Embed Size (px)
Citation preview

Impulse response of a picosecond photodetector directly from power spectrum measurement Arun K. Majumdar
Lockheed-California Company, Kelly Johnson Research & Development Center, P.O. Box 551, Burbank, California 91520. Received 10 February 1986. 0003-6935/86/132042-04$02.00/0. © 1986 Optical Society of America. With increasing interest in generating picosecond pulses
from semiconductor diode lasers1-3 and modulating the light directly in excess of a few gigahertz range for optical communication application, the ultrahigh-speed photodetectors are also being developed with comparable speed and bandwidth. Recently,4,5 the concept and measurement of temporal characteristics of picosecond laser pulses transmitted through a multiple-scattering medium were reported where the effective impulse response of the photodetector and the sampling system was determined to evaluate the higher-order temporal moments. In this paper, a method is described to determine the impulse response of a photodetector directly from the observed output power spectrum. The method is based on obtaining a transfer function from only the output amplitude characteristics of the photodetector using the concept of the Hurwitz factor (to be described later), which is applied in many situations in the study of electrical network analysis and synthesis, especially in the area of filter design.
The photodetector used in the experiment was made by Ortel Corp. (model PD050-OM) and consisted of a very highspeed high-efficient GaAlAs/GaAs PIN photodiode mounted in a high-speed package with an integral SMA-type electrical connector. The photodiode has a typical 10-dB bandwidth of >7.0 GHz, and quantum efficiency of 65%, and features extremely low capacitance and dark current. The photodiode was illuminated by a picosecond mode-locked dye laser (pulse width ~3 ps), and the output signal was observed on a microwave spectrum analyzer. The data of the spectrum analyzer display were obtained from Ortel Corp. The frequency response of the photodiode for 10-V bias voltage is shown in Fig. 1 with the smoothed curve superimposed on the data from the spectrum analyzer displays. By observing the photodiode response directly on a microwave analyzer, a more accurate measurement of the photodiode bandwidth was obtained, since the response was not affected by the finite rise time of the sampling scope.
2042 APPLIED OPTICS / Vol. 25, No. 13 / 1 July 1986

The observed spectrum analyzer output is related to the input power spectrum of the dye laser and the photodetector transfer function as follows6:
where Sg(ω) is the power spectrum of the output, S(ω) is the power spectrum of the input f{t) of the dye laser, and H(ω) is the photodetector transfer function. Defining the amplitude function, M(ω) as M(ω) = |H(ω)|, Eq. (1) can be written as
Assume the dye laser temporal spectrum to be a Gaussian spike of the following form:
where ƒ(t0) = P0 (t0), and α is constant related to the full width at half-maximum (FWHM) ΔΤ by
The value of ΔΤ was taken7 to be ~ 3 ps. Evaluating the power spectrum from the temporal func
tion of Eq. (3) and substituting for S(ω) in Eq. (2), the following equation is obtained:
In the above equation, the dc gain constant of the amplitude function was normalized so that logM 2(ω) = 20 logM(ω) = 0 dB for ω ≤ ωd, where ωd was taken as a reference frequency up to which the amplitude function curve was almost flat.
One question remains: How can a transfer function H(s) from only the amplitude characteristics M(ω) be obtained? The procedure is described below.
First note that the amplitude response M(ω) and the complex transfer function are related by
A new function p(s2) can then be defined so that
Note that s is the complex frequency variable, which is equal to s = jω. Thus Eq. (5) can be rewritten as
From the function p(-ω 2 ) of Eq. (7), it is needed to substitute s2 = - ω 2 back to obtain p(s2), and thenp(s2) is factorized into the product H(s)H(-s). Since the poles and zeros of H(s) are the mirror images of the poles and zeros of H(—s), the Hurwitz factors of p(s2) are chosen as H(s).8 In general, a class of polynomial known as the Hurwitz polynomial given by
Fig. 2. Polynomial fit of third degree of the denominator of Eq. (11) with data points.
has the following properties: P(s) is real when s is real, and the roots of P(s) have real parts which are zero or negative.
To determine the Hurwitz factor H(s) from the measured amplitude function, another function G2(ω) was constructed so that
Thus,
Therefore, for practical purposes, from the spectrum analyzer output measurements in decibels, the function M 2(ω) and then G2(ω) can directly be obtained as a function of frequency, which then can be expressed as a polynomial in ω. Finally, substituting back s2 = - ω 2 , as shown in Eq. (10), it is possible to factor the right-hand side into Hurwitz H(s) and non-Hurwitz H(—s) components. From the Hurwitz component only, the temporal impulse response h(t) was obtained by taking the inverse Laplace transform as follows:
For simplification of computation, new variables x = ω2 and then y = —x = s2 were defined, so that one can write
Figure 2 shows the third degree (n = 3) polynomial fit where the left-hand side of Eq. (11) was obtained for various data points from the spectrum analyzer output measurements using Eq. (10). From the figure, it is seen that there is a reasonably close fit of the polynomial with degree n = 3 with the data points.
Using the complex roots of the denominator polynomials [D(s) = 0] obtained from curve fitting of Fig. 2, H(s)H(-s) was finally factored as follows:
where the dc gain constant is normalized to unity, and the following values of the roots of D(s) = 0 were obtained:
1 July 1986 / Vol. 25, No. 13 / APPLIED OPTICS 2043
Fig. 1. Frequency response of the photodiode (illuminated by a dye laser) at 10-V bias voltage—the smoothed curve superimposed on
the data.
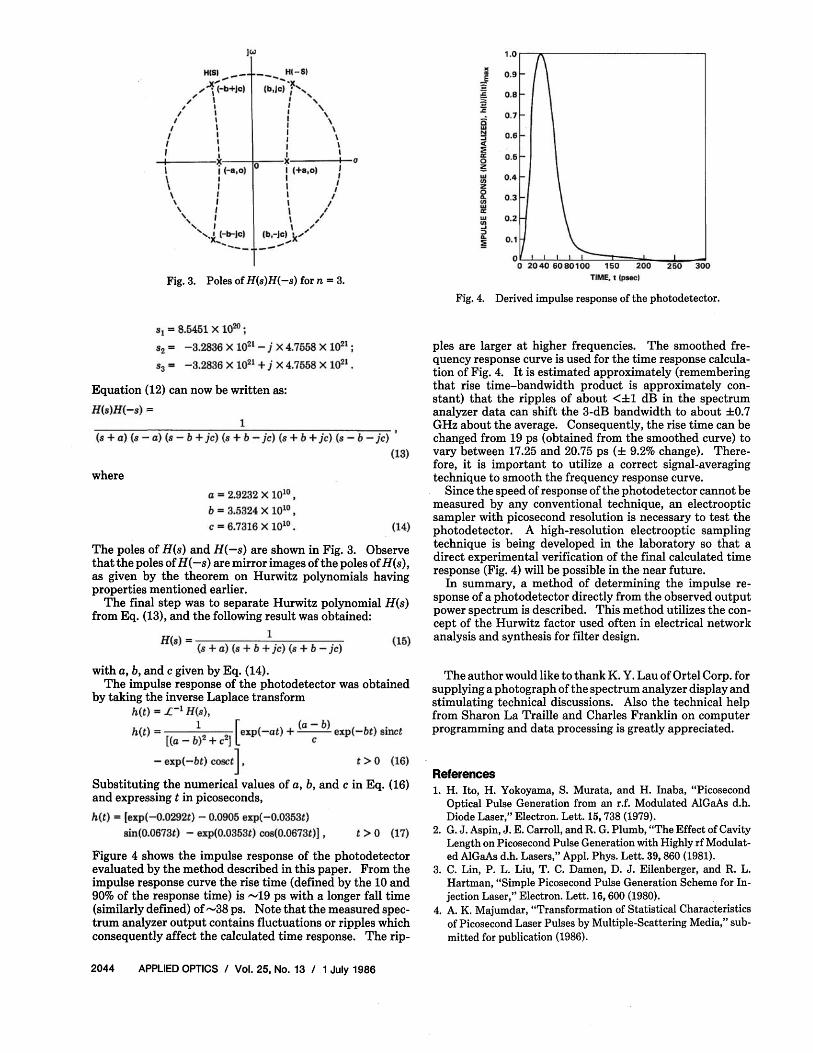
Fig. 3. Poles of H(s)H(-s) for n = 3. Fig. 4. Derived impulse response of the photodetector.
Equation (12) can now be written as:
where
The poles of H(s) and H(—s) are shown in Fig. 3. Observe that the poles of H(—s) are mirror images of the poles of H(s), as given by the theorem on Hurwitz polynomials having properties mentioned earlier.
The final step was to separate Hurwitz polynomial H(s) from Eq. (13), and the following result was obtained:
with a, b, and c given by Eq. (14). The impulse response of the photodetector was obtained
by taking the inverse Laplace transform
Substituting the numerical values of a, b, and c in Eq. (16) and expressing t in picoseconds,
Figure 4 shows the impulse response of the photodetector evaluated by the method described in this paper. From the impulse response curve the rise time (defined by the 10 and 90% of the response time) is ~19 ps with a longer fall time (similarly defined) of ~38 ps. Note that the measured spectrum analyzer output contains fluctuations or ripples which consequently affect the calculated time response. The rip
ples are larger at higher frequencies. The smoothed frequency response curve is used for the time response calculation of Fig. 4. It is estimated approximately (remembering that rise time-bandwidth product is approximately constant) that the ripples of about < ± 1 dB in the spectrum analyzer data can shift the 3-dB bandwidth to about ±0.7 GHz about the average. Consequently, the rise time can be changed from 19 ps (obtained from the smoothed curve) to vary between 17.25 and 20.75 ps (± 9.2% change). Therefore, it is important to utilize a correct signal-averaging technique to smooth the frequency response curve.
Since the speed of response of the photodetector cannot be measured by any conventional technique, an electrooptic sampler with picosecond resolution is necessary to test the photodetector. A high-resolution electrooptic sampling technique is being developed in the laboratory so that a direct experimental verification of the final calculated time response (Fig. 4) will be possible in the near future.
In summary, a method of determining the impulse response of a photodetector directly from the observed output power spectrum is described. This method utilizes the concept of the Hurwitz factor used often in electrical network analysis and synthesis for filter design.
The author would like to thank K. Y. Lau of Ortel Corp. for supplying a photograph of the spectrum analyzer display and stimulating technical discussions. Also the technical help from Sharon La Traille and Charles Franklin on computer programming and data processing is greatly appreciated.
References 1. H. Ito, H. Yokoyama, S. Murata, and H. Inaba, "Picosecond
Optical Pulse Generation from an r.f. Modulated AlGaAs d.h. Diode Laser," Electron. Lett. 15, 738 (1979).
2. G. J. Aspin, J. E. Carroll, and R. G. Plumb, "The Effect of Cavity Length on Picosecond Pulse Generation with Highly rf Modulated AlGaAs d.h. Lasers," Appl. Phys. Lett. 39, 860 (1981).
3. C. Lin, P. L. Liu, T. C. Damen, D. J. Eilenberger, and R. L. Hartman, "Simple Picosecond Pulse Generation Scheme for Injection Laser," Electron. Lett. 16, 600 (1980).
4. A. K. Majumdar, "Transformation of Statistical Characteristics of Picosecond Laser Pulses by Multiple-Scattering Media," submitted for publication (1986).
2044 APPLIED OPTICS / Vol. 25, No. 13 / 1 July 1986

5. A. K. Majumdar, "Deconvolution of non-Gaussian Temporal Characteristics in Picosecond Laser Pulse Measurements," submitted for publication. (1986).
6. A. Papoulis, Systems and Transforms with Applications in Optics (McGraw-Hill, New York, 1968).
7. K. Y. Lau, Ortel Corp., Alhambra CA, private communication (1985).
8. F. F. Kuo, Network Analysis and Synthesis (Wiley, New York, 1966).
1 July 1986 / Vol. 25, No. 13 / APPLIED OPTICS 2045