Embed Size (px)
Citation preview
Impulse Generators – i – SPDC Tutorial
M J Maytum Rev.0
i Copyright © M J Maytum 2012. All Rights Reserved.
Impulse generators used for testing low-voltage equipment
Abstract
This is an advanced level SPDC tutorial on the impulse (surge) generators used in the Standards and Recommendations listed in the Bibliography section. The tolerances of the impulse waveforms are given together with the generator interaction with the test load. The document content is of a general nature only and is not intended to address the specific circumstances of any particular individual or entity; nor be necessarily comprehensive, complete, accurate or up to date; nor represent professional or legal advice.

Impulse Generators – ii – SPDC Tutorial
M J Maytum Rev.0
ii Copyright © M J Maytum 2012. All Rights Reserved.
Contents
1. Introduction.......................................................................................................................................... 1
2. Types of impulse generator ................................................................................................................... 1
3. Impulse generator parameters................................................................................................................ 1 3.1 Glossary of terms ........................................................................................................................... 1 3.2 Virtual parameters.......................................................................................................................... 3
4. Impulse generators typically used for surge protector testing ................................................................. 4 4.1 Impulse generators with a defined voltage waveform ...................................................................... 4 4.2 Impulse generators with a defined current waveform....................................................................... 5 4.3 Impulse generators with defined voltage and current waveforms ..................................................... 6
5. Impulse generator circuits ..................................................................................................................... 8 5.1 Front-time waveshaping ................................................................................................................. 9 5.2 RC half-value time waveshaping .................................................................................................. 10 5.3 LRC waveshaping ........................................................................................................................ 11 5.4 8/20 current generator .................................................................................................................. 12
6. Combination wave generators ............................................................................................................. 13 6.1 1.2/50-8/20 combination wave generator....................................................................................... 13 6.2 10/700-5/320 combination wave generator.................................................................................... 15
7. Expanding single output generators to multiple output......................................................................... 16 7.1 Current waveform generators........................................................................................................ 16 7.2 Voltage and current waveform generators ..................................................................................... 16
8. Generator variants............................................................................................................................... 19 8.1 8/20 current generators................................................................................................................. 19 8.2 10/1000 generators....................................................................................................................... 19 8.3 10/700 generators......................................................................................................................... 20 8.4 10/350 generators......................................................................................................................... 21 8.5 <2/>10 generators ........................................................................................................................ 22 8.6 1.2/50-8/20 combination wave generators ..................................................................................... 23
Annex A (informative) Other forms of Impulse Generator....................................................................... 24 A.1 Defibrillators............................................................................................................................... 24 A.2 Relaxation Oscillators.................................................................................................................. 24
Annex B (informative) Bibliography....................................................................................................... 27
Impulse Generators – 1 – SPDC Tutorial
M J Maytum Rev.0
1 Copyright © M J Maytum 2012. All Rights Reserved.
Impulse Generators
1. Introduction
This document covers:
Types of impulse generator
Impulse generator parameters
Impulse generators typically used for surge protector testing
Impulse generator circuits
Combination-wave generators
Expanding single output generators to multiple output
Generator variants
2. Types of impulse generator
Impulse generators can be classified into three types:
1. Generators with a defined voltage waveform typically used for high-voltage insulation testing
2. Generators with a defined current waveform typically used for high-current component and device testing
3. Generators with defined voltage and current waveforms. These generators can be subdivided into:
3.1. Circuit defined generators
3.2. Waveform defined generators
3. Impulse generator parameters
3.1 Glossary of terms
The following terms are used in this Annex to describe the impulse and generator parameters.
Impulse Generators – 2 – SPDC Tutorial
M J Maytum Rev.0
2 Copyright © M J Maytum 2012. All Rights Reserved.
virtual front time:
a) the front time T1 of a voltage impulse is 1/0.6 times the interval T between the instants when the impulse is 30 % and 90 % of the peak value [B2]
b) the front time T1 of a surge current impulse is 1.25 times the interval T between the instants when the impulse is 10 % and 90 % of the peak value [B5]
NOTE—Some standards use the 10 % and 90 % front time measurement for the voltage impulse.
virtual origin; O1:
a) for the impulse voltage waveform, it is the instant at which a straight line drawn through the 30 % and 90 % amplitude values crosses the time axis. [B2]
b) for the impulse current waveform, it is the instant at which a straight line drawn through the 10 % and 90 % amplitude values crosses the time axis [B5]
virtual time to half-value; T2: interval of time between the instant of virtual origin O1 and the instant when the voltage or current has decreased to half the peak value [B2][B5]
designation of an impulse shape: combination of two numbers, the first representing the virtual front time (T1) and the second the virtual time to half-value on the tail (T2) [B17]
NOTE 1—It is written as T1/T2, both in microseconds, the sign "/" having no mathematical meaning.
NOTE 2—Some standards use alternative designations such as A/B or T1 x T2.
NOTE 3—Combination wave generators have both voltage and current impulse designations given separated by a hyphen e.g. 1.2/50-8/20
NOTE 4—Waveshapes defined as maximum front time and minimum time to half value are expressed as <T1/>T2
undershoot: The peak value of an impulse voltage or current that passes through zero in the opposite polarity of the initial peak. [B1]
charge (impulse): time integral of the impulse current
I2t (impulse): time integral of the square of the impulse current
a) I2t is called the action integral for atmospheric lightning, joule integral for fuses and specific energy (W/R) for AC surge protectors.
b) The units for I2t are A2s, but assuming the current flows in a virtual 1 resistor may be expressed in energy units J (fuses) or W/ (AC surge protectors)
combination wave generator: generator with 1.2/50 µs or 10/700 µs open-circuit voltage waveform and respectively 8/20 µs or 5/320 µs short-circuit current waveform [B10]
effective impedance (impulse generator): quotient of the generator open-circuit peak voltage value and the generator short-circuit peak current value
NOTE—Some standards use the alternative term fictive impedance.[B18]
Impulse Generators – 3 – SPDC Tutorial
M J Maytum Rev.0
3 Copyright © M J Maytum 2012. All Rights Reserved.
3.2 Virtual parameters
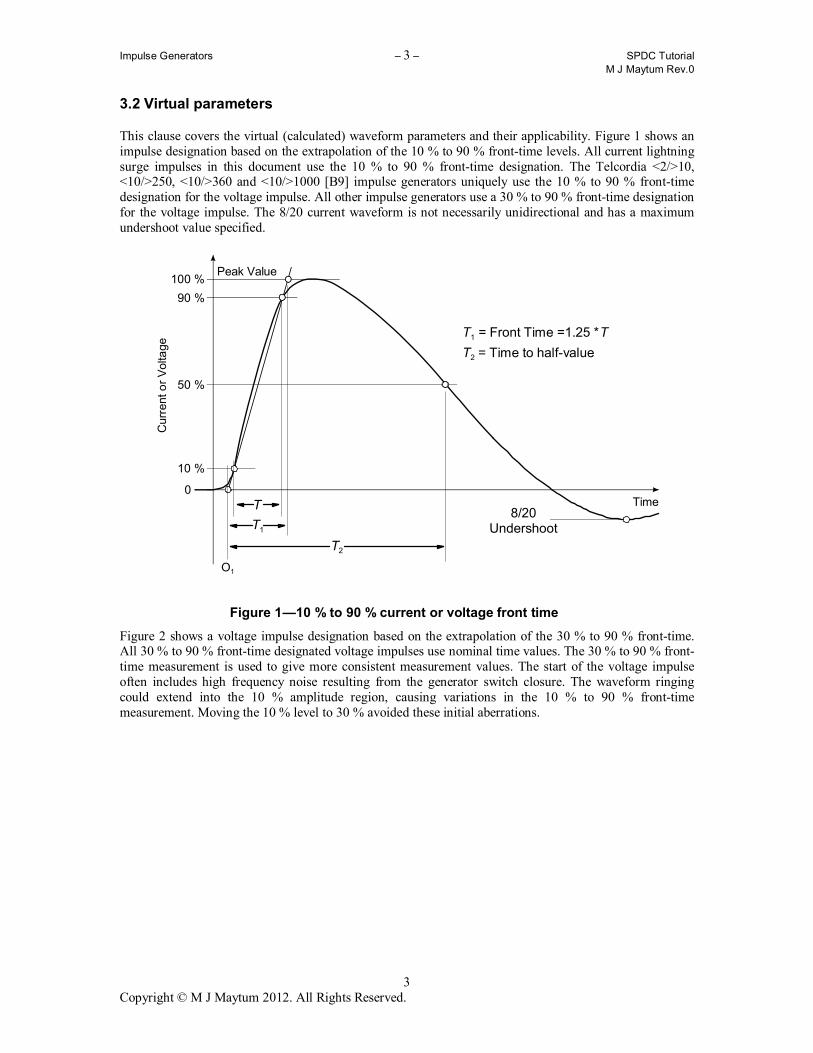
This clause covers the virtual (calculated) waveform parameters and their applicability. Figure 1 shows an impulse designation based on the extrapolation of the 10 % to 90 % front-time levels. All current lightning surge impulses in this document use the 10 % to 90 % front-time designation. The Telcordia <2/>10, <10/>250, <10/>360 and <10/>1000 [B9] impulse generators uniquely use the 10 % to 90 % front-time designation for the voltage impulse. All other impulse generators use a 30 % to 90 % front-time designation for the voltage impulse. The 8/20 current waveform is not necessarily unidirectional and has a maximum undershoot value specified.
50 %
10 %
90 %
100 %
0
8/20 Undershoot
T1 = Front Time =1.25 *T
T2 = Time to half-value
Peak Value
Curr
ent o
r V
olta
ge
Time
T1
T2
T
O1
Figure 1 —10 % to 90 % current or voltage front time
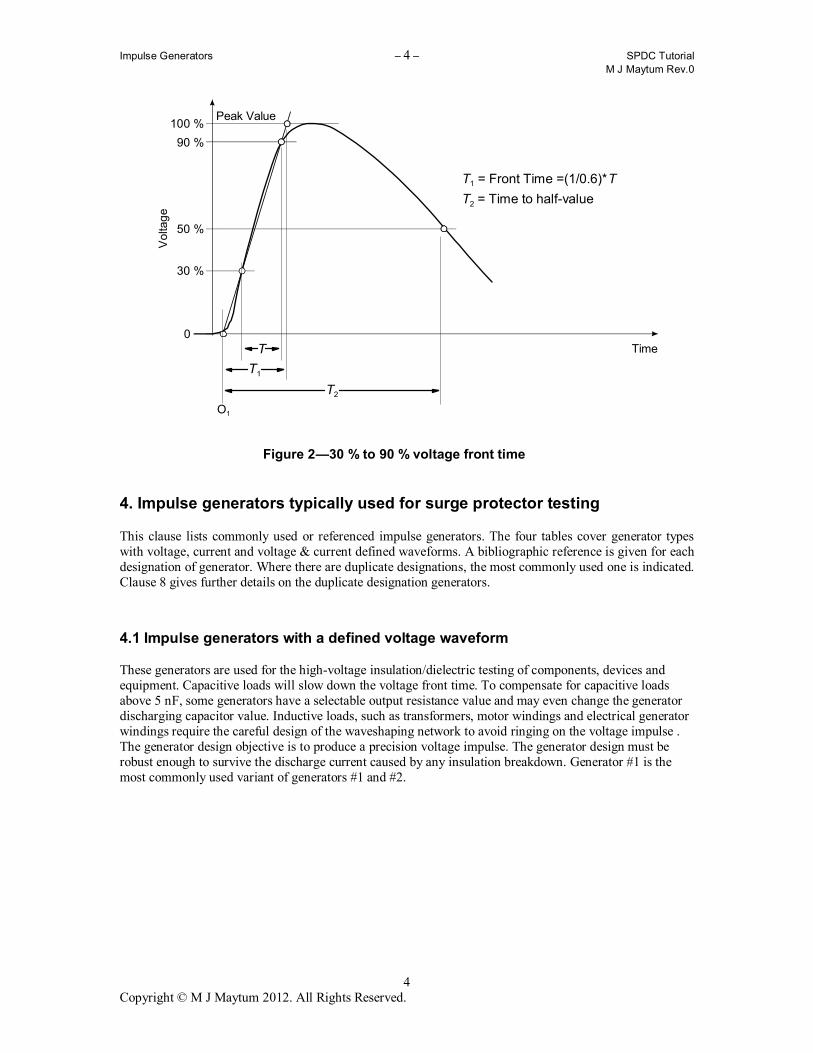
Figure 2 shows a voltage impulse designation based on the extrapolation of the 30 % to 90 % front-time. All 30 % to 90 % front-time designated voltage impulses use nominal time values. The 30 % to 90 % front-time measurement is used to give more consistent measurement values. The start of the voltage impulse often includes high frequency noise resulting from the generator switch closure. The waveform ringing could extend into the 10 % amplitude region, causing variations in the 10 % to 90 % front-time measurement. Moving the 10 % level to 30 % avoided these initial aberrations.
Impulse Generators – 4 – SPDC Tutorial
M J Maytum Rev.0
4 Copyright © M J Maytum 2012. All Rights Reserved.
50 %
30 %
90 %
100 %
0
Peak Value
Volta
ge
Time
T1 = Front Time =(1/0.6)*T
T2 = Time to half-value
T1
T2
T
O1
Figure 2 —30 % to 90 % voltage front time
4. Impulse generators typically used for surge protector testing
This clause lists commonly used or referenced impulse generators. The four tables cover generator types with voltage, current and voltage & current defined waveforms. A bibliographic reference is given for each designation of generator. Where there are duplicate designations, the most commonly used one is indicated. Clause 8 gives further details on the duplicate designation generators.
4.1 Impulse generators with a defined voltage waveform
These generators are used for the high-voltage insulation/dielectric testing of components, devices and equipment. Capacitive loads will slow down the voltage front time. To compensate for capacitive loads above 5 nF, some generators have a selectable output resistance value and may even change the generator discharging capacitor value. Inductive loads, such as transformers, motor windings and electrical generator windings require the careful design of the waveshaping network to avoid ringing on the voltage impulse . The generator design objective is to produce a precision voltage impulse. The generator design must be robust enough to survive the discharge current caused by any insulation breakdown. Generator #1 is the most commonly used variant of generators #1 and #2.
Impulse Generators – 5 – SPDC Tutorial
M J Maytum Rev.0
5 Copyright © M J Maytum 2012. All Rights Reserved.
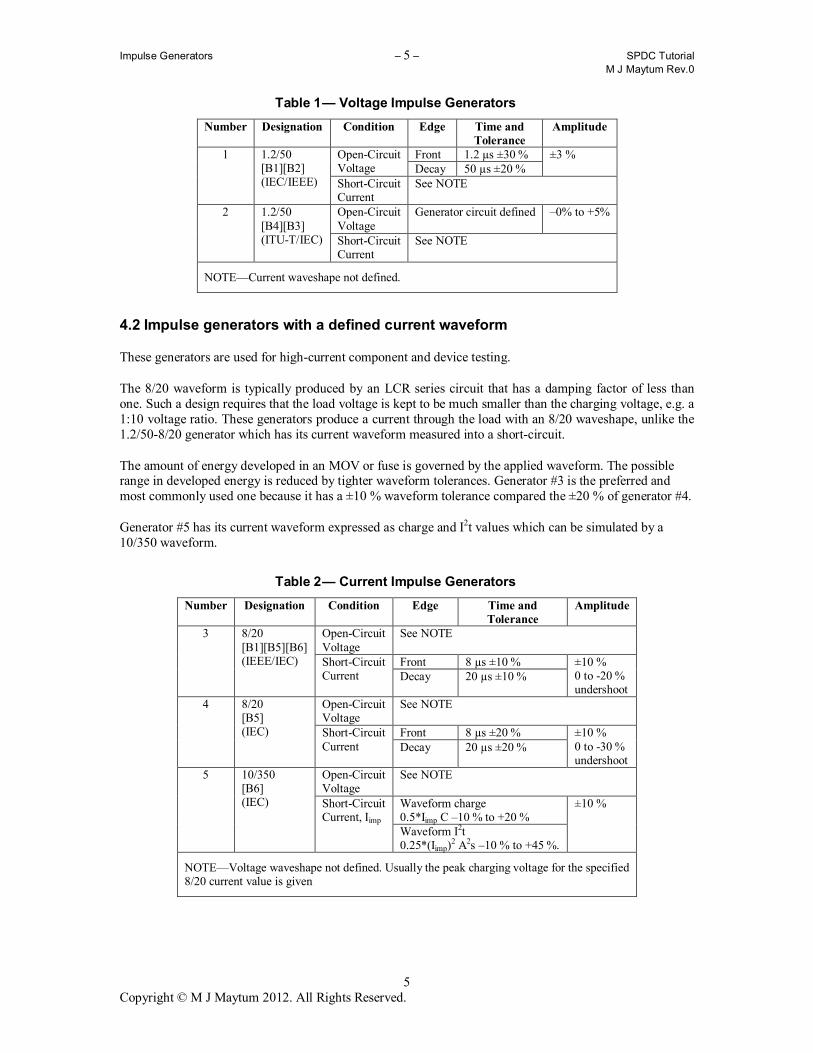
Table 1 — Voltage Impulse Generators
Number Designation Condition Edge Time and Tolerance
Amplitude
Front 1.2 µs ±30 % Open-Circuit Voltage Decay 50 µs ±20 %
±3 % 1 1.2/50 [B1][B2] (IEC/IEEE) Short-Circuit
Current See NOTE
Open-Circuit Voltage
Generator circuit defined –0% to +5% 2 1.2/50 [B4][B3] (ITU-T/IEC) Short-Circuit
Current See NOTE
NOTE—Current waveshape not defined.
4.2 Impulse generators with a defined current waveform
These generators are used for high-current component and device testing.
The 8/20 waveform is typically produced by an LCR series circuit that has a damping factor of less than one. Such a design requires that the load voltage is kept to be much smaller than the charging voltage, e.g. a 1:10 voltage ratio. These generators produce a current through the load with an 8/20 waveshape, unlike the 1.2/50-8/20 generator which has its current waveform measured into a short-circuit.
The amount of energy developed in an MOV or fuse is governed by the applied waveform. The possible range in developed energy is reduced by tighter waveform tolerances. Generator #3 is the preferred and most commonly used one because it has a ±10 % waveform tolerance compared the ±20 % of generator #4.
Generator #5 has its current waveform expressed as charge and I2t values which can be simulated by a 10/350 waveform.
Table 2 — Current Impulse Generators
Number Designation Condition Edge Time and Tolerance
Amplitude
Open-Circuit Voltage
See NOTE
Front 8 µs ±10 %
3 8/20 [B1][B5][B6] (IEEE/IEC) Short-Circuit
Current Decay 20 µs ±10 % ±10 % 0 to -20 % undershoot
Open-Circuit Voltage
See NOTE
Front 8 µs ±20 %
4 8/20 [B5] (IEC) Short-Circuit
Current Decay 20 µs ±20 % ±10 % 0 to -30 % undershoot
Open-Circuit Voltage
See NOTE
Waveform charge 0.5*Iimp C –10 % to +20 %
5 10/350 [B6] (IEC) Short-Circuit
Current, Iimp Waveform I2t 0.25*(Iimp)
2 A2s –10 % to +45 %.
±10 %
NOTE—Voltage waveshape not defined. Usually the peak charging voltage for the specified 8/20 current value is given
Impulse Generators – 6 – SPDC Tutorial
M J Maytum Rev.0
6 Copyright © M J Maytum 2012. All Rights Reserved.
4.3 Impulse generators with defined voltage and current waveforms
The 1.2/50-8/20 generator #7 is commercially available and established in test laboratories. Although generator #8 might be referenced most people would use generator #7 for testing.
A similar situation exists for the 10/1000 impulse generators #11 and #12. Generator #11 is commercially available and established in test laboratories. Although generator #12 might be referenced most people would use generator #11 for testing.
For the 10/700 generators, #9 and #10, the choice is application dependent. For telecommunications applications the ITU-T generator #9 [B7] is the automatic choice and most commonly available both commercially and in test laboratories. General EMC work will often reference the IEC generator #10 [B10]. The IEC generator #10 is available commercially, but is possible to use the ITU-T generator with extra series resistors, see 8.3.
Table 4 lists additional generators from Telcordia [B9] and the TIA [B19]. There are two different versions of the <2/>10 generator and a third variant of the “10/700” generator #19, which in practice is similar to the ITU-T #10 [B7].
Impulse Generators – 7 – SPDC Tutorial
M J Maytum Rev.0
7 Copyright © M J Maytum 2012. All Rights Reserved.
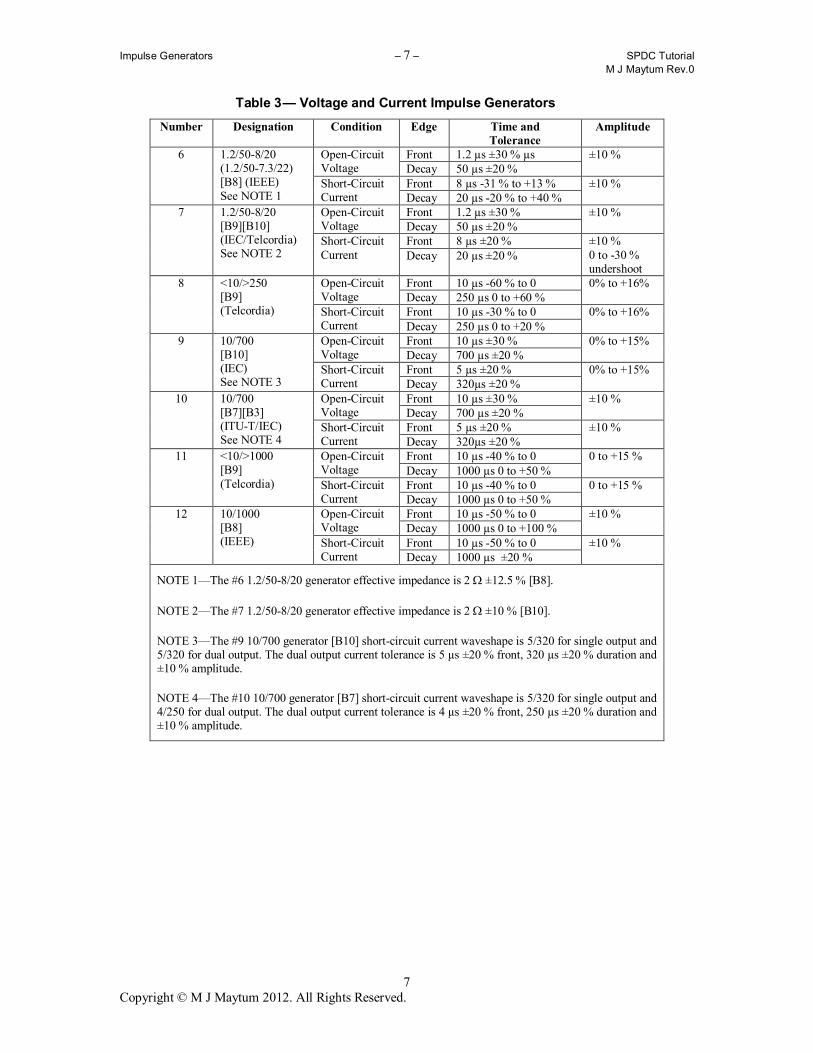
Table 3 — Voltage and Current Impulse Generators
Number Designation Condition Edge Time and Tolerance
Amplitude
Front 1.2 µs ±30 % µs Open-Circuit Voltage Decay 50 µs ±20 %
±10 %
Front 8 µs -31 % to +13 %
6 1.2/50-8/20 (1.2/50-7.3/22) [B8] (IEEE) See NOTE 1
Short-Circuit Current Decay 20 µs -20 % to +40 %
±10 %
Front 1.2 µs ±30 % Open-Circuit Voltage Decay 50 µs ±20 %
±10 %
Front 8 µs ±20 %
7 1.2/50-8/20 [B9][B10] (IEC/Telcordia) See NOTE 2
Short-Circuit Current Decay 20 µs ±20 %
±10 % 0 to -30 % undershoot
Front 10 µs -60 % to 0 Open-Circuit Voltage Decay 250 µs 0 to +60 %
0% to +16%
Front 10 µs -30 % to 0
8 <10/>250 [B9] (Telcordia) Short-Circuit
Current Decay 250 µs 0 to +20 % 0% to +16%
Front 10 µs ±30 % Open-Circuit Voltage Decay 700 µs ±20 %
0% to +15%
Front 5 µs ±20 %
9 10/700 [B10] (IEC) See NOTE 3
Short-Circuit Current Decay 320µs ±20 %
0% to +15%
Front 10 µs ±30 % Open-Circuit Voltage Decay 700 µs ±20 %
±10 %
Front 5 µs ±20 %
10 10/700 [B7][B3] (ITU-T/IEC) See NOTE 4
Short-Circuit Current Decay 320µs ±20 %
±10 %
Front 10 µs -40 % to 0 Open-Circuit Voltage Decay 1000 µs 0 to +50 %
0 to +15 %
Front 10 µs -40 % to 0
11 <10/>1000 [B9] (Telcordia) Short-Circuit
Current Decay 1000 µs 0 to +50 % 0 to +15 %
Front 10 µs -50 % to 0 Open-Circuit Voltage Decay 1000 µs 0 to +100 %
±10 %
Front 10 µs -50 % to 0
12 10/1000 [B8] (IEEE) Short-Circuit
Current Decay 1000 µs ±20 % ±10 %
NOTE 1—The #6 1.2/50-8/20 generator effective impedance is 2 ±12.5 % [B8].
NOTE 2—The #7 1.2/50-8/20 generator effective impedance is 2 ±10 % [B10].
NOTE 3—The #9 10/700 generator [B10] short-circuit current waveshape is 5/320 for single output and 5/320 for dual output. The dual output current tolerance is 5 µs ±20 % front, 320 µs ±20 % duration and ±10 % amplitude.
NOTE 4—The #10 10/700 generator [B7] short-circuit current waveshape is 5/320 for single output and 4/250 for dual output. The dual output current tolerance is 4 µs ±20 % front, 250 µs ±20 % duration and ±10 % amplitude.
Impulse Generators – 8 – SPDC Tutorial
M J Maytum Rev.0
8 Copyright © M J Maytum 2012. All Rights Reserved.
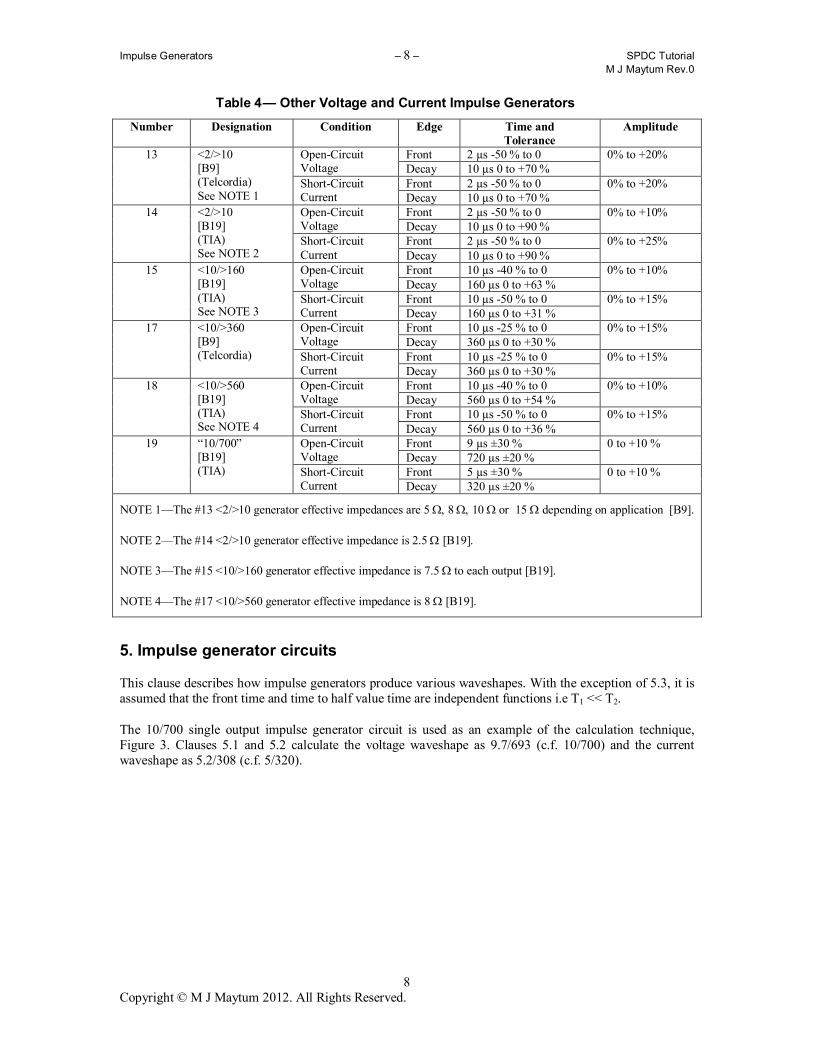
Table 4 — Other Voltage and Current Impulse Generators
Number Designation Condition Edge Time and Tolerance
Amplitude
Front 2 µs -50 % to 0 Open-Circuit Voltage Decay 10 µs 0 to +70 %
0% to +20%
Front 2 µs -50 % to 0
13 <2/>10 [B9] (Telcordia) See NOTE 1
Short-Circuit Current Decay 10 µs 0 to +70 %
0% to +20%
Front 2 µs -50 % to 0 Open-Circuit Voltage Decay 10 µs 0 to +90 %
0% to +10%
Front 2 µs -50 % to 0
14 <2/>10 [B19] (TIA) See NOTE 2
Short-Circuit Current Decay 10 µs 0 to +90 %
0% to +25%
Front 10 µs -40 % to 0 Open-Circuit Voltage Decay 160 µs 0 to +63 %
0% to +10%
Front 10 µs -50 % to 0
15 <10/>160 [B19] (TIA) See NOTE 3
Short-Circuit Current Decay 160 µs 0 to +31 %
0% to +15%
Front 10 µs -25 % to 0 Open-Circuit Voltage Decay 360 µs 0 to +30 %
0% to +15%
Front 10 µs -25 % to 0
17 <10/>360 [B9] (Telcordia) Short-Circuit
Current Decay 360 µs 0 to +30 % 0% to +15%
Front 10 µs -40 % to 0 Open-Circuit Voltage Decay 560 µs 0 to +54 %
0% to +10%
Front 10 µs -50 % to 0
18 <10/>560 [B19] (TIA) See NOTE 4
Short-Circuit Current Decay 560 µs 0 to +36 %
0% to +15%
Front 9 µs ±30 % Open-Circuit Voltage Decay 720 µs ±20 %
0 to +10 %
Front 5 µs ±30 %
19 “10/700” [B19] (TIA) Short-Circuit
Current Decay 320 µs ±20 % 0 to +10 %
NOTE 1—The #13 <2/>10 generator effective impedances are 5 8 10 or 15 depending on application [B9].
NOTE 2—The #14 <2/>10 generator effective impedance is 2.5 [B19].
NOTE 3—The #15 <10/>160 generator effective impedance is 7.5 to each output [B19].
NOTE 4—The #17 <10/>560 generator effective impedance is 8 [B19].
5. Impulse generator circuits
This clause describes how impulse generators produce various waveshapes. With the exception of 5.3, it is assumed that the front time and time to half value time are independent functions i.e T1 << T2.
The 10/700 single output impulse generator circuit is used as an example of the calculation technique, Figure 3. Clauses 5.1 and 5.2 calculate the voltage waveshape as 9.7/693 (c.f. 10/700) and the current waveshape as 5.2/308 (c.f. 5/320).
Impulse Generators – 9 – SPDC Tutorial
M J Maytum Rev.0
9 Copyright © M J Maytum 2012. All Rights Reserved.
R3 = 25 R2 = 15 S1
R1 = 50 C1 = 20 µF C2 = 0.2 µF
VC
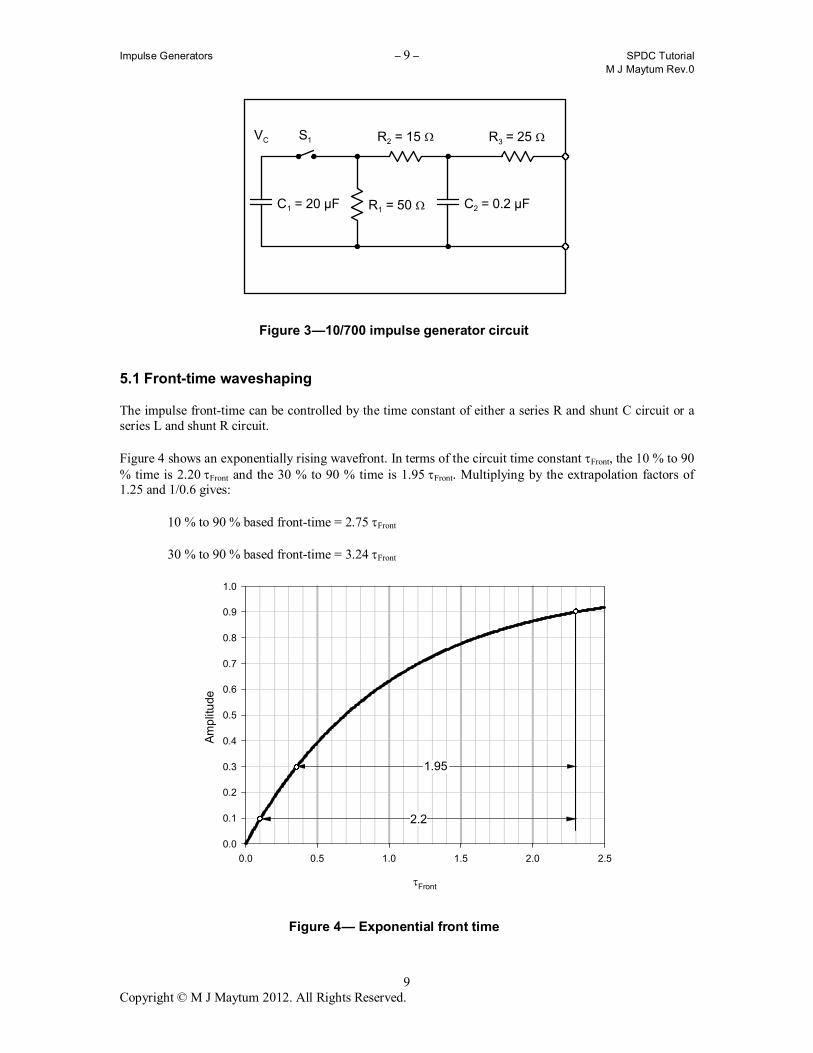
Figure 3 —10/700 impulse generator circuit
5.1 Front-time waveshaping
The impulse front-time can be controlled by the time constant of either a series R and shunt C circuit or a series L and shunt R circuit.
Figure 4 shows an exponentially rising wavefront. In terms of the circuit time constantFront, the 10 % to 90 % time is 2.20Front and the 30 % to 90 % time is 1.95Front. Multiplying by the extrapolation factors of 1.25 and 1/0.6 gives:
10 % to 90 % based front-time = 2.75Front
30 % to 90 % based front-time = 3.24Front
Front
0.0 0.5 1.0 1.5 2.0 2.5
Am
plit
ude
0.0
0.1
0.2
0.3
0.4
0.5
0.6
0.7
0.8
0.9
1.0
2.2
1.95
Figure 4 — Exponential front time
Impulse Generators – 10 – SPDC Tutorial
M J Maytum Rev.0
10 Copyright © M J Maytum 2012. All Rights Reserved.
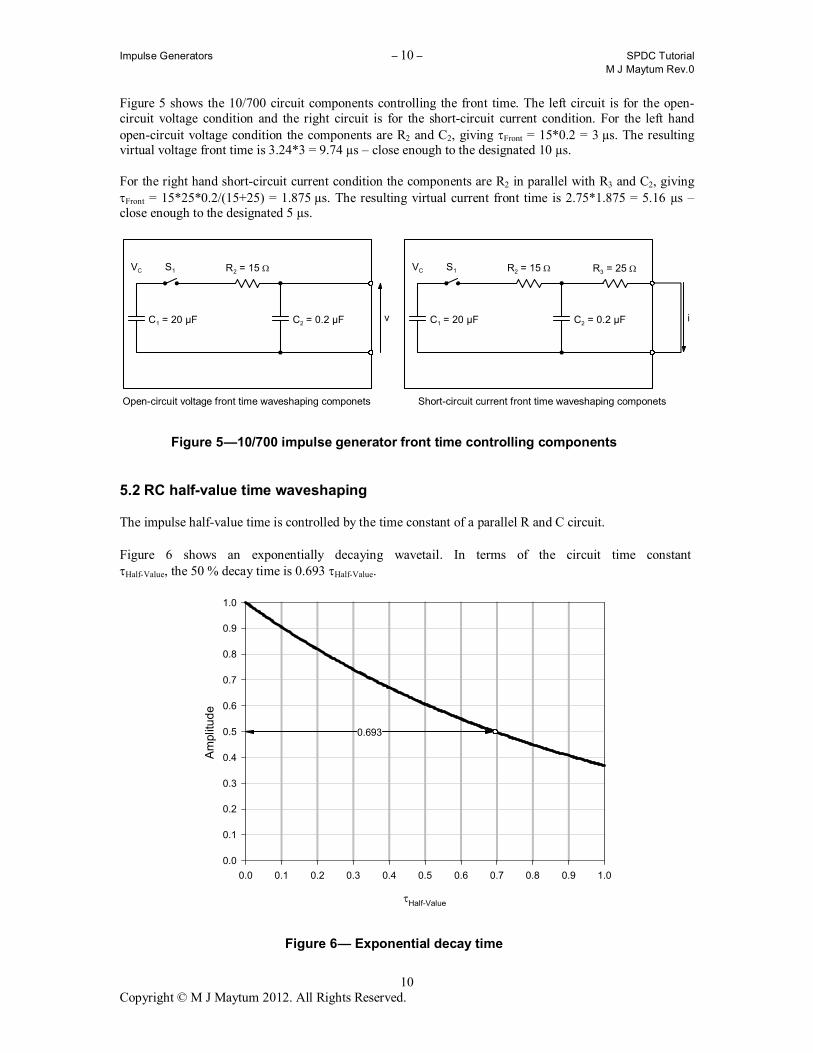
Figure 5 shows the 10/700 circuit components controlling the front time. The left circuit is for the open-circuit voltage condition and the right circuit is for the short-circuit current condition. For the left hand open-circuit voltage condition the components are R2 and C2, giving Front = 15*0.2 = 3 µs. The resulting virtual voltage front time is 3.24*3 = 9.74 µs – close enough to the designated 10 µs.
For the right hand short-circuit current condition the components are R2 in parallel with R3 and C2, giving Front = 15*25*0.2/(15+25) = 1.875 µs. The resulting virtual current front time is 2.75*1.875 = 5.16 µs – close enough to the designated 5 µs.
R3 = 25 R2 = 15 S1
C1 = 20 µF C2 = 0.2 µF
VCR2 = 15 S1
C1 = 20 µF C2 = 0.2 µF
VC
v i
Open-circuit voltage front time waveshaping componets Short-circuit current front time waveshaping componets
Figure 5 —10/700 impulse generator front time controlling components
5.2 RC half-value time waveshaping
The impulse half-value time is controlled by the time constant of a parallel R and C circuit.
Figure 6 shows an exponentially decaying wavetail. In terms of the circuit time constantHalf-Value, the 50 % decay time is 0.693Half-Value.
Half-Value
0.0 0.1 0.2 0.3 0.4 0.5 0.6 0.7 0.8 0.9 1.0
Am
plit
ud
e
0.0
0.1
0.2
0.3
0.4
0.5
0.6
0.7
0.8
0.9
1.0
0.693
Figure 6 — Exponential decay time
Impulse Generators – 11 – SPDC Tutorial
M J Maytum Rev.0
11 Copyright © M J Maytum 2012. All Rights Reserved.
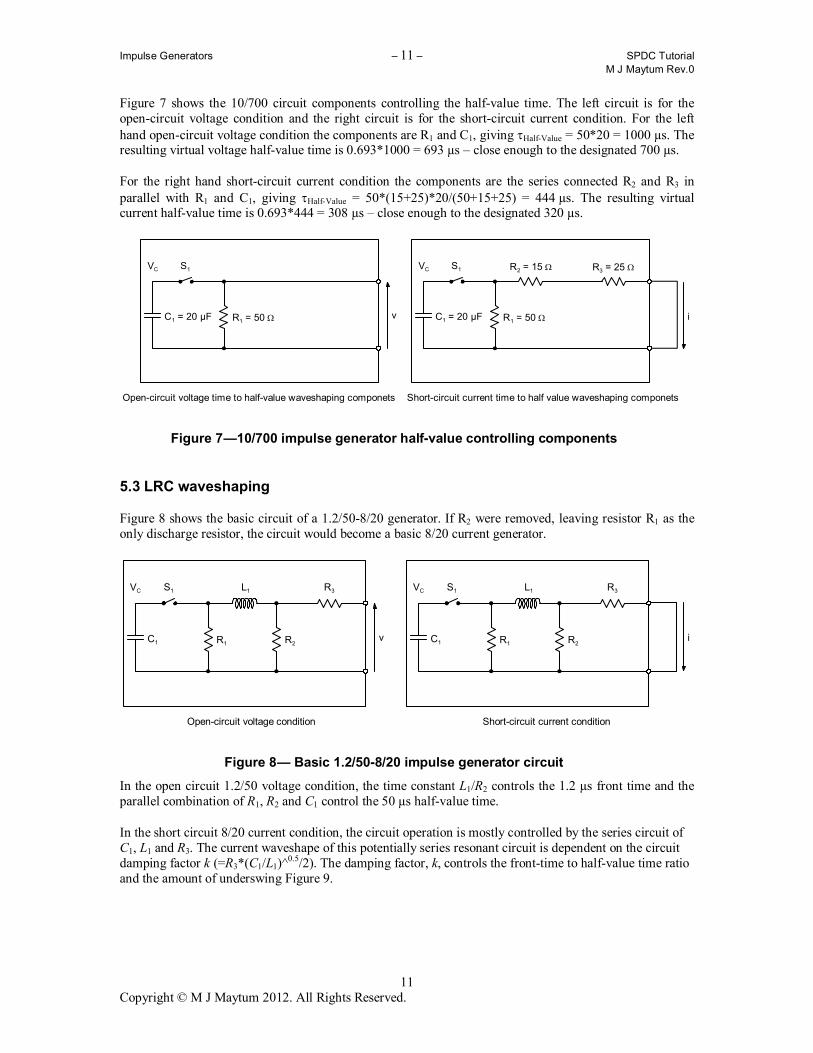
Figure 7 shows the 10/700 circuit components controlling the half-value time. The left circuit is for the open-circuit voltage condition and the right circuit is for the short-circuit current condition. For the left hand open-circuit voltage condition the components are R1 and C1, giving Half-Value = 50*20 = 1000 µs. The resulting virtual voltage half-value time is 0.693*1000 = 693 µs – close enough to the designated 700 µs.
For the right hand short-circuit current condition the components are the series connected R2 and R3 in parallel with R1 and C1, giving Half-Value = 50*(15+25)*20/(50+15+25) = 444 µs. The resulting virtual current half-value time is 0.693*444 = 308 µs – close enough to the designated 320 µs.
R3 = 25 R2 = 15 S1
R1 = 50 C1 = 20 µF
VCS1
R1 = 50 C1 = 20 µF
VC
v i
Open-circuit voltage time to half-value waveshaping componets Short-circuit current time to half value waveshaping componets
Figure 7 —10/700 impulse generator half-value controlling components
5.3 LRC waveshaping
Figure 8 shows the basic circuit of a 1.2/50-8/20 generator. If R2 were removed, leaving resistor R1 as the only discharge resistor, the circuit would become a basic 8/20 current generator.
Open-circuit voltage condition Short-circuit current condition
v
R3S1
C1
VC L1
R1 R2i
R3S1
C1
VC L1
R1 R2
Figure 8 — Basic 1.2/50-8/20 impulse generator circuit
In the open circuit 1.2/50 voltage condition, the time constant L1/R2 controls the 1.2 µs front time and the parallel combination of R1, R2 and C1 control the 50 µs half-value time.
In the short circuit 8/20 current condition, the circuit operation is mostly controlled by the series circuit of C1, L1 and R3. The current waveshape of this potentially series resonant circuit is dependent on the circuit damping factor k (=R3*(C1/L1)^
0.5/2). The damping factor, k, controls the front-time to half-value time ratio and the amount of underswing Figure 9.
Impulse Generators – 12 – SPDC Tutorial
M J Maytum Rev.0
12 Copyright © M J Maytum 2012. All Rights Reserved.
Normalised Time - t/(LC)0.5
0 1 2 3 4 5 6 7 8
Norm
alis
ed A
mplit
ude
-0.4
-0.3
-0.2
-0.1
0.1
0.2
0.3
0.4
0.6
0.7
0.8
0.9
-0.5
0.0
0.5
1.0
k = 0.25
k = 0.35
k = 0.45
k = 0.55
k = 0.65
k = 0.75
k = 0.85
k = 0.95
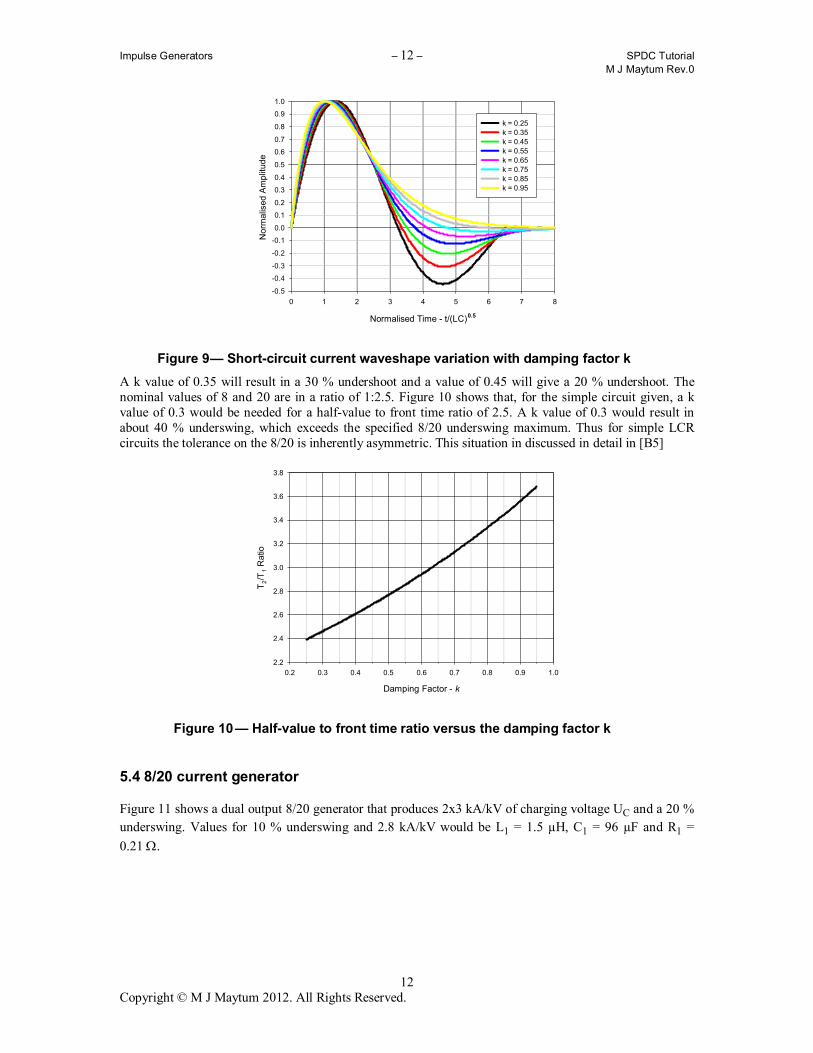
Figure 9 — Short-circuit current waveshape variation with damping factor k
A k value of 0.35 will result in a 30 % undershoot and a value of 0.45 will give a 20 % undershoot. The nominal values of 8 and 20 are in a ratio of 1:2.5. Figure 10 shows that, for the simple circuit given, a k value of 0.3 would be needed for a half-value to front time ratio of 2.5. A k value of 0.3 would result in about 40 % underswing, which exceeds the specified 8/20 underswing maximum. Thus for simple LCR circuits the tolerance on the 8/20 is inherently asymmetric. This situation in discussed in detail in [B5]
Damping Factor - k
0.2 0.3 0.4 0.5 0.6 0.7 0.8 0.9 1.0
T2/T
1 R
atio
2.2
2.4
2.6
2.8
3.0
3.2
3.4
3.6
3.8
Figure 10 — Half-value to front time ratio versus the damping factor k
5.4 8/20 current generator
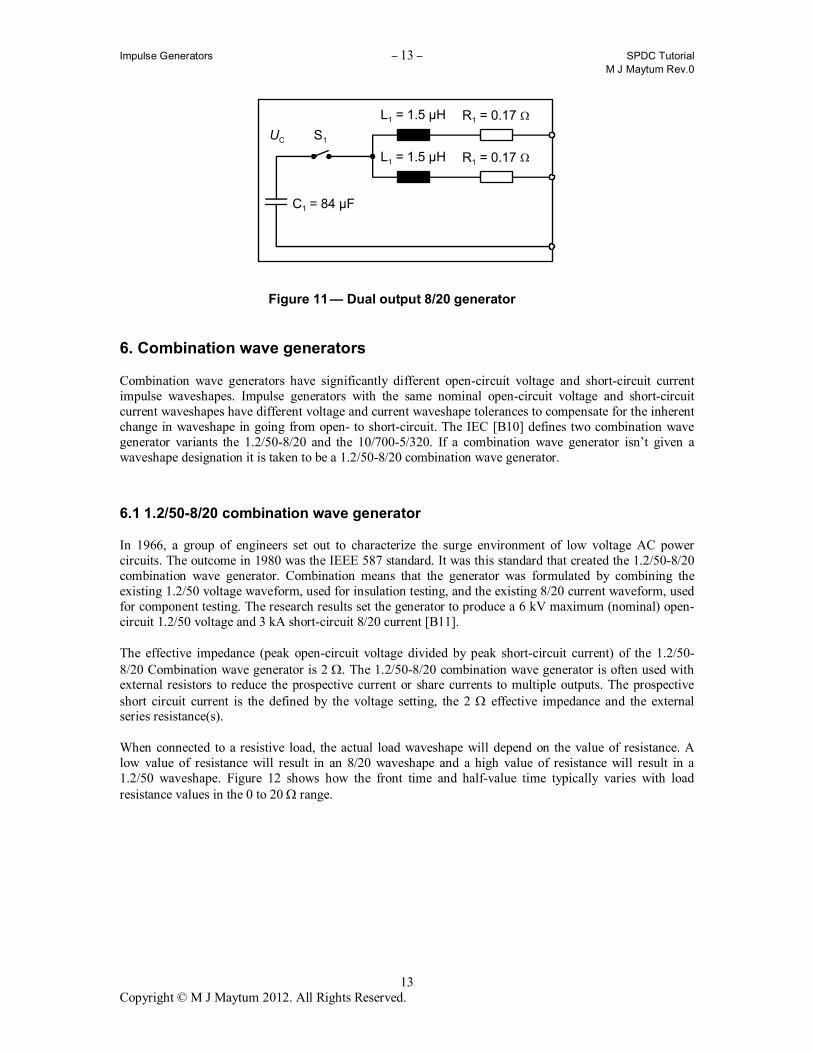
Figure 11 shows a dual output 8/20 generator that produces 2x3 kA/kV of charging voltage UC and a 20 %
underswing. Values for 10 % underswing and 2.8 kA/kV would be L1 = 1.5 µH, C1 = 96 µF and R1 =
0.21 .
Impulse Generators – 13 – SPDC Tutorial
M J Maytum Rev.0
13 Copyright © M J Maytum 2012. All Rights Reserved.
S1
C1 = 84 µF
UC
R1 = 0.17 L1 = 1.5 µH
R1 = 0.17 L1 = 1.5 µH
Figure 11 — Dual output 8/20 generator
6. Combination wave generators
Combination wave generators have significantly different open-circuit voltage and short-circuit current impulse waveshapes. Impulse generators with the same nominal open-circuit voltage and short-circuit current waveshapes have different voltage and current waveshape tolerances to compensate for the inherent change in waveshape in going from open- to short-circuit. The IEC [B10] defines two combination wave generator variants the 1.2/50-8/20 and the 10/700-5/320. If a combination wave generator isn’t given a waveshape designation it is taken to be a 1.2/50-8/20 combination wave generator.
6.1 1.2/50-8/20 combination wave generator
In 1966, a group of engineers set out to characterize the surge environment of low voltage AC power circuits. The outcome in 1980 was the IEEE 587 standard. It was this standard that created the 1.2/50-8/20 combination wave generator. Combination means that the generator was formulated by combining the existing 1.2/50 voltage waveform, used for insulation testing, and the existing 8/20 current waveform, used for component testing. The research results set the generator to produce a 6 kV maximum (nominal) open-circuit 1.2/50 voltage and 3 kA short-circuit 8/20 current [B11].
The effective impedance (peak open-circuit voltage divided by peak short-circuit current) of the 1.2/50-8/20 Combination wave generator is 2 . The 1.2/50-8/20 combination wave generator is often used with external resistors to reduce the prospective current or share currents to multiple outputs. The prospective short circuit current is the defined by the voltage setting, the 2 effective impedance and the external series resistance(s).
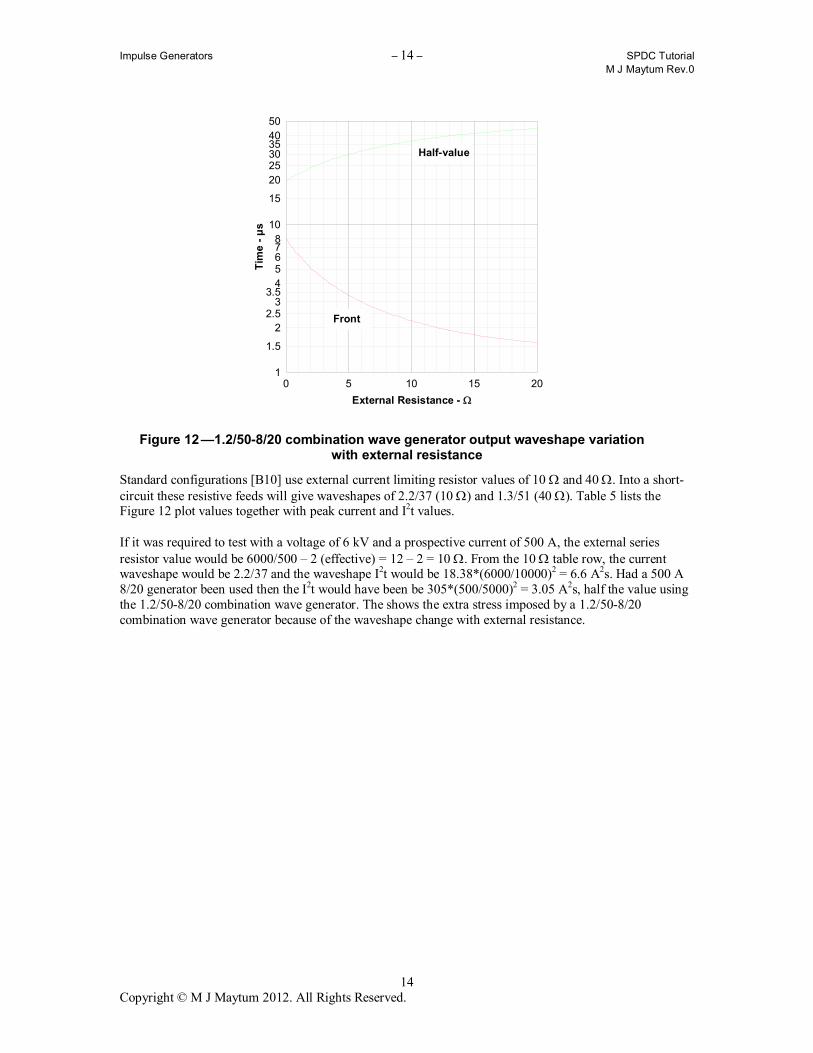
When connected to a resistive load, the actual load waveshape will depend on the value of resistance. A low value of resistance will result in an 8/20 waveshape and a high value of resistance will result in a 1.2/50 waveshape. Figure 12 shows how the front time and half-value time typically varies with load resistance values in the 0 to 20 range.
Impulse Generators – 14 – SPDC Tutorial
M J Maytum Rev.0
14 Copyright © M J Maytum 2012. All Rights Reserved.
External Resistance -
0 5 10 15 20
Tim
e -
µs
1.5
2
2.53
3.54
5678
15
20
25303540
50
1
10
Half-value
Front
Figure 12 —1.2/50-8/20 combination wave generator output waveshape variation with external resistance
Standard configurations [B10] use external current limiting resistor values of 10 and 40 . Into a short-circuit these resistive feeds will give waveshapes of 2.2/37 (10 ) and 1.3/51 (40 ). Table 5 lists the Figure 12 plot values together with peak current and I2t values.
If it was required to test with a voltage of 6 kV and a prospective current of 500 A, the external series resistor value would be 6000/500 – 2 (effective) = 12 – 2 = 10 . From the 10 table row, the current waveshape would be 2.2/37 and the waveshape I2t would be 18.38*(6000/10000)2 = 6.6 A2s. Had a 500 A 8/20 generator been used then the I2t would have been be 305*(500/5000)2 = 3.05 A2s, half the value using the 1.2/50-8/20 combination wave generator. The shows the extra stress imposed by a 1.2/50-8/20 combination wave generator because of the waveshape change with external resistance.
Impulse Generators – 15 – SPDC Tutorial
M J Maytum Rev.0
15 Copyright © M J Maytum 2012. All Rights Reserved.
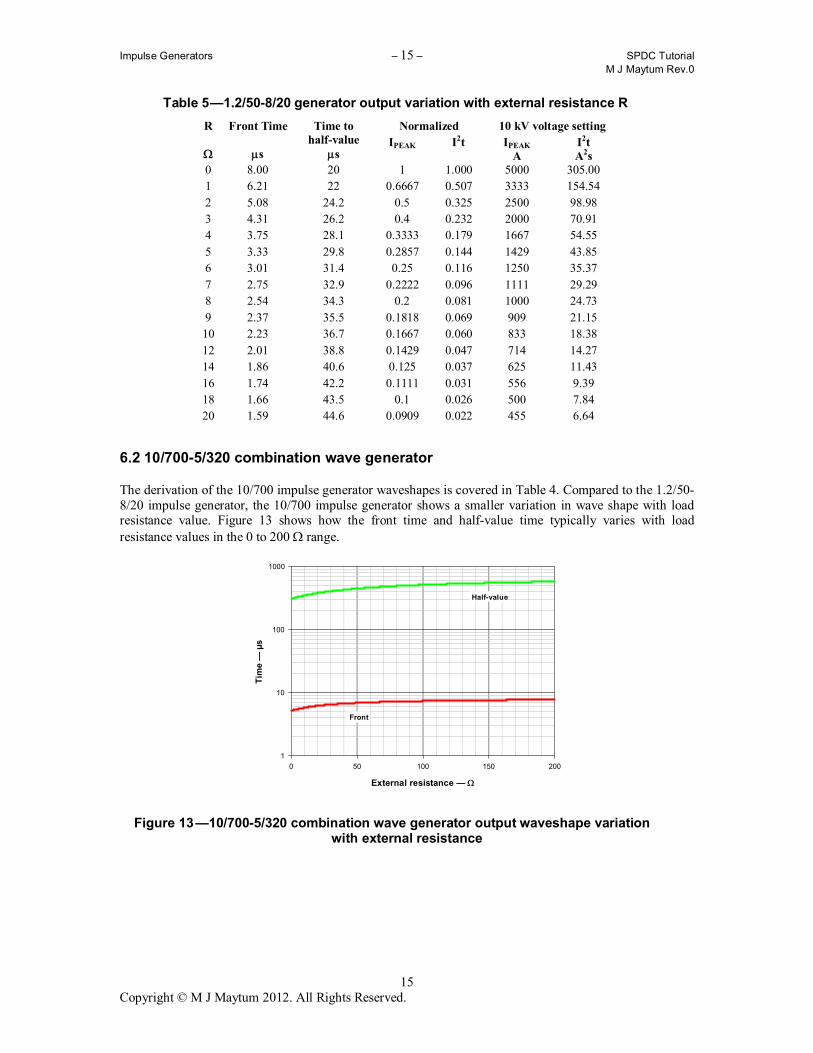
Table 5 —1.2/50-8/20 generator output variation with external resistance R
Normalized 10 kV voltage setting R
Front Time s
Time to half-value
s IPEAK I2t IPEAK
A I2t A2s
0 8.00 20 1 1.000 5000 305.00
1 6.21 22 0.6667 0.507 3333 154.54
2 5.08 24.2 0.5 0.325 2500 98.98
3 4.31 26.2 0.4 0.232 2000 70.91
4 3.75 28.1 0.3333 0.179 1667 54.55
5 3.33 29.8 0.2857 0.144 1429 43.85
6 3.01 31.4 0.25 0.116 1250 35.37
7 2.75 32.9 0.2222 0.096 1111 29.29
8 2.54 34.3 0.2 0.081 1000 24.73
9 2.37 35.5 0.1818 0.069 909 21.15
10 2.23 36.7 0.1667 0.060 833 18.38
12 2.01 38.8 0.1429 0.047 714 14.27
14 1.86 40.6 0.125 0.037 625 11.43
16 1.74 42.2 0.1111 0.031 556 9.39
18 1.66 43.5 0.1 0.026 500 7.84
20 1.59 44.6 0.0909 0.022 455 6.64
6.2 10/700-5/320 combination wave generator
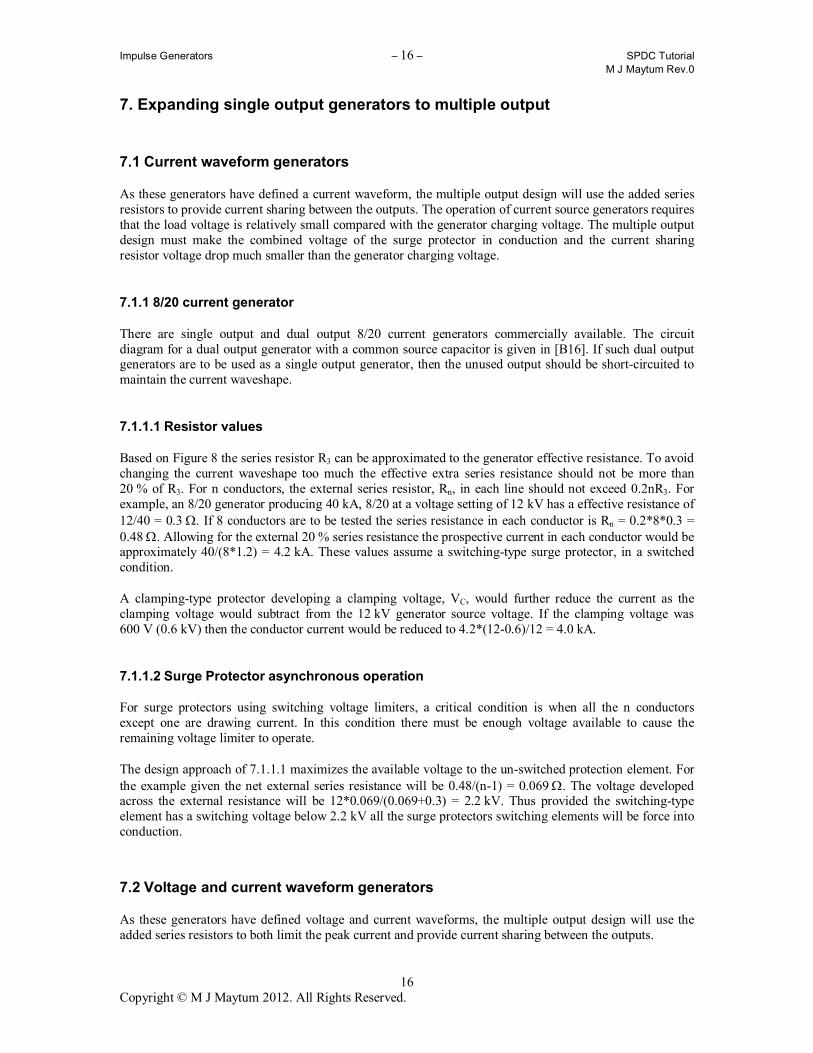
The derivation of the 10/700 impulse generator waveshapes is covered in Table 4. Compared to the 1.2/50-8/20 impulse generator, the 10/700 impulse generator shows a smaller variation in wave shape with load resistance value. Figure 13 shows how the front time and half-value time typically varies with load resistance values in the 0 to 200 range.
External resistance —
0 50 100 150 200
Tim
e —
µs
1
10
100
1000
Half-value
Front
Figure 13 —10/700-5/320 combination wave generator output waveshape variation with external resistance
Impulse Generators – 16 – SPDC Tutorial
M J Maytum Rev.0
16 Copyright © M J Maytum 2012. All Rights Reserved.
7. Expanding single output generators to multiple output
7.1 Current waveform generators
As these generators have defined a current waveform, the multiple output design will use the added series resistors to provide current sharing between the outputs. The operation of current source generators requires that the load voltage is relatively small compared with the generator charging voltage. The multiple output design must make the combined voltage of the surge protector in conduction and the current sharing resistor voltage drop much smaller than the generator charging voltage.
7.1.1 8/20 current generator
There are single output and dual output 8/20 current generators commercially available. The circuit diagram for a dual output generator with a common source capacitor is given in [B16]. If such dual output generators are to be used as a single output generator, then the unused output should be short-circuited to maintain the current waveshape.
7.1.1.1 Resistor values
Based on Figure 8 the series resistor R3 can be approximated to the generator effective resistance. To avoid changing the current waveshape too much the effective extra series resistance should not be more than 20 % of R3. For n conductors, the external series resistor, Rn, in each line should not exceed 0.2nR3. For example, an 8/20 generator producing 40 kA, 8/20 at a voltage setting of 12 kV has a effective resistance of 12/40 = 0.3 . If 8 conductors are to be tested the series resistance in each conductor is Rn = 0.2*8*0.3 = 0.48 . Allowing for the external 20 % series resistance the prospective current in each conductor would be approximately 40/(8*1.2) = 4.2 kA. These values assume a switching-type surge protector, in a switched condition.
A clamping-type protector developing a clamping voltage, VC, would further reduce the current as the clamping voltage would subtract from the 12 kV generator source voltage. If the clamping voltage was 600 V (0.6 kV) then the conductor current would be reduced to 4.2*(12-0.6)/12 = 4.0 kA.
7.1.1.2 Surge Protector asynchronous operation
For surge protectors using switching voltage limiters, a critical condition is when all the n conductors except one are drawing current. In this condition there must be enough voltage available to cause the remaining voltage limiter to operate.
The design approach of 7.1.1.1 maximizes the available voltage to the un-switched protection element. For the example given the net external series resistance will be 0.48/(n-1) = 0.069 . The voltage developed across the external resistance will be 12*0.069/(0.069+0.3) = 2.2 kV. Thus provided the switching-type element has a switching voltage below 2.2 kV all the surge protectors switching elements will be force into conduction.
7.2 Voltage and current waveform generators
As these generators have defined voltage and current waveforms, the multiple output design will use the added series resistors to both limit the peak current and provide current sharing between the outputs.
Impulse Generators – 17 – SPDC Tutorial
M J Maytum Rev.0
17 Copyright © M J Maytum 2012. All Rights Reserved.
7.2.1 1.2/50-8/20 generator
The operation of the 1.2/50-8/20 impulse generator has been covered in 5.3 and 6.1. Because the waveshape varies with external resistance value the stress level, for a given peak current, will increase with increasing generator voltage. For example, 500 A at 6 kV (10 external resistance) will result in an I2t of 6.6 A2s. Lowering the voltage to 2 kV (2 external resistance) will result in an I2t of 4 A2s. Thus for a given current the actual generator voltage used will influence the stress level.
7.2.1.1 Resistor values
For n conductors, a generator setting of VC1 and an individual conductor prospective short-circuit current In, the conductor series resistor Rn will be:
Rn/n = VGEN/(n*In) – 2
or
Rn = VGEN/In – 2*n
where:
n*In is the total current delivered by the generator
Rn/n is the external generator net load.
For a practical value of Rn, then VGEN/In > 2*n.
7.2.1.2 Surge Protector asynchronous operation
For surge protectors using switching voltage limiters, a critical condition is when all the n conductors except one are drawing current. In this condition there must be enough voltage available to cause the remaining voltage limiter to operate.
If the voltage limiter operates at level VL, then the voltage across the (n-1) resistor conducting current must equal or exceed VL:
VL < VGEN * (Rn/(n-1))/(2+Rn/(n-1))
VL < VGEN/(2*(n-1)/Rn +1)
Substituting Rn = VGEN/In – 2*n gives
VL < VGEN/(2*(n-1)/(VGEN/In – 2*n) +1)
VL < VGEN*(VGEN/In – 2*n)/(2*(n-1) + VGEN/In – 2*n)
VL < VGEN*(VGEN/In – 2*n)/(VGEN/In – 2)
For example, if VGEN = 6 kV, n = 2 and In = 1 kA, then Rn = 6000/1000 -2*2 = 2 . To operate, the maximum voltage limiter operating level, VL, is 6*(6/1 - 2*2)/(6/1 – 2) = 6*2/4 = 3 kV.
Impulse Generators – 18 – SPDC Tutorial
M J Maytum Rev.0
18 Copyright © M J Maytum 2012. All Rights Reserved.
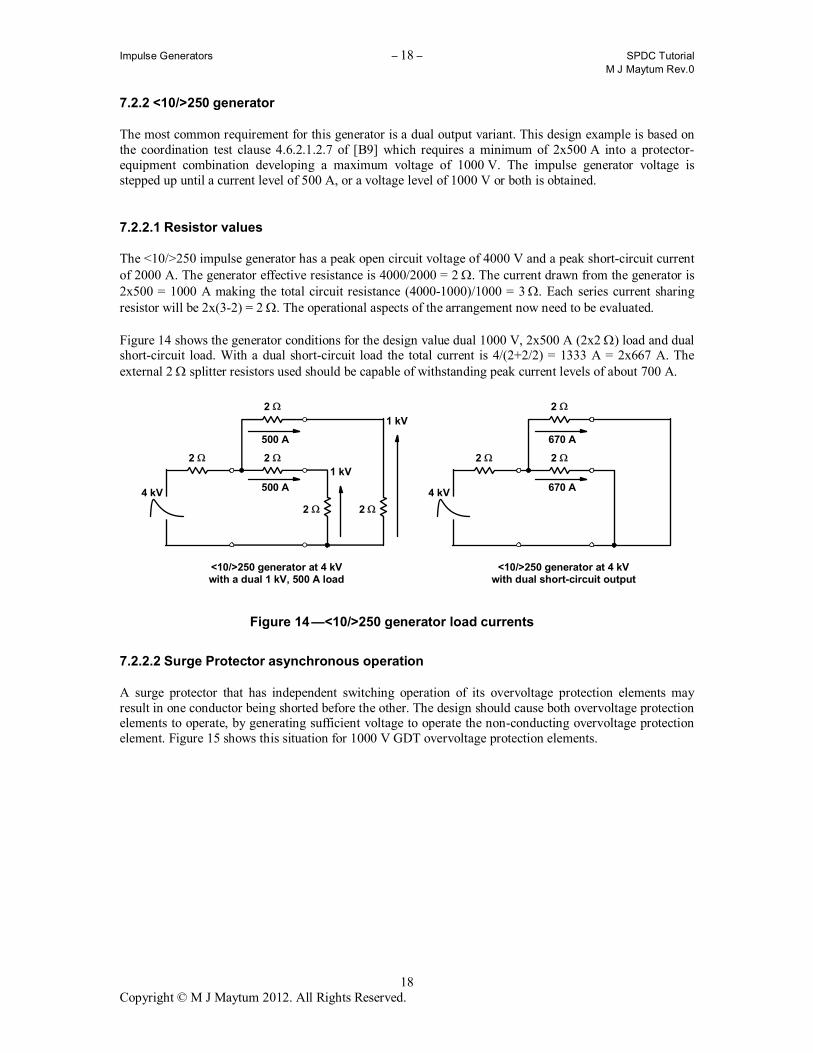
7.2.2 <10/>250 generator
The most common requirement for this generator is a dual output variant. This design example is based on the coordination test clause 4.6.2.1.2.7 of [B9] which requires a minimum of 2x500 A into a protector-equipment combination developing a maximum voltage of 1000 V. The impulse generator voltage is stepped up until a current level of 500 A, or a voltage level of 1000 V or both is obtained.
7.2.2.1 Resistor values
The <10/>250 impulse generator has a peak open circuit voltage of 4000 V and a peak short-circuit current of 2000 A. The generator effective resistance is 4000/2000 = 2 . The current drawn from the generator is 2x500 = 1000 A making the total circuit resistance (4000-1000)/1000 = 3 . Each series current sharing resistor will be 2x(3-2) = 2 . The operational aspects of the arrangement now need to be evaluated.
Figure 14 shows the generator conditions for the design value dual 1000 V, 2x500 A (2x2 ) load and dual short-circuit load. With a dual short-circuit load the total current is 4/(2+2/2) = 1333 A = 2x667 A. The external 2 splitter resistors used should be capable of withstanding peak current levels of about 700 A.
2
500 A
1 kV
2
4 kV
<10/>250 generator at 4 kVwith a dual 1 kV, 500 A load
2
2
500 A
2
1 kV
670 A
2
4 kV
<10/>250 generator at 4 kVwith dual short-circuit output
2
2
670 A
Figure 14 —<10/>250 generator load currents
7.2.2.2 Surge Protector asynchronous operation
A surge protector that has independent switching operation of its overvoltage protection elements may result in one conductor being shorted before the other. The design should cause both overvoltage protection elements to operate, by generating sufficient voltage to operate the non-conducting overvoltage protection element. Figure 15 shows this situation for 1000 V GDT overvoltage protection elements.

Impulse Generators – 19 – SPDC Tutorial
M J Maytum Rev.0
19 Copyright © M J Maytum 2012. All Rights Reserved.
250 A
2
1 kV
<10/>250 generator with asynchronous 1 kV GDTprotectors — first protector just operated
2
2
500 V
500 A
2
2 kV
<10/>250 generator with asynchronous 1 kV GDTprotectors — second protector just about to operate
2
2
1 kV
Figure 15 — Asynchronous GDT operation
When the generator voltage is set to VL (1 kV), one GDT operates first. In operation the GDT conducts a current of 250 A and reduces the voltage of the other GDT to 500 V. Stepping up the generator voltage to 2 kV gives an un-operated GDT voltage of 1 kV with a current of 500 A in the operated GDT. The next small step increase in generator voltage will operate both GDTs.
Had a 3-electrode common-chamber GDT, been used rather than two 2-electrode GDTs, then operation of one side would have automatically caused operation of the other side, reducing the EUT metallic (transverse) stress level.
8. Generator variants
Anomalies occur due to the way in which different standards organizations define a certain waveshape generator. The two differences that can occur are due to tolerance values and current sharing resistances. Users need to be aware of which generator variant they have and if its performance will have an adverse effect on the test result.
8.1 8/20 current generators
Table 2 shows that the 8/20 current generator has two tolerance sets. Generator #3 is the preferred and most commonly used one because it has a ±10 % waveform tolerance compared the ±20 % of generator #4.
8.2 10/1000 generators
In 1955, Bell Telephone Laboratories standardized on a 10/600 waveshape for protection testing [B12]. The recommendations of a 1961 Bell Laboratories field study report resulted in the adoption of a 10/1000 waveshape [B13] The chosen front time of 10 µs was less than 99.5 % of the recorded values and the chosen half-value time of 1000 µs was greater than 95 % of the recorded values.
The study covered five voice-grade trunk routes with a mixture of aerial and underground cabling. Measurements made on modern, short distance DSL-capable lines show front times in the microsecond region.
A Canadian Bell-Northern Research 1968-1969 field study [B14] studied three types of facility. The report suggested the following waveforms, 1000 V, 10/1000 to cover 99.8 % of all paired and coaxial cable
Impulse Generators – 20 – SPDC Tutorial
M J Maytum Rev.0
20 Copyright © M J Maytum 2012. All Rights Reserved.
lightning surges and 2000 V, 4/200 to cover 99.8 % of all open wire circuit lightning surges. The report showed an inverse correlation existed between the surge voltage and decay for higher level surges.
As a result of these recommendations the 1000 V, 100 A, <10/>1000 impulse was standardized on by Telecordia for many of its NEBS (Network Equipment - Building System) documents [B9]. This is the <10/>1000 generator #11 in Table A.3.
Generator #11 is different to the IEEE version [B8] of a 10/1000 generator listed #12 in Table A.3. The IEEE 10/1000 generator defines a 10/1000 waveform mostly based on nominal and not limit values. The Telcordia <10/>1000 generator delivers higher stress levels than the IEEE 10/1000 generator. Mixing up these two 10/1000 generator variants is unlikely as commercially available 10/1000 generators are based on the Telcordia (#11) variant. To enable the testing of common mode (longitudinal) coordination between surge protectors and equipment a dual output generator is available with independent outputs of 2 kV, 200A, <10/>1000.
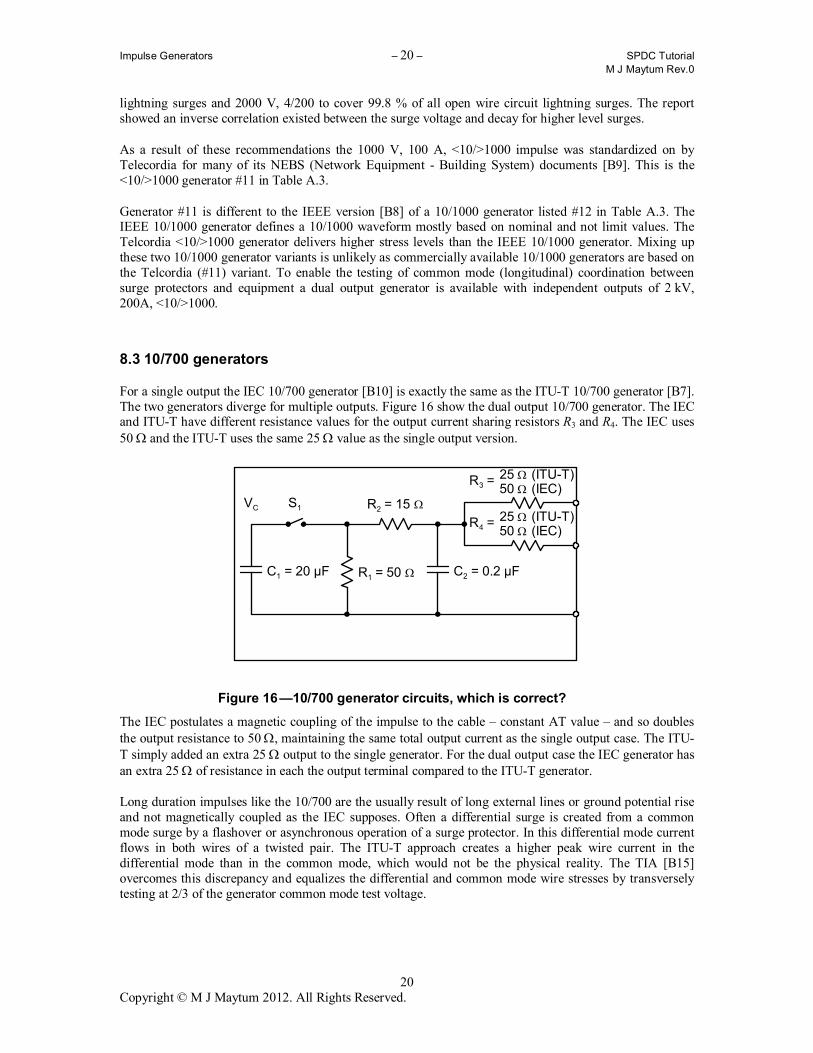
8.3 10/700 generators
For a single output the IEC 10/700 generator [B10] is exactly the same as the ITU-T 10/700 generator [B7]. The two generators diverge for multiple outputs. Figure 16 show the dual output 10/700 generator. The IEC and ITU-T have different resistance values for the output current sharing resistors R3 and R4. The IEC uses 50 and the ITU-T uses the same 25 value as the single output version.
R2 = 15 S1
R1 = 50 C1 = 20 µF C2 = 0.2 µF
VC
R3 = 25 (ITU-T)50 (IEC)
R4 = 25 (ITU-T)50 (IEC)
Figure 16 —10/700 generator circuits, which is correct?
The IEC postulates a magnetic coupling of the impulse to the cable – constant AT value – and so doubles the output resistance to 50 , maintaining the same total output current as the single output case. The ITU-T simply added an extra 25 output to the single generator. For the dual output case the IEC generator has an extra 25 of resistance in each the output terminal compared to the ITU-T generator.
Long duration impulses like the 10/700 are the usually result of long external lines or ground potential rise and not magnetically coupled as the IEC supposes. Often a differential surge is created from a common mode surge by a flashover or asynchronous operation of a surge protector. In this differential mode current flows in both wires of a twisted pair. The ITU-T approach creates a higher peak wire current in the differential mode than in the common mode, which would not be the physical reality. The TIA [B15] overcomes this discrepancy and equalizes the differential and common mode wire stresses by transversely testing at 2/3 of the generator common mode test voltage.
Impulse Generators – 21 – SPDC Tutorial
M J Maytum Rev.0
21 Copyright © M J Maytum 2012. All Rights Reserved.
When testing a single wire, there will be no difference in the results between the ITU-T and IEC generators. In two or more wire testing with the IEC generator will result in lower stress levels than the ITU-T generator would give. 4.3 makes further comments on these two generators.
8.4 10/350 generators
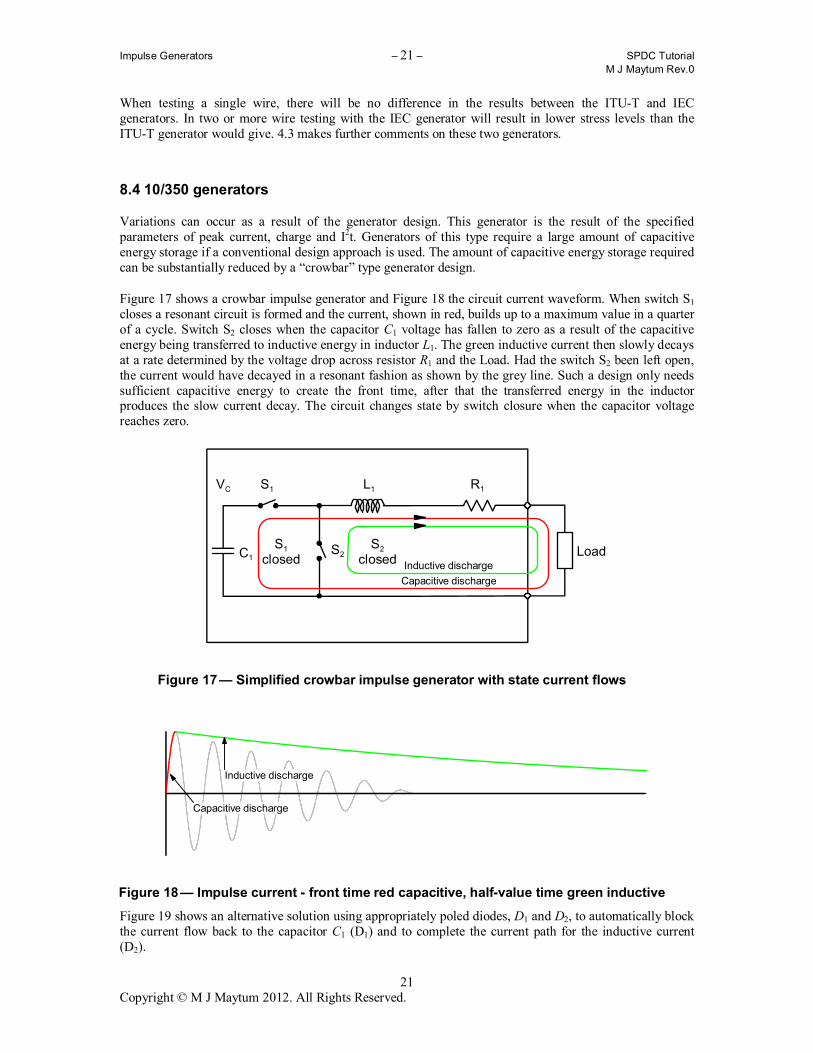
Variations can occur as a result of the generator design. This generator is the result of the specified parameters of peak current, charge and I2t. Generators of this type require a large amount of capacitive energy storage if a conventional design approach is used. The amount of capacitive energy storage required can be substantially reduced by a “crowbar” type generator design.
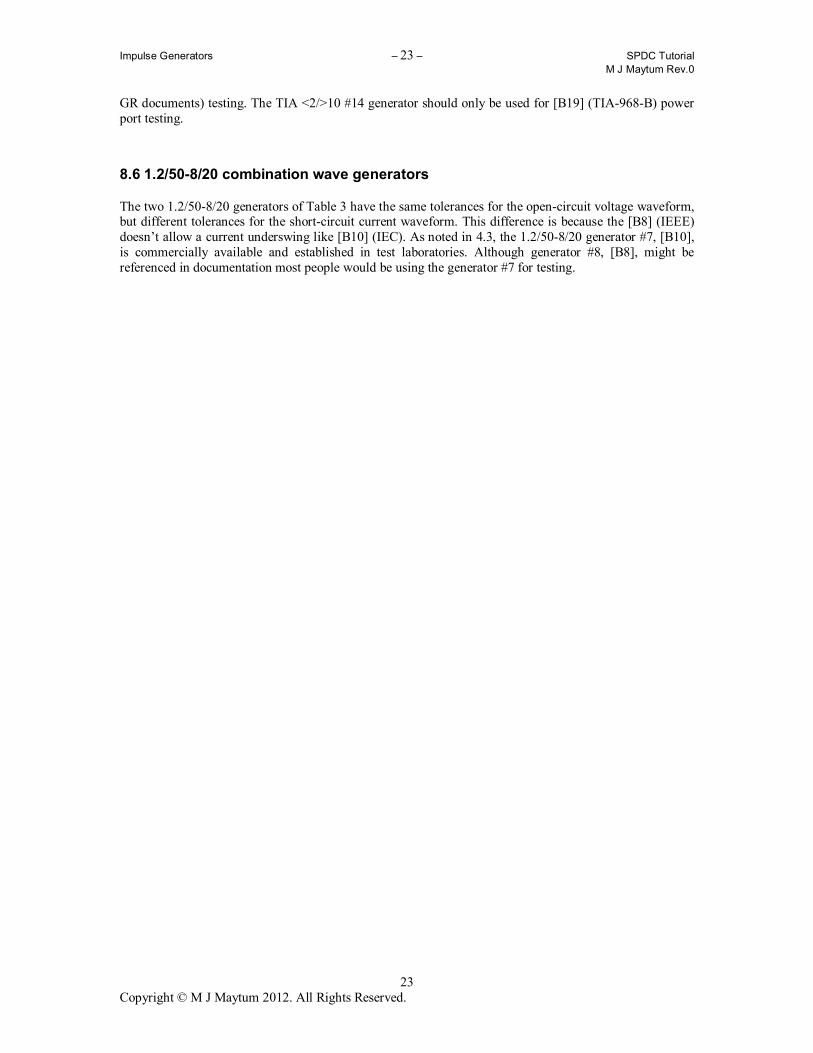
Figure 17 shows a crowbar impulse generator and Figure 18 the circuit current waveform. When switch S1 closes a resonant circuit is formed and the current, shown in red, builds up to a maximum value in a quarter of a cycle. Switch S2 closes when the capacitor C1 voltage has fallen to zero as a result of the capacitive energy being transferred to inductive energy in inductor L1. The green inductive current then slowly decays at a rate determined by the voltage drop across resistor R1 and the Load. Had the switch S2 been left open, the current would have decayed in a resonant fashion as shown by the grey line. Such a design only needs sufficient capacitive energy to create the front time, after that the transferred energy in the inductor produces the slow current decay. The circuit changes state by switch closure when the capacitor voltage reaches zero.
S1
C1
VC L1 R1
S2 LoadS1
closedS2
closed
Capacitive discharge
Inductive discharge
Figure 17 — Simplified crowbar impulse generator with state current flows
Capacitive discharge
Inductive discharge
Figure 18 — Impulse current - front time red capacitive, half-value time green inductive
Figure 19 shows an alternative solution using appropriately poled diodes, D1 and D2, to automatically block the current flow back to the capacitor C1 (D1) and to complete the current path for the inductive current (D2).

Impulse Generators – 22 – SPDC Tutorial
M J Maytum Rev.0
22 Copyright © M J Maytum 2012. All Rights Reserved.
C1
VC L1 R1
Load
first quarter cycle loop
D1
D2
loop when VC = 0
S1
Capacitive discharge
Inductive discharge
Figure 19 — Steering diode impulse generator
The decay current loop is through D1, L1, R1 and the Load. If the load is a clamping type protector it will tend to develop a reasonably constant voltage. A constant voltage applied to an inductor will create a linear ramp of current. The relative resistive voltage (R1) component and the load constant voltage component values will determine how linear or exponential the current decay is. Figure 20 shows two different amplitude current impulses normalized to show the different decay rates. The black trace (1) is the highest current and will have the largest resistive voltage component. The red (2) trace is the lowest current and the constant voltage from the clamping load causes a much more linear current decay and early current termination. A constant voltage component in the load will shorten the total current flow time of a crowbar generator.
1
2
Figure 20 — High and low amplitude impulses normalized to show different decay rates
In surge protector endurance testing measureable performance differences have been found between conventional design and crowbar type generators. The impulse current delivered to the load should be monitored to detect any major generator-load interactions.
8.5 <2/>10 generators
The two <2/>10 generators of Table 4 are different in effective impedances, voltage front-time designation and tolerances. Although the same nominal values, the Telcordia <2/>10 uses a 10 % to 90 % front-time designation for voltage, whereas the TIA <2/>10 uses the standard 30 % to 90 % front-time designation for voltage. The Telcordia <2/>10 #13 generator should only be used for [B9] (GR-1089-CORE and related
Impulse Generators – 23 – SPDC Tutorial
M J Maytum Rev.0
23 Copyright © M J Maytum 2012. All Rights Reserved.
GR documents) testing. The TIA <2/>10 #14 generator should only be used for [B19] (TIA-968-B) power port testing.
8.6 1.2/50-8/20 combination wave generators
The two 1.2/50-8/20 generators of Table 3 have the same tolerances for the open-circuit voltage waveform, but different tolerances for the short-circuit current waveform. This difference is because the [B8] (IEEE) doesn’t allow a current underswing like [B10] (IEC). As noted in 4.3, the 1.2/50-8/20 generator #7, [B10], is commercially available and established in test laboratories. Although generator #8, [B8], might be referenced in documentation most people would be using the generator #7 for testing.
Impulse Generators – 24 – SPDC Tutorial
M J Maytum Rev.0
24 Copyright © M J Maytum 2012. All Rights Reserved.
Annex A
(informative)
Other forms of Impulse Generator
A.1 Defibrillators
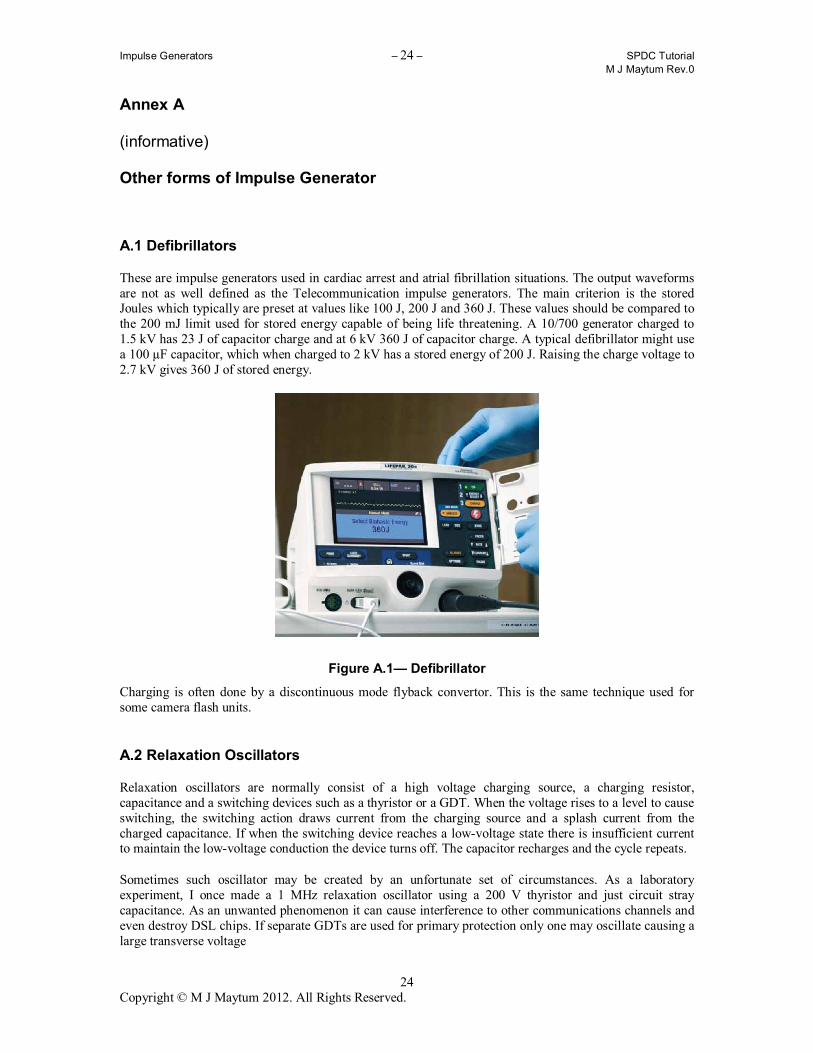
These are impulse generators used in cardiac arrest and atrial fibrillation situations. The output waveforms are not as well defined as the Telecommunication impulse generators. The main criterion is the stored Joules which typically are preset at values like 100 J, 200 J and 360 J. These values should be compared to the 200 mJ limit used for stored energy capable of being life threatening. A 10/700 generator charged to 1.5 kV has 23 J of capacitor charge and at 6 kV 360 J of capacitor charge. A typical defibrillator might use a 100 µF capacitor, which when charged to 2 kV has a stored energy of 200 J. Raising the charge voltage to 2.7 kV gives 360 J of stored energy.
Figure A.1— Defibrillator
Charging is often done by a discontinuous mode flyback convertor. This is the same technique used for some camera flash units.
A.2 Relaxation Oscillators
Relaxation oscillators are normally consist of a high voltage charging source, a charging resistor, capacitance and a switching devices such as a thyristor or a GDT. When the voltage rises to a level to cause switching, the switching action draws current from the charging source and a splash current from the charged capacitance. If when the switching device reaches a low-voltage state there is insufficient current to maintain the low-voltage conduction the device turns off. The capacitor recharges and the cycle repeats.
Sometimes such oscillator may be created by an unfortunate set of circumstances. As a laboratory experiment, I once made a 1 MHz relaxation oscillator using a 200 V thyristor and just circuit stray capacitance. As an unwanted phenomenon it can cause interference to other communications channels and even destroy DSL chips. If separate GDTs are used for primary protection only one may oscillate causing a large transverse voltage

Impulse Generators – 25 – SPDC Tutorial
M J Maytum Rev.0
25 Copyright © M J Maytum 2012. All Rights Reserved.
In terms of surge testing, the most likely test to show oscillation is high impedance common-mode AC fault testing. For example the standard 600 V rms voltage source used with a 600 resistor can create conditions relaxation oscillation. Oscillation can normally be stopped by using a switching protector from a different manufacture or product range.
Here are two example waveforms:
Figure A.2— primary GDT voltage (yellow) and current (blue) with an normal GDT
Figure A.3— primary GDT voltage (yellow) and current (blue) with an oscillating GDT
Lusin [B20] experienced oscillations during 600 V AC testing,. His take on the situation was that the ITU-T test set-up, which removes any circuit damping by decoupling the connected equipment, exacerbated, if not caused, the conditions for oscillation.
Figure A.4— GDT oscillations during ITU-T 600 V testing (Lusin)
“The green trace shows the GDT voltage (500 V/Div). The voltage rises and the GDT operates. The voltage drop on the decoupling inductances prevents a large enough current for the arc mode and the GDT remains
Impulse Generators – 26 – SPDC Tutorial
M J Maytum Rev.0
26 Copyright © M J Maytum 2012. All Rights Reserved.
in the glow mode. The GDT converts the longitudinal surge oscillations into a transverse (differential) voltage (blue trace 20 V/Div) at the DSL line driver input. This transverse voltage can kill the line driver IC, or necessitate extra protection components and cost to fix the problem caused by the ITU-T set-up.”
In summary, each half cycle has about 7 ms of 200 V peak to peak oscillation during a longitudinal power fault condition, which converted to an 80 V peak to peak transverse oscillation at the modem input - killing the driver IC.
Impulse Generators – 27 – SPDC Tutorial
M J Maytum Rev.0
27 Copyright © M J Maytum 2012. All Rights Reserved.
Annex B (informative)
Bibliography
[B1] IEEE Std 4TM-1995, IEEE Standard Techniques for High Voltage Testing
[B2] IEC 60060-1 ed. 3.0 (2010-09) High-voltage test techniques – Part 1: General definitions and test requirements
[B3] IEC 60950-1 ed. 2.0 (2005-12) Information technology equipment - Safety - Part 1: General requirements, Annex N (normative) Impulse test generators
[B4] Recommendation ITU-T K.44 (04/2008) Resistibility tests for telecommunication equipment exposed to overvoltages and overcurrents – Basic Recommendation, Figure A.3-2
[B5] IEC 62475 ed. 1.0 (2010-09) High-current test techniques - Definitions and requirements for test currents and measuring systems
[B6] IEC 61643-11 ed. 1.0 (2011-03) Low-voltage surge protective devices - Part 11: Surge protective devices connected to low-voltage power systems - Requirements and test methods
[B7] Recommendation ITU-T K.44 (04/2008) Resistibility tests for telecommunication equipment exposed to overvoltages and overcurrents – Basic Recommendation, Figure A.3-1
[B8] C62.45-2002 IEEE Recommended Practice on Surge Testing for Equipment Connected to Low-Voltage (1000 V and Less) AC Power Circuits
[B9] GR-1089-CORE, Issue 6, Electromagnetic Compatibility and Electrical Safety - Generic Criteria for Network Telecommunications Equipment
[B10] IEC 61000-4-5 ed2.0 (2005-11) Electromagnetic compatibility (EMC) - Part 4-5: Testing and measurement techniques - Surge immunity test
[B11] François D. Martzloff, A Standard for the 90s: IEEE C62.41 Surges Ahead, Compliance Engineering, Fall 1991
[B12] BODLE, D.W., GHAZI, A.J., SYED, M., and WOODSIDE, R.L., Characterization of the electrical environment, University of Toronto Press, 1976
[B13] D.W. Bodle and P.A. Gresh, “Lightning Surges in Paired Telephone Cable Facilities”, The Bell System Technical Journal, March, 1961
[B14] E. Bennison, A. Ghazi, P. Ferland, Lightning Surges in Open Wire, Coaxial, and Paired Cables, IEEE Transactions on Communications, Oct 1973, Volume: 21, Issue: 10, pp 1136- 1143
[B15] TIA-968-B, Telecommunications Telephone Terminal Equipment Connector Requirements for Connection of Terminal Equipment to the Telephone Network
[B16] IEC 61643-311 (2012) Components for Low-Voltage Surge Protective Devices - Part 311: Performance requirements and test circuits for gas discharge tubes, Figure 14
[B17] IEC 60099-4, ed. 2.1 (2006-07) Surge arresters - Part 4: Metal-oxide surge arresters without gaps for a.c. systems
[B18] IEC TR 62066 ed. 1 (2002-06) Surge overvoltages and surge protection in low-voltage a.c. power systems - General basic information
[B19] TIA-968-B Telecommunications Telephone Terminal Equipment: Technical Requirements for Connection of Terminal Equipment to the Telephone Network, August 2009
[B20] Testing xDSL equipment, Thomas Lusin, 2007 PEG Annual Meeting Presentation. Page 8.

![Impulse generators used for testing low-voltage equipmentpes-spdc.org/sites/default/files/Impulse_generatorsadded...impulse is 10 % and 90 % of the peak value [B5] NOTE—Some standards](https://img.pdfslide.us/doc/110x75/60e7720ea9ea105b76659a39/impulse-generators-used-for-testing-low-voltage-equipmentpes-spdcorgsitesdefaultfilesimpulsegeneratorsadded.jpg)