Embed Size (px)
Citation preview
Teresa Walter, Julia Kloos and Daniel Tsegai
Improving water use efficiency under worsening scarcity: Evidence from the Middle Olifants sub-basin in South Africa
Zentrum für EntwicklungsforschungCenter for Development ResearchUniversity of Bonn
ZEF-Discussion Papers on Development Policy No. 143
Bonn, November 2010
brought to you by COREView metadata, citation and similar papers at core.ac.uk
provided by Research Papers in Economics
The CENTER FOR DEVELOPMENT RESEARCH (ZEF) was established in 1995 as an international, interdisciplinary research institute at the University of Bonn. Research and teaching at ZEF aims to contribute to resolving political, economic and ecological development problems. ZEF closely cooperates with national and international partners in research and development organizations. For information, see: http://www.zef.de. ZEF – DISCUSSION PAPERS ON DEVELOPMENT POLICY are intended to stimulate discussion among researchers, practitioners and policy makers on current and emerging development issues. Each paper has been exposed to an internal discussion within the Center for Development Research (ZEF) and an external review. The papers mostly reflect work in progress. Teresa Walter, Julia Kloos and Daniel Tsegai, Improving water use efficiency under worsening scarcity: Evidence from the Middle Olifants sub-basin in South Africa, ZEF- Discussion Papers on Development Policy No. 143, Center for Development Research, Bonn, November 2010, pp. 21 ISSN: 1436-9931 Published by: Zentrum für Entwicklungsforschung (ZEF) Center for Development Research Walter-Flex-Straße 3 D – 53113 Bonn Germany Phone: +49-228-73-1861 Fax: +49-228-73-1869 E-Mail: [email protected] http://www.zef.de The authors: Teresa Walter, Center for Development Research (ZEF), University of Bonn. Contact: [email protected] Julia Kloos, Center for Development Research (ZEF), University of Bonn. Contact: [email protected] Daniel Tsegai, Center for Development Research (ZEF), University of Bonn. Contact: [email protected]

Acknowledgements
This work is part of the BMBF-funded project on “Integrated Water Resources Management Pilot Project in the Middle Olifants Sub-basin of South Africa”. We would like to thank Dr. Anik Bhaduri from ZEF and Dr. Charles Rodgers for their review and insightful comments on the earlier versions of the manuscript.
Abstract
With the political changes in South Africa in the early 1990s, the South African government introduced a reform process in the entire water sector with the goal of a more enhanced and equitable water management system. This paper analyzes existing water allocation situations and applies a non-linear optimization model to investigate the optimal intra- and inter-regional allocations in the Middle Olifants sub-basin of South Africa. Results show higher benefit from inter-regional water allocation. Reducing water supply levels to conform to the sustainable water supply policy, it can be shown that although water supply is reduced by approximately 50%, total benefits from water are only reduced by 5% and 11% for inter- and intra-regional allocation regimes respectively. These results indicate that alternative water allocation mechanisms can serve as instruments to offset for the effects of water scarcity.
Keywords: Water allocation, IWRM, Olifants basin, South Africa, Africa
1
1. Introduction
Water is one of the most indispensable of all natural resources; it is essential for human beings, economic development and biological diversity. However, many countries have to face the challenge of rapidly growing water demands, driven by an increased population and economic growth, linked to urbanization, industrialization and mechanization (King, 2004). The resulting water scarcity is one of the most pervasive natural resources allocation problems faced by development planners. Hence, water resources management turned out to be a political, social and economic issue of the present century and economists face new challenges of growing societal demands for water and changing laws and institutions (Louw, 2002). Nevertheless, it is also recognized that water scarcity not only results from quantitative or qualitative scarcity, but also from inefficient use and poor water management (Dinar, 2003). Therefore, the need for efficient, equitable and sustainable water allocation policies has increased and new water management studies aim at investigating innovative strategies to yield more efficient water allocation (Rosegrant et al., 2000, Ringler, 2001).
South Africa is one of the numerous countries in the world experiencing water shortages. The increasing competition between water users, decreased water supply and the high and the ever mounting demand for fresh water are some of the major problems of the country (Hassan and Crafford, 2006). Consequently, current water uses are exceeding sustainable natural availability as groundwater is being mined, causing the need for new demand management strategies (Conradie, 2002). Hence, the South African government introduced the National Water Act (NWA) promoting an integrated and decentralized water resources management, emphasizing economic efficiency, environmental protection, equity and the empowerment of people (Hassan and Crafford, 2006). This requires better knowledge by water managers and policymakers on the economic value of water in various uses as well as powerful information systems that integrate hydrological, economic and social dimensions of water supply and demand in the framework of an Integrated Water Resources Management (IWRM) (McKinney et al., 1999). There has been a growing national interest and recognition of the role that market-based approaches can play in facilitating and improving water demand management and water allocation (Howe et al., 1986). However, there are some pre-requisites which are necessary for proper market functioning. These include information and knowledge on water-use efficiencies and water values in its different uses, price elasticities of water demand, as well as necessary institutional and political settings. Nevertheless, information in this regard hardly exists to achieve such a sustainable and efficient water use management in the country. Institutions are usually lagging far behind the need for more appropriate policies and analytical tools are missing to provide water resources management agencies with guidelines to introduce an economically sensible water management (Louw, 2002).
The paper is structured as follows. Section two presents the background, study area and objectives of the research. In section three, relevant literature is summarized and in section four, the conceptual framework outlining the basic structure of the model is illustrated. Section five elaborates on the demand coefficients and the final model structure. In section six, analysis of the main results, scenarios and policy simulations are presented, while section seven concludes.
2
2. Background and Objectives
2.1 National Water Act
Basically two new laws, the Water Services Act and the National Water Act (NWA), which specifies the Government as the trustee of the nations’ water resources led to considerable transformations in the South African water sector (Nieuwoudt et al., 2003). The Water Services Act (1997) guarantees the right for a basic provision of drinking water and sewage services, which obliges all governmental levels to apply an efficient and sustainable provision of drinking water and sewage services (Republic of South Africa, 2002). The NWA provides the legislative framework of the management of water as a national resource and the possibility for a better integration of groundwater and surface water as well as a better water quality and quantity management. To fulfill the objectives of efficiency, equity and sustainability, it sets the following priorities in water allocation:
i. Provision of the 'National Reserve': ‘Ecological Reserve’ and ‘Human Reserve’ ii. Meeting water needs for strategic purposes: ‘Strategic Reserve’ (e.g. power generation) iii. Meeting the needs of general social and economic uses
It, furthermore, acknowledges the possibility of temporary transfers of water entitlements and therefore creates the opportunity of water markets as allocation strategies.
As the Act emphasizes a decentralized water management, Water Management Areas (WMAs) are established, which conduct the protection, use, development, conservation, management and control of water resources. Catchment Management Agencies (CMAs) are in the process of introduction in all 19 WMAs to delegate water resource management planning to the regional or catchment level ensuring participation of local communities. For each WMA, the amount of water reserved for prioritized needs (Points I and ii) is determined by the National Department of Water Affairs (DWAF1
The amount set aside for the ‘Human Reserve’ is essentially determined through the implementation of the national Free Basic Water (FBW) policy guaranteeing access to water for basic human needs (25 liters per capita and day) as water is formally recognized as a human right in the South African Constitution. This is in line with the global policy where, the United Nations just recently in July 2010 declared water as a human right. However the member states did not agree on any binding numbers to be secured to people.
).
General social and economic uses constitute actual water demands of the various water users in South Africa such as industries, agriculture, services and households. As the water resources development potential has reached its limits in many WMAs, the issue of water demand management needs to be explored. According to Hassan and Farolfi (2005) water allocation decisions are currently made on the basis of limited information on water users´ behavior in different economic sectors. For an improved water demand management, the South African government has already implemented rather administrative approaches like water user registration and licensing. However, market-driven approaches with the aim of benefit maximization from water, which are based on the economic valuation of water, have not yet been applied.
1 It has been recently re-named as Department of Water Affairs (DWA).
3
2.2 Study Area
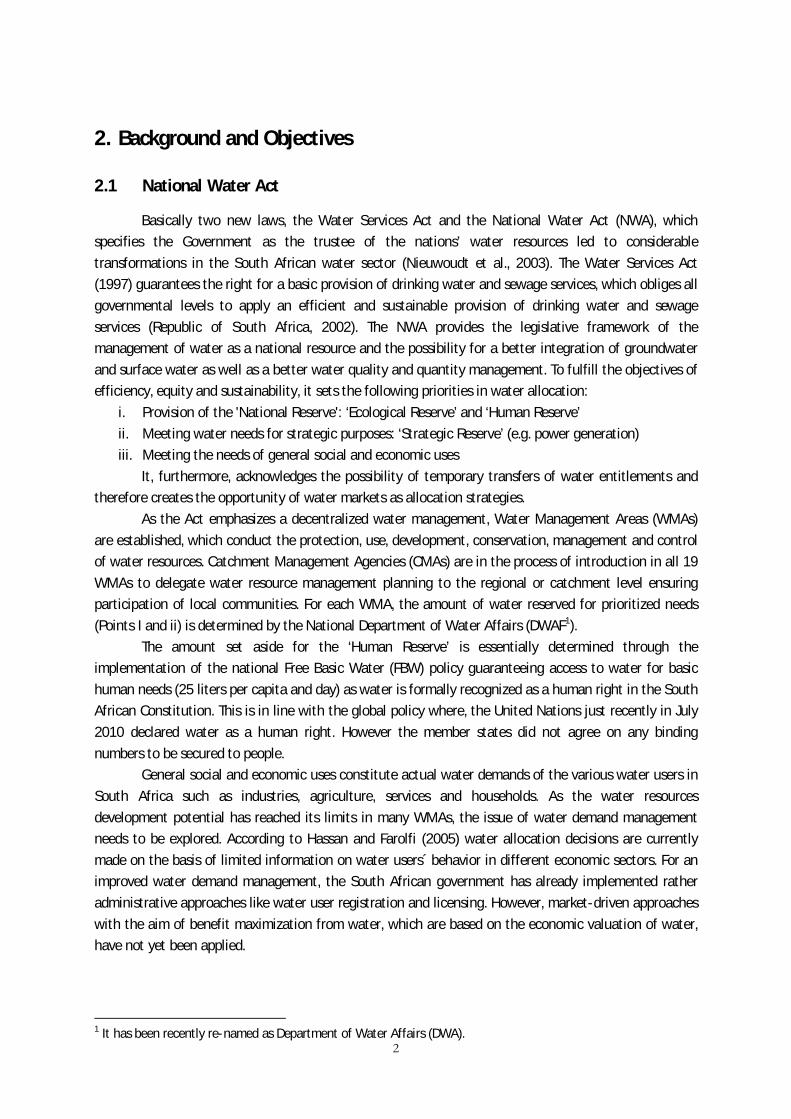
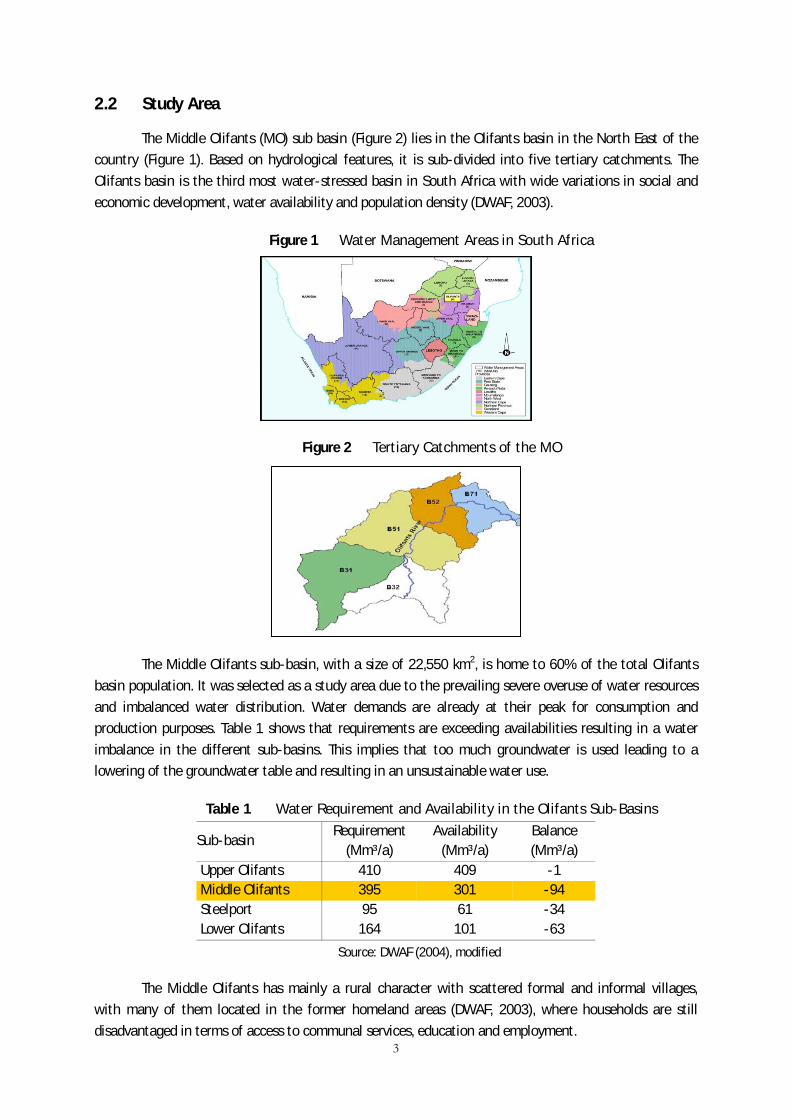
The Middle Olifants (MO) sub basin (Figure 2) lies in the Olifants basin in the North East of the country (Figure 1). Based on hydrological features, it is sub-divided into five tertiary catchments. The Olifants basin is the third most water-stressed basin in South Africa with wide variations in social and economic development, water availability and population density (DWAF, 2003).
Figure 1 Water Management Areas in South Africa
Figure 2 Tertiary Catchments of the MO
The Middle Olifants sub-basin, with a size of 22,550 km2, is home to 60% of the total Olifants
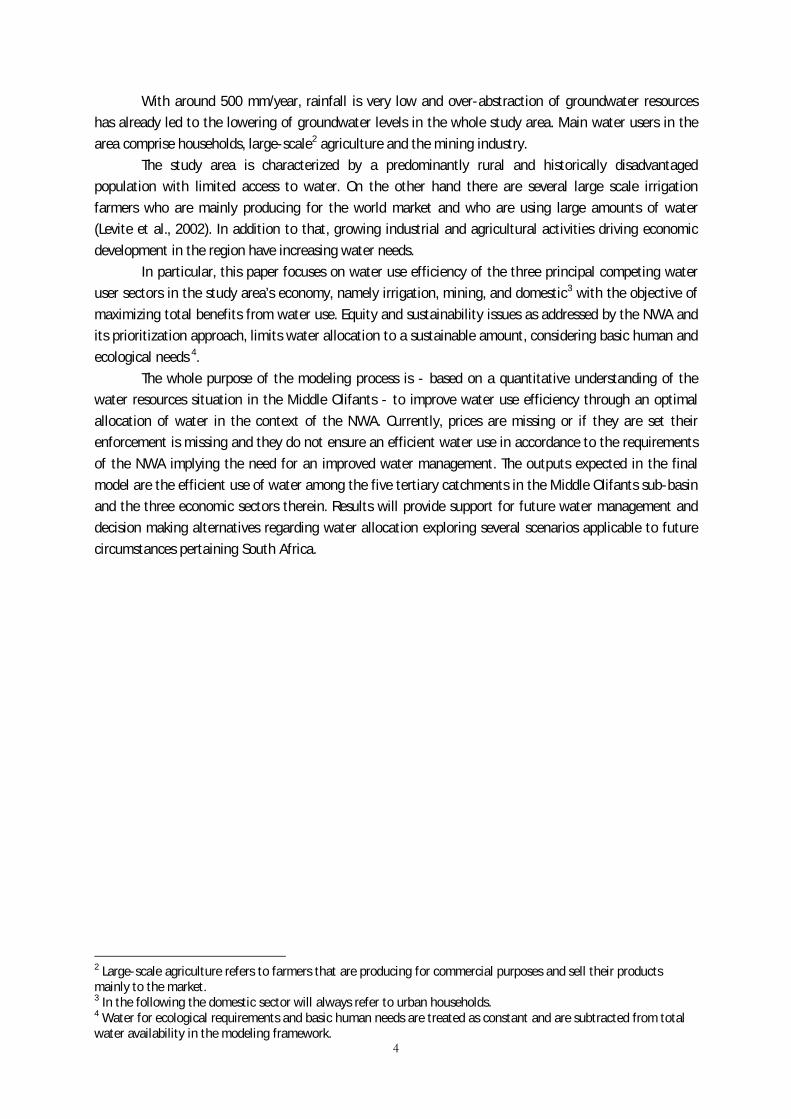
basin population. It was selected as a study area due to the prevailing severe overuse of water resources and imbalanced water distribution. Water demands are already at their peak for consumption and production purposes. Table 1 shows that requirements are exceeding availabilities resulting in a water imbalance in the different sub-basins. This implies that too much groundwater is used leading to a lowering of the groundwater table and resulting in an unsustainable water use.
Table 1 Water Requirement and Availability in the Olifants Sub-Basins
Sub-basin Requirement
(Mm³/a) Availability
(Mm³/a) Balance (Mm³/a)
Upper Olifants 410 409 -1 Middle Olifants 395 301 -94 Steelport 95 61 -34 Lower Olifants 164 101 -63
Source: DWAF (2004), modified
The Middle Olifants has mainly a rural character with scattered formal and informal villages, with many of them located in the former homeland areas (DWAF, 2003), where households are still disadvantaged in terms of access to communal services, education and employment.
4
With around 500 mm/year, rainfall is very low and over-abstraction of groundwater resources has already led to the lowering of groundwater levels in the whole study area. Main water users in the area comprise households, large-scale2
The study area is characterized by a predominantly rural and historically disadvantaged population with limited access to water. On the other hand there are several large scale irrigation farmers who are mainly producing for the world market and who are using large amounts of water (Levite et al., 2002). In addition to that, growing industrial and agricultural activities driving economic development in the region have increasing water needs.
agriculture and the mining industry.
In particular, this paper focuses on water use efficiency of the three principal competing water user sectors in the study area’s economy, namely irrigation, mining, and domestic3 with the objective of maximizing total benefits from water use. Equity and sustainability issues as addressed by the NWA and its prioritization approach, limits water allocation to a sustainable amount, considering basic human and ecological needs 4
The whole purpose of the modeling process is - based on a quantitative understanding of the water resources situation in the Middle Olifants - to improve water use efficiency through an optimal allocation of water in the context of the NWA. Currently, prices are missing or if they are set their enforcement is missing and they do not ensure an efficient water use in accordance to the requirements of the NWA implying the need for an improved water management. The outputs expected in the final model are the efficient use of water among the five tertiary catchments in the Middle Olifants sub-basin and the three economic sectors therein. Results will provide support for future water management and decision making alternatives regarding water allocation exploring several scenarios applicable to future circumstances pertaining South Africa.
.
2 Large-scale agriculture refers to farmers that are producing for commercial purposes and sell their products mainly to the market. 3 In the following the domestic sector will always refer to urban households. 4 Water for ecological requirements and basic human needs are treated as constant and are subtracted from total water availability in the modeling framework.
5
3. Literature Review
Due to the deteriorating water scarcity situation and the subsequent water allocation problems, water management has seen a paradigm shift from supply management (mainly through the increase of water availability via water supply infrastructure and other technical solutions) to demand management (through improved technologies, incentives, re-design of tariffs). Several studies have dealt with optimal water allocations in different regions of the world. They differ in the type of data used, applied methods
and biophysical factors included5
Booker and Young (1994) developed a river optimisation model for the Colorado River to identify optimal inter-regional allocations and prices. They find increasing benefits, which are generated by water use, of up to 50% through market transfers.
.
Rosegrant et al. (2000) developed an integrated economic hydrologic model for the Maipo River Basin in Chile that not only considers water allocation but also takes into account interactions of water allocation and agricultural productivity, non agricultural water demand and resource degradation. Consequently the model estimates economic as well as social gains from efficiency improvements of water use. The model consists of nodes and links, representing physical entities and links between these entities. Water Sources and inflows and water demands are modelled including agricultural, municipal and industrial water demand. With the objective of maximising benefits from water use water demand and supply are integrated into an endogenous system determining efficient water allocations. Model results show that reallocations to higher water values yield higher benefits from water use, which is driven by differences in the marginal unit values of water. The model can be further improved by including further inputs to agricultural productions and using empirically estimated data on household and industrial water demand rather than using literature based elasticities.
Louw (2002) developed a methodology to estimate the true value of water in the Berg River water management area in South Africa and evaluated potential impacts of a water market on the efficient utilization of water. With a positive mathematical programming model, the author developed a spatial equilibrium model to predict the impact of a potential water market. Besides irrigation he also includes water for urban uses like households and industries. The true value of water in irrigation was found to vary significantly between areas in the basin, with the marginal value of water ranging between zero and 20 Rand/m³. These differences indicate that there are significant gains from allocative mechanisms possible in these areas.
Mahan et al. (2002) determined efficient allocation of surface water resources in Southern Alberta, Canada by employing a standard welfare maximizing objective function. They find that intra-regional transfer from low value uses to high value uses yield substantial benefit increases of around 6% compared to the status quo situation. They conclude that efficiency improvements through market pricing are likely to be relatively large.
Rodgers and Zaafrano (2002, 2003) developed an integrated economic-hydrologic water resources simulation-optimisation model for the Brantas Basin in East Java, Indonesia. They estimate municipal water demands using data from a household survey. However, for the estimation of industrial water demands they use average water values and literature-based water demand elasticities and the agricultural water demand function is based on different studies of rice yields and FAO yield coefficients.
5 McKinney et al. (1999) provide a good overview of market valuations of water uses applied in different studies.
6
The model is able to simulate new infrastructure allowing the analysis of benefits associated with the construction of two new dams. Hence the model does not only emphasise water demands management but also considers supply management side.
Draper et al. (2003) developed an economic-engineering optimisation model for California. They maximise the economic value of agricultural and urban water uses representing water demands for the year 2020 levels of development. They use state survey data. Limitations of the model include the consideration of only two economic sectors and environmental regulation could not be modelled accurately.
Jenkins et al. (2004) developed a large-scale economic-engineering optimization model of California’s water supply system. Results suggest significant improvements to system operation and water allocations through water transfers and exchanges, conjunctive use, and various operational changes to increase flexibility as well as expanding selected conveyance and storage facilities. The authors show that there is great potential to improve the flexibility and economic performance of the water system and that both water scarcity and scarcity costs can be considerably reduced. However limitations of the model include simplifications of conditions and processes, quality of existing data sets, restrictions imposed by the model, and time constraints.
A holistic model embedding water resources and economic components into a mathematical programming model for the Maipo River Basin in Chile was developed by Cai et al. (2001); Cai et al. (2006) and Cai (2008), building on the work by Rosegrant et al. (2000). The model optimises water allocation by maximising economic profits from water uses in various sectors and confirmed previous results where welfare gains could be reached through reallocations to high value uses. In West Africa, Ahrends et al. (2008) looked at coupling hydrological-economic modelling for optimizing irrigation in West Africa while Bharati et al. (2008) a dynamic coupling of economic and hydrological modelling to explore conjunctive irrigation water use in the Volta basin.
All the above studies conclude that potential gains in the net use value of water could be obtained through the hypothetical introduction of water markets which lead to improved water use efficiency.
This study aims to contribute to present literature by using an economic model, based on supply figures provided by the hydrological model and primary data on water demands. Unlike most other studies, which rely on “literature-based” demand coefficients and other parameters, the study depends entirely on own-collected data and the demand coefficients and elasticities are own-estimated, adding plausibility to model results.
7
4. Conceptual Framework
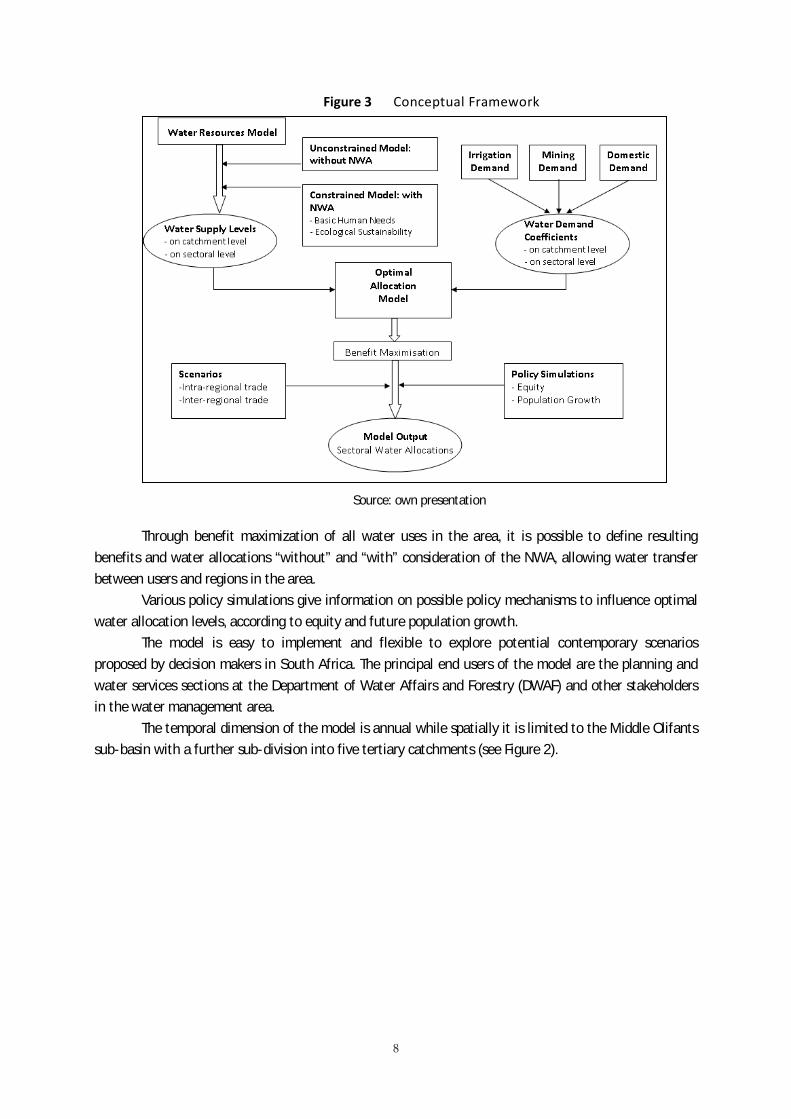
The Optimal Allocation Model (OAM) presents the main constituents for the determination of optimal allocation levels modeling different scenarios and simulations. Figure 3 shows the conceptual framework of the whole modeling process. Water supply levels as output of the Water Resources Model
(WRM) 6 and water demand coefficients7 for irrigation, mining and domestic sector provide OAM with
necessary parameters. The WRM is a hydrological model based on the simplification and further refinements of the Water Situation Assessment Model (WSAM) (DWAF, 2007) to calculate the water resources available for the five tertiary catchments in different sectors. Respective water supply levels can be modeled in two different ways. The first model is unconstrained, neglecting basic human and
ecological needs and thus also neglecting the terms under the NWA (see section 2.1)8
The second model
. Results identify
benefit gains resulting from water re-allocation with Scenario 1 and Scenario 2 (see section 5.2 below) allowing water re-allocation within and between tertiary catchments respectively.
9
Demand coefficients for irrigation, mining and domestic sectors were estimated separately, employing various methods of valuation. Water for irrigation is valued by simulating a water demand function via mathematical programming models. Water price and quantity schedules are simulated with an optimization model in GAMS, maximizing farm profits with varying water prices. Demand functions are obtained by fitting regression equations and point water price elasticities are calculated. Water demand in the mining sector is estimated with econometric methods using time series data. A Seemingly Unrelated Regression (SUR) procedure is applied to estimate cost functions for the five mines analyzed and water price elasticities and water demand functions are calculated. Using the estimated cost functions, water demands can be derived by varying the water price holding all other inputs and output constant. The valuation of domestic water uses allows for a direct estimation of demand function using an econometric model (see section 5).
analyses water allocation levels under Scenario 1 and 2 if available water is
reduced to NWA levels. Sustainable water supply levels are results of the WRM, modelled in such a way that it gives priority to environmental flows and basic human needs.
6 The WRM was provided by DWAF and updated by the project partners at the University of Witten/Herdecke, GmbH, Germany. Further details are available on request from Markus Bombeck (in http://www.uni-wh-utm.de/). 7 The demand coefficients are the estimated parameters of the water demand equations in each water using sector per tertiary catchment. 8 In the following, this will always be referred to as policy condition “without consideration of the NWA”. 9 In the following, this will always be referred to as policy condition “with consideration of the NWA”.
8
Figure 3 Conceptual Framework
Source: own presentation
Through benefit maximization of all water uses in the area, it is possible to define resulting benefits and water allocations “without” and “with” consideration of the NWA, allowing water transfer between users and regions in the area.
Various policy simulations give information on possible policy mechanisms to influence optimal water allocation levels, according to equity and future population growth.
The model is easy to implement and flexible to explore potential contemporary scenarios proposed by decision makers in South Africa. The principal end users of the model are the planning and water services sections at the Department of Water Affairs and Forestry (DWAF) and other stakeholders in the water management area.
The temporal dimension of the model is annual while spatially it is limited to the Middle Olifants sub-basin with a further sub-division into five tertiary catchments (see Figure 2).
9
5. Optimal Allocation Model (OAM)
Typically prices reflect market scarcity as well as the equilibrium between demand and transportation and supply costs (Spulber and Sabbaghi, 1998). If this is not the case, there is market imperfection and that impedes the market from adjusting to changes in quantities demanded or to changes in costs of supply. Hence, political and institutional mechanisms must be established to ensure an efficient water use. Although the NWA provides the constitutional framework for water markets and technical water research has received priority in the past, little is known about the economics of water use and impacts of alternative water policies (W. L. Nieuwoudt n.a.).
The following section analyzes gains from water re-allocation among households, irrigation and the mining sector in the Middle Olifants, using a non-linear optimization model maximizing total benefits of water use. At first, benefits from water-reallocation under current water uses are analyzed while in a second step water availability is reduced as per the NWA and new allocation levels are estimated.
5.1 Water Demand Functions
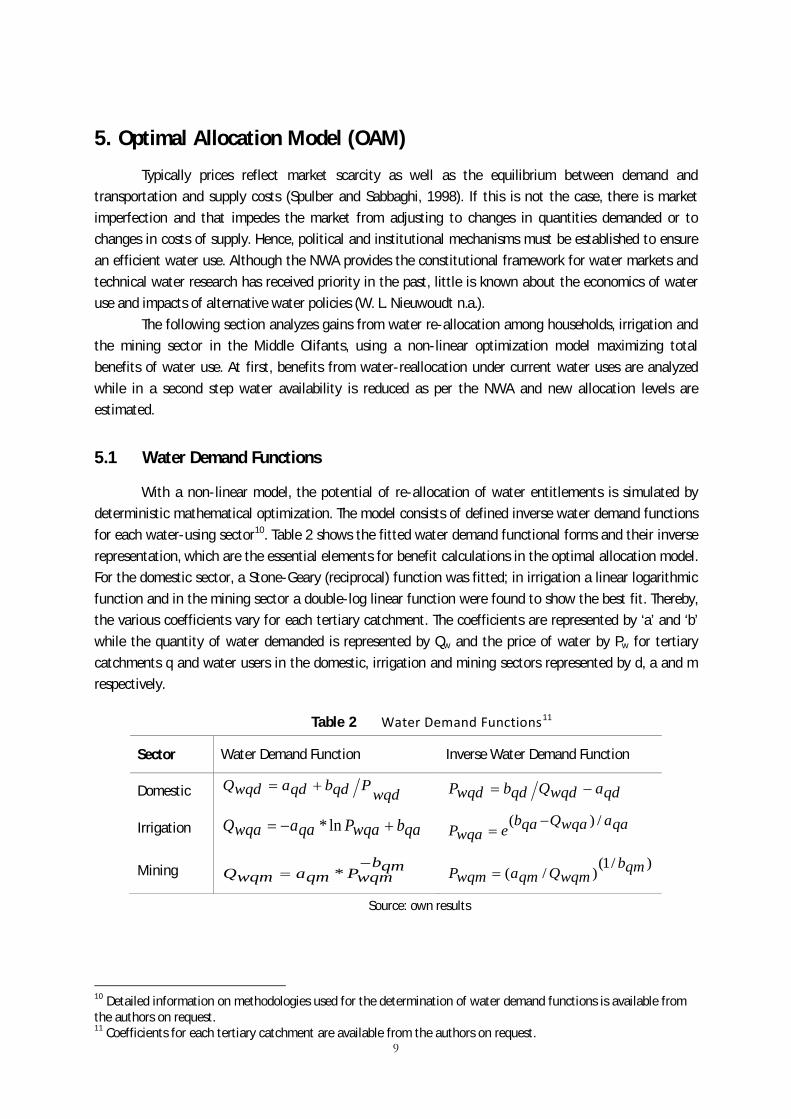
With a non-linear model, the potential of re-allocation of water entitlements is simulated by deterministic mathematical optimization. The model consists of defined inverse water demand functions for each water-using sector10
Table 2 Water Demand Functions
. Table 2 shows the fitted water demand functional forms and their inverse representation, which are the essential elements for benefit calculations in the optimal allocation model. For the domestic sector, a Stone-Geary (reciprocal) function was fitted; in irrigation a linear logarithmic function and in the mining sector a double-log linear function were found to show the best fit. Thereby, the various coefficients vary for each tertiary catchment. The coefficients are represented by ‘a’ and ‘b’ while the quantity of water demanded is represented by Qw and the price of water by Pw for tertiary catchments q and water users in the domestic, irrigation and mining sectors represented by d, a and m respectively.
11
Sector
Water Demand Function Inverse Water Demand Function
Domestic wqdPqdbqdawqdQ +=
qdawqdQqdbwqdP −=
Irrigation qabwqaPqaawqaQ +−= ln* qaawqaQqabewqaP
/)( −=
Mining qmbwqmPqmawqmQ−
= * )/1(
)/( qmbwqmQqmawqmP =
Source: own results
10 Detailed information on methodologies used for the determination of water demand functions is available from the authors on request. 11 Coefficients for each tertiary catchment are available from the authors on request.
10
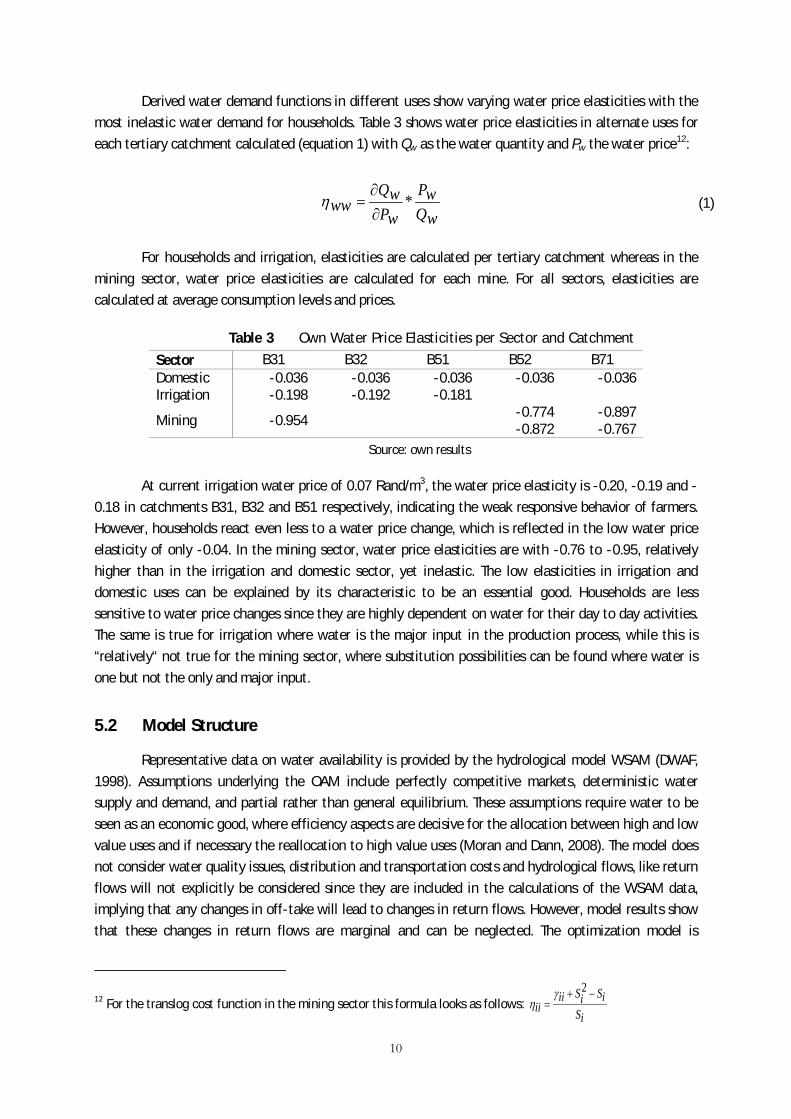
Derived water demand functions in different uses show varying water price elasticities with the most inelastic water demand for households. Table 3 shows water price elasticities in alternate uses for each tertiary catchment calculated (equation 1) with Qw as the water quantity and Pw the water price12
:
wQwP
wPwQ
ww *∂∂
=η (1)
For households and irrigation, elasticities are calculated per tertiary catchment whereas in the
mining sector, water price elasticities are calculated for each mine. For all sectors, elasticities are calculated at average consumption levels and prices.
Table 3 Own Water Price Elasticities per Sector and Catchment
Sector B31 B32 B51 B52 B71 Domestic -0.036 -0.036 -0.036 -0.036 -0.036 Irrigation -0.198 -0.192 -0.181
Mining -0.954 -0.774 -0.897 -0.872 -0.767
Source: own results
At current irrigation water price of 0.07 Rand/m3, the water price elasticity is -0.20, -0.19 and -0.18 in catchments B31, B32 and B51 respectively, indicating the weak responsive behavior of farmers. However, households react even less to a water price change, which is reflected in the low water price elasticity of only -0.04. In the mining sector, water price elasticities are with -0.76 to -0.95, relatively higher than in the irrigation and domestic sector, yet inelastic. The low elasticities in irrigation and domestic uses can be explained by its characteristic to be an essential good. Households are less sensitive to water price changes since they are highly dependent on water for their day to day activities. The same is true for irrigation where water is the major input in the production process, while this is “relatively“ not true for the mining sector, where substitution possibilities can be found where water is one but not the only and major input.
5.2 Model Structure
Representative data on water availability is provided by the hydrological model WSAM (DWAF, 1998). Assumptions underlying the OAM include perfectly competitive markets, deterministic water supply and demand, and partial rather than general equilibrium. These assumptions require water to be seen as an economic good, where efficiency aspects are decisive for the allocation between high and low value uses and if necessary the reallocation to high value uses (Moran and Dann, 2008). The model does not consider water quality issues, distribution and transportation costs and hydrological flows, like return flows will not explicitly be considered since they are included in the calculations of the WSAM data, implying that any changes in off-take will lead to changes in return flows. However, model results show that these changes in return flows are marginal and can be neglected. The optimization model is
12 For the translog cost function in the mining sector this formula looks as follows: iS
iSiSiiii
−+=
2γη
11
programmed in GAMS, where the different sets and subsets for catchments q and water uses u including
households, irrigation and mining are formulated. Further sets contain the parameters of the inverse water demand functions represented as coefficients a and b. The objective function maximizes total
benefits TB as the sum of the areas under the inverse demand curves (Mahan et al., 2002, Nieuwoudt et
al., 2003). Considering households, irrigation and mining the model can be formulated as:
∑∑
+∫=
q uquQquCPwdQwQ
UL
LLquFTB min)(max (2)
where Fqu (Qw) are the inverse functions for water consumption Qw. Benefits from each water
usage u in each catchment q can be calculated as the area under the inverse demand functions (see Table 2) from the upper limit Qw to the minimum quantity demanded Qmin at the choke price CP13
. Using equations from Table 2 the choke price at Qmin is calculated and entered in the benefit functions. If the integral of the functional form does not converge, it is necessary to add the rectangle from the choke price and the corresponding minimum amount demanded to the benefit function. Equations 3, 4 and 5 respectively show the benefit functions for the domestic, irrigation and mining sector with ‘a’ and ‘b’ as the coefficients for the functional forms shown in Table 2.
[ ] [ ] TCaQbaQbB qdqdqdqdwqdqdqd −−−−= )log(*)log(*max min (3)
qaQqaCPqaaqaQqabeqaaqaawqaQqab
eqaaqaB min*/)min(
*/)(
*max +
−−−
−−= (4)
qmQqmCPqmbqmbqmQqmb
wqmQqmbqmaqmB min*]/11/[
/11min
/11/1max +−
−−
−= (5)
Since water is not available without limit, total water availability per catchment Sq represents
the major restriction in the model.
∑≤∑∑q
qSq u
wquQ
u = domestic, irrigation and mining sectors
q = tertiary catchments: B31, B32, B51, B52, B71
TC= Treatment costs for domestic water uses
(6)
Distribution losses, which are assumed not to enter into return flows but to be simply sinks,
account for 25% (Polokwane, 2006) in the domestic and agricultural sectors (Tren & Schur, 2000), while they add up to 10% in the mining sector (DWAF, 1998). Results referring to allocation mechanisms are presented in section 6.2 while section 6.3 presents policy simulations.
13 The choke price defines the backstop price, at which quantity demanded becomes exactly zero or approximately zero.
12
6. Model Results
In this section, effects of alternative allocation mechanisms based on two different water availability levels and sensitivity analyses are presented. The allocation mechanisms to be analyzed include intra- and inter-regional trade which will be compared to the status quo situation where current water use will be considered and the NWA is not fulfilled.
Scenario 1: Intra-regional water allocation: Water can only be re-allocated within a tertiary
catchment but not between tertiary catchments.
Scenario 2: Inter-regional water allocation: Water can be re-allocated in the whole Middle
Olifants, that is, between tertiary catchments. Besides water quantities, changes in total benefits due to the allocative mechanisms will be
analyzed. In a second step, simulation scenarios reflecting current policies and future developments are developed.
Simulation 1: Policy-makers may introduce an upper limit to domestic water tariffs to ensure
basic water quantities for particularly low- income and poor households. This is in-line with the equity objective of the NWA. However it should be noted that basic water needs according to the NWA are already assured.
Simulation 2: Policy-makers may set a minimum price for large scale irrigation farmers to
promote a more efficient water use in irrigation and to cross-subsidize the domestic sector.
Simulation 3: Population growth and increased urbanization in the year 2050: This simulation
consists of a prediction of population growth and urbanization rates based on data from Statistical Services, South Africa.
All simulations are modeled at inter- and intra-regional trade water allocation regimes.
6.1 Current Water Use (2007)
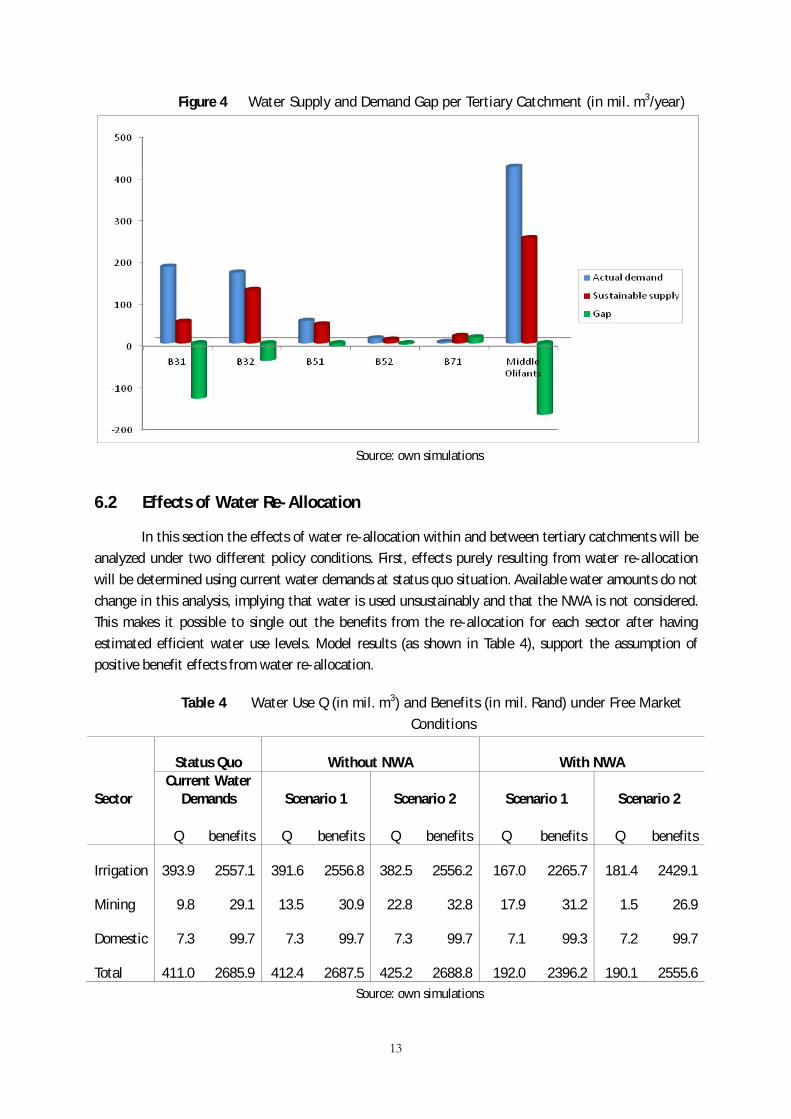
To be able to analyze the impact of re-allocation and the changes in allocation based on the fulfillment of the requirements of the NWA, the existing water use of the year 2007 is modeled. Currently, most of the available water (93%) is used by commercial farmers for crop irrigation. Only 4.7% of the water is consumed by urban and rural households and 2.3% by mines. The fact that current water use is highly unsustainable can be seen by comparing current demand to sustainable water supply in accordance to NWA (1998) at the catchment level. A negative balance of 171 million m3/year is witnessed the Middle Olifants sub-basin (see Figure 4), implying that groundwater is mined and water is used unsustainably. All catchments, but catchment B71, exhibit a negative balance. The situation is most severe upstream in catchment B31 in which the gap is almost three times as high as sustainable supply. The strong negative balance forms the need for a better – more sustainable- water management according to the NWA.
13
Figure 4 Water Supply and Demand Gap per Tertiary Catchment (in mil. m3/year)
Source: own simulations
6.2 Effects of Water Re-Allocation
In this section the effects of water re-allocation within and between tertiary catchments will be analyzed under two different policy conditions. First, effects purely resulting from water re-allocation will be determined using current water demands at status quo situation. Available water amounts do not change in this analysis, implying that water is used unsustainably and that the NWA is not considered. This makes it possible to single out the benefits from the re-allocation for each sector after having estimated efficient water use levels. Model results (as shown in Table 4), support the assumption of positive benefit effects from water re-allocation.
Table 4 Water Use Q (in mil. m3) and Benefits (in mil. Rand) under Free Market Conditions
Sector
Status Quo Without NWA With NWA Current Water
Demands Scenario 1 Scenario 2 Scenario 1 Scenario 2
Q benefits Q benefits Q benefits Q benefits Q benefits
Irrigation 393.9 2557.1 391.6 2556.8 382.5 2556.2 167.0 2265.7 181.4 2429.1
Mining 9.8 29.1 13.5 30.9 22.8 32.8 17.9 31.2 1.5 26.9
Domestic 7.3 99.7 7.3 99.7 7.3 99.7 7.1 99.3 7.2 99.7
Total 411.0 2685.9 412.4 2687.5 425.2 2688.8 192.0 2396.2 190.1 2555.6 Source: own simulations
14
The status quo situation shows current water demand levels for each sector at the historical level from 2007, reflecting an average year. Corresponding benefits are highest in irrigation representing 95% of total benefits. Total water use in the Middle Olifants amounts up to around 424 Million m3 per year. Permitting water transfer within tertiary catchments as in Scenario 1, while water availabilities stay on status quo levels is leading to small water re-allocations from irrigation to mining, confirming the assumption of water flows from low to high value uses under the condition allowing water transfers (re-allocation). Water allocations in the mining sector increase by 37% while they decrease by only 1% in irrigation, representing a decrease of 2.3 Million m3 per year. Total benefits increase by 1.6 and 2.9 Million Rand per year in Scenarios 1 and 2 respectively with the implication that benefits are higher when water transfer is allowed in the whole Middle Olifants and not only within tertiary catchments. In Scenario 2 water allocations to irrigation further decrease to some extent, while they increase by around 69% in the mining sector compared to Scenario 1. In the domestic sector, water allocation levels stay the same as in the status quo situation, reflecting very low elasticities of households.
Since current water levels are unsustainable and do not comply with South African policies and the NWA, we determine new water allocation levels under decreased water availabilities in a second analysis. This allows the consideration of basic human and environmental needs. In Scenario 1, we witness an increase of 82% in the mining sector compared to the status quo situation while water allocation in irrigation is reduced by 58%. It can be shown that water re-allocation presents an appropriate means to tackle the problem of water scarcity since, although water availabilities are reduced by almost 50%, total benefits under Scenario 1 only decrease by around 11% compared to the status quo, while it is even less in Scenario 2. Water allocations in Scenario 2 are reduced by 54%, 85% and 1.5% respectively in irrigation, mining and domestic compared to the status quo situation. Low water allocations to mining can be explained with differences in available water supplies in tertiary catchments (see Figure 4) where especially in catchments B52 and B71, gaps between current demand and sustainable supply are only slightly negative (B52) or even positive (B71). This leads to lower water values resulting in a re-allocation to catchments with highly negative gaps and higher water values. In tertiary catchment B31, the water value is very high and water is re-allocated from B71 and B52 to B31. This is different to the first situation where the NWA is not considered and water supply levels are much higher. Resulting water values are much lower as more water is available than with NWA. Differences in total water use levels result from different distribution losses that are accounted for in the model.
Generally, results show that water markets represent political measures to increase water use efficiencies and to re-allocate water to its high value uses. Benefits increase highest in Scenario 2 in both situations (‘without’ and ‘with’ NWA). However, it must be noted that high transportation costs might accrue, which are not accounted for in the model and which would need further research. Including them might lead to different results as inter-regional re-allocation might be very expensive. On the other hand, benefits from trade might also be higher if more trading partners were present in the area.
6.3 Policy Simulations
Given the fact that water is not a purely economic good and that equity aspects play a major role in the new South African policy, we run relevant policy simulations and analyze resulting impacts on the allocation levels under Scenarios 1 and 2. Further simulations investigate the effects of a population
15
increase in the year 2050 and consequently the effects of increased water demands of the urban domestic sector14
Policy Simulations 1 and 2: Equity Issues
.
Until now modeling results only take into account efficiency aspects. However in many cases efficiency considerations fail to consider the backward and forward linkages among sectors and other non-market uses of water, leading to the incorporation of equity and sustainability issues. This raises the question of the allocation of water resources in such a way that the standard of living of most people is improved (Juana et al., 2006). Furthermore considering equity issues, accounts for the current South African policy. According to the black empowerment policy, the South African government attempts to address the past racial inequities by assuring water availability and affordability for all households. Hence, no more water (or even less) should be given to large-scale commercial farmers and more shall be allocated to the poor population. This simulation tries to address the issue by analyzing different policy interventions on the water pricing system.
In a first simulation, the end user price in the domestic sector will be restricted to a maximum level of 4 Rand/m3. Compared to the current water price of 5.69 Rand/m3 and compared to water prices of up to 8 Rand/m3 in Scenario 1 and Scenario 2, households would have to pay much less for their water15
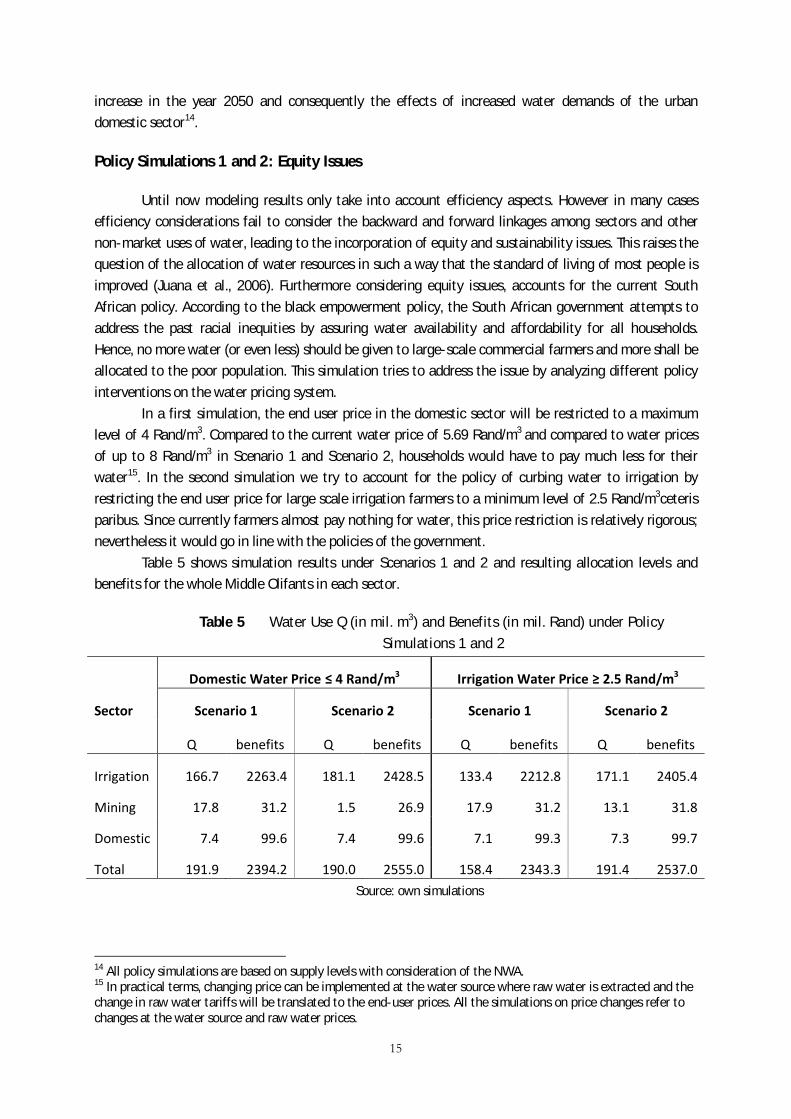
Table 5 shows simulation results under Scenarios 1 and 2 and resulting allocation levels and benefits for the whole Middle Olifants in each sector.
. In the second simulation we try to account for the policy of curbing water to irrigation by restricting the end user price for large scale irrigation farmers to a minimum level of 2.5 Rand/m3ceteris paribus. Since currently farmers almost pay nothing for water, this price restriction is relatively rigorous; nevertheless it would go in line with the policies of the government.
Table 5 Water Use Q (in mil. m3) and Benefits (in mil. Rand) under Policy Simulations 1 and 2
Sector
Domestic Water Price ≤ 4 Rand/m3 Irrigation Water Price ≥ 2.5 Rand/m3
Scenario 1 Scenario 2 Scenario 1 Scenario 2
Q benefits Q benefits Q benefits Q benefits
Irrigation 166.7 2263.4 181.1 2428.5 133.4 2212.8 171.1 2405.4
Mining 17.8 31.2 1.5 26.9 17.9 31.2 13.1 31.8
Domestic 7.4 99.6 7.4 99.6 7.1 99.3 7.3 99.7
Total 191.9 2394.2 190.0 2555.0 158.4 2343.3 191.4 2537.0 Source: own simulations
14 All policy simulations are based on supply levels with consideration of the NWA. 15 In practical terms, changing price can be implemented at the water source where raw water is extracted and the change in raw water tariffs will be translated to the end-user prices. All the simulations on price changes refer to changes at the water source and raw water prices.
16
Compared to results in Table 4 (the “with” NWA Scenario 1 and 2 results), water quantities do not change remarkably as a result of the domestic water price restriction. Under Scenario 1, domestic water allocation increases from 7.1 (see Table 4) to 7.4 million m3 corresponding to a 4% increase, while it increases by only 3% in Scenario 2. Although quantities of water used are higher than without price restriction net benefits decrease, as a water price restriction does not lead to efficient water use. Total benefits are, with 2394 and 2555 Million Rand only, slightly lower than benefits without price restrictions reflecting the low impact of water price restrictions in the domestic sector.
Looking at the restriction in irrigation, we realize that higher water prices for farmers have a high impact on the allocation levels and benefits. Due to the higher water price, farmers are demanding around 33 Million m3 (-20%) less water compared to the unrestricted model under Scenario 1, while water use decreases by only 6% under Scenario 2. In Scenario 1, total water use is, with 158.4 Million m3, lower than sustainable availability. Due to the high water price in irrigation, less is demanded and more is available for households. However, in tertiary catchments B32 and B51 water is not reallocated from irrigation to households instead16
Results show that policy instruments (altering prices) can be one of the means to influence allocation levels under market conditions. By restricting domestic water prices to a maximum of four Rands per cubic meter, for example, water is re-allocated from irrigation to households, as more domestic households are encouraged to buy more water. However, compared to the high domestic water price reduction of around 50%, increase in demand by the domestic households are, with 4 % and 3%, relatively low reflecting the low water price elasticity of households (see Table 3). This shows that interfering in the water price policy can be one instrument for the government to support households and reallocate water from irrigation. Nevertheless, to realize higher reallocation amounts to households, further measurements should be applied. Looking at the pricing instrument for farms, it could be shown that higher water prices in irrigation lead to highly decreased demands in the sector, but do not support reallocations to households but rather to the mining sector. Hence, it does not represent an appropriate instrument if households are the ones to be favored.
, since it would not be efficient and water is therefore left unused. In Scenario 2 all water available is used, and is reallocated to the mining sector in catchments B52 and B71. The resulting high increase of water use in the mining sector and the corresponding low increase in net benefits, reflects the inefficient water re-allocation due to price restrictions in irrigation. Even in the domestic sector water allocation increased slightly to 7.4 million m3. Total benefits in the Middle Olifants decrease by around 2% and 1% in Scenarios 1 and 2 respectively compared to the analysis considering the NWA without price restrictions.
Policy Simulation 3: Population Increase
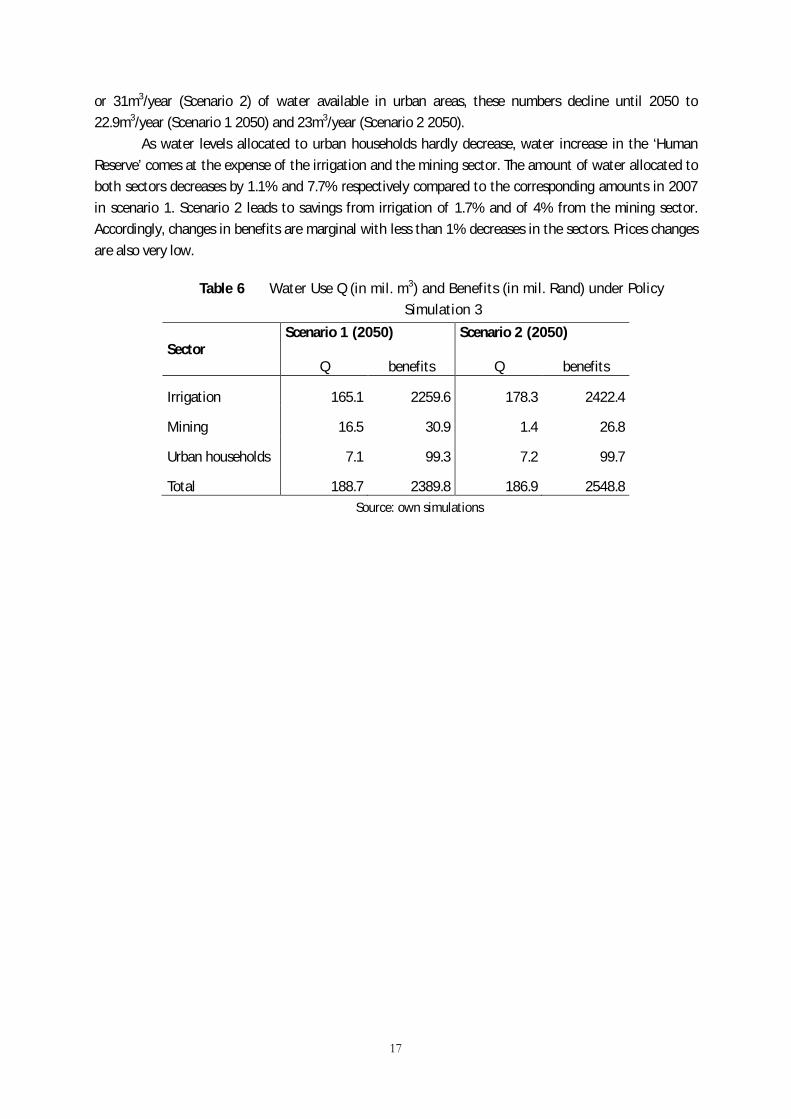
This scenario is based on population growth rates and urbanization until the year 2050. According to the higher population figures, the amount of water assigned to the ‘Human Reserve’ increases. As it is prioritized by the NWA, this decreases the amount of water to be freely allocated among the sectors. Table 6 presents the new allocation figures per sector. All sectors get less water in 2050 than in 2007. The amount of water allocated to urban households is least reduced with only 0.03% and 0.05% reduction in Scenario 1 and 2 (2050) respectively compared to the allocation in 2007 (see Table 4). However, as the number of urban households increases due to population growth and urbanization, less water per person is available. While in 2007 every person has 30.8m3/year (Scenario 1)
16 In catchments B32 and B51 there are no mining activities.
17
or 31m3/year (Scenario 2) of water available in urban areas, these numbers decline until 2050 to 22.9m3/year (Scenario 1 2050) and 23m3/year (Scenario 2 2050).
As water levels allocated to urban households hardly decrease, water increase in the ‘Human Reserve’ comes at the expense of the irrigation and the mining sector. The amount of water allocated to both sectors decreases by 1.1% and 7.7% respectively compared to the corresponding amounts in 2007 in scenario 1. Scenario 2 leads to savings from irrigation of 1.7% and of 4% from the mining sector. Accordingly, changes in benefits are marginal with less than 1% decreases in the sectors. Prices changes are also very low.
Table 6 Water Use Q (in mil. m3) and Benefits (in mil. Rand) under Policy Simulation 3
Sector Scenario 1 (2050)
Scenario 2 (2050)
Q benefits Q benefits
Irrigation 165.1 2259.6 178.3 2422.4
Mining 16.5 30.9 1.4 26.8
Urban households 7.1 99.3 7.2 99.7
Total 188.7 2389.8 186.9 2548.8 Source: own simulations
18
7. Conclusions and Policy Implications
If not properly allocated, the sustainably available water resources are insufficient to meet the economic and socio-political objectives of the country. The development of new water sources in the Middle Olifants is not possible. Thus, using water efficiently and allocating it in such a way that it meets the economic and sociopolitical objectives of the country is crucial for the future sustainable water availability. Due to this reason, the paper emphasizes on how to optimally allocate the limited available water to meet the socio-economic objectives.
The “without NWA” results of the study suggest that in order to maximize the benefits from water use and thus meet the socio-economic objectives, water should be transferred from irrigation to mining, while domestic water use should relatively stay unchanged (with negligible transfer to mining). This is a reflection of the growing importance of the mining sector and its highest economic return from water. The “with NWA” result suggests an overall reduction of water for all with a higher amount (in Volume) for irrigation and again domestic water use will remain relatively stable. From DWAF’s point of view, in order to redress the historically disadvantaged individuals, water should be taken away from irrigation farmers (mostly rich and white) to the domestic needy (mostly black and poor in the rural areas). Thus the model results show that the government policy of capping water for irrigation does not only meet the socio-political objective but has economic rationale especially when transferred to mining. We agree with the planned cut of water for irrigation but we challenge the government’s plan to direct the water transfer to domestic water users as this may meet the equity objective but not economic objectives. We also confirm that with growing water scarcity, water use becomes more efficient as evidenced by the lower (5-11%) reduction in the total benefits from water compared to the higher (about 50%) water reduction to meet the NWA requirements. Both intra-and inter-regional allocation results provide evidence for benefits of water re-allocations. Assuming that intra-regional allocation involves less transaction cost than the inter-regional allocation and owing to lower distances and resulting lower transportation costs in the short run, the intra-regional allocation is more beneficial. However, the intra-regional allocation involves some water loss in B71 as the sustainable supply is more than what is actually used. Therefore, intra-regional allocation will be more effective in future when the government will make use of this water once the planned several mining companies in B71 are in place (Conradie, 2007).
All scenario results, without exception, confirm the fact that water transfer from irrigation to other sectors is inevitable and this goes in the same vein with the government’s planned cut of water for irrigation.
19
References
Ahrends, H., Mast, M., Rodgers, Ch., and Kunstman, H. (2008). Coupled hydrological-economic modelling for optimized irrigated cultivation in a semi-arid catchment of West Africa. Environmental Modelling and Software, 23, 385-395.
Bharati, L., Rodgers, C., Erdenberger, T., Plotnikova, M., and Shumilov, S. (2008). Integration of economic and hydrological models: Exploring conjunctive irrigation water use trategies in the Volta basin. Agricultural Water Management, 95, 925-936.
Booker, J. F. and Young, R. A. (1994). Modeling Intrastate and Interstate Markets for Colorado River Water Resources, Journal of Environmental Economics and Management, 26, 66-87.
Cai, X., McKinney, D.C., and Lasdon, L.S. (2001). Piece-by-piece approach to solving large non-linear water resources management models. Journal of Water Resources Planning and Management, 127(6), 363-368.
Cai, X. and Wang, D. (2006). Calibrating holistic water resources-economic models. Journal of Water Resources Planning and Management, 132(6), 414-423.
Cai, X. (2008). Implementation of Holistic Water Resources-Economic Optimization Models for River Basin Management - Reflective Experiences, Environmental Modleing & Software, 23, 2-18.
Conradie, B. (2002). The Value of Water in the Fish Sundays Scheme of the Eastern Cape. Water Research Commission (WRC), Pretoria.
Conradie, A. (2007). Personal Interview. Platinum-Group Metal Mine in South Africa. Pretoria. The Department of Minerals and Energy, Directorate: Mineral Economics.
Dinar, A. (2003). The Potential Economy Context of Water-Pricing Reforms. In: P. Koundouri, P. Pashardes, T.M. Swanson, & A. Xepapadeas, The Economics of Water Management in Developing Countries (pp. 15-40). Edwards Elgar Publishing, Inc., UK.
Draper, A. J., Jenkins, M. W., Kirby, K. W., Lund, J. R., and Howitt, R. E. (2003). Economic-Engineering Optimization for California Water Management, Journal of Water Resources Planning and Management (May/June), 155-164.
DWAF (1998). Water Situation Assessment Model (WSAM). Department of Water Affairs and Forestry (DWAF), Pretoria.
DWAF (2003). National Water Resource Strategy: Summary. Department of Water Affairs and Forestry (DWAF), Pretoria.
DWAF. (2004). Olifants Water Management Area Internal Strategic Perspective. DWAF. Pretoria: DWAF.
DWAF (2007). Water Situation Assessment Model, Department of Water Affairs and Forestry Chief Directorate Planning, Directorate Strategic Planning. A Decision Support System for Reconnaissance Level Planning, Volume 1.
Hassan, R. and Crafford, J. (2006). Environmental and Economic Accounts for Water in South Africa. In: G.-M. Lange und R. Hassan, The Economics of Water Management in Southern Africa: an Environmental Accounting Approach (pp. 114-168). Edward Elgar Publishing Limited, Great Britain.
20
Hassan, R. and Farolfi, S. (2005). Water Value, Resource Rent Re-Covery and Economic Welfare Cost of Environmental Protection. A Water Sector Model for the Steelport Sub-Basin in South Africa, Water SA, 31(1), 9-16.
Howe, C., Schurmeier, D., and Shaw, D. (1986, April). Innovative Approaches to Water Allocation: The Potential for Water Markets. Water Resources Research, 22(4), 439-445.
Juana, J., Kirsten, J., and Strzepek, K. (2006). Inter-sectoral water use in South Africa: efficiency versus equity. Contributed paper prepared for presentation at the 26th International Association of Agricultural Economist Conference, Gold Coast, Australia, August 12-18, 2006.
King, N. (2004). The Economic Value of Water in South Africa. In: Blignaut, J. and de Witt, M., (eds): Sustainable Options: Development Lessons from Applied Environmental Economics, pages 207-238. University of Cape Town Press, Cape Town.
Levite, H., Sally, H. and Cour, J. (2002). Water Demand Management Scenarios in a Water-Stressed Basin in South Africa. 3rd WARSFA/Waternet Symposium. Arusha: International Water Management Institute (IWMI).
Louw (2002). The Development of a Methodology to Determine the True Value of Water and the Impact of a Potential Water Market on the Efficient Uitlisation of Water in the Berg River Basin. Water Research commission (WRC), Pretoria.
Mahan, R. C., Horbulyk, Th. M. and Rowse, J. G. (2002). Market Mechanisms and the Efficient Allocation of Surface Water Resources in Southern Alberta, Socio-Economic Planning Sciences, 25-49.
Jenkins, M., W., Lund, J. R., Howitt, R. E., Draper, A., J., Msangi, S., M., Tanaka, St., K., Randall S. Ritzema, K., R., and Marques, G., F. (2004). Optimization of California’s Water Supply System: Results and Insights. ASCE J. Water Resources Planning and Management, 130(4), 271-280.
McKinney, D., Cai, X., Rosegrant, M., Ringler, C., and Scott, C. (1999). Modeling Water Resources Management at the Basin Level: Review and Future Directions. Sri Lanka: International Water Management Institute (IWMI).
Moran, D., and Dann, S. (2008). The Economic Value of Water Use: Implications for Implementing the Water Framework Directive in Scotland. Journal of Environmental Management, 87, 484-496.
Nieuwoudt, W., Backeberg, G., and du Plessis, H. (2003). The Value of Water in the South African Economy - A Review. Pretoria: Water Research Commission.
Nieuwoudt, W.L. (n.a.). Water Markets Institutions in South Africa, Lessons from Colorado. Department of Agricultural Economics, University of Natal, Pietermaritzburg, South Africa.
Polokwane (2006). Water Service Development Plan. Polokwane Municipality 2006.
Republic of South Africa (2002). National Water Resource Strategy. Summary. Proposed First Edition. South Africa
Ringler, C. (2001). Optimal Water Allocation in the Mekong River Basin. Bonn: Center for Development Research (ZEF), Dicussion Paper No. 38.
Rodgers, C. and Zaafrano, R. (2002). Water Allocation and Pricing Strategies in the Brantas River Basin, East Java, Indonesia. A paper prepared for the Conference on Irrigation Water Policies: Micro and Macro Considerations, held in Agadir, Morocco 15-17 June 2002.
Rodgers, C. and Zaafrano, R. (2003). A water resources management policy simulation model of the Brantas Basin, East Java, Indonesia. Invited paper prepared for the Panel on Water Policy and

21
Agricultural Production at the Global and River Basin Levels, IAAE Meetings, Durban, South Africa August 16-23, 2003.
Rosegrant, M. W., Ringler, C., McKinney, D. C., Cai, X., Keller, A., and Donoso, G. (2000). Integrated Economic-Hydrologic Water Modeling at the Baisn Scale: The Maipo River Basin. Washington: International Food Policy Research Institute (IFPRI).
Spulber, N., and Sabbaghi, A. (1998). Economics of Water Resources: From Regulation to Privatization. Kluwer Academic Publishers.
Tren, R. and Schur, M. (2000). Olifants River Irrigation Schemes, Reports 1&2. Sri Lanka: IWMI.