Embed Size (px)
Citation preview
American Journal of Electrical Power and Energy Systems 2021; 10(1): 6-14
http://www.sciencepublishinggroup.com/j/epes
doi: 10.11648/j.epes.20211001.12
ISSN: 2326-912X (Print); ISSN: 2326-9200 (Online)
Improving the Reconfiguration of Hybrid Power Networks by Combining Genetic Algorithm (GA) with Particle Swarm Optimization (PSO)
Ahmed Alshahir*, Richard Molyet
Electrical Engineering and Computer Science Department, University of Toledo, Ohio, USA
Email address:
*Corresponding author
To cite this article: Ahmed Alshahir, Richard Molyet. Improving the Reconfiguration of Hybrid Power Networks by Combining Genetic Algorithm (GA) with
Particle Swarm Optimization (PSO). American Journal of Electrical Power and Energy Systems. Vol. 10, No. 1, 2021, pp. 6-14.
doi: 10.11648/j.epes.20211001.12
Received: January 25, 2021; Accepted: February 2, 2021; Published: February 10, 2021
Abstract: Renewable Energy Sources (RESs) have been growing continuously until they become the second source of
electricity after coal. However, most of RESs have intermittent nature of electricity production due to the high dependency on
some external conditions like weather which changes seasonally. This intermittent nature has a negative impact on security and
stability, voltage profile, and increasing the power losses in radial distribution power networks which contain uncertain power
sources. Therefore, this paper presents a novel technique based on Genetic Algorithm (GA) combined with Particle Swarm
Optimization (PSO). The goal of utilizing the GA is to track the maximum power point of uncertain power sources such as
Solar/Photovoltaic (PV) and Wind Turbine (WT). Then, PSO starts its execution to determine the optimum configuration of
power networks in order to minimize the power losses, maintain voltage profile, and increase the overall system stability and
security. Different test cases are considered for testing different operation conditions. The simulation work has implemented by
using MATLAB 2016b software. The results are tested on standard IEEE 33 bus systems and validated with other conventional
method to verify the correctness of the proposed technique. Results show a significant improvement in voltage profile, reduction
in the power losses, and hence increment in the overall system stability and security.
Keywords: Conventional Energy Sources (CESs), Genetic Algorithm (GA), Particle Swarm Optimization (PSO),
Radial Distribution Systems (RDSs), Network Reconfiguration
1. Introduction
Nowadays, there are so many issues in the power system
networks such as increasing the electricity cost, limiting of
Conventional Energy Sources (CESs) for generating
electricity, etc. However, using CESs do not always lead to an
optimum solution in the Radial Distribution Systems (RDSs)
due to the limiting quantity, increasing the fuel cost, harming
emissions of burning the fossil fuels which made to the power
generation unviable and unsustainable. However, with
concerns about the environmental problems and progress,
Non-Conventional Energy Sources (N-CESs) such as RESs
tend to be one of the optimum solutions. They help the world
meet sustainable targets though precaution to access to safe
energy, clean, affordable as well as prevent the atmospheric
pollution by depleting the fossil fuel [1-3].
Solar/Photovoltaic (PV) and Wind Turbine (WT) are very
most promising to supply the load; however, they have
intermittent nature of electricity production due to the
dependency on weather changes [4, 5]. As knowing, WT
depends on the wind speed which changes seasonally.
Similarly, PV relies on the sun irradiance and the temperature
which are changed based on the weather conditions.
Installation these generators to the network can affect the
power flow distribution in the smart grid. So, power losses and
voltage profile of distributed power networks are very critical
and can affect the whole power system network. Therefore,
network reconfiguration has been proposed in literature to
reduce the power losses and enhance voltage profile by
applying Artificial Intelligence techniques as well as using
American Journal of Electrical Power and Energy Systems 2021; 10(1): 6-14 7
sectionalizing switch (normally closed) or tie switch
(normally opened) [6, 7]. So, penetrating RESs in power
networks should consider the issue of the uncertainty of
production of RESs due to depending on external conditions.
There are many research contributions for optimizing the
configuration of the radial power networks to reduce the
power losses and determining the optimum placement of the
compensator capacitors for the same purpose. For example,
feeder reconfiguration is presented in order to minimize the
power losses [8]. In addition, Romero et al. have mentioned a
new technique for optimizing the power network
reconfiguration in order to reduce the active power losses
without performing load flow processing [9]. Moreover,
Billinton and Jonnavithula have proposed new formulation for
calculating the optimum number of sectionalized switches and
the optimum place in network feeders for minimizing the
power losses [10].
Moreover, a proposed efficient solution has utilized which
focused on the problems that prevent evolutionary algorithms
from fulfilling all the objective [11]. The authors presented a
new codification algorithm which proved better results in
terms of optimization the topology of the radial distribution
systems to minimize losses and improve the voltage profile.
Furthermore, a new algorithm has been presented for
optimizing the reconfiguration of radial distribution systems
based on integer coded of Particle Swarm Optimization (PSO)
[12]. It considered the historical local optimum configurations
for generating new particles. It showed an improvement over
the traditional PSO method. It also tested the proposed
algorithm on three different distribution systems to validate
and verify the work.
In addition, the power flow analysis has been utilized
iteratively by testing all switches one by one using a new
heuristic model to determine the optimum configuration for
reducing the power losses [13]. The technique works by
considering all branches initially closed and finding the next
loop to be opened by one switch. Then, repeating that with
updating the opened switch of each iteration until all loops
will be opened. Moreover, Montoya and Ramirez have
developed a novel algorithm based on Genetic Algorithm (GA)
combined with Minimum Spanning Tree (MST) algorithm.
MST utilized for determining the configuration of radial
power network to minimize the power losses. Then, GA
implemented for determining the optimum position and values
of the capacitors to improve the power profile and reduce the
power losses [14].
Also, a new method has been proposed for reconfiguring
the radial power networks and optimizing the capacitor
insertion to maintain the voltage profile within acceptable
ranges and to reduce the power losses [15]. The method was
based on a simple branch exchange technique. Authors
utilized a joint optimization algorithm and used the GA for
optimizing the location and size of the capacitors and the
sequence of the loop selection process. The authors also
applied the simulated annealing algorithm to compare the
results as regard to the convergence speed. They tested their
proposed technique on 77 bus distribution system and run
many tests for different load patterns.
Furthermore, a new approach by using GA has been utilized
to solve the placement problem and network reconfiguration
problem simultaneously in order to reduce power losses and
enhance the voltage profile [16]. In addition, a new technique
is proposed based on ant colony algorithm and capacitor
placement problem [17]. Ant colony is used for solving the
optimal reconfiguration of the network. Capacitor placement
problem is also used for reducing the power losses and
enhancing the voltage profile of radial power network systems.
The authors combined the two means for reducing power
losses which are using compensator capacitors and network
reconfiguration. Their results proved that using these two
means together give better results than using them separately.
On the other hand, Artificial Intelligence and heuristic
search techniques have been utilized for improving the
optimization techniques in the most research papers which
conducted in the last few years. For example, a comparative
study has been addressed and compared three novel PSO
based techniques for optimizing the steady state performance
of power system [18]. It showed that the proposed PSO based
techniques are more efficient than the conventional PSO and
Evolutionary Algorithms-based techniques in terms of the
convergence time and accuracy. Furthermore, a new technique
for determining the optimum number and position of switches
in radial distribution networks has been developed and
presented to reduce the total cost [19]. The proposed method
includes both type of switches which are the sectionalizing
and breaker switches.
In addition, Moradi et al. have developed methods for
optimizing the placement of switches in distribution networks
based on economical and reliability calculations for
minimizing the total cost and maximizing the reliability of the
system [20]. Furthermore, an optimum relocation technique of
the sectionalized switches has presented for reducing the
interruption cost based on traditional method of solving
optimum power flow method [21]. However, Teng and Liu
solved the problem based on Ant Colony System (ACS)
technique and compared their results with the Genetic
Algorithm (GA)-based technique [22]. The authors have
proved a significant improvement. Moreover, a new method is
proposed for allocating number of switches and locations
remotely based on decomposition technique [23]. It
demonstrated significant effect to enhance the fault isolation
and reconfiguration of the system. Also, a hybrid technique
composed of PSO integrated with tangent vector technique is
presented for reducing the power losses by optimally solving
the power flow [24]. Moreover, a Binary Particle Swarm
Optimization (BPSO) method is used with standard IEEE 33
in order to obtain the optimal distribution configuration of the
network for minimizing the power losses and voltage profile
[25].
The above survey concludes that there are basically two
methods for reducing the power losses and maintaining the
voltage profile which are using compensator capacitors and
reconfiguration of power network sectionalizing switches. It
also lists many methods and algorithms for solving the
8 Ahmed Alshahir and Richard Molyet: Improving the Reconfiguration of Hybrid Power Networks by Combining
Genetic Algorithm (GA) with Particle Swarm Optimization (PSO)
optimization problem. Some of them are conventional
methods and some are based on Artificial Intelligence and
heuristic search techniques. Also, some have worked on the
two means of reducing the power losses separately and other
methods used a combination of techniques. However, all
techniques and algorithms have not considered the uncertainty
of some generation sources like RESs. The intermittent nature
of such sources causes problem of reliability and may change
the results negatively regarding power losses. Therefore, there
is still a knowledge gap and immense need for developing new
methods that consider penetrating the power networks with
sources of uncertainty in power systems.
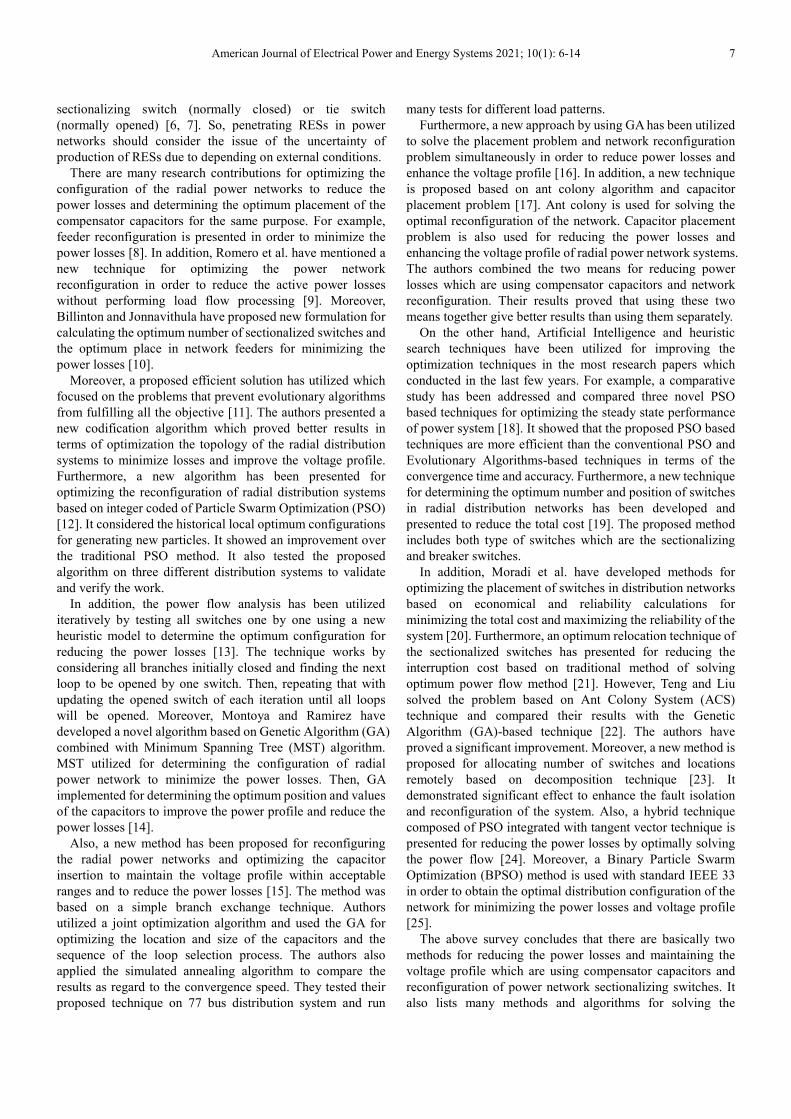
Figure 1. Single line diagram of radial power system with generators and switches.
Table 1. List of used sources.
Generator Type Capacity Location
Conventional Energy Source (CES) 2 MW Bus 1
Solar/Photovoltaic (PV) 1 MW Bus 14
Wind Turbine (WT) 1 MW Bus 22
This paper presents a novel method to determine the optimum
configuration of the network which has been extended from [25]
by considering the inclusion of RESs such as WT and PV power
sources of the radial power systems. Also, GA combined with
PSO technique are utilized to determine the maximum power
point of the RESs and to find the optimum state of sectionalizing
switches and tie switches in order to minimize the active power
losses and maintain the voltage profile at an acceptable value.
This satisfies all system constraints regarding generation and
demand for all buses in the network to guarantee the security and
reliability of the power network.
The paper is organized as follows: Section 2 presents the
methodology of the proposed technique. Section 3 shows and
discusses the simulation results. The conclusion of the work
will be shown in Section 4.
2. Material and Method
2.1. Problem Statement
As it has been introduced above in the introduction, most of
the existing solutions of optimizing the power losses by using
the reconfiguration in radial power system networks have not
considered the case of having uncertain amount of production
in generation sources like the case of RESs such as WT and
PV generators. So, the problem that is targeted in this research
can be defined as optimizing the power losses and maintaining
the voltage profile at acceptable ranges in radial power
systems which include renewable energy generators.
2.2. System Description
The single line diagram which is shown in Figure 1
represents a typical IEEE 33 bus radial power system. Also, it
shows the generators and switches which are distributed over
the bus system. The solid bold lines represent buses as well as
branches which connect buses together in case of connecting
switches to be initially closed while the dotted lines show
switches to be initially opened. In addition, the network is
supplied by the following generators which listed in Table 1.
Also, Table 2 below represents line data, load data as well
as the sectionalizing switches and tie switches of the examined
WT
PV
23 24 25
26 27 28 29 30 31 32 33
1 2 3 4 5 6 7 8 9 10 11 12 13 14 15 16 17 18
19 20 21 22
36*
1 2 3 4 5 6 7 8 9 10 11 12 13 14 15 16 17
19 20 21
26 27 28 29 30 31 32
33* 34*
25
18
37*
35*
22
23 24
CES
American Journal of Electrical Power and Energy Systems 2021; 10(1): 6-14 9
system. The column Lines in the table represents the number
of switches between buses and tie switches of the radial power
system. R is the resistance of the line. X is the reactance of the
line. Pd is the active demanded power. Qd is the reactive
demanded power. Type represents the bus type which divides
into three different numbers such as number 1 is for load bus
type, number 2 is for slack or reference bus type (if exist), and
number 3 is for generator bus type. Status is the initial status of
the 37 switches which categorized as 1 for connected status
and 0 for disconnected status. The range of voltages is
between 0.9 and 1 pu. The base voltage is considered as
12.66KV. This radial power system will be used in testing the
proposed technique.
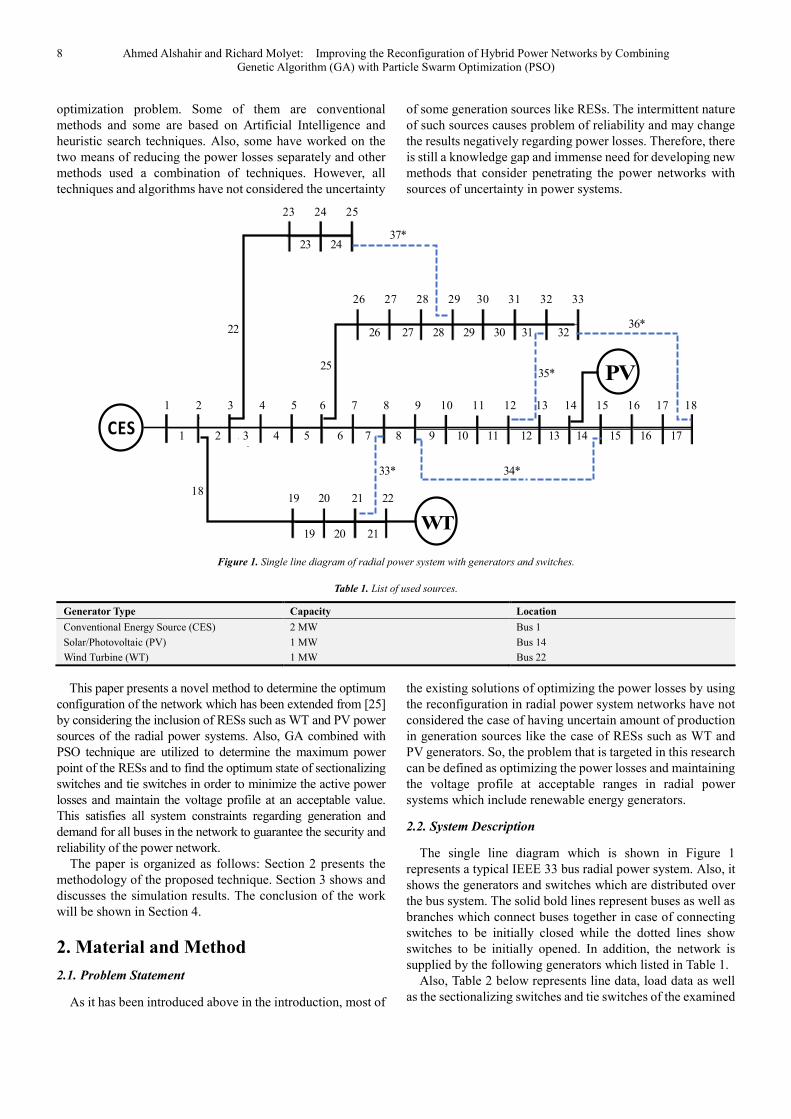
Figure 2. Proposed technique flowchart.
10 Ahmed Alshahir and Richard Molyet: Improving the Reconfiguration of Hybrid Power Networks by Combining
Genetic Algorithm (GA) with Particle Swarm Optimization (PSO)
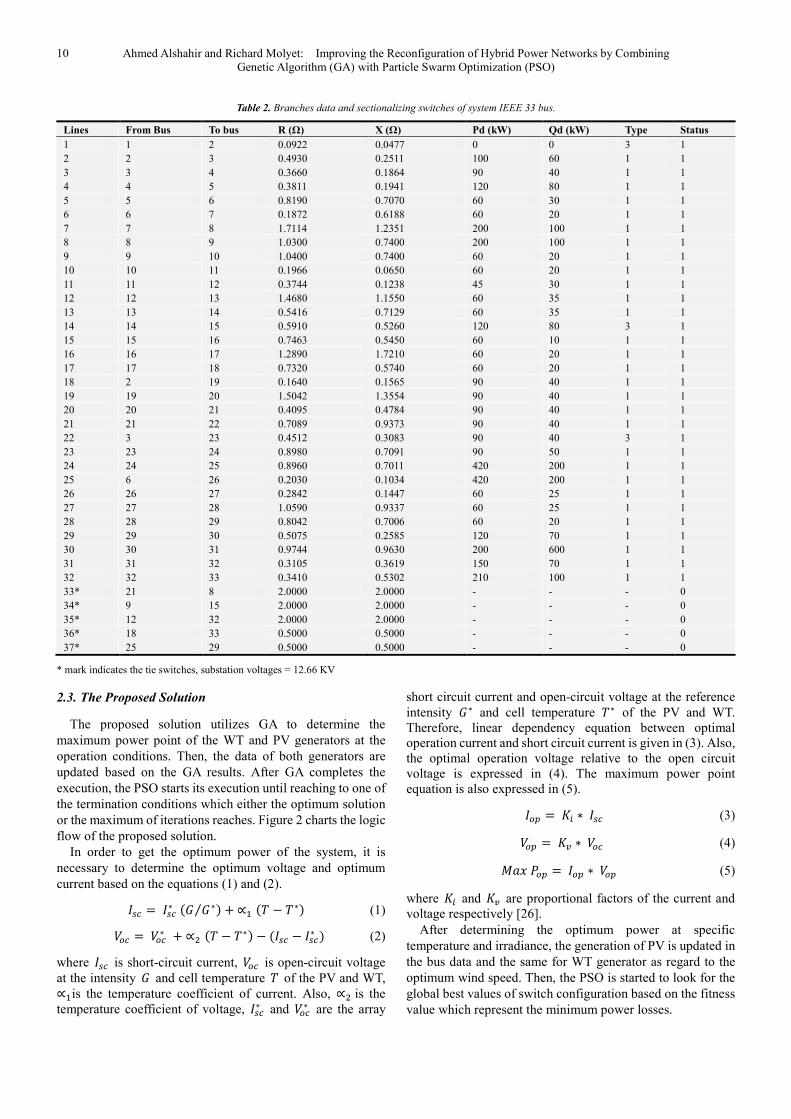
Table 2. Branches data and sectionalizing switches of system IEEE 33 bus.
Lines From Bus To bus R (Ω) X (Ω) Pd (kW) Qd (kW) Type Status
1 1 2 0.0922 0.0477 0 0 3 1
2 2 3 0.4930 0.2511 100 60 1 1
3 3 4 0.3660 0.1864 90 40 1 1
4 4 5 0.3811 0.1941 120 80 1 1
5 5 6 0.8190 0.7070 60 30 1 1
6 6 7 0.1872 0.6188 60 20 1 1
7 7 8 1.7114 1.2351 200 100 1 1
8 8 9 1.0300 0.7400 200 100 1 1
9 9 10 1.0400 0.7400 60 20 1 1
10 10 11 0.1966 0.0650 60 20 1 1
11 11 12 0.3744 0.1238 45 30 1 1
12 12 13 1.4680 1.1550 60 35 1 1
13 13 14 0.5416 0.7129 60 35 1 1
14 14 15 0.5910 0.5260 120 80 3 1
15 15 16 0.7463 0.5450 60 10 1 1
16 16 17 1.2890 1.7210 60 20 1 1
17 17 18 0.7320 0.5740 60 20 1 1
18 2 19 0.1640 0.1565 90 40 1 1
19 19 20 1.5042 1.3554 90 40 1 1
20 20 21 0.4095 0.4784 90 40 1 1
21 21 22 0.7089 0.9373 90 40 1 1
22 3 23 0.4512 0.3083 90 40 3 1
23 23 24 0.8980 0.7091 90 50 1 1
24 24 25 0.8960 0.7011 420 200 1 1
25 6 26 0.2030 0.1034 420 200 1 1
26 26 27 0.2842 0.1447 60 25 1 1
27 27 28 1.0590 0.9337 60 25 1 1
28 28 29 0.8042 0.7006 60 20 1 1
29 29 30 0.5075 0.2585 120 70 1 1
30 30 31 0.9744 0.9630 200 600 1 1
31 31 32 0.3105 0.3619 150 70 1 1
32 32 33 0.3410 0.5302 210 100 1 1
33* 21 8 2.0000 2.0000 - - - 0
34* 9 15 2.0000 2.0000 - - - 0
35* 12 32 2.0000 2.0000 - - - 0
36* 18 33 0.5000 0.5000 - - - 0
37* 25 29 0.5000 0.5000 - - - 0
* mark indicates the tie switches, substation voltages = 12.66 KV
2.3. The Proposed Solution
The proposed solution utilizes GA to determine the
maximum power point of the WT and PV generators at the
operation conditions. Then, the data of both generators are
updated based on the GA results. After GA completes the
execution, the PSO starts its execution until reaching to one of
the termination conditions which either the optimum solution
or the maximum of iterations reaches. Figure 2 charts the logic
flow of the proposed solution.
In order to get the optimum power of the system, it is
necessary to determine the optimum voltage and optimum
current based on the equations (1) and (2).
= ∗ ∗⁄ +∝ −
∗ (1)
=∗ +∝ −
∗ − − ∗ (2)
where is short-circuit current, is open-circuit voltage
at the intensity and cell temperature of the PV and WT,
∝ is the temperature coefficient of current. Also, ∝is the
temperature coefficient of voltage, ∗ and
∗ are the array
short circuit current and open-circuit voltage at the reference
intensity ∗ and cell temperature ∗ of the PV and WT.
Therefore, linear dependency equation between optimal
operation current and short circuit current is given in (3). Also,
the optimal operation voltage relative to the open circuit
voltage is expressed in (4). The maximum power point
equation is also expressed in (5).
= ∗ (3)
= ∗ (4)
= ∗ (5)
where and are proportional factors of the current and
voltage respectively [26].
After determining the optimum power at specific
temperature and irradiance, the generation of PV is updated in
the bus data and the same for WT generator as regard to the
optimum wind speed. Then, the PSO is started to look for the
global best values of switch configuration based on the fitness
value which represent the minimum power losses.
American Journal of Electrical Power and Energy Systems 2021; 10(1): 6-14 11
3. Simulation Results
The proposed technique utilizes GA combined with PSO to
achieve the reconfiguration of the network to reduce the
power losses. The objective of GA is to determine the
optimum maximum power of the PV and WT at given
operating conditions. In these results, four test cases have been
considered and validated. In addition, power losses and
minimizing the voltage are compared among all the cases.
Make sure that all cases are based on Figure 1 and default
switches’ statuses listed on Table 2. These four cases are listed
as follows: the CES, PV and WT generators are taken into
consideration in case 1. In case 2, the WT is neglected. Also,
the PV is not considered in case 3. Finally, only the CES has
been considered in case 4.
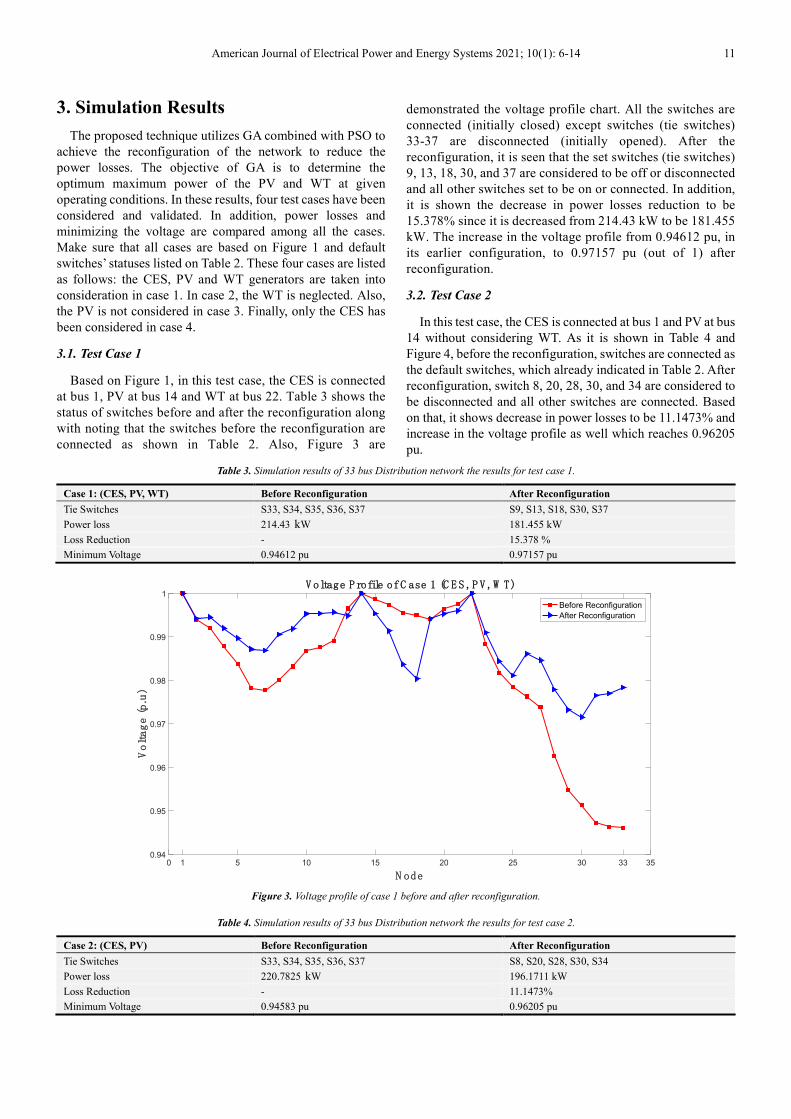
3.1. Test Case 1
Based on Figure 1, in this test case, the CES is connected
at bus 1, PV at bus 14 and WT at bus 22. Table 3 shows the
status of switches before and after the reconfiguration along
with noting that the switches before the reconfiguration are
connected as shown in Table 2. Also, Figure 3 are
demonstrated the voltage profile chart. All the switches are
connected (initially closed) except switches (tie switches)
33-37 are disconnected (initially opened). After the
reconfiguration, it is seen that the set switches (tie switches)
9, 13, 18, 30, and 37 are considered to be off or disconnected
and all other switches set to be on or connected. In addition,
it is shown the decrease in power losses reduction to be
15.378% since it is decreased from 214.43 kW to be 181.455
kW. The increase in the voltage profile from 0.94612 pu, in
its earlier configuration, to 0.97157 pu (out of 1) after
reconfiguration.
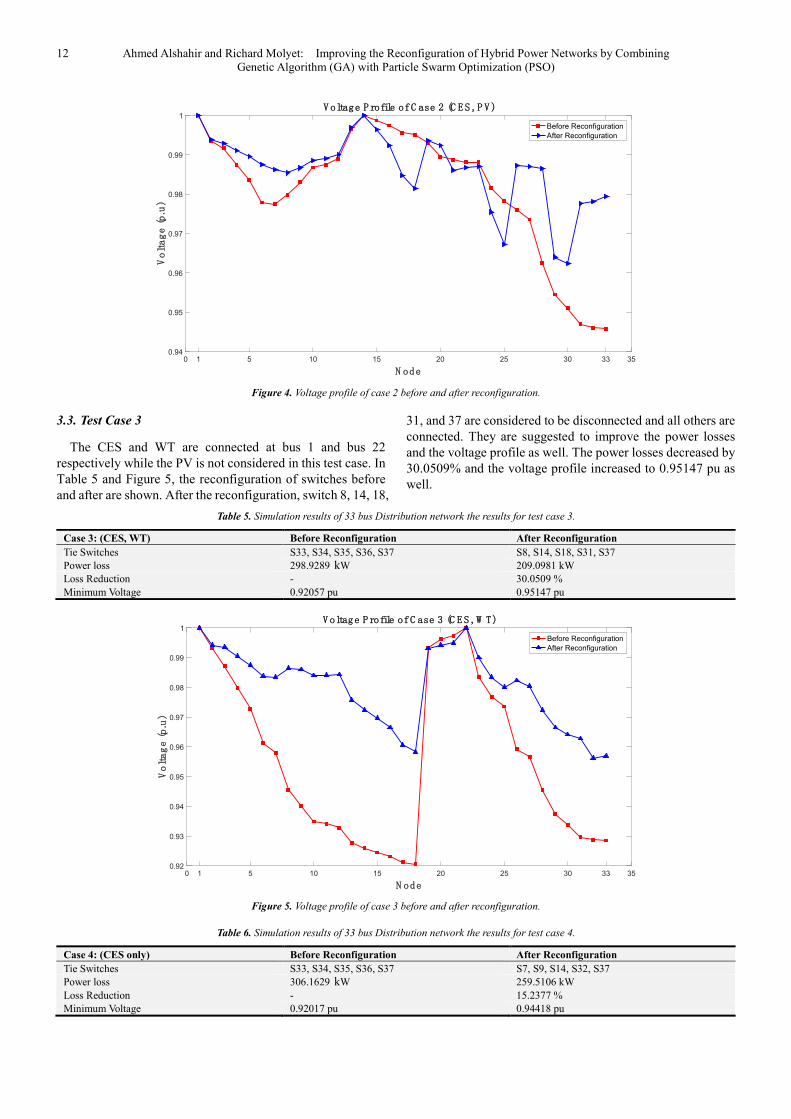
3.2. Test Case 2
In this test case, the CES is connected at bus 1 and PV at bus
14 without considering WT. As it is shown in Table 4 and
Figure 4, before the reconfiguration, switches are connected as
the default switches, which already indicated in Table 2. After
reconfiguration, switch 8, 20, 28, 30, and 34 are considered to
be disconnected and all other switches are connected. Based
on that, it shows decrease in power losses to be 11.1473% and
increase in the voltage profile as well which reaches 0.96205
pu.
Table 3. Simulation results of 33 bus Distribution network the results for test case 1.
Case 1: (CES, PV, WT) Before Reconfiguration After Reconfiguration
Tie Switches S33, S34, S35, S36, S37 S9, S13, S18, S30, S37
Power loss 214.43 kW 181.455 kW
Loss Reduction - 15.378 %
Minimum Voltage 0.94612 pu 0.97157 pu
Figure 3. Voltage profile of case 1 before and after reconfiguration.
Table 4. Simulation results of 33 bus Distribution network the results for test case 2.
Case 2: (CES, PV) Before Reconfiguration After Reconfiguration
Tie Switches S33, S34, S35, S36, S37 S8, S20, S28, S30, S34
Power loss 220.7825 kW 196.1711 kW
Loss Reduction - 11.1473%
Minimum Voltage 0.94583 pu 0.96205 pu
0 1 5 10 15 20 25 30 33 35
N ode
0.94
0.95
0.96
0.97
0.98
0.99
1
Voltage (p.u)
V oltage P rofile of C ase 1 (C E S , P V , W T)
Before Reconfiguration
After Reconfiguration
12 Ahmed Alshahir and Richard Molyet: Improving the Reconfiguration of Hybrid Power Networks by Combining
Genetic Algorithm (GA) with Particle Swarm Optimization (PSO)
Figure 4. Voltage profile of case 2 before and after reconfiguration.
3.3. Test Case 3
The CES and WT are connected at bus 1 and bus 22
respectively while the PV is not considered in this test case. In
Table 5 and Figure 5, the reconfiguration of switches before
and after are shown. After the reconfiguration, switch 8, 14, 18,
31, and 37 are considered to be disconnected and all others are
connected. They are suggested to improve the power losses
and the voltage profile as well. The power losses decreased by
30.0509% and the voltage profile increased to 0.95147 pu as
well.
Table 5. Simulation results of 33 bus Distribution network the results for test case 3.
Case 3: (CES, WT) Before Reconfiguration After Reconfiguration
Tie Switches S33, S34, S35, S36, S37 S8, S14, S18, S31, S37
Power loss 298.9289 kW 209.0981 kW
Loss Reduction - 30.0509 %
Minimum Voltage 0.92057 pu 0.95147 pu
Figure 5. Voltage profile of case 3 before and after reconfiguration.
Table 6. Simulation results of 33 bus Distribution network the results for test case 4.
Case 4: (CES only) Before Reconfiguration After Reconfiguration
Tie Switches S33, S34, S35, S36, S37 S7, S9, S14, S32, S37
Power loss 306.1629 kW 259.5106 kW
Loss Reduction - 15.2377 %
Minimum Voltage 0.92017 pu 0.94418 pu
0 1 5 10 15 20 25 30 33 35
N ode
0.94
0.95
0.96
0.97
0.98
0.99
1
Voltage (p.u)
V oltage P rofile of C ase 2 (C E S , P V )
Before Reconfiguration
After Reconfiguration
0 1 5 10 15 20 25 30 33 35
N ode
0.92
0.93
0.94
0.95
0.96
0.97
0.98
0.99
1
Voltage (p.u)
V oltage P rofile of C ase 3 (C E S , W T)
Before Reconfiguration
After Reconfiguration
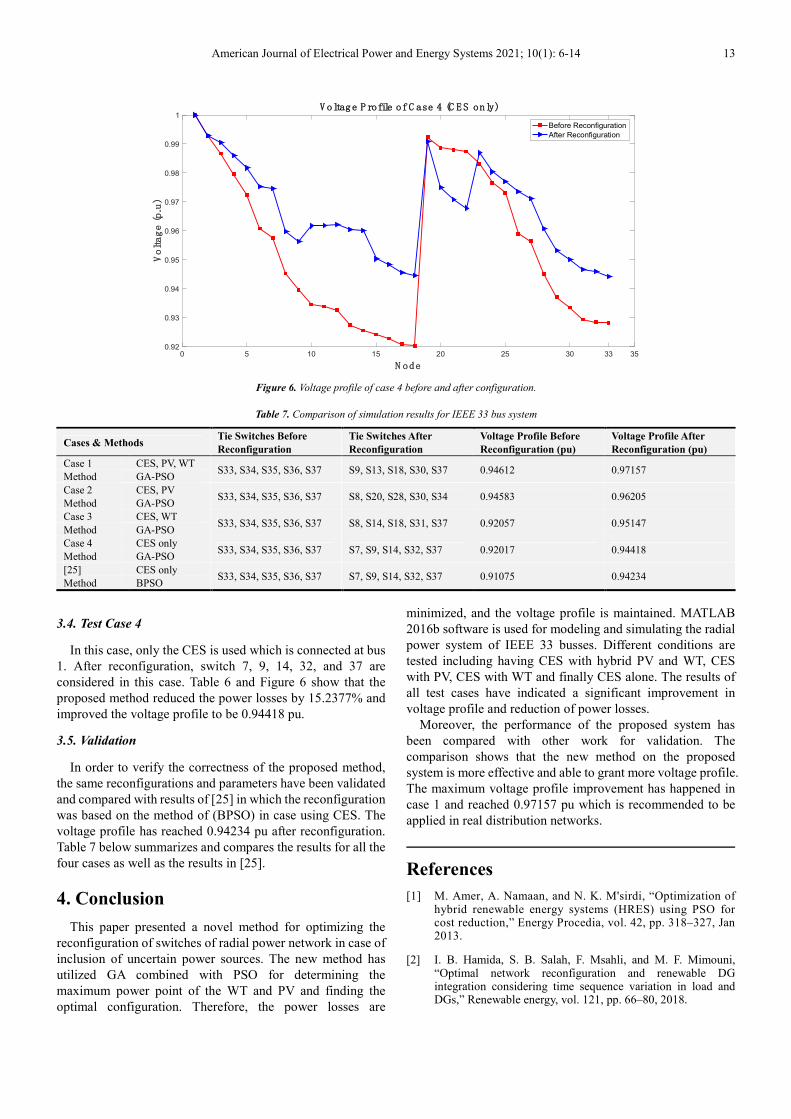
American Journal of Electrical Power and Energy Systems 2021; 10(1): 6-14 13
Figure 6. Voltage profile of case 4 before and after configuration.
Table 7. Comparison of simulation results for IEEE 33 bus system
Cases & Methods Tie Switches Before
Reconfiguration
Tie Switches After
Reconfiguration
Voltage Profile Before
Reconfiguration (pu)
Voltage Profile After
Reconfiguration (pu)
Case 1 CES, PV, WT S33, S34, S35, S36, S37 S9, S13, S18, S30, S37 0.94612 0.97157
Method GA-PSO
Case 2 CES, PV S33, S34, S35, S36, S37 S8, S20, S28, S30, S34 0.94583 0.96205
Method GA-PSO
Case 3 CES, WT S33, S34, S35, S36, S37 S8, S14, S18, S31, S37 0.92057 0.95147
Method GA-PSO
Case 4 CES only S33, S34, S35, S36, S37 S7, S9, S14, S32, S37 0.92017 0.94418
Method GA-PSO
[25] CES only S33, S34, S35, S36, S37 S7, S9, S14, S32, S37 0.91075 0.94234
Method BPSO
3.4. Test Case 4
In this case, only the CES is used which is connected at bus
1. After reconfiguration, switch 7, 9, 14, 32, and 37 are
considered in this case. Table 6 and Figure 6 show that the
proposed method reduced the power losses by 15.2377% and
improved the voltage profile to be 0.94418 pu.
3.5. Validation
In order to verify the correctness of the proposed method,
the same reconfigurations and parameters have been validated
and compared with results of [25] in which the reconfiguration
was based on the method of (BPSO) in case using CES. The
voltage profile has reached 0.94234 pu after reconfiguration.
Table 7 below summarizes and compares the results for all the
four cases as well as the results in [25].
4. Conclusion
This paper presented a novel method for optimizing the
reconfiguration of switches of radial power network in case of
inclusion of uncertain power sources. The new method has
utilized GA combined with PSO for determining the
maximum power point of the WT and PV and finding the
optimal configuration. Therefore, the power losses are
minimized, and the voltage profile is maintained. MATLAB
2016b software is used for modeling and simulating the radial
power system of IEEE 33 busses. Different conditions are
tested including having CES with hybrid PV and WT, CES
with PV, CES with WT and finally CES alone. The results of
all test cases have indicated a significant improvement in
voltage profile and reduction of power losses.
Moreover, the performance of the proposed system has
been compared with other work for validation. The
comparison shows that the new method on the proposed
system is more effective and able to grant more voltage profile.
The maximum voltage profile improvement has happened in
case 1 and reached 0.97157 pu which is recommended to be
applied in real distribution networks.
References
[1] M. Amer, A. Namaan, and N. K. M'sirdi, “Optimization of hybrid renewable energy systems (HRES) using PSO for cost reduction,” Energy Procedia, vol. 42, pp. 318–327, Jan 2013.
[2] I. B. Hamida, S. B. Salah, F. Msahli, and M. F. Mimouni, “Optimal network reconfiguration and renewable DG integration considering time sequence variation in load and DGs,” Renewable energy, vol. 121, pp. 66–80, 2018.
0 5 10 15 20 25 30 33 35
N ode
0.92
0.93
0.94
0.95
0.96
0.97
0.98
0.99
1
Voltage (p.u)
V oltage P rofile of C ase 4 (C E S only)
Before Reconfiguration
After Reconfiguration
14 Ahmed Alshahir and Richard Molyet: Improving the Reconfiguration of Hybrid Power Networks by Combining
Genetic Algorithm (GA) with Particle Swarm Optimization (PSO)
[3] O. H. Mohammed, Y. Amirat, and M. Benbouzid, “Particle swarm optimization of a hybrid wind/tidal/PV/battery energy system. Application to a remote area in Bretagne France,” Energy Procedia, 162, 87–96, 2019.
[4] M. R. Javadi, K. Mazlumi, and A. Jalilvand, “Application of GA, PSO and ABC in optimal design of a stand-alone hybrid system for north-west of Iran,” In2011 7th International Conference on Electrical and Electronics Engineering (ELECO), pp. 203–211, 2011, IEEE.
[5] A. Alshahir, W. Collings, R. Molyet, and R. Khanna, “Transient enhancement of smart grid using SMES controlled by PID and fuzzy logic control,” Engineering and Applied Sciences, vol. 5, no. 3, pp. 56–65, 2020.
[6] G. A. Eboda, A. W. Eboda, and S. B. Femi, “Development of a power flow model for optimal location of distributed generators in electrical distribution system,” Development, vol 7, no. 9, pp. 11–19, 2017.
[7] H. Hong, Z. Hu, R. Guo, J. Ma, and J. Tian, “Directed graph-based distribution network reconfiguration for operation mode adjustment and service restoration considering distributed generation,” Journal of Modern Power Systems and Clean Energy, vol. 5, no. 1, pp. 142–149, 2017.
[8] I. Roytelman, V. Melnik, S. S. H. Lee, and R. G. Lugu, “Multi- objective feeder reconfiguration by distribution management system,” IEEE Transactions on Power Systems, vol. 11, no. 2, pp. 661–667, 1996.
[9] E. Romero, J. L. Martinez-Ramos, A. Gdmez, and A. Urbano, “Optimal reconfiguration of distribution networks for power loss reduction,” 2001 IEEE Porto Power Tech Proceedings (Cat. No. 01EX502), vol. 3. 2001. IEEE.
[10] R. Billinton and S. Jonnavithula, “Optimal switching device dlacement in radial distribution systems,” IEEE Transactions on Power Delivery, vol. 11, no. 3: 1646–1651, 1996.
[11] E. M. Carreno, R. Romero, and A. Padilha-Feltrin, “An efficient codification to solve distribution network reconfiguration for loss reduction problem,” IEEE Transactions on Power Systems, vol. 23, no. 4, pp. 1542–1551, 2008.
[12] W. C. Wu and M. S. Tsai, “Application of enhanced integer coded particle swarm optimization for distribution system feeder reconfiguration,” IEEE Transactions on Power Systems, vol. 26, no. 1, pp. 1–9, 2011.
[13] F. V. Gomes et al., “A new distribution system reconfiguration approach using optimum power flow and sensitivity analysis for loss reduction. IEEE Transactions on Power Systems, vol. 21, no. 4, pp. 1616–1623, 2006.
[14] D. P. Montoya and J. M. Ramirez, “Reconfiguration and optimal capacitor placement for losses reduction,” 2012 Sixth IEEE/PES Transmission and Distribution: Latin America Conference and Exposition (T&D-LA), pp. 1–6, 2012, IEEE.
[15] V. Farahani, B. Vahidi, and H. A. Abyaneh, “Reconfiguration and capacitor placement simultaneously for energy loss reduction based on an improved reconfiguration method,” IEEE Transactions on Power Systems, vol. 27, no. 2, pp. 587–595, 2011.
[16] S. Madeiro, E. Galvão, C. Cavellucci, C. Lyra, and F. Von Zuben, “Simultaneous capacitor placement and reconfiguration for loss reduction in distribution networks by a hybrid genetic algorithm,” IEEE Congress of Evolutionary Computation (CEC), 2011, pp. 2178–2185, 2011, IEEE.
[17] M. J. Kasaei and M. Gandomkar, “Loss reduction in distribution network using simultaneous capacitor placement and reconfiguration with ant colony algorithm,” 2010 Asia-Pacific Power and Energy Engineering Conference, pp. 1–4, 2010, IEEE.
[18] J. G. Vlachogiannis and K. Y. Lee, “A comparative study on particle swarm optimization for optimal steady-state performance of power systems,” IEEE Transactions on Power Systems, vol. 21, no 4, pp. 1718–1728, 2006.
[19] A. Moradi and M. Fotuhi-Firuzabad, “Optimal switch placement in distribution systems using trinary particle swarm optimization algorithm,” IEEE Transactions on Power Delivery, vol. 23, no. 1, pp. 271–279, 2008.
[20] A. Moradi, M. Fotuhi-Firuzabad, and M. Rashidi-Nejad, “A reliability cost/worth approach to determine optimum switching placement in distribution systems,” 2005 IEEE/PES Transmission & Distribution Conference & Exposition: Asia and Pacific, pp. 1–5, 2005, IEEE.
[21] J. H. Teng and C. N. Lu, “Feeder switch relocation for customer interruption cost minimization,” IEEE Transactions on Power Delivery, vol. 17, no. 1, pp. 254–259, 2002.
[22] J. H. Teng and Y. H. Liu, “A novel ACS-based optimum switch relocation method,” IEEE Transactions on Power Systems, vol. 18, no. 1, pp. 113–120, 2003.
[23] P. M. Carvalho, L. A. Ferreira, and A. C. Da Silva, “A decomposition approach to optimal remote controlled switch allocation in distribution systems,” IEEE Transactions on Power Delivery, vol. 20, no. 2, pp. 1031–1036, 2005.
[24] A. A. Esmin, G. Lambert-Torres, A. Z. De Souza, “A hybrid particle swarm optimization applied to loss power minimization,” IEEE Transactions on Power Systems, vol. 20, no. 2, pp. 859–866, 2005.
[25] R. Manjunath, “Reconfiguration of distributed network using binary particle swarm optimization method,” International Journal of Computer Sciences and Engineering 2018, vol. 6, no. 7, 1443-1445.
[26] T. Tafticht, K. Agbossou, M. L. Doumbia, and A. Cheriti, “An improved maximum power point tracking method for photovoltaic systems,” Renewable Energy, vol. 33, no. 7, pp. 1508–1516, 2008.