Embed Size (px)
DESCRIPTION
none
Citation preview
1
Improving the Psychometric Properties of the Problem Gambling Severity Index
SHAWN R. CURRIEDAVID M. CASEY
DAVID C. HODGINS
November 2010
Submitted to the Canadian Consortium for Gambling Research: Alberta Gaming Research Institute Canadian Centre on Substance Abuse Canadian Partnership for responsible Gambling Manitoba Gaming Control Commission Nova Scotia Gaming Foundation Ontario Problem Gambling Research Centre Saskatchewan Health
2
Improving the Psychometric Properties of the Problem Gambling Severity Index
Table of Contents
Acknowledgements .........................................................................................................................5
Executive Summary ........................................................................................................................6
Section 1 - Background ................................................................................................................10
Section 2 - Overall Approach
Data Sources ......................................................................................................................13
Inclusion and Exclusion Criteria used in all Studies ........................................................14
General analysis plan .........................................................................................................15
Section 3 - Assessing the Reliability and Validity of Current PGSI Severity Categories
Study 1 - PGSI Severity Categories Based on Original Scoring .......................................15
Study 2 - Temporal Stability of the Original PGSI Classifications in Adults ...................25
Study 3 - Reasons for Shifting PGSI Categories over Time..............................................27
Section 4 - Validity and Reliability of Novel PGSI Scoring System
Study 1 - Creation and Reliability of Novel PGSI Scoring System ..................................35
Study 2 - Validity of a Percentile-based PGSI Scoring System ........................................51
Study 3 – Reliability of the Dichotomous PGSI Scoring System......................................53
Section 5 - Factor analysis and latent trait modeling
Study 1 - Factor Structure Analysis ..................................................................................54
Study 2 - Evaluating Item Fit to the Rasch Rating-scale Model........................................63
Section 6 - Weighting the PGSI items
Study 1 - Statistical Generation of PGSI Item-level Weights............................................69
Study 2 - Obtaining Expert Opinion on the Importance of PGSI Items ............................74
Section 7 - Conclusions .................................................................................................................85
Section 8 - Recommendations .......................................................................................................89
Section 9 - References ...................................................................................................................91
Appendices.....................................................................................................................................94
3
List of Tables
Table 2.1: The main gambling variables that were common across the datasets used in this project. 15Table 3.1: Comparison of non-problem, low-risk, moderate-risk, and problem gamblers ondemographic variables using original PGSI scoring
18
Table 3.2: Proportion of non-problem, low-risk, moderate-risk, and problem gamblers that gamble atleast 2-3 times/month using original PGSI scoring
19
Table 3.3: Comparison of non-problem, low-risk, moderate-risk, and problem gamblers on amountspent on gambling, percent of income spent on gambling, and number of games played in last yearusing original scoring
20
Table 3.4: Comparison of non-problem, low-risk, moderate-risk, and problem gamblers on healthand mental health status using original PGSI scoring
23
Table 3.5: Demographics for the LLLP 26Table 3.6: Wave 1 of LLLP: Original PGSI scoring system 29Table 3.7: Wave 2 of LLLP: Original PGSI scoring system 30Table 3.8: Wave 1 & 2 of LLLP: Original PGSI scoring system- Only for wave 1 non-problemgamblers & PGSI category at wave 2
32
Table 3.9: Wave 1 & 2 of LLLP: Original PGSI scoring system - Only for wave 1 low-risk gamblers& PGSI category at wave 2
33
Table 3.10: Wave 1 & 2 of LLLP: Original PGSI scoring system - Only for wave 1 moderate-riskgamblers & PGSI category at wave 2
34
Table 4.1: Comparison of original PGSI scoring with novel PGSI scoring systems - Participants thatgambled at both wave 1 and 2 of LLLP
38
Table 4.2: Wave 1 of LLLP: Novel PGSI scoring system 39Table 4.3: Wave 2 of LLLP: Novel PGSI scoring system 40Table 4.4: Wave 2 of LLLP: Novel PGSI scoring system- Only for wave 1 non-problem gamblers &novel PGSI category at wave 2
41
Table 4.5: Wave 2 of LLLP: Novel PGSI scoring system - Only for wave 1 low-risk gamblers &novel PGSI category at wave 2
42
Table 4.6: Wave 2 of LLLP: Novel PGSI scoring system - Only for wave 1 moderate-risk gamblers& novel PGSI category at wave 2
43
Table 4.7: Proportion of non-problem, low-risk, moderate-risk, and problem gamblers that gamble atleast 2-3 times/month using novel scoring of the PGSI
44
Table 4.8: Comparison of gambling intensity indicators for PGSI categories based on novel scoring 46Table 4.9: Comparison of non-problem, low-risk, moderate-risk and problem gamblers on health andmental health status using novel scoring of the PGSI
47
Table 4.10: Comparison of gambling intensity indicators for PGSI categories based on novel scoringthat retains the PGSI = 8 as cut-off for problem gambling
50
Table 4.11: Comparison of gambling intensity indicators for PGSI categories based on percentileranking of percent of income spent on gambling per year
52
Table 5.1: PGSI item loadings on first unrotated principal component for likert response anddichotomously scored items
57
Table 5.2: Symptom severity estimates for the Problem Gambling Severity Index (PGSI) from asample of 25,584 gamblers who reported gambling at least once in the previous 12 month period.
66
Table 5.3: Results of differential item functioning tests of statistical and clinical significance 68Table 5.4: Severity rankings of the nine PGSI Items: Results from Rasch analysis and expert survey 69Table 6.1: Statistical generation of PGSI weights: Linear regression results predicting percentincome, total dollars and number of gambling activities from individual PGSI items
71
Table 6.2: Statistical generation of PGSI weights: Results of logistic regression with dependent 72
4
variable as exceeding the 90th percentile for percent of income spent on gambling.Table 6.3: Statistical generation of PGSI weights: Results of linear regression using LLLP time 1data on adult gamblers (N = 1059)
73
Table 6.4: Respondent Characteristics (N= 142) 77Table 6.5: Opinions on the PGSI and its scoring systema 78Table 6.6: Overall rankings of severity of each PGSI item 79Table 6.7: Opinions on the relative weight of PGSI item response choices in determining severity ofgambling problem
80
Table 6.8: Impact of using expert opinion on the relative scoring weight of PGSI item responsechoices on the proportion of gamblers in each PGSI category
81
Table 6.9: Ratings of individual PGSI symptoms is indicators of problem gambling 82Table 7.1: Pros and cons of modifying the PGSI scoring rules 88
List of Figures
Figure 3.1. Proportion of non-problem, low-risk, moderate-risk, and problem gamblers who playdifferent game types 2-3 times per month or more.
21
Figure 3.2. Proportion (with 99% confidence intervals) of non-problem, low-risk, moderate-risk,and problem gamblers who play EGMs or casino games versus all other game types (except EGMand casino games) 2-3 times per month or more.
22
Figure 3.3. Indicators of gambling intensity by PGSI category using original scoring 22Figure 3.4. Mean amount spent on all gambling in each category at wave 1 (1=non-problem; 2=low-risk gambler; 3=moderate-risk gambler; and 4=problem gambler).
31
Figure 3.5. Mean amount spent on all gambling in each category at wave 2 (1=non-problem; 2=low-risk gambler; 3=moderate-risk gambler; and 4=problem gambler).
31
Figure 4.1. Percentage of gamblers in each category at wave 1 (1=non-problem; 2=low-riskgambler; 3=moderate-risk gambler; and 4=problem gambler).
36
Figure 4.2. Percentage of gamblers in each category at wave 2 (1=non-problem; 2=low-riskgambler; 3=moderate-risk gambler; and 4=problem gambler).
37
Figure 4.3. Proportion (with 99% confidence intervals) of non-problem, low-risk, moderate-risk, andproblem gamblers who play EGMs or casino games versus all other game types (except EGM andcasino games) 2-3 times per month or more using novel scoring.
45
Figure 4.4. Indicators of gambling intensity by PGSI category using novel scoring. 45Figure 4.5. Indicators of gambling intensity by PGSI category using novel percentile rank scoring. 52Figure 5.1. Confirmatory factor analysis – PGSI Likert items with standarized loadings 58Figure 5.2. Confirmatory factor analysis – PGSI dichotomously scored items with standarizedloadings
58
Figure 5.3. PGSI item loadings for men and women 59Figure 5.4. PGSI item loadings for three age groups 60Figure 5.5 PGSI item loading for indivduals who play Electronic Gambing Machines or casinogames versus individuals playing other games only
61
Figure 5.6. PGSI item loadings for three income groups 62Figure 6.1. Regression coefficients (with 99% confidence intervals) associated with each PGSI itempredicting percent of income spent on gambling and total expenditures.
72
Figure 6.2. Emergence of PGSI symptoms and quantitative measures of gambling intensity atdifferent levels of problem gambling severity
83
5
Acknowledgements
The investigators would like to thank the Canadian Consortium for Gambling Research(Alberta Gaming Research Institute, Canadian Partnership for Responsible Gambling, CanadianCentre on Substance Abuse, Manitoba Gaming Control Commission, Nova Scotia GamingFoundation, Ontario Problem Gambling Research Centre, Saskatchewan Health) for theirfinancial support to conduct this study. The investigators also thank Kirsten Fiest and NatalieMiller for their outstanding contributions in data analysis, interpretation, and report preparation.We thank all the gambling experts who participated in the online opinion survey of the CPGI.
6
Executive Summary
The Canadian Problem Gambling Index (CPGI) has become the gold standard in Canada forcollecting information on gambling habits and problem gambling symptoms. Since itslaunch, the CPGI has been used in all ten Canadian provinces and the national mental healthsurvey (Canadian Community Health Survey – Mental Health and Well-being; CCHS-1.2). It isalso used in Australia, Norway, Great Britain, and Iceland. The CPGI includes nine itemsassessing gambling problems that form a quantitative index called the Problem GamblingSeverity Index (PGSI). Four gambler subtypes have been identified based on the total PGSIscore: non-problem, low-risk, moderate-risk, and problem gamblers.
In the 10 years since the CPGI was first introduced, criticism of the scale has surfaced. Much ofthis criticism centres on the PGSI. Specific issues identified include: the lack validation of forthe low-risk and moderate-risk subtypes; the variable range of scores for each of the PGSI-defined subtypes; the limited number of items; choice of wording for the Likert responsecategories; absence of weights for items; low frequency of endorsement for many items, and;concerns of false positives and false negatives. While no measurement instrument is perfect andbrief screening tools such as the PGSI inevitably attract criticism, proponents of the CPGIbelieve that many of the concerns could be addressed with a thorough investigation of thepsychometric properties of the present version and exploration of alternate methods of scoring.
The present study employed advanced statistical techniques to identify the strengths andweaknesses of the PGSI scoring systems and the impact of alternative scoring. Three largepopulation datasets were used:
CPGI integrated dataset. Contains CPGI data pooled from the National CPGIvalidation study and prevalence surveys conducted in Alberta, British Columbia, Ontario(two cycles), Manitoba, Newfoundland between 2001 and 2005.
Canadian Community Health Survey – Mental Health Well-being (CCHS-1.2). The2002 national mental health survey that included the CPGI to assess gambling.
Leisure, Lifestyle, and Lifecycle Project (LLLP). An ongoing (2006-present)longitudinal study of gambling involving adolescents and adults living in rural and urbanAlberta.
Statistical methods used in this study included: exploratory and confirmatory factor analysis,Rasch modeling, differential item functioning analysis, test-retest reliability, validation of thefour PGSI gambler subtypes, and regression modeling to explore the development of statisticalweights. We also conducted an opinion survey of 142 experts in the field of gambling fromCanada and other countries. The main findings are:
The CPGI is well-regarded by researchers and clinicians in Canada and elsewhere. Expertswho participated in our survey felt the PGSI is useful in identifying both at risk and problemgamblers.
The PGSI in its present form demonstrates strong internal validity and reliability. Thefactor structure was confirmed with both exploratory and confirmatory methods. All items loadon the one-factor model. The factor structure is valid for both the 4-point Likert scaled items andwhen the items are scored dichotomously. Internal reliability is better with the Likert scaleditems. The factor structure is invariant across subgroups defined by gender, age, income level,and game types.
7
The Rasch analysis supports the PGSI as an internally reliable, continuous measure ofproblem gambling severity. No miss-fitting items were identified. There was evidence ofclinically significant differential item functioning with only one item, borrowing money togamble, which indicated a potential response bias in gamblers who play electronic gamingmachines (EGM) or casino games versus other game types. Specifically, EGM/casino gamblerswere less likely to report the need to borrow money for gambling than gamblers who playedother games at equivalent levels of problem gambling severity. This could indicate a reducedsensitivity for the PGSI symptom of borrowing money to detect problem gambling inEGM/casino players.
The internal validity of the PGSI is superior to other comparable measures of problemgambling severity notably the SOGS and DSM-IV based scales. The factor structure andRasch model fit were stronger for the PGSI compared to recent publications applying the samemethods to the SOGS and DSM-IV based scales including the NODS. The relative order ofPGSI symptoms when ranked by level of problem gambling severity being assessed is similar tothe SOGS and DSM-IV based scales, at least for the items that are comparable acrossinstruments.
Gaps in the coverage of problem gambling severity are evident in the PGSI. The Raschmodel suggests a gap in symptom coverage exists in the severity of problem gambling reflectedin the items betting more than one can afford to lose and recognition of gambling problem. Thisportion of the continuum corresponds to the low-risk and moderate-risk range of the PGSIscoring categories (i.e., gamblers who endorse between one and four symptoms). The additionof new PGSI items that reflect mid-range problem gambling severity would provide bettercoverage of symptoms that are characteristic of low to moderate-risk gamblers.
Among the four gambler subtypes defined by the PGSI, the non-problem gambler (PGSI =0) and problem gambler subtype (PGSI > 7) are the most distinct and possess the greatestexternal validity. The non-problem subtype represents the typical, normative Canadian gambler.The problem gambler category is a distinct group of gamblers on all dimensions. Thedifferences between this category and closest adjacent category, moderate-risk gamblers, werelarge enough to be considered clinically meaningful on most dimensions. Overall, there issufficient evidence to retain these PGSI subtypes with minimal changes. Furthermore,combining the moderate-riskmoderate-risk and problem gambler subtypes and labelling theresultant group ‘problem gamblers’ is not recommended. Because of the low prevalence ofindividuals who score as problem gamblers researchers often merge the moderate-risk andproblem gambling groups into a single category to increase statistical power. Our analysesindicate that individuals in the moderate-risk and problem gambler categories represent distinctsubtypes of gamblers and combining these groups is not empirically supported.
There is insufficient evidence to consider the low-risk and moderate-risk PGSI subtypes asdistinct groups of gamblers using the present scoring cut-offs. These PGSI subtypes werefound to have poor external validity. There are two options for improving the classification ofmid-level problem gambling severity (i.e., gamblers who score greater than zero but under 9 onthe PGSI): (1) merge the low and moderate-risk categories into a single PGSI subtype of ‘at-riskgamblers,’ with the PGSI score used as a quantitative index of degree of risk that ranges from 1to 7. (2) modify the PGSI scoring cut-off rules, creating two new mid-level categories consistingof low-risk gamblers (PGSI = 1 to 4) and moderate-risk gamblers (PGSI = 5 to 7). The latteroption is recommended. The low and moderate-risk groupings are similar on many dimensions
8
and this is largely the result of the original scoring rules that established moderate-risk as havinga score as low as 3. The modified scoring produces two categories of mid-level problemgambling severity that appears clinically distinct and better captures the gradient of problemgambling severity from the non-problem to problem levels.
The temporal reliability for the four PGSI subtypes, using both the original scoring rulesand the novel scoring rules, is satisfactory for a retest interval of approximately 14 months.Using both the intraclass correlation coefficient and reliable change index to assess reliability,the majority of gamblers do not shift PGSI subtype over time. As predicted, a shift in PGSIsubtype over time corresponded to a change in level of gambling intensity—i.e., an increase inPGSI score that resulted in a gambler being classified as a higher risk gambler could beexplained by an increase in gambling expenditure.
There is no statistical evidence justifying item-level weights for the PGSI items. Inregression models predicting both measures of gambling intensity and number of DSM-IVsymptoms of pathological gambling the confidence intervals around the coefficients overlappedfor the majority of PGSI symptoms. This suggests there is no statistical basis for weightingspecific PGSI items as contributing more to the total score, although we acknowledge there aresignificant limitations in the data available that prevent the development of robust weights at thistime. The development of item-level weights requires a valid, external criterion to assess therelative contribution of the individual PGSI items in predicting. The ideal criterion would be ananother indicator of problem gambling severity that is distinct from the PGSI -e.g., collateralratings of problem severity obtained from a family member or clinician--and not exclusivelybased on DSM-IV criteria. A future CPGI population survey could attempt to collect collateralratings of problem gambling severity for a sample of participants for use in a weightdevelopment study.
Recommendations
The results from our analyses suggest that revisions to the existing scoring system wouldimprove the assessment of mid-level problem gambling severity. The first recommendationcould be implemented immediately. The remaining recommendations pertain to thedevelopment of new PGSI items and an overhaul of the Likert response scale. Theserecommendations would require a new validation study to collect normative data and establishnew cut-offs for the PGSI subtypes. The specific recommendations are:
1) Modify the PGSI scoring cut-off rules, creating two new mid-level categories consistingof low-risk gamblers (PGSI = 1 to 4) and moderate-risk gamblers (PGSI = 5 to 7).Ideally, these subtypes would have the same range of scores (4) however definingmoderate-risk gamblers as scoring from 5 to 8 would require validation of a new cut-offfor problem gamblers (e.g., ≥ 9). Our findings suggest this is little difference in definingmoderate-risk gamblers with the upper range being 7 rather than 8 so keeping the originalcut-off for defining problem gamblers as PGSI ≥ 8 would allow for comparisons ofprevious and future prevalence studies.
2) Adopt a new Likert scale that replaces the ‘most of the time’ and ‘almost always’ choices.It has been noted that these response choices are very similar in wording and ‘almostalways’ is rarely endorsed. Two options for improving the Likert scale include:removing the ‘almost always’ choice to create a shorter 3-point scale (never, sometimesor most of the time), or adopting the Australian revision of having five response choices
9
(never=0, rarely = 1, sometimes = 1, often = 2, always =3) for each item. In theAustralian scoring system, rarely and sometimes receive the same score. Given that thePGSI performs similarly when the items are dichotomously scored or Likert scored, werecommend shortening the number of response choices per item in favour of adding moreitems to expand the range of symptoms in the low and moderate-risk categories.
3) Following from above, new items that specifically assess mid-level problem gamblingseverity should be added to increase the range of scores for gamblers classified as low-risk or moderate-risk. An increased score range could also enhance the distinctiveness ofthese subtypes and aid in the detection of gamblers who are approaching the clinicalthreshold for problem gambling.
4) Quantitative measures of gambling intensity (frequency of gambling, expenditure ongambling, duration of gambling sessions) could also be considered for new items.
5) Any future validation work on the PGSI should incorporate changes to the diagnosticcriteria for pathological gambling being planned for the release of the DSM-5 1. Werecommend waiting for the release of the DSM-5 before changing the cut-off for problemgamblers for clinical diagnostic purposes.
Finally, it should be noted that maintaining the status quo and leaving the PGSI as is wouldbe a defendable option until the revised DSM criteria are released. Any revisions to thePGSI in its current form would not necessarily improve the identification of problemgamblers, which is one of the primary purposes of the instrument. In this capacity, the PGSIappears to do an adequate job and is psychometrically stronger than comparable gamblingscales.
10
Section 1
Background
The gaming industry is one of the fastest growing industries in North America. In Canada, netrevenue from gambling increased four-fold from $2.7 billion in 1992 to $14 billion in 2007.Canada has a broad range of gambling venues and opportunities including over 87,000 electronicgaming machines, 33,000 lottery outlets, 250 race tracks, 60 permanent casinos, and 25,000licenses to run temporary bingos, casinos, and raffles 2. Past year and lifetime rates of gamblingamong Canadians are 76% and 85%, respectively 3-6. Rates of gambling participation in thegeneral population have increased along with per capita expenditure 2. It is estimated that about23% of Canadian gaming revenue now derives from problem gamblers 7.
Problem Gambling Severity Index (PGSI)
The Canadian Problem Gambling Index (CPGI) has become the standard in Canada forcollecting information on gambling habits and problem gambling symptoms. It is also usedin Australia (Queensland, Victoria and Tasmania), Norway, Great Britain, and Iceland. Althoughpredominately a survey instrument for research, it is also used clinically for screening problemgambling and program evaluation. The CPGI collects data on problem gambling symptoms andgambling habits for all major types of gambling including instant win/scratch tickets, lotterytickets, bingo, casino games, electronic gaming machines (EGMs), private card/board games,horse betting, sports betting, games of skill, internet, raffle tickets, and arcade games 8. TheCPGI includes nine items assessing gambling problems that form a quantitative index calledthe Problem Gambling Severity Index (PGSI). The PGSI items were chosen from a largerpool of symptoms based on superior test-retest reliability, ability to discriminate recreationalgamblers from gamblers, and contributing to high internal consistency of the total score 8.Scores on the PGSI correlate highly (r = .83) with DSM-based scales such as the NODS 8. Theresponse choices for each PGSI item are ‘never,’ ‘sometimes,’ ‘most of the time,’ or ‘almostalways,’ with a total score ranging from 0 to 27. Cut-offs are used to assign gamblers tocategories consisting of ‘non-problem gamblers’ (PGSI = 0), ‘low-risk’ (PGSI = 1 to 2),‘moderate-risk’ (PGSI = 3 to 7), or ‘problem-gambler’ (PGSI >7)9. These PGSI categoriesare purported to represent distinct subtypes of gamblers within the continuum of problemgambling severity. Since its launch, the CPGI has been used in all ten Canadian provinces andthe national mental health survey (Canadian Community Health Survey – Mental Health andWell-being; CCHS-1.2),
The initial enthusiasm for the CPGI as a tool for screening and quantifying problem gamblingseverity has started to fade and serious criticism of the scale is now emerging. For example,there was relatively little validation of the cut-offs for the low-risk and moderate-risk categories.The scale developers argued that issues of sensitivity and specificity do not apply because thesegroups do not represent problem gambling 8. This raises important questions such as: what dothese categories really represent? Is there any meaningful difference between low-risk andmoderate-risk gamblers, or non-problem and low-risk gamblers? The present scoring system forthe PGSI may also be problematic for the scale’s reliability. The range of scores for each PGSIcategory varies considerably: low-risk (2-point range), moderate-risk (5-point), and problemgambling (19-point range). The variable score ranges could impact the temporal stability of thecategories with more stability for categories with wider ranges. Recent reviews of the CPGIprovide other critical insight on the scale:
11
Performance and enhancement of the Canadian Problem Gambling Index: Report andrecommendations 10. Investigators interviewed 20 researchers familiar with the CPGI includingthe scale developers. These key informants were asked their opinions of the PGSI as a measureof problem gambling severity and to recommend improvements or additional research. Keyfindings to emerge from this study were:
Additional research is needed to validate the subtypes and cut-offs. The soundness of thelabels, definitions and cut-points was questioned. Respondents questioned the variable rangeof scores for each of the severity categories.
The PGSI may underestimate problem gambling given that some heavy gamblers (thoseinvesting time and money on gambling that greatly exceed the population norm) can scorebelow the threshold for problem gambling.
Suggestions for improving the PGSI included: adding new items (e.g., loss of control, familyarguments over gambling), weighting the items, changing the wording of particular items andresponse choices, and developing additional items specifically to measure low-risk andmoderate-risk.
Suggestions for new research were: additional validation studies of the PGSI subtypes, usingmore advanced scaling methods such as latent trait modeling to understand how theindividual items assess problem gambling severity at different levels, additional factoranalysis studies, and longitudinal cohort studies to assess how PGSI scores predict futuregambling or other indicators.
Using the SOGS vs CPGI in Problem Gambling Screening and Assessment 11. Thiscomprehensive literature review of the CPGI and related instruments identified similar concernsas the McCready and Adlaf (2006) report. They also concluded: 1) The CPGI lacks anunderlying theoretical model of gambling; 2) Factor analytic studies of the PGSI have producedinconsistent results, although the latest results from the British Gambling Prevalence Surveyindicate a one factor solution is the best fit for the PGSI; 3) Although the four point scale foreach item is thought to be an improvement over the dichotomous scoring of related instruments,the reality is that most respondents use one or two response choices, suggesting the items couldbe simplified. Despite these concerns, the authors conclude the PGSI outperforms the SOGS andthe Victorian Gambling Screen in terms of construct validity, item difficulty, and sensitivityin detecting symptoms within the general population 12. Scores on the PGSI also correlate withmental health consequences of problem gambling including anxiety, depression, and suicideideation.
Canadian Low-Risk Gambling Limits: New Evidence and Limitations 13. This series of studiesfunded by the Ontario Problem Gambling Research Centre did not specifically focus on thepsychometrics of the PGSI but did produce findings relevant to the current project. The work bythis team used the population data collected in the provincial prevalence surveys and CCHS-1.2to examine how well indicators of gambling intensity (expenditure, frequency of gambling, andtime invested) predict harm as measured by the PGSI. Using CCHS-1.2 data we derived a set oflow-risk gambling limits using a combination of risk curve analysis and logistic regression 14.The empirically derived limits (gambling no more than two to three times per month, spendingno more than $501-$1000CAN per year or no more than 1% income on gambling) accuratelypredicted risk of gambling-related harm after controlling for other known risk factors. The limitswere replicated in a large integrated dataset of CPGI surveys from provincial prevalence studies.
12
We also demonstrated using longitudinal data that risk of harm changes over time in gamblerswho increase or reduce their level of gambling in relation to the low-risk limits. Specifically,data from the Leisure, Lifestyle, and Lifecycle Project (dataset described in method below)shows that individuals who shift from being low-risk to high risk gamblers from Time 1 to Time2 (~14 month interval) are more likely to report harm (defined as reporting at least 2 symptomsfrom the PGSI) compared to those who remain low-risk gamblers.15.
This project also convened a panel of leading gambling researchers in Canada and the US toreview the data and make recommendations. The panel concluded that limitations in the CPGIprevent additional development of low-risk gambling limits using existing population data.Specifically,
The concept of harm has not been satisfactorily defined in the context of gambling. Thepresent PGSI contains a narrow sample of potential harm, with most of the items beingcharacteristic of problematic gambling levels.
A limitation of the current scoring system is that the composite score (sum of ratings for allitems) assumes qualitative equivalency among the items. The total score fails to account forthe relative contribution of different items to the construct of problem gambling severity.
The shortcoming of the present scoring system could be corrected by the application of itemweights, or by varying the threshold on specific items that respondents need to endorse to berecognized as experiencing a harm.
Similar concerns have been voiced about other measures of problem gambling severity,including the DSM-IV 16 where each of the ten criteria receives equal weighting when scored,with five or more symptoms being the threshold for diagnosing pathological gambling. Therelative importance of each symptom is not considered despite the fact that some represent moresevere consequences of problem gambling (e.g., committing illegal acts) than others (e.g., feelingirritable when unable to gamble). Stinchfield and colleagues undertook a rigorous psychometricevaluation of the DSM-IV criteria for pathological gambling 17. Using a sample of community-dwelling recreational gamblers and gamblers in treatment, they tested the validity of individualcriteria and the cut-score of five for distinguishing problem from non-problem gamblers. Thediagnostic accuracy of the DSM-IV criteria was improved when the cut-off was lowered to four.The accuracy was further improved by using weights derived from discriminant function analysisto adjust the scoring of each criterion. These weights placed more importance on the symptomstrying to cut back on gambling, preoccupation with gambling, using gambling to escape or avoidproblems and chasing losses, as contributing to the determination of diagnosis.
PGSI and DSM-IV in the 2007 British Gambling Prevalence Survey. This study by Orford andcolleagues 18 is the most recent psychometric evaluation of the PGSI to be published. TheBritish Gambling Prevalence Survey was conducted in 2007 with a nationally representativerandom sample of community dwelling persons aged 16 years and older. The survey includedboth the PGSI and a DSM-IV-based scale thereby allowing for direct comparison of the twoinstruments. The DSM-IV scale employed a 4-point Likert scale similar to the PGSI. Focusingon the sample of 6161 past-year gamblers, the investigators examined internal reliability, itemresponse patterns, factor structure, and inter-scale agreement. The PGSI was found to havebetter internal reliability than the DSM-IV scale and fewer problems with differential itemendorsement along gender, age, and socioeconomic divisions. The factor structure of the PGSIwas superior to the DSM scale in terms of clarity and parsimony. The DSM scale, despite
13
having only 10 items, produced two factors that could roughly be labeled as dependence andconsequences. However, several items loaded equally on both scales suggesting thedimensionality of the DSM items is not clear. Furthermore, the DSM items had very low rates ofpositive endorsement compared to the PGSI items. The correlation between the PGSI and DSMscale was high, but the rate of agreement in identifying problem gamblers was only modest.
This study is important because it represents the most comprehensive psychometric evaluation ofthe PGSI that is published in a peer-reviewed journal. However, the study also has numerouslimitations in the method that we take steps to improve upon in the present report. Foremost, theinvestigators employ a very superficial item response analysis based on descriptive statistics andvisual inspection of the frequency of endorsement across the PGSI categories. The factoranalytic approach in the study relied exclusively on exploratory methods. In the present report,we substantially improve on these methods, using Rasch modeling to conduct the item analysisand confirmatory factor analysis to examine the PGSI factor structure. Moreover, the datasetsavailable to our team were by far the largest ever used in a population level analysis of thepsychometric properties of the PGSI.
Present study objectives
The specific aims of the present study are to (1) assess the validity of the present PGSI severityclassifications and cut-off scores for the non-problem gamblers, low-risk, moderate-risk andproblem gamblers groups using cross-sectional and longitudinal population data; (2) assess theimpact of re-calibrating the PGSI scoring rules on the reliability and external validity of PGSIseverity categories; (3) assess the factor structure of the PGSI with newly acquired populationdata; (4) model the continuum of gambling problems as assessed by the PGSI total score withitem response theory (IRT) and identify sources of differential responding across demographicand game type subgroups, and; (5) determine if weights are justified for the PGSI items torecalibrate the scoring and assignment to severity categories.
Section 2
Overall Approach
Data sources
CPGI integrated dataset. The CPGI integrated dataset was provided to the investigators for aprevious project funded by the Ontario Problem Gambling Research Centre. 13 It includes datafrom prevalence surveys conducted in Alberta (AB; N = 1,461)19, British Columbia (BC; N =3086)20, Ontario (ON; two cycles 2001; N = 3,764 [21] and 2005; N = 2,252 22), Manitoba (MB;N = 578)23, Newfoundland (NF; N = 2,152)24 and the National CPGI validation study 8 for a totalsample size of 21,374. Each survey employed a similar methodology. Namely, the data werecollected via a computer-assisted telephone interviewing system. Samples were stratified byregional boundaries, age, and gender. Random digit dialing was used to select cases at thehousehold level and the adult resident (minimum age = 18 years) with the most recent birthdaywas selected to be interviewed. The prevalence of problem gambling (PGSI > 8) ranged from0.4% in BC to 1.3% in AB. The Alberta survey, typical of most of the provincial CPGI surveys,is provided in Appendix A. Detailed comparisons of the provincial surveys in terms ofdemographic, gambling habit and ancillary questions are provided in Appendices B and C.
In addition to the CPGI, the integrated dataset contains information on participant characteristics,involvement in gambling activities, and, in some surveys, limited data on health and mental
14
health status. In terms of gambling involvement, information was collected on types ofgambling, frequency of play, and amount spent on gambling activities in the last year. Inprevious research, percent of income spent on all gambling activities has shown the strongestrelationship with level of risk as measured by the PGSI 13 25 and related instruments like theSOGS26.
Canadian Community Health Survey – Mental Health Well-being (CCHS-1.2). Detaileddescriptions of the CCHS-1.2 in terms of target population, sampling procedures, response rateand psychiatric assessment are in other sources 27;28. Briefly, the CCHS-1.2 was a cross-sectionalsurvey of a nationally representative sample of individuals aged 15 and older. The CCHS-1.2data were collected by Statistics Canada between May and December 2002 (N=36,984). ValidPGSI data for past year gamblers is available for 18913 cases. Gambling was assessed using theCPGI (Ferris & Wynne, 2001). In addition, the CCHS-1.2 provided data on 12-monthprevalence of mood disorders (major depression, bipolar disorder, and dysthymia, anxietydisorders (panic disorder, obsessive-compulsive disorder, social anxiety, phobias), and substanceuse disorders (alcohol and drug). All disorders were based on a Canadian adaptation of theWorld Mental Health version of the Composite International Diagnostic Interview (WMH-CIDI;13). The CCHS-1.2 also collected information on self-reported health status (1=excellent to 5 =poor), self-reported stress (1= no stress to 5 = extreme stress), and psychological well-being (0 to100 with higher values indicating better psychological well-being). The psychological well-being scale is a composite score based on the sum of participants’ responses to 25 items 29.Sample items include “During the past month, you felt self-confident” and “felt satisfied withaccomplishments.” Information on the CCHS-1.2 gambling module and mental health measuresis provided in Appendix D.
Leisure, Lifestyle, and Lifecycle Project (LLLP). This longitudinal study is described in detail inanother source 30. Briefly, the LLLP is a prospective cohort study of 1808 adolescents and adultsliving in rural and urban Alberta. Individuals in five age cohorts range from 13 to 65 years arebeing followed for five years using a combination of telephone, web-based, and in-person datacollection. The study began in 2006 and is ongoing. The data collected at each wave (separatedby approximately 18 month intervals) include a rich set of psychological, behavioural, medical,and social variables used to examine the etiology and natural progression of both recreationaland problematic gambling. Random digit dialing (RDD) was used to recruit participants fromthe general population sample (n=1284) with approximately equal numbers in each of the fiveage cohorts: (13-15, 18–20, 23–25, 43–45, and 63–65 year olds). A second wave of RDDsampling was used to recruit ‘at-risk’ gamblers (n=524) who were at or above the 70th percentilein either gambling expenditure or gambling frequency based on provincial normative data. Theintent of the ‘at-risk’ sample was to increase the yield of individuals who may be experiencing orlikely to develop gambling problems during the course of this longitudinal study. The presentstudy uses data from time 1 and 2.
Inclusion and exclusion criteria used in all studies
All analyses were restricted to individuals who a) 18 years and older; b) reporting gambling atleast once in the past year, and; c) were administered the PGSI items. Individuals who reportedno gambling activity in the past year were excluded. Each substudy used data from one or moreof these datasets. For the factor analysis and latent trait modeling, we merged the CPGIintegrated and CCHS-1.2 datasets to maximize the sample size.
15
General analysis plan
Gambling variables common to all datasets and analyses are shown in Table 2.1. The CPGIIntegrated dataset and CCHS-1.2 were merged into one file for many analyses. Both the CPGIintegrated datasets contain sampling weights, to adjust for age and gender biases. However, themethods used to weight cases were different hence it was not possible to utilize the samplingweights in analyses of the merged data from these datasets. For some analyses, the use of theindividual datasets was better justified because the results were clearer and more interpretable.The LLLP dataset was reserved for analyses involving longitudinal data. In consideration of thenumber of statistical tests performed we adopted a more conservative criteria for significance (p< .01) to guard against Type I error.
Table 2.1.The main gambling variables that were common across the datasets used in this project.Term Definition
Dollars spent on gambling Amount of money spent on games of chance in a typical month.
Percent income Dollars spent on gambling per year divided by gross household income (range0% to 100%). In cases where expenditure on gambling exceeded householdincome, the value for percent of income was winsorized to 100%.
Frequency of gambling CPGI categories: Daily; 2 to 6 times a week; once a week; 2 to 3 times amonth; once a month; 6 to 11 times year; 1 to 5 times a year.
Number of gamblingactivities
Total number of game types played at least once in the last 12 months to amaximum of 8.
Type of gambler Two groups formed: (1) EGM/casino gambler were persons who reportedplaying electronic gaming machines (VLTs or slot machines) or casinogames; (2) Other consisted of individuals who reported any other type ofgambling other than EGMs or casino games. Research has shown thatelectronic gaming machines (video lottery terminals and slot machines) andcasino gambling have a greater risk of harm and addiction compared to otherforms of gambling 31;32
Section 3
Assessing the Reliability and Validity of Current PGSI Severity Categories
Study 1 – PGSI Severity Categories Based on Original Scoring
Objectives
The intent of this set of analyses was to assess the external validity of the PGSI by determining ifthe four subtypes of gamblers that are defined based on current PGSI scoring rules (i.e., nonproblem, low-risk, moderate-risk, and problem gamblers) represent meaningful and distinctsubpopulations of gamblers. Specifically, we compared the PGSI category groupings on thefollowing key variables: (1) age, gender, marital status, and gross household income; (2)intensity of gambling involvement (frequency, total expenditures, percent of income spent on
16
gambling, total number of different games played); (3) types of games played at least 2-3 timesper month, and: (4) frequency of other addictive behaviours and mental health concerns reported.
Method
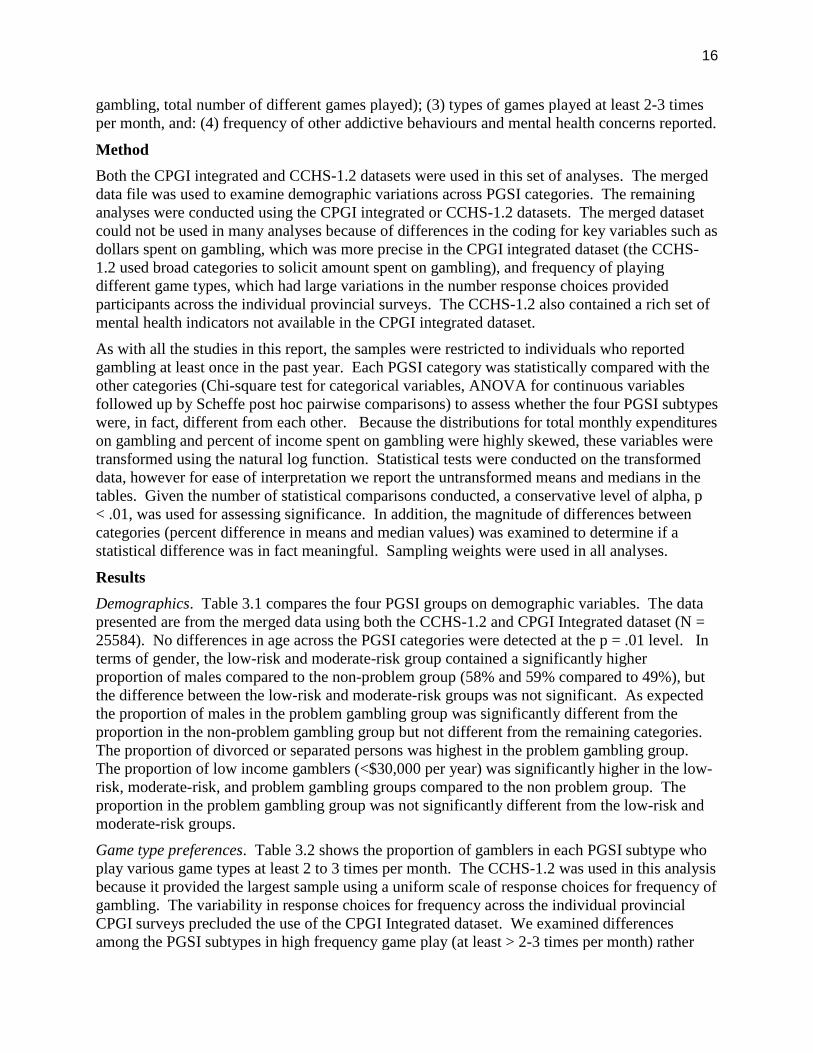
Both the CPGI integrated and CCHS-1.2 datasets were used in this set of analyses. The mergeddata file was used to examine demographic variations across PGSI categories. The remaininganalyses were conducted using the CPGI integrated or CCHS-1.2 datasets. The merged datasetcould not be used in many analyses because of differences in the coding for key variables such asdollars spent on gambling, which was more precise in the CPGI integrated dataset (the CCHS-1.2 used broad categories to solicit amount spent on gambling), and frequency of playingdifferent game types, which had large variations in the number response choices providedparticipants across the individual provincial surveys. The CCHS-1.2 also contained a rich set ofmental health indicators not available in the CPGI integrated dataset.
As with all the studies in this report, the samples were restricted to individuals who reportedgambling at least once in the past year. Each PGSI category was statistically compared with theother categories (Chi-square test for categorical variables, ANOVA for continuous variablesfollowed up by Scheffe post hoc pairwise comparisons) to assess whether the four PGSI subtypeswere, in fact, different from each other. Because the distributions for total monthly expenditureson gambling and percent of income spent on gambling were highly skewed, these variables weretransformed using the natural log function. Statistical tests were conducted on the transformeddata, however for ease of interpretation we report the untransformed means and medians in thetables. Given the number of statistical comparisons conducted, a conservative level of alpha, p< .01, was used for assessing significance. In addition, the magnitude of differences betweencategories (percent difference in means and median values) was examined to determine if astatistical difference was in fact meaningful. Sampling weights were used in all analyses.
Results
Demographics. Table 3.1 compares the four PGSI groups on demographic variables. The datapresented are from the merged data using both the CCHS-1.2 and CPGI Integrated dataset (N =25584). No differences in age across the PGSI categories were detected at the p = .01 level. Interms of gender, the low-risk and moderate-risk group contained a significantly higherproportion of males compared to the non-problem group (58% and 59% compared to 49%), butthe difference between the low-risk and moderate-risk groups was not significant. As expectedthe proportion of males in the problem gambling group was significantly different from theproportion in the non-problem gambling group but not different from the remaining categories.The proportion of divorced or separated persons was highest in the problem gambling group.The proportion of low income gamblers (<$30,000 per year) was significantly higher in the low-risk, moderate-risk, and problem gambling groups compared to the non problem group. Theproportion in the problem gambling group was not significantly different from the low-risk andmoderate-risk groups.
Game type preferences. Table 3.2 shows the proportion of gamblers in each PGSI subtype whoplay various game types at least 2 to 3 times per month. The CCHS-1.2 was used in this analysisbecause it provided the largest sample using a uniform scale of response choices for frequency ofgambling. The variability in response choices for frequency across the individual provincialCPGI surveys precluded the use of the CPGI Integrated dataset. We examined differencesamong the PGSI subtypes in high frequency game play (at least > 2-3 times per month) rather
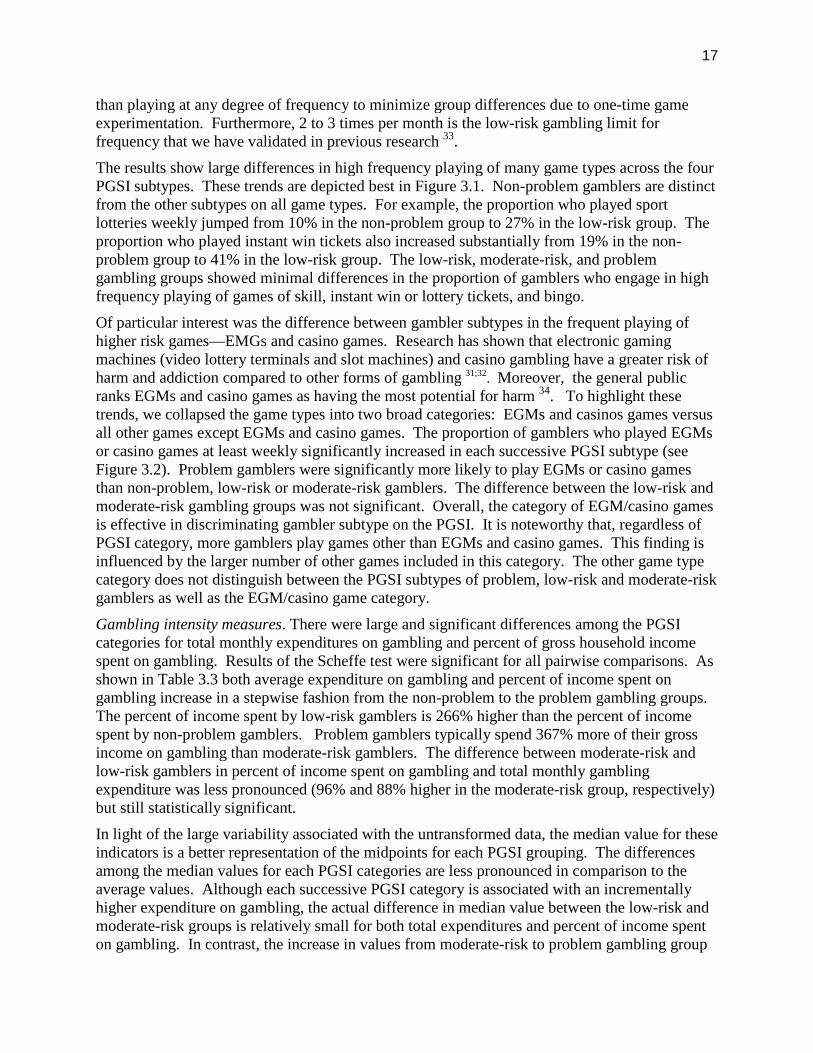
17
than playing at any degree of frequency to minimize group differences due to one-time gameexperimentation. Furthermore, 2 to 3 times per month is the low-risk gambling limit forfrequency that we have validated in previous research 33.
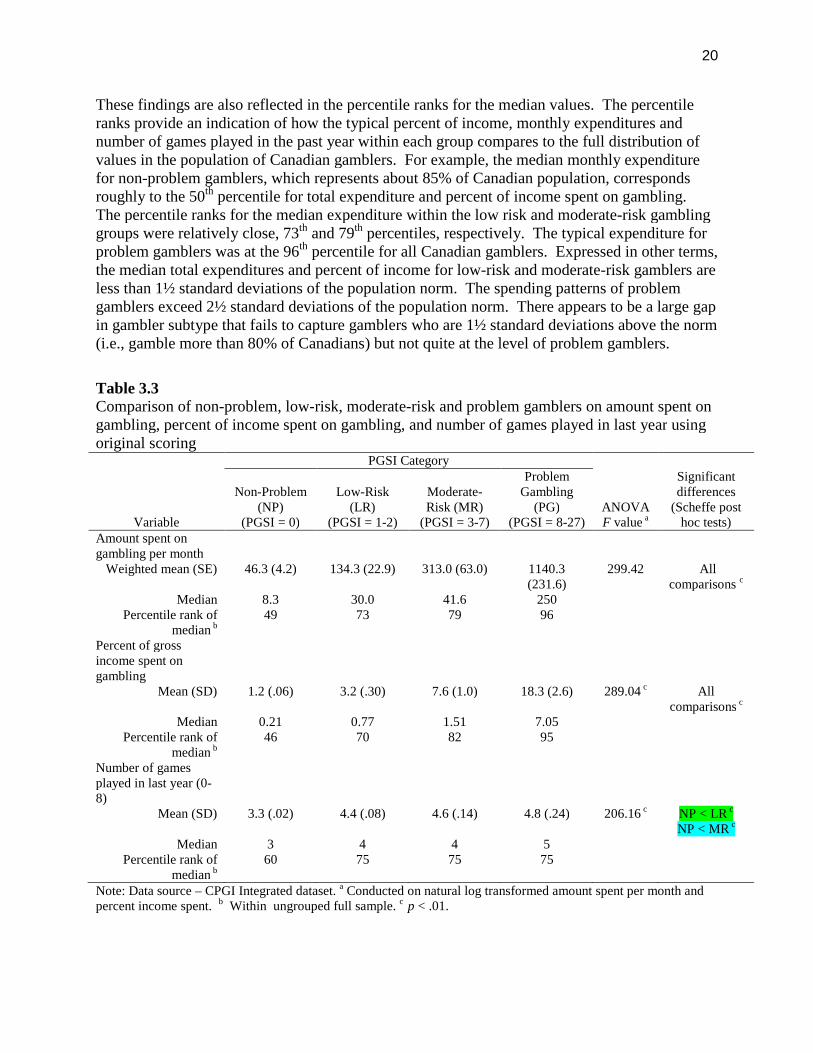
The results show large differences in high frequency playing of many game types across the fourPGSI subtypes. These trends are depicted best in Figure 3.1. Non-problem gamblers are distinctfrom the other subtypes on all game types. For example, the proportion who played sportlotteries weekly jumped from 10% in the non-problem group to 27% in the low-risk group. Theproportion who played instant win tickets also increased substantially from 19% in the non-problem group to 41% in the low-risk group. The low-risk, moderate-risk, and problemgambling groups showed minimal differences in the proportion of gamblers who engage in highfrequency playing of games of skill, instant win or lottery tickets, and bingo.
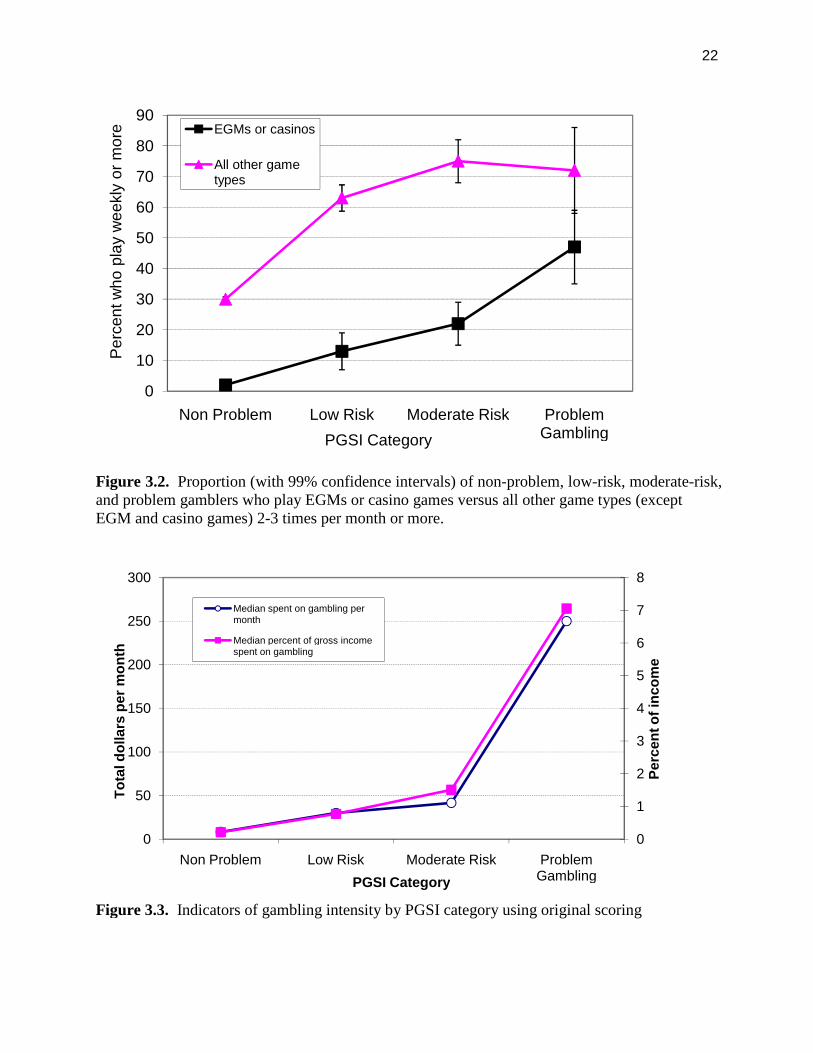
Of particular interest was the difference between gambler subtypes in the frequent playing ofhigher risk games—EMGs and casino games. Research has shown that electronic gamingmachines (video lottery terminals and slot machines) and casino gambling have a greater risk ofharm and addiction compared to other forms of gambling 31;32. Moreover, the general publicranks EGMs and casino games as having the most potential for harm 34. To highlight thesetrends, we collapsed the game types into two broad categories: EGMs and casinos games versusall other games except EGMs and casino games. The proportion of gamblers who played EGMsor casino games at least weekly significantly increased in each successive PGSI subtype (seeFigure 3.2). Problem gamblers were significantly more likely to play EGMs or casino gamesthan non-problem, low-risk or moderate-risk gamblers. The difference between the low-risk andmoderate-risk gambling groups was not significant. Overall, the category of EGM/casino gamesis effective in discriminating gambler subtype on the PGSI. It is noteworthy that, regardless ofPGSI category, more gamblers play games other than EGMs and casino games. This finding isinfluenced by the larger number of other games included in this category. The other game typecategory does not distinguish between the PGSI subtypes of problem, low-risk and moderate-riskgamblers as well as the EGM/casino game category.
Gambling intensity measures. There were large and significant differences among the PGSIcategories for total monthly expenditures on gambling and percent of gross household incomespent on gambling. Results of the Scheffe test were significant for all pairwise comparisons. Asshown in Table 3.3 both average expenditure on gambling and percent of income spent ongambling increase in a stepwise fashion from the non-problem to the problem gambling groups.The percent of income spent by low-risk gamblers is 266% higher than the percent of incomespent by non-problem gamblers. Problem gamblers typically spend 367% more of their grossincome on gambling than moderate-risk gamblers. The difference between moderate-risk andlow-risk gamblers in percent of income spent on gambling and total monthly gamblingexpenditure was less pronounced (96% and 88% higher in the moderate-risk group, respectively)but still statistically significant.
In light of the large variability associated with the untransformed data, the median value for theseindicators is a better representation of the midpoints for each PGSI grouping. The differencesamong the median values for each PGSI categories are less pronounced in comparison to theaverage values. Although each successive PGSI category is associated with an incrementallyhigher expenditure on gambling, the actual difference in median value between the low-risk andmoderate-risk groups is relatively small for both total expenditures and percent of income spenton gambling. In contrast, the increase in values from moderate-risk to problem gambling group
18
is very large. Figure 3.3 shows this trend graphically. This figure suggests a large gap existsbetween gamblers labelled as moderate-risk and gamblers labelling as problem gamblers.
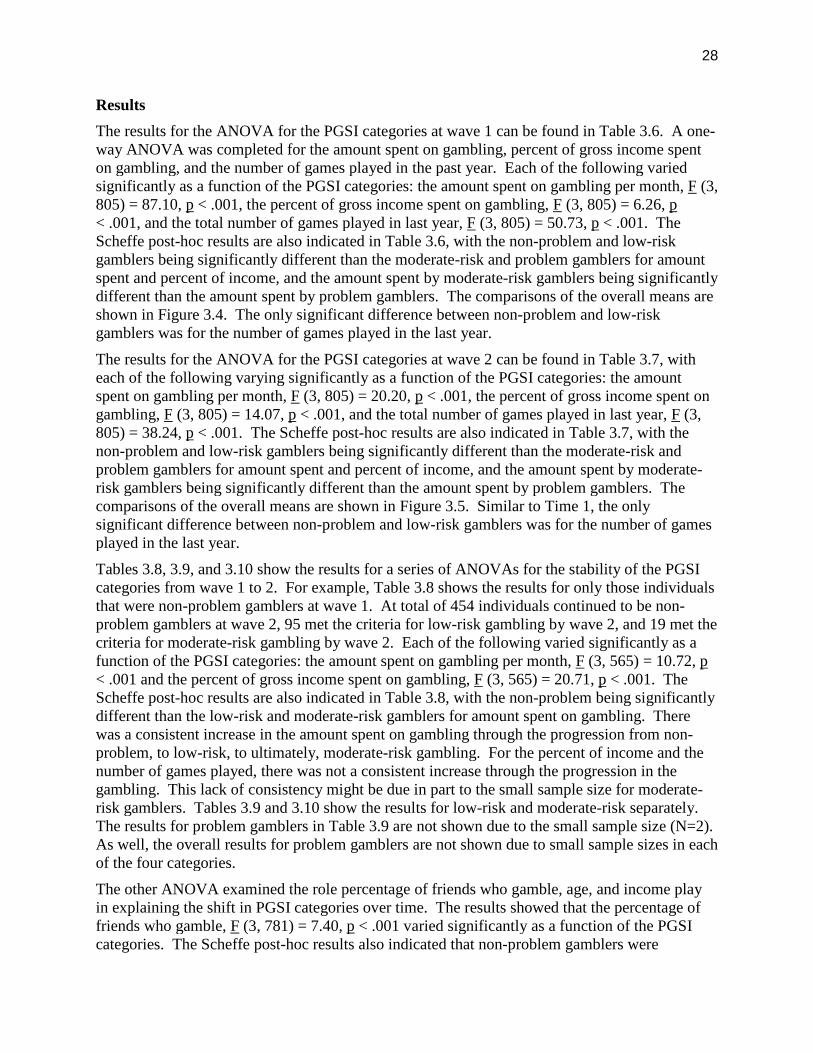
Table 3.1Comparison of non-problem, low-risk, moderate-risk and problem gamblers on demographicvariables using original PGSI scoring
Variable
PGSI Category
Significantdifferences
Non-Problem(NP)
(PGSI = 0)
Low-Risk(LR)
(PGSI = 1-2)
Moderate-Risk (MR)
(PGSI = 3-7)
ProblemGambling
(PG)(PGSI = 8-27)
N 21,597 2,513 1,106 368Age
15-19 years 2.4 7.4 7.0 3.7
NoDifferences
20-29 years 17.0 27.6 28.4 28.430-44 years 33.1 33.0 32.3 36.445-64 years 33.9 23.4 23.2 28.2
65+ years 13.6 8.7 9.2 3.4Gender, % male 49.0 58.3 59.0 63.8 LR>NP a
MR>NP a
PG>NP a
Household income< $30K 19.8 25.6 31.5 30.6 LR>NP a
MR>NP a
PG>NP a
$30K – 49999 24.8 25.2 21.9 22.7 NoDifferences
$50K+ 55.4 49.1 46.6 46.7 LR>NP a
MR>NP a
Marital statusMarried/common-law 64.4 50.1 47.2 50.3 LR>NP a
MR>NP a
PG>NP a
Single 15.2 14.5 16.1 16.0 NoDifferences
Divorced/separated/widow 20.4 35.5 36.7 33.7 LR>NP a
MR>NP a
PG>NP a
Note: Data source – CPGI and CCHS-1.2 merged datafile; a p < .01.
19
Table 3.2Proportion of non-problem, low-risk, moderate-risk and problem gamblers that gamble at least 2-3 times/month using original PGSI scoring
Type of gambling
PGSI Category
Significantdifferences
Non-Problem(NP)
(PGSI = 0)Low-Risk (LR)
(PGSI = 1-2)
Moderate-Risk(MR)
(PGSI = 3-7)
ProblemGambling (PG)(PGSI = 8-27)
N 12,160 1,496 564 168Sports lotteries 10% 27% 37% 28% NP < LR a
NP < MR a
VLT inside of casino 2% 8% 9% 16% NP < LR a
NP < MR a
NP < PG a
VLT outside of casino 6% 14% 25% 61% NP < MR a
NP < PG a
LR < PG a
MR < PG a
Other casino games 1% 8% 9% 45% NP < MR a
NP < PG a
LR < PG a
MR < PG a
Instant Win Tickets 19% 41% 47% 49% NP < LR a
NP < MR a
NP < PG a
Lottery Tickets 30% 54% 53% 53% NP < LR a
NP < MR a
NP < PG a
Card Games 9% 14% 24% 20% NP < MR a
Horse Racing 3% 12% 10% 14% No differences
Games of Skill 10% 23% 26% 12% No differences
Bingo 19% 36% 30% 32% NP < LR a
Other forms of gambling 9% 14% 19% 27% No differences
EGM or any casino games 2% 13% 21% 47% NP < LR a
NP < MR a
NP < PG a
MR < PG a
All other types ofgambling
30% 63% 75% 72% NP < LR a
NP < MR a
NP < PG a
Note: Data source – CCHS-1.2; coding for frequency of gambling - 0 = < 2-3 times/month; 1 = > 2-3 times/month.a p < .01.
20
These findings are also reflected in the percentile ranks for the median values. The percentileranks provide an indication of how the typical percent of income, monthly expenditures andnumber of games played in the past year within each group compares to the full distribution ofvalues in the population of Canadian gamblers. For example, the median monthly expenditurefor non-problem gamblers, which represents about 85% of Canadian population, correspondsroughly to the 50th percentile for total expenditure and percent of income spent on gambling.The percentile ranks for the median expenditure within the low risk and moderate-risk gamblinggroups were relatively close, 73th and 79th percentiles, respectively. The typical expenditure forproblem gamblers was at the 96th percentile for all Canadian gamblers. Expressed in other terms,the median total expenditures and percent of income for low-risk and moderate-risk gamblers areless than 1½ standard deviations of the population norm. The spending patterns of problemgamblers exceed 2½ standard deviations of the population norm. There appears to be a large gapin gambler subtype that fails to capture gamblers who are 1½ standard deviations above the norm(i.e., gamble more than 80% of Canadians) but not quite at the level of problem gamblers.
Table 3.3Comparison of non-problem, low-risk, moderate-risk and problem gamblers on amount spent ongambling, percent of income spent on gambling, and number of games played in last year usingoriginal scoring
Variable
PGSI Category
ANOVAF value a
Significantdifferences
(Scheffe posthoc tests)
Non-Problem(NP)
(PGSI = 0)
Low-Risk(LR)
(PGSI = 1-2)
Moderate-Risk (MR)
(PGSI = 3-7)
ProblemGambling
(PG)(PGSI = 8-27)
Amount spent ongambling per month
Weighted mean (SE) 46.3 (4.2) 134.3 (22.9) 313.0 (63.0) 1140.3(231.6)
299.42 Allcomparisons c
Median 8.3 30.0 41.6 250Percentile rank of
median b49 73 79 96
Percent of grossincome spent ongambling
Mean (SD) 1.2 (.06) 3.2 (.30) 7.6 (1.0) 18.3 (2.6) 289.04 c Allcomparisons c
Median 0.21 0.77 1.51 7.05Percentile rank of
median b46 70 82 95
Number of gamesplayed in last year (0-8)
Mean (SD) 3.3 (.02) 4.4 (.08) 4.6 (.14) 4.8 (.24) 206.16 c NP < LR c
NP < MR c
Median 3 4 4 5Percentile rank of
median b60 75 75 75
Note: Data source – CPGI Integrated dataset. a Conducted on natural log transformed amount spent per month andpercent income spent. b Within ungrouped full sample. c p < .01.
21
Figure 3.1. Proportion of non-problem, low-risk, moderate-risk, and problem gamblers whoplay different game types 2-3 times per month or more.
For number of games played in the last year, the difference among the four PGSI subtypes wasalso highly significant. With this indicator, the source of variability was the difference betweenthe non-problem group and the low-risk and moderate-risk subtypes (p < .01 for Scheffe pairwisecomparisons). There was little difference in number of games played in the last year among thelow-risk, moderate-risk, and problem gambling groups. For example, low-risk and problemgamblers only differed by 0.4 games. As a quantitative indicator of gambling intensity, numberof games played does not appear to discriminate among PGSI categories to the same degree astotal expenditures and percent of income.
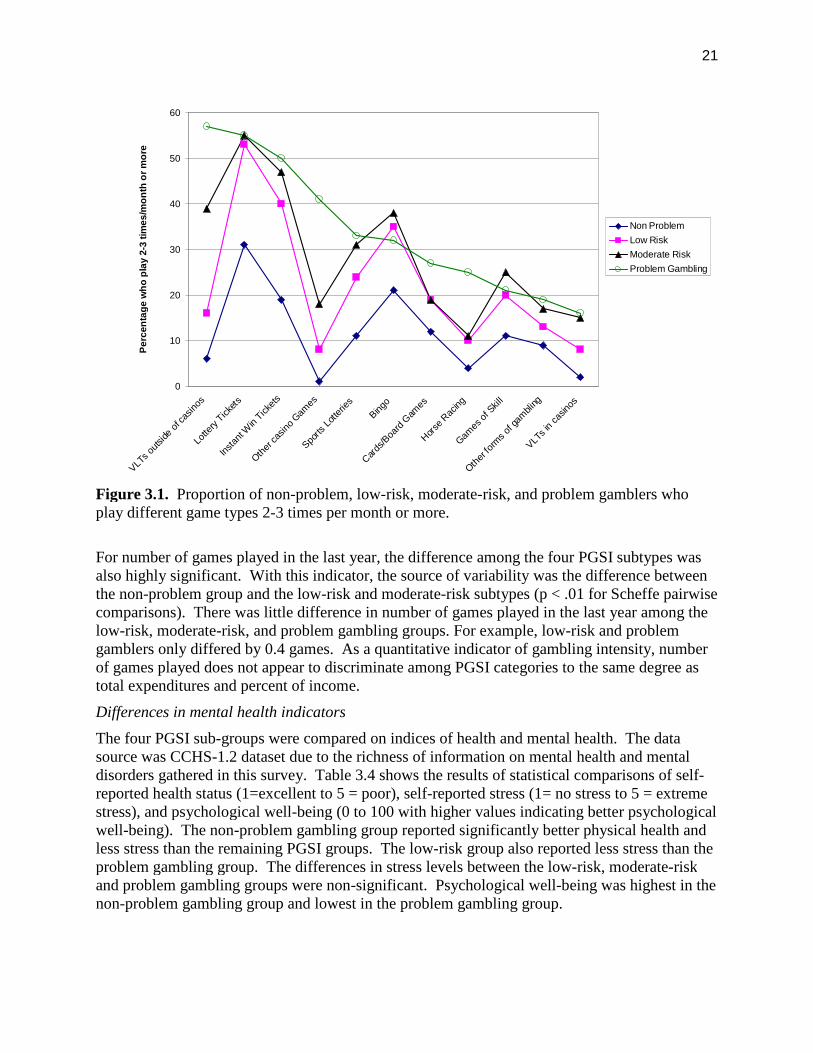
Differences in mental health indicators
The four PGSI sub-groups were compared on indices of health and mental health. The datasource was CCHS-1.2 dataset due to the richness of information on mental health and mentaldisorders gathered in this survey. Table 3.4 shows the results of statistical comparisons of self-reported health status (1=excellent to 5 = poor), self-reported stress (1= no stress to 5 = extremestress), and psychological well-being (0 to 100 with higher values indicating better psychologicalwell-being). The non-problem gambling group reported significantly better physical health andless stress than the remaining PGSI groups. The low-risk group also reported less stress than theproblem gambling group. The differences in stress levels between the low-risk, moderate-riskand problem gambling groups were non-significant. Psychological well-being was highest in thenon-problem gambling group and lowest in the problem gambling group.
0
10
20
30
40
50
60
VLT
sou
tside
ofca
sino
s
Lotte
ryTic
kets
Inst
ant W
inTic
kets
Oth
erca
sino
Gam
es
Sports
Lotte
ries
Bingo
Car
ds/B
oard
Gam
es
Hor
seRac
ing
Gam
esof
Skill
Oth
erfo
rms
ofga
mbling
VLTs
inca
sinos
Pe
rcen
tag
ew
ho
pla
y2-3
tim
es
/mo
nth
or
mo
re
Non Problem
Low Risk
Moderate Risk
Problem Gambling
22
Figure 3.2. Proportion (with 99% confidence intervals) of non-problem, low-risk, moderate-risk,and problem gamblers who play EGMs or casino games versus all other game types (exceptEGM and casino games) 2-3 times per month or more.
Figure 3.3. Indicators of gambling intensity by PGSI category using original scoring
0
10
20
30
40
50
60
70
80
90
Non Problem Low Risk Moderate Risk ProblemGambling
Pe
rce
ntw
ho
pla
yw
ee
kly
or
mo
re
PGSI Category
EGMs or casinos
All other gametypes
0
1
2
3
4
5
6
7
8
0
50
100
150
200
250
300
Non Problem Low Risk Moderate Risk ProblemGambling
Pe
rce
nt
of
inc
om
e
To
tald
olla
rsp
er
mo
nth
PGSI Category
Median spent on gambling permonth
Median percent of gross incomespent on gambling
23
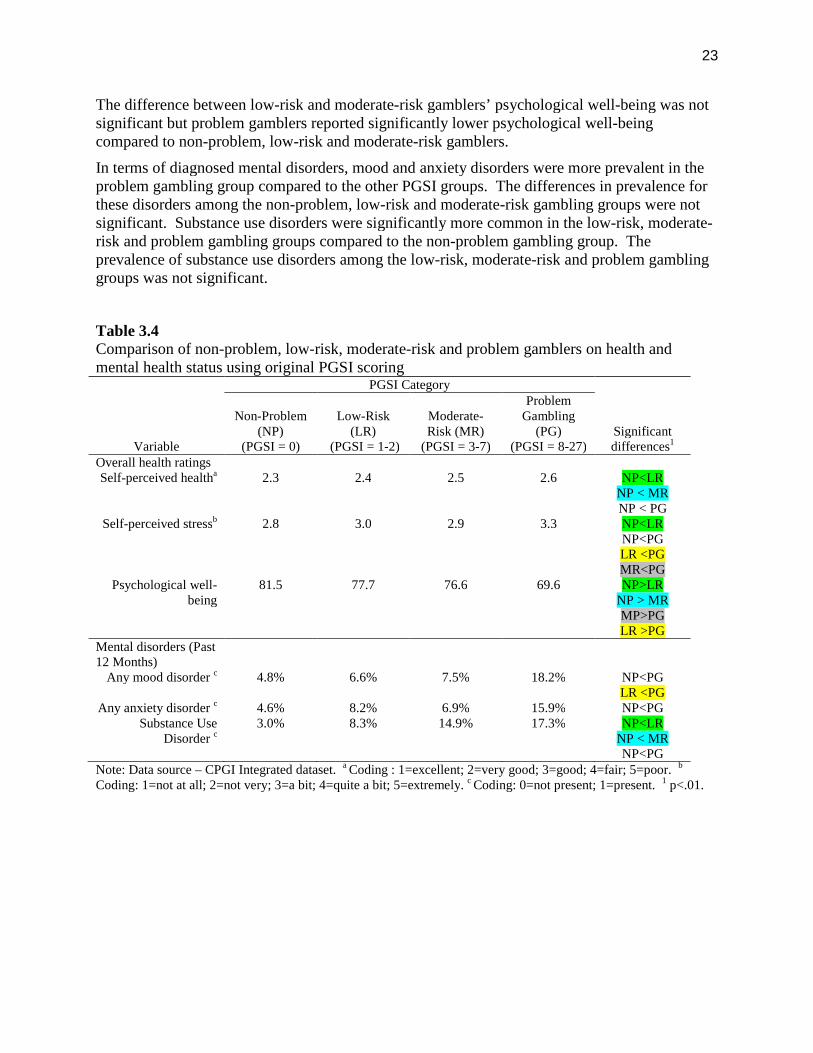
The difference between low-risk and moderate-risk gamblers’ psychological well-being was notsignificant but problem gamblers reported significantly lower psychological well-beingcompared to non-problem, low-risk and moderate-risk gamblers.
In terms of diagnosed mental disorders, mood and anxiety disorders were more prevalent in theproblem gambling group compared to the other PGSI groups. The differences in prevalence forthese disorders among the non-problem, low-risk and moderate-risk gambling groups were notsignificant. Substance use disorders were significantly more common in the low-risk, moderate-risk and problem gambling groups compared to the non-problem gambling group. Theprevalence of substance use disorders among the low-risk, moderate-risk and problem gamblinggroups was not significant.
Table 3.4Comparison of non-problem, low-risk, moderate-risk and problem gamblers on health andmental health status using original PGSI scoring
Variable
PGSI Category
Significantdifferences1
Non-Problem(NP)
(PGSI = 0)
Low-Risk(LR)
(PGSI = 1-2)
Moderate-Risk (MR)
(PGSI = 3-7)
ProblemGambling
(PG)(PGSI = 8-27)
Overall health ratingsSelf-perceived healtha 2.3 2.4 2.5 2.6 NP<LR
NP < MRNP < PG
Self-perceived stressb 2.8 3.0 2.9 3.3 NP<LRNP<PGLR <PGMR<PG
Psychological well-being
81.5 77.7 76.6 69.6 NP>LRNP > MRMP>PGLR >PG
Mental disorders (Past12 Months)
Any mood disorder c 4.8% 6.6% 7.5% 18.2% NP<PGLR <PG
Any anxiety disorder c 4.6% 8.2% 6.9% 15.9% NP<PGSubstance Use
Disorder c3.0% 8.3% 14.9% 17.3% NP<LR
NP < MRNP<PG
Note: Data source – CPGI Integrated dataset. a Coding : 1=excellent; 2=very good; 3=good; 4=fair; 5=poor. b
Coding: 1=not at all; 2=not very; 3=a bit; 4=quite a bit; 5=extremely. c Coding: 0=not present; 1=present. 1 p<.01.
24
Discussion
Our analysis of the PGSI-defined gambler subtypes can be summarized with the followingconclusions:
1) The problem gambler category (PGSI > 7) appears to be a distinct group of gamblers on alldimensions. Differences between this category and the remaining PGSI subtypes werestatistically significant at the p = .01 level on nearly every dimension examined includingdemographics, game type preferences, indicators of gambling intensity and prevalence ofother mental health concerns. Moreover, the differences between this category and closestadjacent category, moderate-risk gamblers, were large enough to be considered clinicallymeaningful on many key dimensions. This is not surprising given the extensive validationwork completed by the PGSI development team to establish this category.
2) The non-problem category (PGSI = 0) also appears to be a distinct group of gamblers onmost dimensions. Differences between this category and the low-risk, moderate-risk, andproblem gambler subtypes were statistically significant. Differences between non-problemgamblers and the remaining categories were clinically meaningful for measures of gamblingintensity and game preferences. It is fitting that expenditures for gamblers in this categorywere at the 50th percentile for the population. Non-problem gamblers, according to currentPGSI scoring rules, comprise about 85% of the Canadian population of past-year gamblers.Hence, this group represents the typical, normative Canadian gambler.
3) Differences between the low-risk and moderate-risk PGSI subtypes were not statisticallysignificant for most of the dimensions analyzed. For example, these groups aredemographically similar and play many game types at the same level of frequency. Therewas no difference in the proportion who play EGMs or casino games at least 2 -3 times perweek. There was no difference between these groups in measures of stress, well-being, orprevalence of mental health problems. The groups did show statistically significantdifferences in gambling expenditures. For example, the median proportion of income spenton gambling by moderate-risk gamblers is double the median amount spent by low-riskgamblers. The median percent of income spent by moderate-risk gamblers exceeds 82% ofthe Canadian population while low-risk gamblers exceed 70% of the population. However,the relative difference between low and moderate-risk gamblers was not as large as otheradjacent PGSI categories. One option is to merge these categories into a single PGSI subtypeof ‘low-risk gamblers.’ The PGSI score could be used as a quantitative index of degree ofrisk that ranges from 1 to 7.
4) The difference between moderate-risk gamblers and problem gamblers is very large onnearly all dimensions, most notably in gambling expenditures. This calls into questionresearch studies that merge these categories under the single subtype of problem gamblers.Our data suggest these are distinct subtypes of gamblers and merging is not justified. Figure3.1 suggests rescoring of the PGSI is needed to create a subtype just below the problemgambling category that better captures the continuum of risk that the total PGSI score isintended to represent. In essence, rescoring could change the inverted L-shape of the curvein Figure 3.1 to a linear trend. On the other hand, researchers and clinicians may value thedistinctive nature of the present problem gambling category. Given one of the main purposesof the PGSI is to screen for problem gamblers, there are advantages to maintaining the largegap between this and the adjacent category of moderate-risk.
25
Study 2 – Temporal Stability of the original PGSI Classifications in Adults
Objectives
The objective here was to use the LLLP dataset to examine the temporal stability of theoriginal PGSI classifications in a sample of adults who were at least 18 years of age at wave1. In particular, we wanted to examine if comparable levels of gambling among a sample ofadults would lead to stability of their PGSI score and category over time. We hypothesizedthat the reliability of the PGSI categories would directly correspond to the range of possiblescores, with the non-problem and low-risk gamblers showing the most instability over time.Finally, this section also provided the opportunity to complete a preliminary validity check ofthe PGSI severity classifications and the cut-off scores for each category (non-gamblers, non-problem gamblers, low-risk, moderate-risk and problem gamblers) using a longitudinalpopulation data.
Method
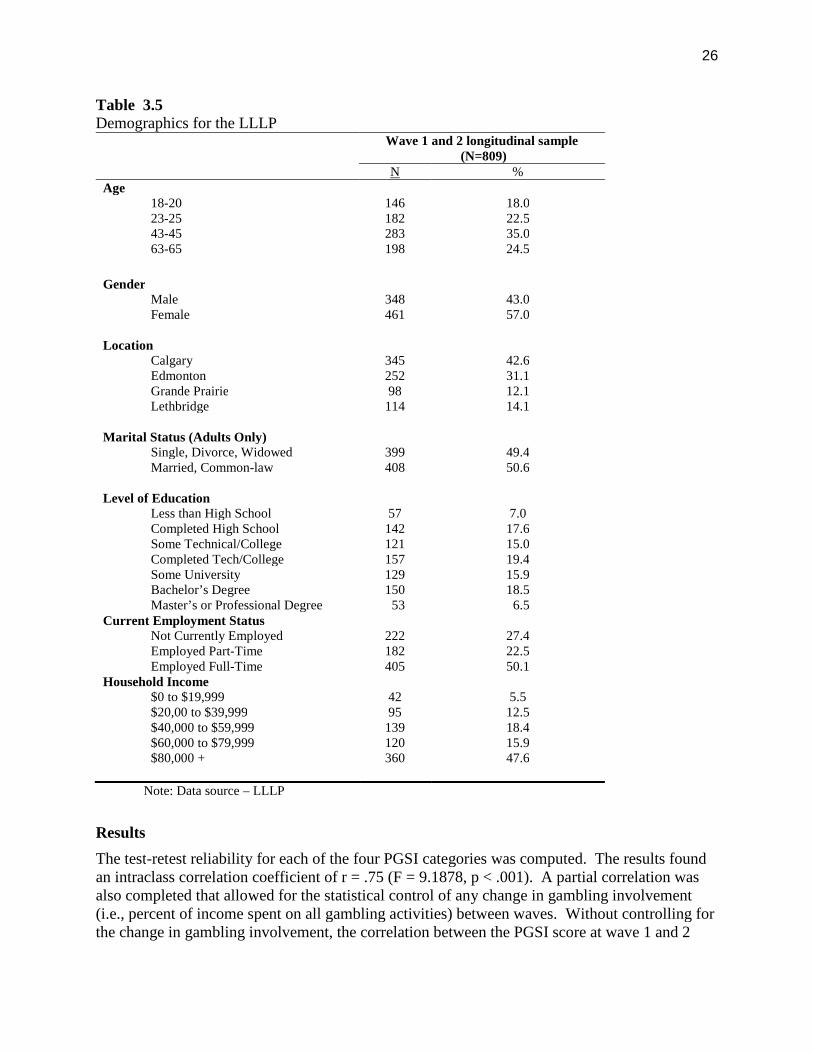
A summary of the LLLP was presented earlier and a more detailed description of the LLLP isavailable elsewhere 30. The analysis that was completed here was limited to those adults that hadparticipated in a least one gambling activity at both wave 1 and wave 2 of the LLLP (N=809).This facilitated an analysis on individuals where we had complete information regarding theirgambling behavior during the first two data collections. Table 3.5 shows the demographiccharacteristics at wave 1 for these 809 participants included in this analysis.
Survey weights and bootstrap weights were developed for the LLLP to compensate both for thecomplex sampling design, and for the differences between the sampling plan and the collectedsample. It was felt that these weights would allow for more accurate estimates of populationprevalence of relevant aspects of gambling behavior. It is important to note however, that theseweights were not used in the present analysis. It was deemed unreliable to use these weights onthe subsample of 809 individuals, since the weights were calculated based on the total sample of1808 adults and adolescents.
In this section, there were a number of statistical analyses that were completed. First, anintraclass correlation coefficient (ICC) was calculated to examine the temporal reliability of theoriginal PGSI measured at wave 1 and 2 in the LLLP. The ICC is an effective measure of thereliability of measurements or ratings over time. Second, partial correlations were completed totry and identify the role that the change in proportion of income spent on gambling played inchanges in the relationship between the PGSI scores over time. Partial correlations allowed forthe examination of the relationship between two variables while controlling for percentage ofincome spent on all gambling activities. Finally, a reliable change index was calculated 35 as away of capturing the natural change in PGSI scores over time. Using the PGSI’s published test-retest reliability coefficient of 0.78, the reliable change index provided a statistical method ofdetermining if the observed change is beyond the limits of chance variation, given the reliabilityof the assessment instrument. The original scoring system for the PGSI would be seen to haveflaws if more than 25% of the LLLP participants shift PGSI categories between wave 1 and 2without a corresponding increase in their gambling involvement. The reliable change index wascalculated using the Jacobson et al technique 35 as a way to measure this change over time. Thedata analysis was completed using PSAW 17.0.
26
Table 3.5Demographics for the LLLP
Wave 1 and 2 longitudinal sample(N=809)
N %Age
18-2023-2543-4563-65
146182283198
18.022.535.024.5
GenderMaleFemale
348461
43.057.0
LocationCalgaryEdmontonGrande PrairieLethbridge
34525298
114
42.631.112.114.1
Marital Status (Adults Only)Single, Divorce, WidowedMarried, Common-law
399408
49.450.6
Level of EducationLess than High SchoolCompleted High SchoolSome Technical/CollegeCompleted Tech/CollegeSome UniversityBachelor’s DegreeMaster’s or Professional Degree
57142121157129150
53
7.017.615.019.415.918.5
6.5Current Employment Status
Not Currently EmployedEmployed Part-TimeEmployed Full-Time
Household Income$0 to $19,999$20,00 to $39,999$40,000 to $59,999$60,000 to $79,999$80,000 +
222182405
4295
139120360
27.422.550.1
5.512.518.415.947.6
Note: Data source – LLLP
Results
The test-retest reliability for each of the four PGSI categories was computed. The results foundan intraclass correlation coefficient of r = .75 (F = 9.1878, p < .001). A partial correlation wasalso completed that allowed for the statistical control of any change in gambling involvement(i.e., percent of income spent on all gambling activities) between waves. Without controlling forthe change in gambling involvement, the correlation between the PGSI score at wave 1 and 2
27
was r = .641, p < .001, whereas when the change in gambling involvement was controlled, thecorrelation only dropped slightly to r =. 622, p < .001.
The reliable change index was not calculated for participants that scored 0 on the PGSI score atboth wave 1 and 2. Consequently, the results of the analysis on the remaining 303 individualsshowed that 62 individuals (7.7% of original 808) had a reliable change in their score from wave1 to 2. Specifically, 15 individuals had a reliable change index score that was below -1.96 andanother 47 individuals had a reliable change index score that was above +1.96. The remaining241 individuals did not show a statistically significant change in their score, with values between-1.96 and +1.96.
Discussion
The intraclass correlation coefficient (r = .75) indicates there is a reasonably strong test-retestreliability associated with original PGSI scoring system. The partial correlation (r = .62) that iscalculated when controlling for percent of income spent on gambling is lower than one mightexpect. This may be indicative of change in gambling behaviour over time from wave 1 to 2.The results of the reliability change index analysis indicate that there was not a significantstatistical change in the score overtime. Only 7.7% of the sample shifted PGSI categoriesbetween wave 1 and 2, which was well below the 25% cut-off that was set at the outset.Consequently, the original PGSI gambler subtypes appear to be reliable over time. Based onthese results, the PGSI score is an effective measure to examine change in problem gambling riskseverity in a longitudinal study.
Study 3 – Reasons for Shifting PGSI Categories over Time
Objectives
Using the LLLP dataset, we explored potential reasons for shifting PGSI categories betweenwave 1 and 2 in adults. We hypothesized that, in addition to increasing gambling activity, anincrease in PGSI category could be accounted for by other variables such as increase in numberof friends who gamble, age, income, etc. The identification of factors other than PGSImeasurement error that can explain the shift in PGSI category over time could provide evidenceof the validity of the original PGSI scoring system.
Method
It was theorized that adults gambling at the same level should have comparable PGSI scores ateach wave. We hypothesized that reliability of PGSI category would directly correspond to therange of possible scores (i.e., the non-problem and low-risk gambler categories will show themost instability over time). A series of ANOVAs were completed to examine two issues. First,how did individuals vary on variables like amount spent gambling, percent of gross income spenton gambling, and number of games played as a function of the PGSI categories at wave 1 and 2.Second, how did these same variables vary when the category at wave 1 is held constant, whichallowed us to examine the shifting pattern of categories between wave 1 and 2. As well, anANOVA was completed to examine the role that percentage of friends who gamble, age, andincome play in explaining the shift in PGSI categories over time.
28
Results
The results for the ANOVA for the PGSI categories at wave 1 can be found in Table 3.6. A one-way ANOVA was completed for the amount spent on gambling, percent of gross income spenton gambling, and the number of games played in the past year. Each of the following variedsignificantly as a function of the PGSI categories: the amount spent on gambling per month, F (3,805) = 87.10, p < .001, the percent of gross income spent on gambling, F (3, 805) = 6.26, p< .001, and the total number of games played in last year, F (3, 805) = 50.73, p < .001. TheScheffe post-hoc results are also indicated in Table 3.6, with the non-problem and low-riskgamblers being significantly different than the moderate-risk and problem gamblers for amountspent and percent of income, and the amount spent by moderate-risk gamblers being significantlydifferent than the amount spent by problem gamblers. The comparisons of the overall means areshown in Figure 3.4. The only significant difference between non-problem and low-riskgamblers was for the number of games played in the last year.
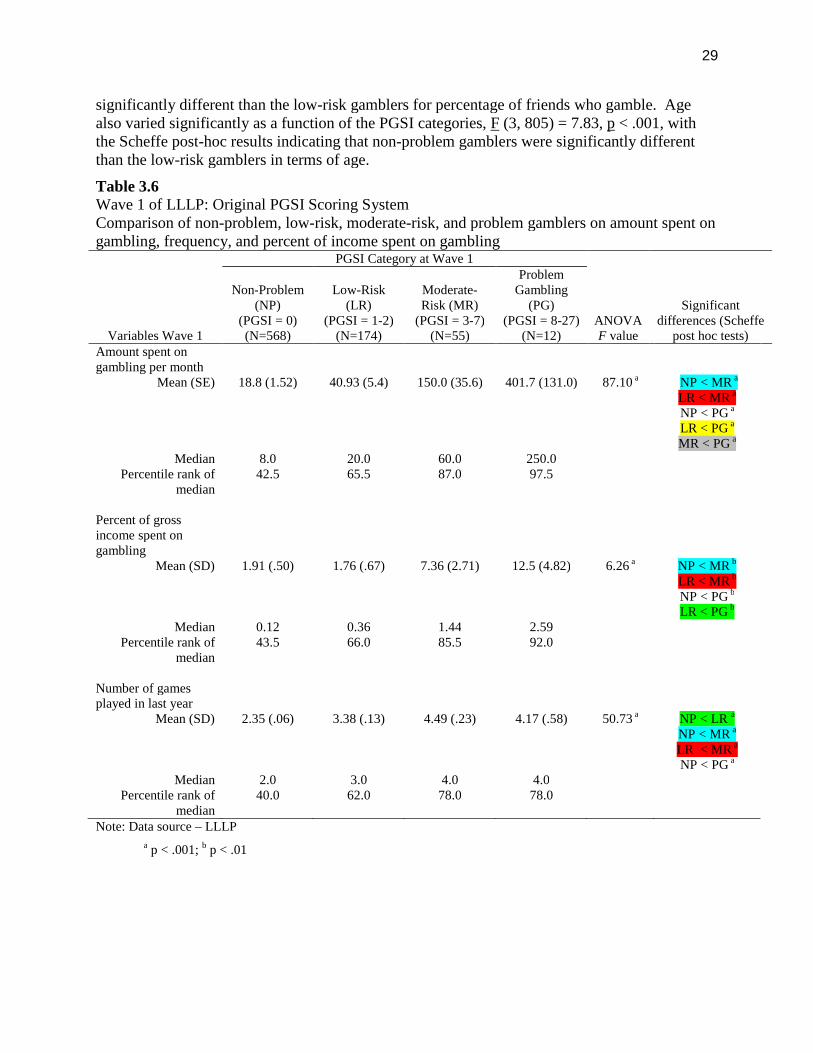
The results for the ANOVA for the PGSI categories at wave 2 can be found in Table 3.7, witheach of the following varying significantly as a function of the PGSI categories: the amountspent on gambling per month, F (3, 805) = 20.20, p < .001, the percent of gross income spent ongambling, F (3, 805) = 14.07, p < .001, and the total number of games played in last year, F (3,805) = 38.24, p < .001. The Scheffe post-hoc results are also indicated in Table 3.7, with thenon-problem and low-risk gamblers being significantly different than the moderate-risk andproblem gamblers for amount spent and percent of income, and the amount spent by moderate-risk gamblers being significantly different than the amount spent by problem gamblers. Thecomparisons of the overall means are shown in Figure 3.5. Similar to Time 1, the onlysignificant difference between non-problem and low-risk gamblers was for the number of gamesplayed in the last year.
Tables 3.8, 3.9, and 3.10 show the results for a series of ANOVAs for the stability of the PGSIcategories from wave 1 to 2. For example, Table 3.8 shows the results for only those individualsthat were non-problem gamblers at wave 1. At total of 454 individuals continued to be non-problem gamblers at wave 2, 95 met the criteria for low-risk gambling by wave 2, and 19 met thecriteria for moderate-risk gambling by wave 2. Each of the following varied significantly as afunction of the PGSI categories: the amount spent on gambling per month, F (3, 565) = 10.72, p< .001 and the percent of gross income spent on gambling, F (3, 565) = 20.71, p < .001. TheScheffe post-hoc results are also indicated in Table 3.8, with the non-problem being significantlydifferent than the low-risk and moderate-risk gamblers for amount spent on gambling. Therewas a consistent increase in the amount spent on gambling through the progression from non-problem, to low-risk, to ultimately, moderate-risk gambling. For the percent of income and thenumber of games played, there was not a consistent increase through the progression in thegambling. This lack of consistency might be due in part to the small sample size for moderate-risk gamblers. Tables 3.9 and 3.10 show the results for low-risk and moderate-risk separately.The results for problem gamblers in Table 3.9 are not shown due to the small sample size (N=2).As well, the overall results for problem gamblers are not shown due to small sample sizes in eachof the four categories.
The other ANOVA examined the role percentage of friends who gamble, age, and income playin explaining the shift in PGSI categories over time. The results showed that the percentage offriends who gamble, F (3, 781) = 7.40, p < .001 varied significantly as a function of the PGSIcategories. The Scheffe post-hoc results also indicated that non-problem gamblers were
29
significantly different than the low-risk gamblers for percentage of friends who gamble. Agealso varied significantly as a function of the PGSI categories, F (3, 805) = 7.83, p < .001, withthe Scheffe post-hoc results indicating that non-problem gamblers were significantly differentthan the low-risk gamblers in terms of age.
Table 3.6Wave 1 of LLLP: Original PGSI Scoring SystemComparison of non-problem, low-risk, moderate-risk, and problem gamblers on amount spent ongambling, frequency, and percent of income spent on gambling
Variables Wave 1
PGSI Category at Wave 1
ANOVAF value
Significantdifferences (Scheffe
post hoc tests)
Non-Problem(NP)
(PGSI = 0)(N=568)
Low-Risk(LR)
(PGSI = 1-2)(N=174)
Moderate-Risk (MR)
(PGSI = 3-7)(N=55)
ProblemGambling
(PG)(PGSI = 8-27)
(N=12)Amount spent ongambling per month
Mean (SE) 18.8 (1.52) 40.93 (5.4) 150.0 (35.6) 401.7 (131.0) 87.10 a NP < MR a
LR < MR a
NP < PG a
LR < PG a
MR < PG a
Median 8.0 20.0 60.0 250.0Percentile rank of
median42.5 65.5 87.0 97.5
Percent of grossincome spent ongambling
Mean (SD) 1.91 (.50) 1.76 (.67) 7.36 (2.71) 12.5 (4.82) 6.26 a NP < MR b
LR < MR b
NP < PG b
LR < PG b
Median 0.12 0.36 1.44 2.59Percentile rank of
median43.5 66.0 85.5 92.0
Number of gamesplayed in last year
Mean (SD) 2.35 (.06) 3.38 (.13) 4.49 (.23) 4.17 (.58) 50.73 a NP < LR a
NP < MR a
LR < MR a
NP < PG a
Median 2.0 3.0 4.0 4.0Percentile rank of
median40.0 62.0 78.0 78.0
Note: Data source – LLLP
a p < .001; b p < .01
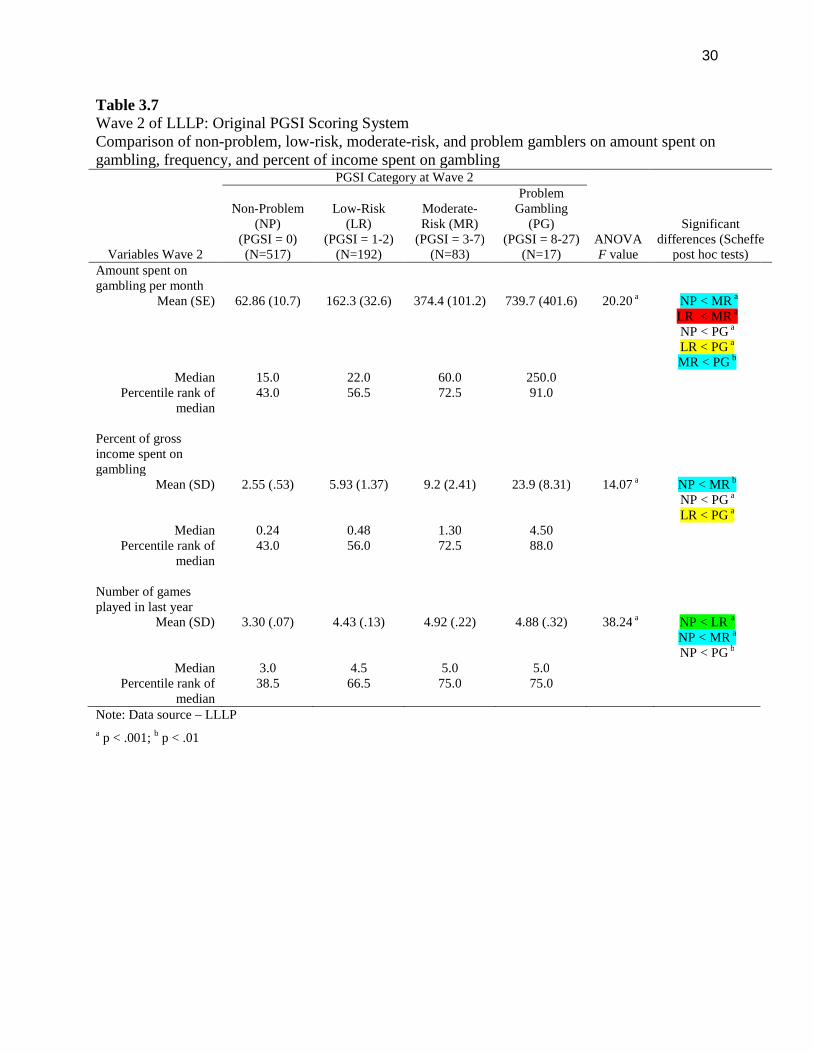
30
Table 3.7Wave 2 of LLLP: Original PGSI Scoring SystemComparison of non-problem, low-risk, moderate-risk, and problem gamblers on amount spent ongambling, frequency, and percent of income spent on gambling
Variables Wave 2
PGSI Category at Wave 2
ANOVAF value
Significantdifferences (Scheffe
post hoc tests)
Non-Problem(NP)
(PGSI = 0)(N=517)
Low-Risk(LR)
(PGSI = 1-2)(N=192)
Moderate-Risk (MR)
(PGSI = 3-7)(N=83)
ProblemGambling
(PG)(PGSI = 8-27)
(N=17)Amount spent ongambling per month
Mean (SE) 62.86 (10.7) 162.3 (32.6) 374.4 (101.2) 739.7 (401.6) 20.20 a NP < MR a
LR < MR a
NP < PG a
LR < PG a
MR < PG b
Median 15.0 22.0 60.0 250.0Percentile rank of
median43.0 56.5 72.5 91.0
Percent of grossincome spent ongambling
Mean (SD) 2.55 (.53) 5.93 (1.37) 9.2 (2.41) 23.9 (8.31) 14.07 a NP < MR b
NP < PG a
LR < PG a
Median 0.24 0.48 1.30 4.50Percentile rank of
median43.0 56.0 72.5 88.0
Number of gamesplayed in last year
Mean (SD) 3.30 (.07) 4.43 (.13) 4.92 (.22) 4.88 (.32) 38.24 a NP < LR a
NP < MR a
NP < PG b
Median 3.0 4.5 5.0 5.0Percentile rank of
median38.5 66.5 75.0 75.0
Note: Data source – LLLP
a p < .001; b p < .01
31
Figure 3.4. Mean amount spent on all gambling in each category at wave 1 (1=non-problem;2=low-risk gambler; 3=moderate-risk gambler; and 4=problem gambler).
Figure 3.5. Mean amount spent on all gambling in each category at wave 2 (1=non-problem;2=low-risk gambler; 3=moderate-risk gambler; and 4=problem gambler).
0
100
200
300
400
500
600
1 2 3 4
Time 1
Do
llars
Time 1: Amount Spent GamblingOriginal PGSI Scoring
Novel PGSI Scoring
Novel PGSI DichotomousScoring
0
100
200
300
400
500
600
700
800
900
1000
1 2 3 4
Time 2
Do
llars
Time 2: Amount Spent Gambling
Original PGSI Scoring
Novel PGSI Scoring
Novel PGSI DichotomousScoring
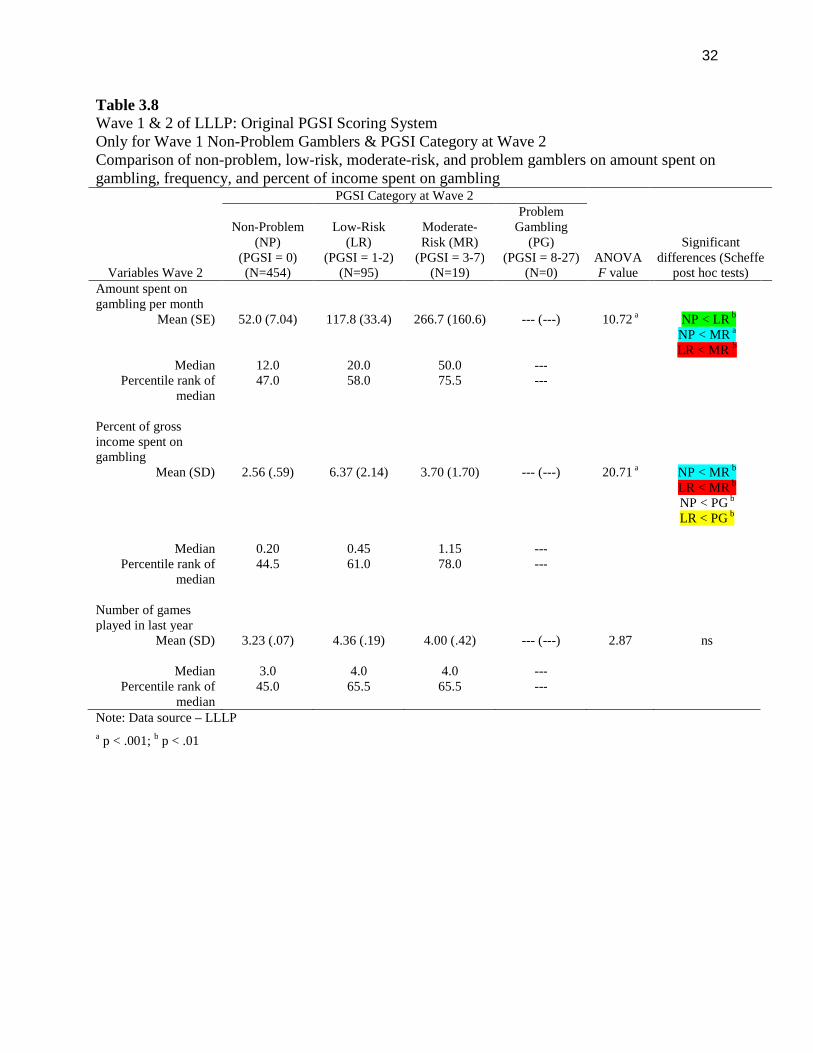
32
Table 3.8Wave 1 & 2 of LLLP: Original PGSI Scoring SystemOnly for Wave 1 Non-Problem Gamblers & PGSI Category at Wave 2Comparison of non-problem, low-risk, moderate-risk, and problem gamblers on amount spent ongambling, frequency, and percent of income spent on gambling
Variables Wave 2
PGSI Category at Wave 2
ANOVAF value
Significantdifferences (Scheffe
post hoc tests)
Non-Problem(NP)
(PGSI = 0)(N=454)
Low-Risk(LR)
(PGSI = 1-2)(N=95)
Moderate-Risk (MR)
(PGSI = 3-7)(N=19)
ProblemGambling
(PG)(PGSI = 8-27)
(N=0)Amount spent ongambling per month
Mean (SE) 52.0 (7.04) 117.8 (33.4) 266.7 (160.6) --- (---) 10.72 a NP < LR b
NP < MR a
LR < MR b
Median 12.0 20.0 50.0 ---Percentile rank of
median47.0 58.0 75.5 ---
Percent of grossincome spent ongambling
Mean (SD) 2.56 (.59) 6.37 (2.14) 3.70 (1.70) --- (---) 20.71 a NP < MR b
LR < MR b
NP < PG b
LR < PG b
Median 0.20 0.45 1.15 ---Percentile rank of
median44.5 61.0 78.0 ---
Number of gamesplayed in last year
Mean (SD) 3.23 (.07) 4.36 (.19) 4.00 (.42) --- (---) 2.87 ns
Median 3.0 4.0 4.0 ---Percentile rank of
median45.0 65.5 65.5 ---
Note: Data source – LLLP
a p < .001; b p < .01
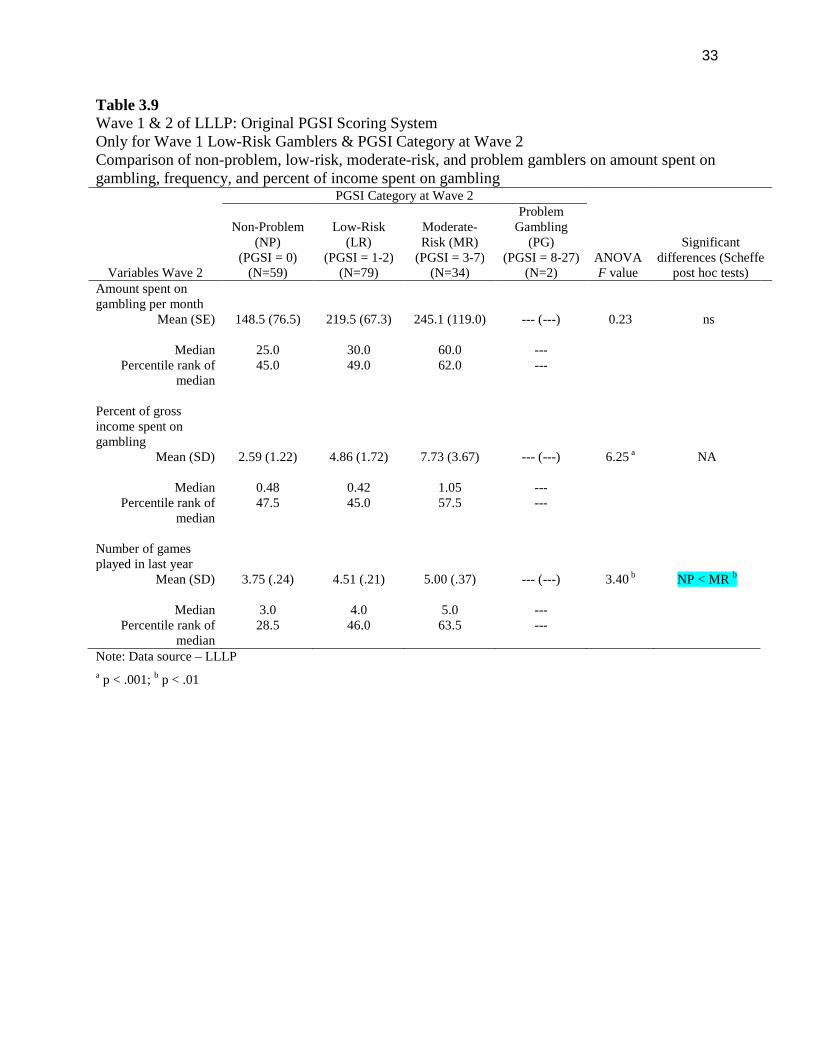
33
Table 3.9Wave 1 & 2 of LLLP: Original PGSI Scoring SystemOnly for Wave 1 Low-Risk Gamblers & PGSI Category at Wave 2Comparison of non-problem, low-risk, moderate-risk, and problem gamblers on amount spent ongambling, frequency, and percent of income spent on gambling
Variables Wave 2
PGSI Category at Wave 2
ANOVAF value
Significantdifferences (Scheffe
post hoc tests)
Non-Problem(NP)
(PGSI = 0)(N=59)
Low-Risk(LR)
(PGSI = 1-2)(N=79)
Moderate-Risk (MR)
(PGSI = 3-7)(N=34)
ProblemGambling
(PG)(PGSI = 8-27)
(N=2)Amount spent ongambling per month
Mean (SE) 148.5 (76.5) 219.5 (67.3) 245.1 (119.0) --- (---) 0.23 ns
Median 25.0 30.0 60.0 ---Percentile rank of
median45.0 49.0 62.0 ---
Percent of grossincome spent ongambling
Mean (SD) 2.59 (1.22) 4.86 (1.72) 7.73 (3.67) --- (---) 6.25 a NA
Median 0.48 0.42 1.05 ---Percentile rank of
median47.5 45.0 57.5 ---
Number of gamesplayed in last year
Mean (SD) 3.75 (.24) 4.51 (.21) 5.00 (.37) --- (---) 3.40 b NP < MR b
Median 3.0 4.0 5.0 ---Percentile rank of
median28.5 46.0 63.5 ---
Note: Data source – LLLP
a p < .001; b p < .01
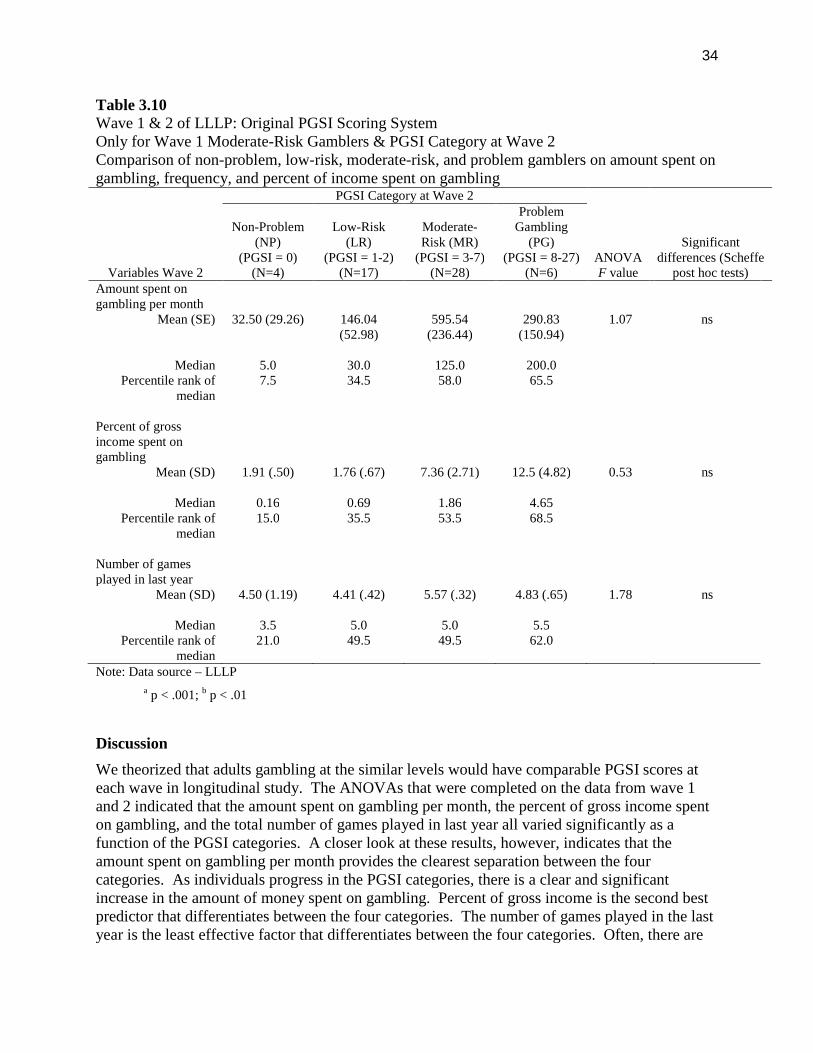
34
Table 3.10Wave 1 & 2 of LLLP: Original PGSI Scoring SystemOnly for Wave 1 Moderate-Risk Gamblers & PGSI Category at Wave 2Comparison of non-problem, low-risk, moderate-risk, and problem gamblers on amount spent ongambling, frequency, and percent of income spent on gambling
Variables Wave 2
PGSI Category at Wave 2
ANOVAF value
Significantdifferences (Scheffe
post hoc tests)
Non-Problem(NP)
(PGSI = 0)(N=4)
Low-Risk(LR)
(PGSI = 1-2)(N=17)
Moderate-Risk (MR)
(PGSI = 3-7)(N=28)
ProblemGambling
(PG)(PGSI = 8-27)
(N=6)Amount spent ongambling per month
Mean (SE) 32.50 (29.26) 146.04(52.98)
595.54(236.44)
290.83(150.94)
1.07 ns
Median 5.0 30.0 125.0 200.0Percentile rank of
median7.5 34.5 58.0 65.5
Percent of grossincome spent ongambling
Mean (SD) 1.91 (.50) 1.76 (.67) 7.36 (2.71) 12.5 (4.82) 0.53 ns
Median 0.16 0.69 1.86 4.65Percentile rank of
median15.0 35.5 53.5 68.5
Number of gamesplayed in last year
Mean (SD) 4.50 (1.19) 4.41 (.42) 5.57 (.32) 4.83 (.65) 1.78 ns
Median 3.5 5.0 5.0 5.5Percentile rank of
median21.0 49.5 49.5 62.0
Note: Data source – LLLP
a p < .001; b p < .01
Discussion
We theorized that adults gambling at the similar levels would have comparable PGSI scores ateach wave in longitudinal study. The ANOVAs that were completed on the data from wave 1and 2 indicated that the amount spent on gambling per month, the percent of gross income spenton gambling, and the total number of games played in last year all varied significantly as afunction of the PGSI categories. A closer look at these results, however, indicates that theamount spent on gambling per month provides the clearest separation between the fourcategories. As individuals progress in the PGSI categories, there is a clear and significantincrease in the amount of money spent on gambling. Percent of gross income is the second bestpredictor that differentiates between the four categories. The number of games played in the lastyear is the least effective factor that differentiates between the four categories. Often, there are
35
fewer games played among problem gamblers than for moderate-risk gamblers, even though theamount spent and percent of income is often significantly higher among problem gamblers. Thismight be indicative of the types of gambling activities that problem gamblers participate incompared to other gamblers. That is fewer types, but more risky gambling activities like EGMsand casino games.
We also examined how the amount spent gambling, percent of gross income spent on gambling,and number of games played varied when the PGSI category at wave 1 was held constant. Itprovided an opportunity to examine the shifting pattern of PGSI categories between wave 1 and2 of the LLLP. Unfortunately, the somewhat small sample sizes (e.g., problem gamblers) forsome of these analyses limited the overall conclusions that could be drawn. Based on theanalyses that were completed, the amount spent on gambling per month is the best predictor ofthe shifting PGSI categories that occur overtime in a longitudinal study. Finally we examinedthe role that factors like percentage of friends who gamble, age, and income play would play inexplaining the shift in PGSI categories over time. The results showed, as compared to low-riskgamblers, non-problems gamblers had significantly fewer friends who gambled and they tendedbe older. Overall, there appears to a variety of factors that help differentiate between the PGSIcategories over time. At lower levels of gambling (i.e., non-problem vs. low-risk), factors suchas percentage of friends gambling, age, and amount spent on gambling appear to better predictwhich PGSI category one might separate, whereas, amount spent on gambling provides morespecificity in identifying differences between the four PGSI categories.
Section 4Validity and Reliability of Novel PGSI Scoring System
Study 1 – Creation and Reliability of Novel PGSI Scoring System
Objectives
Using the original 0 to 27 scoring range (each item scored on a 4-point scale), four novelcategories were created that corresponded to scores of 0, 1 to 4, 5 to 8, and 9+). This scoringmaintained the non-problem (zero-symptom) gambler and high severity categories as largelyunchanged from the original scoring, while having equal intervals (4 points each) for the twomiddle categories. It was hypothesized that the original categories for the PGSI might need to beadjusted to facilitate a more refined separation between the four categories. We hypothesizedthis scoring system would demonstrate greater stability over time. The goal was to assess theimpact of re-calibrating the PGSI scoring rules on the reliability and validity of the PGSI severitycategories.
Method
An intraclass correlation coefficient (ICC) was calculated to examine the temporal reliability ofthe novel PGSI scoring system measured at wave 1 and 2 in the LLLP. Partial correlations werecompleted to try and identify the role that the change in proportion of income spent had inchanges in the relationship between the novel PGSI scores over time. A series of ANOVAs werecompleted to examine the role that amount spent, the proportion of income spent on gambling,and the frequency of gambling play in identifying variation in the new categories for the PGSI.In order to complete this analysis, the LLLP dataset was used on these four categories tocompare differences in the amount spent on gambling, the percent of gross income spent ongambling, and the number of games played in the last year. Of particular interest was the
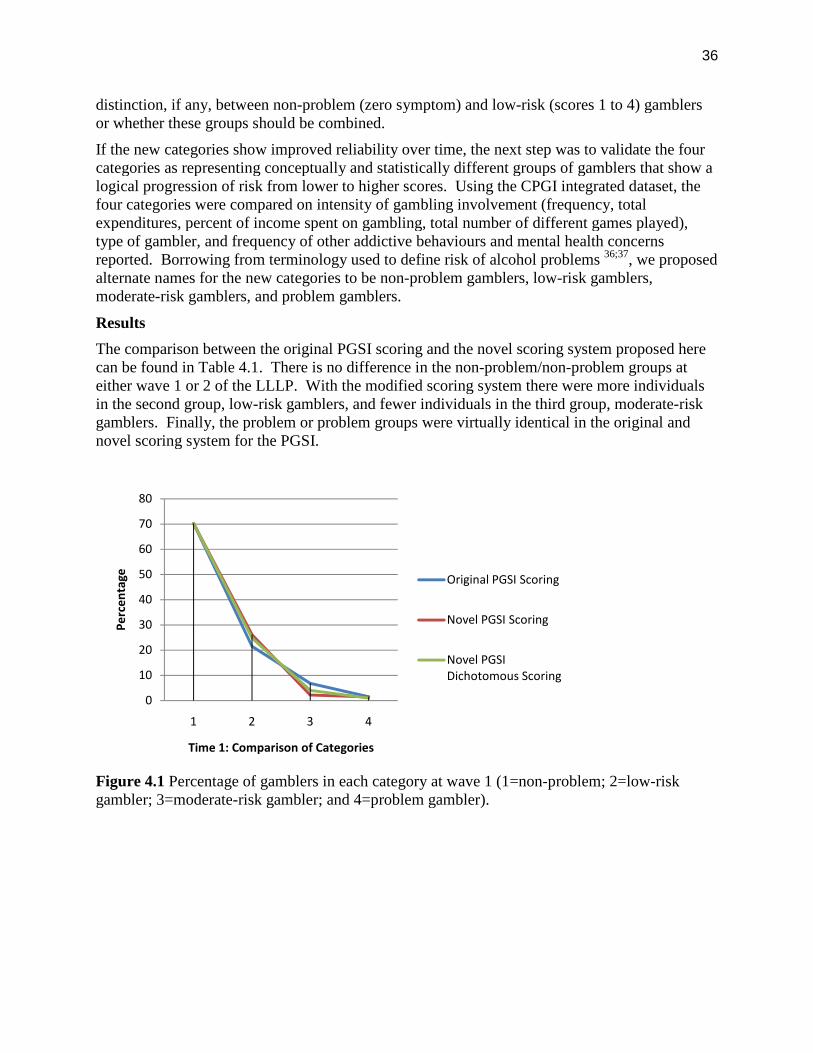
36
distinction, if any, between non-problem (zero symptom) and low-risk (scores 1 to 4) gamblersor whether these groups should be combined.
If the new categories show improved reliability over time, the next step was to validate the fourcategories as representing conceptually and statistically different groups of gamblers that show alogical progression of risk from lower to higher scores. Using the CPGI integrated dataset, thefour categories were compared on intensity of gambling involvement (frequency, totalexpenditures, percent of income spent on gambling, total number of different games played),type of gambler, and frequency of other addictive behaviours and mental health concernsreported. Borrowing from terminology used to define risk of alcohol problems 36;37, we proposedalternate names for the new categories to be non-problem gamblers, low-risk gamblers,moderate-risk gamblers, and problem gamblers.
Results
The comparison between the original PGSI scoring and the novel scoring system proposed herecan be found in Table 4.1. There is no difference in the non-problem/non-problem groups ateither wave 1 or 2 of the LLLP. With the modified scoring system there were more individualsin the second group, low-risk gamblers, and fewer individuals in the third group, moderate-riskgamblers. Finally, the problem or problem groups were virtually identical in the original andnovel scoring system for the PGSI.
Figure 4.1 Percentage of gamblers in each category at wave 1 (1=non-problem; 2=low-riskgambler; 3=moderate-risk gambler; and 4=problem gambler).
0
10
20
30
40
50
60
70
80
1 2 3 4
Pe
rce
nta
ge
Time 1: Comparison of Categories
Original PGSI Scoring
Novel PGSI Scoring
Novel PGSIDichotomous Scoring
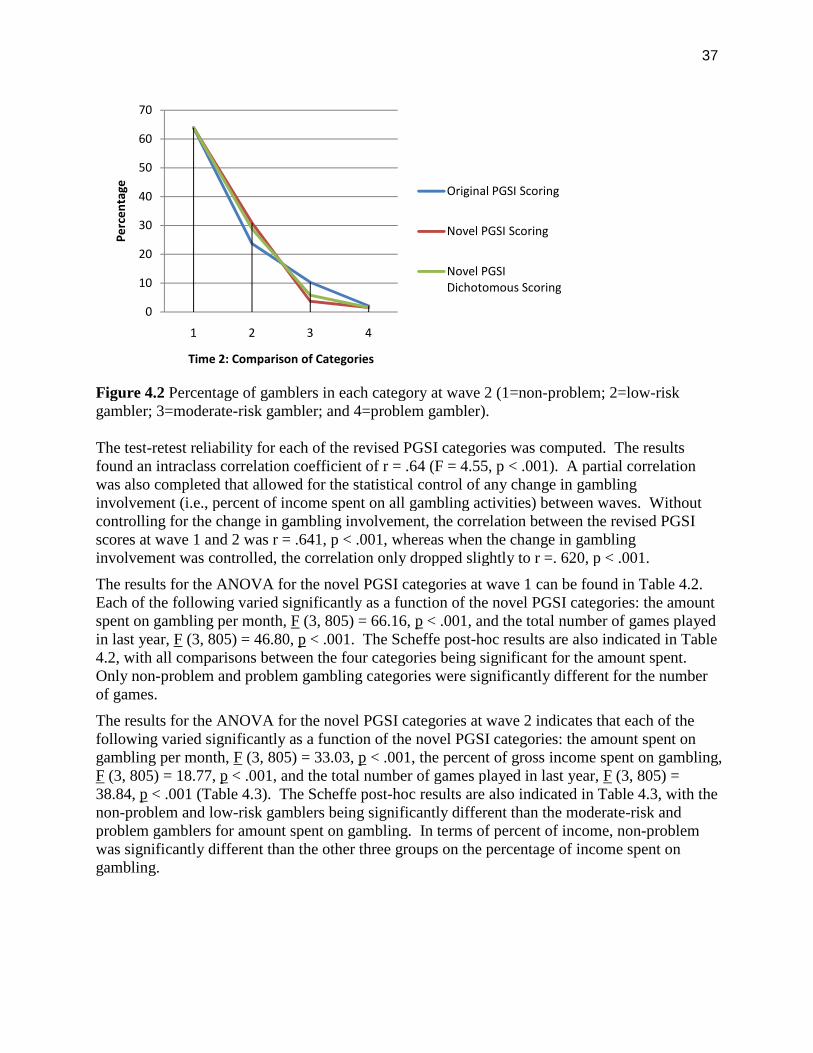
37
Figure 4.2 Percentage of gamblers in each category at wave 2 (1=non-problem; 2=low-riskgambler; 3=moderate-risk gambler; and 4=problem gambler).
The test-retest reliability for each of the revised PGSI categories was computed. The resultsfound an intraclass correlation coefficient of r = .64 (F = 4.55, p < .001). A partial correlationwas also completed that allowed for the statistical control of any change in gamblinginvolvement (i.e., percent of income spent on all gambling activities) between waves. Withoutcontrolling for the change in gambling involvement, the correlation between the revised PGSIscores at wave 1 and 2 was r = .641, p < .001, whereas when the change in gamblinginvolvement was controlled, the correlation only dropped slightly to r =. 620, p < .001.
The results for the ANOVA for the novel PGSI categories at wave 1 can be found in Table 4.2.Each of the following varied significantly as a function of the novel PGSI categories: the amountspent on gambling per month, F (3, 805) = 66.16, p < .001, and the total number of games playedin last year, F (3, 805) = 46.80, p < .001. The Scheffe post-hoc results are also indicated in Table4.2, with all comparisons between the four categories being significant for the amount spent.Only non-problem and problem gambling categories were significantly different for the numberof games.
The results for the ANOVA for the novel PGSI categories at wave 2 indicates that each of thefollowing varied significantly as a function of the novel PGSI categories: the amount spent ongambling per month, F (3, 805) = 33.03, p < .001, the percent of gross income spent on gambling,F (3, 805) = 18.77, p < .001, and the total number of games played in last year, F (3, 805) =38.84, p < .001 (Table 4.3). The Scheffe post-hoc results are also indicated in Table 4.3, with thenon-problem and low-risk gamblers being significantly different than the moderate-risk andproblem gamblers for amount spent on gambling. In terms of percent of income, non-problemwas significantly different than the other three groups on the percentage of income spent ongambling.
0
10
20
30
40
50
60
70
1 2 3 4
Pe
rce
nta
ge
Time 2: Comparison of Categories
Original PGSI Scoring
Novel PGSI Scoring
Novel PGSIDichotomous Scoring
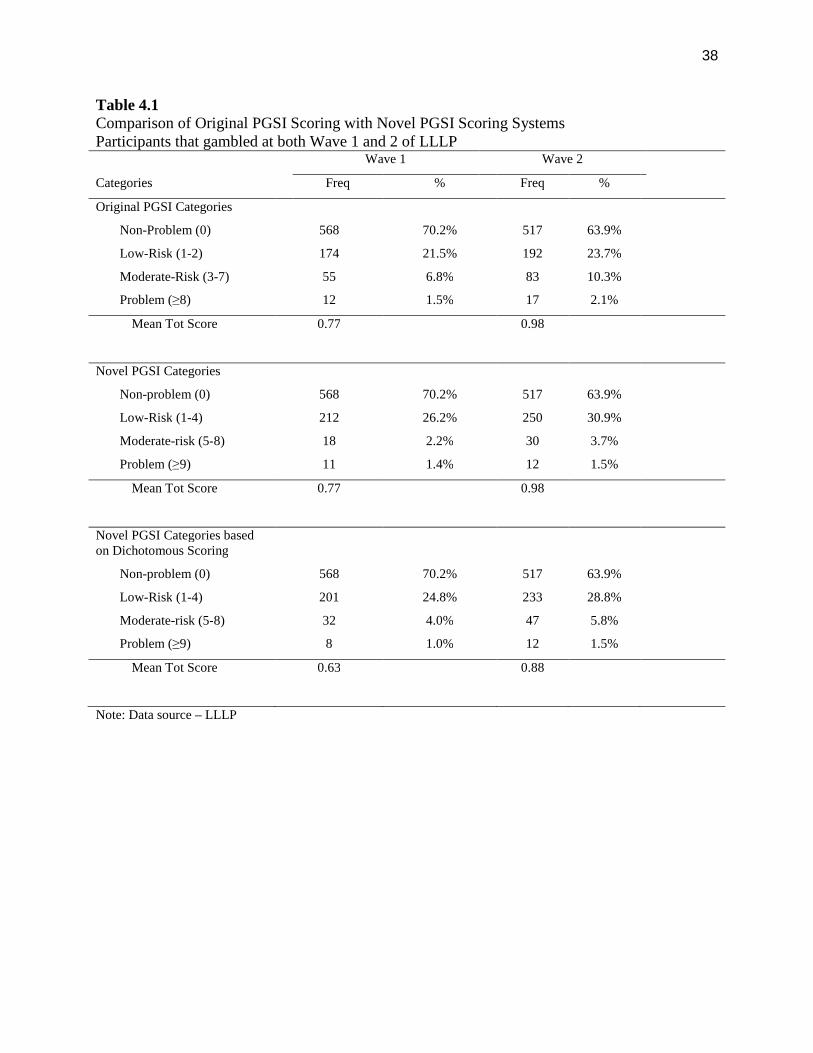
38
Table 4.1Comparison of Original PGSI Scoring with Novel PGSI Scoring SystemsParticipants that gambled at both Wave 1 and 2 of LLLP
Wave 1 Wave 2
Categories Freq % Freq %
Original PGSI Categories
Non-Problem (0) 568 70.2% 517 63.9%
Low-Risk (1-2) 174 21.5% 192 23.7%
Moderate-Risk (3-7) 55 6.8% 83 10.3%
Problem (≥8) 12 1.5% 17 2.1%
Mean Tot Score 0.77 0.98
Novel PGSI Categories
Non-problem (0) 568 70.2% 517 63.9%
Low-Risk (1-4) 212 26.2% 250 30.9%
Moderate-risk (5-8) 18 2.2% 30 3.7%
Problem (≥9) 11 1.4% 12 1.5%
Mean Tot Score 0.77 0.98
Novel PGSI Categories basedon Dichotomous Scoring
Non-problem (0) 568 70.2% 517 63.9%
Low-Risk (1-4) 201 24.8% 233 28.8%
Moderate-risk (5-8) 32 4.0% 47 5.8%
Problem (≥9) 8 1.0% 12 1.5%
Mean Tot Score 0.63 0.88
Note: Data source – LLLP
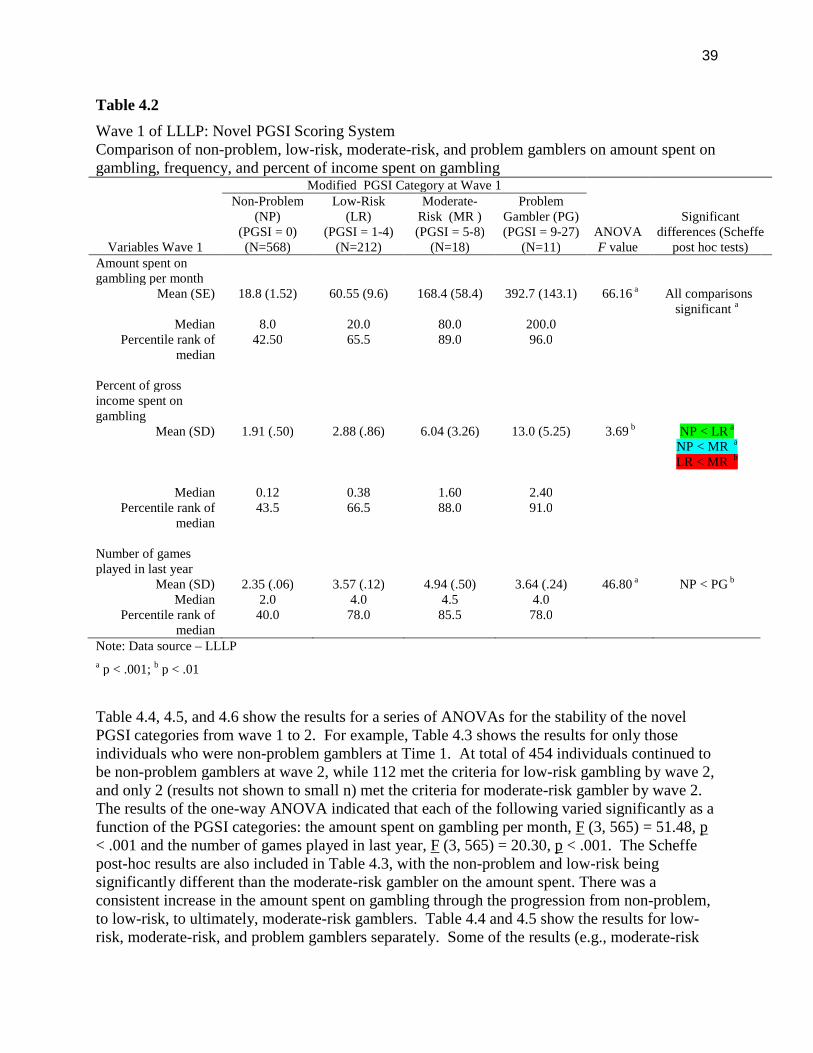
39
Table 4.2
Wave 1 of LLLP: Novel PGSI Scoring SystemComparison of non-problem, low-risk, moderate-risk, and problem gamblers on amount spent ongambling, frequency, and percent of income spent on gambling
Variables Wave 1
Modified PGSI Category at Wave 1
ANOVAF value
Significantdifferences (Scheffe
post hoc tests)
Non-Problem(NP)
(PGSI = 0)(N=568)
Low-Risk(LR)
(PGSI = 1-4)(N=212)
Moderate-Risk (MR )(PGSI = 5-8)
(N=18)
ProblemGambler (PG)(PGSI = 9-27)
(N=11)Amount spent ongambling per month
Mean (SE) 18.8 (1.52) 60.55 (9.6) 168.4 (58.4) 392.7 (143.1) 66.16 a All comparisonssignificant a
Median 8.0 20.0 80.0 200.0Percentile rank of
median42.50 65.5 89.0 96.0
Percent of grossincome spent ongambling
Mean (SD) 1.91 (.50) 2.88 (.86) 6.04 (3.26) 13.0 (5.25) 3.69 b NP < LR a
NP < MR a
LR < MR b
Median 0.12 0.38 1.60 2.40Percentile rank of
median43.5 66.5 88.0 91.0
Number of gamesplayed in last year
Mean (SD) 2.35 (.06) 3.57 (.12) 4.94 (.50) 3.64 (.24) 46.80 a NP < PG b
Median 2.0 4.0 4.5 4.0Percentile rank of
median40.0 78.0 85.5 78.0
Note: Data source – LLLP
a p < .001; b p < .01
Table 4.4, 4.5, and 4.6 show the results for a series of ANOVAs for the stability of the novelPGSI categories from wave 1 to 2. For example, Table 4.3 shows the results for only thoseindividuals who were non-problem gamblers at Time 1. At total of 454 individuals continued tobe non-problem gamblers at wave 2, while 112 met the criteria for low-risk gambling by wave 2,and only 2 (results not shown to small n) met the criteria for moderate-risk gambler by wave 2.The results of the one-way ANOVA indicated that each of the following varied significantly as afunction of the PGSI categories: the amount spent on gambling per month, F (3, 565) = 51.48, p< .001 and the number of games played in last year, F (3, 565) = 20.30, p < .001. The Scheffepost-hoc results are also included in Table 4.3, with the non-problem and low-risk beingsignificantly different than the moderate-risk gambler on the amount spent. There was aconsistent increase in the amount spent on gambling through the progression from non-problem,to low-risk, to ultimately, moderate-risk gamblers. Table 4.4 and 4.5 show the results for low-risk, moderate-risk, and problem gamblers separately. Some of the results (e.g., moderate-risk
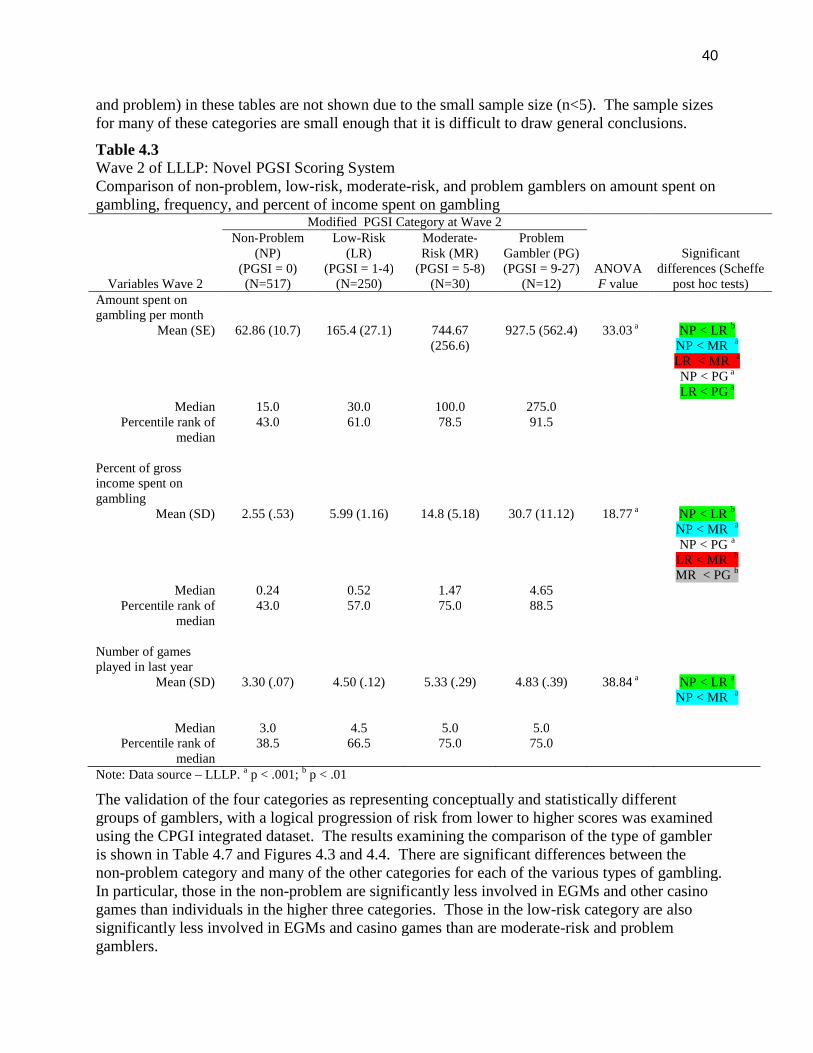
40
and problem) in these tables are not shown due to the small sample size (n<5). The sample sizesfor many of these categories are small enough that it is difficult to draw general conclusions.
Table 4.3Wave 2 of LLLP: Novel PGSI Scoring SystemComparison of non-problem, low-risk, moderate-risk, and problem gamblers on amount spent ongambling, frequency, and percent of income spent on gambling
Variables Wave 2
Modified PGSI Category at Wave 2
ANOVAF value
Significantdifferences (Scheffe
post hoc tests)
Non-Problem(NP)
(PGSI = 0)(N=517)
Low-Risk(LR)
(PGSI = 1-4)(N=250)
Moderate-Risk (MR)
(PGSI = 5-8)(N=30)
ProblemGambler (PG)(PGSI = 9-27)
(N=12)Amount spent ongambling per month
Mean (SE) 62.86 (10.7) 165.4 (27.1) 744.67(256.6)
927.5 (562.4) 33.03 a NP < LR b
NP < MR a
LR < MR a
NP < PG a
LR < PG a
Median 15.0 30.0 100.0 275.0Percentile rank of
median43.0 61.0 78.5 91.5
Percent of grossincome spent ongambling
Mean (SD) 2.55 (.53) 5.99 (1.16) 14.8 (5.18) 30.7 (11.12) 18.77 a NP < LR b
NP < MR a
NP < PG a
LR < MR b
MR < PG b
Median 0.24 0.52 1.47 4.65Percentile rank of
median43.0 57.0 75.0 88.5
Number of gamesplayed in last year
Mean (SD) 3.30 (.07) 4.50 (.12) 5.33 (.29) 4.83 (.39) 38.84 a NP < LR a
NP < MR a
Median 3.0 4.5 5.0 5.0Percentile rank of
median38.5 66.5 75.0 75.0
Note: Data source – LLLP. a p < .001; b p < .01
The validation of the four categories as representing conceptually and statistically differentgroups of gamblers, with a logical progression of risk from lower to higher scores was examinedusing the CPGI integrated dataset. The results examining the comparison of the type of gambleris shown in Table 4.7 and Figures 4.3 and 4.4. There are significant differences between thenon-problem category and many of the other categories for each of the various types of gambling.In particular, those in the non-problem are significantly less involved in EGMs and other casinogames than individuals in the higher three categories. Those in the low-risk category are alsosignificantly less involved in EGMs and casino games than are moderate-risk and problemgamblers.
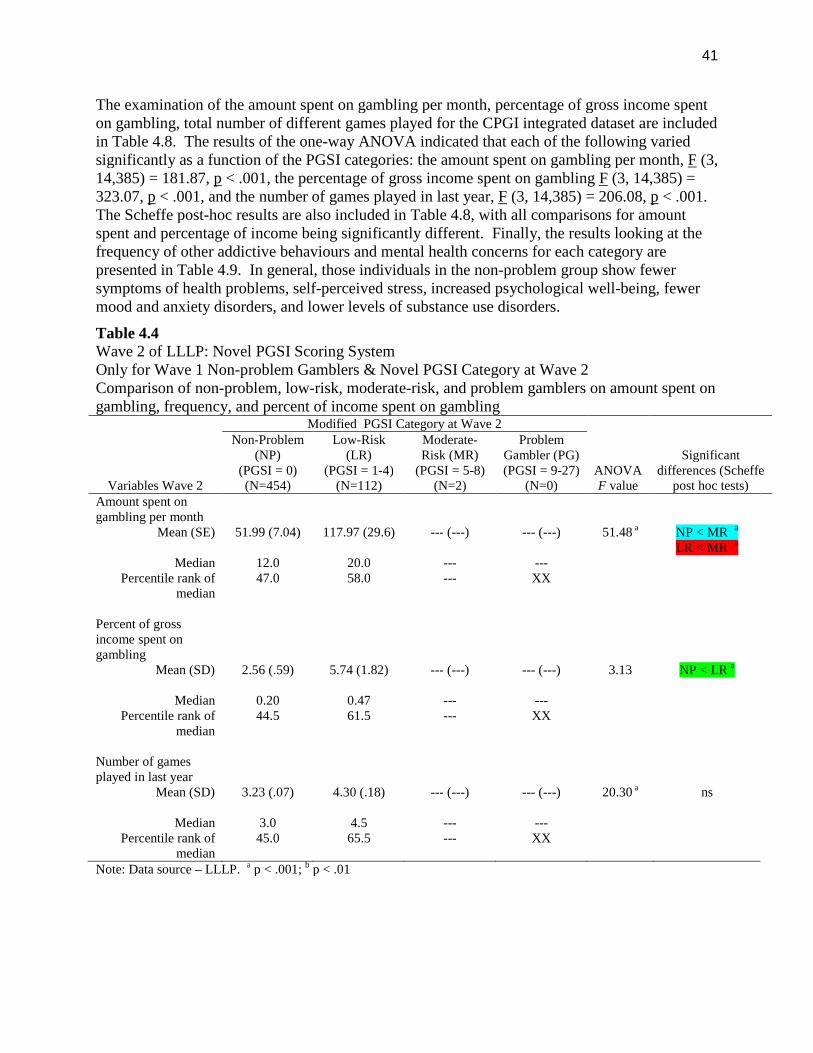
41
The examination of the amount spent on gambling per month, percentage of gross income spenton gambling, total number of different games played for the CPGI integrated dataset are includedin Table 4.8. The results of the one-way ANOVA indicated that each of the following variedsignificantly as a function of the PGSI categories: the amount spent on gambling per month, F (3,14,385) = 181.87, p < .001, the percentage of gross income spent on gambling F (3, 14,385) =323.07, p < .001, and the number of games played in last year, F (3, 14,385) = 206.08, p < .001.The Scheffe post-hoc results are also included in Table 4.8, with all comparisons for amountspent and percentage of income being significantly different. Finally, the results looking at thefrequency of other addictive behaviours and mental health concerns for each category arepresented in Table 4.9. In general, those individuals in the non-problem group show fewersymptoms of health problems, self-perceived stress, increased psychological well-being, fewermood and anxiety disorders, and lower levels of substance use disorders.
Table 4.4Wave 2 of LLLP: Novel PGSI Scoring SystemOnly for Wave 1 Non-problem Gamblers & Novel PGSI Category at Wave 2Comparison of non-problem, low-risk, moderate-risk, and problem gamblers on amount spent ongambling, frequency, and percent of income spent on gambling
Variables Wave 2
Modified PGSI Category at Wave 2
ANOVAF value
Significantdifferences (Scheffe
post hoc tests)
Non-Problem(NP)
(PGSI = 0)(N=454)
Low-Risk(LR)
(PGSI = 1-4)(N=112)
Moderate-Risk (MR)
(PGSI = 5-8)(N=2)
ProblemGambler (PG)(PGSI = 9-27)
(N=0)Amount spent ongambling per month
Mean (SE) 51.99 (7.04) 117.97 (29.6) --- (---) --- (---) 51.48 a NP < MR a
LR < MR a
Median 12.0 20.0 --- ---Percentile rank of
median47.0 58.0 --- XX
Percent of grossincome spent ongambling
Mean (SD) 2.56 (.59) 5.74 (1.82) --- (---) --- (---) 3.13 NP < LR a
Median 0.20 0.47 --- ---Percentile rank of
median44.5 61.5 --- XX
Number of gamesplayed in last year
Mean (SD) 3.23 (.07) 4.30 (.18) --- (---) --- (---) 20.30 a ns
Median 3.0 4.5 --- ---Percentile rank of
median45.0 65.5 --- XX
Note: Data source – LLLP. a p < .001; b p < .01

42
Table 4.5
Wave 2 of LLLP: Novel PGSI Scoring SystemOnly for Wave 1 Low-Risk Gamblers & Novel PGSI Category at Wave 2Comparison of non-problem, low-risk, moderate-risk, and problem gamblers on amount spent ongambling, frequency, and percent of income spent on gambling
Variables Wave 2
Modified PGSI Category at Wave 2
ANOVAF value
Significantdifferences (Scheffe
post hoc tests)
Non-Problem(NP)
(PGSI = 0)(N=62)
Low-Risk(LR)
(PGSI = 1-4)(N=128)
ModerateRisk (MR)
(PGSI = 5-8)(N=21)
ProblemGambler (PG)(PGSI = 9-27)
(N=1)Amount spent ongambling per month
Mean (SE) 143.45(72.79)
193.01(43.59)
675.24(334.39)
--- (---) 3.40 NA
Median 22.5 35.0 100.0 ---Percentile rank of
median42.5 49.5 69.0 ---
Percent of grossincome spent ongambling
Mean (SD) 2.49 (1.16) 6.08 (1.59) 16.61 (7.20) --- (---) 12.17 b NAMedian 0.48 0.54 1.38 ---
Percentile rank ofmedian
46.0 47.0 64.0 ---
Number of gamesplayed in last year
Mean (SD) 3.81 (.24) 4.58 (.17) 5.52 (.35) --- (---) 4.89 b NA
Median 3.0 5.0 5.0 ---Percentile rank of
median26.0 61.5 61.5 ---
Note: Data source – LLLP. a p < .001; b p < .01
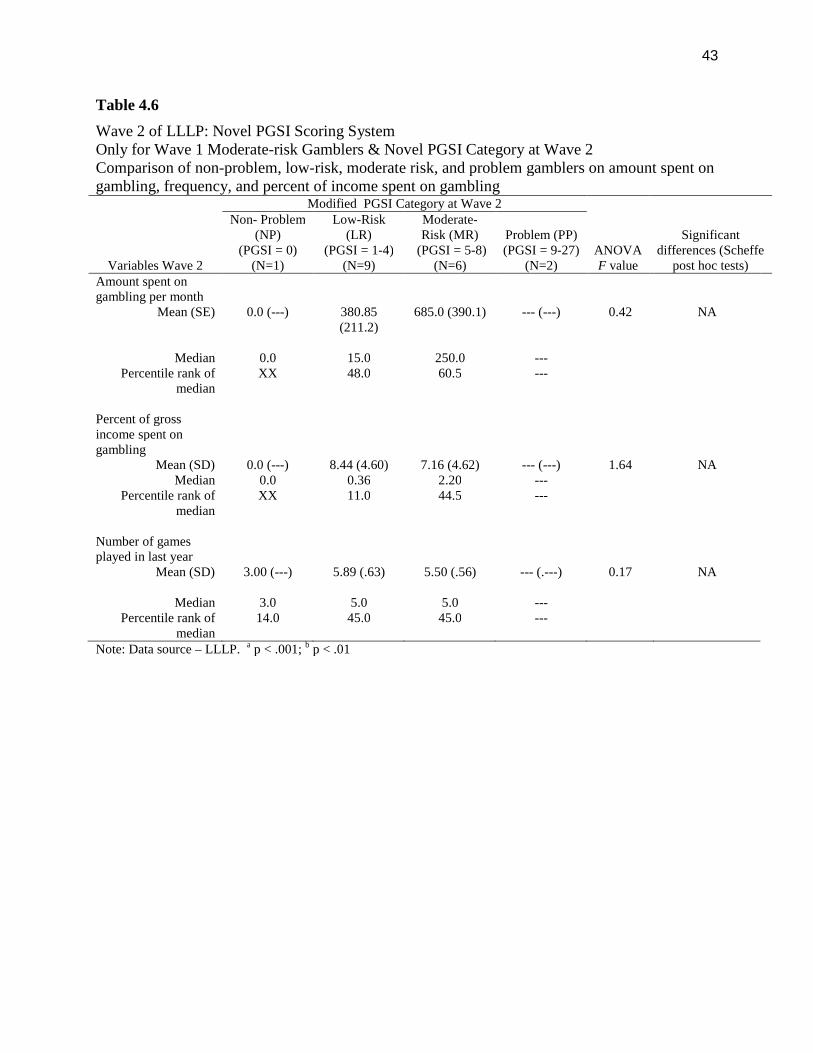
43
Table 4.6
Wave 2 of LLLP: Novel PGSI Scoring SystemOnly for Wave 1 Moderate-risk Gamblers & Novel PGSI Category at Wave 2Comparison of non-problem, low-risk, moderate risk, and problem gamblers on amount spent ongambling, frequency, and percent of income spent on gambling
Variables Wave 2
Modified PGSI Category at Wave 2
ANOVAF value
Significantdifferences (Scheffe
post hoc tests)
Non- Problem(NP)
(PGSI = 0)(N=1)
Low-Risk(LR)
(PGSI = 1-4)(N=9)
Moderate-Risk (MR)
(PGSI = 5-8)(N=6)
Problem (PP)(PGSI = 9-27)
(N=2)Amount spent ongambling per month
Mean (SE) 0.0 (---) 380.85(211.2)
685.0 (390.1) --- (---) 0.42 NA
Median 0.0 15.0 250.0 ---Percentile rank of
medianXX 48.0 60.5 ---
Percent of grossincome spent ongambling
Mean (SD) 0.0 (---) 8.44 (4.60) 7.16 (4.62) --- (---) 1.64 NAMedian 0.0 0.36 2.20 ---
Percentile rank ofmedian
XX 11.0 44.5 ---
Number of gamesplayed in last year
Mean (SD) 3.00 (---) 5.89 (.63) 5.50 (.56) --- (.---) 0.17 NA
Median 3.0 5.0 5.0 ---Percentile rank of
median14.0 45.0 45.0 ---
Note: Data source – LLLP. a p < .001; b p < .01
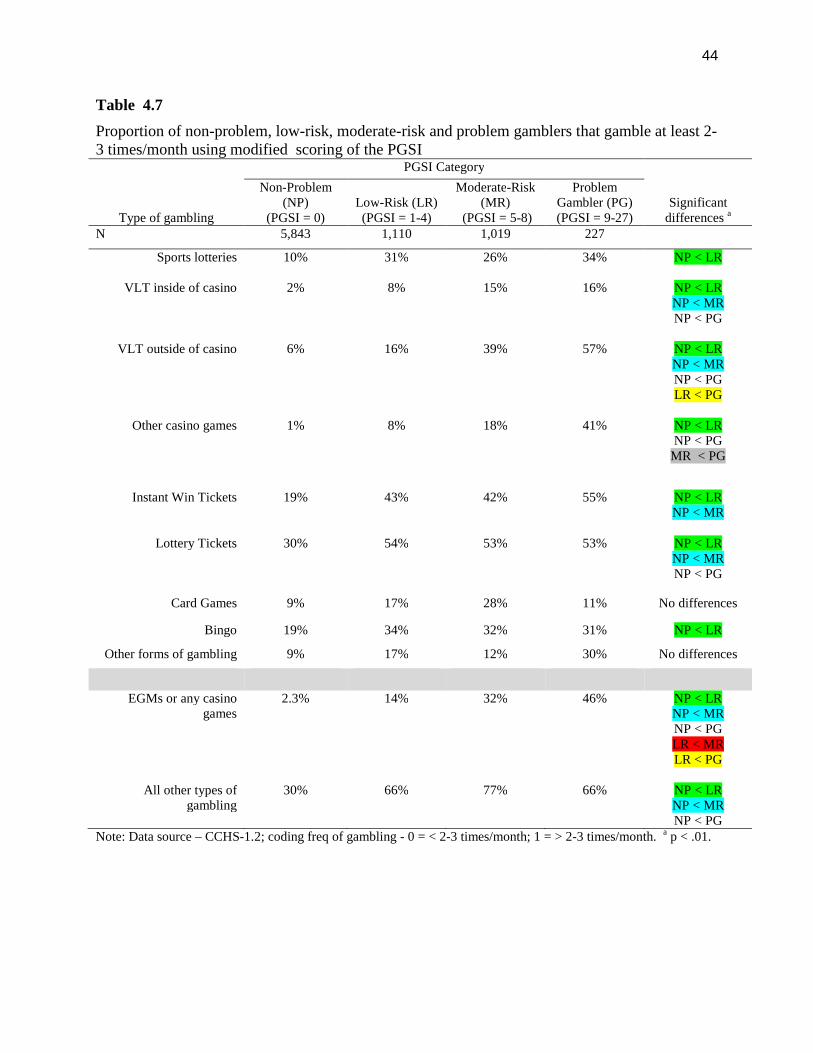
44
Table 4.7
Proportion of non-problem, low-risk, moderate-risk and problem gamblers that gamble at least 2-3 times/month using modified scoring of the PGSI
Type of gambling
PGSI Category
Significantdifferences a
Non-Problem(NP)
(PGSI = 0)Low-Risk (LR)(PGSI = 1-4)
Moderate-Risk(MR)
(PGSI = 5-8)
ProblemGambler (PG)(PGSI = 9-27)
N 5,843 1,110 1,019 227
Sports lotteries 10% 31% 26% 34% NP < LR
VLT inside of casino 2% 8% 15% 16% NP < LRNP < MRNP < PG
VLT outside of casino 6% 16% 39% 57% NP < LRNP < MRNP < PGLR < PG
Other casino games 1% 8% 18% 41% NP < LRNP < PG
MR < PG
Instant Win Tickets 19% 43% 42% 55% NP < LRNP < MR
Lottery Tickets 30% 54% 53% 53% NP < LRNP < MRNP < PG
Card Games 9% 17% 28% 11% No differences
Bingo 19% 34% 32% 31% NP < LR
Other forms of gambling 9% 17% 12% 30% No differences
EGMs or any casinogames
2.3% 14% 32% 46% NP < LRNP < MRNP < PGLR < MRLR < PG
All other types ofgambling
30% 66% 77% 66% NP < LRNP < MRNP < PG
Note: Data source – CCHS-1.2; coding freq of gambling - 0 = < 2-3 times/month; 1 = > 2-3 times/month. a p < .01.
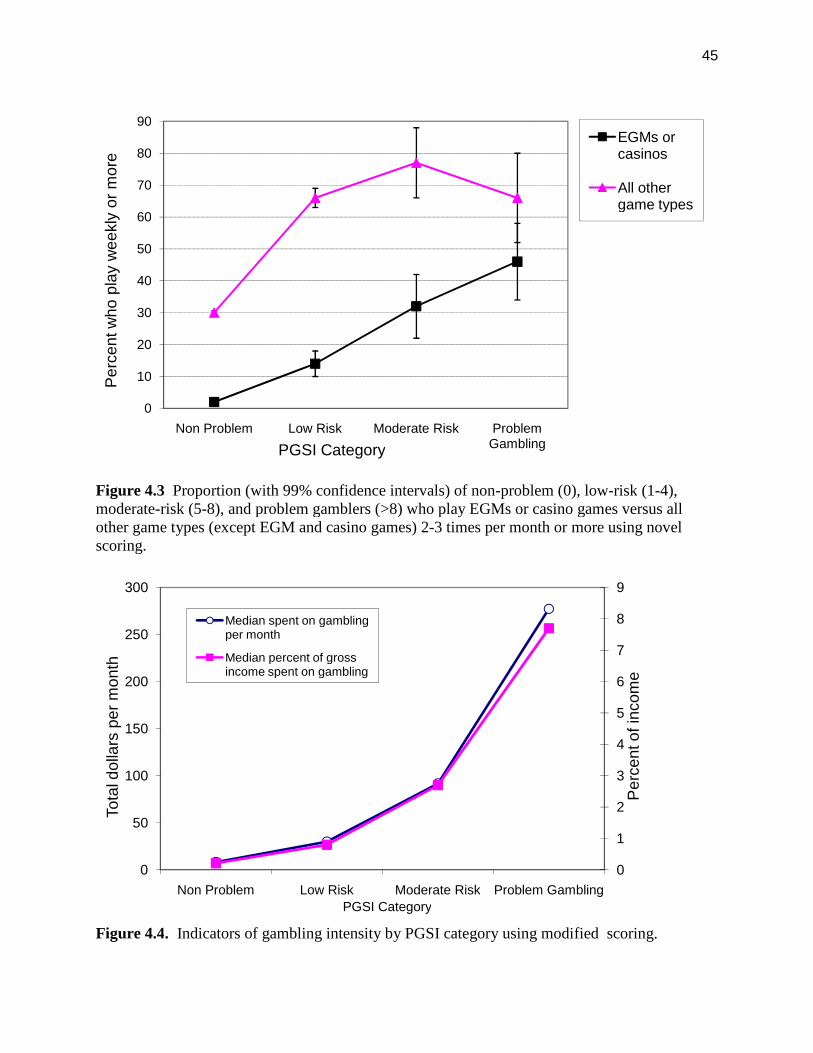
45
Figure 4.3 Proportion (with 99% confidence intervals) of non-problem (0), low-risk (1-4),moderate-risk (5-8), and problem gamblers (>8) who play EGMs or casino games versus allother game types (except EGM and casino games) 2-3 times per month or more using novelscoring.
Figure 4.4. Indicators of gambling intensity by PGSI category using modified scoring.
0
10
20
30
40
50
60
70
80
90
Non Problem Low Risk Moderate Risk ProblemGambling
Pe
rce
ntw
ho
pla
yw
ee
kly
or
mo
re
PGSI Category
EGMs orcasinos
All othergame types
0
1
2
3
4
5
6
7
8
9
0
50
100
150
200
250
300
Non Problem Low Risk Moderate Risk Problem Gambling
Pe
rce
nto
fin
com
e
To
tald
olla
rsp
er
mo
nth
PGSI Category
Median spent on gamblingper month
Median percent of grossincome spent on gambling
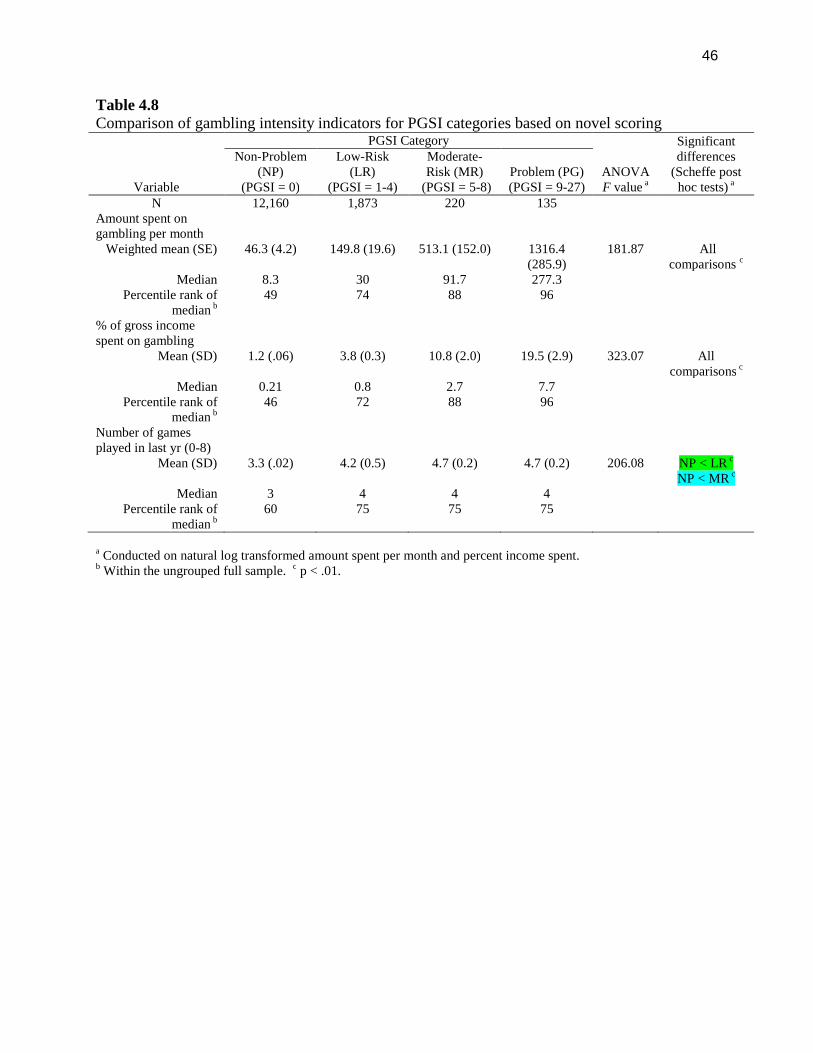
46
Table 4.8Comparison of gambling intensity indicators for PGSI categories based on novel scoring
Variable
PGSI Category
ANOVAF value a
Significantdifferences
(Scheffe posthoc tests) a
Non-Problem(NP)
(PGSI = 0)
Low-Risk(LR)
(PGSI = 1-4)
Moderate-Risk (MR)
(PGSI = 5-8)Problem (PG)(PGSI = 9-27)
N 12,160 1,873 220 135Amount spent ongambling per month
Weighted mean (SE) 46.3 (4.2) 149.8 (19.6) 513.1 (152.0) 1316.4(285.9)
181.87 Allcomparisons c
Median 8.3 30 91.7 277.3Percentile rank of
median b49 74 88 96
% of gross incomespent on gambling
Mean (SD) 1.2 (.06) 3.8 (0.3) 10.8 (2.0) 19.5 (2.9) 323.07 Allcomparisons c
Median 0.21 0.8 2.7 7.7Percentile rank of
median b46 72 88 96
Number of gamesplayed in last yr (0-8)
Mean (SD) 3.3 (.02) 4.2 (0.5) 4.7 (0.2) 4.7 (0.2) 206.08 NP < LR c
NP < MR c
Median 3 4 4 4Percentile rank of
median b60 75 75 75
a Conducted on natural log transformed amount spent per month and percent income spent.b Within the ungrouped full sample. c p < .01.
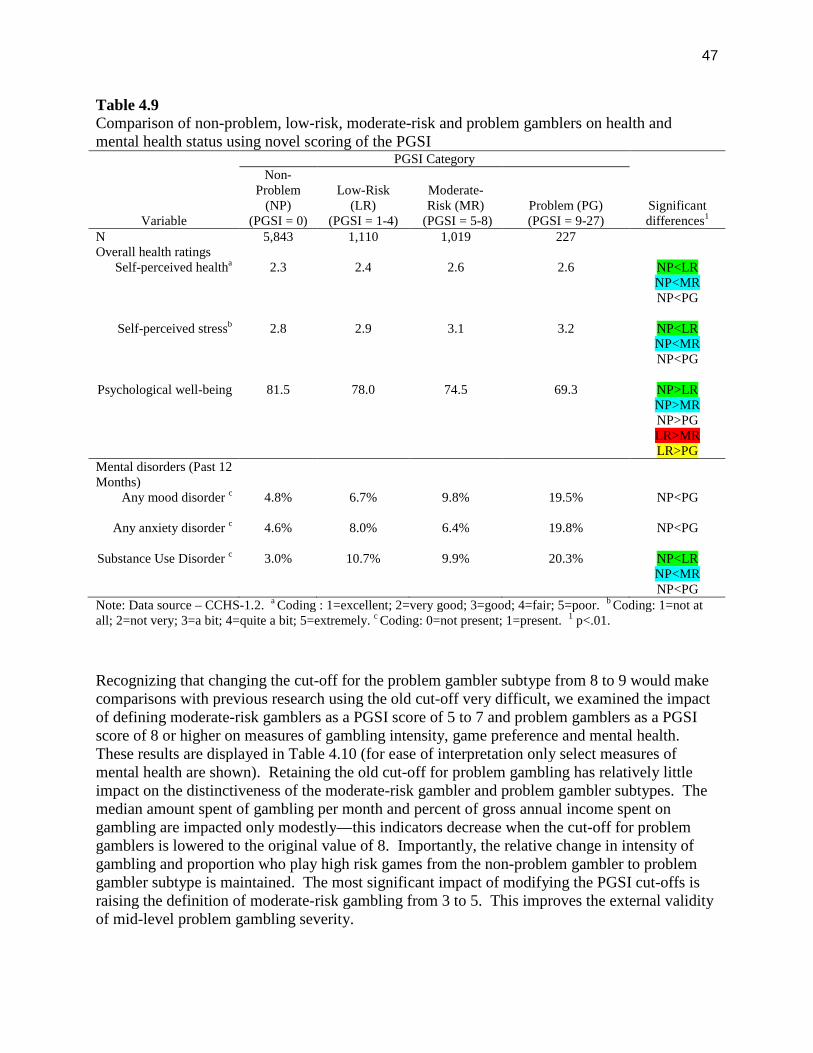
47
Table 4.9Comparison of non-problem, low-risk, moderate-risk and problem gamblers on health andmental health status using novel scoring of the PGSI
Variable
PGSI Category
Significantdifferences1
Non-Problem
(NP)(PGSI = 0)
Low-Risk(LR)
(PGSI = 1-4)
Moderate-Risk (MR)
(PGSI = 5-8)Problem (PG)(PGSI = 9-27)
N 5,843 1,110 1,019 227Overall health ratings
Self-perceived healtha 2.3 2.4 2.6 2.6 NP<LRNP<MRNP<PG
Self-perceived stressb 2.8 2.9 3.1 3.2 NP<LRNP<MRNP<PG
Psychological well-being 81.5 78.0 74.5 69.3 NP>LRNP>MRNP>PGLR>MRLR>PG
Mental disorders (Past 12Months)
Any mood disorder c 4.8% 6.7% 9.8% 19.5% NP<PG
Any anxiety disorder c 4.6% 8.0% 6.4% 19.8% NP<PG
Substance Use Disorder c 3.0% 10.7% 9.9% 20.3% NP<LRNP<MRNP<PG
Note: Data source – CCHS-1.2. a Coding : 1=excellent; 2=very good; 3=good; 4=fair; 5=poor. b Coding: 1=not atall; 2=not very; 3=a bit; 4=quite a bit; 5=extremely. c Coding: 0=not present; 1=present. 1 p<.01.
Recognizing that changing the cut-off for the problem gambler subtype from 8 to 9 would makecomparisons with previous research using the old cut-off very difficult, we examined the impactof defining moderate-risk gamblers as a PGSI score of 5 to 7 and problem gamblers as a PGSIscore of 8 or higher on measures of gambling intensity, game preference and mental health.These results are displayed in Table 4.10 (for ease of interpretation only select measures ofmental health are shown). Retaining the old cut-off for problem gambling has relatively littleimpact on the distinctiveness of the moderate-risk gambler and problem gambler subtypes. Themedian amount spent of gambling per month and percent of gross annual income spent ongambling are impacted only modestly—this indicators decrease when the cut-off for problemgamblers is lowered to the original value of 8. Importantly, the relative change in intensity ofgambling and proportion who play high risk games from the non-problem gambler to problemgambler subtype is maintained. The most significant impact of modifying the PGSI cut-offs israising the definition of moderate-risk gambling from 3 to 5. This improves the external validityof mid-level problem gambling severity.
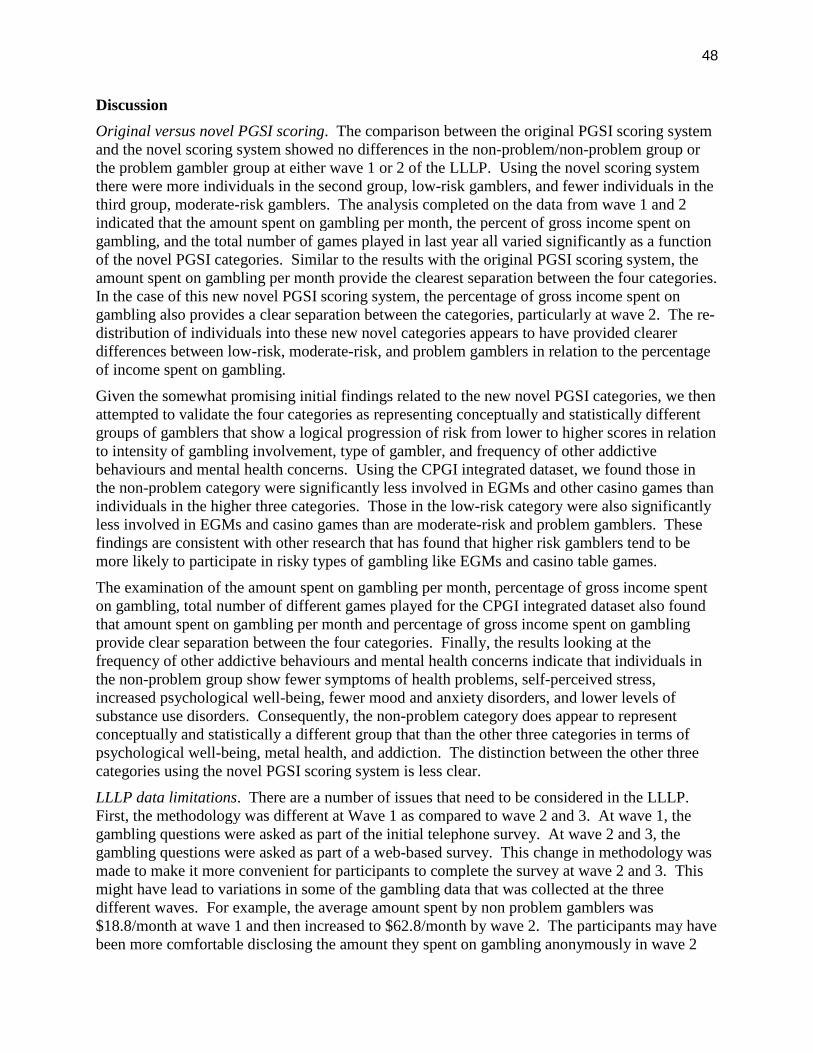
48
Discussion
Original versus novel PGSI scoring. The comparison between the original PGSI scoring systemand the novel scoring system showed no differences in the non-problem/non-problem group orthe problem gambler group at either wave 1 or 2 of the LLLP. Using the novel scoring systemthere were more individuals in the second group, low-risk gamblers, and fewer individuals in thethird group, moderate-risk gamblers. The analysis completed on the data from wave 1 and 2indicated that the amount spent on gambling per month, the percent of gross income spent ongambling, and the total number of games played in last year all varied significantly as a functionof the novel PGSI categories. Similar to the results with the original PGSI scoring system, theamount spent on gambling per month provide the clearest separation between the four categories.In the case of this new novel PGSI scoring system, the percentage of gross income spent ongambling also provides a clear separation between the categories, particularly at wave 2. The re-distribution of individuals into these new novel categories appears to have provided clearerdifferences between low-risk, moderate-risk, and problem gamblers in relation to the percentageof income spent on gambling.
Given the somewhat promising initial findings related to the new novel PGSI categories, we thenattempted to validate the four categories as representing conceptually and statistically differentgroups of gamblers that show a logical progression of risk from lower to higher scores in relationto intensity of gambling involvement, type of gambler, and frequency of other addictivebehaviours and mental health concerns. Using the CPGI integrated dataset, we found those inthe non-problem category were significantly less involved in EGMs and other casino games thanindividuals in the higher three categories. Those in the low-risk category were also significantlyless involved in EGMs and casino games than are moderate-risk and problem gamblers. Thesefindings are consistent with other research that has found that higher risk gamblers tend to bemore likely to participate in risky types of gambling like EGMs and casino table games.
The examination of the amount spent on gambling per month, percentage of gross income spenton gambling, total number of different games played for the CPGI integrated dataset also foundthat amount spent on gambling per month and percentage of gross income spent on gamblingprovide clear separation between the four categories. Finally, the results looking at thefrequency of other addictive behaviours and mental health concerns indicate that individuals inthe non-problem group show fewer symptoms of health problems, self-perceived stress,increased psychological well-being, fewer mood and anxiety disorders, and lower levels ofsubstance use disorders. Consequently, the non-problem category does appear to representconceptually and statistically a different group that than the other three categories in terms ofpsychological well-being, metal health, and addiction. The distinction between the other threecategories using the novel PGSI scoring system is less clear.
LLLP data limitations. There are a number of issues that need to be considered in the LLLP.First, the methodology was different at Wave 1 as compared to wave 2 and 3. At wave 1, thegambling questions were asked as part of the initial telephone survey. At wave 2 and 3, thegambling questions were asked as part of a web-based survey. This change in methodology wasmade to make it more convenient for participants to complete the survey at wave 2 and 3. Thismight have lead to variations in some of the gambling data that was collected at the threedifferent waves. For example, the average amount spent by non problem gamblers was$18.8/month at wave 1 and then increased to $62.8/month by wave 2. The participants may havebeen more comfortable disclosing the amount they spent on gambling anonymously in wave 2
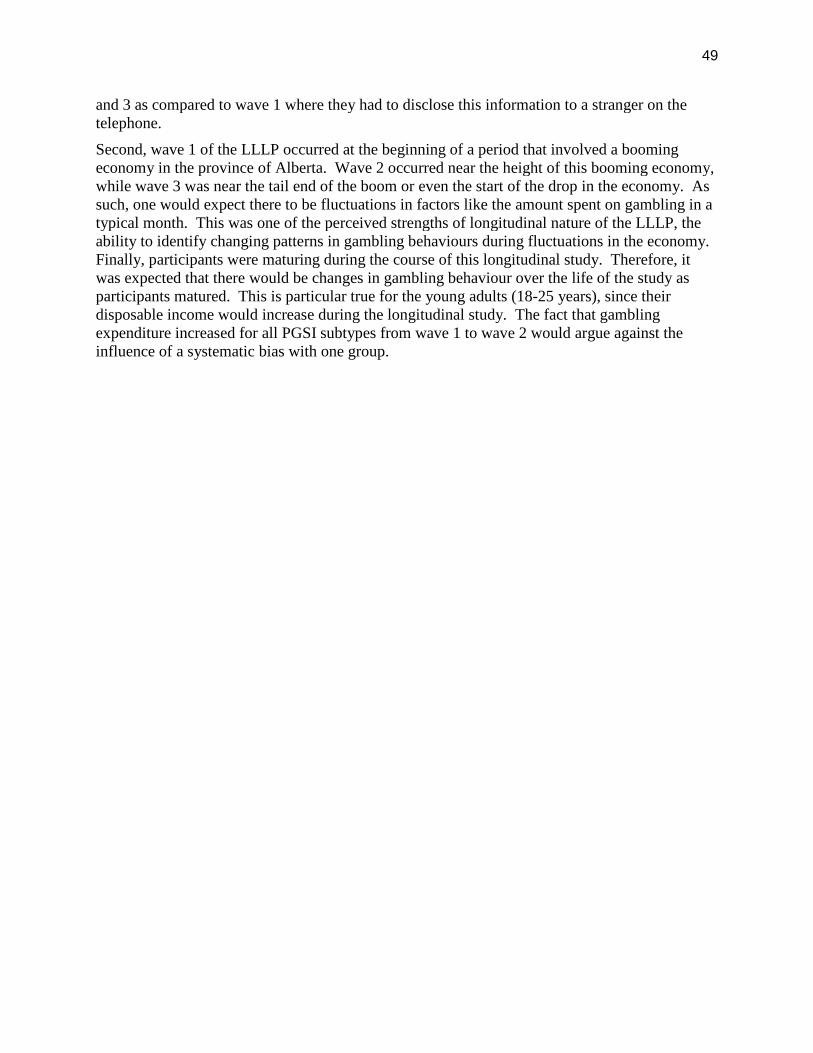
49
and 3 as compared to wave 1 where they had to disclose this information to a stranger on thetelephone.
Second, wave 1 of the LLLP occurred at the beginning of a period that involved a boomingeconomy in the province of Alberta. Wave 2 occurred near the height of this booming economy,while wave 3 was near the tail end of the boom or even the start of the drop in the economy. Assuch, one would expect there to be fluctuations in factors like the amount spent on gambling in atypical month. This was one of the perceived strengths of longitudinal nature of the LLLP, theability to identify changing patterns in gambling behaviours during fluctuations in the economy.Finally, participants were maturing during the course of this longitudinal study. Therefore, itwas expected that there would be changes in gambling behaviour over the life of the study asparticipants matured. This is particular true for the young adults (18-25 years), since theirdisposable income would increase during the longitudinal study. The fact that gamblingexpenditure increased for all PGSI subtypes from wave 1 to wave 2 would argue against theinfluence of a systematic bias with one group.
50
Table 4.10Comparison of gambling intensity indicators for PGSI categories based on novel scoring thatretains the PGSI = 8 as cut-off for problem gambling
Variable
PGSI Category
ANOVAF value a
Significantdifferences
(Scheffe posthoc tests) a
Non-Problem(NP)
(PGSI = 0)
Low-Risk(LR)
(PGSI = 1-4)
Moderate-Risk (MR)(PGSI = 5-8)
ProblemGambler (PG)(PGSI = 9-27)
N 12,160 1,873 187 168Amount spent ongambling per month
Weighted mean (SE) 46.3 (4.2) 149.8 (19.6) 547.5 (208.7) 1101.5(222.5)
168.01 Allcomparisons c
Median 8.3 30 100 250Percentile rank of
median b49 74 88 96
% of gross incomespent on gambling
Mean (SD) 1.2 (.06) 3.8 (0.3) 9.9 (1.8) 17.9 (2.5) 318.89 Allcomparisons c
Median 0.21 0.8 2.7 7.1Percentile rank of
median b46 72 88 96
Game preferenceEGMs or any casino
games2.3% 14% 27% 47% NP < LR
NP < MRNP < PGLR < MRLR < PG
All other types ofgambling
30% 66% 75% 72% NP < LRNP < MRNP < PG
Mental disorders (Past12 Months)
Any mood disorder c 4.8% 6.7% 8.4% 18.2% NP<PGLR>PG
Any anxiety disorder c 4.6% 8.0% 6.3% 15.9% NP<PGLR>PG
Substance UseDisorder c
3.0% 10.7% 9.8% 17.3% NP<LRNP<MRNP<PG
a Conducted on natural log transformed amount spent per month and percent income spent.b Within the ungrouped full sample. c p < .01.
51
Study 2 – Validity of a Percentile-based PGSI Scoring System
Objectives
The purpose of this study was to determine if more meaningful categories of risk could bedeveloped using the population distribution of a key indicator of gambling intensity—percent ofincome spent on gambling— as the basis for gambler subtypes. After creating the novelcategories, we compared the new groups on measures of gambling intensity, types of gamesplayed, and frequency of other mental health concerns to determine if the four new groupingsbetter separate subpopulations of gamblers than the categories based on the original scoring.
Method
The four categories of risk for problem gambling were defined based on deviation frompopulation norms for gambling involvement. Using the CPGI integrated dataset, these fourgroups were defined as follows:
Non-problem gamblers - individuals with a percent of income spent on gambling beingno greater than ½ standard deviation of the population norm (0th to 70th percentile);
Low-risk gamblers - individuals who stay below 1½ standard deviation of the populationnorm (71st to 84th percentile);
Moderate-risk gamblers – individuals who gamble 1½ standard deviation above thepopulation norm but below 2½ standard deviations (85th to 98th percentile);
Problem gamblers – individuals gambling more than 2½ standard deviations above thepopulation norm (ie., exceeding the 98th percentile).
The median PGSI score within each risk group was used to define the cut-offs and range ofscores.
Results
Table 4.11 compares the indices of gambling intensity among the PGSI categories based on thenovel scoring using percentile rank. The novel scoring does not improve the distribution ofgambling intensity values or separation between the PGSI categories. There remains a largeincrease in median percent of income and total gambling expenditures between the moderate-riskgambling and problem gambling groups (see Figure 4.5). The difference between low-risk andmoderate-risk gamblers on these indices was relatively small. The change in scoring had littleimpact on the non-problem grouping which is not surprising given that the typical non-problemgambler under the original scoring represented gambling expenditures at the 50th percentile forthe Canadian population. The proportion of gamblers that play different game types 2-3 timesper week or more also did not show much change with the novel scoring categories (Table 4.21).Of note, the average PGSI score for problem gamblers was 4.0 suggesting a lower cut-off may bejustified to identify individuals who gambler more than 98% of the population.
Discussion
Overall, these findings suggest there is little value added by classifying individuals as non-problem, low-risk, moderate-risk, or problem gamblers according to percentile ranks rather thancut-off scores of the PGSI total index. The resulting categories are very similar to the originalPGSI subtypes.
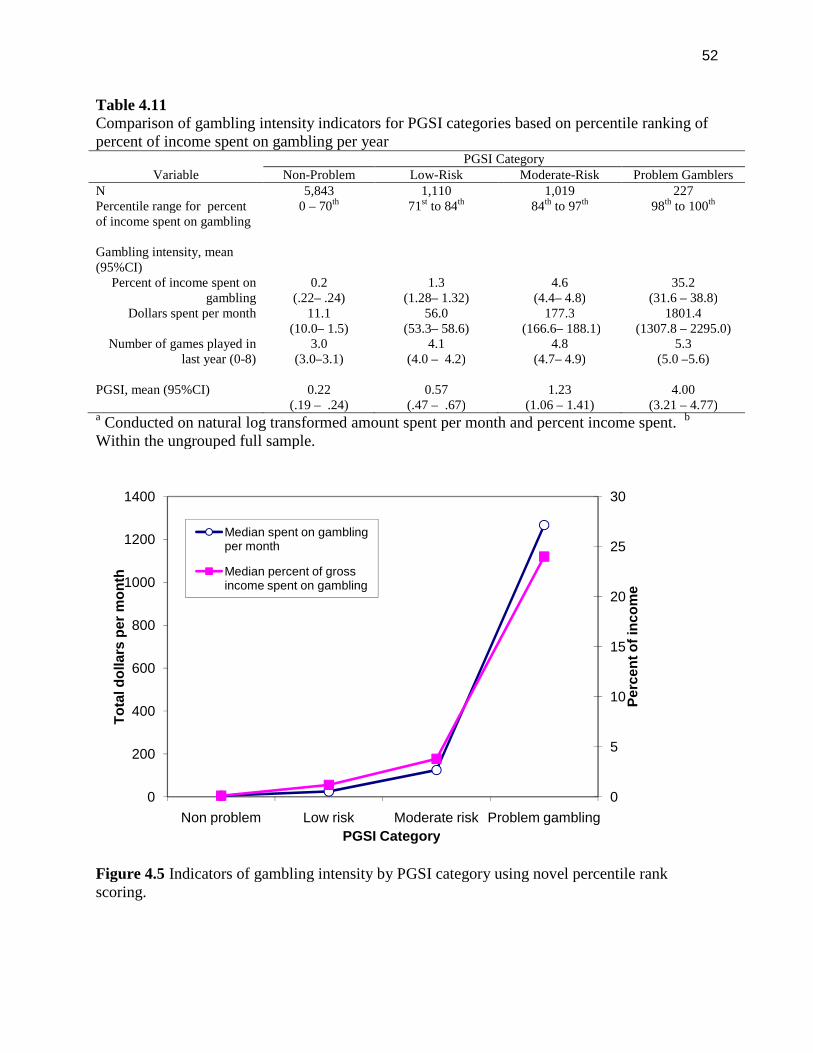
52
Table 4.11Comparison of gambling intensity indicators for PGSI categories based on percentile ranking ofpercent of income spent on gambling per year
VariablePGSI Category
Non-Problem Low-Risk Moderate-Risk Problem GamblersN 5,843 1,110 1,019 227Percentile range for percentof income spent on gambling
0 – 70th 71st to 84th 84th to 97th 98th to 100th
Gambling intensity, mean(95%CI)
Percent of income spent ongambling
0.2(.22– .24)
1.3(1.28– 1.32)
4.6(4.4– 4.8)
35.2(31.6 – 38.8)
Dollars spent per month 11.1(10.0– 1.5)
56.0(53.3– 58.6)
177.3(166.6– 188.1)
1801.4(1307.8 – 2295.0)
Number of games played inlast year (0-8)
3.0(3.0–3.1)
4.1(4.0 – 4.2)
4.8(4.7– 4.9)
5.3(5.0 –5.6)
PGSI, mean (95%CI) 0.22(.19 – .24)
0.57(.47 – .67)
1.23(1.06 – 1.41)
4.00(3.21 – 4.77)
a Conducted on natural log transformed amount spent per month and percent income spent. b
Within the ungrouped full sample.
Figure 4.5 Indicators of gambling intensity by PGSI category using novel percentile rankscoring.
0
5
10
15
20
25
30
0
200
400
600
800
1000
1200
1400
Non problem Low risk Moderate risk Problem gambling
Pe
rce
nt
of
inc
om
e
To
tald
olla
rsp
er
mo
nth
PGSI Category
Median spent on gamblingper month
Median percent of grossincome spent on gambling
53
Study 3 – Reliability of the Dichotomous PGSI Scoring System
Objectives
The second alternate scoring system to recalibrate the PGSI categories uses dichotomous scoresfor original 9 items that make up the PGSI. Although the PGSI has a range of 0 to 27, less thanone percent of the population has scores exceeding 9 or 10. Furthermore, the range of responsesto individual items suggest most individuals use only the ‘never’ and ‘sometimes’ categories.The reliability of dichotomous scoring of the PGSI items (range 0 to 9) was assessed with theLLLP data. Four categories of scores were created (0, 1-3, 4-7, and 8-9) that correspond to: non-problem gamblers, low-risk gamblers, moderate-risk gamblers, and problem gamblers.
Method
An intraclass correlation coefficient (ICC) was calculated to examine the temporal reliability ofthe new dichotomous PGSI scoring system at wave 1 and 2 in the LLLP. A reliable changeindex 35 was calculated as a way of capturing the natural change in novel dichotomous PGSIscoring system over time. Here we used the PGSI’s published test-retest reliability coefficient of0.78. The original scoring system for the PGSI would be seen to have flaws if more than 25% ofthe LLLP participants shift PGSI categories between wave 1 and 2 without a correspondingincrease in their gambling involvement.
Results
The comparison between the original PGSI scoring and the novel dichotomous scoring systemproposed here can be found in Table 4.11 (or Figure 4.1 and 4.2). The test-retest reliability forthe novel dichotomous PGSI was computed. The results found an intraclass correlationcoefficient of r = .71 (F = 5.881, p < .001). Again for the dichotomous scoring method, thereliable change index was not calculated for participants that scored 0 on the PGSI score at bothwave 1 and 2. Consequently, the results of the analysis on the remaining 297 individuals showedthat 116 individuals (14.3% of original 808) had a reliable change in their score from wave 1 to 2.Specifically, 35 individuals had a reliable change index score that was below -1.96 and another81 individuals had a reliable change index score that was above +1.96. The remaining 181individuals did not show a statistically significant change in their score, with values between -1.96 and +1.96.
Discussion
There is no difference in the non-problem group at either wave 1 or 2 of the LLLP. With thenovel dichotomous scoring system there were more individuals in the second group, low-riskgamblers, and fewer individuals in the third group, moderate-risk gamblers. Finally, the problemor problem groups were virtually identical in the original and novel dichotomous scoring systemfor the PGSI. When comparing the novel scoring system and the novel dichotomous scoringsystem for the PGSI, it is evident that the non-problem group is identical and the problem groupis virtually identical. The difference occurs in the two middle groups, with novel scoring systemhaving more individuals in the low-risk gambling group and fewer in the moderate-risk gamblinggroup, while the novel dichotomous scoring system has fewer in the low-risk gambling groupand more in the moderate-risk gambling group.
One important issue to consider going forward is which way of categorizing the PGSI should beused: the original scoring system, the novel scoring system, or the novel dichotomous scoringsystem? As mentioned early, very few individuals score above 9 on the PGSI and most only use
54
the two lowest options in the Likert scale for the 9-items. Based on the reliable change index,the original scoring system appears to be superior to the new novel dichotomous scoring systemin terms of assessing gambling behaviour over time. There is still the issue of very fewindividuals scoring above 9 on the PGSI. What impact does this somewhat restricted range (0-9)have on the specificity of the measure? It would be useful to examine the change over time inPGSI scores in another longitudinal study to see if similar findings are reached in relation to thereliability change index.
Section 5
Factor Analysis and Latent Trait Modeling
Study 1 - Factor Structure Analysis
Objective
The purpose of this set of analyses was to explore and confirm the factor structure of the PGSIitems scored using Likert response categories (0 = never, 1 = sometimes, 2 = most of the time, 3= almost always) and dichotomously (0 = never, 1 = sometimes, most of the time, almost always).Based upon the scale development and previous research 18;38 a one factor structure washypothesized. We also hypothesized a high level of internal reliability. However, Orford at al. 18
and Young et al. 39 found differential item endorsement for a number of PGSI items, which mayindicate that the items are measuring different constructs for men and women. Therefore, thefactor invariance across gender was also examined. In addition, factor invariance across age,income, and type of game was explored as these are additional factors that are associated withprevalence of gambling problems.
Method
The data file of 25,584 cases was randomly split into two databases. Exploratory factor analyseswere conducted on the first half and confirmatory analysis of the structure was performed on thesecond half. Both analyses were conducted with items scored using the Likert scale and repeatedwith items scored dichotomously. Principal components analysis was used for the exploratoryfactor analysis using SPSS V 17 for the Likert data and Stata V.11 for the dichotomous data.Confirmatory factor analyses were conducted using AMOS V17. Internal reliability of thesummed total score was estimated using coefficient alpha (SPSS. V. 17). Factor invarianceacross gender, age, type of game and income was assessed using confirmatory factor analysis ofthe total data file.
Results
Exploratory Factor Analysis
Principal components analysis (PCA) was used to explore the factor structure of the nine PGSIitems. Two analysis were conducted, one with items using the four Likert response categoriesand the other with the dichotomously scored items. Because of the very small amount of missingitem data (from 9 to 22 cases, M = 11.8), mean substitution was used to replace the missingvalues.
For the four response items, a Pearson correlation matrix was used in the PCA. The Kaiser-Meyer-Olkin Measure of Sampling Adequacy was .925, indicating good factorability of the
55
matrix. PCA revealed a clear one component solution, accounting for 49.8% of the variance(Eigenvalue = 4.48). The Eigenvalue for the second unrotated component was comparablysmall, 0.76. Item communalities ranged from .36 to .60 and all items loaded strongly on the firstcomponent as shown in Table 5.1.
For the dichotomous items, a tetrachoric correlation matrix was used in the PCA. Again, PCArevealed a clear one component solution, accounting for 77.6% of the variance (Eigenvalue =6.99). The Eigenvalue for the second unrotated component was comparably small, 0.39. Itemcommunalities ranged from .70 to .87 and all items loaded strongly on the first component asshown in Table 5.1. The ordering of the items based upon the strength of their loadings wasgenerally similar between the dichotomous items and the Likert response option items (e.g., thestrongest and weakest three items were the same in both analyses) although the strength of theloadings was generally higher for the dichotomous items. This finding may reflect that the itemsare mostly measuring the presence versus absence of an impact versus degree of impact.
Confirmatory Factor Analysis
A one-factor structural equation model of the PGSI Likert response category items showed goodfit to the data, despite a significant χ2 (27) = 2393.6 (CFI = .972; RMSEA = .059 [90%CI .057 -.061]). Hu and Bentler 40 suggest that CFI > .95 and RMSEA < .06 represent good fit. Because
item data were positively skewed, bootstrapping was used to estimate parameter confidenceintervals. As shown in figure 5.1, all model parameters were significant.
For the dichotomous items, the Bayesian estimation approach was used to estimate the structuralequation model 41. The parameters estimates were almost identical to those produced by themaximum likelihood approach. The dichotomous items also showed good fit for a one factormodel, χ2 (27) = 1026.2; CFI = .969; RMSEA = .054 (90% CI .051, .056. Figure 5.2 displays thestandardized parameter estimates.
Reliability Analysis
Corrected item-total correlations for the summed total score ranged from .49 to .70 for the Likertresponse items (M r = .61) and .41 to .64 for the dichotomous items (M r = .54). Coefficientalphas were .86 and .82 respectively. Neither coefficient alpha increased with the deletion of anyitem.
Subgroup Factor Structure Invariance
Gender. Because men and women differ in terms of their gambling involvements and theprevalence of gambling problems, structural equation modeling was used to examine theinvariance of the PGSI items loadings across gender. The entire data set was used for theseanalyses using Likert response items. The first step examined the invariance of the configural(overall) model. Fit indices showed that the overall model is similar for men and women, χ2 (81)= 3947; CFI = .970; RMSEA = .035. The second step tested whether the parameter loadingsdiffer by comparing the change in χ2 and CFI indices when the parameters are constrained to beidentical for men and women. The change in Chi square was χ2 (161) = 366, which is statisticallysignificant, but the change CFI = .007 was less than the suggested cut off of .01 for a meaningfuldifference 41. Figure 5.3 shows that there are some minor differences in the loadings for mostitems but no major differences.
Age. Because the prevalence of gambling and gambling problems vary according to age, asimilar analysis was conducted to examine the invariance of PGSI item loadings in different age
56
groups. The age categories used in the different samples were not consistent but we were able toconstruct three meaningful age groups that could be coded in all databases, age 18 to 24 years(young adults), 25 to 64 years (adults), and age 65 and order (older adults). The first step showedthat the overall model is similar for the three age groups, χ2 (81) = 3028; CFI = .964; RMSEA= .035. In the second step the change in Chi square was χ2 (16) = 1162, which is statisticallysignificant, and the change CFI = .014 was slightly greater than the suggested cut off of .01 for ameaningful difference 41. Figure 5.4 displays the item loadings for the three age groups. Follow-up analyses using the methods proposed by Byrne (2010) indicated that loadings for thetolerance, chasing and criticizing items do not differ significantly among the three groups.Inspection of the loadings for the remaining items did not reveal any strong differences althoughthe older group has generally lower loadings across the items and the middle group the strongestloadings overall. None of the differences are sufficiently large to indicate that differential itemselection or weighting is warranted in scoring the PGSI scale for different age groups.
Type of Game. Because electronic gaming machines and casinos games have been identified asparticularly problematic types of gambling (most treatment seekers in Canada report problemswith these games) we examined the invariance of the PGSI items loadings across individualswho play these games and those who do not. The entire data set was used for these analyses.The first step examined the invariance of the configural (overall) model. Fit indices showed thatthe overall model is similar for both groups, χ2 (54) = 2833; CFI = .958; RMSEA = .045. Thesecond step tested whether the parameter loadings differ by comparing the change in χ2 and CFIindices when the parameters are constrained to be identical for both groups. The change in Chisquare was χ2 (8) = 552, which is statistically significant, but the change CFI = .009 was lessthan the suggested cut off of .01 for a meaningful difference. 41 Figure 5.4 shows that theloadings for most items are higher for electronic gaming machine or casino players versusplayers of other games.
Income. The final analysis examined the invariance of the PGSI items loadings across threeincome groups (less than $30000, $30000 – $50000, more than $50000). The first step examinedthe invariance of the configural (overall) model. Fit indices showed that the overall model issimilar for the three subgroups, χ2 (81) = 2747; CFI = .962; RMSEA = .039. The second steptested whether the parameter loadings differ by comparing the change in χ2 and CFI indiceswhen the parameters are constrained to be identical for the three subgroups. The change in Chisquare was χ2 (16) = 373, which is statistically significant, but the change CFI = .005 was lessthan the suggested cut off of .01 for a meaningful difference (41,. Figure 5.6 shows that there aresome minor differences in the loadings for most items but no major differences.
Discussion
The exploratory and confirmatory factor analyses revealed a one factor structure for the ninePGSI items. The item factor loadings for the dichotomous scoring were slightly higher than theloadings for the Likert scored items in the exploratory analysis but they were equivalent in theconfirmatory analysis. The confirmatory model fit was good for both the Likert scoring and thedichotomous scoring. The internal reliability was slightly higher for the Likert scoring (.86vs. .82) and was comparable to the value reported in the development sample (.84)8. Holtgrave38 also reported α = .86 for a subset of these Canadian data and Orford at al 18 reported α = .90 forthe British population survey.
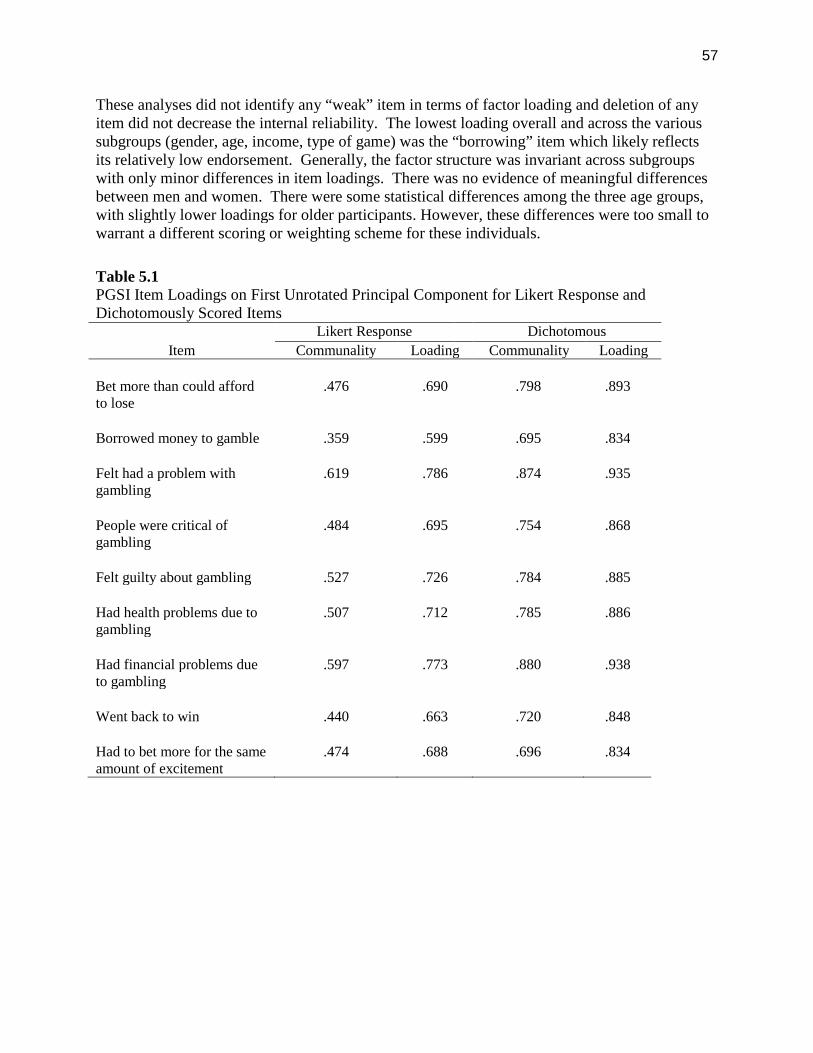
57
These analyses did not identify any “weak” item in terms of factor loading and deletion of anyitem did not decrease the internal reliability. The lowest loading overall and across the varioussubgroups (gender, age, income, type of game) was the “borrowing” item which likely reflectsits relatively low endorsement. Generally, the factor structure was invariant across subgroupswith only minor differences in item loadings. There was no evidence of meaningful differencesbetween men and women. There were some statistical differences among the three age groups,with slightly lower loadings for older participants. However, these differences were too small towarrant a different scoring or weighting scheme for these individuals.
Table 5.1PGSI Item Loadings on First Unrotated Principal Component for Likert Response andDichotomously Scored Items
Likert Response Dichotomous
Item Communality Loading Communality Loading
Bet more than could affordto lose
.476 .690 .798 .893
Borrowed money to gamble .359 .599 .695 .834
Felt had a problem withgambling
.619 .786 .874 .935
People were critical ofgambling
.484 .695 .754 .868
Felt guilty about gambling .527 .726 .784 .885
Had health problems due togambling
.507 .712 .785 .886
Had financial problems dueto gambling
.597 .773 .880 .938
Went back to win .440 .663 .720 .848
Had to bet more for the sameamount of excitement
.474 .688 .696 .834
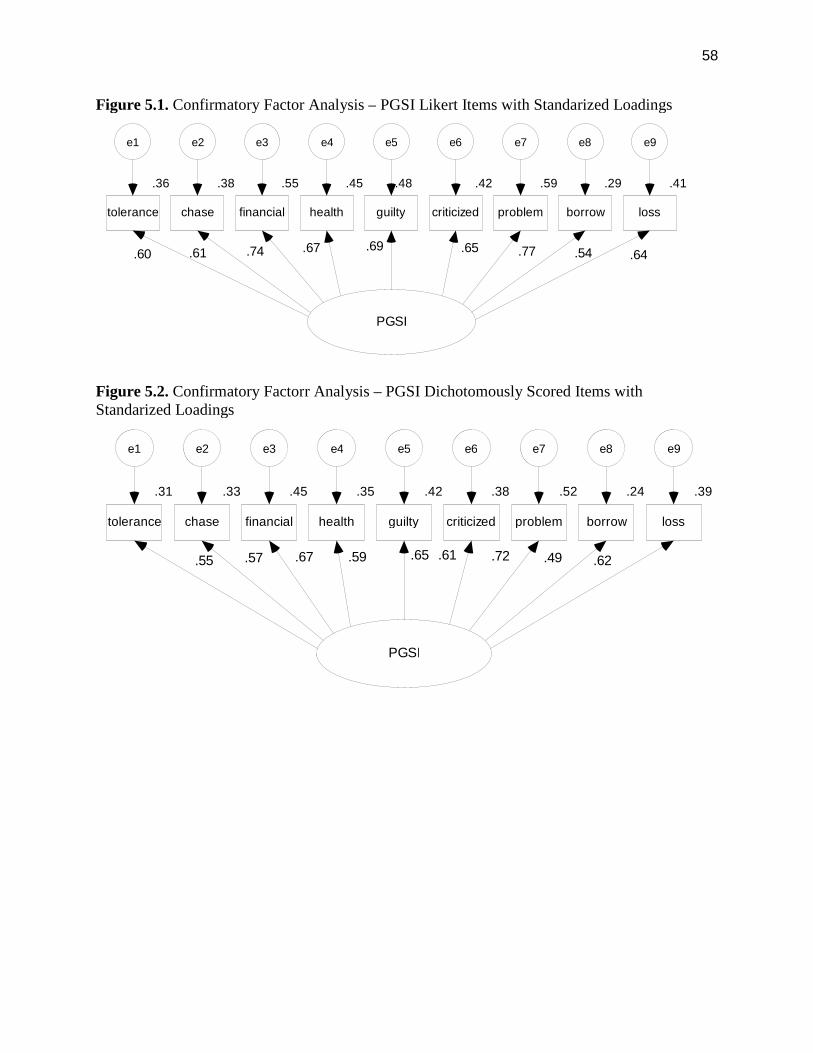
58
Figure 5.1. Confirmatory Factor Analysis – PGSI Likert Items with Standarized Loadings
Figure 5.2. Confirmatory Factorr Analysis – PGSI Dichotomously Scored Items withStandarized Loadings
PGSI
.36
tolerance
e1
.60
.38
chase
e2
.55
financial
e3
.45
health
e4
.67
.48
guilty
e5
.69
.42
criticized
e6
.65
.59
problem
e7
.29
borrow
e8
.41
loss
e9
.61 .64.54.74 .77
PGSI
.31
tolerance
e1
.55
.33
chase
e2
.45
financial
e3
.35
health
e4
.59
.42
guilty
e5
.65
.38
criticized
e6
.52
problem
e7
.24
borrow
e8
.39
loss
e9
.62.67 .61 .49.72.57
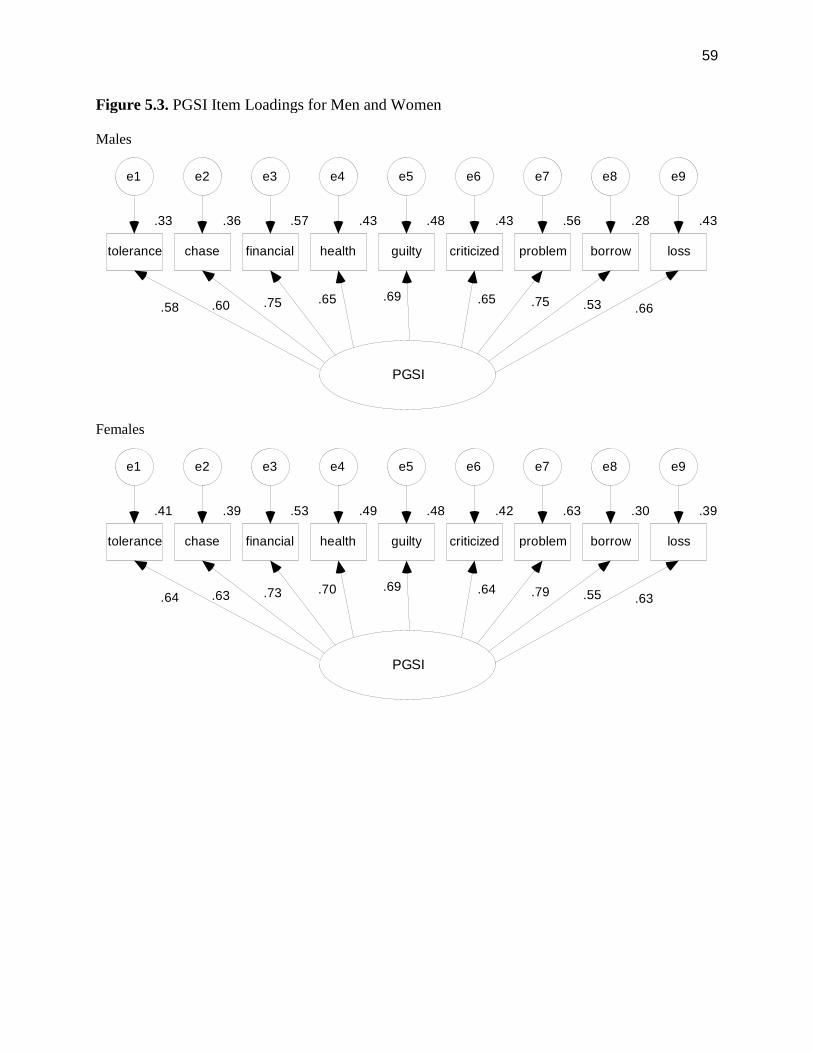
59
Figure 5.3. PGSI Item Loadings for Men and Women
Males
Females
PGSI
.33
tolerance
e1
.58
.36
chase
e2
.57
financial
e3
.43
health
e4
.65
.48
guilty
e5
.43
criticized
e6
.65
.56
problem
e7
.28
borrow
e8
.43
loss
e9
.69.75 .75.66.53.60
PGSI
.41
tolerance
e1
.64
.39
chase
e2
.53
financial
e3
.49
health
e4
.70
.48
guilty
e5
.42
criticized
e6
.64
.63
problem
e7
.30
borrow
e8
.39
loss
e9
.69.73 .79.63.55.63
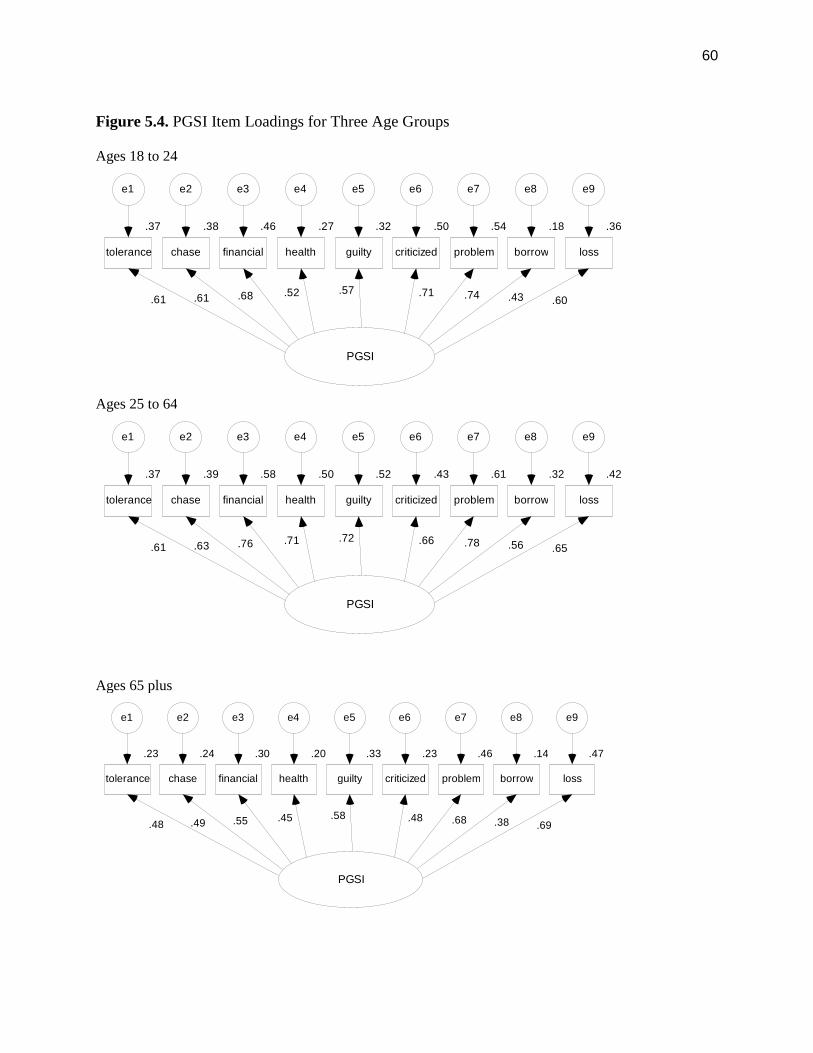
60
Figure 5.4. PGSI Item Loadings for Three Age Groups
Ages 18 to 24
Ages 25 to 64
Ages 65 plus
PGSI
.37
tolerance
e1
.61
.38
chase
e2
.46
financial
e3
.27
health
e4
.52
.32
guilty
e5
.50
criticized
e6
.71
.54
problem
e7
.18
borrow
e8
.36
loss
e9
.57.68 .74 .60.43.61
PGSI
.37
tolerance
e1
.61
.39
chase
e2
.58
financial
e3
.50
health
e4
.71
.52
guilty
e5
.43
criticized
e6
.66
.61
problem
e7
.32
borrow
e8
.42
loss
e9
.72.76 .78 .65.56.63
PGSI
.23
tolerance
e1
.48
.24
chase
e2
.30
financial
e3
.20
health
e4
.45
.33
guilty
e5
.23
criticized
e6
.48
.46
problem
e7
.14
borrow
e8
.47
loss
e9
.58.55 .68 .69.38.49
61
Figure 5.5 PGSI Item Loading for Indivduals who Play Electronic Gambing Machines orCasino Games versus Individuals Playing Other Games Only
Electronic Gaming Machines or Casino Game Players
Other Games Only
PGSI
.39
tolerance
e1
.62
.42
chase
e2
.58
financial
e3
.47
health
e4
.69
.51
guilty
e5
.46
criticized
e6
.67
.62
problem
e7
.31
borrow
e8
.46
loss
e9
.72.76 .79
.68.55.64
PGSI
.20
tolerance
e1
.45
.24
chase
e2
.39
financial
e3
.35
health
e4
.59
.28
guilty
e5
.25
criticized
e6
.50
.41
problem
e7
.28
borrow
e8
.21
loss
e9
.53.62 .64
.46.52.49
62
Figure 5.6. PGSI Item Loadings for Three Income GroupsLower Income (less than $30000)
Middle Income ($30000 to $50000)
Higher Income (more than $50000)
PGSI
.38
tolerance
e1
.62
.42
chase
e2
.52
financial
e3
.46
health
e4
.68
.53
guilty
e5
.44
criticized
e6
.67
.57
problem
e7
.26
borrow
e8
.40
loss
e9
.73.72 .75 .63.51.65
PGSI
.40
tolerance
e1
.63
.37
chase
e2
.52
financial
e3
.44
health
e4
.67
.44
guilty
e5
.40
criticized
e6
.63
.62
problem
e7
.33
borrow
e8
.39
loss
e9
.67.72 .79
.63.57.61
PGSI
.30
tolerance
e1
.54
.34
chase
e2
.54
financial
e3
.42
health
e4
.65
.49
guilty
e5
.41
criticized
e6
.64
.60
problem
e7
.27
borrow
e8
.42
loss
e9
.70.74 .77 .65.52.59
63
Study 2 - Evaluating Item Fit to the Rasch Rating-scale Model
Objectives
The purpose of this study was to assess how well the PGSI in its present form assesses thecontinuum of problem gambling severity in the general population. The Rasch model is a typeof polytomous item response theory (IRT) model that is appropriate for Likert scaled items. TheRasch method analyzes item response patterns to characterize the performance of individualitems in measuring the underlying construct of problem gambling severity. In this model itemsand people are scaled on the same metric. For the present study, we used the Rasch model to:(1) estimate the relative severity of problem gambling being assessed by each item; (2) assess theorder in which symptoms covered by the PGSI are likely to be endorsed as severity increases; (3)assess the standard error of measurement associated with each item and the full range of PGSIscores, and; (4) determine whether applying dichotomous scoring to the PGSI items improves theassessment of problem gambling severity.
Method
A Rasch model was fitted to the merged CPGI integrated and CCHS-1.2 dataset (N=25,584).The same dataset and inclusion criteria used in the factor structure analysis were applied to theRasch analysis except we employed the full sample from the merged datafile rather than splittingthe file. The WINSTEPS program was used in this analysis. Because all the PGSI items havethe same ordinal scale with the assumption that item response steps were comparable for allitems (i.e., going from one step to the next is constant across items), we examined the fit ofrating-scale model rather than the partial credit model 42.
Results
Testing the assumption of unidimensionality
Unidimensionality of the latent construct is an assumption of item response theory 43. Theprincipal components analysis and confirmatory factor analysis reported earlier in this reportconfirmed the presence of a single factor underlying the PGSI when the full Likert responsescale is used. The eigenvalue for the first factor was 4.48, significantly larger than the value forthe second factor (0.76). The first factor accounted for 50% of the total variance.
Item-level Estimates of Problem Severity
Table 5.2 presents the item parameters for all nine PGSI items. The first column (%) indicatesthe prevalence of a positive endorsement of each item (i.e., a non-zero score) within the sampleof past-year gamblers. The most commonly reported symptoms were ‘feeling guilty aboutgambling’, ‘chasing losses’, and ‘betting more than one could afford to lose’. The next columnshows each item’s severity index. The severity index (also known as item difficulty) conveys thepoint along the continuum where there is a 50% chance of the symptom being present 44. Eachitem’s severity in a Rasch model is standardized so that the average of all items is 0. Severityestimates greater than 0 reflect items that assess symptoms of problem gambling that are moresevere than the mean level of severity for the PGSI scale. The rank order of symptoms by severityindex provides an indication of the specific types of problems that are more likely to appear asproblem gambling severity increases. Symptoms that are typical at low levels of problemgambling severity include feeling guilty about gambling, chasing losses, and betting more thanone can afford to lose. These symptoms may provide the most useful information aboutindividuals with relatively low levels of problem gambling severity. Symptoms that are typical at
64
high levels of severity are financial problems and borrowing money to support gambling. Theseitems are more useful in separating people at high levels of problem gambling.
The severity estimates suggest some items may be providing redundant psychometricinformation about severity of problem gambling. Feeling guilty and chasing losses have thesame severity index. Hence, the inclusion of both items on the PGSI does not increase theamount of information on problem gambling severity reflected in the total score. This alsoapplies to the PGSI items assessing tolerance and self-perception of having a gamblingproblem. These findings were reflected in the response patterns for these item pairs: 43% ofgamblers who endorsed the feeling guilty item also endorsed chasing losses, and 41% ofgamblers who acknowledged the development of tolerance also felt they may have a gamblingproblem. The severity estimates also suggest there are gaps in the PGSI’s coverage of problemgambling severity. There is a large gap after the item ‘betting more than one can afford to lose’and the next item, acknowledgement that gambling may be a problem. After the gambleracknowledge they are betting more than they can really afford, a large increase in problemgambling severity is required before gamblers recognize they have a problem. Additional PGSIitems are needed to assess severity in this low to middle range of the problem gamblingcontinuum. Another gap is evident at the upper end of the continuum. More severe symptomsare needed to the fill the gap between acknowledging financial problems and admitting the needto borrow money to continue gambling.
Fit of Rasch model to PGSI data
With the exception of the mean outfit value for financial problems (M = 0.58), all of the infit andoutfit statistics for individual PGSI items fell within the acceptable range of 0.6 to 1.4 45. Thisindicates there are no poorly fitting items in the PGSI. Furthermore, the standard errors (SE) forthe severity estimates were small and consistent across all items (the mean SE for all 9 items was0.03). The standard errors fell within a narrow range of 0.03 to 0.05 for all PGSI items includingthose that were endorsed infrequently by gamblers (e.g., borrowing money). The reliabilityestimate for item severity indicated perfect reliability (1.00), suggesting that the item rankingsfor severity would likely replicate in other similar population samples 42.
The Rasch model provides the standard error of measurement—that is, the estimated precision ofmeasurement—for the complete of range of scores on the PGSI (0 to 27). Lower standard errors(< 1.0) are desirable because they indicate greater reliability of PGSI measurement 46. Thestandard errors for the PGSI ranged from 0.37 to 1.86 across the full range of scores. The PGSIis most reliable (SE < 1.0) for individuals with PGSI scores ranging from 2 to 26, and is leastreliable for individuals with scores in the extreme ends of the distribution. For example, thestandard errors for PGSI scores of 0 or 1 were 1.9 and 1.1, respectively, while the standard errorfor a PGSI score of 27 was 1.7.
Differential item functioning
We examined possible response differences among subgroups of the sample using differentialitem functioning (DIF). Ideally, scores on a continuous index of severity should be free of biasfrom respondent characteristics. Items demonstrating differential item functioning (DIF) aremeasuring the latent construct differently for one subgroup of the population compared toanother at the same level of severity. The detection of DIF could indicate problems in theinstrument’s validity across key subgroups.
65
Subgroup comparisons were identical to those used in the investigation of factor structureinvariance: gender (males vs. females), age (18-24 years, 25-64 years, and 65+ years), householdincome (< $30K, $30K to $50K, >$50K), and game type (EGM/casino vs. other). TheWINSTEPS program statistically compares the individual item severity estimates for the varioussubgroup comparisons. The statistical method used by the program is based on earlier work byWright 42 and Linacre 45. We also considered the magnitude of the difference to determinewhich results could be considered clinically meaningful. Hence, significant DIF findings wereidentified on the basis of exceeding two criteria: (1) the result of the t-test comparing severityestimates was significant at the p < .01 level, and (2) the difference in estimates was 0.5 logitunits or greater, which represents a half standard deviation difference and considered large formost purposes 45;47.
Table 5.3 displays all the statistically significant (p < .01) DIF results. Four items had astatistically significant difference (p < .01) in severity estimates between male and femalegamblers, three items showed a significant DIF for age, three items showed a significant DIF forgame type and two items showed a significant DIF for income. However, only one of thesedifferences was deemed to be both statistically and clinically meaningful. The item borrowingmoney had a significantly higher severity estimate for EGM or casino gamblers compared togamblers who played other games. This item requires a more severe level of gambling problemsto be endorsed by EGM or casino players.
Rasch model on dichotomously scored PGSI items
Similar to our factor analysis, we also examined the fit of the Rasch model to the PGSI if theitems are scoring dichotomously (0 = never; 1 = sometimes, most of the time, or almost always).The survey response patterns indicate that the most of the time and almost always responsechoices are used infrequently by gamblers (only about 1% of the sample responded most of thetime or almost always to the PGSI items). Furthermore, the exploratory factor analysis showed aslightly better fitting model when the items are scored dichotomously.
The Rasch model conducted on the dichotomously scored PGSI indicate a comparable fit to thedata. The infit and outfit statistics were within the desired range of 0.6 and 1.4, and the orderingof items by severity index was identical to the model using the full Likert scaled scores. Thestandard errors for the Rasch severity estimates were marginally higher on the dichotomousitems (M = 0.05) compared to the Likert scaled items (M = 0.03) but still considered acceptable.The severity estimates from the dichotomously scored PGSI provided slightly better coverageacross the continuum of problem gambling severity. Nonetheless, the items feeling guilty andchasing losses had severity estimates close in value (-1.21 and -1.28), as did the items beingcriticized by others and self-perception of having a gambling problem (0.12 and 0.11),suggesting these item pairs may be redundant. The measurement precision across the range ofPGSI scores was superior for the Likert scaled PGSI. Only 11% of the standard errors wereabove 1.0 when the total PGSI score is allowed to range from 0 to 27 compared to 44% of thestandard errors being above 1.0 the PGSI ranges from only 0 to 9.
Comparison of Rasch model results and opinions of gambling experts
We compared the rank order of symptoms by level of severity produced by the Rasch model tothe opinions of gambling experts collected from the online survey reported in section 6 of thisreport. Gambling experts were asked to rate the severity of each PGSI item level in terms ofproviding information on overall severity of problem gambling being exhibited by gamblers who
66
endorse the symptom. The rank order of these ratings indicates which PGSI items were viewedby experts as providing information on severe levels of problem gambling and which itemsprovide information on less severe levels of problem gambling. The ranking of item severity fromthe Rasch model provides the same basic information. Table 5.4 compares the Rasch model andgambling experts’ ranking of severity. The intraclass correlation coefficient, which assesses theoverall level of agreement, was .79 suggesting good agreement in these rankings. Agreement ofrankings was best at the upper and lower extremes of problem gambling severity. For example,borrowing money and financial problems were the PGSI items found to provide the mostinformation on severe problem gambling while feelings of guilt provided the least information onsevere problem gambling. Acknowledgement of health problems from gambling was found to bea mid-level symptom of problem gambling severity by both the Rasch model and gamblingexperts. There was a large disagreement between experts and the Rasch analysis for the chasinglosses item. According to the Rasch model this symptom is typical of low levels of severity butexperts rated this item as being indicative of more severe problem gambling. A similardisagreement occurred with the item being criticized by others. In this case, experts ranked theitem as indicating low severity whereas the Rasch model placed the item in the middle range ofproblem gambling severity.
Table 5.2Symptom severity estimates for the Problem Gambling Severity Index (PGSI) from a sample of25,584 gamblers who reported gambling at least once in the previous 12 month period.
Problem GamblingSeverity
Infit statistic Outfit statistic
Item %endorsed a
δ SE M Z M Z rt
Guilt feelings 6.8 -.85 .03 .99 -.4 1.03 .9 .73
Chasing losses 7.0 -.85 .03 1.13 4.4 1.18 5.5 .71
Betting morethan can afford
6.0 -.70 .03 1.12 3.8 1.15 4.5 .69
Recognizes onehas a problem
3.6 .00 .03 .92 -2.3 .72 -7.7 .65
Tolerance 3.9 .00 .03 1.20 5.3 1.12 3.0 .59
Criticized byothers
3.6 .05 .03 1.15 3.9 1.05 1.3 .59
HealthProblems
2.7 .48 .04 1.07 1.7 .93 -1.3 .55
FinancialProblems
2.2 .70 .04 .93 -1.7 .58 -9.1 .56
Borrowingmoney
1.7 1.17 .05 1.16 3.0 .99 -.1 .45
a Proportion with non-zero score.
67
Discussion
The Rasch model item-response analysis applied to the PGSI reveals a well-fitting,unidimensional model overall. No miss-fitting items were identified. The estimated internalreliability of the PGSI was very high (1.00), suggesting that the item rankings for severity wouldlikely replicate in other future population samples. The standard errors associated with theseverity estimates were much lower reported in comparable Rasch analyses of the NODS andother DSM-IV derived scales 46;48. Furthermore, the range of standard errors was narrow acrossall items (0.03 – 0.06), an improvement over the DSM-IV based scales. Hence, the PGSI in itscurrent form appears to be an internally reliable measure of a single dimension of problemgambling severity. Like all IRT models, a Rasch model assumes that less severe gamblingproblems exist on the same continuum as more severe problems. The appearance of symptomsalong the continuum is not considered to be random, with some symptoms being characteristic oflower severity levels and some of higher severity levels. Furthermore, the presence of moresevere gambling problems presumes the likely presence of less severe problems in the sameindividual 49.
Using this theoretical framework, we can interpret the appearance of the individual PGSIsymptoms along the continuum in the context of current knowledge about the characteristics andprogression of problem gambling at varying levels of severity. Notably, the item responsepatterns provide an indication of the specific types of problems that are more likely to appear asproblem gambling severity increases. Note, because of the cross-sectional nature of the data, wecannot make conclusions about the emergence of symptoms within an individual over time. Ourconclusions are limited to the appearance of symptoms at different levels of problem gamblingseverity in the population. The PGSI symptom with the lowest severity estimate was feelingguilty about gambling. Experiencing guilt or remorse about gambling or the consequences ofgambling may be a useful indicator of low severity levels of problem gambling. Gamblingexperts also ranked this item as indicating low severity of problems. Chasing losses was alsocharacteristic of low severity gambling problems. Three other Rasch studies 48-50 also foundchasing loses (as assessed by the SOGS and DSM-IV) to being indicative of low severity levelsof problem gambling. Gambling experts, however, ranked this item as characterized a moderatelevel of problem gambling severity.
Severe problem gambling was associated with the appearance of PGSI items assessing financialproblems and borrowing money to gamble. There was agreement between the Rasch model andgambling experts on placement of these items along the problem gambling continuum.Furthermore, Strong and colleagues reported that a similar DSM-IV symptom, relies on others’money to relieve a financial situation, was useful in separating people at high levels of problemgambling severity. 46 Borrowing money was the only PGSI item to display both a statisticallyand clinically meaningful DIF between game type subgroups, suggesting a bias exists in the itemthat may result in measurement errors. Specifically, the severity estimate for EGM or casinogamblers was significantly higher than gamblers who play other games. Expressed another way,at equivalent levels of problem gambling severity EGM/casino gamblers were less likely toborrow money to gamble than gamblers who played other games. Although this finding mayseem counter-intuitive, it is consistent with the spending habits of EGM/casino playerscompared to other gamblers. EGM and casino gamblers, in general, spend more money ongambling than individuals who don’t play these games 25. The winnings from EGMs and casinogames are also higher than most other games 51. This scaling up of wins and losses on the
68
monetary dimension may suggest there is a higher threshold of severity that EGM/casinogamblers must reach to before resorting to borrowing money. Moreover, the borrowing moneyitem did not differ in severity for the three income groups, suggesting that this difference is notrelated to EGM/casino players having different financial resources. This result could indicate areduced sensitivity for the PGSI symptom of borrowing money to detect problem gamblingseverity in EGM/casino players. However, this sole DIF finding should be put into context.The emergence of only one clinically significant DIF for the PGSI is a rather remarkable findingconsidering that other established scales including SOGS and DSM-IV gambling scales havebeen shown to have several items with DIF concerns 48 50;52.
The rank ordering of symptoms by severity was identical in the Likert scaled anddichotomously scored PGSI Rasch model. The model fit was marginally better when thePGSI is scored with the full Likert scale as indicated by the lower standard errors around theseverity estimates and greater precision of measurement across the range of PGSI scores (0to 27 vs. 0 to 9). Although the extent of miss-fitting or biased items on the PGSI is minimal,the instrument has limitations in the coverage of symptoms along the continuum. There isredundant psychometric information on severity being provided by two symptoms at the lowerportion of the severity continuum. Coverage improves when the PGSI items are scoreddichotomously, but the same gaps between items in this range of severity still persists.
Table 5.3Results of differential item functioning tests of statistical and clinical significance
Differential Item FunctioningPGSI Item Gender Age Income Game type
Guilt feelings F-M = 0.28
Chasing losses F-M = 0.20 18-24 yrs –Overall = -0.24
Other – EGM/Casino= 0..28
Betting more thancan afford
F-M = 0.21 >$50K – Overall = 0.20
Recognizes onehas a problem
18-24 yrs –Overall = 0.44
Other – EGM/Casino= 0.34
Tolerance $30K-$50K – Overall = -0.15
>$50K – Overall = 0.22Criticized byothersHealth Problems 18-24 yrs –
Overall = -0.10Financial Problems F-M = 0.23Borrowing money Other –
EGM/Casino = 0.65
Note: Cells with problem gambling severity parameters reported indicate the difference between groups(p <.01). The difference between the subgroups is shown for cells with significant results. Gender andGame Type were two-group comparison. For Age and Income the entire sample was the reference groupand the specified category was the focal group. Bolded items indicate a severity parameter differenceof .50 or greater.
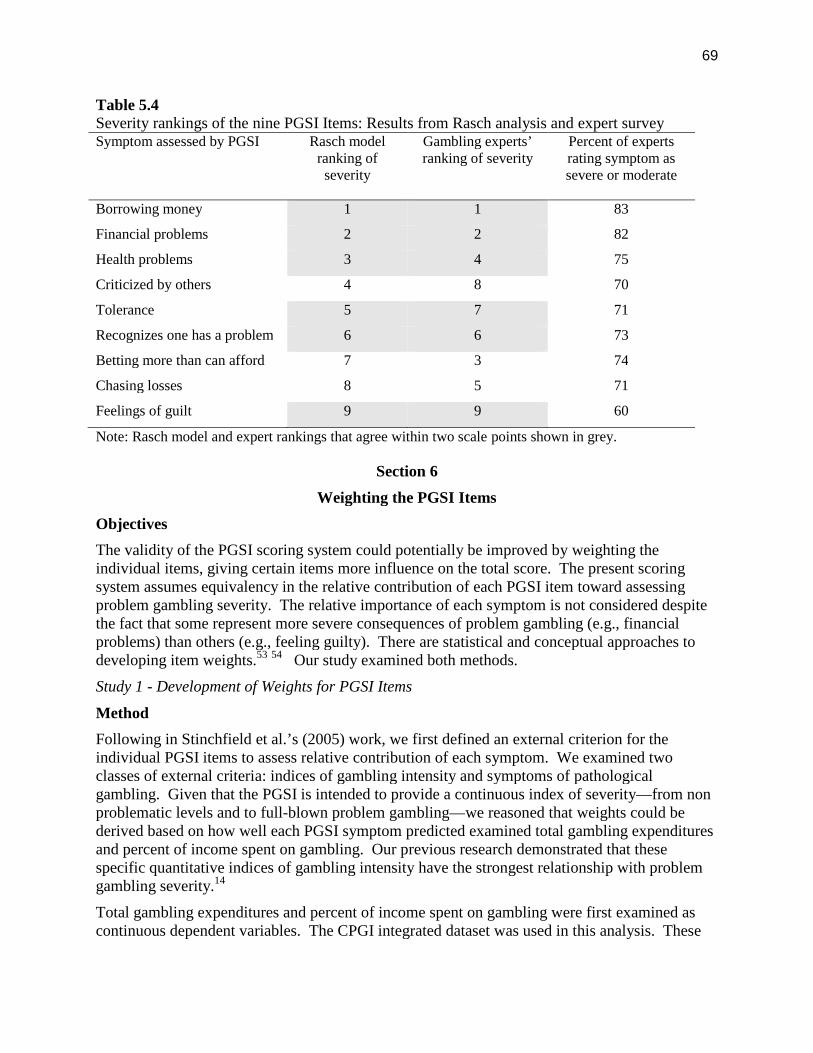
69
Table 5.4Severity rankings of the nine PGSI Items: Results from Rasch analysis and expert surveySymptom assessed by PGSI Rasch model
ranking ofseverity
Gambling experts’ranking of severity
Percent of expertsrating symptom assevere or moderate
Borrowing money 1 1 83
Financial problems 2 2 82
Health problems 3 4 75
Criticized by others 4 8 70
Tolerance 5 7 71
Recognizes one has a problem 6 6 73
Betting more than can afford 7 3 74
Chasing losses 8 5 71
Feelings of guilt 9 9 60
Note: Rasch model and expert rankings that agree within two scale points shown in grey.
Section 6
Weighting the PGSI Items
Objectives
The validity of the PGSI scoring system could potentially be improved by weighting theindividual items, giving certain items more influence on the total score. The present scoringsystem assumes equivalency in the relative contribution of each PGSI item toward assessingproblem gambling severity. The relative importance of each symptom is not considered despitethe fact that some represent more severe consequences of problem gambling (e.g., financialproblems) than others (e.g., feeling guilty). There are statistical and conceptual approaches todeveloping item weights.53 54 Our study examined both methods.
Study 1 - Development of Weights for PGSI Items
Method
Following in Stinchfield et al.’s (2005) work, we first defined an external criterion for theindividual PGSI items to assess relative contribution of each symptom. We examined twoclasses of external criteria: indices of gambling intensity and symptoms of pathologicalgambling. Given that the PGSI is intended to provide a continuous index of severity—from nonproblematic levels and to full-blown problem gambling—we reasoned that weights could bederived based on how well each PGSI symptom predicted examined total gambling expendituresand percent of income spent on gambling. Our previous research demonstrated that thesespecific quantitative indices of gambling intensity have the strongest relationship with problemgambling severity.14
Total gambling expenditures and percent of income spent on gambling were first examined ascontinuous dependent variables. The CPGI integrated dataset was used in this analysis. These
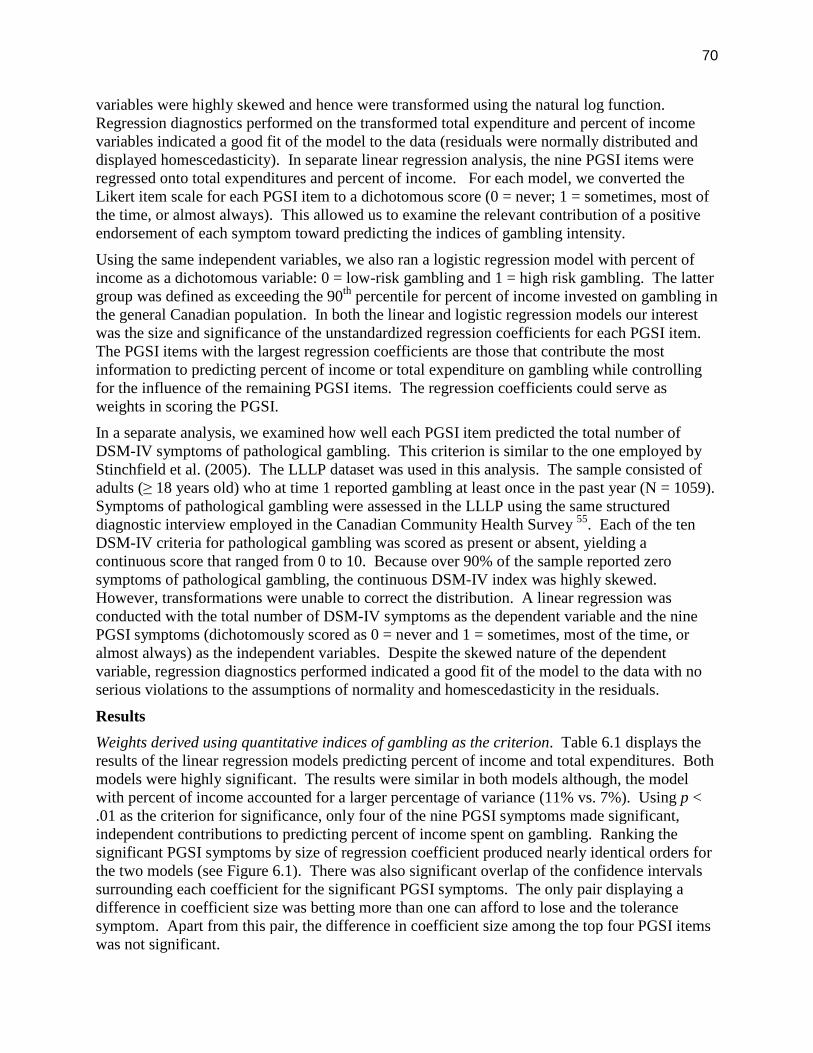
70
variables were highly skewed and hence were transformed using the natural log function.Regression diagnostics performed on the transformed total expenditure and percent of incomevariables indicated a good fit of the model to the data (residuals were normally distributed anddisplayed homescedasticity). In separate linear regression analysis, the nine PGSI items wereregressed onto total expenditures and percent of income. For each model, we converted theLikert item scale for each PGSI item to a dichotomous score (0 = never; 1 = sometimes, most ofthe time, or almost always). This allowed us to examine the relevant contribution of a positiveendorsement of each symptom toward predicting the indices of gambling intensity.
Using the same independent variables, we also ran a logistic regression model with percent ofincome as a dichotomous variable: 0 = low-risk gambling and 1 = high risk gambling. The lattergroup was defined as exceeding the 90th percentile for percent of income invested on gambling inthe general Canadian population. In both the linear and logistic regression models our interestwas the size and significance of the unstandardized regression coefficients for each PGSI item.The PGSI items with the largest regression coefficients are those that contribute the mostinformation to predicting percent of income or total expenditure on gambling while controllingfor the influence of the remaining PGSI items. The regression coefficients could serve asweights in scoring the PGSI.
In a separate analysis, we examined how well each PGSI item predicted the total number ofDSM-IV symptoms of pathological gambling. This criterion is similar to the one employed byStinchfield et al. (2005). The LLLP dataset was used in this analysis. The sample consisted ofadults (≥ 18 years old) who at time 1 reported gambling at least once in the past year (N = 1059).Symptoms of pathological gambling were assessed in the LLLP using the same structureddiagnostic interview employed in the Canadian Community Health Survey 55. Each of the tenDSM-IV criteria for pathological gambling was scored as present or absent, yielding acontinuous score that ranged from 0 to 10. Because over 90% of the sample reported zerosymptoms of pathological gambling, the continuous DSM-IV index was highly skewed.However, transformations were unable to correct the distribution. A linear regression wasconducted with the total number of DSM-IV symptoms as the dependent variable and the ninePGSI symptoms (dichotomously scored as 0 = never and 1 = sometimes, most of the time, oralmost always) as the independent variables. Despite the skewed nature of the dependentvariable, regression diagnostics performed indicated a good fit of the model to the data with noserious violations to the assumptions of normality and homescedasticity in the residuals.
Results
Weights derived using quantitative indices of gambling as the criterion. Table 6.1 displays theresults of the linear regression models predicting percent of income and total expenditures. Bothmodels were highly significant. The results were similar in both models although, the modelwith percent of income accounted for a larger percentage of variance (11% vs. 7%). Using p <.01 as the criterion for significance, only four of the nine PGSI symptoms made significant,independent contributions to predicting percent of income spent on gambling. Ranking thesignificant PGSI symptoms by size of regression coefficient produced nearly identical orders forthe two models (see Figure 6.1). There was also significant overlap of the confidence intervalssurrounding each coefficient for the significant PGSI symptoms. The only pair displaying adifference in coefficient size was betting more than one can afford to lose and the tolerancesymptom. Apart from this pair, the difference in coefficient size among the top four PGSI itemswas not significant.
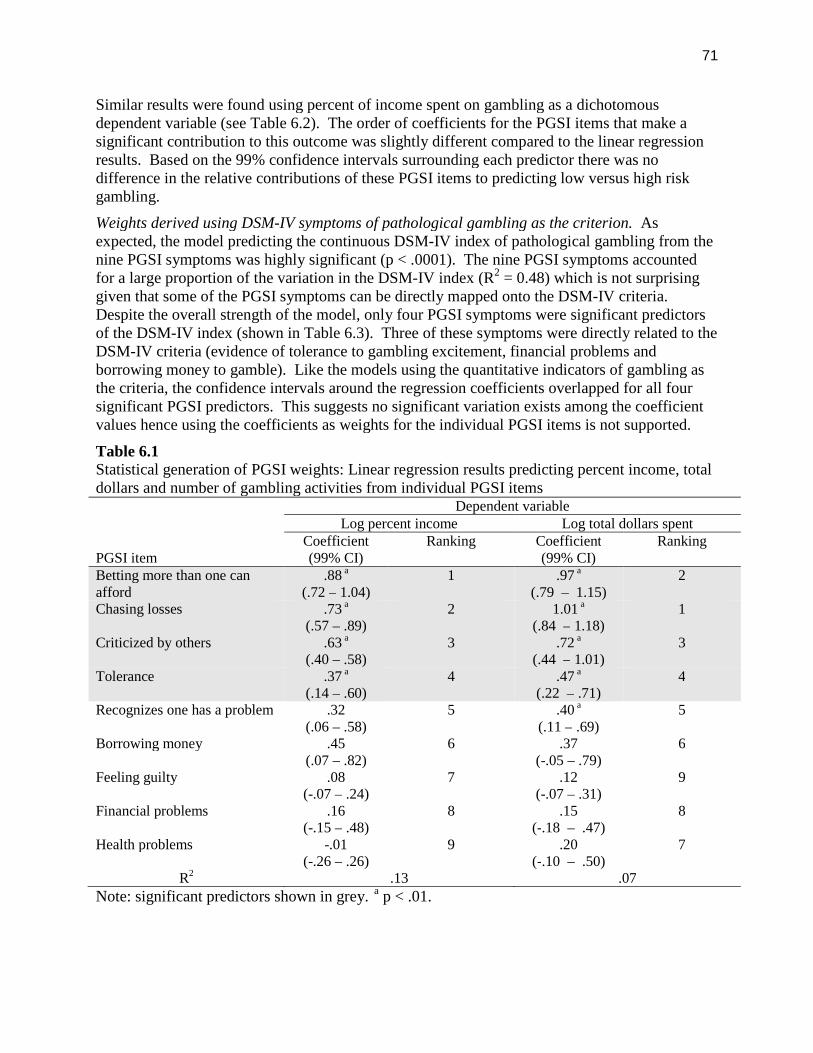
71
Similar results were found using percent of income spent on gambling as a dichotomousdependent variable (see Table 6.2). The order of coefficients for the PGSI items that make asignificant contribution to this outcome was slightly different compared to the linear regressionresults. Based on the 99% confidence intervals surrounding each predictor there was nodifference in the relative contributions of these PGSI items to predicting low versus high riskgambling.
Weights derived using DSM-IV symptoms of pathological gambling as the criterion. Asexpected, the model predicting the continuous DSM-IV index of pathological gambling from thenine PGSI symptoms was highly significant (p < .0001). The nine PGSI symptoms accountedfor a large proportion of the variation in the DSM-IV index (R2 = 0.48) which is not surprisinggiven that some of the PGSI symptoms can be directly mapped onto the DSM-IV criteria.Despite the overall strength of the model, only four PGSI symptoms were significant predictorsof the DSM-IV index (shown in Table 6.3). Three of these symptoms were directly related to theDSM-IV criteria (evidence of tolerance to gambling excitement, financial problems andborrowing money to gamble). Like the models using the quantitative indicators of gambling asthe criteria, the confidence intervals around the regression coefficients overlapped for all foursignificant PGSI predictors. This suggests no significant variation exists among the coefficientvalues hence using the coefficients as weights for the individual PGSI items is not supported.
Table 6.1Statistical generation of PGSI weights: Linear regression results predicting percent income, totaldollars and number of gambling activities from individual PGSI items
PGSI item
Dependent variableLog percent income Log total dollars spent
Coefficient(99% CI)
Ranking Coefficient(99% CI)
Ranking
Betting more than one canafford
.88 a
(.72 – 1.04)1 .97 a
(.79 – 1.15)2
Chasing losses .73 a
(.57 – .89)2 1.01 a
(.84 – 1.18)1
Criticized by others .63 a
(.40 – .58)3 .72 a
(.44 – 1.01)3
Tolerance .37 a
(.14 – .60)4 .47 a
(.22 – .71)4
Recognizes one has a problem .32(.06 – .58)
5 .40 a
(.11 – .69)5
Borrowing money .45(.07 – .82)
6 .37(-.05 – .79)
6
Feeling guilty .08(-.07 – .24)
7 .12(-.07 – .31)
9
Financial problems .16(-.15 – .48)
8 .15(-.18 – .47)
8
Health problems -.01(-.26 – .26)
9 .20(-.10 – .50)
7
R2 .13 .07
Note: significant predictors shown in grey. a p < .01.
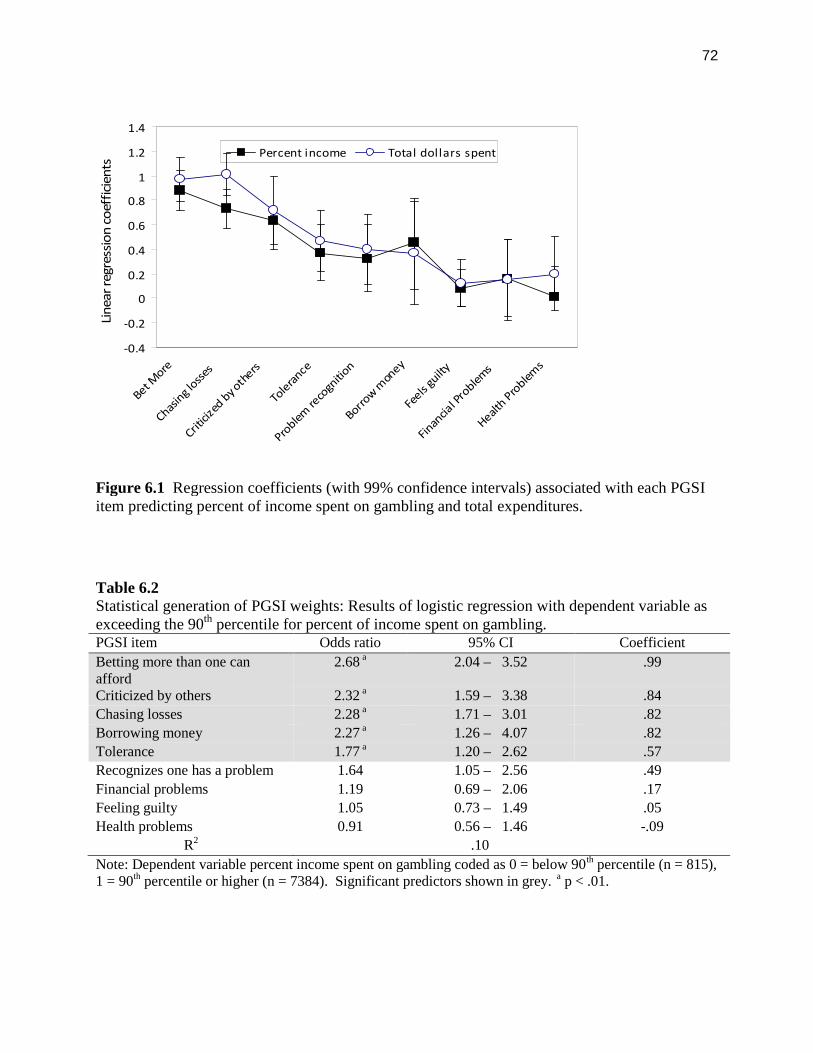
72
Figure 6.1 Regression coefficients (with 99% confidence intervals) associated with each PGSIitem predicting percent of income spent on gambling and total expenditures.
Table 6.2Statistical generation of PGSI weights: Results of logistic regression with dependent variable asexceeding the 90th percentile for percent of income spent on gambling.PGSI item Odds ratio 95% CI Coefficient
Betting more than one canafford
2.68 a 2.04 – 3.52 .99
Criticized by others 2.32 a 1.59 – 3.38 .84
Chasing losses 2.28 a 1.71 – 3.01 .82
Borrowing money 2.27 a 1.26 – 4.07 .82
Tolerance 1.77 a 1.20 – 2.62 .57
Recognizes one has a problem 1.64 1.05 – 2.56 .49
Financial problems 1.19 0.69 – 2.06 .17
Feeling guilty 1.05 0.73 – 1.49 .05
Health problems 0.91 0.56 – 1.46 -.09
R2 .10
Note: Dependent variable percent income spent on gambling coded as 0 = below 90th percentile (n = 815),1 = 90th percentile or higher (n = 7384). Significant predictors shown in grey. a p < .01.
-0.4
-0.2
0
0.2
0.4
0.6
0.8
1
1.2
1.4
Bet More
Chasin
glo
sses
Critici
zed
byothers
Tole
rance
Proble
mre
cogn
ition
Borrow
mon
ey
Feels
guilt
y
Finan
cial P
roble
ms
Health
Proble
ms
Lin
ear
regr
essi
on
coef
fici
ents
Percent income Total dollars spent
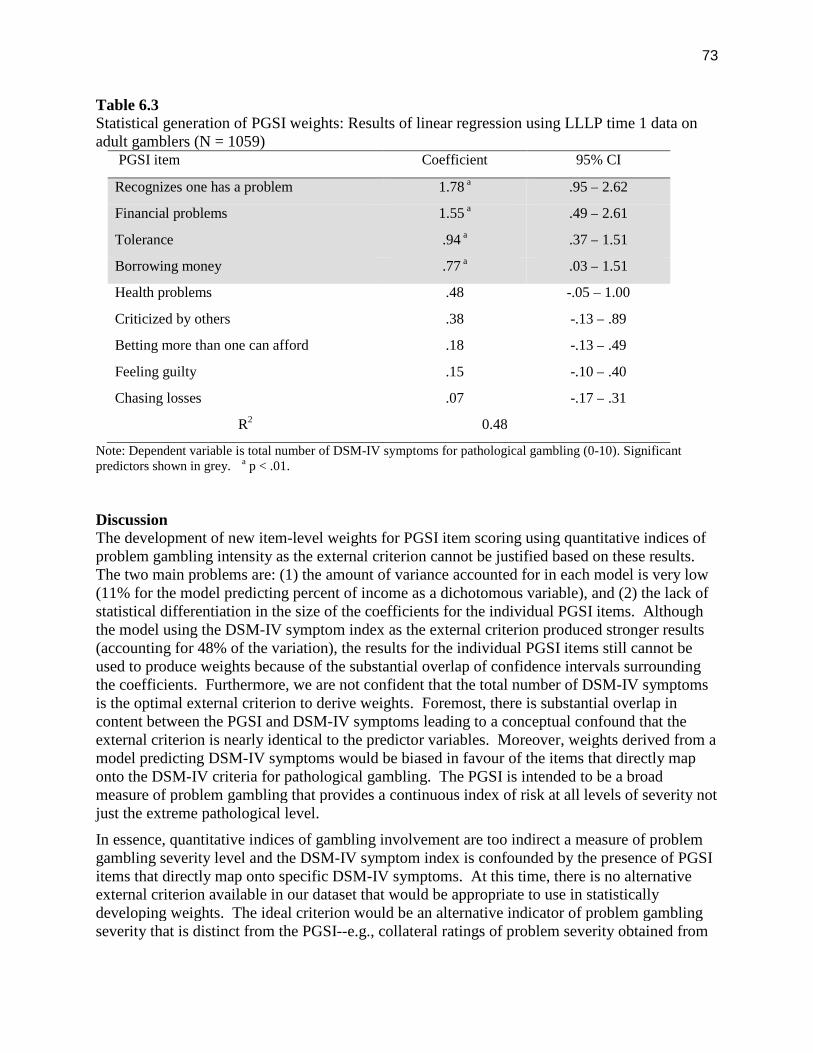
73
Table 6.3Statistical generation of PGSI weights: Results of linear regression using LLLP time 1 data onadult gamblers (N = 1059)
PGSI item Coefficient 95% CI
Recognizes one has a problem 1.78 a .95 – 2.62
Financial problems 1.55 a .49 – 2.61
Tolerance .94 a .37 – 1.51
Borrowing money .77 a .03 – 1.51
Health problems .48 -.05 – 1.00
Criticized by others .38 -.13 – .89
Betting more than one can afford .18 -.13 – .49
Feeling guilty .15 -.10 – .40
Chasing losses .07 -.17 – .31
R2 0.48
Note: Dependent variable is total number of DSM-IV symptoms for pathological gambling (0-10). Significantpredictors shown in grey. a p < .01.
DiscussionThe development of new item-level weights for PGSI item scoring using quantitative indices ofproblem gambling intensity as the external criterion cannot be justified based on these results.The two main problems are: (1) the amount of variance accounted for in each model is very low(11% for the model predicting percent of income as a dichotomous variable), and (2) the lack ofstatistical differentiation in the size of the coefficients for the individual PGSI items. Althoughthe model using the DSM-IV symptom index as the external criterion produced stronger results(accounting for 48% of the variation), the results for the individual PGSI items still cannot beused to produce weights because of the substantial overlap of confidence intervals surroundingthe coefficients. Furthermore, we are not confident that the total number of DSM-IV symptomsis the optimal external criterion to derive weights. Foremost, there is substantial overlap incontent between the PGSI and DSM-IV symptoms leading to a conceptual confound that theexternal criterion is nearly identical to the predictor variables. Moreover, weights derived from amodel predicting DSM-IV symptoms would be biased in favour of the items that directly maponto the DSM-IV criteria for pathological gambling. The PGSI is intended to be a broadmeasure of problem gambling that provides a continuous index of risk at all levels of severity notjust the extreme pathological level.
In essence, quantitative indices of gambling involvement are too indirect a measure of problemgambling severity level and the DSM-IV symptom index is confounded by the presence of PGSIitems that directly map onto specific DSM-IV symptoms. At this time, there is no alternativeexternal criterion available in our dataset that would be appropriate to use in statisticallydeveloping weights. The ideal criterion would be an alternative indicator of problem gamblingseverity that is distinct from the PGSI--e.g., collateral ratings of problem severity obtained from
74
a family member or clinician. A future CPGI population survey could attempt to collectcollateral ratings of problem gambling severity for a sample of participants for use in a weightdevelopment study.
The absence of statistical differentiation in the magnitude of regression coefficient is unlikely tobe caused of the absence of power given the large sample sizes used in each analysis. Oneplausible conclusion from these results is that weighting of the PGSI at the item level is notnecessary. It is possible that the status quo is most justified—that is, that each item should beequally weighted as contributing to the total score. Weights for the PGSI may instead beapplied to the Likert scale response choices for each item. This was the conclusion stemmingfrom the expert survey. By adjusting the weights for the response choices for specific items(e.g., assigning a higher score for acknowledging financial problems that occur ‘sometimes’compared to experiencing guilty feelings), it is possible to ensure that items judged by gamblingexperts as being indicative of more severe problems would contribute more to the total scorewhen the appropriate threshold is reached. These results are reviewed below.
Study 2 - Obtaining Expert Opinion on the Importance of PGSI Items
Method
We solicited the opinions of experts in the gambling field to assess the relative importance ofindividual PGSI items as contributing information to the severity of problem gambling. A web-based survey (provided in Appendix F) was developed and posted on Survey Monkey, a popularand cost-effective web resource for researchers conducting brief surveys. The survey was firstpiloted with 10 individuals before broad dissemination. Based on the feedback from the 10 pilotparticipants, the survey was modified slightly to improve wording and the comprehension of theinstructions. The final version contained the following sections:
1) Respondent characteristics including knowledge of PGSI, use of PGSI clinically and inresearch, and demographics.
2) Personal opinions on the PGSI scale including its usefulness as a continuous measure ofseverity, the usefulness of the four PGSI subtypes, issues with false positives or falsenegatives, the effectiveness in identifying low-risk and problem gamblers, and whetherthe scoring system could be improved.
3) Rankings on PGSI item scoring weights. Respondents were presented with the ninePGSI items and asked to rate the severity of each response choice (sometimes, most ofthe time, almost always) in terms of providing information on the gambler’s overallseverity of gambling problems. Pilot participants found this question the most difficult tocomprehend. A detailed example in the instructions enhanced clarity greatly. Theexample provided to participants is shown below.
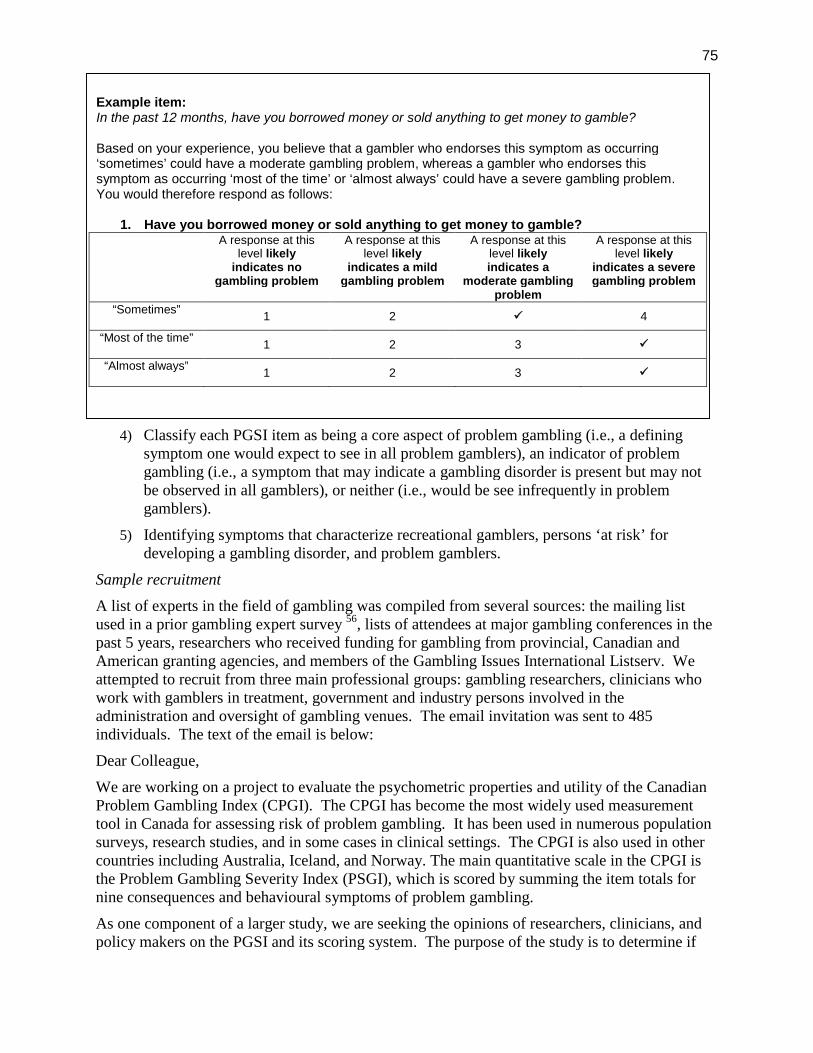
75
Example item:In the past 12 months, have you borrowed money or sold anything to get money to gamble?
Based on your experience, you believe that a gambler who endorses this symptom as occurring‘sometimes’ could have a moderate gambling problem, whereas a gambler who endorses thissymptom as occurring ‘most of the time’ or ‘almost always’ could have a severe gambling problem.You would therefore respond as follows:
1. Have you borrowed money or sold anything to get money to gamble?A response at this
level likelyindicates no
gambling problem
A response at thislevel likely
indicates a mildgambling problem
A response at thislevel likelyindicates a
moderate gamblingproblem
A response at thislevel likely
indicates a severegambling problem
“Sometimes”1 2 4
“Most of the time”1 2 3
“Almost always”1 2 3
4) Classify each PGSI item as being a core aspect of problem gambling (i.e., a definingsymptom one would expect to see in all problem gamblers), an indicator of problemgambling (i.e., a symptom that may indicate a gambling disorder is present but may notbe observed in all gamblers), or neither (i.e., would be see infrequently in problemgamblers).
5) Identifying symptoms that characterize recreational gamblers, persons ‘at risk’ fordeveloping a gambling disorder, and problem gamblers.
Sample recruitment
A list of experts in the field of gambling was compiled from several sources: the mailing listused in a prior gambling expert survey 56, lists of attendees at major gambling conferences in thepast 5 years, researchers who received funding for gambling from provincial, Canadian andAmerican granting agencies, and members of the Gambling Issues International Listserv. Weattempted to recruit from three main professional groups: gambling researchers, clinicians whowork with gamblers in treatment, government and industry persons involved in theadministration and oversight of gambling venues. The email invitation was sent to 485individuals. The text of the email is below:
Dear Colleague,
We are working on a project to evaluate the psychometric properties and utility of the CanadianProblem Gambling Index (CPGI). The CPGI has become the most widely used measurementtool in Canada for assessing risk of problem gambling. It has been used in numerous populationsurveys, research studies, and in some cases in clinical settings. The CPGI is also used in othercountries including Australia, Iceland, and Norway. The main quantitative scale in the CPGI isthe Problem Gambling Severity Index (PSGI), which is scored by summing the item totals fornine consequences and behavioural symptoms of problem gambling.
As one component of a larger study, we are seeking the opinions of researchers, clinicians, andpolicy makers on the PGSI and its scoring system. The purpose of the study is to determine if
76
the PGSI, in its present form, provides a valid and reliable index of problem gambling severity orwhether improvements are needed to the scale. You do not need to be familiar with the CPGI tocomplete this survey. Our main interest is your opinion on how well the consequences andsymptoms of problem gambling being assessed by the PGSI reflect problem gambling severity atdifferent levels. The results should provide some insight on the relative weighting of each itemtoward the total score.
The online survey should take you less than 10 minutes to complete. It can be found at
http://www.surveymonkey.com/s/RG9TGRZ. If you would prefer to complete the survey byhand, a paper copy is attached.
A draw for a $100 Amazon gift certificate was offered as an incentive to complete the survey.The first notice for the survey was sent on May 20, 2010. Reminder notices were sent two andfour weeks later. The survey was live on the web site until July 15, 2010.
Results
Response rate and respondent characteristics
Of the 485 email invitations sent out, 63 were returned because the email address was not validand an alternative address could not be located. Among the remaining 422 valid invitations,surveys were completed by 142 individuals, making the response rate 34%. The characteristicsof the responders are listed in Table 6.4. The primary position reported by respondentssuggested we achieved our goal of recruiting approximately equal numbers of researchers,clinicians, and administrators.
Opinions on the PGSI scale
Three quarters of respondents rated their knowledge of the PGSI as good to excellent. Theseexperts were invited to give their opinions of the PGSI using a 5-point Likert scale: StronglyDisagree, Disagree, Neutral, Agree and Strongly Agree. Respondents were specifically asked torate their feelings on eight questions related to the current scoring system of the PGSI, as well ascharacteristics of the questions. Only one response could be selected per question, andrespondents had the option to skip these questions. 59% of respondents rated their opinion of thequestion “The PGSI is an effective tool for identifying problem gamblers” as either stronglyagree or agree. As to whether “False positives are a concern with the PGSI”, 38% of expertsindicated they were neutral on this issue and similarly, 35% indicated they were neutral onwhether “False negatives are a concern on the PGSI”. 27% were neutral, and 31% of respondentsstrongly agreed or agreed with the statement “The PGSI is an effective tool for assessing low-risk gambling”. The question “The PGSI is an effective tool for identifying persons at risk forproblem gambling” garnered a 52% strongly agree/agree response. 48% of experts indicated astrongly agree/agree response to both “The total score on the PGSI is a useful way of assessingseverity of problem gambling” and “The scoring categories for the PGSI are a useful way ofclassifying level of problem gambling risk”. As to whether “The PGSI could be improved byrevising the scoring system”, 35% of responders strongly agreed/agreed and 38% were neutral onthis item. The remaining opinions to the eight questions are described in Table 6.5.
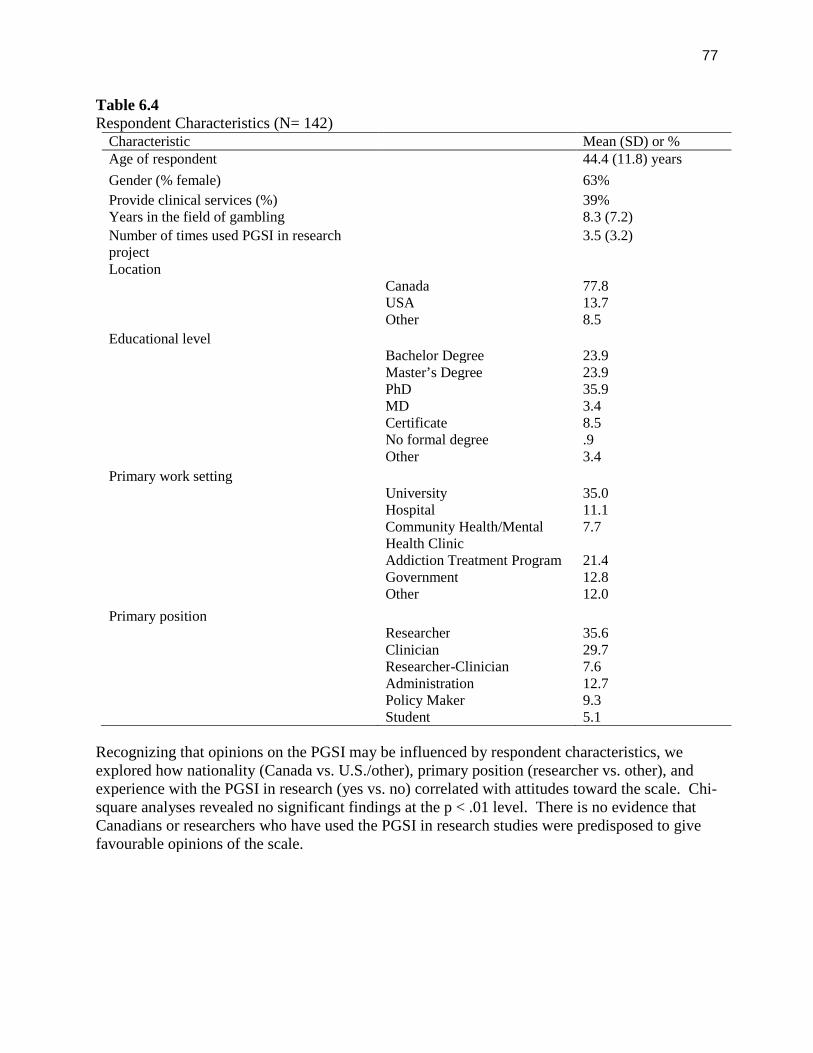
77
Table 6.4Respondent Characteristics (N= 142)
Characteristic Mean (SD) or %Age of respondent 44.4 (11.8) years
Gender (% female) 63%
Provide clinical services (%) 39%Years in the field of gambling 8.3 (7.2)
Number of times used PGSI in researchproject
3.5 (3.2)
LocationCanada 77.8USA 13.7Other 8.5
Educational levelBachelor Degree 23.9Master’s Degree 23.9PhD 35.9MD 3.4Certificate 8.5No formal degree .9Other 3.4
Primary work settingUniversity 35.0Hospital 11.1Community Health/MentalHealth Clinic
7.7
Addiction Treatment Program 21.4Government 12.8Other 12.0
Primary positionResearcher 35.6Clinician 29.7Researcher-Clinician 7.6Administration 12.7Policy Maker 9.3Student 5.1
Recognizing that opinions on the PGSI may be influenced by respondent characteristics, weexplored how nationality (Canada vs. U.S./other), primary position (researcher vs. other), andexperience with the PGSI in research (yes vs. no) correlated with attitudes toward the scale. Chi-square analyses revealed no significant findings at the p < .01 level. There is no evidence thatCanadians or researchers who have used the PGSI in research studies were predisposed to givefavourable opinions of the scale.
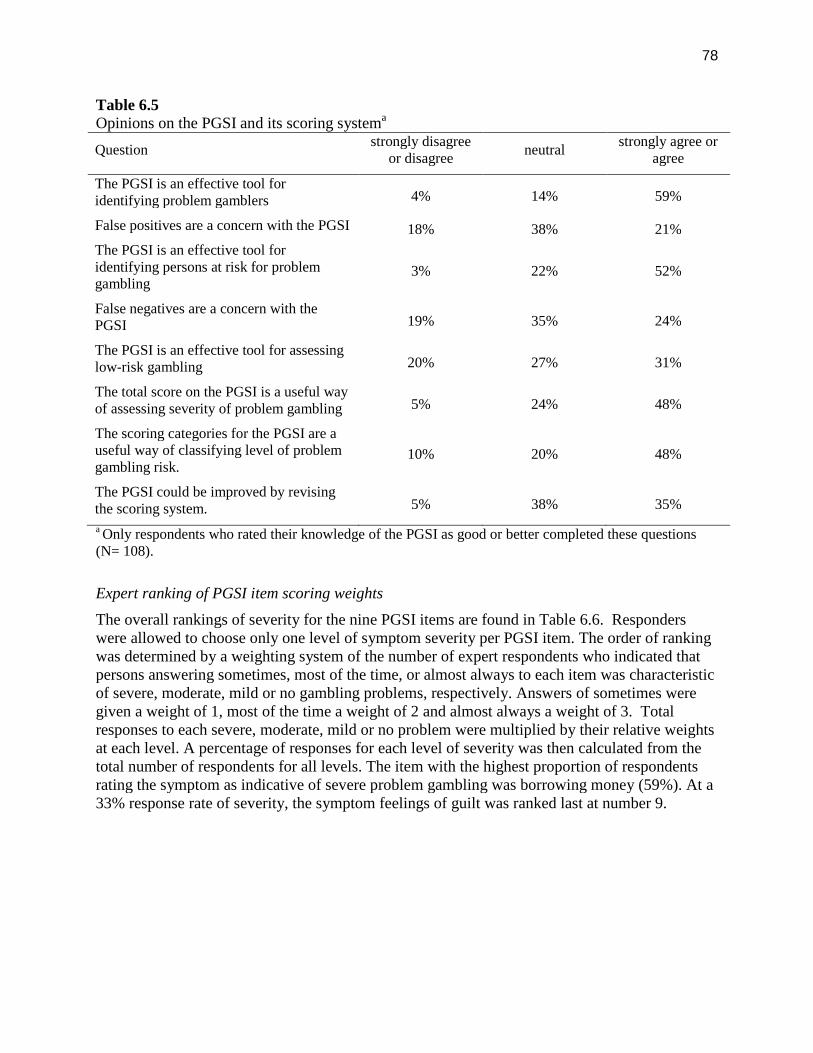
78
Table 6.5Opinions on the PGSI and its scoring systema
Questionstrongly disagree
or disagreeneutral
strongly agree oragree
The PGSI is an effective tool foridentifying problem gamblers 4% 14% 59%
False positives are a concern with the PGSI 18% 38% 21%
The PGSI is an effective tool foridentifying persons at risk for problemgambling
3% 22% 52%
False negatives are a concern with thePGSI 19% 35% 24%
The PGSI is an effective tool for assessinglow-risk gambling 20% 27% 31%
The total score on the PGSI is a useful wayof assessing severity of problem gambling 5% 24% 48%
The scoring categories for the PGSI are auseful way of classifying level of problemgambling risk.
10% 20% 48%
The PGSI could be improved by revisingthe scoring system. 5% 38% 35%
a Only respondents who rated their knowledge of the PGSI as good or better completed these questions(N= 108).
Expert ranking of PGSI item scoring weights
The overall rankings of severity for the nine PGSI items are found in Table 6.6. Responderswere allowed to choose only one level of symptom severity per PGSI item. The order of rankingwas determined by a weighting system of the number of expert respondents who indicated thatpersons answering sometimes, most of the time, or almost always to each item was characteristicof severe, moderate, mild or no gambling problems, respectively. Answers of sometimes weregiven a weight of 1, most of the time a weight of 2 and almost always a weight of 3. Totalresponses to each severe, moderate, mild or no problem were multiplied by their relative weightsat each level. A percentage of responses for each level of severity was then calculated from thetotal number of respondents for all levels. The item with the highest proportion of respondentsrating the symptom as indicative of severe problem gambling was borrowing money (59%). At a33% response rate of severity, the symptom feelings of guilt was ranked last at number 9.
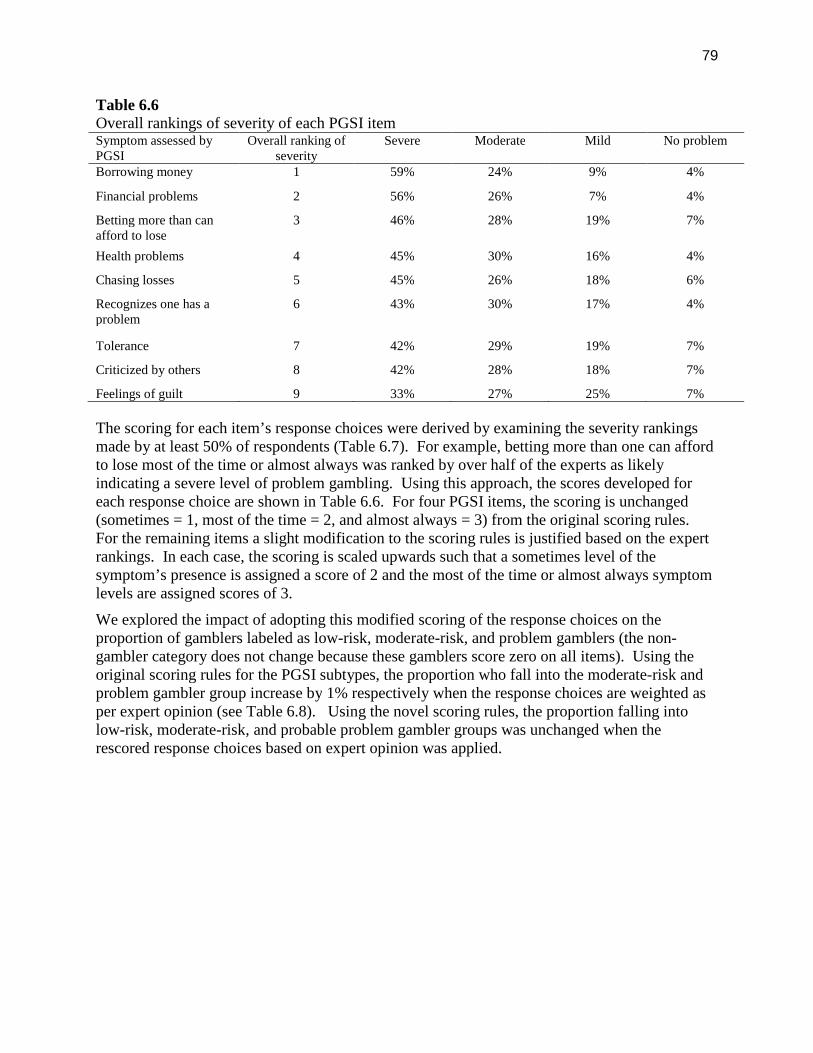
79
Table 6.6Overall rankings of severity of each PGSI itemSymptom assessed byPGSI
Overall ranking ofseverity
Severe Moderate Mild No problem
Borrowing money 1 59% 24% 9% 4%
Financial problems 2 56% 26% 7% 4%
Betting more than canafford to lose
3 46% 28% 19% 7%
Health problems 4 45% 30% 16% 4%
Chasing losses 5 45% 26% 18% 6%
Recognizes one has aproblem
6 43% 30% 17% 4%
Tolerance 7 42% 29% 19% 7%
Criticized by others 8 42% 28% 18% 7%
Feelings of guilt 9 33% 27% 25% 7%
The scoring for each item’s response choices were derived by examining the severity rankingsmade by at least 50% of respondents (Table 6.7). For example, betting more than one can affordto lose most of the time or almost always was ranked by over half of the experts as likelyindicating a severe level of problem gambling. Using this approach, the scores developed foreach response choice are shown in Table 6.6. For four PGSI items, the scoring is unchanged(sometimes = 1, most of the time = 2, and almost always = 3) from the original scoring rules.For the remaining items a slight modification to the scoring rules is justified based on the expertrankings. In each case, the scoring is scaled upwards such that a sometimes level of thesymptom’s presence is assigned a score of 2 and the most of the time or almost always symptomlevels are assigned scores of 3.
We explored the impact of adopting this modified scoring of the response choices on theproportion of gamblers labeled as low-risk, moderate-risk, and problem gamblers (the non-gambler category does not change because these gamblers score zero on all items). Using theoriginal scoring rules for the PGSI subtypes, the proportion who fall into the moderate-risk andproblem gambler group increase by 1% respectively when the response choices are weighted asper expert opinion (see Table 6.8). Using the novel scoring rules, the proportion falling intolow-risk, moderate-risk, and probable problem gambler groups was unchanged when therescored response choices based on expert opinion was applied.
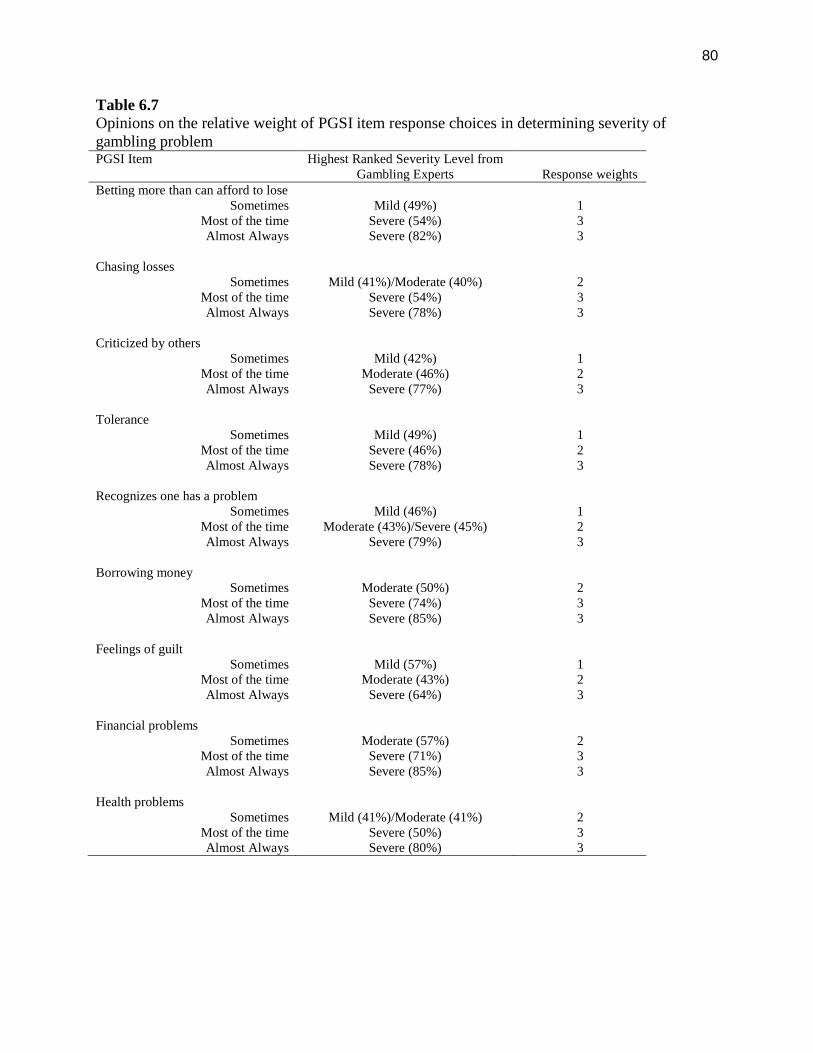
80
Table 6.7Opinions on the relative weight of PGSI item response choices in determining severity ofgambling problemPGSI Item Highest Ranked Severity Level from
Gambling Experts Response weightsBetting more than can afford to lose
Sometimes Mild (49%) 1Most of the time Severe (54%) 3Almost Always Severe (82%) 3
Chasing lossesSometimes Mild (41%)/Moderate (40%) 2
Most of the time Severe (54%) 3Almost Always Severe (78%) 3
Criticized by othersSometimes Mild (42%) 1
Most of the time Moderate (46%) 2Almost Always Severe (77%) 3
ToleranceSometimes Mild (49%) 1
Most of the time Severe (46%) 2Almost Always Severe (78%) 3
Recognizes one has a problemSometimes Mild (46%) 1
Most of the time Moderate (43%)/Severe (45%) 2Almost Always Severe (79%) 3
Borrowing moneySometimes Moderate (50%) 2
Most of the time Severe (74%) 3Almost Always Severe (85%) 3
Feelings of guiltSometimes Mild (57%) 1
Most of the time Moderate (43%) 2Almost Always Severe (64%) 3
Financial problemsSometimes Moderate (57%) 2
Most of the time Severe (71%) 3Almost Always Severe (85%) 3
Health problemsSometimes Mild (41%)/Moderate (41%) 2
Most of the time Severe (50%) 3Almost Always Severe (80%) 3
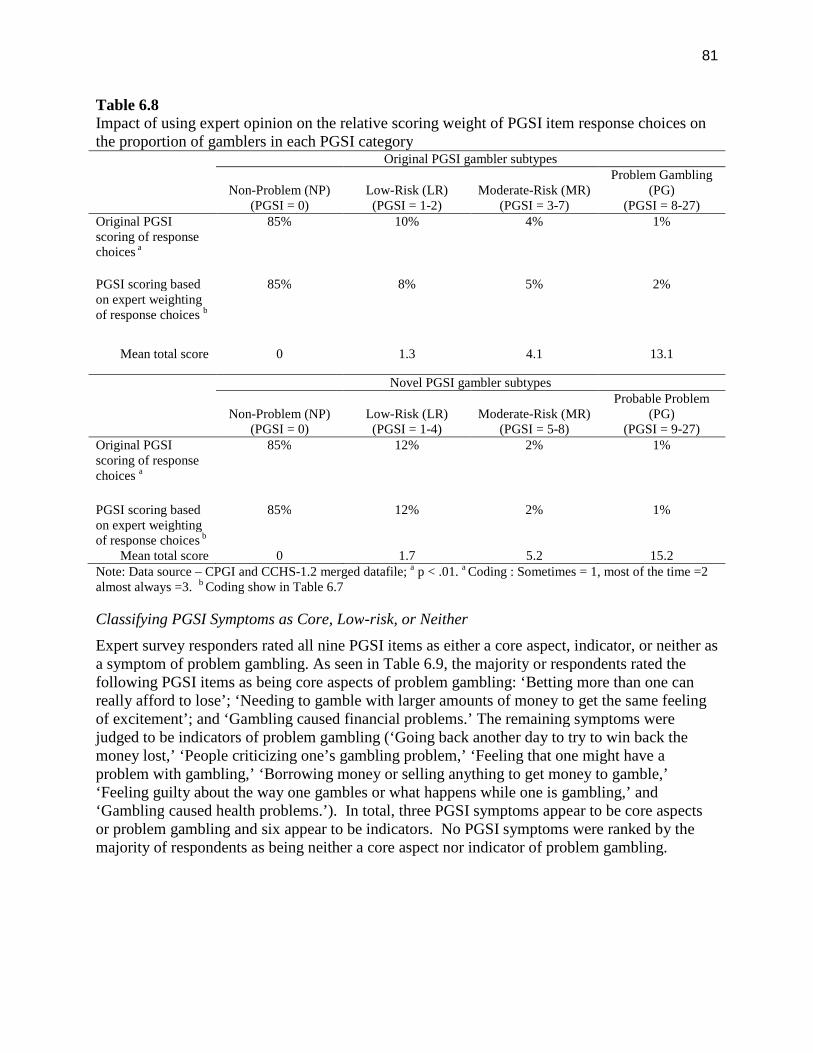
81
Table 6.8Impact of using expert opinion on the relative scoring weight of PGSI item response choices onthe proportion of gamblers in each PGSI category
Original PGSI gambler subtypes
Non-Problem (NP)(PGSI = 0)
Low-Risk (LR)(PGSI = 1-2)
Moderate-Risk (MR)(PGSI = 3-7)
Problem Gambling(PG)
(PGSI = 8-27)Original PGSIscoring of responsechoices a
85% 10% 4% 1%
PGSI scoring basedon expert weightingof response choices b
85% 8% 5% 2%
Mean total score 0 1.3 4.1 13.1
Novel PGSI gambler subtypes
Non-Problem (NP)(PGSI = 0)
Low-Risk (LR)(PGSI = 1-4)
Moderate-Risk (MR)(PGSI = 5-8)
Probable Problem(PG)
(PGSI = 9-27)Original PGSIscoring of responsechoices a
85% 12% 2% 1%
PGSI scoring basedon expert weightingof response choices b
85% 12% 2% 1%
Mean total score 0 1.7 5.2 15.2Note: Data source – CPGI and CCHS-1.2 merged datafile; a p < .01. a Coding : Sometimes = 1, most of the time =2almost always =3. b Coding show in Table 6.7
Classifying PGSI Symptoms as Core, Low-risk, or Neither
Expert survey responders rated all nine PGSI items as either a core aspect, indicator, or neither asa symptom of problem gambling. As seen in Table 6.9, the majority or respondents rated thefollowing PGSI items as being core aspects of problem gambling: ‘Betting more than one canreally afford to lose’; ‘Needing to gamble with larger amounts of money to get the same feelingof excitement’; and ‘Gambling caused financial problems.’ The remaining symptoms werejudged to be indicators of problem gambling (‘Going back another day to try to win back themoney lost,’ ‘People criticizing one’s gambling problem,’ ‘Feeling that one might have aproblem with gambling,’ ‘Borrowing money or selling anything to get money to gamble,’‘Feeling guilty about the way one gambles or what happens while one is gambling,’ and‘Gambling caused health problems.’). In total, three PGSI symptoms appear to be core aspectsor problem gambling and six appear to be indicators. No PGSI symptoms were ranked by themajority of respondents as being neither a core aspect nor indicator of problem gambling.
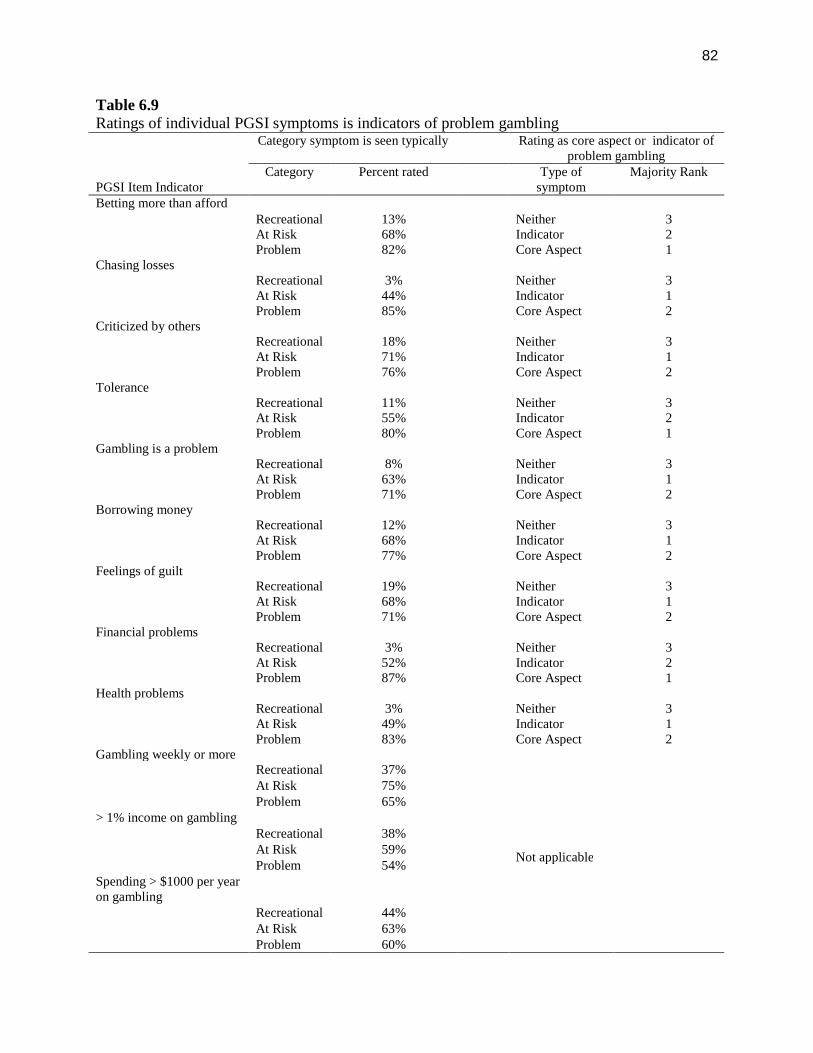
82
Table 6.9Ratings of individual PGSI symptoms is indicators of problem gambling
PGSI Item Indicator
Category symptom is seen typically Rating as core aspect or indicator ofproblem gambling
Category Percent rated Type ofsymptom
Majority Rank
Betting more than affordRecreational 13% Neither 3At Risk 68% Indicator 2Problem 82% Core Aspect 1
Chasing lossesRecreational 3% Neither 3At Risk 44% Indicator 1Problem 85% Core Aspect 2
Criticized by othersRecreational 18% Neither 3At Risk 71% Indicator 1Problem 76% Core Aspect 2
ToleranceRecreational 11% Neither 3At Risk 55% Indicator 2Problem 80% Core Aspect 1
Gambling is a problemRecreational 8% Neither 3At Risk 63% Indicator 1Problem 71% Core Aspect 2
Borrowing moneyRecreational 12% Neither 3At Risk 68% Indicator 1Problem 77% Core Aspect 2
Feelings of guiltRecreational 19% Neither 3At Risk 68% Indicator 1Problem 71% Core Aspect 2
Financial problemsRecreational 3% Neither 3At Risk 52% Indicator 2Problem 87% Core Aspect 1
Health problemsRecreational 3% Neither 3At Risk 49% Indicator 1Problem 83% Core Aspect 2
Gambling weekly or moreRecreational 37%
Not applicable
At Risk 75%Problem 65%
> 1% income on gamblingRecreational 38%At Risk 59%Problem 54%
Spending > $1000 per yearon gambling
Recreational 44%At Risk 63%Problem 60%
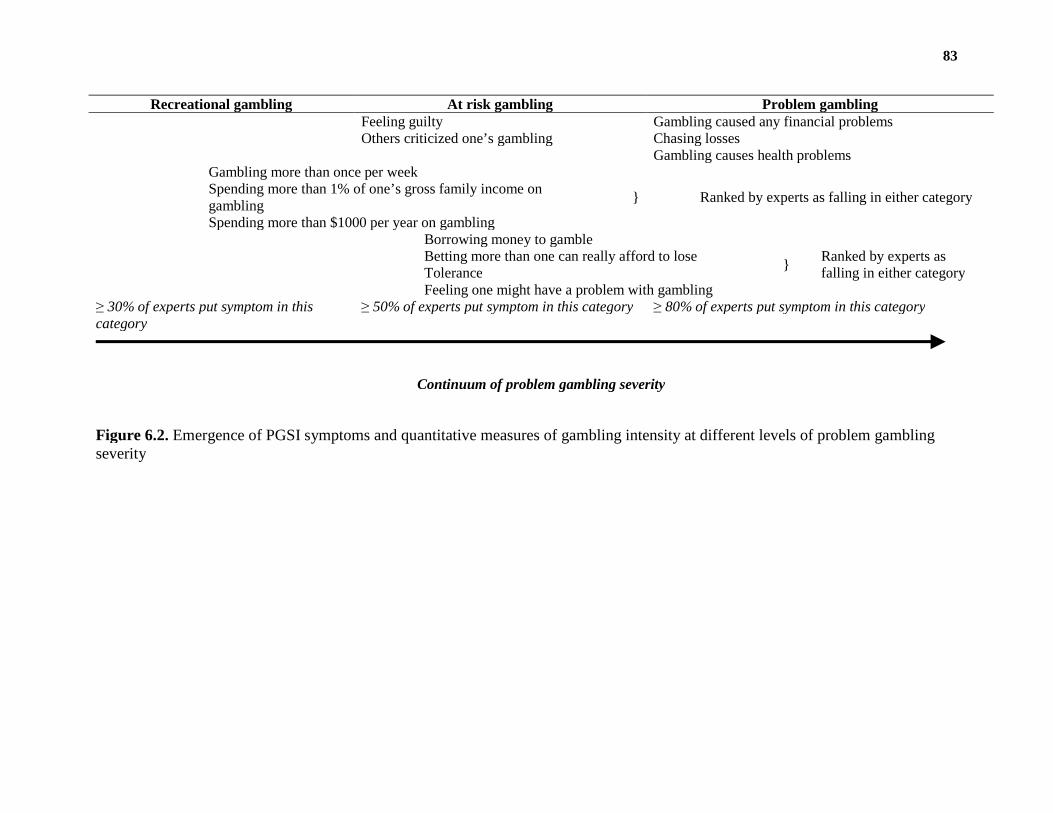
83
Figure 6.2. Emergence of PGSI symptoms and quantitative measures of gambling intensity at different levels of problem gamblingseverity
Recreational gambling At risk gambling Problem gamblingFeeling guilty Gambling caused any financial problemsOthers criticized one’s gambling Chasing losses
Gambling causes health problemsGambling more than once per week
} Ranked by experts as falling in either categorySpending more than 1% of one’s gross family income ongamblingSpending more than $1000 per year on gambling
Borrowing money to gamble
}Ranked by experts asfalling in either category
Betting more than one can really afford to loseToleranceFeeling one might have a problem with gambling
≥ 30% of experts put symptom in thiscategory
≥ 50% of experts put symptom in this category ≥ 80% of experts put symptom in this category
Continuum of problem gambling severity
84
PGSI symptoms that characterize recreational gamblers, at risk gamblers or problem gamblers
Approaching the question of what level of severity does each PGSI item represent in a slightlydifferent way, we asked respondents to categorize each symptom as being representative ofrecreational, at risk or problem gamblers. The intent of this question was to determine if thePGSI covers symptoms of both at risk and problem gambling levels of severity. We alsoincluded in this question the low-risk gambling limits to assess who quantitative indicators ofgambling risk compared with the PGSI items. The 3 additional indicators were ‘Gambling morethan once per week’, ‘Spending more than 1% of one’s gross family income on gambling’ and‘Spending more than $1000 per year on gambling’. Experts were able to choose multipleresponses to each question (i.e., a PGSI item could be seen in any combination of Recreational,At Risk, and Problem Gamblers). Table 6.9 presents the results. As expected, the majority ofrespondents rated the nine PGSI symptoms as likely to appear in problem gamblers. Less than20% of respondents also felt these symptoms would appear in recreational gamblers. Over halfof respondents felt each PGSI symptom could also appear in at risk gamblers. Our attempt topictorially capture these results is shown in Figure 6.2. The overall findings suggest the PGSIdoes cover the continuum of gambling from at risk to problematic levels.
Discussion
Based on the opinions of the experts surveyed we reach the following conclusions about thePGSI:
1) The PGSI is a well-regarded instrument overall. Most experts feel it is useful inidentifying both at risk and problem gamblers. About 20% of experts voiced concerns offalse positives and false negatives with the scale however the majority was neutral onthese questions suggesting they may not have a basis for providing an opinion. Similarlyabout one third felt the scoring system could be improved but one third were also neutralon the question. There was no evidence of participant bias toward the PGSI by virtue ofbeing Canadian or a researcher with experience in using the scale.
2) The PGSI includes items characteristic of both problem and low-risk gamblers. Six ofthe items were judged to be indicators of problem gambling rather than core aspects.Hence, the scale is not overrepresented by symptoms one would only expect to see inproblem gamblers. This finding is consistent with the intention of the instrument—tomeasure the continuum of risk from non-symptomatic to problem gambling levels ofseverity. In short, the PGSI has excellent face validity as a measure of problem gamblingseverity.
3) The present Likert scale used by the PGSI item assumes that equivalency of severity foreach scale level across all symptoms (i.e., reporting feelings of guilt ‘sometimes’ isequivalent in severity to borrowing money ‘sometimes’). The assumption waschallenged by the expert rankings of relative weight of the Likert scale options across theitems. Specifically, the present scoring system (sometimes = 1, most of the time = 2, andalmost always = 3) was confirmed for only four items. A modified scoring system,giving more weight to the sometimes category, would be justified for the remaining fivePGSI items. Applying the modified scoring system had a modest impact on theproportion of gamblers falling into the low-risk, moderate-risk, and problem gamblerscategories. Specifically, more gamblers are labeled moderate-risk and problem gamblersusing the modified response choice scoring.
85
4) Quantitative thresholds of gambling intensity were rated by experts as also beingindicators of low-risk gamblers. These indicators (i.e., the low-risk gambling limits orcomparable thresholds of gambling behaviours) could be explored as new items for thePGSI. Other brief screening tools in the field of addictions employ items assessingquantitative dimensions of consumption as measures of risk (c.f., AUDIT for alcoholdisorder screening). An advantage of such items is that they do not rely on theemergence of specific consequences of gambling to be endorsed.
Section 7
Conclusions
1. The CPGI is well-regarded by researchers and clinicians in Canada and elsewhere. Expertswho participated in our survey felt the PGSI is useful in identifying both at risk and problemgamblers. About one third of the sample felt the scoring system could be improved howevera large proportion of respondents declined to offer an opinion on this issue. It is possible thatmany users of the CPGI are unaware of any concerns with the scoring system.
2. The PGSI in its present form demonstrates strong internal validity. The factor structure wasconfirmed with both exploratory and confirmatory methods. All items load on the one-factormodel. The factor structure is valid for both the 4-point Likert scaled items and when theitems are dichotomously scored by collapsing the sometimes, most of the time, and almostalways response choices into a single score. Internal reliability is better with the Likertscaled items. The factor structure is invariant across subgroups defined by gender, age,income level, and game types.
3. The Rasch analysis supports the PGSI as an internally reliable, continuous measure ofproblem gambling severity. No miss-fitting items were identified and there was evidence ofclinically significant differential item functioning with only one item, borrowing money togamble. Similar results were found with the Likert and dichotomously scored items.Measurement precision is better with the Likert scored PGSI but coverage of symptomsacross the continuum of problem gambling severity was slightly better with the dichotomousitems. Overall, dichotomous scoring does not substantially improve the internal validity ofthe PGSI.
4. The factor structure and Rasch model fit of the PGSI is superior to other comparablemeasures of problem gambling severity notably the SOGS and DSM-IV based scalesincluding the NODS.
5. Gaps in the coverage of problem gambling severity are evident in the PGSI. The Raschmodels suggests a large gap exists in the severity of problem gambling reflected in the itemsbetting more than one can afford to lose and recognition of gambling problem. This portionof the continuum corresponds to the low-risk and moderate-risk range of the PGSI scoringcategories (i.e., gamblers who endorse between one to four symptoms). The addition of newPGSI items that reflect mid-range problem gambling severity would provide better coverageof symptoms that are characteristic of low and moderate-risk gamblers.
6. The relative order of PGSI symptoms ranked by level of problem gambling severity beingassessed is similar to the SOGS and DSM-IV based scales, at least for the items that are
86
comparable across instruments. Moreover, there was good agreement between the Raschmodel ranking of symptoms by severity and the opinions of gambling experts.
7. The present taxonomy for gambler subtypes based on total PGSI score has four levels: non-problem, low-risk, moderate-risk, and problem gamblers. The non-problem gambler subtype(PGSI = 0) appears to be a distinct group of gamblers on most dimensions. This grouprepresents the typical, normative Canadian gambler. The problem gambler category (PGSI >7) also appears to be a distinct group of gamblers on all dimensions. The differencesbetween this category and closest adjacent category, moderate-risk gamblers, were largeenough to be considered clinically meaningful on many key dimensions. Overall, there issufficient evidence to retain these PGSI subtypes with minimal changes.
8. Differences between the low-risk and moderate-risk PGSI subtypes were not statisticallysignificant for most of the dimensions analyzed. These gambler subtypes, based on thecurrent PGSI scoring cutoffs, are not sufficiently different to justify their retention as distinctcategories of gamblers. There are two options for improving the classification of mid-levelproblem gambling severity (i.e., gamblers who score greater than zero but under 9 on thePGSI): (1) merge the low and moderate-risk categories into a single PGSI subtype of ‘at-riskgamblers,’ with the PGSI score used as a quantitative index of degree of risk that ranges from1 to 7. (2) modify the PGSI scoring cut-off rules creating two new mid-level categoriesconsisting of low-risk gamblers (PGSI = 1 to 4) and moderate-risk gamblers (PGSI = 5 to 7).These categories better separate gamblers with mid-level severity of problems into two levelsof risk than the previous groupings. The pros and cons of this and other changes to thescoring system are detailed in Table 7.1
9. The temporal reliability for the four PGSI subtypes, using both the original scoring rules andthe novel scoring rules, is satisfactory for a retest interval of approximately 14 months.Using both the intraclass correlation coefficient and reliable change index to assess reliability,the majority of gamblers do not shift PGSI subtype over time. As predicted, shift in PGSIsubtype over time corresponded to a change in level of gambling intensity—ie., an increasein PGSI score that resulted in a gambler being classified as a higher risk gambler could beexplained by an increase in gambling expenditure.
10. There is no statistical evidence justifying item-level weights for the PGSI items. Inregression models predicting both measures of gambling intensity and number of DSM-IVsymptoms of pathological gambling the confidence intervals around the coefficientsoverlapped for the majority of PGSI symptoms. This suggests there is no statistical basis forweighting specific PGSI items as contributing more to the total score. We acknowledgethere are significant limitations in the data available that prevent the development of robustweights at this time.
Revising the PGSI scoring system
The results from our analyses suggest that revisions to the scoring system could improve theassessment of mid-level problem gambling severity. It should be noted that revisions to thePGSI would not necessarily improve the identification of problem gamblers, which is one of theprimary purposes of the instrument. In this capacity, the PGSI does an adequate job and ispsychometrically stronger than comparable gambling scales. On one hand, a revised scoringsystem could enhance the validity of the gamblers in the middle range of problem severity. Onthe other hand, any revision to the scoring system that results in changing the cut-off for problem
87
gambling would require a new validation study to justify this cut-off. For example, altering thescoring of the Likert response choices—giving more weight to a ‘sometimes’ response—wouldresult in more gamblers be classified as problem gamblers under the original scoring cut-off.
It is possible a new validation study could be done with existing data. For example, the LLLPstudy included additional measures of DSM-IV pathological gambling. However, this studyincludes only Alberta gamblers and specifically oversampled at risk gamblers. A larger, morerepresentative sample would be desired. Future validation work should also incorporate changesto the diagnostic criteria for pathological gambling being planned for the release of the DSM-V 1.We recommend waiting for the release of the DSM-V before changing the cut-off for clinicaldiagnostic purposes.
Table 7.1 provides various options for revising the scoring system. Most of these options areintended to improve the validity of the PGSI subtypes of low and moderate-risk gamblers. Oneoption, for example is to alter the scoring of the Likert response choices for the items chasinglosing borrowing money, financial problems, and health problems —specifically, giving moreweight to a ‘sometimes’ response (assigning a score of 2 rather than 1) and equating the scoringof the ‘most of the time’ and ‘almost always’ responses (both get scores of 3). Because thiswould result in more gamblers be classified as moderate-risk and problem gamblers under theoriginal scoring cut-off, validation of new cut-offs would be required. Modification such as thisare an attempt to compensate for a poorly worded Likert scale—that is, the lack of discriminationbetween the ‘most of the time’ and ‘almost always’ choices. If the PGSI is revised and a newvalidation study planned, we strongly suggest revising the Likert scale in the process. Twooptions are listed: removing the ‘almost always’ choice to create a shorter 3-point scale, oradopting the Australian revision of having five response choices (never=0, sometimes = 1, rarely= 1, often = 2, always =3) for each item 57.
Another option is to add new items that specifically assess mid-level problem gambling severity.New items could increase the range of scores for gamblers classified as low-risk or moderate-risk.An increased score range could also enhance the distinctiveness of these subtypes. Quantitativemeasures of gambling intensity (frequency of gambling, expenditure on gambling, duration ofgambling sessions) could also be considered for new items. These items could be formatteddichotomously in the form exceeding low-risk thresholds (e.g., gambling weekly or more), orwith a graduated scale with higher scores assigned to more intense gambling (e.g., 0 = less thanmonthly, 1 = monthly, 2 = weekly, 3 = more than weekly). One of the challenges in usingquantitative measures of gambling intensity is managing the enormous variety of game types andrelative meaning of different measures of intensity. For example, playing EGMs weekly carriesa greater risk of gambling harm than playing the lottery weekly. One option is to limit the scopeof quantitative measures to high risk games (i.e., specifically ask about frequency or expenditureon EGMs and casino games rather than any gambling).
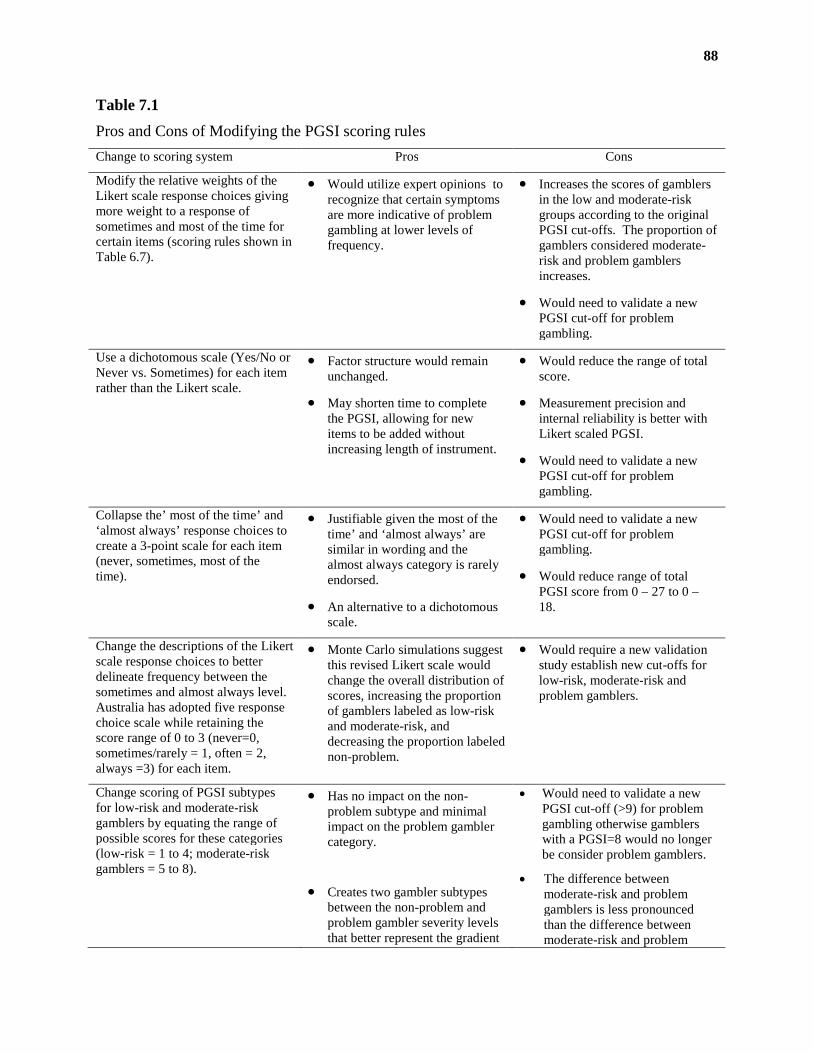
88
Table 7.1
Pros and Cons of Modifying the PGSI scoring rules
Change to scoring system Pros Cons
Modify the relative weights of theLikert scale response choices givingmore weight to a response ofsometimes and most of the time forcertain items (scoring rules shown inTable 6.7).
Would utilize expert opinions torecognize that certain symptomsare more indicative of problemgambling at lower levels offrequency.
Increases the scores of gamblersin the low and moderate-riskgroups according to the originalPGSI cut-offs. The proportion ofgamblers considered moderate-risk and problem gamblersincreases.
Would need to validate a newPGSI cut-off for problemgambling.
Use a dichotomous scale (Yes/No orNever vs. Sometimes) for each itemrather than the Likert scale.
Factor structure would remainunchanged.
May shorten time to completethe PGSI, allowing for newitems to be added withoutincreasing length of instrument.
Would reduce the range of totalscore.
Measurement precision andinternal reliability is better withLikert scaled PGSI.
Would need to validate a newPGSI cut-off for problemgambling.
Collapse the’ most of the time’ and‘almost always’ response choices tocreate a 3-point scale for each item(never, sometimes, most of thetime).
Justifiable given the most of thetime’ and ‘almost always’ aresimilar in wording and thealmost always category is rarelyendorsed.
An alternative to a dichotomousscale.
Would need to validate a newPGSI cut-off for problemgambling.
Would reduce range of totalPGSI score from 0 – 27 to 0 –18.
Change the descriptions of the Likertscale response choices to betterdelineate frequency between thesometimes and almost always level.Australia has adopted five responsechoice scale while retaining thescore range of 0 to 3 (never=0,sometimes/rarely = 1, often = 2,always =3) for each item.
Monte Carlo simulations suggestthis revised Likert scale wouldchange the overall distribution ofscores, increasing the proportionof gamblers labeled as low-riskand moderate-risk, anddecreasing the proportion labelednon-problem.
Would require a new validationstudy establish new cut-offs forlow-risk, moderate-risk andproblem gamblers.
Change scoring of PGSI subtypesfor low-risk and moderate-riskgamblers by equating the range ofpossible scores for these categories(low-risk = 1 to 4; moderate-riskgamblers = 5 to 8).
Has no impact on the non-problem subtype and minimalimpact on the problem gamblercategory.
Creates two gambler subtypesbetween the non-problem andproblem gambler severity levelsthat better represent the gradient
Would need to validate a newPGSI cut-off (>9) for problemgambling otherwise gamblerswith a PGSI=8 would no longerbe consider problem gamblers.
The difference betweenmoderate-risk and problemgamblers is less pronouncedthan the difference betweenmoderate-risk and problem
89
of increasing severity.
The low-risk and moderate-riskgambler subtypes are moredistinct than low-risk andmoderate-risk under the originalscoring rules in terms ofgambling intensity and gamepreference.
gamblers. This may reduce thespecificity of the cut-off forproblem gamblers.
As above, but retain PGSI ≥ 8 as thecut-off for problem gamblers bydefining moderate-risk gamblers asPGSI 5 to 7.
Would not require validation of anew cut-off for defining problemgamblers.
Only modest differences in thesubtype defined as PGSI = 5 to 8vs. PGSI = 5 to 7.
Different range of scores for allfour subtypes (Non-problem = 1,low-risk = 4, moderate-risk = 3,and problem gamblers = 20)
Section 8
Recommendations
Recommendations that could be implemented immediately.
The results from our analyses suggest that revisions to the existing scoring system wouldimprove the assessment of mid-level problem gambling severity. Specifically, we recommendthat the low-risk and moderate-risk subtypes be eliminated in favour of two new mid-levelcategories consisting of low-risk gamblers defined as a PGSI score of 1 to 4 and moderate-riskgamblers defined as a PGSI score of 5 to 7. Ideally, these subtypes would have the same rangeof scores (4) however defining moderate-risk gamblers as scoring from 5 to 8 would requirevalidation of a new cut-off for problem gamblers (e.g., ≥ 9). Our findings suggest this is littledifference in defining moderate-risk gamblers with the upper range being 7 rather than 8 sokeeping the original cut-off for defining problem gamblers as PGSI ≥ 8 would allow forcomparisons of previous and future prevalence studies.
Recommendations that would require the collection of new data.
The remaining recommendations pertain to the development of new PGSI items and an overhaulof the Likert response scale. These recommendations would require a new validation study tocollect normative data and establish new cut-offs for the PGSi subtypes. The specificrecommendations are:
1) Adopt a new Likert scale that replaces the ‘most of the time’ and ‘almost always’ choices.It has been noted that these response choices are very similar in wording and ‘almostalways’ is rarely endorsed. Two options for improving the Likert scale include:removing the ‘almost always’ choice to create a shorter 3-point scale (never, sometimesor most of the time), or adopting the Australian revision of having five response choices(never=0, rarely = 1, sometimes = 1, often = 2, always =3) for each item. In theAustralian scoring system, rarely and sometimes receive the same score. Given that thePGSI performs similarly when the items are dichotomously scored or Likert scored, werecommend shortening the number of response choices per item in favour of adding moreitems to expand the range of symptoms in the low and moderate-risk categories.
90
2) Add new items that specifically assess mid-level problem gambling severity to increasethe range of scores for gamblers classified as low-risk or moderate-risk. An increasedscore range could also enhance the distinctiveness of these subtypes and aid in thedetection of gamblers who are approaching the clinical threshold for problem gambling.
3) Consider the addition of quantitative measures of gambling intensity (frequency ofgambling, expenditure on gambling, duration of gambling sessions) as new items.
4) Future validation work on the PGSI should incorporate changes to the diagnostic criteriafor pathological gambling being planned for the release of the DSM-5 1. We recommendwaiting for the release of the DSM-5 before changing the cut-off for problem gamblersfor clinical diagnostic purposes.
5) The development of item-level weights for the PGSI would require a valid, externalcriterion to assess the relative contribution of the individual PGSI items in predicting.The ideal criterion would be an another indicator of problem gambling severity that isdistinct from the PGSI --e.g., collateral ratings of problem severity obtained from afamily member or clinician--and not exclusively based on DSM-IV criteria. A futureCPGI population survey could attempt to collect collateral ratings of problem gamblingseverity for a sample of participants for use in a weight development study.
91
Section 9
Reference List
1. Petry NM. Pathological gambling and the DSM-V. International Gambling Studies 2010;10:113-115.
2. Azmier, J. Gambling in Canada 2005: Statistics and Context. 2005. Calgary, AB, Canada WestFoundation.
3. Cox BJ, Yu N, Afifi TO, et al. A national survey of gambling problems in Canada. CanadianJournal of Psychiatry - Revue Canadienne de Psychiatrie 2005;50:213-217.
4. Ladouceur R. The prevalence of pathological gambling in Canada. J Gambl Stud 1996;12:129-142.5. Marshall, K. and Wynne, H. Fighting the odds. Perspectives [Catalogue no. 75-001-XIE], 5-12.
2003. Ottawa, Statistics Canada.6. Shaffer HJ, Hall MN, Vander Bilt J. Estimating the prevalence of disordered gambling behavior in
the United States and Canada: A research synthesis. American Journal of Public Health1997;89:1369-1376.
7. Williams RJ, Wood RT. The proportion of gaming revenue derived from problem gamblers:Examining the issues in a Canadian Context. Analyses of Social Issues and Public Policy2004;4:33-45.
8. Ferris, J. and Wynne, H. J. The Canadian Problem Gambling Index final report. 2001. Ottawa, ON,Canadian Centre on Substance Abuse.
9. Stinchfield R, Govoni R, Frisch GR. A review of screening and assessment instruments for problemand pathological gambling. In: Smith G, Hodgins DC, Williams RJ, eds. Research andMeasurement Issues in Gambling Studies. Burlington, MA: Academic Press; 2007:179-213.
10. McCready, J. and Adlaf, E. Performance and enhancement of the Canadian Problem GamblingIndex: Report and recommendations. 2006. Guelph, ON, Ontario Problem Gambling ResearchCentre.
11. Volberg, Rachel A. and Young, Matthew M. Using SOGS vs CPGI in Problem GamblingScreening and Assessment. 2008. Guelph, ON, Ontario Problem Gambling Research Centre.
12. Mcmillen J, Wenzel M. Measuring Problem Gambling: Assessment of Three Prevalence Screens.International Gambling Studies 2006;6:147-174.
13. Currie, S., Hodgins, D. C., and Wang, J. L. Canadian Low-Risk Gambling Limits: New Evidenceand Limitations. 2008. Guelph, ON, Ontario Problem Research Centre.
14. Currie SR, Hodgins DC, Wang J, et al. Risk of harm from gambling in the general population as afunction of level of participation in gambling activities. Addiction 2006;101:570-580.
15. Currie S.R., Hodgins, D. C., Casey, D., el-Guebaly, N., Smith, G., Williams, R. J., Schopflocher, D.,and Wood, R. Examining the Predictive Validity of Low Risk Gambling Limits with LongitudinalData. Manuscript under review. 2010.
16. American Psychiatric Association. Diagnostic and statistical manual of mental disorders. 4th ed.Washington, DC: Author; 1994.
17. Stinchfield, Randy, Govoni, Richard, and Frisch, C. Ron. DSM-IV Diagnostic Criteria forPathological Gambling: Reliability, Validity, and Classification Accuracy. American Journal onAddictions 14[1], 73-82. 1-1-2005.
18. Orford J, Wardle H, Griffith M, et al. PGSI and DSM-IV in the 2007 British Gambling PrevalenceSurvey: reliability, item response, factor structure and inter-scale agreement. InternationalGambling Studies 2010;10:31-44.
19. Smith, G. J. and Wynne, H. J. Measuring gambling and problem gambling in Alberta using theCanadian Problem Gambling Index. 2002. Edmonton, AB, Alberta Gaming Research Institute.
20. Ipsos-Reid & Gemini Research. British Columbia Problem Gambling Prevalence Study. 2003.Vancouver, British Columbia, Ministry of Public Safety and Solicitor General, British Columbia.
92
21. Wiebe, J., Single, E., and Falkowski-Ham, A. Measuring gambling and problem gambling inOntario. 2001. Ottawa, ON, Canadian Centre on Substance Abuse.
22. Wiebe, J., Mun, P., and Kauffman, N. Gambling and problem gambling in Ontario 2005. 2005.Toronto, ON, Responsible Gambling Council.
23. Patton, D., Brown, D., Dhaliwal, J., Pankratz, C., and Broszeit, B. Gambling Involvement andProblem Gambling in Manitoba. 2002. Winnipeg, Manitoba, Addictions Foundation of Manitoba.
24. Market Quest Research Group Inc. Newfoundland and Labrador Gambling Prevalence Study. 2005.St. John's, Newfoundland, Department of Health and Community Services, Newfoundland.
25. Currie SR, Casey DM. Quantification and dimensionalization of gambling behaviour. In: Smith G,Hodgins DC, Williams RJ, eds. Research and Measurement Issues in Gambling Studies. Burlington,MA: Academic Press; 2007:156-173.
26. Weinstock, J., Ledgerwood, D. M., and Petry, N. M. Association Between Posttreatment GamblingBehavior and Harm in Pathological Gamblers. Psychology of Addictive Behaviors 21, 185-193. 1-1-2007.
27. Statistics Canada. Canadian Community Health Survey (Cycle 1.2) - Mental Health and Well-beingUser's Guide. 2002. Ottawa, ON: Statistics Canada.
28. Gravel R, Beland Y. The Canadian Community Health Survey: Mental Health and Well-Being. CanJ Psychiatry 2005;50:573-579.
29. Masse R, Poulin C, Dasa C, et al. Elaboration et validation d'un outil de mesure du bien-etrepsychologique : L'emmbep. Canadian Journal of Public Health 1998;89:357.
30. el-Guebaly N, Casey D, Hodgins DC, et al. Designing a Longitudinal Cohort Study of Gambling inAlberta: Rationale, Methods, and Challenges. J Gambl Stud 2008;4:479-504.
31. Breen R, Zimmerman M. Rapid onset of pathological gambling in machine gamblers. Journal ofGambling Studies 2002;18:31-43.
32. Welte J, Barnes G, Wieczorek W, et al. Risk factors for pathological gambling. AddictiveBehaviors 2004;29:323-335.
33. Currie SR, Hodgins DC, Wang J, et al. Replication of low-risk gambling limits using Canadianprovincial gambling prevalence data. J Gambl Stud 2008;24:321-335.
34. Smith, G. J. Gambling Policy and Public Opinion. Presentation at the Alberta Gaming ResearchInstitute's 9th Annual Conference . 2010.
35. Jacobson NS, Roberts LJ, Berns SB, et al. Methods for defining and determining the clinicalsignificance of treatment effects: description, application, and alternatives. Journal of Consulting &Clinical Psychology 1999;67:300-307.
36. Babor TF, Caetano R, Casswell S, et al. Alcohol: No ordinary commodity: Research and publicpolicy. New York: Oxford University Press; 2003.
37. Babor TF, Higgins-Biddle JC. Brief Intervention: For hazardous and harmful drinking - A manualfor use in primary care. WHO Department of Mental Health and Substance Dependence; 2001.
38. Holtgraves T. Evaluating the Problem Gambling Severity Index. J Gambl Stud 2009;Vol.25:105-120.
39. Young, Matthew M. and Wohl, Michael J. A. Evaluation of the Canadian Problem Gambling Index(CPGI), and the CPGI Profiler software in a Clinical Setting. 2008. Guelph, ON, Ontario ProblemGambling Research Centre.
40. Hu LT, Bentler PM. Cutoff criteria for fit indices in covariance structure analysis: Conventionalcriteria versus new alternatives. Structural Equation Modeling 1999;6:1-55.
41. Byrne BM. Structural equation modeling with AMOS. Basic concepts, applications, andprogramming. New York: Taylor and Francis.; 2010.
42. Wright BD, Stone MH. Best test design: Rasch measurement. Chicago: MESA Press; 1979.43. Langenbucher JW, Labouvie E, Martin CS, et al. An Application of Item Response Theory
Analysis to Alcohol, Cannabis, and Cocaine Criteria in DSM-IV. Journal of Abnormal Psychology2004;113:72-80.
44. Embretson SE, Reise SP. Item response theory for psychologists. Mahwah, NJ: Erlbaum; 2000.
93
45. Linacre JM. Rasch power analysis: Size vs. significance: Standardized chi-square fit statistics.Rasch Measurement Transactions 2003;17:918.
46. Strong DR, Kahler CW. Evaluation of the continuum of gambling problems using the DSM-IV.Addiction 2007;102:713-721.
47. Steinberg L, Thissen DE-MA, Steinberg Lle. Using effect sizes for research reporting: Examplesusing item response theory to analyze differential item functioning. Psychological Methods2006;11:402-415.
48. Molde H, Hystad SW, Pallesen S, et al. Evaluating lifetime NODS using Rasch modelling.International Gambling Studies 2010;10:189-202.
49. Strong DR, Lesieur HR, Breen RB, et al. Using a Rasch model to examine the utility of the SouthOaks Gambling Screen across clinical and community samples. Addictive Behaviors 2004;29:465-481.
50. Strong DR, Kahler CW. Evaluation of the continuum of gambling problems using the DSM-IV.Addiction 2007;102:713-721.
51. Parke J, Griffiths M. The role of structural characteristics in gambling. In: Smith G, Hodgins DC,Williams RJ, eds. Research and Measurement Issues in Gambling Studies. Burlington, MA:Academic Press; 2007:218-245.
52. Strong DR, Breen RB, Lesieur HR, et al. Using the Rasch model to evaluate the South OaksGambling Screen for use with nonpathological gamblers. Addictive Behaviors 2003;28:1465-1472.
53. Hofstee WKB. How to score questionnaires. Personality and Individual Differences 1998;.25.54. Giovannelli TS, Cash T, Cash TF. The measurement of body-image dissatisfaction-satisfaction: Is
rating importance important? Body Image 2008;5.55. Statistics Canada & the Canadian Institutes of Health Research. Canadian Community Health
Survey (CCHS), Cycle 1.2: Mental Health and Well-Being. Ottawa: Statistics Canada; 2002.56. Currie SR, Hodgins DC, Wang J, et al. In pursuit of empirically based responsible gambling limits.
International Gambling Studies 2008;8:229.57. Australian Government Productivity Commission. Gambling: Productivity Commission Report.
Volume 2. 2010. Melbourne, Commonwealth of Australia Productivity Commission.
94
APPENDICES
Appendix A. Copy of the CPGI used in Alberta Gambling Prevalence Survey in 2002.
Appendix B. Table Comparing the CPGI used in different Provinces
Appendix C. Table Comparing CPGI Demographics Questions
Appendix D. Copy of the CPGI used in the CCHS-1.2 survey
Appendix E. CCHS-1.2 Questions on Mental Disorders
Appendix F. Expert Opinion Survey

95
Appendix A. Copy of the CPGI used in Measuring Gambling and Problem Gambling in AlbertaUsing the Canadian Problem Gambling Severity Index (C.P.G.I.) by Smith & Wynne, 2002.
CANADIAN PROBLEM GAMBLING INDEX(N=1804)
Hello, my name is ______________ and I'm calling (long distance) from the Population ResearchLaboratory at the University of Alberta. Have I dialed XXX-XXXX? Your phone number was selected atrandom by computer as belonging to a household in Alberta.We are currently conducting a research survey on the gambling activities and attitudes of Albertans. Theinformation gathered in this study will help researchers better understand gambling behaviour and developprograms and services for Albertans with gambling problems. We are interested in a wide representation ofviewpoints and would like to speak with people who gamble as well as those who do not gamble.
To ensure that we speak with a good cross-section of people in the province, could you please tell me thenumber of men aged 18 and older who live in your household?
_______ # of men aged 18 and older
And the number of women aged 18 and older?
_______ # of women aged 18 and older
We don’t always interview the person who answers the telephone. For this study I would like to interview the(a) (male/female) member of the household. Would that person be available to speak with me?
1 Yes-proceed2 No-schedule callback for person (or code appropriately)
INTERVIEWER NOTE: REPEAT INTRODUCTION IF ANOTHER PERSON COMES TO PHONE.
Enter gender of respondent
1 Male2 Female
I would like to interview you and I’m hoping that now is a good time for you. The interview will take about 15minutes, depending on the questions that apply to you. Is now a convenient time for you?
1 Yes-proceed2 No-schedule callback (or code appropriately)
Before I go on, I would like to assure you that your participation in this interview is completely voluntary. Ifthere are any questions you don’t wish to answer, please point these out to me and we’ll go on to the nextquestion. You, of course, have the right to end this phone call at any time. The information we are requestingin this interview is protected under the Alberta Freedom of Information and Protection of Privacy Act and willbe used only for research purposes.Nobody will be identified individually in any reports coming out of the survey. If you have any questionsabout this study, you can call Cathy Drixler, Project Coordinator at the Population Research Lab (at 780-492-4659, ext. 229). May we proceed?
1 Yes2 No-Arrange callback or code appropriately
First, I would like to ask you some questions about gambling activities you may participate in. Peoplespend money and gamble on many different things including buying lottery tickets, playing BINGO, or

96
playing card games with their friends. I am going to read you a list of activities and I would like you to tellme which of these you have bet or spent money on in the past 12 months.
1. In the past 12 months, have you bet or spent money on….(READ. SELECT ALL THAT APPLY)2.
Lottery tickets such as 649, Super 7, or POGODaily lottery tickets like Pick 3Instant-win or scratch tickets (e.g., break-open, pull tabs, Nevada strips)Raffle tickets or fundraising ticketsBINGOCard or board games with family or friends (for money)Video lottery terminals (VLTs) (i.e., in bar or restaurant lounge)Casino slot machinesArcade or video games for moneyGambling on the InternetSports Select (e.g., Pro Line, Over/Under, Point Spread)Sports pools (e.g., charity-sponsored or at work)Outcome of sporting events (other than sports pool or Sports Select)Sports with a bookieHorse races at the track or off-trackGames at Alberta casinos other than coin slots or VLTs (e.g., poker, blackjack, roulette)Games at casinos outside Alberta (e.g., Las Vegas, Regina) other than coin slots or VLTs (e.g.,poker, blackjack, roulette)Stocks, options, commodities markets but NOT mutual funds or RRSPsGames of skill for money like golf, pool, bowling, dartsCard games in non-regulated settings other than with family/friends (e.g., card rooms)Other forms of gambling 1 (specify) ______________________Other forms of gambling 2 (specify) ______________________No response
IF RESPONDENT HAS NOT GAMBLED IN THE PAST 12 MONTHS, SKIP TO Q28A
For each activity that respondent has participated in during the past 12 months ask questions 2-7:
2. In the past 12 months, how often did you bet or spend money on ___________?Would you say…(READ)1 Daily2 2 to 6 times/week3 About once/week4 2-3 times/month5 About once/month6 Between 6-11 times/year7 Between 1-5 times/year8 Don’t know0 No response
3. In the past 12 months, how many minutes or hours did you normally spend EACH TIME betting orspending money on _____________________?
_______ Number of minutes (EXACT MINUTES. NO ROUNDING)
481 More than 8 hours998 Don’t know999 No response
97
4. In the past 12 months, how much money, not including winnings, did you spend on__________________ in a typical month?
_______ Number of dollars99998 Don’t know99999 No response
NOTE: Spending means out of pocket and doesn’t include money won and then spent
5. In the past 12 months, what is the largest amount of money you spent on ___________ in any oneday?
_______ Number of dollars
99998 Don’t know99999 No response
6. When you spend money on ____________, who do you participate with or go with? (READ TOPROMPT IF NECESSARY. IF MORE THAN ONE RESPONSE, SELECT ‘6’ AND RECORDRESPONSES)
1 Alone2 With spouse or partner3 With other family members4 With friends or co-workers5 With some other individual or group (Specify)6 More than one of selections above (Specify)7 Don’t know0 No response
7. What are the main reasons why you participate in ____________? (DO NOT READ. IF MORE THANONE RESPONSE, SELECT ‘12’ AND RECORD ALL RESPONSES)
1 In order to do things with your friends2 For excitement or as a challenge3 As a hobby4 To win money5 To support worthy causes6 Out of curiosity7 For entertainment or fun8 To distract yourself from everyday problems9 Because you’re good at it10 To be alone11 Other (specify)12 More than one reason (specify)13 Don’t know0 No response
The next questions are part of a standard measurement scale that was recently developed in Canada foruse in gambling surveys similar to this one. For each question I would like you to base your answer onthe past 12 months. Some of these questions may not apply to you but please try to answer as accuratelyas possible. Remember that all your answers are strictly confidential. The categories to use for eachquestion are never, sometimes, most of the time, or almost always.
8. Thinking about the past 12 months, have you bet more than you could really afford to lose? Would yousay…(READ)
1 Never
98
2 Sometimes 3 Most of the time4 Almost always5 Don’t know0 No response
9. (Thinking about the past 12 months)…have you needed to gamble with larger amounts of money to getthe same feeling of excitement? (Would you say…(READ))
10. (Thinking about the past 12 months)…have you gone back another day to try to win back the moneyyou lost? (Would you say… (READ))
11. (Thinking about the past 12 months)…have you borrowed money or sold anything to get money togamble? (Would you say… (READ))
12. (Thinking about the past 12 months)…have you felt that you might have a problem with gambling?(Would you say… (READ))
13. (Thinking about the past 12 months)…have people criticized your betting or told you that you had agambling problem, regardless of whether or not you thought it was true? (Would you say… (READ))
14. (Thinking about the past 12 months)…have you felt guilty about the way you gamble or what happenswhen you gamble? (Would you say… (READ))
15. (Thinking about the past 12 months)…has your gambling caused you any health problems, includingstress or anxiety? (Would you say… (READ))
16. (Thinking about the past 12 months)…has your gambling caused any financial problems for you oryour household? (Would you say… (READ))
17. (Thinking about the past 12 months)…have you felt like you would like to stop betting money orgambling but you didn’t think that you could? (Would you say… (READ))
18. (Thinking about the past 12 months)…have you hidden betting slips, lottery tickets, gambling money,IOUs, or other signs of betting or gambling from your partner, children, or other important peoplein your life? (Would you say… (READ))
19. (Thinking about the past 12 months)…have you gambled as a way of escaping problems or to helpyou feel better when you were depressed? (Would you say… (READ))
20. (Thinking about the past 12 months)…have you lied to family members or others to hide yourgambling? (Would you say… (READ))
21. (Thinking about the past 12 months)…have you bet or spent more money than you wanted to ongambling? (Would you say… (READ))
22. (Thinking about the past 12 months)…have you tried to quit or cut down on your gambling but wereunable to do it? (Would you say… (READ))
23. (Thinking about the past 12 months)…have you had difficulty sleeping because of your gambling?(Would you say… (READ))
24. (Thinking about the past 12 months)…have you felt irritable or restless when you tried to cut down orstop gambling for a while? (Would you say… (READ))
25. (Thinking about the past 12 months)…has your gambling caused any problems between you and anyof your family members or friends? (Would you say… (READ))
26. (Thinking about the past 12 months)…have you stolen anything or done anything illegal such as writebad cheques so that you could have money to gamble? (Would you say… (READ))
27. (Thinking about the past 12 months)…have you almost lost a relationship, a job, or an educational orcareer opportunity because of your gambling? (Would you say… (READ))
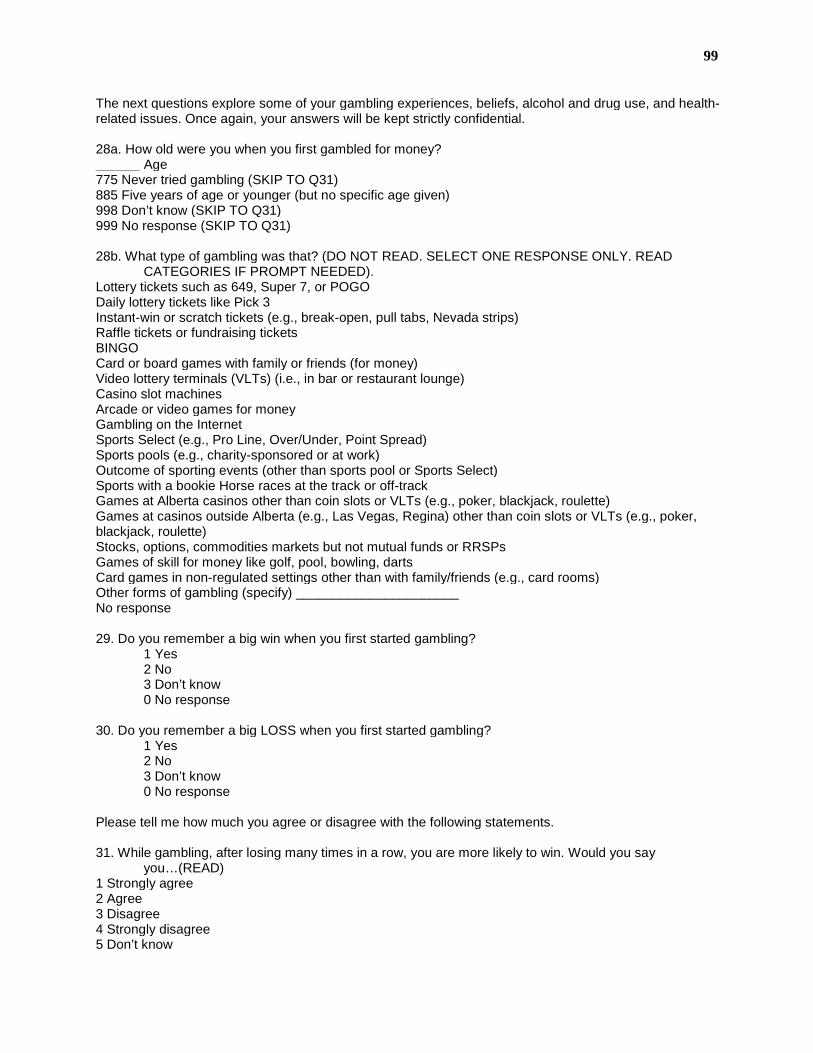
99
The next questions explore some of your gambling experiences, beliefs, alcohol and drug use, and health-related issues. Once again, your answers will be kept strictly confidential.
28a. How old were you when you first gambled for money?______ Age775 Never tried gambling (SKIP TO Q31)885 Five years of age or younger (but no specific age given)998 Don’t know (SKIP TO Q31)999 No response (SKIP TO Q31)
28b. What type of gambling was that? (DO NOT READ. SELECT ONE RESPONSE ONLY. READCATEGORIES IF PROMPT NEEDED).
Lottery tickets such as 649, Super 7, or POGODaily lottery tickets like Pick 3Instant-win or scratch tickets (e.g., break-open, pull tabs, Nevada strips)Raffle tickets or fundraising ticketsBINGOCard or board games with family or friends (for money)Video lottery terminals (VLTs) (i.e., in bar or restaurant lounge)Casino slot machinesArcade or video games for moneyGambling on the InternetSports Select (e.g., Pro Line, Over/Under, Point Spread)Sports pools (e.g., charity-sponsored or at work)Outcome of sporting events (other than sports pool or Sports Select)Sports with a bookie Horse races at the track or off-trackGames at Alberta casinos other than coin slots or VLTs (e.g., poker, blackjack, roulette)Games at casinos outside Alberta (e.g., Las Vegas, Regina) other than coin slots or VLTs (e.g., poker,blackjack, roulette)Stocks, options, commodities markets but not mutual funds or RRSPsGames of skill for money like golf, pool, bowling, dartsCard games in non-regulated settings other than with family/friends (e.g., card rooms)Other forms of gambling (specify) ______________________No response
29. Do you remember a big win when you first started gambling?1 Yes2 No3 Don’t know0 No response
30. Do you remember a big LOSS when you first started gambling?1 Yes2 No3 Don’t know0 No response
Please tell me how much you agree or disagree with the following statements.
31. While gambling, after losing many times in a row, you are more likely to win. Would you sayyou…(READ)
1 Strongly agree2 Agree3 Disagree4 Strongly disagree5 Don’t know
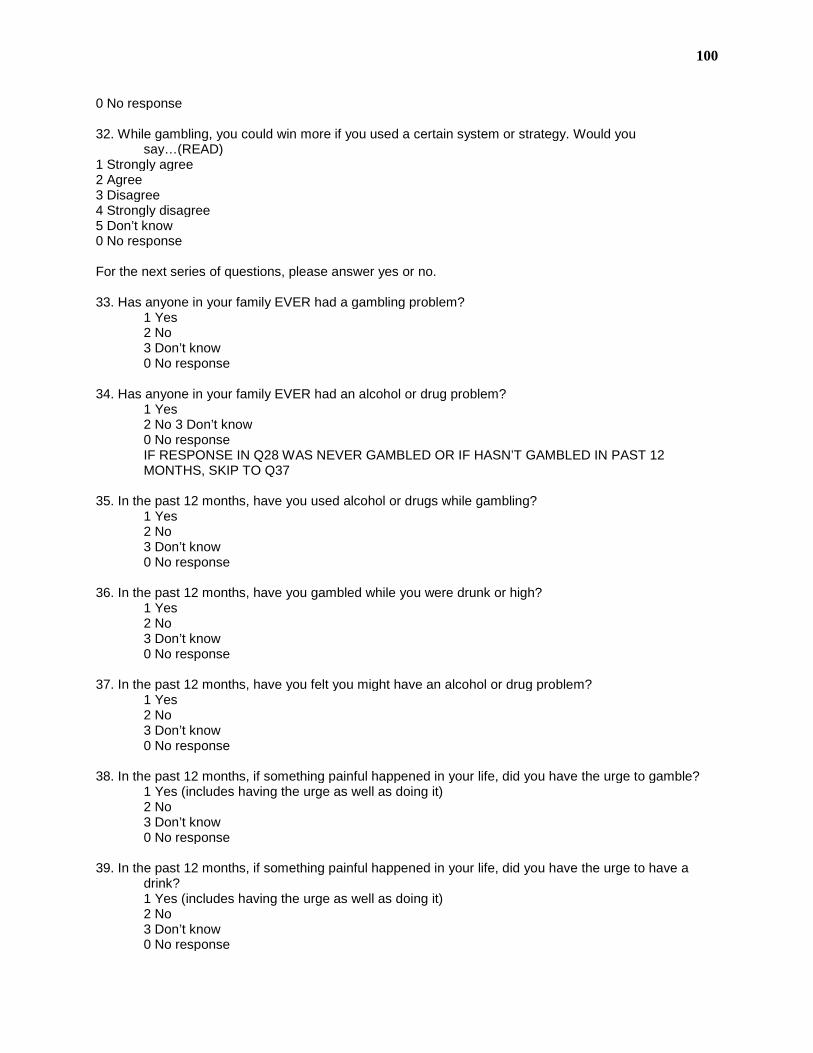
100
0 No response
32. While gambling, you could win more if you used a certain system or strategy. Would yousay…(READ)
1 Strongly agree2 Agree3 Disagree4 Strongly disagree5 Don’t know0 No response
For the next series of questions, please answer yes or no.
33. Has anyone in your family EVER had a gambling problem?1 Yes2 No3 Don’t know0 No response
34. Has anyone in your family EVER had an alcohol or drug problem?1 Yes2 No 3 Don’t know0 No responseIF RESPONSE IN Q28 WAS NEVER GAMBLED OR IF HASN’T GAMBLED IN PAST 12MONTHS, SKIP TO Q37
35. In the past 12 months, have you used alcohol or drugs while gambling?1 Yes2 No3 Don’t know0 No response
36. In the past 12 months, have you gambled while you were drunk or high?1 Yes2 No3 Don’t know0 No response
37. In the past 12 months, have you felt you might have an alcohol or drug problem?1 Yes2 No3 Don’t know0 No response
38. In the past 12 months, if something painful happened in your life, did you have the urge to gamble?1 Yes (includes having the urge as well as doing it)2 No3 Don’t know0 No response
39. In the past 12 months, if something painful happened in your life, did you have the urge to have adrink?1 Yes (includes having the urge as well as doing it)2 No3 Don’t know0 No response
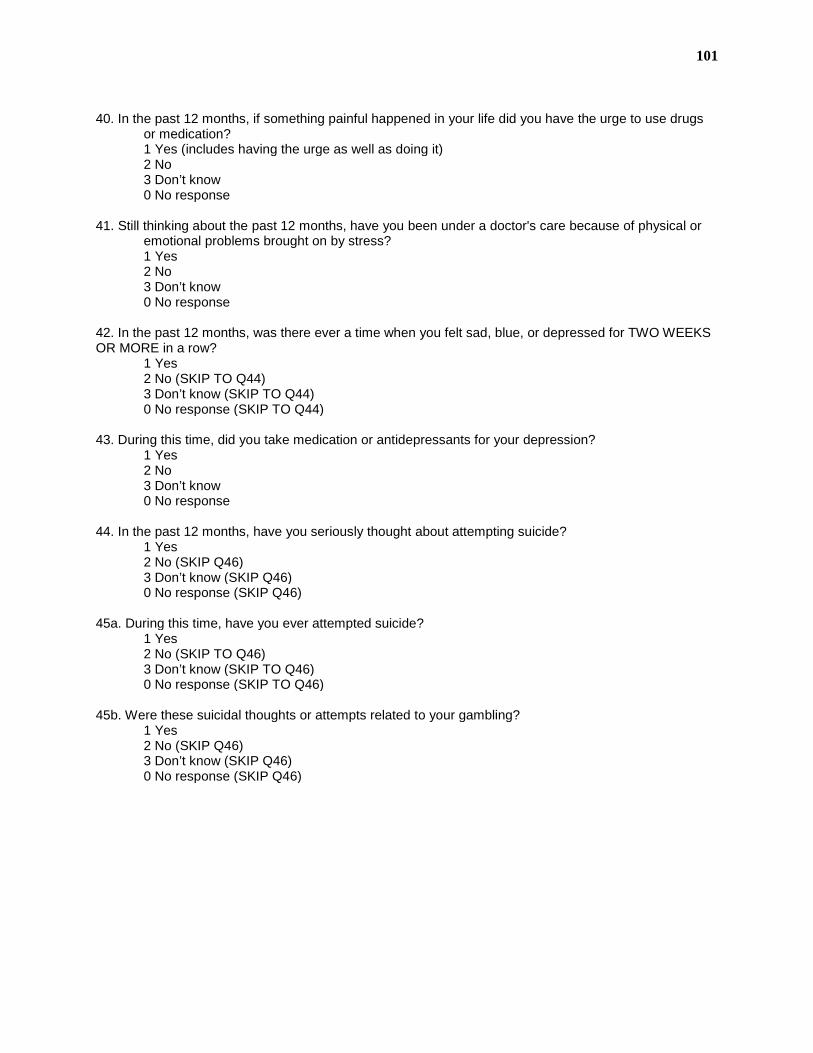
101
40. In the past 12 months, if something painful happened in your life did you have the urge to use drugsor medication?1 Yes (includes having the urge as well as doing it)2 No3 Don’t know0 No response
41. Still thinking about the past 12 months, have you been under a doctor's care because of physical oremotional problems brought on by stress?1 Yes2 No3 Don’t know0 No response
42. In the past 12 months, was there ever a time when you felt sad, blue, or depressed for TWO WEEKSOR MORE in a row?
1 Yes2 No (SKIP TO Q44)3 Don’t know (SKIP TO Q44)0 No response (SKIP TO Q44)
43. During this time, did you take medication or antidepressants for your depression?1 Yes2 No3 Don’t know0 No response
44. In the past 12 months, have you seriously thought about attempting suicide?1 Yes2 No (SKIP Q46)3 Don’t know (SKIP Q46)0 No response (SKIP Q46)
45a. During this time, have you ever attempted suicide?1 Yes2 No (SKIP TO Q46)3 Don’t know (SKIP TO Q46)0 No response (SKIP TO Q46)
45b. Were these suicidal thoughts or attempts related to your gambling?1 Yes2 No (SKIP Q46)3 Don’t know (SKIP Q46)0 No response (SKIP Q46)
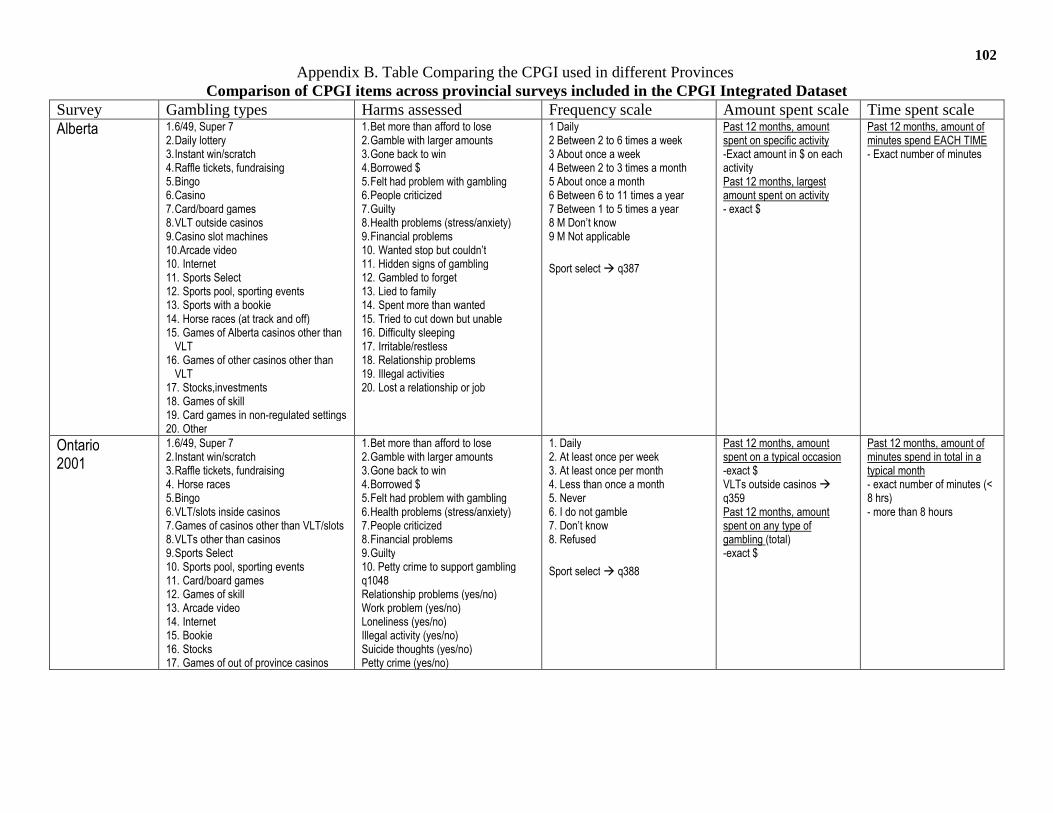
102Appendix B. Table Comparing the CPGI used in different Provinces
Comparison of CPGI items across provincial surveys included in the CPGI Integrated DatasetSurvey Gambling types Harms assessed Frequency scale Amount spent scale Time spent scaleAlberta 1.6/49, Super 7
2.Daily lottery3.Instant win/scratch4.Raffle tickets, fundraising5.Bingo6.Casino7.Card/board games8.VLT outside casinos9.Casino slot machines10.Arcade video10. Internet11. Sports Select12. Sports pool, sporting events13. Sports with a bookie14. Horse races (at track and off)15. Games of Alberta casinos other than
VLT16. Games of other casinos other than
VLT17. Stocks,investments18. Games of skill19. Card games in non-regulated settings20. Other
1.Bet more than afford to lose2.Gamble with larger amounts3.Gone back to win4.Borrowed $5.Felt had problem with gambling6.People criticized7.Guilty8.Health problems (stress/anxiety)9.Financial problems10. Wanted stop but couldn’t11. Hidden signs of gambling12. Gambled to forget13. Lied to family14. Spent more than wanted15. Tried to cut down but unable16. Difficulty sleeping17. Irritable/restless18. Relationship problems19. Illegal activities20. Lost a relationship or job
1 Daily2 Between 2 to 6 times a week3 About once a week4 Between 2 to 3 times a month5 About once a month6 Between 6 to 11 times a year7 Between 1 to 5 times a year8 M Don’t know9 M Not applicable
Sport select q387
Past 12 months, amountspent on specific activity-Exact amount in $ on eachactivityPast 12 months, largestamount spent on activity- exact $
Past 12 months, amount ofminutes spend EACH TIME- Exact number of minutes
Ontario2001
1.6/49, Super 72.Instant win/scratch3.Raffle tickets, fundraising4. Horse races5.Bingo6.VLT/slots inside casinos7.Games of casinos other than VLT/slots8.VLTs other than casinos9.Sports Select10. Sports pool, sporting events11. Card/board games12. Games of skill13. Arcade video14. Internet15. Bookie16. Stocks17. Games of out of province casinos
1.Bet more than afford to lose2.Gamble with larger amounts3.Gone back to win4.Borrowed $5.Felt had problem with gambling6.Health problems (stress/anxiety)7.People criticized8.Financial problems9.Guilty10. Petty crime to support gamblingq1048Relationship problems (yes/no)Work problem (yes/no)Loneliness (yes/no)Illegal activity (yes/no)Suicide thoughts (yes/no)Petty crime (yes/no)
1. Daily2. At least once per week3. At least once per month4. Less than once a month5. Never6. I do not gamble7. Don’t know8. Refused
Sport select q388
Past 12 months, amountspent on a typical occasion-exact $VLTs outside casinosq359Past 12 months, amountspent on any type ofgambling (total)-exact $
Past 12 months, amount ofminutes spend in total in atypical month- exact number of minutes (<8 hrs)- more than 8 hours
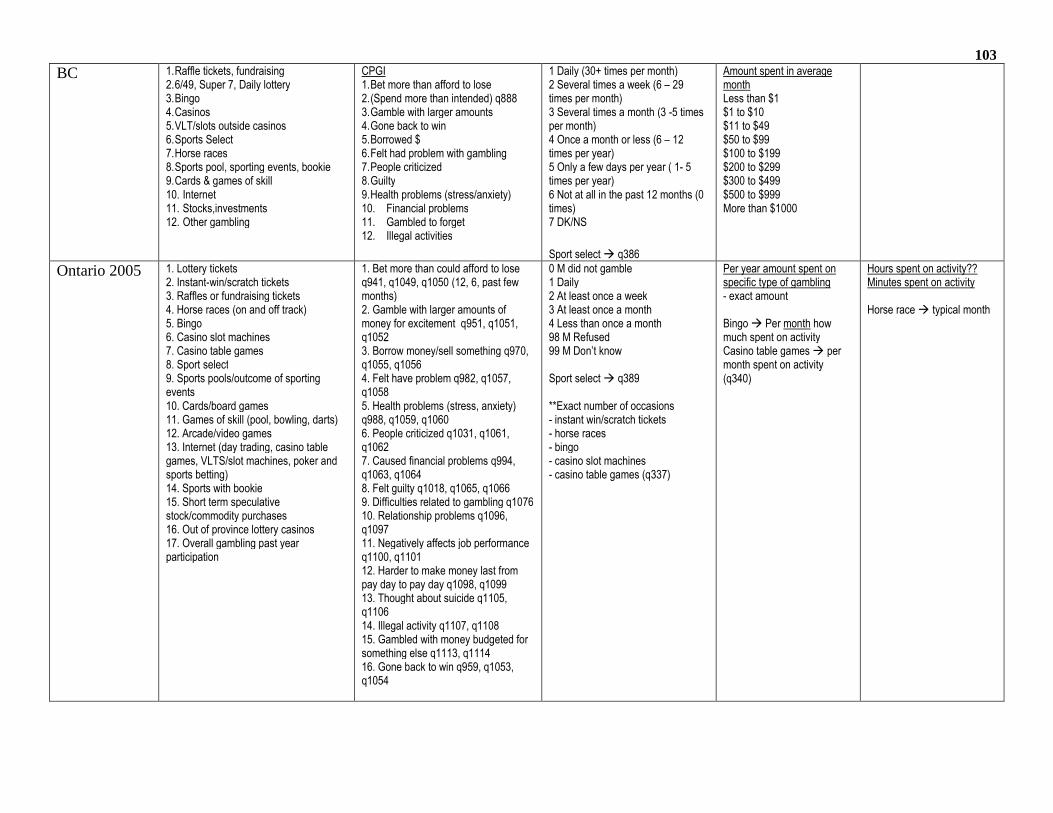
103
BC 1.Raffle tickets, fundraising2.6/49, Super 7, Daily lottery3.Bingo4.Casinos5.VLT/slots outside casinos6.Sports Select7.Horse races8.Sports pool, sporting events, bookie9.Cards & games of skill10. Internet11. Stocks,investments12. Other gambling
CPGI1.Bet more than afford to lose2.(Spend more than intended) q8883.Gamble with larger amounts4.Gone back to win5.Borrowed $6.Felt had problem with gambling7.People criticized8.Guilty9.Health problems (stress/anxiety)10. Financial problems11. Gambled to forget12. Illegal activities
1 Daily (30+ times per month)2 Several times a week (6 – 29times per month)3 Several times a month (3 -5 timesper month)4 Once a month or less (6 – 12times per year)5 Only a few days per year ( 1- 5times per year)6 Not at all in the past 12 months (0times)7 DK/NS
Sport select q386
Amount spent in averagemonthLess than $1$1 to $10$11 to $49$50 to $99$100 to $199$200 to $299$300 to $499$500 to $999More than $1000
Ontario 2005 1. Lottery tickets2. Instant-win/scratch tickets3. Raffles or fundraising tickets4. Horse races (on and off track)5. Bingo6. Casino slot machines7. Casino table games8. Sport select9. Sports pools/outcome of sportingevents10. Cards/board games11. Games of skill (pool, bowling, darts)12. Arcade/video games13. Internet (day trading, casino tablegames, VLTS/slot machines, poker andsports betting)14. Sports with bookie15. Short term speculativestock/commodity purchases16. Out of province lottery casinos17. Overall gambling past yearparticipation
1. Bet more than could afford to loseq941, q1049, q1050 (12, 6, past fewmonths)2. Gamble with larger amounts ofmoney for excitement q951, q1051,q10523. Borrow money/sell something q970,q1055, q10564. Felt have problem q982, q1057,q10585. Health problems (stress, anxiety)q988, q1059, q10606. People criticized q1031, q1061,q10627. Caused financial problems q994,q1063, q10648. Felt guilty q1018, q1065, q10669. Difficulties related to gambling q107610. Relationship problems q1096,q109711. Negatively affects job performanceq1100, q110112. Harder to make money last frompay day to pay day q1098, q109913. Thought about suicide q1105,q110614. Illegal activity q1107, q110815. Gambled with money budgeted forsomething else q1113, q111416. Gone back to win q959, q1053,q1054
0 M did not gamble1 Daily2 At least once a week3 At least once a month4 Less than once a month98 M Refused99 M Don’t know
Sport select q389
**Exact number of occasions- instant win/scratch tickets- horse races- bingo- casino slot machines- casino table games (q337)
Per year amount spent onspecific type of gambling- exact amount
Bingo Per month howmuch spent on activityCasino table games permonth spent on activity(q340)
Hours spent on activity??Minutes spent on activity
Horse race typical month
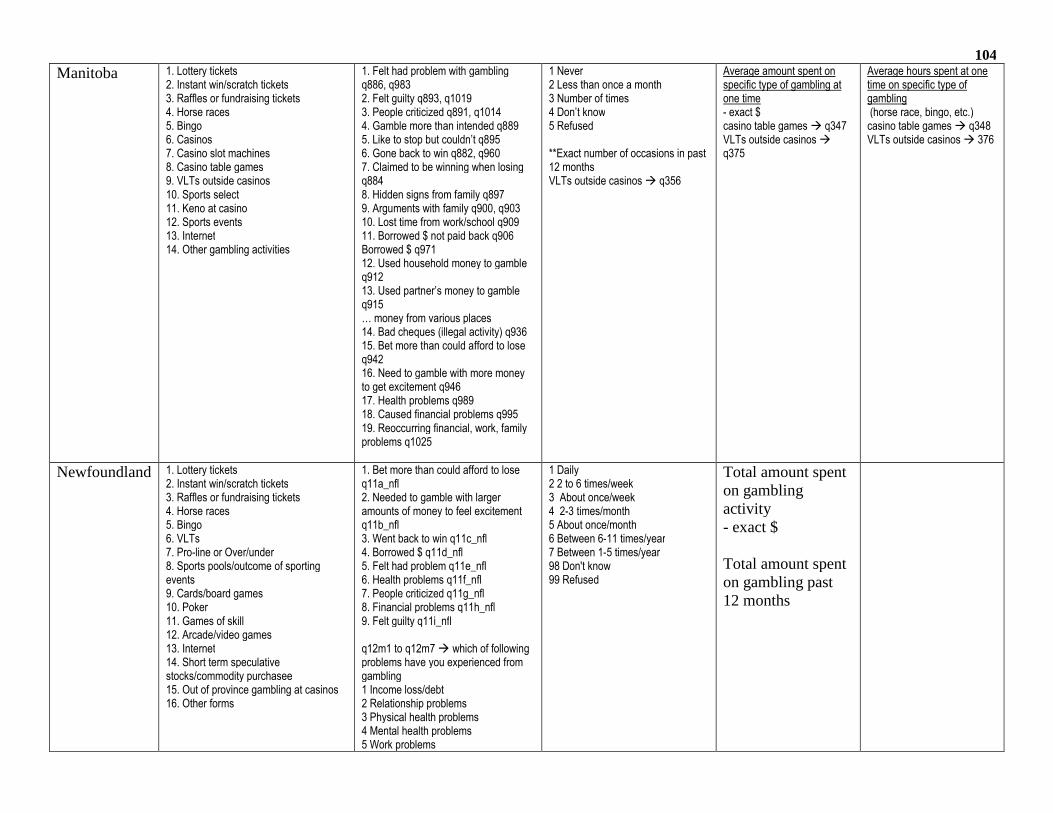
104
Manitoba 1. Lottery tickets2. Instant win/scratch tickets3. Raffles or fundraising tickets4. Horse races5. Bingo6. Casinos7. Casino slot machines8. Casino table games9. VLTs outside casinos10. Sports select11. Keno at casino12. Sports events13. Internet14. Other gambling activities
1. Felt had problem with gamblingq886, q9832. Felt guilty q893, q10193. People criticized q891, q10144. Gamble more than intended q8895. Like to stop but couldn’t q8956. Gone back to win q882, q9607. Claimed to be winning when losingq8848. Hidden signs from family q8979. Arguments with family q900, q90310. Lost time from work/school q90911. Borrowed $ not paid back q906Borrowed $ q97112. Used household money to gambleq91213. Used partner’s money to gambleq915… money from various places14. Bad cheques (illegal activity) q93615. Bet more than could afford to loseq94216. Need to gamble with more moneyto get excitement q94617. Health problems q98918. Caused financial problems q99519. Reoccurring financial, work, familyproblems q1025
1 Never2 Less than once a month3 Number of times4 Don’t know5 Refused
**Exact number of occasions in past12 monthsVLTs outside casinos q356
Average amount spent onspecific type of gambling atone time- exact $casino table games q347VLTs outside casinosq375
Average hours spent at onetime on specific type ofgambling(horse race, bingo, etc.)casino table games q348VLTs outside casinos 376
Newfoundland 1. Lottery tickets2. Instant win/scratch tickets3. Raffles or fundraising tickets4. Horse races5. Bingo6. VLTs7. Pro-line or Over/under8. Sports pools/outcome of sportingevents9. Cards/board games10. Poker11. Games of skill12. Arcade/video games13. Internet14. Short term speculativestocks/commodity purchasee15. Out of province gambling at casinos16. Other forms
1. Bet more than could afford to loseq11a_nfl2. Needed to gamble with largeramounts of money to feel excitementq11b_nfl3. Went back to win q11c_nfl4. Borrowed $ q11d_nfl5. Felt had problem q11e_nfl6. Health problems q11f_nfl7. People criticized q11g_nfl8. Financial problems q11h_nfl9. Felt guilty q11i_nfl
q12m1 to q12m7 which of followingproblems have you experienced fromgambling1 Income loss/debt2 Relationship problems3 Physical health problems4 Mental health problems5 Work problems
1 Daily2 2 to 6 times/week3 About once/week4 2-3 times/month5 About once/month6 Between 6-11 times/year7 Between 1-5 times/year98 Don't know99 Refused
Total amount spenton gamblingactivity- exact $
Total amount spenton gambling past12 months
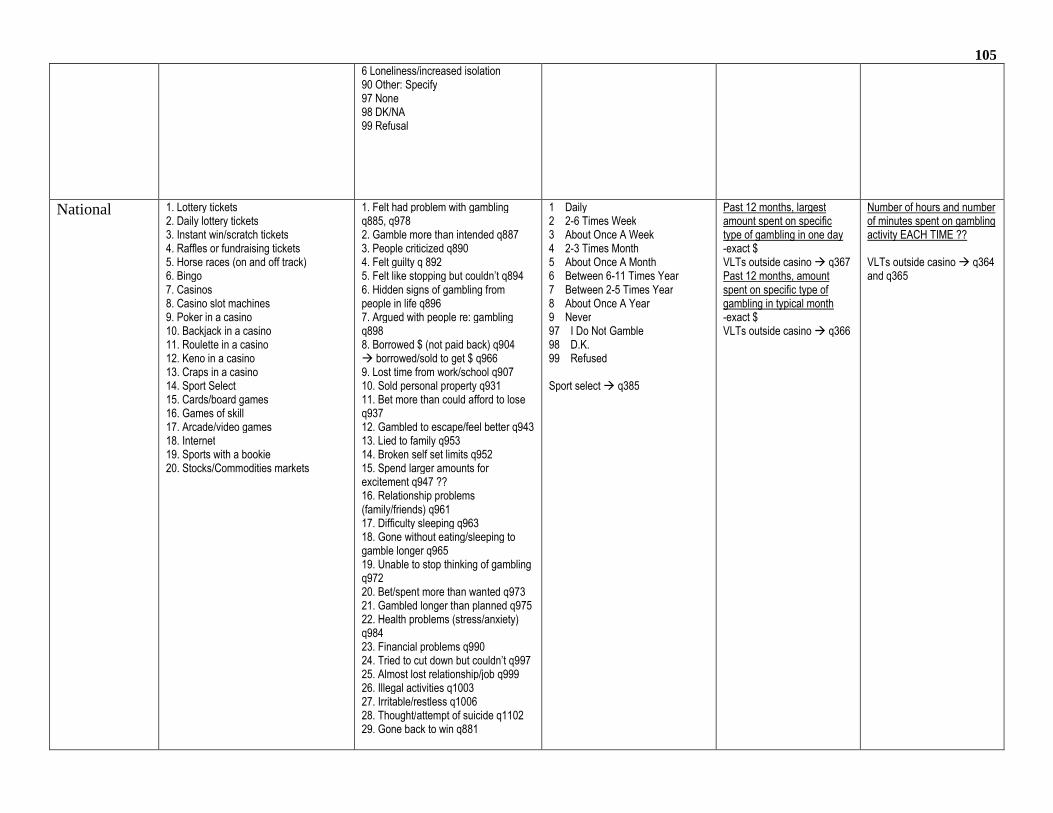
1056 Loneliness/increased isolation90 Other: Specify97 None98 DK/NA99 Refusal
National 1. Lottery tickets2. Daily lottery tickets3. Instant win/scratch tickets4. Raffles or fundraising tickets5. Horse races (on and off track)6. Bingo7. Casinos8. Casino slot machines9. Poker in a casino10. Backjack in a casino11. Roulette in a casino12. Keno in a casino13. Craps in a casino14. Sport Select15. Cards/board games16. Games of skill17. Arcade/video games18. Internet19. Sports with a bookie20. Stocks/Commodities markets
1. Felt had problem with gamblingq885, q9782. Gamble more than intended q8873. People criticized q8904. Felt guilty q 8925. Felt like stopping but couldn’t q8946. Hidden signs of gambling frompeople in life q8967. Argued with people re: gamblingq8988. Borrowed $ (not paid back) q904 borrowed/sold to get $ q9669. Lost time from work/school q90710. Sold personal property q93111. Bet more than could afford to loseq93712. Gambled to escape/feel better q94313. Lied to family q95314. Broken self set limits q95215. Spend larger amounts forexcitement q947 ??16. Relationship problems(family/friends) q96117. Difficulty sleeping q96318. Gone without eating/sleeping togamble longer q96519. Unable to stop thinking of gamblingq97220. Bet/spent more than wanted q97321. Gambled longer than planned q97522. Health problems (stress/anxiety)q98423. Financial problems q99024. Tried to cut down but couldn’t q99725. Almost lost relationship/job q99926. Illegal activities q100327. Irritable/restless q100628. Thought/attempt of suicide q110229. Gone back to win q881
1 Daily2 2-6 Times Week3 About Once A Week4 2-3 Times Month5 About Once A Month6 Between 6-11 Times Year7 Between 2-5 Times Year8 About Once A Year9 Never97 I Do Not Gamble98 D.K.99 Refused
Sport select q385
Past 12 months, largestamount spent on specifictype of gambling in one day-exact $VLTs outside casino q367Past 12 months, amountspent on specific type ofgambling in typical month-exact $VLTs outside casino q366
Number of hours and numberof minutes spent on gamblingactivity EACH TIME ??
VLTs outside casino q364and q365
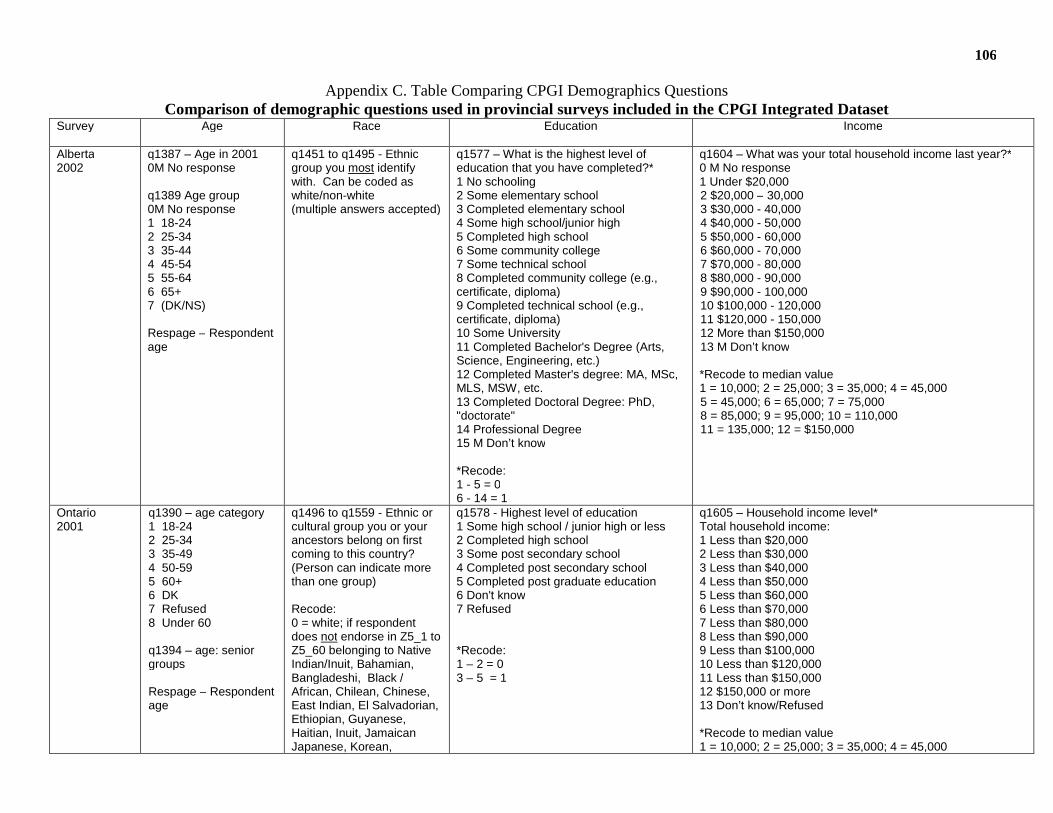
106
Appendix C. Table Comparing CPGI Demographics QuestionsComparison of demographic questions used in provincial surveys included in the CPGI Integrated Dataset
Survey Age Race Education Income
Alberta2002
q1387 – Age in 20010M No response
q1389 Age group0M No response1 18-242 25-343 35-444 45-545 55-646 65+7 (DK/NS)
Respage – Respondentage
q1451 to q1495 - Ethnicgroup you most identifywith. Can be coded aswhite/non-white(multiple answers accepted)
q1577 – What is the highest level ofeducation that you have completed?*1 No schooling2 Some elementary school3 Completed elementary school4 Some high school/junior high5 Completed high school6 Some community college7 Some technical school8 Completed community college (e.g.,certificate, diploma)9 Completed technical school (e.g.,certificate, diploma)10 Some University11 Completed Bachelor's Degree (Arts,Science, Engineering, etc.)12 Completed Master's degree: MA, MSc,MLS, MSW, etc.13 Completed Doctoral Degree: PhD,"doctorate"14 Professional Degree15 M Don’t know
*Recode:1 - 5 = 06 - 14 = 1
q1604 – What was your total household income last year?*0 M No response1 Under $20,0002 $20,000 – 30,0003 $30,000 - 40,0004 $40,000 - 50,0005 $50,000 - 60,0006 $60,000 - 70,0007 $70,000 - 80,0008 $80,000 - 90,0009 $90,000 - 100,00010 $100,000 - 120,00011 $120,000 - 150,00012 More than $150,00013 M Don’t know
*Recode to median value1 = 10,000; 2 = 25,000; 3 = 35,000; 4 = 45,0005 = 45,000; 6 = 65,000; 7 = 75,0008 = 85,000; 9 = 95,000; 10 = 110,00011 = 135,000; 12 = $150,000
Ontario2001
q1390 – age category1 18-242 25-343 35-494 50-595 60+6 DK7 Refused8 Under 60
q1394 – age: seniorgroups
Respage – Respondentage
q1496 to q1559 - Ethnic orcultural group you or yourancestors belong on firstcoming to this country?(Person can indicate morethan one group)
Recode:0 = white; if respondentdoes not endorse in Z5_1 toZ5_60 belonging to NativeIndian/Inuit, Bahamian,Bangladeshi, Black /African, Chilean, Chinese,East Indian, El Salvadorian,Ethiopian, Guyanese,Haitian, Inuit, JamaicanJapanese, Korean,
q1578 - Highest level of education1 Some high school / junior high or less2 Completed high school3 Some post secondary school4 Completed post secondary school5 Completed post graduate education6 Don't know7 Refused
*Recode:1 – 2 = 03 – 5 = 1
q1605 – Household income level*Total household income:1 Less than $20,0002 Less than $30,0003 Less than $40,0004 Less than $50,0005 Less than $60,0006 Less than $70,0007 Less than $80,0008 Less than $90,0009 Less than $100,00010 Less than $120,00011 Less than $150,00012 $150,000 or more13 Don’t know/Refused
*Recode to median value1 = 10,000; 2 = 25,000; 3 = 35,000; 4 = 45,000
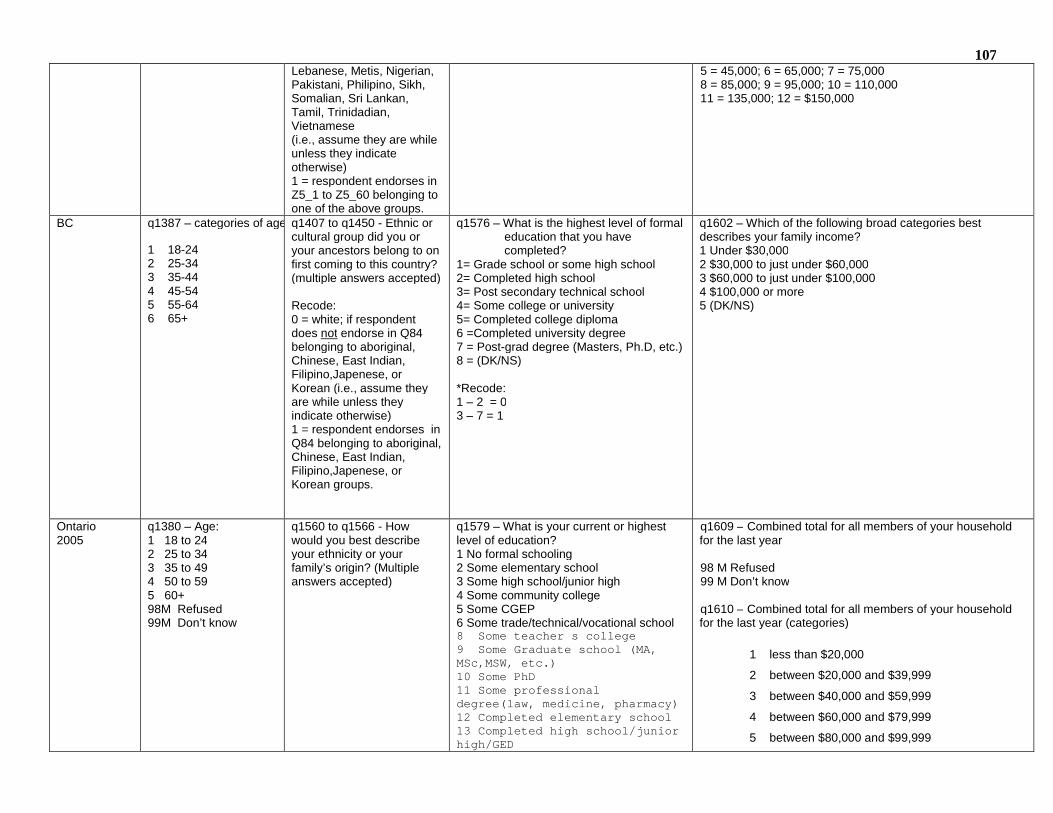
107Lebanese, Metis, Nigerian,Pakistani, Philipino, Sikh,Somalian, Sri Lankan,Tamil, Trinidadian,Vietnamese(i.e., assume they are whileunless they indicateotherwise)1 = respondent endorses inZ5_1 to Z5_60 belonging toone of the above groups.
5 = 45,000; 6 = 65,000; 7 = 75,0008 = 85,000; 9 = 95,000; 10 = 110,00011 = 135,000; 12 = $150,000
BC q1387 – categories of age:
1 18-242 25-343 35-444 45-545 55-646 65+
q1407 to q1450 - Ethnic orcultural group did you oryour ancestors belong to onfirst coming to this country?(multiple answers accepted)
Recode:0 = white; if respondentdoes not endorse in Q84belonging to aboriginal,Chinese, East Indian,Filipino,Japenese, orKorean (i.e., assume theyare while unless theyindicate otherwise)1 = respondent endorses inQ84 belonging to aboriginal,Chinese, East Indian,Filipino,Japenese, orKorean groups.
q1576 – What is the highest level of formaleducation that you havecompleted?
1= Grade school or some high school2= Completed high school3= Post secondary technical school4= Some college or university5= Completed college diploma6 =Completed university degree7 = Post-grad degree (Masters, Ph.D, etc.)8 = (DK/NS)
*Recode:1 – 2 = 03 – 7 = 1
q1602 – Which of the following broad categories bestdescribes your family income?1 Under $30,0002 $30,000 to just under $60,0003 $60,000 to just under $100,0004 $100,000 or more5 (DK/NS)
Ontario2005
q1380 – Age:1 18 to 242 25 to 343 35 to 494 50 to 595 60+98M Refused99M Don’t know
q1560 to q1566 - Howwould you best describeyour ethnicity or yourfamily’s origin? (Multipleanswers accepted)
q1579 – What is your current or highestlevel of education?1 No formal schooling2 Some elementary school3 Some high school/junior high4 Some community college5 Some CGEP6 Some trade/technical/vocational school8 Some teacher s college9 Some Graduate school (MA,MSc,MSW, etc.)10 Some PhD11 Some professionaldegree(law, medicine, pharmacy)12 Completed elementary school13 Completed high school/juniorhigh/GED
q1609 – Combined total for all members of your householdfor the last year
98 M Refused99 M Don’t know
q1610 – Combined total for all members of your householdfor the last year (categories)
1 less than $20,000
2 between $20,000 and $39,999
3 between $40,000 and $59,999
4 between $60,000 and $79,999
5 between $80,000 and $99,999
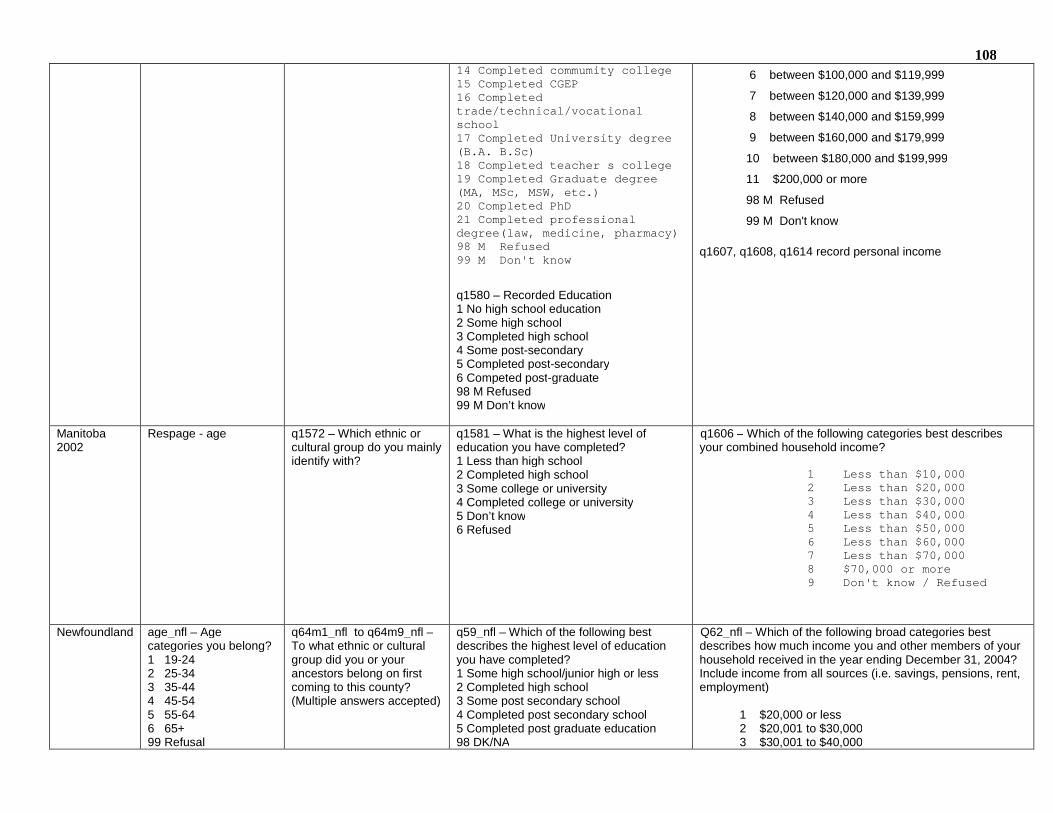
10814 Completed commumity college15 Completed CGEP16 Completedtrade/technical/vocationalschool17 Completed University degree(B.A. B.Sc)18 Completed teacher s college19 Completed Graduate degree(MA, MSc, MSW, etc.)20 Completed PhD21 Completed professionaldegree(law, medicine, pharmacy)98 M Refused99 M Don't know
q1580 – Recorded Education1 No high school education2 Some high school3 Completed high school4 Some post-secondary5 Completed post-secondary6 Competed post-graduate98 M Refused99 M Don’t know
6 between $100,000 and $119,999
7 between $120,000 and $139,999
8 between $140,000 and $159,999
9 between $160,000 and $179,999
10 between $180,000 and $199,999
11 $200,000 or more
98 M Refused
99 M Don't know
q1607, q1608, q1614 record personal income
Manitoba2002
Respage - age q1572 – Which ethnic orcultural group do you mainlyidentify with?
q1581 – What is the highest level ofeducation you have completed?1 Less than high school2 Completed high school3 Some college or university4 Completed college or university5 Don’t know6 Refused
q1606 – Which of the following categories best describesyour combined household income?
1 Less than $10,0002 Less than $20,0003 Less than $30,0004 Less than $40,0005 Less than $50,0006 Less than $60,0007 Less than $70,0008 $70,000 or more9 Don't know / Refused
Newfoundland age_nfl – Agecategories you belong?1 19-242 25-343 35-444 45-545 55-646 65+99 Refusal
q64m1_nfl to q64m9_nfl –To what ethnic or culturalgroup did you or yourancestors belong on firstcoming to this county?(Multiple answers accepted)
q59_nfl – Which of the following bestdescribes the highest level of educationyou have completed?1 Some high school/junior high or less2 Completed high school3 Some post secondary school4 Completed post secondary school5 Completed post graduate education98 DK/NA
Q62_nfl – Which of the following broad categories bestdescribes how much income you and other members of yourhousehold received in the year ending December 31, 2004?Include income from all sources (i.e. savings, pensions, rent,employment)
1 $20,000 or less2 $20,001 to $30,0003 $30,001 to $40,000
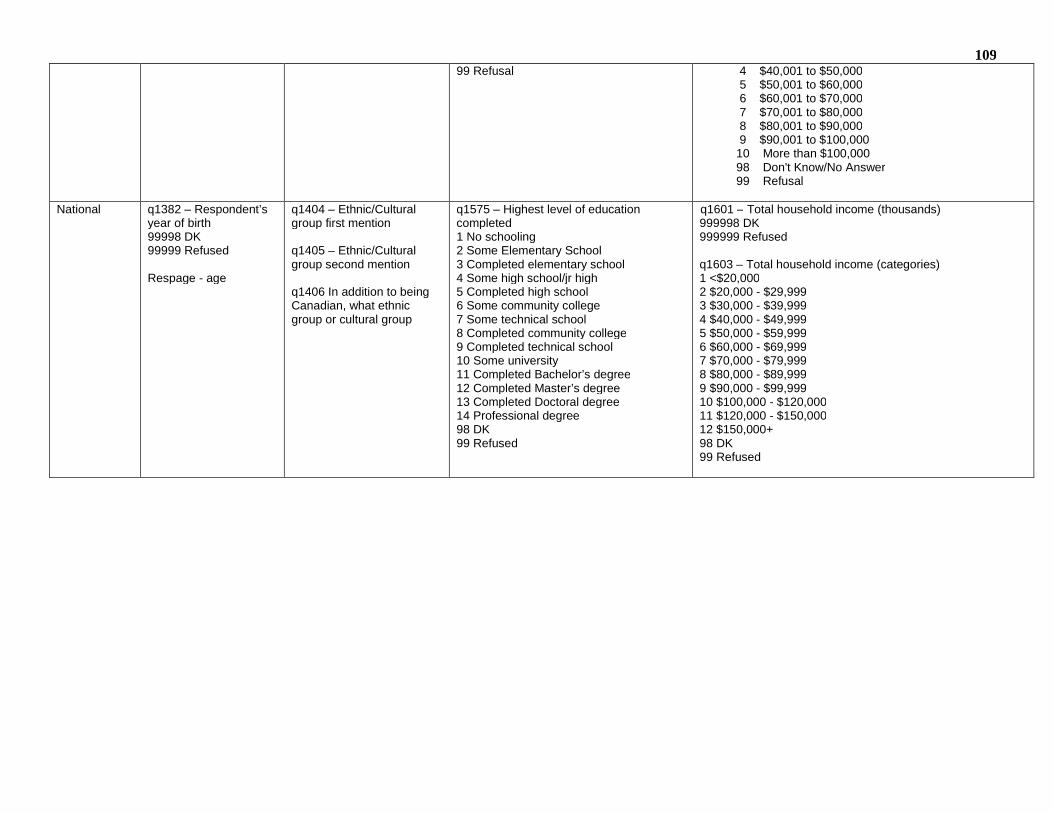
10999 Refusal 4 $40,001 to $50,000
5 $50,001 to $60,0006 $60,001 to $70,0007 $70,001 to $80,0008 $80,001 to $90,0009 $90,001 to $100,000
10 More than $100,00098 Don't Know/No Answer99 Refusal
National q1382 – Respondent’syear of birth99998 DK99999 Refused
Respage - age
q1404 – Ethnic/Culturalgroup first mention
q1405 – Ethnic/Culturalgroup second mention
q1406 In addition to beingCanadian, what ethnicgroup or cultural group
q1575 – Highest level of educationcompleted1 No schooling2 Some Elementary School3 Completed elementary school4 Some high school/jr high5 Completed high school6 Some community college7 Some technical school8 Completed community college9 Completed technical school10 Some university11 Completed Bachelor’s degree12 Completed Master’s degree13 Completed Doctoral degree14 Professional degree98 DK99 Refused
q1601 – Total household income (thousands)999998 DK999999 Refused
q1603 – Total household income (categories)1 <$20,0002 $20,000 - $29,9993 $30,000 - $39,9994 $40,000 - $49,9995 $50,000 - $59,9996 $60,000 - $69,9997 $70,000 - $79,9998 $80,000 - $89,9999 $90,000 - $99,99910 $100,000 - $120,00011 $120,000 - $150,00012 $150,000+98 DK99 Refused
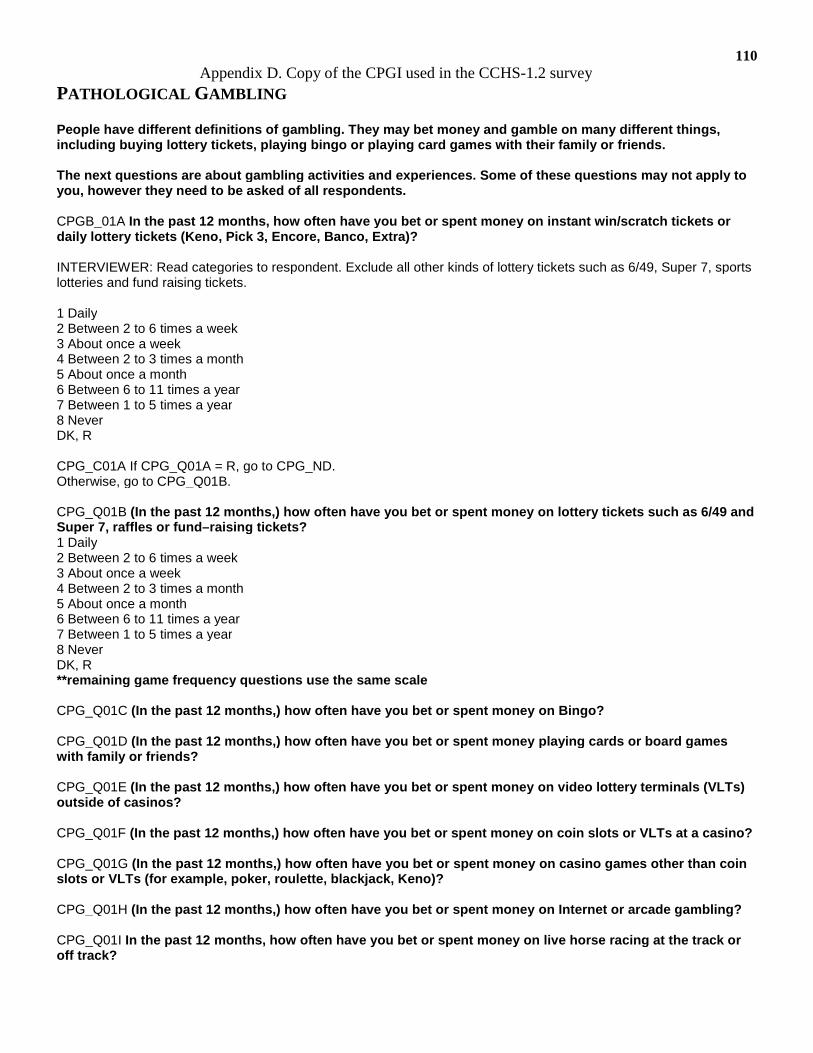
110Appendix D. Copy of the CPGI used in the CCHS-1.2 survey
PATHOLOGICAL GAMBLING
People have different definitions of gambling. They may bet money and gamble on many different things,including buying lottery tickets, playing bingo or playing card games with their family or friends.
The next questions are about gambling activities and experiences. Some of these questions may not apply toyou, however they need to be asked of all respondents.
CPGB_01A In the past 12 months, how often have you bet or spent money on instant win/scratch tickets ordaily lottery tickets (Keno, Pick 3, Encore, Banco, Extra)?
INTERVIEWER: Read categories to respondent. Exclude all other kinds of lottery tickets such as 6/49, Super 7, sportslotteries and fund raising tickets.
1 Daily2 Between 2 to 6 times a week3 About once a week4 Between 2 to 3 times a month5 About once a month6 Between 6 to 11 times a year7 Between 1 to 5 times a year8 NeverDK, R
CPG_C01A If CPG_Q01A = R, go to CPG_ND.Otherwise, go to CPG_Q01B.
CPG_Q01B (In the past 12 months,) how often have you bet or spent money on lottery tickets such as 6/49 andSuper 7, raffles or fund–raising tickets?1 Daily2 Between 2 to 6 times a week3 About once a week4 Between 2 to 3 times a month5 About once a month6 Between 6 to 11 times a year7 Between 1 to 5 times a year8 NeverDK, R**remaining game frequency questions use the same scale
CPG_Q01C (In the past 12 months,) how often have you bet or spent money on Bingo?
CPG_Q01D (In the past 12 months,) how often have you bet or spent money playing cards or board gameswith family or friends?
CPG_Q01E (In the past 12 months,) how often have you bet or spent money on video lottery terminals (VLTs)outside of casinos?
CPG_Q01F (In the past 12 months,) how often have you bet or spent money on coin slots or VLTs at a casino?
CPG_Q01G (In the past 12 months,) how often have you bet or spent money on casino games other than coinslots or VLTs (for example, poker, roulette, blackjack, Keno)?
CPG_Q01H (In the past 12 months,) how often have you bet or spent money on Internet or arcade gambling?
CPG_Q01I In the past 12 months, how often have you bet or spent money on live horse racing at the track oroff track?
111CPG_Q01J (In the past 12 months,) how often have you bet or spent money on sports such as sportslotteries (Sport Select, Pro-Line, Mise-au-jeu, Total), sportspool or sporting events?
CPG_Q01K (In the past 12 months,) how often have you bet or spent money on speculative investments suchas stocks, options or commodities? INTERVIEWER: Speculative investments refers to buying high-risk stocks, butdoes not include low-risk bonds, RRSPs and/or mutual funds.
CPG_Q01L In the past 12 months, how often have you bet or spent money on games of skill such as pool, golf,bowling or darts?
CPG_Q01M (In the past 12 months,) how often have you bet or spent money on any other forms of gamblingsuch as dog races, gambling at casino nights/country fairs, bet on sports with a bookie or gambling pools atwork?
CPG_Q01N In the past 12 months, how much money, not including winnings, did you spend on all of yourgambling activities? INTERVIEWER: Read categories to respondent.1 Between 1 dollar and 50 dollars2 Between 51 dollars and 100 dollars3 Between 101 dollars and 250 dollars4 Between 251 dollars and 500 dollars5 Between 501 dollars and 1000 dollars6 More than 1000 dollarsDK, R
The next questions are about gambling attitudes and experiences. Again, all the questions will refer to the past12 months.
INTERVIEWER: Press <Enter> to continue.
CPG_Q02 In the past 12 months, how often have you bet or spent more money than you wanted to ongambling? INTERVIEWER: Read categories to respondent.1 Never2 Sometimes3 Most of the time4 Almost always5 I am not a gambler (Go to CPG_ND)DKR (Go to CPG_ND)**remaining problem questions use the same scale
CPG_Q03 (In the past 12 months), how often have you needed to gamble with larger amounts of money to getthe same feeling of excitement?
CPG_Q04 (In the past 12 months), when you gambled, how often did you go back another day to try to winback the money you lost?
CPG_Q05 In the past 12 months, how often have you borrowed money or sold anything to get money togamble?
CPG_Q06 (In the past 12 months,) how often have you felt that you might have a problem with gambling?
CPG_Q07 (In the past 12 months,) how often has gambling caused you any health problems, including stressor anxiety?
CPG_Q08 (In the past 12 months,) how often have people criticized your betting or told you that you had agambling problem, regardless of whether or not youthought it was true?
112CPG_Q09 (In the past 12 months,) how often has your gambling caused financial problems for you or yourfamily?
CPG_Q10 In the past 12 months, how often have you felt guilty about the way you gamble or what happenswhen you gamble?
CPG_Q11 (In the past 12 months,) how often have you lied to family members or others to hide yourgambling?
CPG_Q12 (In the past 12 months,) how often have you wanted to stop betting money or gambling, but didn’tthink you could?
CPG_Q13 In the past 12 months, how often have you bet more than you could really afford to lose?
CPG_Q14 (In the past 12 months), have you tried to quit or cut down on your gambling but were unable to doit?
CPG_Q15 (In the past 12 months,) have you gambled as a way of forgetting problems or to feel better whenyou were depressed?
CPG_Q16 (In the past 12 months,) has your gambling caused any problems with your relationship with any ofyour family members or friends?
113Appendix E. CCHS-1.2 Questions on Mental Disorders
CCHS-1.2 Questions on:
Self-Perceived Health
Variable Name GENB_01Question Name GEN_Q01Concept Self-perceived healthQuestion In general, would you say your health is: (excellent, very good, good, fair or poor)?Length 1Universe All respondentsNotePosition 17
Self-Perceived Stress
Variable Name GENB_07Question Name GEN_Q07Concept Self-perceived stressQuestion Thinking about the amount of stress in your life, would you say that most days are: (not at all stressful, notvery stressful, a bit stressful, quite a bit stressful, extremely stressful)?Length 1Universe All respondentsNotePosition 24
Psychological Well-Being
1) Psychological Well-Being Manifestation Scale (WBMMS)2) Variable Name: PWBBDPWB
Based on: PWBB_01, PWBB_02, PWBB_03, PWBB_04, PWBB_05, PWBB_06, PWBB_07, PWBB_08, PWBB_09,PWBB_10, PWBB_11, PWBB_12, PWBB_13, PWBB_14, PWBB_15, PWBB_16, PWBB_17, PWBB_18, PWBB_19,PWBB_20, PWBB_21, PWBB_22, PWBB_23, PWBB_24, PWBB_25
Description: This scale, which assesses psychological well-being, is based on the proposed questions fromRaymond Massé. Higher scores indicate greater well-being.
Source: Raymond Massé (Laval University)"Élaboration et validation d’un outil de mesure du bien-être psychologique : L’ÉMMBEP” R. Massé, C. Poulin, C.Dassa, J. Lambert, S. Bélair, M.A. Battaglini. Revue Canadienne de Santé Publique, Vol. 89. No. 5, pp. 352-357.Respondent’s score on the psychological well-being scale. Higher values indicate higher wellbeing.
Variable Name PWBB_01Question Name PWB_Q01Concept Frequency - felt self-confident - past monthQuestion During the past month, you felt self-confident.
Variable Name PWBB_02Question Name PWB_Q02Concept Frequency - satisfied with accomplishments - past monthQuestion During the past month, you felt satisfied with what you were able to accomplish, you felt proud of yourself.
Variable Name PWBB_03Question Name PWB_Q03Concept Frequency - took on lots of projects - past monthQuestion (During the past month,) you were a "go-getter", you took on lots of projects.
Variable Name PWBB_04Question Name PWB_Q04Concept Frequency - felt emotionally balanced - past monthQuestion (During the past month,) you felt emotionally balanced.
Variable Name PWBB_05Question Name PWB_Q05Concept Frequency - felt loved and appreciated - past monthQuestion (During the past month,) you felt loved and appreciated.
Variable Name PWBB_06Question Name PWB_Q06Concept Frequency - had goals and ambitions - past monthQuestion (During the past month,) you had goals and ambitions.
114Variable Name PWBB_07Question Name PWB_Q07Concept Frequency - felt like having fun - past monthQuestion (During the past month,) you felt like having fun, participating in sports and all your favourite activities andhobbies.
Variable Name PWBB_08Question Name PWB_Q08Concept Frequency - felt useful - past monthQuestion During the past month, you felt useful.
Variable Name PWBB_09Question Name PWB_Q09Concept Frequency - smiled easily - past monthQuestion (During the past month,) you smiled easily.
Variable Name PWBB_10Question Name PWB_Q10Concept Frequency - was true to self - past monthQuestion (During the past month,) you were true to yourself, being natural at all times.
Variable Name PWBB_11Question Name PWB_Q11Concept Frequency - did good job listening to friends - past monthQuestion (During the past month,) you did a good job of listening to your friends.
Variable Name PWBB_12Question Name PWB_Q12Concept Frequency - was curious and interested - past monthQuestion (During the past month,) you were curious and interested in all sorts of things.
Variable Name PWBB_13Question Name PWB_Q13Concept Frequency - was able to clearly sort things out - past monthQuestion (During the past month,) you were able to clearly sort things out when faced with complicated situations.
Variable Name PWBB_14Question Name PWB_Q14Concept Frequency - found life exciting - past monthQuestion (During the past month,) you found life exciting and you wanted to enjoy every moment of it.
Variable Name PWBB_15Question Name PWB_Q15Concept Frequency - life was well-balanced - past monthQuestion (During the past month,) your life was well-balanced between your family, personal and professionalactivities.
Variable Name PWBB_16Question Name PWB_Q16Concept Frequency - was calm and level-headed - past monthQuestion During the past month, you were quite calm and level-headed.
Variable Name PWBB_17Question Name PWB_Q17Concept Frequency - easily found answers - past monthQuestion (During the past month,) you were able to easily find answers to your problems.
Variable Name PWBB_18Question Name PWB_Q18Concept Frequency - got along well with others - past monthQuestion (During the past month,) you got along well with everyone around you.
Variable Name PWBB_19Question Name PWB_Q19Concept Frequency - lived at normal pace - past monthQuestion (During the past month,) you lived at a normal pace, not doing anything excessively.
Variable Name PWBB_20Question Name PWB_Q20Concept Frequency - impression of enjoying life - past monthQuestion (During the past month,) you had the impression of really enjoying life.
Variable Name PWBB_21Question Name PWB_Q21Concept Frequency - had good sense of humour - past month
115Question (During the past month,) you had a good sense of humour, easily making your friends laugh.
Variable Name PWBB_22Question Name PWB_Q22Concept Frequency - was at peace with self - past monthQuestion (During the past month,) you felt good, at peace with yourself.
Variable Name PWBB_23Question Name PWB_Q23Concept Frequency - felt healthy/in good shape - past monthQuestion (During the past month,) you felt healthy and in good shape.
Variable Name PWBB_24Question Name PWB_Q24Concept Frequency - face situations positively - past monthQuestion (During the past month,) you were able to face difficult situations in a positive way.
Variable Name PWBB_25Question Name PWB_Q25Concept Frequency - had good morale - past monthQuestion (During the past month,) your morale was good.
Variable Name PWBBDPWBQuestion NameConcept Psychological well-being scale - past month - (D)Question
Mood DisordersThe questions on mood disorders were modified for the CCHS-1.2 from the World Mental Health version of theComposite International Diagnostic Interview (WMH-CIDI). The WMH-CIDI is a standardized method of assessment formental disorders, operationalized to the DSM-IV criteria. For the purposes of the CCHS-1.2 measured mood disorderswere major depression episodes and manic episodes. 12-month diagnoses of mood disorders were used for thepurposes of these analyses to match the time period of gambling questions asked.
Anxiety DisordersThree anxiety disorders were assessed using the WMH-CIDI questionnaire adapted for the CCHS -1.2: agoraphobia,panic disorder, and social phobia. The presence of any one of these disorders in the past 12 months classified aperson as having a 12-month diagnosis of any anxiety disorder. Again, the 12-month diagnosis was used to align withthe time-period assessed in the relevant gambling variables.
Substance DependenceAny substance dependence was diagnosed in the CCHS-1.2 version of the WMH-CIDI as dependence of alcohol orillicit drugs in the past 12 months. At least one dependency qualified a person to be placed into this category. Data wasonly collected for the previous 12 months in the CCHS-1.2, and this data was used for all relevant comparisons.
116Appendix F. Expert Opinion Survey
Dear Colleague,
We are working on a project to evaluate the psychometric properties and utility of the Canadian Problem GamblingIndex (CPGI). The CPGI has become the most widely used measurement tool in Canada for assessing risk of problemgambling. It has been used in numerous population surveys, research studies, and in some cases in clinical settings.The CPGI isalso used in other countries including Australia, Iceland, and Norway. The main quantitative scale in the CPGI is theProblem Gambling Severity Index (PSGI), which is scored by summing the item totals for nine consequences andbehavioural symptoms of problem gambling.
As one component of a larger study, we are seeking the opinions of researchers, clinicians, and policy makers on thePGSI and its scoring system. The purpose of the study is to determine if the PGSI, in its present form, provides a validand reliable index of problem gambling severity or whether improvements are needed to the scale. You do not need tobe familiar with the CPGI to complete this survey. Our main interest is your opinion on how well the consequencesand symptoms ofproblem gambling being assessed by the PGSI reflect problem gambling severity at different levels. The results shouldprovide some insight on the relative weighting of each item toward the total score.
The online survey should take you less than 10 minutes to complete. It can be found athttp://www.surveymonkey.com/s/RG9TGRZ
If you would prefer to complete the survey by hand, a paper copy is attached. It can be mailed to:
Dr. Shawn CurrieAlberta Health Services - Information Management, Evaluation & Research Unit10101 Southport Rd SWCalgary, ABT2W 3N2Canada
Unfortunately, there is no direct compensation for participating. We will have a draw for a $100 gift certificate forAmazon.com (or the local book distributor of your choice); just enter your email address at the end of the survey to beentered in this draw. We can also send all participants a summary report of the results.
This project is funded by the Canadian Centre on Substance Abuse.
Sincerely,
Shawn Currie, Ph.D.University of [email protected]
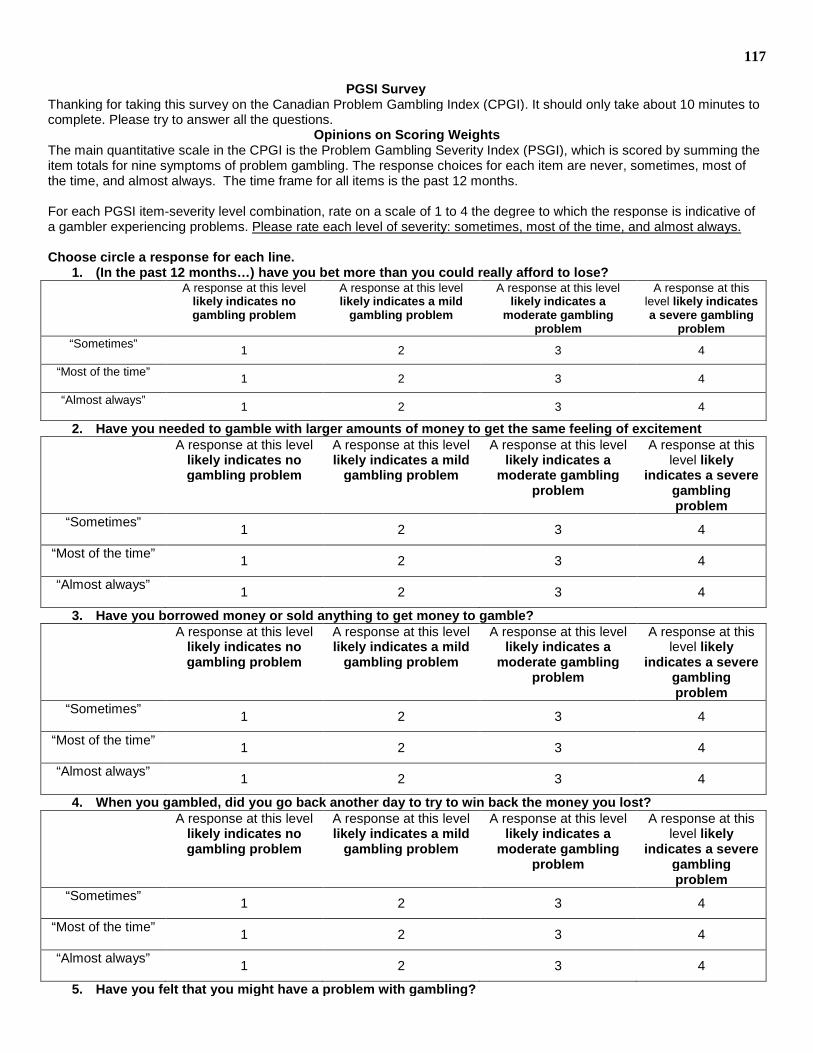
117
PGSI SurveyThanking for taking this survey on the Canadian Problem Gambling Index (CPGI). It should only take about 10 minutes tocomplete. Please try to answer all the questions.
Opinions on Scoring WeightsThe main quantitative scale in the CPGI is the Problem Gambling Severity Index (PSGI), which is scored by summing theitem totals for nine symptoms of problem gambling. The response choices for each item are never, sometimes, most ofthe time, and almost always. The time frame for all items is the past 12 months.
For each PGSI item-severity level combination, rate on a scale of 1 to 4 the degree to which the response is indicative ofa gambler experiencing problems. Please rate each level of severity: sometimes, most of the time, and almost always.
Choose circle a response for each line.1. (In the past 12 months…) have you bet more than you could really afford to lose?
A response at this levellikely indicates nogambling problem
A response at this levellikely indicates a mild
gambling problem
A response at this levellikely indicates a
moderate gamblingproblem
A response at thislevel likely indicatesa severe gambling
problem“Sometimes”
1 2 3 4
“Most of the time”1 2 3 4
“Almost always”1 2 3 4
2. Have you needed to gamble with larger amounts of money to get the same feeling of excitementA response at this level
likely indicates nogambling problem
A response at this levellikely indicates a mild
gambling problem
A response at this levellikely indicates a
moderate gamblingproblem
A response at thislevel likely
indicates a severegamblingproblem
“Sometimes”1 2 3 4
“Most of the time”1 2 3 4
“Almost always”1 2 3 4
3. Have you borrowed money or sold anything to get money to gamble?A response at this level
likely indicates nogambling problem
A response at this levellikely indicates a mild
gambling problem
A response at this levellikely indicates a
moderate gamblingproblem
A response at thislevel likely
indicates a severegamblingproblem
“Sometimes”1 2 3 4
“Most of the time”1 2 3 4
“Almost always”1 2 3 4
4. When you gambled, did you go back another day to try to win back the money you lost?A response at this level
likely indicates nogambling problem
A response at this levellikely indicates a mild
gambling problem
A response at this levellikely indicates a
moderate gamblingproblem
A response at thislevel likely
indicates a severegamblingproblem
“Sometimes”1 2 3 4
“Most of the time”1 2 3 4
“Almost always”1 2 3 4
5. Have you felt that you might have a problem with gambling?
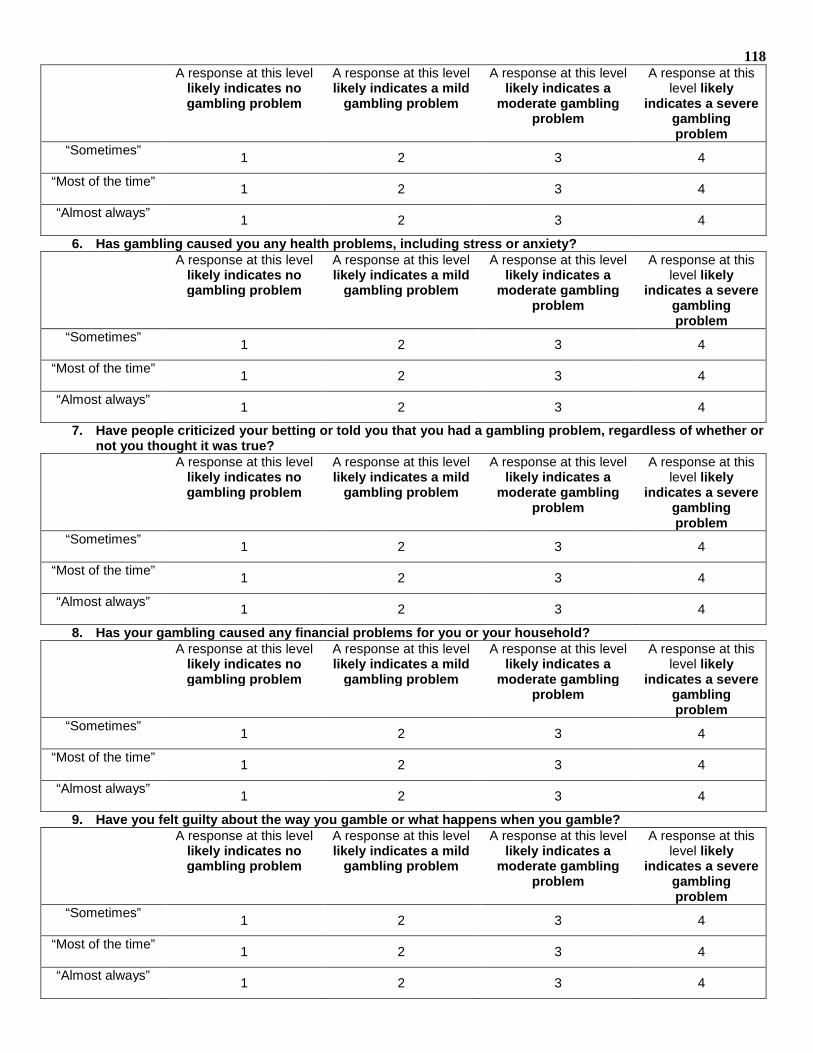
118A response at this level
likely indicates nogambling problem
A response at this levellikely indicates a mild
gambling problem
A response at this levellikely indicates a
moderate gamblingproblem
A response at thislevel likely
indicates a severegamblingproblem
“Sometimes”1 2 3 4
“Most of the time”1 2 3 4
“Almost always”1 2 3 4
6. Has gambling caused you any health problems, including stress or anxiety?A response at this level
likely indicates nogambling problem
A response at this levellikely indicates a mild
gambling problem
A response at this levellikely indicates a
moderate gamblingproblem
A response at thislevel likely
indicates a severegamblingproblem
“Sometimes”1 2 3 4
“Most of the time”1 2 3 4
“Almost always”1 2 3 4
7. Have people criticized your betting or told you that you had a gambling problem, regardless of whether ornot you thought it was true?
A response at this levellikely indicates nogambling problem
A response at this levellikely indicates a mild
gambling problem
A response at this levellikely indicates a
moderate gamblingproblem
A response at thislevel likely
indicates a severegamblingproblem
“Sometimes”1 2 3 4
“Most of the time”1 2 3 4
“Almost always”1 2 3 4
8. Has your gambling caused any financial problems for you or your household?A response at this level
likely indicates nogambling problem
A response at this levellikely indicates a mild
gambling problem
A response at this levellikely indicates a
moderate gamblingproblem
A response at thislevel likely
indicates a severegamblingproblem
“Sometimes”1 2 3 4
“Most of the time”1 2 3 4
“Almost always”1 2 3 4
9. Have you felt guilty about the way you gamble or what happens when you gamble?A response at this level
likely indicates nogambling problem
A response at this levellikely indicates a mild
gambling problem
A response at this levellikely indicates a
moderate gamblingproblem
A response at thislevel likely
indicates a severegamblingproblem
“Sometimes”1 2 3 4
“Most of the time”1 2 3 4
“Almost always”1 2 3 4
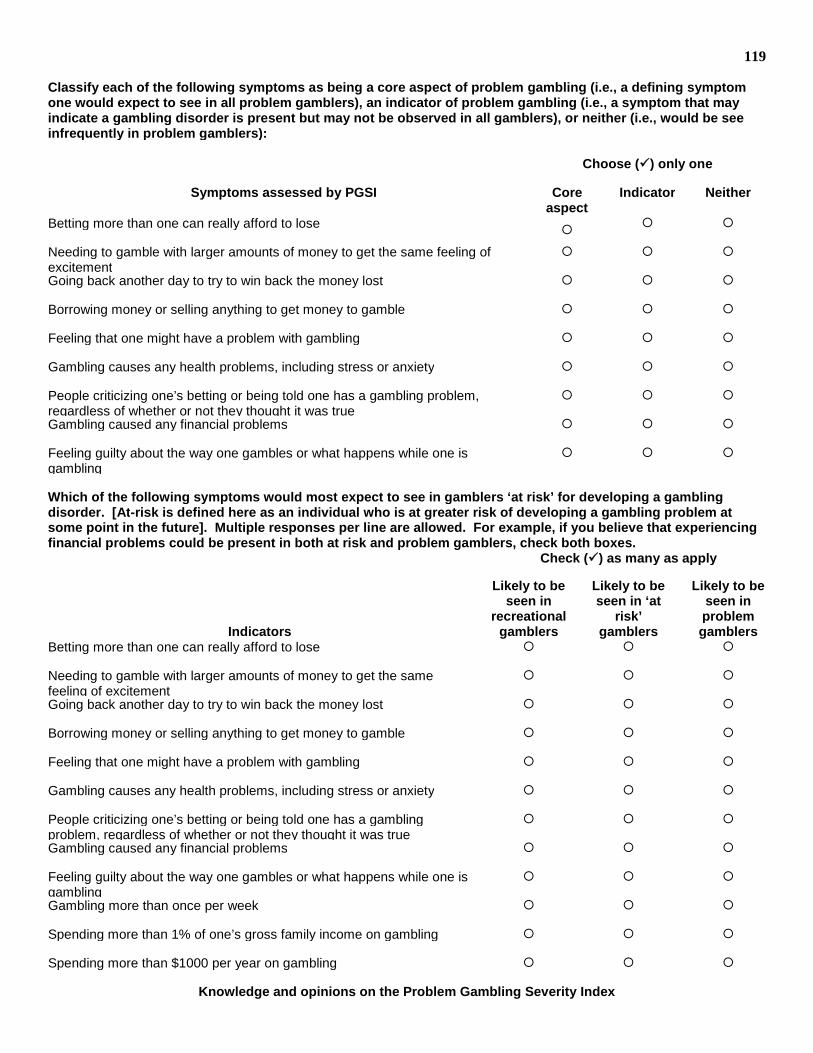
119
Classify each of the following symptoms as being a core aspect of problem gambling (i.e., a defining symptomone would expect to see in all problem gamblers), an indicator of problem gambling (i.e., a symptom that mayindicate a gambling disorder is present but may not be observed in all gamblers), or neither (i.e., would be seeinfrequently in problem gamblers):
Choose () only one
Symptoms assessed by PGSI Coreaspect
Indicator Neither
Betting more than one can really afford to lose
Needing to gamble with larger amounts of money to get the same feeling ofexcitement
Going back another day to try to win back the money lost
Borrowing money or selling anything to get money to gamble
Feeling that one might have a problem with gambling
Gambling causes any health problems, including stress or anxiety
People criticizing one’s betting or being told one has a gambling problem,regardless of whether or not they thought it was true
Gambling caused any financial problems
Feeling guilty about the way one gambles or what happens while one isgambling
Which of the following symptoms would most expect to see in gamblers ‘at risk’ for developing a gamblingdisorder. [At-risk is defined here as an individual who is at greater risk of developing a gambling problem atsome point in the future]. Multiple responses per line are allowed. For example, if you believe that experiencingfinancial problems could be present in both at risk and problem gamblers, check both boxes.
Check () as many as apply
Indicators
Likely to beseen in
recreationalgamblers
Likely to beseen in ‘at
risk’gamblers
Likely to beseen inproblemgamblers
Betting more than one can really afford to lose
Needing to gamble with larger amounts of money to get the samefeeling of excitement
Going back another day to try to win back the money lost
Borrowing money or selling anything to get money to gamble
Feeling that one might have a problem with gambling
Gambling causes any health problems, including stress or anxiety
People criticizing one’s betting or being told one has a gamblingproblem, regardless of whether or not they thought it was true
Gambling caused any financial problems
Feeling guilty about the way one gambles or what happens while one isgambling
Gambling more than once per week
Spending more than 1% of one’s gross family income on gambling
Spending more than $1000 per year on gambling
Knowledge and opinions on the Problem Gambling Severity Index
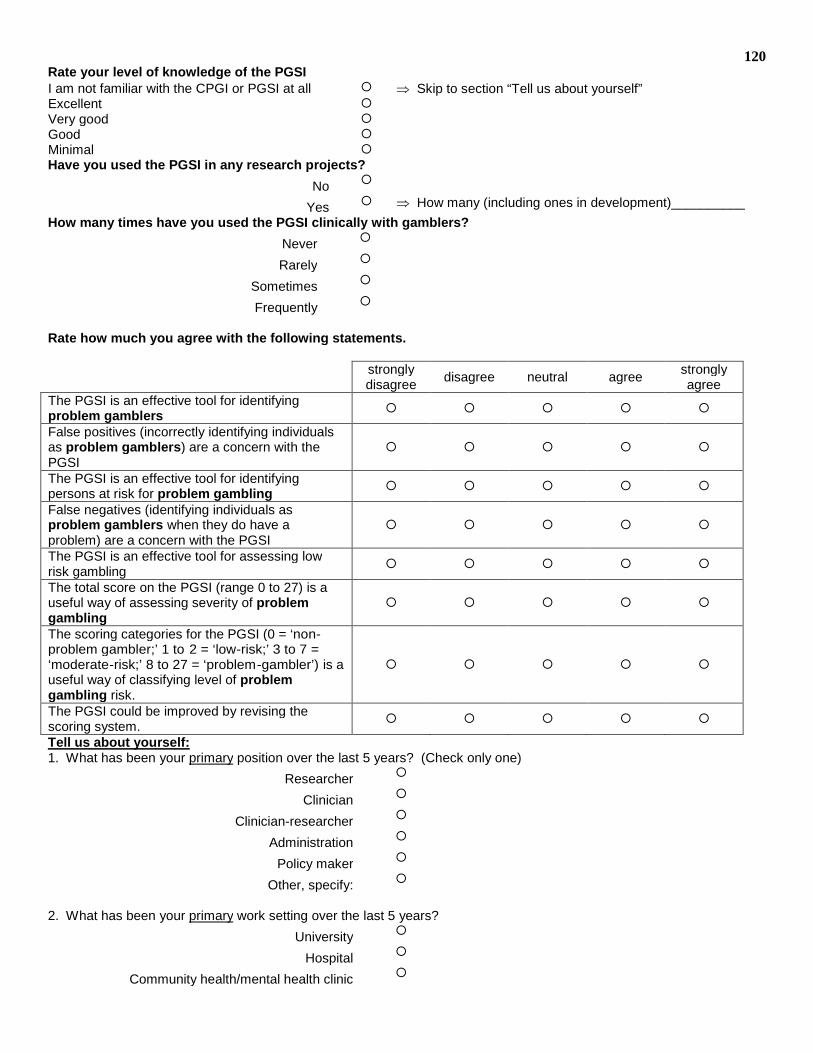
120Rate your level of knowledge of the PGSII am not familiar with the CPGI or PGSI at all Skip to section “Tell us about yourself”Excellent Very good Good Minimal Have you used the PGSI in any research projects?
No
Yes How many (including ones in development)__________
How many times have you used the PGSI clinically with gamblers?
Never
Rarely
Sometimes
Frequently
Rate how much you agree with the following statements.
stronglydisagree
disagree neutral agreestronglyagree
The PGSI is an effective tool for identifyingproblem gamblers
False positives (incorrectly identifying individualsas problem gamblers) are a concern with thePGSI
The PGSI is an effective tool for identifyingpersons at risk for problem gambling
False negatives (identifying individuals asproblem gamblers when they do have aproblem) are a concern with the PGSI
The PGSI is an effective tool for assessing lowrisk gambling
The total score on the PGSI (range 0 to 27) is auseful way of assessing severity of problemgambling
The scoring categories for the PGSI (0 = ‘non-problem gambler;’ 1 to 2 = ‘low-risk;’ 3 to 7 =‘moderate-risk;’ 8 to 27 = ‘problem-gambler’) is auseful way of classifying level of problemgambling risk.
The PGSI could be improved by revising thescoring system.
Tell us about yourself:1. What has been your primary position over the last 5 years? (Check only one)
Researcher
Clinician
Clinician-researcher
Administration
Policy maker
Other, specify:
2. What has been your primary work setting over the last 5 years?
University
Hospital
Community health/mental health clinic
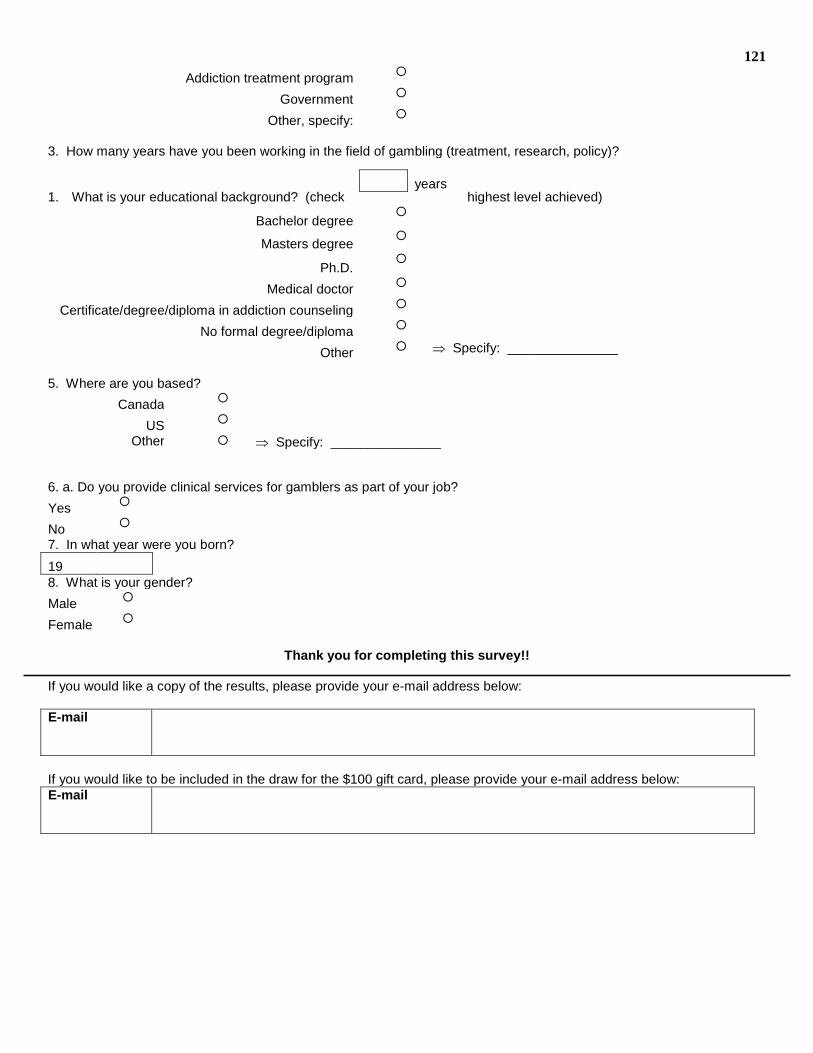
121
Addiction treatment program
Government
Other, specify:
3. How many years have you been working in the field of gambling (treatment, research, policy)?
1. What is your educational background? (check highest level achieved)
Bachelor degree
Masters degree
Ph.D.
Medical doctor
Certificate/degree/diploma in addiction counseling
No formal degree/diploma
Other Specify: _______________
5. Where are you based?
Canada
US
Other Specify: _______________
6. a. Do you provide clinical services for gamblers as part of your job?
Yes
No
7. In what year were you born?
198. What is your gender?
Male
Female
Thank you for completing this survey!!
If you would like a copy of the results, please provide your e-mail address below:
If you would like to be included in the draw for the $100 gift card, please provide your e-mail address below:E-mail
years