Embed Size (px)
Citation preview

Improving thePresentation of
QuantitativeResults in Political
Science
John Kastellec andAndrew Gelman
Introduction
Practice in PoliticalScience
Principles
ExamplesCoefficients & standarderrors
Graphs for methodologicalresearch
Age and voting
Peacekeeping
Sports fans
Multiple regression models
Conclusion
Improving the Presentation ofQuantitative Results in Political Science
John Kastellec and Andrew Gelman
Columbia University
February 12, 2009

Improving thePresentation of
QuantitativeResults in Political
Science
John Kastellec andAndrew Gelman
Introduction
Practice in PoliticalScience
Principles
ExamplesCoefficients & standarderrors
Graphs for methodologicalresearch
Age and voting
Peacekeeping
Sports fans
Multiple regression models
Conclusion
Overview
• What do political scientists do?• Why tables?• Why graphs?• Some basic principles• A graphing template• Some examples

Improving thePresentation of
QuantitativeResults in Political
Science
John Kastellec andAndrew Gelman
Introduction
Practice in PoliticalScience
Principles
ExamplesCoefficients & standarderrors
Graphs for methodologicalresearch
Age and voting
Peacekeeping
Sports fans
Multiple regression models
Conclusion
The use of tables vs. graphs in politicalscience
• Examined 5 journals in 2006 (Kastellec and Leoni2007)
• Coded tables/graphs, and purpose of each• Overall: 150 tables, 89 graphs
●
●
●
●
●
●
0 10 20 30 40
Mathematical
Other
Non−numeric
Predicted Values
Estimates and Uncertainties
Summary Statistics
Percentage of Graphsand Tables Combined,
by Category
●
●
●
●
●
●
0 25 50 75 100
Percentage ofGraphs WithinEach Category
●
●

Improving thePresentation of
QuantitativeResults in Political
Science
John Kastellec andAndrew Gelman
Introduction
Practice in PoliticalScience
Principles
ExamplesCoefficients & standarderrors
Graphs for methodologicalresearch
Age and voting
Peacekeeping
Sports fans
Multiple regression models
Conclusion
Why Tables?
• Tables:• Much easier to produce• Standard in teaching, presentation and publishing• Can aid replication studies
• Graphs:• Takes a lot of work• Belief it’s not possible to present info graphically
Improving thePresentation of
QuantitativeResults in Political
Science
John Kastellec andAndrew Gelman
Introduction
Practice in PoliticalScience
Principles
ExamplesCoefficients & standarderrors
Graphs for methodologicalresearch
Age and voting
Peacekeeping
Sports fans
Multiple regression models
Conclusion
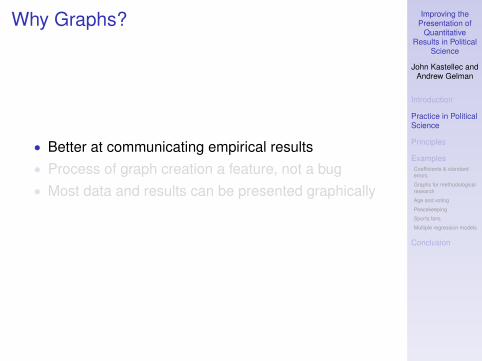
Why Graphs?
• Better at communicating empirical results• Process of graph creation a feature, not a bug• Most data and results can be presented graphically

Improving thePresentation of
QuantitativeResults in Political
Science
John Kastellec andAndrew Gelman
Introduction
Practice in PoliticalScience
Principles
ExamplesCoefficients & standarderrors
Graphs for methodologicalresearch
Age and voting
Peacekeeping
Sports fans
Multiple regression models
Conclusion
CoefficientVariable (Standard Error)Constant .41 (.93)Countries
Argentina 1.31 (.33)∗∗B,M
Chile 93 (.32)∗∗B,M
Colombia 1.46 (.32)∗∗B,M
Mexico .07 (.32)∗∗A,CH,CO,V
Venezuela 0.96 (.37)∗∗B,M
ThreatRetrospective egocentric .20 (.13)
economic perceptionsProspective egocentric .22 (.12)]
economic perceptionsRetrospective sociotropic -.21 (.12)]
economic perceptionsProspective sociotropic -.32 (.12)*
economic perceptionsIdeological distance from -.27 (.07)**
presidentIdeology
Ideology .23 (.07)**Individual Differences
Age .00 (.01)Female -0.03 (.21)Education .13 (.14)Academic sector .15 (.29)Business sector .31 (.25)Government sector -.10 (.27)
R2 .15Adjusted R2 .12n 500**p < .01, *p < .05, ]p < .10 (two-tailed)

Improving thePresentation of
QuantitativeResults in Political
Science
John Kastellec andAndrew Gelman
Introduction
Practice in PoliticalScience
Principles
ExamplesCoefficients & standarderrors
Graphs for methodologicalresearch
Age and voting
Peacekeeping
Sports fans
Multiple regression models
Conclusion
●
●
●
●
●
●
●
●
●
●
●
●
●
●
●
●
●
−2 −1 0 1 2
Government sector
Business sector
Academic sector
Education
Female
Age
Ideology
Distance from president
Prospective sociotropic
Retrospective sociotropic
Prospective egocentric
Retrospective egocentric
Venezuela
Mexico
Colombia
Chile
Argentina
R2 == 0.15
Adjusted R2 == .12
n = 500

Improving thePresentation of
QuantitativeResults in Political
Science
John Kastellec andAndrew Gelman
Introduction
Practice in PoliticalScience
Principles
ExamplesCoefficients & standarderrors
Graphs for methodologicalresearch
Age and voting
Peacekeeping
Sports fans
Multiple regression models
Conclusion
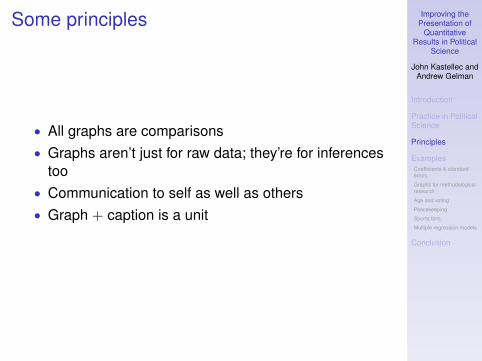
Some principles
• All graphs are comparisons• Graphs aren’t just for raw data; they’re for inferences
too• Communication to self as well as others• Graph + caption is a unit

Improving thePresentation of
QuantitativeResults in Political
Science
John Kastellec andAndrew Gelman
Introduction
Practice in PoliticalScience
Principles
ExamplesCoefficients & standarderrors
Graphs for methodologicalresearch
Age and voting
Peacekeeping
Sports fans
Multiple regression models
Conclusion
Some principles
• All graphs are comparisons• Graphs aren’t just for raw data; they’re for inferences
too• Communication to self as well as others• Graph + caption is a unit

Improving thePresentation of
QuantitativeResults in Political
Science
John Kastellec andAndrew Gelman
Introduction
Practice in PoliticalScience
Principles
ExamplesCoefficients & standarderrors
Graphs for methodologicalresearch
Age and voting
Peacekeeping
Sports fans
Multiple regression models
Conclusion
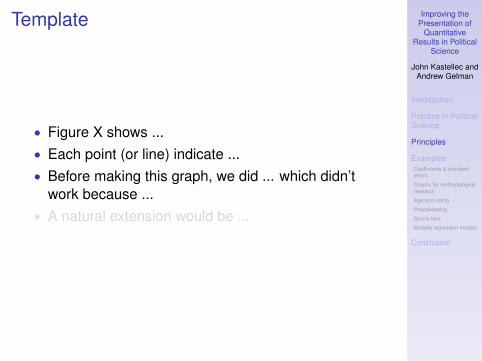
Template
• Figure X shows ...• Each point (or line) indicate ...• Before making this graph, we did ... which didn’t
work because ...• A natural extension would be ...

Improving thePresentation of
QuantitativeResults in Political
Science
John Kastellec andAndrew Gelman
Introduction
Practice in PoliticalScience
Principles
ExamplesCoefficients & standarderrors
Graphs for methodologicalresearch
Age and voting
Peacekeeping
Sports fans
Multiple regression models
Conclusion
Template
• Figure X shows ...• Each point (or line) indicate ...• Before making this graph, we did ... which didn’t
work because ...• A natural extension would be ...

Improving thePresentation of
QuantitativeResults in Political
Science
John Kastellec andAndrew Gelman
Introduction
Practice in PoliticalScience
Principles
ExamplesCoefficients & standarderrors
Graphs for methodologicalresearch
Age and voting
Peacekeeping
Sports fans
Multiple regression models
Conclusion
PRIOR DISTRIBUTION FOR LOGISTIC REGRESSION 1371
FIG. 2. The left column shows the estimated coefficients (±1 standard error) for a logistic regres-sion predicting the probability of a Republican vote for president given sex, race, and income, as fitseparately to data from the National Election Study for each election 1952 through 2000. [The binaryinputs female and black have been centered to have means of zero, and the numerical variableincome (originally on a 1–5 scale) has been centered and then rescaled by dividing by two standarddeviations.]There is complete separation in 1964 (with none of the black respondents supporting the Republicancandidate, Barry Goldwater), leading to a coefficient estimate of −∞ that year. (The particular finitevalues of the estimate and standard error are determined by the number of iterations used by the glmfunction in R before stopping.)The other columns show estimated coefficients (±1 standard error) for the same model fit each yearusing independent Cauchy, t7, and normal prior distributions, each with center 0 and scale 2.5. Allthree prior distributions do a reasonable job at stabilizing the estimates for 1964, while leaving theestimates for other years essentially unchanged.
4.2. A small bioassay experiment. We next consider a small-sample examplein which the prior distribution makes a difference for a coefficient that is already

Improving thePresentation of
QuantitativeResults in Political
Science
John Kastellec andAndrew Gelman
Introduction
Practice in PoliticalScience
Principles
ExamplesCoefficients & standarderrors
Graphs for methodologicalresearch
Age and voting
Peacekeeping
Sports fans
Multiple regression models
Conclusion
Age and voting
Year
Rep
ublic
an s
hare
of t
he tw
o−pa
rty
vote
1988 1992 1996 2000 2004 2008
30%
40%
50%
age 18−29
age 30−44
age 45−64
age 65+
The youth vote and everybody else

Improving thePresentation of
QuantitativeResults in Political
Science
John Kastellec andAndrew Gelman
Introduction
Practice in PoliticalScience
Principles
ExamplesCoefficients & standarderrors
Graphs for methodologicalresearch
Age and voting
Peacekeeping
Sports fans
Multiple regression models
Conclusion
Peacekeeping0
510
15
The Efficacy of Post−Cold War−era Peacekeeping Operations
Pre−treatment measure of problems in country in conflict
Tim
e at
pea
ce (
year
s)
Very Bad Less Bad
●
●
●
●
●●
●
●
●
●
●
●
● ●
●●
●
●
●
●
●
●●
●
●
●
●
●●
●
●
●
●
●●
● ●
●
●
●
●
●
●
●
●
●
●●●
●
●
●
●
●
●
●
●
●
●
●
●
●
●
●
●
●
●
●●
●●
●●
●●
●
●
●
●
●
●
●
●
Peacekeeping−−Peace holdsPeacekeeping−−War resumesNo Peacekeeping−−Peace holdsNo Peacekeeping−−War resumes

Improving thePresentation of
QuantitativeResults in Political
Science
John Kastellec andAndrew Gelman
Introduction
Practice in PoliticalScience
Principles
ExamplesCoefficients & standarderrors
Graphs for methodologicalresearch
Age and voting
Peacekeeping
Sports fans
Multiple regression models
Conclusion
Ideology of sports fan versus non-fans

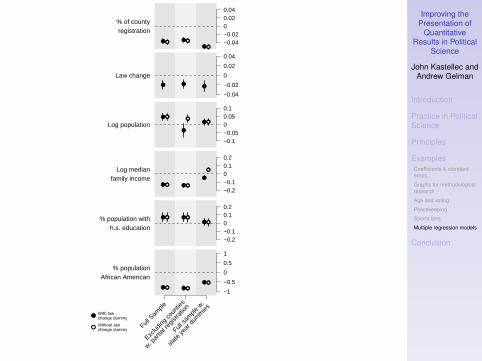
Multiple regression models: tableDependent Variable = County-Level TurnoutExcluding Excludingcounties Full sample counties Full sample
Full w/ partial w/state-year Full w/ partial w/state-yearsample registration dummies sample registration dummies
(1) (2) (3) (4) (5) (6)% of county -0.039** -0.036** -0.051** -0.037** -0.034** -0.050**registration (0.003) (0.003) (0.003) (0.003) (0.003) (0.003)
Law change -0.020** -0.018** -0.023**(0.005) (0.005) (0.006)
Log population 0.048** 0.036** 0.017 0.047** -0.035** 0.016(0.011) (0.012) (0.010) (0.011) (0.021) (0.010)
Log median -0.133** -0.142** 0.050** -0.131** -0.139** -0.049**family income (0.013) (0.014) (0.013) (0.013) (0.014) (0.013)
% population with 0.071* 0.070* 0.011 0.072* 0.071* 0.013h.s. education (0.028) (0.029) (0.024) (0.028) (0.029) (0.024)
% population -0.795** -0.834** -0.532** -0.783** -0.822** -0.521**African American (0.056) (0.059) (0.044) (0.055) (0.059) (0.044)
Constant 1.47** 1.70** 0.775** 1.45** 1.68** 0.819**(0.152) (0.171) (0.124) (0.152) (0.170) (0.127)
R2 0.91 0.91 0.94 0.91 0.91 0.94
N 3572 3153 3572 3572 3153 3572Note. *p < .05, **p < .01. Huber-White standard errors in parentheses. Year dummies andstate-year dummies are not reported.
Improving thePresentation of
QuantitativeResults in Political
Science
John Kastellec andAndrew Gelman
Introduction
Practice in PoliticalScience
Principles
ExamplesCoefficients & standarderrors
Graphs for methodologicalresearch
Age and voting
Peacekeeping
Sports fans
Multiple regression models
Conclusion
● ●
●● ●
●−0.04−0.0200.020.04
% of countyregistration
● ●●
−0.04
−0.02
0
0.02
0.04
Law change
●
●
●
●●
●
−0.1−0.0500.050.1
Log population
● ●
●
● ●
●
−0.2−0.100.10.2
Log medianfamily income
● ●●
● ●●
−0.2−0.100.10.2
% population withh.s. education
● ●
●
● ●
●
Full S
ample
Exclud
ing co
untie
s
w. par
tial r
egist
ratio
n
Full sa
mple
w.
state
year
dum
mies
−1
−0.5
0
0.5
1
% populationAfrican American
●With lawchange dummy
●Without lawchange dummy

Improving thePresentation of
QuantitativeResults in Political
Science
John Kastellec andAndrew Gelman
Introduction
Practice in PoliticalScience
Principles
ExamplesCoefficients & standarderrors
Graphs for methodologicalresearch
Age and voting
Peacekeeping
Sports fans
Multiple regression models
Conclusion
Conclusion
• Software needs to be improved so that graphs areautomatic
• Make data more available (aid replication)• Change incentives: encourage people to use graphs