Embed Size (px)
Citation preview

Improving the Operation of Juvenile Justice
Systems by Taking a New Approach on Evidence-
Based Practice
Gabrielle Lynn Chapman, Ph.D.
Peabody Research Institute
Vanderbilt University
National Juvenile Justice Network, July 28, 2011
Bridging the Gap Between Research and Practice
Shay Bilchik, J.D.
Center for Juvenile Justice Reform
Georgetown Public Policy Institute

Overview
Comprehensive Strategy framework
Evidence-based practice
What does it mean?
Knowledge base
Meta-analysis
Research summary
Standard Program Evaluation Protocol
(SPEP)
Operationalization
Validation
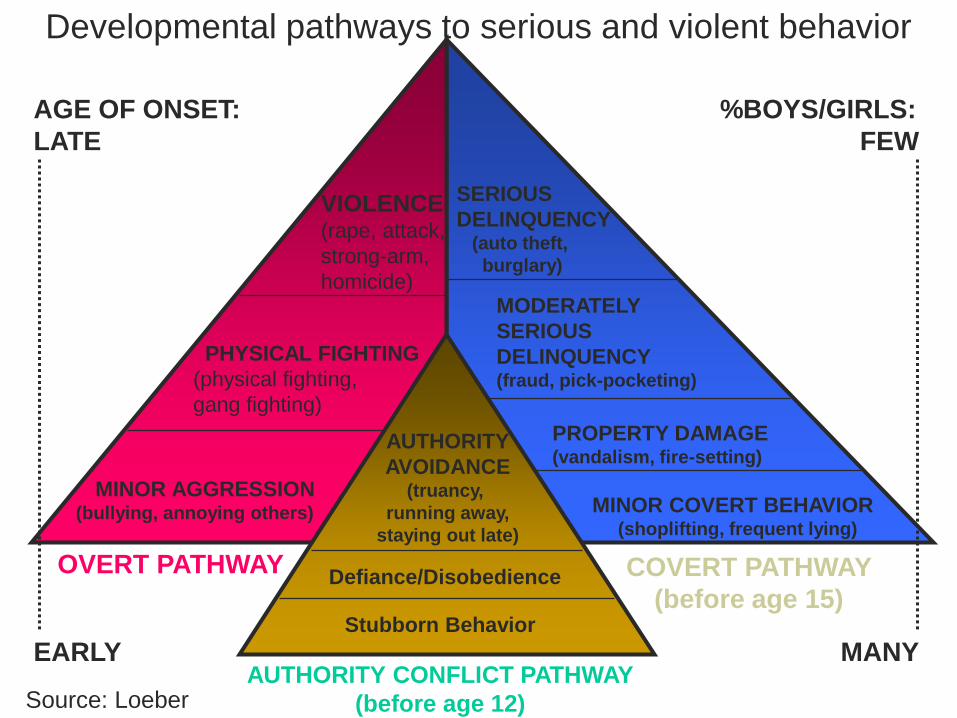
AUTHORITY CONFLICT PATHWAY
(before age 12)
OVERT PATHWAY COVERT PATHWAY
(before age 15)
AGE OF ONSET:
LATE
EARLY
%BOYS/GIRLS:
FEW
MANY Stubborn Behavior
Defiance/Disobedience
AUTHORITY
AVOIDANCE (truancy,
running away,
staying out late)
MINOR AGGRESSION (bullying, annoying others)
PHYSICAL FIGHTING
(physical fighting,
gang fighting)
VIOLENCE
(rape, attack,
strong-arm,
homicide)
MINOR COVERT BEHAVIOR (shoplifting, frequent lying)
PROPERTY DAMAGE (vandalism, fire-setting)
MODERATELY
SERIOUS
DELINQUENCY (fraud, pick-pocketing)
SERIOUS
DELINQUENCY (auto theft,
burglary)
Developmental pathways to serious and violent behavior
Source: Loeber

Age 3
Family
Source: Howell (2003)©
Age 6
School
Age 9
Peer Group
Age 12
IndividualCharacteristics
Age 15
Community
Age 18
ElementarySchoolFailure
ConductProblems
ChildDelinquency
GangMember
Serious andViolent
Delinquency
Prevention Early InterventionTreatment
& Sanctions
Risk and Protective Factors
Prevention and Intervention
Windows of Opportunity
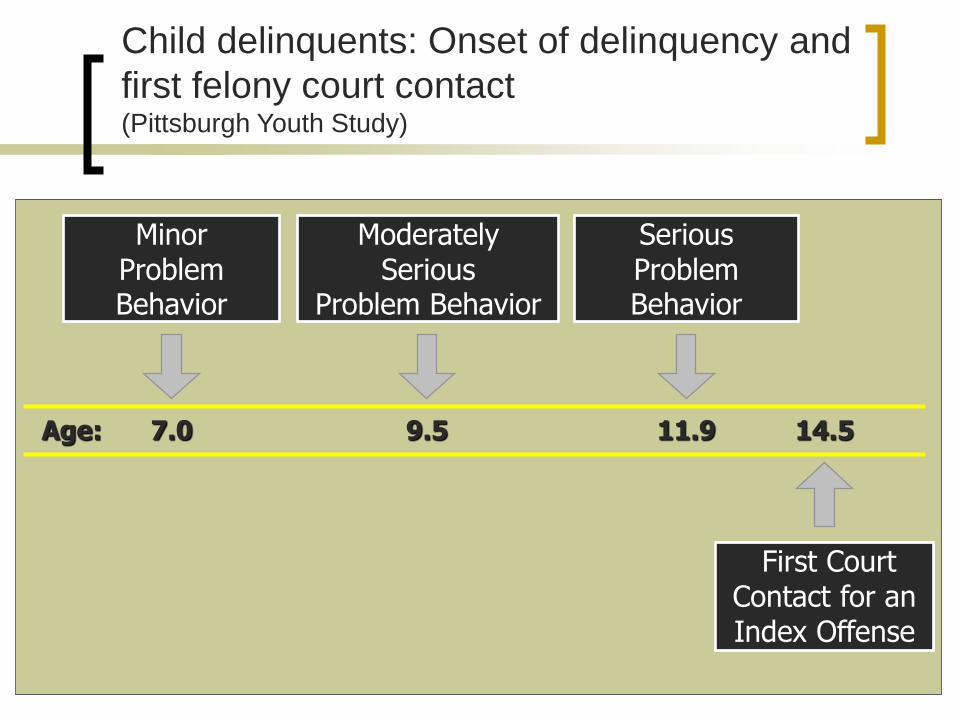
Child delinquents: Onset of delinquency and
first felony court contact (Pittsburgh Youth Study)
First Court Contact for an Index Offense
Age:
Minor Problem Behavior
7.0
Moderately Serious
Problem Behavior
9.5
Serious Problem Behavior
11.9 14.5

Comprehensive Strategy for Serious,
Violent, and Chronic Juvenile Offenders
Problem Behavior > Noncriminal Misbehavior > Delinquency > Serious, Violent, and Chronic Offending
Prevention Target Population: At-Risk Youth
Preventing youth from becoming
delinquent by focusing prevention
programs on at-risk youth
Intervention & Graduated Sanctions Target Population: Delinquent Youth
Improving the juvenile justice
system response to delinquent
offenders within a continuum of
treatment options and system of
graduated sanctions
> > > > > > Programs for All Youth
Programs for Youth at Greatest Risk
Immediate Intervention
Intermediate Sanctions
Community Confinement
Training Schools
Aftercare
Source: Wilson & Howell (1993)

Bridging the Gap

Few evidence-based programs are
actually used in JJ systems
Why?
There are relatively few programs certified
as evidence-based under the prevailing
definition
These programs present organizational
challenges:
Cost
The ability of providers to implement
them “by the book”

The prevailing definition of EBP
The P part: A ‘brand name’ program, e.g., Functional Family Therapy (FFT)
Multisystemic Therapy (MST)
Big Brothers/Big Sisters mentoring
Aggression Replacement Training (ART)
The EB part: Credible research supporting that specific program certified by, e.g., Blueprints for Violence Prevention
OJJDP Model Programs Guide
National Registry of Evidence-based Programs and Practices (NREPP)

An alternative perspective on the P in
EBP: Generic program “types”
Interventions with research on effectiveness can be described by the types of programs they represent rather than their brand names, e.g.,
family therapy
mentoring
cognitive behavioral therapy
These types include the brand name programs, but also many ‘home grown’ programs as well
Viewed this way, there are many evidence-based programs of types familiar to local practitioners
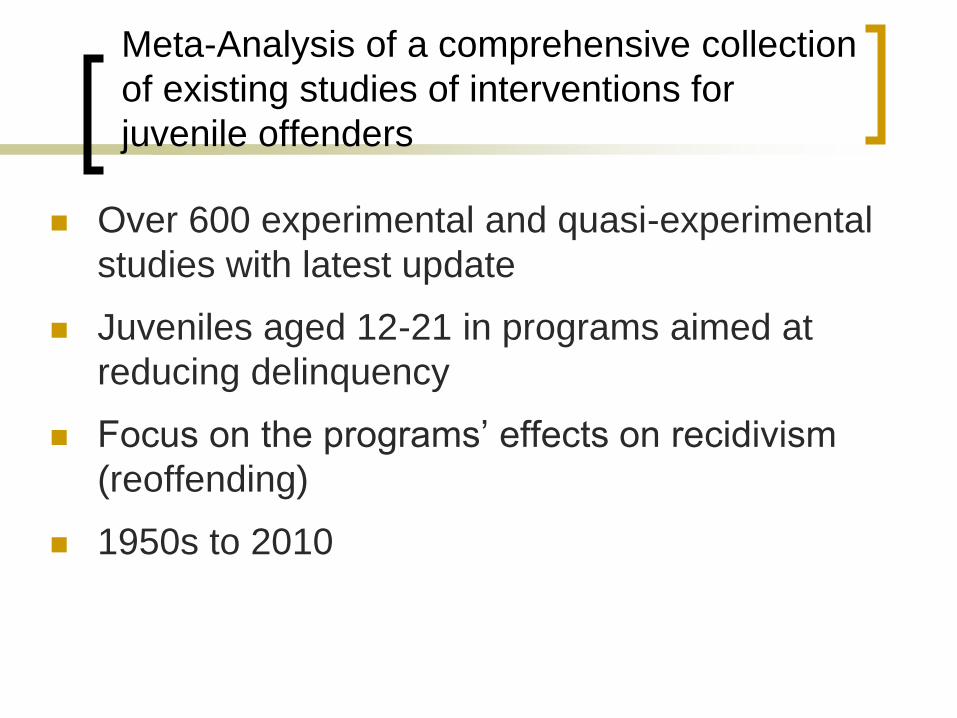
Meta-Analysis of a comprehensive collection
of existing studies of interventions for
juvenile offenders
Over 600 experimental and quasi-experimental
studies with latest update
Juveniles aged 12-21 in programs aimed at
reducing delinquency
Focus on the programs’ effects on recidivism
(reoffending)
1950s to 2010

Database of existing studies of
interventions for juvenile offenders
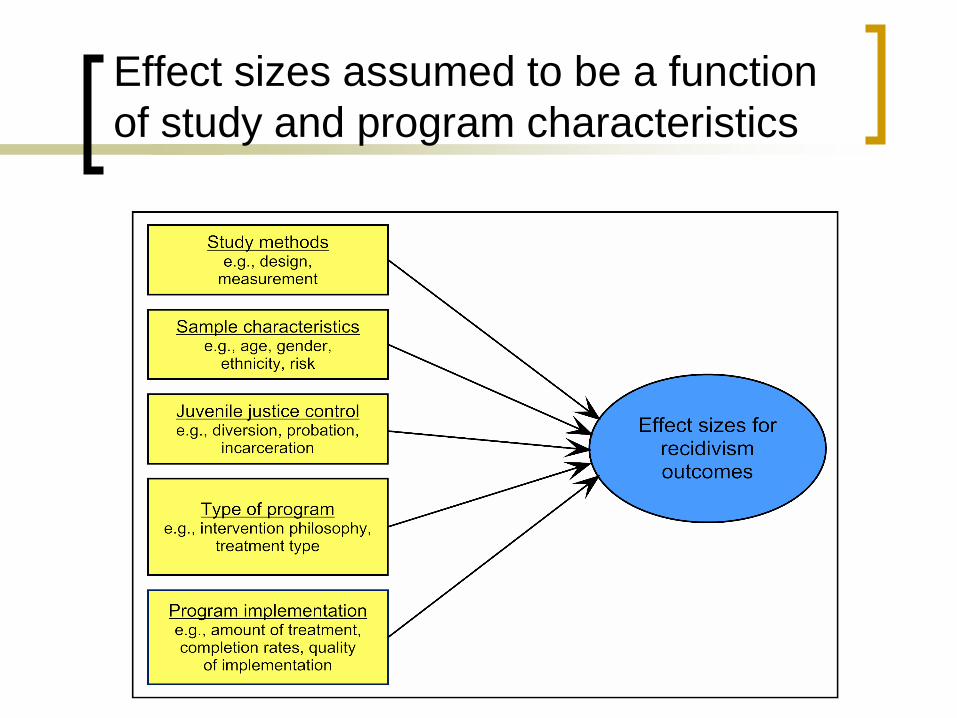
Effect sizes assumed to be a function
of study and program characteristics
Using evidence
from existing
studies in our
meta-analytic
database to
determine . . .
Evidence based practice
what generic
programs and
practices are
effective

Program “philosophies” (Group 1)
Discipline: e.g., paramilitary regimens in
boot camps
Deterrence: e.g., prison visitation (Scared
Straight)
Surveillance: e.g., intensive probation or
parole.

Program “philosophies” (Group 2)
Restorative: e.g., restitution, mediation
Skill-building: behavioral, CBT, social
skills, challenge, academic, & vocational
Counseling: individual, mentoring, family,
family crisis, group, peer, mixed
counseling, mixed with supplementary
referral
Multiple coordinated services: case
management, service broker, multimodal
regimen.

Program types sorted by general
approach: Average recidivism effect
Multiple services
Counseling
Skill building
Restorative
Surveillance
Deterrence
Discipline
-10 -5 0 5 10 15
% Recidivism Reduction from .50 Baseline

Further sorting by intervention type
within, e.g., counseling approaches
Mixed w/referrals
Mixed
Peer
Group
Family crisis
Family
Mentoring
Individual
0 5 10 15 20 25
% Recidivism Reduction from .50 Baseline

Further sorting by intervention type
within, e.g., skill-building approaches
Job related
Academic
Challenge
Social skills
Cognitive-behavioral
Behavioral
0 5 10 15 20 25 30
% Recidivism Reduction from .50 Baseline

Many types of therapeutic interventions thus
have evidence of effectiveness … but there’s
a catch:
Though their average effects on recidivism
are positive, larger and smaller effects are
distributed around that average.
This means that some variants of the
intervention show large positive effects,
but others show negligible or even
negative effects.
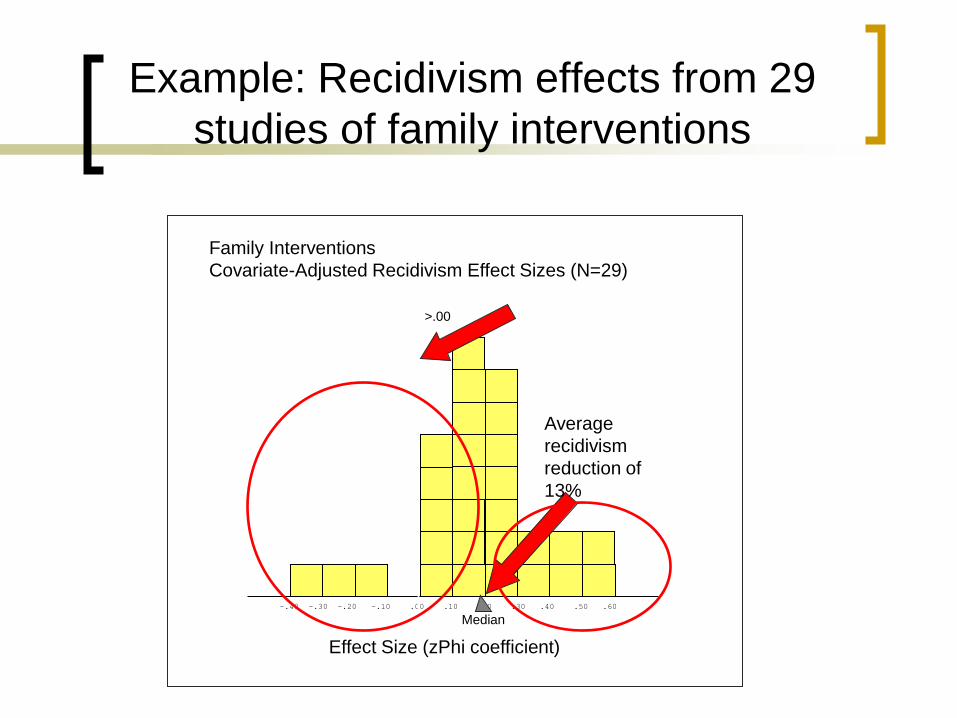
Example: Recidivism effects from 29
studies of family interventions
-.40 -.30 -.20 -.10 .00 .10 .20 .30 .40 .50 .60
Family Interventions
Covariate-Adjusted Recidivism Effect Sizes (N=29)
Effect Size (zPhi coefficient)
>.00
Average
recidivism
reduction of
13%
Median
-.40 -.30 -.20 -.10 .00 .10 .20 .30 .40 .50 .60
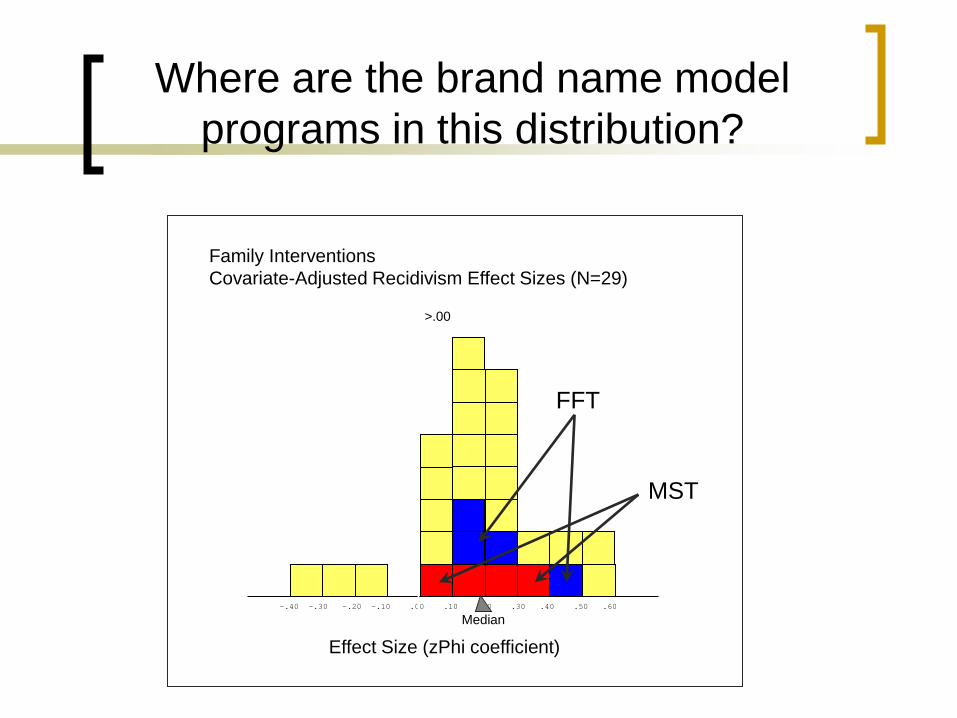
Where are the brand name model
programs in this distribution?
Family Interventions
Covariate-Adjusted Recidivism Effect Sizes (N=29)
Effect Size (zPhi coefficient)
>.00
Median
MST
FFT

Some characteristics of the juveniles
matter
On average, larger positive effects on
recidivism with higher risk juveniles
Little difference in effects for juveniles of
different age, gender, and ethnicity

JJ supervision doesn’t matter much
For juveniles with similar risk for recidivism,
intervention effects are similar at all levels of
juvenile justice supervision:
No supervision
Diversion
Probation/parole
Incarceration

Service amount and quality matters
For each type of intervention …
Positive outcomes are associated with
the average duration and total hours of
service
Positive outcomes are strongly
associated with the quality with which the
intervention is implemented

To have good effects, interventions must be
implemented to match the ‘best practice’ found in
the research
Program type: Therapeutic approaches are the
more effective intervention types
Risk: Larger effects with high risk juveniles
Dose: Amount of service that at least matches the
average in the supporting research
High quality implementation: Treatment protocol
and monitoring for adherence

Standardized Program Evaluation
Protocol (SPEP)
Apply this knowledge base to assess how
well current program practice matches
evidence for effectiveness
A rating scheme for each program type
within the therapeutic philosophies
Applied to individual programs based on
data about the services actually provided to
participating juveniles
Validated with juvenile justice programs in
Arizona and North Carolina

Primary Service:
[INSERT
SCORE]100Provider’s Total SPEP Score:
% of youth with the target risk score or higher:
25% (5 points) 75% (15 points)
50% (10 points) 99% (20 points)
20
Youth Risk Level:
Rated quality of services delivered:
Low (5 points) Medium (10 points) High (15 points)
15Treatment Quality:
15
Contact Hours:
% of youth that received target hours of service or more:
0% (0 points) 60% (9 points)
20% (3 points) 80% (12 points)
40% (6 points) 100% (15 points)
Duration:
% of youth that received target number of weeks of service or more:
0% (0 points) 60% (6 points)
20% (2 points) 80% (8 points)
40% (4 points) 100% (10 points)
10
Treatment Amount:
Qualifying supplemental service used (5 points) 5
Supplemental Service:
35 High average effect service (35 points)
Moderate average effect service (25 points)
Low average effect service (15 points)
Received
Points
Possible
Points
Standardized Program Evaluation Protocol (SPEP) for
Services to Probation Youth
Points assigned proportionate to the contribution of each factor to recidivism reduction
Target values from the meta-analysis (generic) OR program manual (manualized)

Evidence based practice
With adequate specification of the nature
of a particular program or service taking
place, we can match it with research that
provides evidence for the effectiveness of
that practice.

Actual vs. predicted recidivism for
providers with scores ≥ 50 and < 50
-0.01
-0.01
-0.13
-0.12
-0.14 -0.12 -0.1 -0.08 -0.06 -0.04 -0.02 0 0.02
Actual Minus Predicted Recidivism Difference
SPEP ≥ 50
SPEP < 50
6-Month Recidivism Difference
12-Month Recidivism Difference
6-mo
recidivism
difference:
Low score
12-mo
recidivism
difference:
Low score
6-mo
recidivism
difference:
High score
12-mo
recidivism
difference:
High score
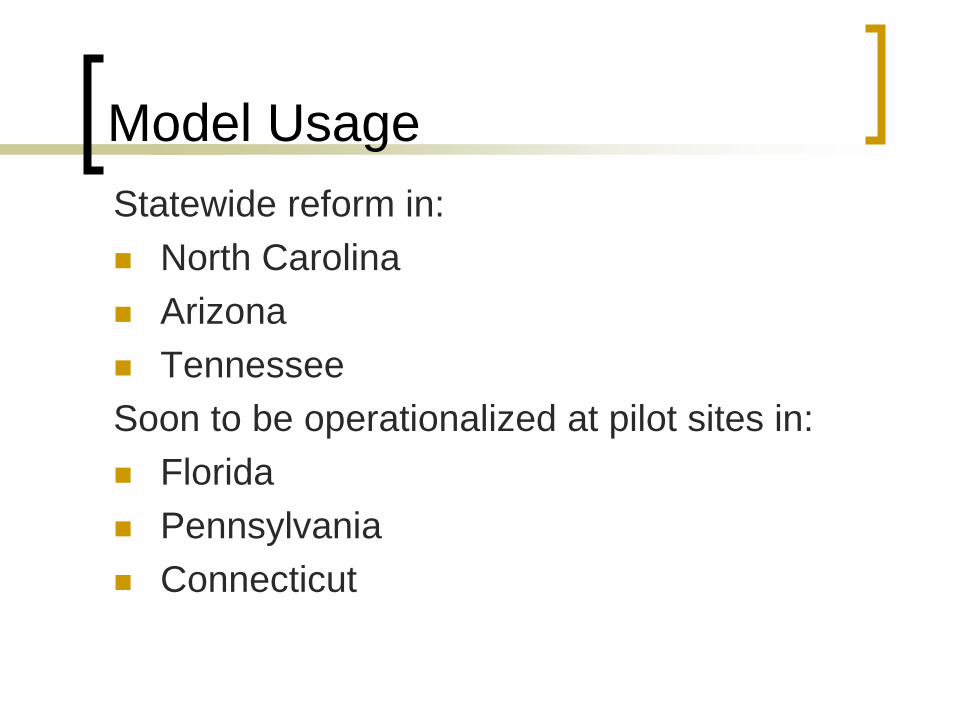
Model Usage
Statewide reform in:
North Carolina
Arizona
Tennessee
Soon to be operationalized at pilot sites in:
Florida
Pennsylvania
Connecticut
Summary
There is a great deal of evidence on the
effectiveness of interventions for juvenile
offenders beyond that for brand name model
programs
Model programs may be the best choice when a
new program is to be implemented
But evidence-based ‘best practice’ guidance can
support the effectiveness of ‘home grown’
programs already in place without replacing them
with model programs

Creating an Evidence Based
Operating Platform
There is a need for a research based
operating platform to ensure that each
element of a juvenile justice system is part of
a cohesive whole.
Risk
Assessment
Level of
Supervision
Options
Needs
Assessment
Effective
Program
Options
Reoffense Rate, Incarceration Rate,
Mental Health outcomes, etc.
P
R
E
V
E
N
T
I
O
N
JJ
Entry
Achieving desired outcomes?
Done
Unsatisfactory outcomes?
Program and System Improvement

Role of Advocacy
Advance the messages that underpin this work,
such as:
States needlessly spend billions of dollars a year
incarcerating nonviolent youth.
Imprisoning youth can have severe detrimental effects on
youth, their long-term economic productivity and economic
health of communities.
Community-based programs increase public safety.
Community-based programs for youth are more cost-
effective than incarceration.
From: Justice Policy Institute (2009). The Costs of Confinement: Why Good
Juvenile Justice Policies Make Good Fiscal Sense. Washington DC: Justice Policy
Institute.

Role of Advocacy (continued)
The role of reinvestment strategies in
supporting realignment
RECLAIM Ohio

Improving the Operation of Juvenile Justice
Systems by Taking a New Approach on Evidence-
Based Practice
Gabrielle Lynn Chapman, Ph.D.
Peabody Research Institute
Vanderbilt University
National Juvenile Justice Network, July 28, 2011
Bridging the Gap Between Research and Practice
Shay Bilchik, J.D.
Center for Juvenile Justice Reform
Georgetown Public Policy Institute