Embed Size (px)
Citation preview
IOTC-2016-WPDCS-18 rev1
Improving the management of European Union
and assimilated Purse Seine fleets size-frequency
data received by the Secretariat
Emmanuel Chassot∗, Fabio Fiorellato†, James Geehan†, Laurent Floch‡
SUMMARY
Sampling and processing procedures used for monitoring the European
and assimilated purse seine catch in the Indian Ocean evolved over time,
particularly during the fishery expansion throughout the 1980s. Size fre-
quency data sets available include both raw and weighted size data as well
as catch-at-size matrices. Here, we show that the size data used in the re-
cent asessments of yellowfin and bigeye with stock synthesis were derived
from catch-at-size data while they should rely on weighted size data sets.
Size structures between weighted and extrapolated data appear to be very
similar during 1991-2015 and should not affect models estimates. By con-
trast, size data available in the 1980s show major differences which should
be further explored. Future assessments performed for tropical tunas with
stock synthesis will include updated versions of the purse seine size data
that are currently key in the assessment of their status.
KEYWORDS: bigeye; size structure; stock assessment; yellowfin
∗IRD - UMR MARBEC 248, SFA, Long Pier, BP570, Victoria, SEYCHELLES;[email protected]†IOTC Secretariat Le Chantier Mall (2nd floor) PO Box 1011, Victoria, SEYCHELLES;
[email protected]‡IRD - UMR MARBEC, CRH, Avenue Jean Monnet CS 30171 34203 Sete cedex, FRANCE
1
1. Introduction
The purse seine (PS) fleet of the Indian Ocean developed from the early-1980s
after some exploratory cruises (Hallier and Marsac, 1985). Initially based on
the sampling protocol conducted for the European purse seine fleet of the At-
lantic Ocean (Bard and Vendeville, 1986), sampling procedures of the PS catch
in the Indian Ocean quickly adapted to the logistical constraints of unloading in
Victoria (Seychelles) and evolved over the 1980s and 1980s with the expansion
of the fishery (Hallier et al., 1992).
Consequently, sampling of size frequency data for tropical tunas caught by
the European and assimilated purse seiners varied over time (Pianet, 1999).
Prior to August 1984, one single size sample of about 100 yellowfin and skipjack
was collected at sea and at land for estimating the size structure of the catch.
Bigeye was less abundant in the catch and samples generally included less than
100 fish. From September 1984, an additional sampling of the ’mixed sets’, i.e.
coming from fishing sets comprised of a mix of small tunas generally caught on
floating objects, was performed to estimate the species composition of the catch.
After 1987, the method expanded to all wells where the size sampling indicated
a mix of species inconsistent with what was reported in the logbook or well plan.
From 1989 to 1998, a simple random sampling procedure was implemented with
one step aimed at estimating the size structure and a second one devoted to
the species composition. The sampling protocols and processing procedures for
the European and assimilated PS fleets were harmonized across the two oceans
from the late-1990s through the EU project ’Echantillonnage Thonier’ which
established the foundation of the current sampling system in use in the fleets
flying the Seychelles, French, Spanish, and Mauritius flag (Pallares and Hallier,
1997; Pianet et al., 2000). Since 1998, a single sampling procedure has been
implemented to estimate both size and species composition from size measure-
ments.
Size-frequency datasets prepared by the IOTC Secretariat for stock assess-
ments are based on the data provided on an annual basis by each CPC. While
some assessment models (e.g. Statistical-Catch-At-Age) rely on a complete
catch-at-age matrix which requires extrapolation procedures and assumptions
(e.g. use of proxy fleet assumed to have a similar size structure), Multifan-CL
and Stock Synthesis (SS) make use of the raw size frequency data available for
the fleets considered in the model (Fournier et al., 1998; Methot and Wetzel,
2013). Precisely, a multinomial distribution is used to model the length compo-
sition data expressed in proportion, using an assigned sample size to scale the
variance of each bin in a composition vector (Methot and Wetzel, 2013). This
sample size is typically in the range of 50–200 individuals, i.e much lower than
the actual number of individuals measured. It is noteworthy that SS estimates
an ’effective sample size’ (ESS) which represents the size of the random sample
needed, on average, to achieve a fit that is as good as the variance in the model’s
fit to the composition vector (Methot and Wetzel, 2013; McAllister and Ianelli,
1997). In the 2016 assessment of bigeye conducted with SS, all fisheries length
frequency observations were assigned an ESS of 1 to down-weigh their impor-
tance in the fitting process while the PS log-associated fishery was assigned an
ESS of 10 (Langley, 2016). PS size frequency data play therefore a crucial role
in stock assessments of yellowfin and bigeye with regards to the issues encoun-
tered in longline size-frequency data (Geehan and Hoyle, 2013).
It was noted during the 2015 Scientific Committee and the 2016 Working
Party on Tropical Tunas that the size frequency data used for purse seine catches
in the recent stock assessment models developed for yellowfin and bigeye dif-
fered from the original size samples (Fonteneau, 2016). Preliminary analyses
indicated that the size structure of the data processed by the Secretariat were
very similar to the data available from the CPCs and this should not affect
the assessment. It was agreed during the WPTT that the WPDCS would ad-
dress the question of management of purse seine size data by the Secretariat.
The present report describes the size-frequency data available for bigeye and
yellowfin from the European and assimilated purse seine fleets to clarify the
current procedures used by the Secretariat for producing the size data used as
inputs in stock assessment models.
2. Materials and Methods
Purse seine fisheries are typically split between 2 main types of school association
which result in catches of very distinct size and species composition: Log School
(LS) and Free School (FS). The acronym ’LS’ encompasses any type of drifting
floating object to which tuna schools associate with. This definition includes
”natural” objects (e.g. logs, palm branches) and anthropogenic floating objects,
such as man-made bamboo rafts equipped with radio-range beacons, satellite
transmitters and echo-sounders. The acronym ’FS’ is used for free-swimming
schools, i.e. unassociated. Fishing sets made on whales were classified as FS
sets whereas sets made on whale sharks (Rhincodon typus) were classified as LS
sets (Pallares and Hallier, 1997).

2.1 Sampling protocol and processing
In the Indian Ocean, the sampling of the European and assimilated purse sein-
ers is conducted at unloading in the fishing ports of Victoria (Seychelles) and
Antsiranana (Madagascar). It consists in a 2-step approach: (i) the wells are
selected from among those containing homogeneous strata, i.e. same quarter,
type of school association and area (Fig. 2) and (ii) fish are randomly collected
from the wells and counted and/or measured. A total of 500 fish are sampled
for LS sets and 200 for FS sets in 2 distinct rounds made on the upper and
lower parts of the wells to reduce any stratification effect. Size measurements
are made with a caliper in fork length (i.e. projected straight distance from
the tip of the snout to the shortest caudal ray; FL) to the nearest cm for tunas
<70 cm and in predorsal length (i.e. projected straight distance from the tip
of the snout to the anterior base of the first dorsal fin) to the 1/2 cm for tunas
>70 cm. Raw data are stored in the MS ACCESS relational database AVDTH
(Lechauve, 1999).
In a second step, all fish sizes are harmonized in fork length through species-
specific conversion keys, which determine the proportion of fork length at pre-
dorsal length, and stored in the PostgreSQL/PostGIS database BALBAYA
hosted on a secured IRD server. A quality code is assigned to each size-frequency
sample: (1) samples can be used for both estimation of species composition and
size structure, (2) samples can be used for description of size structure, (3) sam-
ples can only be used for describing some biological samples, (4) samples can
not be used as there was some sorting issues, etc.
All size-frequency data collected for the European and assimilated PS fleets
have been shared over the full time period through mutual agreements be-
tween the institutes in charge of the purse seine monitoring, namely the In-
stitute of Research for Sustainable Development (IRD), the Instituto Espanol
de Oceanografia (IEO), and the Seychelles Fishing Authority (SFA). At IRD, all
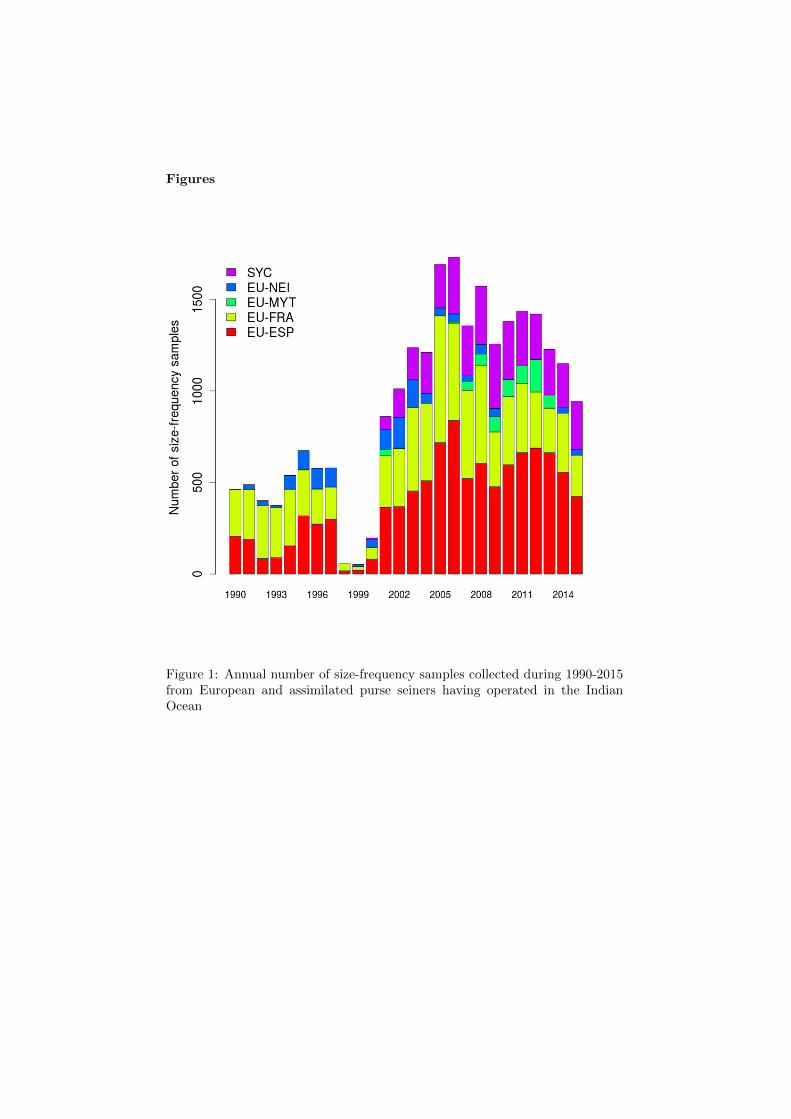
sampling data from 1990 have been stored in BALBAYA. The annual number of
samples varied from about 500 during 1990-1997 to about 50 during 1998-1999
and 200 in 2000 due to some issues in the monitoring of sampling activities (Fig.
1). The number of sampled increased thereafter consistently with the expansion
of the fishery and varied between 900 and 1700 during the 2000-2010s. Data
collected prior to 1990 are only available for the French PS fleet and accessi-
ble in AVDTH while Spanish samples collected prior to 1990 are currently not
available.
2.2 Data sets
Three types of size-frequency data sets are produced for the European and
assimilated purse seine fleets:
1. Raw samples (file extension NN.T): Number of individuals by 2-cm fork
length class (lower bound);
2. Weighted samples (file extension PON.TM5): Number of individuals
by 2-cm fork length class (lower bound) raised to the catch of the fishing
sets sampled and aggregated by 5x5 grid and month;
3. Catch-at-size (file extension NE.TM5): Number of individuals by fork
length class raised to the total catch and aggregated by 5x5 grid and
month.
It is noteworthy that the catch-at-size data set results from a processing pro-
cedure which merges all European and assimilated size samples to estimate the
mean size distribution in a given stratum, i.e. area, quarter and type of school
association (Fig. 2). The processing assumes that the flag of the fishing vessel
does not affect tuna size distribution within each stratum. This results in the
relative length frequency distribution to be identical for all the flags in a given
stratum. When the number of samples is considered insufficient (<15), a sub-
stitution procedure is used, e.g. using length distributions from neighbouring
grids, or different time periods for the same area. the file extension is (Pallares
and Hallier, 1997).
2.3 Data management at the IOTC Secretariat
Each of the 3 size-frequency data sets described above has not always been
provided on an annual basis to the IOTC Secretariat. Hence, there is some het-
erogeneity in the data available at the Secretariat due to the temporal changes in
sampling and processing conducted and associated tools Pianet (1999); Pianet
et al. (2000). The IOTC database stores for each reported size-frequency stra-
tum the ’sample size’, i.e. the actual number of fish having been sampled for the
stratum according to the data provider, and the number of fish for each length
class, i.e. the length distribution. To prepare the files for stock assessment
models (i.e. SS3), which use the original samples, the raised lengths (NE.TM5)
are scaled down to the original sample size provided to the Secretariat in the
PON.TM5 files. When producing the SS3 inputs - in terms of length distribu-
tion for each assessment stratum (year, quarter, fishery) - the process uses the
size-frequency data as stored within the IOTC database and updates the actual
length distribution for each year, fleet, month, grid, gear, species so that the
sum of number of fish by length class (for a given stratum) will be equal to the
stored sample size for the same stratum. This is true for each and every stratum
that has a sample size greater than zero: size-frequency strata with sample size
set to zero are simply discarded.
3. Results & Discussion
3.1 Availability of size measurements
The number of tropical tuna measurements collected during 1983-2015 is very
similar between the IOTC database and data available from IRD, IEO and SFA.
The number of data available from IOTC for sets on floating objects (LS) ap-
pears to be equal or higher to IRD-IEO-SFA during 1984-1989, likely due to
the current non-availability of Spanish samples during this period in the IEO
database (Figs. 3-4). This indicates that the size data could be recovered from
the IOTC for this period as the number of fish suggests that the raw samples
were provided to the Secretariat at this time. It is noteworthy that all big-
eye size measurements collected by IRD during 1986-1987 were lost while they
are available for yellowfin and skipjack. Some data rescue from IRD historical
records might be feasible and should be further explored (A. Fonteneau, pers.
com.). For some years, there are more size measurements available from IRD,
IEO and SFA than in the IOTC database. This could be due to the quality
criteria used when data were provided to the Secretariat as the information is
currently missing for some European and Seychelles size samples. A procedure
was recently developed to determine the sample quality from samples character-
istics (e.g. number of fish) and information on fishing set origin available from
the well plans. This procedure should be used for all samples with unknown
quality to ensure that only data of quality criteria 1 and 2 have been provided
to the Secretariat. Finally, it seems that PS size data collected in 2014-2015
have not all been provided to the Secretariat and this should be checked once
the criterion of data quality has been fully recovered.
3.2 Comparison of size structure
Overall, size frequency data available from IRD-IEO-SFA and the IOTC Secre-
tariat are very similar over the period 1991-2015. For instance, the relative size
frequency distribution of bigeye caught on LS in 2014 shows an almost identical
pattern with a median size at 50 cm FL and the 25% and 75% quantiles at 46
and 56 cm FL, respectively (Fig. 5). There are however some small differences
in the relative magnitude of the distribution for sizes in the interval 50-60 cm
FL and for fish >75 cm FL. These differences are not due to size-frequency
data available from purse seine fleets other than the European and assimilated
fleet, i.e. Korea and Iran, since no information on LS size data was provided by
these CPCs in 2014. Our results show that the IOTC FL data correspond to
the CAS data sets provided by IRD-IEO-SFA over the period 1991-2015. SS3
inputs appear to be very similar to the CAS data with some small changes that
due to the removal of size data from the strata where there was no sampling.
Future stock assessments conducted with a similar approach as SS3 for dealing
with size data, i.e. with a likelihood component for the length composition data,
should use the size structure available from the weighted samples of PS size fre-
quency data and not be derived from the CAS data that rely on some processing
(merging of the samples of a same stratum) and substitution procedure.
More differences between data sources are found in the 1980s. In 1988 for
instance, the CAS data available from IRD-IEO-SFA strongly differ from IOTC
FL data and from SS3 input data (Fig. 5). Also, unweighted size data, only
available from French purse seiners, appear to be skewed towards large sizes
(median = 61 cm FL) while the CAS is more consistent with a typical size
structure of bigeye caught on LS (median = 54 cm FL). Only less than 6,000
bigeye were measured in 1988 from some selected wells of the French purse
seiners, i.e. non randomly (Pianet, 1999). In this case, the computation of the
Catch-At-Size matrix accounting for the weight of each sample and non sampled
strata might better reflect the size structure of the population. It might then be
better to rely on the CAS data available from IRD-IEO over the period 1982-
1990 to produce the size-frequency data required by stock assessment models
such as SS3.
Acknowledgements
We are grateful to all current and past personnel involved in the collection and
management of purse seine fisheries data since the early 1980s. Special thanks
are given to Alain Fonteneau for pointing out issues in the data, Cindy Assan
(SFA), Juliette Lucas (SFA) and Alicia Delgado de Molina (IEO) for fruitful
collaboration over the last decades.
References
F. Bard and P. Vendeville. Note sur l’echantillonnage plurispecifique des thons
tropicaux au port d’Abidjan. In Tropical tunas = Thonides tropicaux =
Tunidos tropicales, volume 25 of Collective Volume of Scientific Papers, pages
37–45. ICCAT, Madrid, Spain, 1986.
A. Fonteneau. Note on the size frequencies of the YFT & BET catches by PS
used in the SS3 model. In IOTC Proceedings, Victoria, Seychelles, 2016.
IOTC.
D. Fournier, J. Hampton, and J. Sibert. MULTIFAN-CL: a length-based, age-
structured model for fisheries stock assessment, with application to South Pa-
cific albacore, Thunnus alalunga. Canadian Journal of Aquatic and Fisheries
Sciences, 55:2105–2116, 1998.
J. Geehan and S. Hoyle. Review of length frequency data of the Taiwanese dis-
tant water longline fleet. In IOTC Proceedings, volume WPTT15-41, page 30,
San Sebastian, Spain, 23-28 October 2013, 2013. IOTC.
J.-P. Hallier and F. Marsac. La flotille thoniere franco-ivoirienne operant dans
l’ocean Indien occidental de novembre 1983 a decembre 1984. In Expert
consultation on stock assessment of tunas in the Indian ocean, pages 157–
164, Victoria Mahe, 1985. IPTP. URL http://www.documentation.ird.
fr/hor/fdi:010006302.
J.-P. Hallier, P. Dewals, A. Thomas, and F. Layani. Le systeme de collecte
et de traitement des statistiques thonieres aux Seychelles. Technical report,
ORSTOM, Victoria Mahe, 1992. URL http://www.documentation.ird.fr/
hor/fdi:010063028.
A. Langley. Stock assessment of bigeye tuna in the Indian Ocean for 2016 —
model development and evaluation. In IOTC Proceedings, volume IOTC-
2016-WPTT18-20, page 98p, Victoria, Seychelles, 11 - 13 Novembre 2016,
2016. IOTC.
J.-J. Lechauve. AVDTH98. Acquisition et validation des donnees de peche
au thon tropical. Technical Report 84, Institut de Recherche pour le
Developpement, Brest, France, 1999.
M. K. McAllister and J. N. Ianelli. Bayesian stock assessment using catch-age
data and the sampling - importance resampling algorithm. Canadian Journal
of Fisheries and Aquatic Sciences, 54(2):284–300, Feb. 1997. ISSN 0706-652X,
1205-7533. doi: 10.1139/f96-285. URL http://www.nrcresearchpress.
com/doi/abs/10.1139/f96-285.

R. D. Methot and C. R. Wetzel. Stock synthesis: A biological and
statistical framework for fish stock assessment and fishery management.
Fisheries Research, 142:86–99, May 2013. ISSN 01657836. doi: 10.1016/
j.fishres.2012.10.012. URL http://linkinghub.elsevier.com/retrieve/
pii/S0165783612003293.
P. Pallares and J.-P. Hallier. Analyse du schema d’echantillonnage mul-
tispecifique des thonides tropicaux. Rapport scientifique. Programme 95/37,
IEO/ORSTOM, 1997.
R. Pianet. Evolution du systeme de collecte et de traitement des donnees de la
peche thoniere des senneurs europeens et assimiles de 1981 a 1998. In IOTC
Proceedings, volume 2, pages 74–96, 1999.
R. Pianet, P. Pallares, and C. Petit. New sampling and data processing strategy
for estimating the composition of catches by species and sizes in the European
purse seine tropical tuna fisheries. In IOTC Proceedings, volume 3, pages
104–139, 2000.
Figures
Figure 1: Annual number of size-frequency samples collected during 1990-2015from European and assimilated purse seiners having operated in the IndianOcean

Figure 2: spatial areas used in the processing of size-frequency data collectedfrom the European and assimilated purse seine fishery in the Indian Ocean
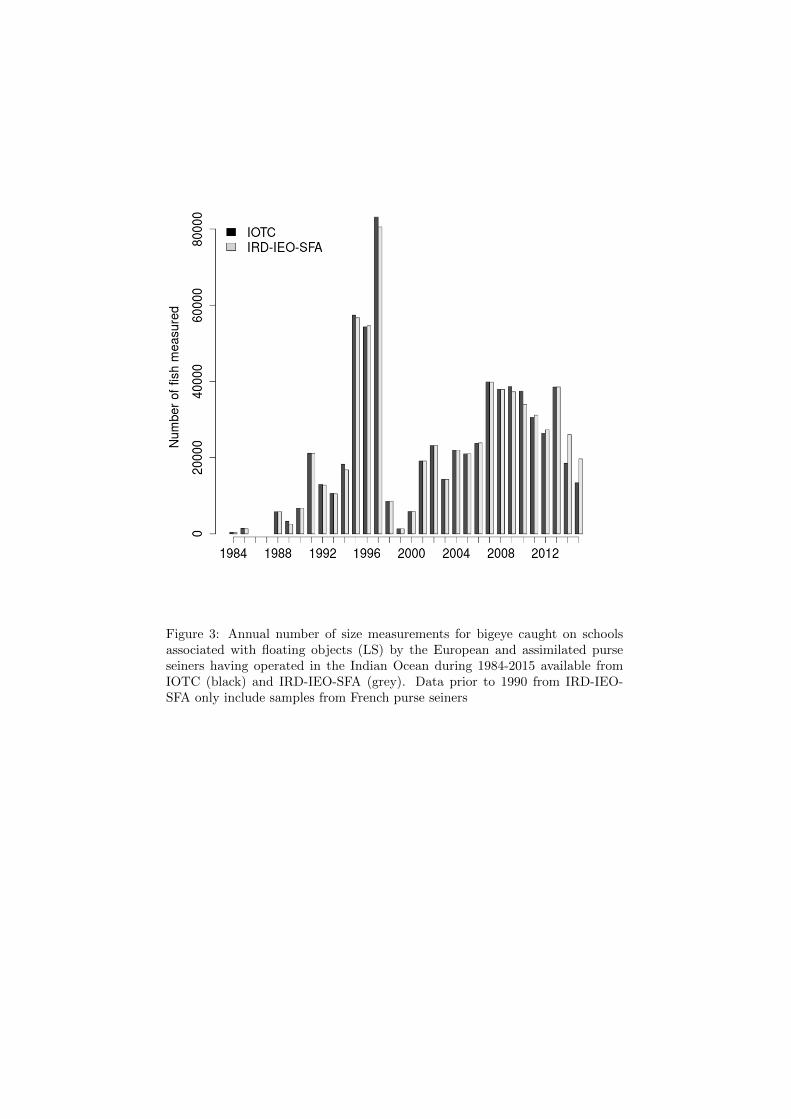
Figure 3: Annual number of size measurements for bigeye caught on schoolsassociated with floating objects (LS) by the European and assimilated purseseiners having operated in the Indian Ocean during 1984-2015 available fromIOTC (black) and IRD-IEO-SFA (grey). Data prior to 1990 from IRD-IEO-SFA only include samples from French purse seiners

Figure 4: Annual number of size measurements for yellowfin caught on schoolsassociated with floating objects (LS) by the European and assimilated purseseiners having operated in the Indian Ocean during 1984-2015 available fromIOTC (black) and IRD-IEO-SFA (grey). Data prior to 1990 from IRD-IEO-SFA only include samples from French purse seiners

Figure 5: Relative size-frequency histograms of bigeye caught on schools asso-ciated with floating objects (LS) by the European and assimilated purse seinershaving operated in the Indian Ocean in 2014 based on the different data setsavailable
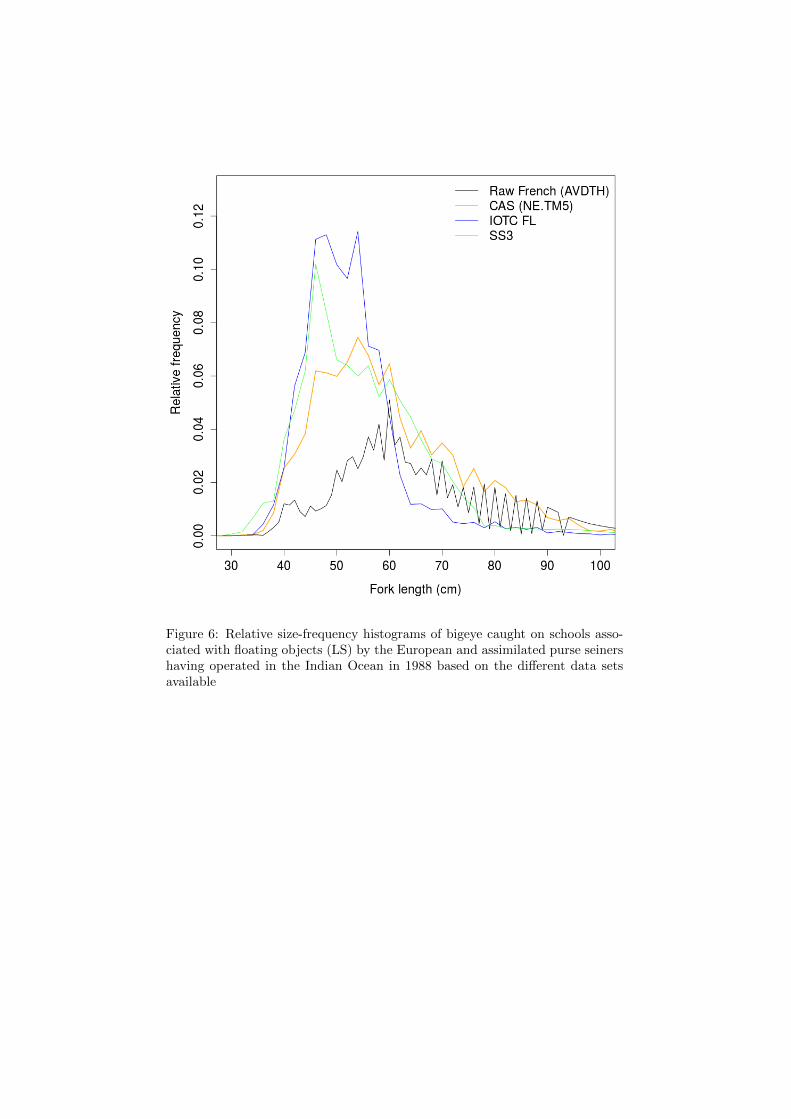
Figure 6: Relative size-frequency histograms of bigeye caught on schools asso-ciated with floating objects (LS) by the European and assimilated purse seinershaving operated in the Indian Ocean in 1988 based on the different data setsavailable


![Evolution of the scattering properties of phytoplankton cells …horizon.documentation.ird.fr/exl-doc/pleins_textes/divers17-09/... · [20] simulated the phytoplankton optical properties](https://img.pdfslide.us/doc/110x75/5aabe7dc7f8b9a8f498c8eb0/evolution-of-the-scattering-properties-of-phytoplankton-cells-20-simulated.jpg)
