Embed Size (px)
Citation preview

Improving the group's performance in nuclear and renewable energies
Luc Oursel, Chief Executive Officer
Pierre Aubouin, Chief Financial Executive Officer
Benjamin Fremaux, SEVP, Strategy, Mergers and Acquisitions, Secretary to
the Executive Board
Paris - December 13, 2011
AREVA Strategic Action Plan – 2012-2016 – December 13, 2011 – p.2
Contents
Introduction
AREVA believes in the future of nuclear and
renewable energies
AREVA is consolidating its leadership
AREVA is committed to improving its performance
Financial outlook
Conclusion

AREVA Strategic Action Plan – 2012-2016 – December 13, 2011 – p.3
Introduction
In the years 2000, AREVA launched an ambitious capital spending
program to:
Ensure the sustainability and develop all its activities
Meet its customers’ needs
Implement and promote the highest safety and security standards
Energy market forecasts are subject to questions in the aftermath of the
Fukushima accident and the financial crisis
Share of nuclear power in the energy mix and timing of ramp-up
Pace of growth in renewable energies
In this environment, AREVA launched a comprehensive review of all its
activities, their outlook and corresponding resource needs
Five-month process since the designation of the new Executive Board
Review of the strategy for the 2012-2016 period
Safety and security remain our absolute priorities

AREVA Strategic Action Plan – 2012-2016 – December 13, 2011 – p.4
Economic performance 2007-2011
Decrease in EBITDA over the period
10 billion-euro capital spending program over the period*
33% financed internally by operations
Balance financed through a significant asset disposal program, a share
capital increase and debt increase
Free operating cash flow has been negative since 2006
*Excluding the acquisition of AREVA NP shares

AREVA Strategic Action Plan – 2012-2016 – December 13, 2011 – p.5
Financial outlook 2011
Revenue
EBITDA
Free operating
cash flow
Provisions identified for fiscal year
ended December 31, 2011
Operating income between
-€1.4bn and -€1.6bn
> €8.9bn
> €890m
> -€2.9bn
> €240m *Excl. Siemens effects
> -€1.8bn **Excl. Siemens effects
€1.46bn impairment of mining assets
related to UraMin acquisition in 2007
€800m of provisions for contingencies
and expenses likely to result in future
cash outflows (including €150m related
to the OL3 project)
€100m of impairment of non-current
assets related to industrial facilities
(capacity utilization outlook revised
downwards)
Constant consolidation scope
* €648m penalty from Siemens
** €648m penalty from Siemens and acquisition of AREVA NP shares for €1,679m
Backlog c. €44bn

AREVA Strategic Action Plan – 2012-2016 – December 13, 2011 – p.6
Impairment of mining assets stemming from UraMin acquisition
Evolution of the impairment tests’
hypotheses since June 30, 2011
Unfavourable revision of (i) the level of deposit’s
resources of Trekkopje from 46,2 ktU to 26,0 ktU
and (ii) the cost production assumptions, following
interpretation of conducted technical analysis
Adjustments of the offer-demand balance and
downwards evolution of future price expectations
on natural uranium market and decision to
postpone the start of 3 mining production projects
stemming from the acquisition of UraMin
(Trekkopje, Bakouma and Ryst Kuil)
Revision of the production plan of those projects
on the basis of above elements
Provisions identified for the year ended December 31, 2011: €1.46bn
additional impairment of the property, plant and equipment and
intangible assets capitalized for mining projects stemming from the
UraMin acquisition in 2007 (Trekkopje, Bakouma, Ryst Kuil) bringing the
net carrying amount of capitalized assets to €410m
Reminder
€426m impairment booked in 2010
Reference in the Notes to the
consolidated financial statements for
the year ended December 31, 2010
and for the half-year ended
June 30, 2011 to deposit’s resources
of Trekkopje
Interpretation of the analyses results
on Trekkopje in progress as of the
date of the closing of June 30, 2011

AREVA Strategic Action Plan – 2012-2016 – December 13, 2011 – p.7
Contents
Introduction
AREVA believes in the future of nuclear and
renewable energies
AREVA is consolidating its leadership
AREVA is committed to improving its performance
Financial outlook
Conclusion

AREVA Strategic Action Plan – 2012-2016 – December 13, 2011 – p.8
Energy market: continued growth announced
Geopolitics Resources Environment
Limitation of fossil
resources
20501990 2010 2030
Barils
GHG emissions cut
by half by 2050
20501990 2010 2030
BUSINESS
AS USUAL
450ppm
SCENARIO
tCO2
0
25
50
75
100
$2011/barrel of oil
1990 1970
Economics Macroeconomics
Energy demand
multiplied by 2
by 2050
20501990 2010 2030
BUSINESS
AS USUAL
tep
20501990 2010 2030
BUSINESS
AS USUAL
tep
2010
0
25
50
75
100
125
150
175
+70% +60%
Reference
case
+6%
Fuel
price
x2
CO2 price
x2
Nat. gas
CCGT Nuclear Coal
Source: IEA ETP: reference scenario 2010 - UNFCC, CERA 2009
Production in barrels of oil
* Billions of toe
Demand in nuclear energy*
Demand in renewable energies*
+2.1% / year
+2.5% / year 20
11
WE
O
2009 –
2035
Scen
ari
o Global primary demand in energy* +1.3% / year
Ineluctable decline of
fossile resources +
pressure on prices
GHG emissions: goal= 50%
reduction by 2050
Energy independance and
security of supply
Energy cost, stability,
predictability
Energy demand:
x2 by 2050

AREVA Strategic Action Plan – 2012-2016 – December 13, 2011 – p.9
Major nuclear programs are confirmed
Gradual phase out of nuclear and / or plants shut down New builds program frozen / halted
Program for new nuclear reactors abandoned Nuclear programs / projects confirmed
AREVA Strategic Action Plan – 2012-2016 – December 13, 2011 – p.10
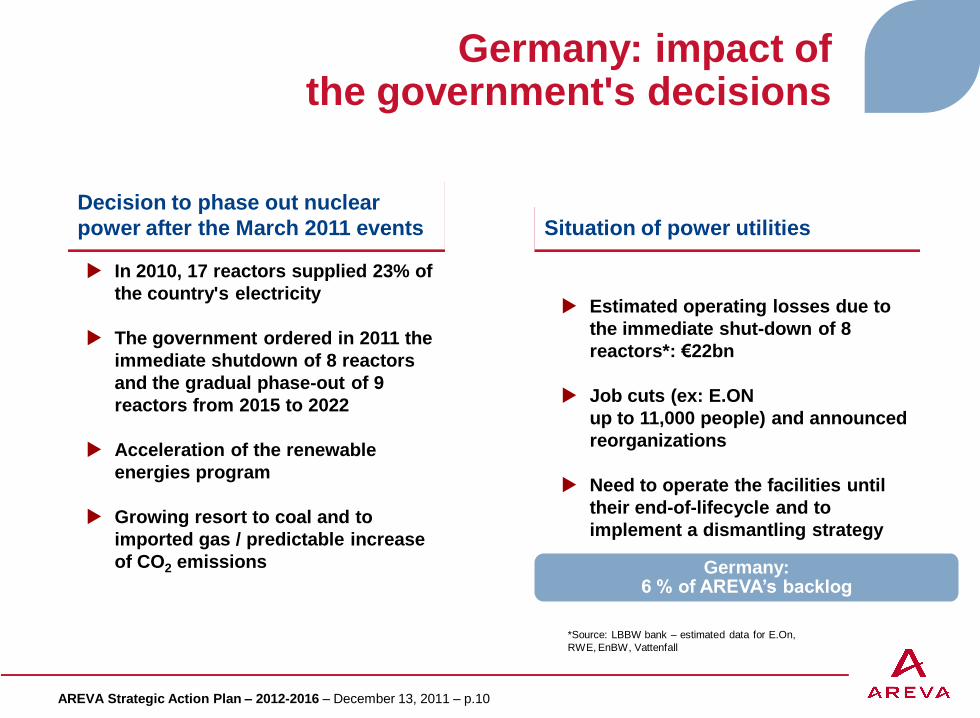
Germany: impact of the government's decisions
In 2010, 17 reactors supplied 23% of
the country's electricity
The government ordered in 2011 the
immediate shutdown of 8 reactors
and the gradual phase-out of 9
reactors from 2015 to 2022
Acceleration of the renewable
energies program
Growing resort to coal and to
imported gas / predictable increase
of CO2 emissions
Estimated operating losses due to
the immediate shut-down of 8
reactors*: €22bn
Job cuts (ex: E.ON
up to 11,000 people) and announced
reorganizations
Need to operate the facilities until
their end-of-lifecycle and to
implement a dismantling strategy
*Source: LBBW bank – estimated data for E.On,
RWE, EnBW, Vattenfall
Decision to phase out nuclear
power after the March 2011 events Situation of power utilities
Germany: 6 % of AREVA’s backlog

AREVA Strategic Action Plan – 2012-2016 – December 13, 2011 – p.11
Update on Japan situation
Japan: 12 % of AREVA’s backlog
Extremely complex and costly
electrical supply
45 reactors shut down
Construction for 2 reactors stopped
Debate on energy policy should confirm
nuclear program
Complementary safety tests:
prerequisits to the restart of reactors in
second half of 2012
Update on Fukushima-Daiichi situation:
after the exit of the emergency phase,
decontamination of the site
Situation as of December 12, 2011 2012 outlook

Plan d’Action Stratégique AREVA – 2012-2016 – 13 décembre 2011 – p.12
Nuclear scenario: installed capacity growth will be delayed
0
150
300
450
600
350
500
650
2010
2012
2014
2016
2018
2020
2022
2024
2026
2028
2030
2030 New builds Life
extensions
Plants shut
down
2010
583
378
Growth in installed capacity:
+2.2% per year on average until 2030
AREVA 2011 scenario (GWe) Change in global installed base (GWe)
304
159
AREVA
2010
scenario (262) 190 393 659
AREVA
2010 scenario
AREVA
2011 scenario
Reassessed as of end June 2011
New builds
projects are
postponed
(258)
Incl. 60%
in Asia
Plan d’Action Stratégique AREVA – 2012-2016 – 13 décembre 2011 – p.13
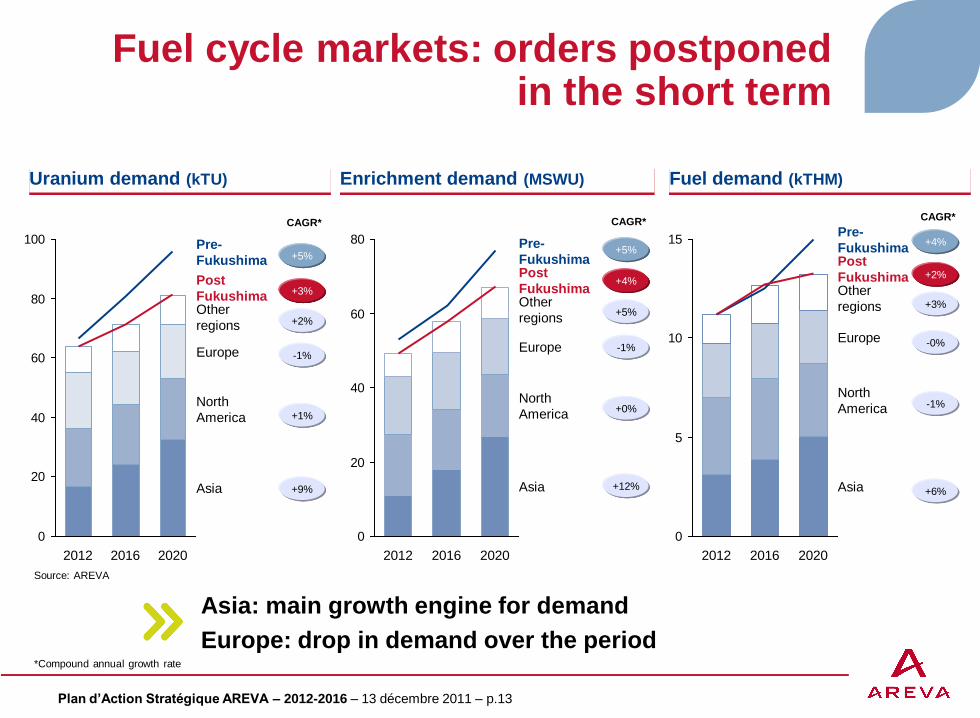
Fuel cycle markets: orders postponed in the short term
Uranium demand (kTU) Enrichment demand (MSWU) Fuel demand (kTHM)
0
20
40
60
80
Post
Fukushima
Asia
North
America
Europe
Other
regions
Pre-
Fukushima
2020 2016 2012
0
5
10
15
2012 2016 2020
Post
Fukushima
Pre-
Fukushima
Asia
Other
regions
Europe
North
America
0
20
40
60
80
100
Other
regions
Asia
North
America
Europe
2012 2016 2020
Pre-
Fukushima
Post
Fukushima
Asia: main growth engine for demand
Europe: drop in demand over the period
+5%
+2%
-1%
+1%
+9%
+3%
+5%
+5%
-1%
+0%
+12%
+4%
+4%
+3%
-0%
-1%
+6%
+2%
CAGR* CAGR* CAGR*
*Compound annual growth rate
Source: AREVA

Plan d’Action Stratégique AREVA – 2012-2016 – 13 décembre 2011 – p.14
Used fuel management: a growing market
Used fuel unloaded by region
(MTHM/year)
Used fuel inventories by region
(MTHM)
Recycling or dry storage solutions are needed to reduce the level of
used fuel inventories in pools
+3%*
Africa
Asia
Latin America
CIS
Europe
United States
2021
234,600
1,300
58,700
1,800 23,700
54,600
94,500
2011
171,932
900
35,000
1,114 15,080
47,450
72,388
613
+3%*
Asie
Latin America
CIS
Europe
United States
2021
8,900
3,200
100
1,000
2,300
2,300
2011
6,456
1,226
60
2,368
2,189
Source: AREVA
* Compound annual growth rate

AREVA Strategic Action Plan – 2012-2016 – December 13, 2011 – p.15
Accelerated growth in renewable energies
Offshore wind market will focus on the UK,
Germany and France
0.3
0.7
0.90.7
1.01.01.01.0
0.91.0
0.20.2
0.8
0.9 0.9 0.9
0.6
1.0
1.0
1.01.1
1.3
1.41.7 1.7
0
2
4
6
17
4.7
1.6
16
3.6
1.4
15
3.4
1.2
14
2.8
0.9
2020
5.4
1.8
19
5.4
1.8
18
5.1
1.8
0.0
13
2.5
0.8
0.0
12
2.0
0.7
0.0
2011
0.9
0.6
UK
Germany
France
Europe - others
Annual addition to the installed base in
Europe 2011-2020 (GW) – Reference scenario
An average of 3.6GW installed in
Europe per year from 2011 to 2020
Reference scenario: 30GW installed
worldwide by 2020
Global accessible market for concentrated solar
could reach up to 30GW by 2020
Installed capacity (GW)
2020
4.0
2.3
2015 In operation
Europe
United States
India
Middle East
Australia
South Africa
North Africa
China
South America
5.83.5
3.4
3.1
5.8
2.0
0
5
10
15
20
25
30
35
30.5
4.0
2.3 0.7
9.4
1.0
4.0
2.5
Source: Boston Consulting Group

AREVA Strategic Action Plan – 2012-2016 – December 13, 2011 – p.16
Contents
Introduction
AREVA believes in the future of nuclear and
renewable energies
AREVA is consolidating its leadership
AREVA is committed to improving its performance
Financial outlook
Conclusion

AREVA Strategic Action Plan – 2012-2016 – December 13, 2011 – p.17
Safety: the linchpin of AREVA's development
Providing support to utilities: demonstrating and strengthening the safety of their facilities
A portofolio of Gen III+ reactors with the
highest standards of safety
Safety of our products Safety of our customers Safety of our operations
Maintaining the highest level
of safety throughout the
lifecycle of its nuclear
facilities

AREVA Strategic Action Plan – 2012-2016 – December 13, 2011 – p.18
A portfolio of solutions to ensure nuclear safety
► Analysis of Fukushima accident
► Safety engineering expertise
► Global footprint supporting utilities during stress tests
► Experience with all reactor models
► Managing major risks
► Resilience of cooling systems
► Preventing environmental damage
A portfolio of 30+ safety solutions
Recognized expertise (examples)
AREVA leadership
Safety objectives
► Safety analysis (reassessment of safety margins in case of earthquake or flooding)
► Safety upgrades (cooling systems, hydrgen recombiners, containment filtered venting systems)
► Safety procedures (severe accident management guidelines)
► CNNC (China): analysis services and support for safety testing
► Japanese utilities: sale of hydrogen recombiners
► US utility : safety analysis (earthquakes, flooding)

AREVA Strategic Action Plan – 2012-2016 – December 13, 2011 – p.19
Reducing the risk of a serious accident
with core melt
Ability to withstand an airplane crash
No impact on local populations near
the site in the event of a serious
accident
Ability to withstand exceptional
accidents and natural events
Designed to benefit from nuclear accident lessons, they would have
resisted Fukushima
External shell
Earthquake proof
Doors able to withstand explosions and flooding
External containment protecting critical buildings
Independent cooling trains + physical separation
Emergency diesel generators in two different
buildings
Core catcher: to collect the corium
EPR and ATMEA: designed to meet the most demanding nuclear and industrial safety standards
Safeguard
division
APC shell
Fuel pool
1
2
3 4
AREVA Strategic Action Plan – 2012-2016 – December 13, 2011 – p.20
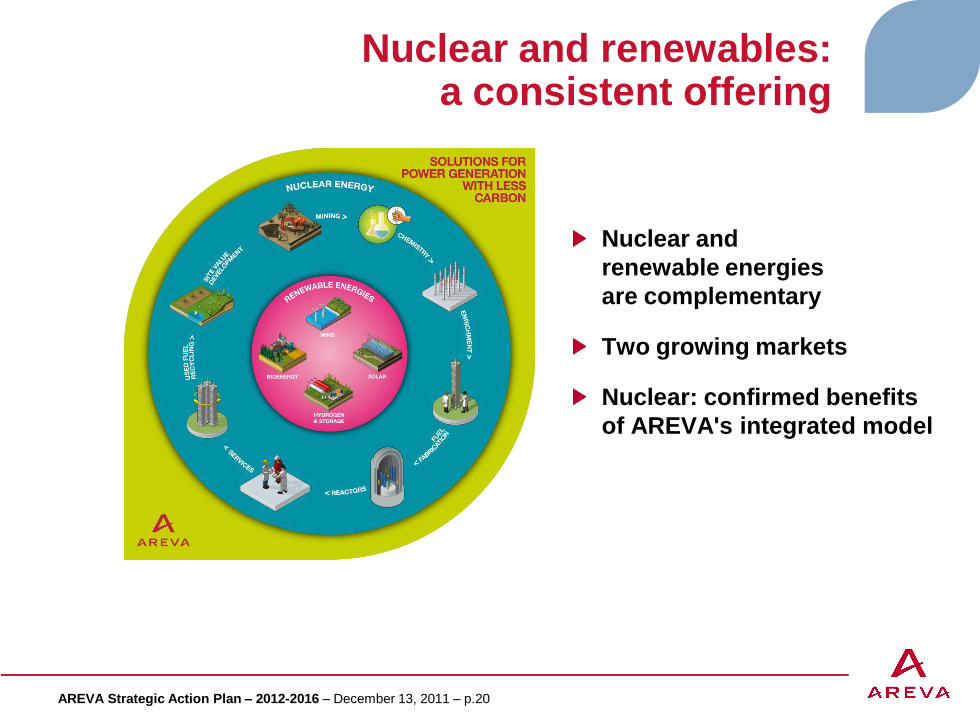
Nuclear and renewables: a consistent offering
Nuclear and
renewable energies
are complementary
Two growing markets
Nuclear: confirmed benefits
of AREVA's integrated model

AREVA Strategic Action Plan – 2012-2016 – December 13, 2011 – p.21
Backlog as of end
September 2011
Orders: 5 years of revenue in backlog
€43bn in backlog in
all AREVA group
business lines
More than 50% of our
2012-2015 revenue is
in backlog
€2bn
Mining €10bn 9.5 years
€18bn 6.5 years
€7bn 2 years
€6bn 3.5 years
Renouvelables
Front End
Reactors
& Services
Back End
Renewables
Value Number of years of 2010
revenue in backlog

AREVA Strategic Action Plan – 2012-2016 – December 13, 2011 – p.22
0
1 000
2 000
3 000
4 000
5 000
6 000
7 000
8 000
9 000
10 000
2005 2006 2007 2008 2009 2010
Revenue from Recurring operations vs. New builds (€m)
Over 80% of AREVA’s revenues stem from
recurring operations generated by existing reactors
Recurring operations: a robust foundation
Recurring operations
New builds

AREVA Strategic Action Plan – 2012-2016 – December 13, 2011 – p.23
Integrated business model: an engine for growth
With a 2.2% annual growth rate by 2030, activities related to the operating of
reactors offer significant growth potential
Installed base
New builds
Opportunities along the whole lifecycle of reactors
Construction Life extension Reactor
shutdown
Back-End R&S
R&S
Reactor lifecycle
AREVA’s
activities
Operation
Mining,
Front-End
R&S
Back-End

AREVA Strategic Action Plan – 2012-2016 – December 13, 2011 – p.24
95% of all nuclear utilities are AREVA customers
AREVA provides services to 360 reactors worldwide
~130 reactors
126 for services
100 for fuel
North and
South America
~140 reactors
114 for services
135 for fuel
Europe, CIS and Africa
~90 reactors
17 for services
90 for fuel
Asia
AREVA Strategic Action Plan – 2012-2016 – December 13, 2011 – p.25
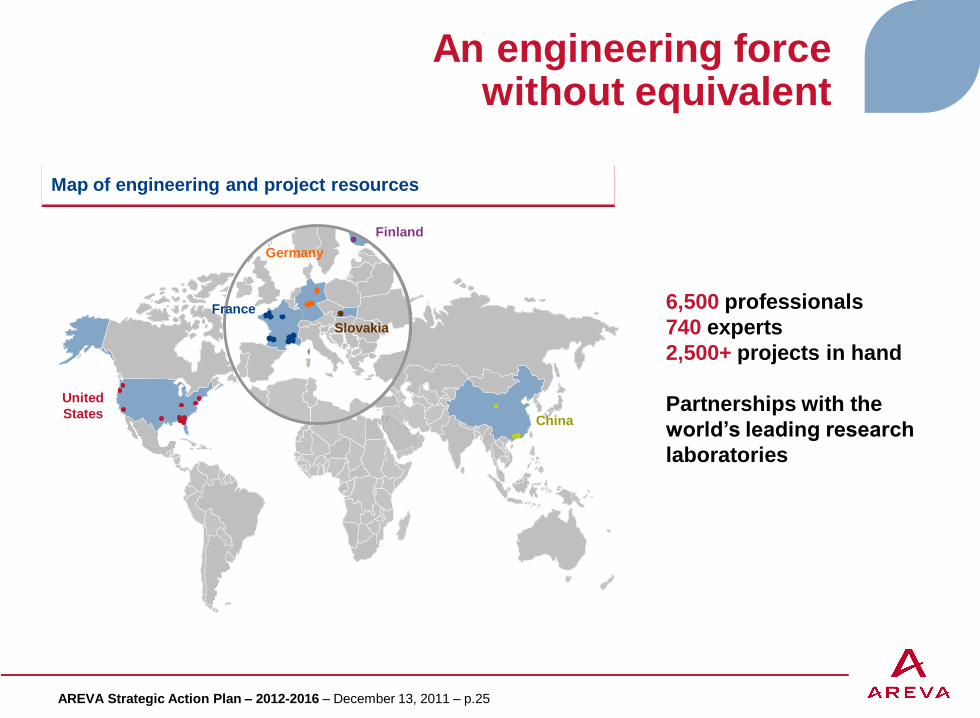
An engineering force without equivalent
6,500 professionals
740 experts
2,500+ projects in hand
Partnerships with the
world’s leading research
laboratories
Map of engineering and project resources
United
States China
France
Germany
Slovakia
Finland

AREVA Strategic Action Plan – 2012-2016 – December 13, 2011 – p.26
Investments for our customers’ benefit
Capital expenditure in Renewables
Capital expenditure in the fuel cycle
(Mining/Front End/Back End)
Development of a diversified portfolio
of projects to secure uranium resources
Replacement and improvement of production facilities
Deployment of the most advanced technologies
Expansion of the offering and optimization of nuclear fuel
Building of a portfolio of renewable energy solutions
through targeted acquisitions
Capacity development and industrialization
of existing activities
Gross capital expenditure, 2007-2011*
Total: about €10bn
(incl. about €2bn for safety, security,
maintenance)
Capital expenditure in Reactors & Services
Design and certification of Gen III+ reactors
Optimization of component manufacturing facilities
~40%
~5%
~5%
~15%
~30%
Mining
Front End
Reactors
& Services
Back End
Renewables Other
*Excl. acquisition of AREVA NP shares

AREVA Strategic Action Plan – 2012-2016 – December 13, 2011 – p.27
Front end of the cycle: guaranteed security of supply
More than 200,000 MTU delivered to date
A diversified mining platform (geographic distribution,
technologies, development stage)
A dynamic exploration policy
More than 40 years of industrial experience
and more than 360,000 MTU delivered to date
Comurhex II: a new conversion facility
End 2010: first production at the Georges Besse II
enrichment plant
Best centrifugation technology in the world (ETC)
More than 35 years of experience in boiling water reactors
(BWR) and pressurized water reactors (PWR)
More than 135 reactors worldwide use AREVA's fuel
products
Mining
Conversion
Enrichment
Fuel
AREVA Strategic Action Plan – 2012-2016 – December 13, 2011 – p.28
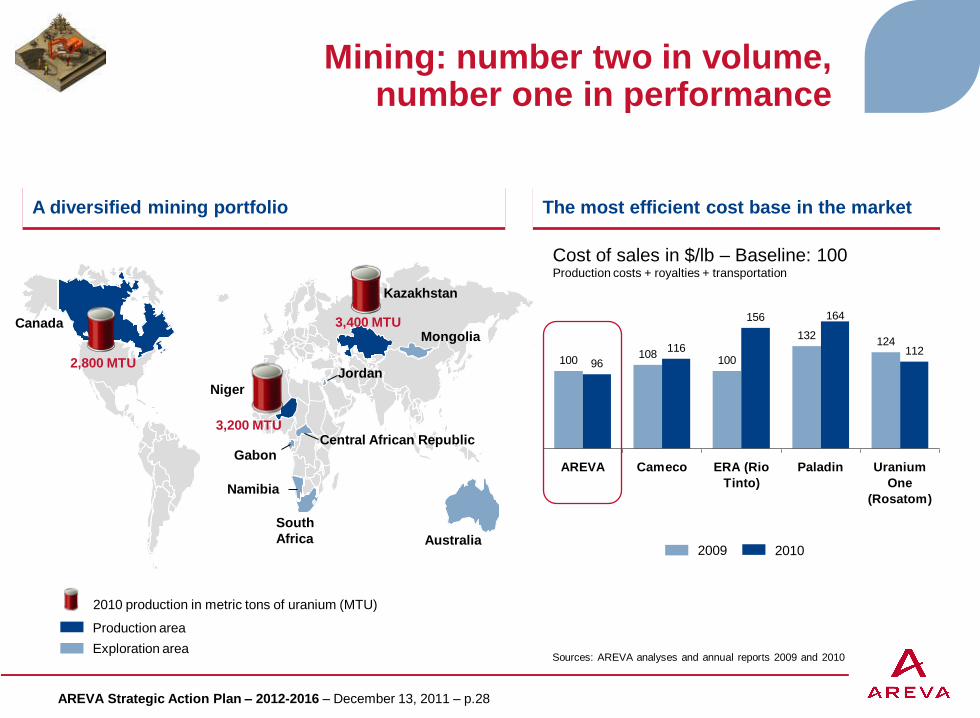
Mining: number two in volume, number one in performance
Namibia
Kazakhstan
Mongolia
Niger
3,400 MTU
Production area
Exploration area
2010 production in metric tons of uranium (MTU)
Australia
Canada
3,200 MTU Central African Republic
Jordan
South
Africa
Gabon
2,800 MTU 100108
100
132124
116
156 164
11296
AREVA Cameco ERA (Rio
Tinto)
Paladin Uranium
One
(Rosatom)
Cost of sales in $/lb – Baseline: 100 Production costs + royalties + transportation
The most efficient cost base in the market A diversified mining portfolio
Sources: AREVA analyses and annual reports 2009 and 2010
2010 2009

AREVA Strategic Action Plan – 2012-2016 – December 13, 2011 – p.29
Global leadership for the construction of Gen III+ reactors
Olkiluoto 3 82% complete
(Supply of a turnkey power plant)
Percentage of completion in %
(AREVA scope)
Flamanville 3
Taishan 1 & 2
56% complete
(Supply of a Nuclear Steam
Supply System)
63% complete
(Supply of 2 nuclear islands)
AREVA Strategic Action Plan – 2012-2016 – December 13, 2011 – p.30
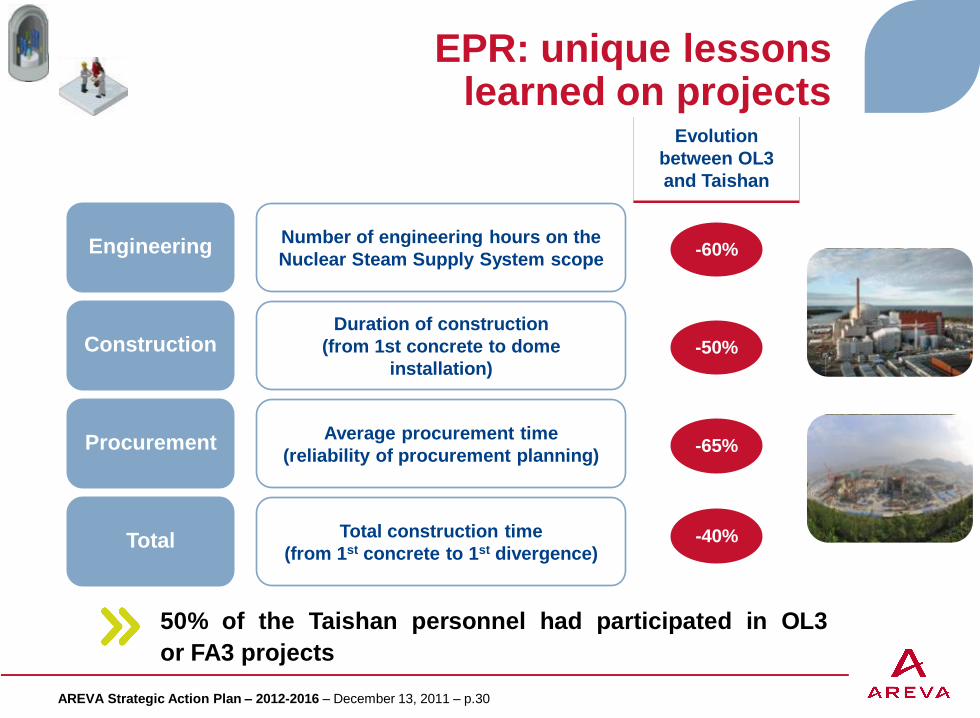
EPR: unique lessons learned on projects
Engineering
Construction
Procurement
Total Total construction time
(from 1st concrete to 1st divergence)
Average procurement time
(reliability of procurement planning)
Duration of construction
(from 1st concrete to dome
installation)
Number of engineering hours on the
Nuclear Steam Supply System scope
Evolution
between OL3
and Taishan
50% of the Taishan personnel had participated in OL3
or FA3 projects
-60%
-50%
-65%
-40%
AREVA Strategic Action Plan – 2012-2016 – December 13, 2011 – p.31
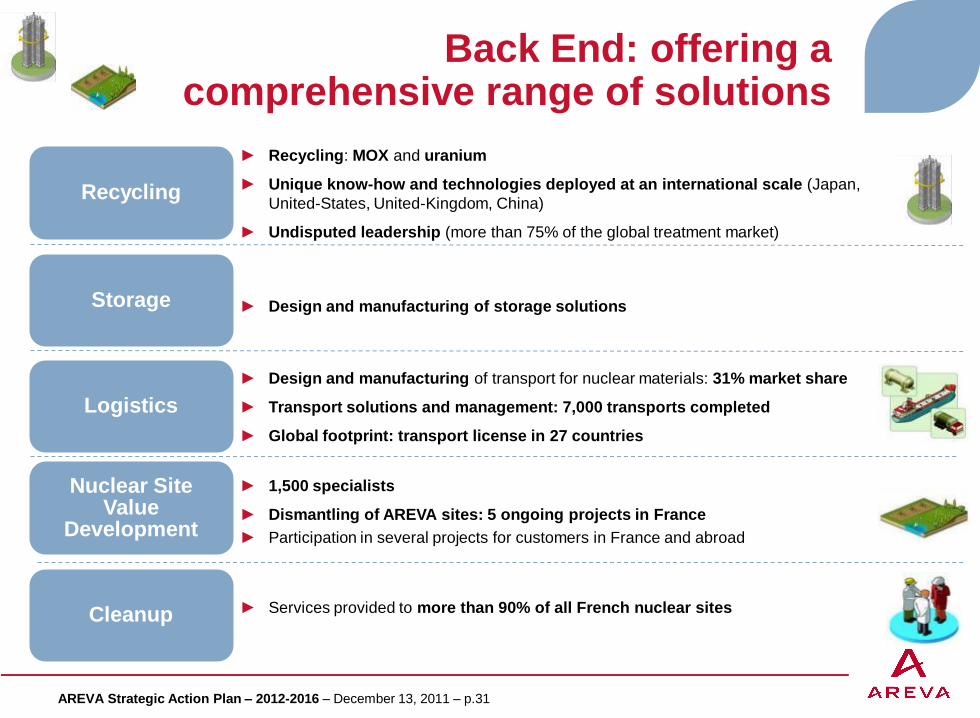
Back End: offering a comprehensive range of solutions
CLEAN UP
► Recycling: MOX and uranium
► Unique know-how and technologies deployed at an international scale (Japan,
United-States, United-Kingdom, China)
► Undisputed leadership (more than 75% of the global treatment market)
► 1,500 specialists
► Dismantling of AREVA sites: 5 ongoing projects in France
► Participation in several projects for customers in France and abroad
► Design and manufacturing of transport for nuclear materials: 31% market share
► Transport solutions and management: 7,000 transports completed
► Global footprint: transport license in 27 countries
► Services provided to more than 90% of all French nuclear sites
Recycling
Logistics
Nuclear Site Value
Development
Cleanup
► Design and manufacturing of storage solutions Storage

AREVA Strategic Action Plan – 2012-2016 – December 13, 2011 – p.32
Dismantling: broad expertise in managing customer projects
Dismantling of the reactor vessel and internals
Decontamination of primary and auxiliary circuits
Dismantling of the reactor vessel and internals
Support to the sodium retrieval and D&D preparation
High level waste treatment (customer: DOE)
Vitrification of high level waste (customer: DOE)
Special equipment to retrieve damaged fuel in research reactor
Design and implementation of a full water treatment system
D&D of a large fuel treatment facility (customer: CEA)
Member of the site's M&O consortium
Stade, Würgassen, Obrigheim
Millstone, Rancho Seco, Yankee Rowe
Creys-Superphénix
Hanford
Marcoule
Sellafield
Savannah
Dounreay
Fukushima
Reactor vessel / internals: decontamination and dismantling (D&D)
Used fuel, effluent / radioactive waste management
Assistance to the project owner / Design and engineering
M&O (maintenance and operations) for D&D projects
Creation of an expertise center for decommissioning and dismantling in Germany

AREVA Strategic Action Plan – 2012-2016 – December 13, 2011 – p.33
Renewable energies: a targeted offering
* Exclusive negotiations, not included in backlog as at the end of September 2011
A portfolio of technologies meeting
customer needs
Expertise demonstrated
in actual projects
Most powerful wind turbine in operation
(5MW)
Leader on the high-rated wind turbine
market
Investor confidence
Ramp-up of industrial production
100 plants in service worldwide
Installed base: almost 3 GW
Alpha Ventus (30 MW)
GT1 (400 MW)
Borkum West II (200 MW)
Exclusive ongoing negotiations
for several projects
Kogan Creek (44 MW
expansion)
Liddell (3 MWe)
Kimberlina (5 MWe)
Solar Dawn (250 MWe)*
Coriance (12 MWe)
Bertin (380 MWe)
Bolognesi Participacoes
(modernization, 330 MWe)
Offshore wind
Solar
(CSP)
Bio-energies
Fresnel technology adapted to arid areas
10-15% lower electricity cost than
parabolic trough technology

AREVA Strategic Action Plan – 2012-2016 – December 13, 2011 – p.34
Contents
Introduction
AREVA believes in the future of nuclear and
renewable energies
AREVA is consolidating its leadership
AREVA is committed to improving its performance
Financial outlook
Conclusion

AREVA Strategic Action Plan – 2012-2016 – December 13, 2011 – p.35
Improving our performance
Safety Security Transparency
Commercial
priority given
to value
creation
Selectivity
in
capital spending
Debt
management

AREVA Strategic Action Plan – 2012-2016 – December 13, 2011 – p.36
Strategic objectives by Business Group
Front End Reactors & Services Back End Renewables Mining
AREVA Strategic Action Plan – 2012-2016 – December 13, 2011 – p.37
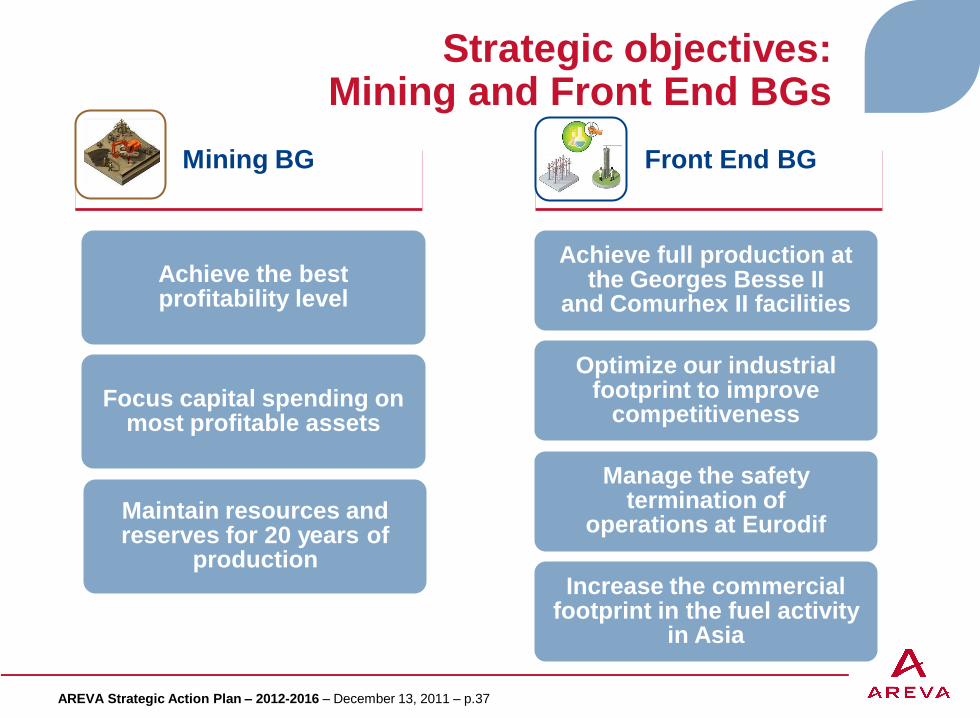
Strategic objectives: Mining and Front End BGs
Achieve the best profitability level
Focus capital spending on most profitable assets
Maintain resources and reserves for 20 years of
production
Mining BG
Front End BG
Achieve full production at the Georges Besse II
and Comurhex II facilities
Optimize our industrial footprint to improve
competitiveness
Manage the safety termination of
operations at Eurodif
Increase the commercial footprint in the fuel activity
in Asia

AREVA Strategic Action Plan – 2012-2016 – December 13, 2011 – p.38
Strategic objectives: Reactors & Services and Back End BGs
Continue to improve the competitiveness of the EPR
reactor and the qualification of the ATMEA reactor
Contribute to improved reactor safety and reactor life expansion projects for
existing reactors
Participate in growth in Asia
Prepare the technologies of the future
(SMR and Generation IV)
Back End BG
Ensure full usage production capacity at La Hague and
Melox
Participate in the development of the new regional recycling platforms (China, Japan, UK)
Capitalize on our unique experience in fuel cycle facility
and reactor dismantling
Expand our leadership in storage and logistics services
Reactors &
Services BG

AREVA Strategic Action Plan – 2012-2016 – December 13, 2011 – p.39
Strategic objectives: Renewable Energies BG
Refocus our business portfolio
Turn first projects into landmark contracts
Become a reference leader in offshore wind turbines in Europe (Germany, France, UK)
Become an reference leader in concentrated solar power in Asia and the Middle East
Renouvelables

AREVA Strategic Action Plan – 2012-2016 – December 13, 2011 – p.40
Improving our performance
Safety Security Transparency
Commercial
priority given
to value
creation
Debt
management
Selective
capital
expenditure

AREVA Strategic Action Plan – 2012-2016 – December 13, 2011 – p.41
Installed base: doubling profitability by 2016
► Reducing the volume of used fuel in the pools (recycling or dry storage)
► Improving pool safety
► Capturing 35% of the accessible market of post-Fukushima safety works (estimated at €3.5bn over 10 years)
Post-
Fukushima
safety
Recycling:
promoting
safer
management
approaches
for used fuel
Fuel
offering ► Expanding integrated offerings in the front end cycle
► Replacing primary components
► Installing digital I&C systems
Reactor
modernization/
life extension

AREVA Strategic Action Plan – 2012-2016 – December 13, 2011 – p.42
New nuclear plants: becoming the reference technology
Ongoing negotiations
(bilateral) Ongoing bids Bids to come (in 3-5 years)
Taishan 3-4
Jaitapur 1-2
Hinkley Point
C-D
Penly 3
Wylfa 3-4
Temelin 3-4
Calvert Cliff 3
Piketon
Bell Bend
Pyhäjoki
Saoudi Arabia
ESKOM
Delta
Vattenfall
PGE
TVO
GDF Suez – Iberdrola
Ameren
New Brunswick Power
Horizon
Nuclear Power
Fennovoima
CEZ
JAEC
CGNPC
NPCIL
EDF
EDF
EDF
PPL
Duke Energy

AREVA Strategic Action Plan – 2012-2016 – December 13, 2011 – p.43
Contract wins since Fukushima
Fuel cycle Reactors & Services Renewable Energies
►Uranium supply and conversion services for a European power company
► Supply of fuel assembly in Japan and in the US
► Supply of 32 steam generators to EDF for 1,300 MW reactors (€1.1bn) in France
► Upgrade of instrumentation and control systems for 20 EDF 1,300 MW reactors (€600m) in France
► Solutions provided to TVA to complete the Bellefonte plant in the US
► Supply of digital instrumentation & control systems for JNPC’s Tianwan 3&4 reactors (VVER type) in China
► Supply of services for electrical and I&C systems for Kozloduy 5&6 in Bulgaria
► Supply of forgings for EDF Energy Hinkley Point EPR in the UK
► Agreement with CNNC on safety checks post Fukushima in China
► Supply to TEPCO of a treatment-recycling solution for contaminated water at the Fukushima site in Japan
► Supply of dismantling services with the CEA for the Marcoule site over the 2011-2015 period in France
►Supply of dry storage casks for 2 European customers
► Construction of a biomass cogeneration plant for Coriance (€45m)
► Construction of a biomass cogeneration plant for Eneco (€155m)
► Selected to be involved in the part 1 of the “Solar Flagships” program in Australia (250 MW)
€5.6bn orders at the end of October, 2011

AREVA Strategic Action Plan – 2012-2016 – December 13, 2011 – p.44
Improving our performance
Safety Security Transparency
Commercial
priority given
to value
creation
Debt
management
Selective
capital
expenditure

AREVA Strategic Action Plan – 2012-2016 – December 13, 2011 – p.45
Investment program consistent with new market conditions
Safety
Maintenance
Priority strategic
investments
projects
Cigar Lake
Imouraren
Comurhex II (CXII)
Georges Besse II (GBII)
ATMEA
Renewables (c. €300m)
Investments projects on hold
given uncertainties
Capacity extensions
(GBII, CXII, Melox, La Hague)
Eagle Rock Enrichment Facility
Trekkopje, Bakouma, Ryst Kuil
Cumulative
2012-2016
Cumulative
2007-2011
c. €5.7bn
c. €2bn
c. €7.7bn c. €10bn
-34%
c. €1.6bn
Gross operating
Capex
Acquisition
of AREVA
NP shares

AREVA Strategic Action Plan – 2012-2016 – December 13, 2011 – p.46
Capital spending trend 2012-2016
Safety, security,
maintenance
Other
Gross operating Capex (€bn) Average per year
c €2.0bn c. €1.9bn
c. €1.3bn
No new significant Capex project launched
Significant decrease of the annual value of capital spending in 2014 with the completion of the Georges Besse II plant
Capex related to safety stable at €2bn over the period
* excluding the acquisition of AREVA NP shares
-32%
-5%
2007-2011* 2014-2016 2012-2013
Georges Besse II

AREVA Strategic Action Plan – 2012-2016 – December 13, 2011 – p.47
Improving our performance
Safety Security Transparency
Commercial
priority given
to value
creation
Debt
management
Selective
capital
expenditure

AREVA Strategic Action Plan – 2012-2016 – December 13, 2011 – p.48
Financial structure objectives
2012-2013:
Limited use
of external
financing Maintain an
appropriate
level of short-
term liquidity
Maintain a solid
financial
structure
2012-2016:
Fully self-finance
cumulative
Capex*
*vs 33% over 2007-2011 period

AREVA Strategic Action Plan – 2012-2016 – December 13, 2011 – p.49
A financing plan in line with the group's financial structure objectives
Plans for disposal / secondary
offering of equity interests
Plans for disposal of non-strategic
operations
Plans for disposal of minority
interests / partnerships in strategic
projects or operations
Long-term bond issue program
Cumulative objective 2012-2013
> €1.2bn
Capex fully funded from operations as from 2014

AREVA Strategic Action Plan – 2012-2016 – December 13, 2011 – p.50
Financing: favorable elements
No debt subject to covenants
No short-term debt roll-over: average debt maturity of 7.5 years
Long-term S&P rating: BBB+
Unused confirmed lines of credit in the amount of €3.5bn
Investment of surplus cash in highly liquid, risk-free short-term
instruments
Long-term investor confidence demonstrated by the success of
bond issues since 2009

AREVA Strategic Action Plan – 2012-2016 – December 13, 2011 – p.51
Improving our performance
Safety Security Transparency
Commercial
priority given
to value
creation
Selective
capital
expenditure
Debt
management
AREVA Strategic Action Plan – 2012-2016 – December 13, 2011 – p.52
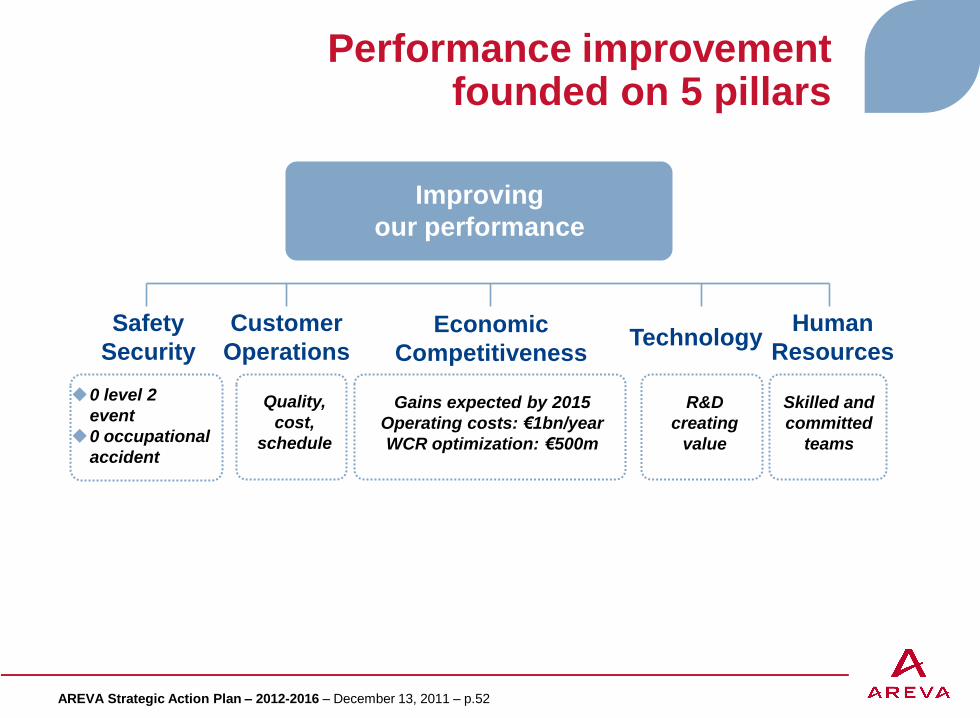
Performance improvement founded on 5 pillars
Improving
our performance
Safety
Security
Customer
Operations Technology
Human
Resources
0 level 2
event
0 occupational
accident
Quality,
cost,
schedule
Skilled and
committed
teams
R&D
creating
value
Economic
Competitiveness
Gains expected by 2015
Operating costs: €1bn/year
WCR optimization: €500m

AREVA Strategic Action Plan – 2012-2016 – December 13, 2011 – p.53
Safety and security above all
► Safety target
0 level 2 events on the INES scale from 2012
Promote improvement of reporting metrics: TPE
target at 0.12
► Security target
0 occupational accident
Frequency rate: 1.5 in 2013
► Maintain the target of dose reduction (number
of people over 14 mSv)
► Reinforce the confidence of external
stakeholders
Zero non-compliance to the regulation
Integral respect for commitments to the authorities
All the sites under the AREVA Safety Health
Security Environment standards by 2015
1.7
11 10
2.0
09
2.2
08
3.4
07
3.7
06
4.3
Frequency rate (number of accidents per
million hours worked )
Improvement of the safety / security indicators Ambition
Occupational safety Nuclear safety
► Level 2 incidents:
2 in 2009, 1 in 2010
► Taux de prévention des
événements (TPE*) :
0.18 in 2009
0.16 in 2010
0.16 in 2011
Benchmark (2010 data)
Occupational safety Nuclear safety
► TPE* EDF: 0.1 ► Renault: 2
► Lafarge: 1.57
► DuPont de Nemours: 0.7
*TPE = number of INES level 1 event / number of INES level 0 event

AREVA Strategic Action Plan – 2012-2016 – December 13, 2011 – p.54
Focus on economic competitiveness
► 300 documented and monitored initiatives
► Breakdown of operating costs and support
functions reduction
70% from gains on external expenses
30% from optimization of internal expenses
► 50 documented and monitored initiatives
► Simultaneous efforts concerning all components
of WCR
Reduction in inventories (notably GB1–GB2 transition)
Optimization of trade receivables and trade payables
Operating costs and support functions
-€1bn/year by 2015 (-10% reduction cost base)
Optimization of working capital requirement
€500m by 2015 (improvement > 15 days of revenue)

AREVA Strategic Action Plan – 2012-2016 – December 13, 2011 – p.55
€700m in operating cost savings on external expenses
Transition
GBI GBII
►Savings of €180m per year as from 2013 on energy consumption
thanks to GBII technology innovations
Subcontracting ►70% reduction in engineering subcontracting by 2013 for a rapid
adjustment of resources to lower business levels
Procurement
►Reduction in EPR cost baseline for future projects
►Procurement savings for ongoing projects and recurring business
Support functions
►Internalization of activities
►Reduction in IT costs
►Decrease in advertising and sponsorship budgets; reduction of
event costs

AREVA Strategic Action Plan – 2012-2016 – December 13, 2011 – p.56
€300m in operating cost savings on internal expenses
Compensation
Germany
France
Support functions
► Gathering the Parisian sites in La Défense under consideration
in 2012
► Bringing together management teams and industrial sites under
consideration
► Reduction in the costs/revenue ratio of 15% to 10% by 2015
► Hiring freeze
► Intention to reduce the workforce over the period from 1,200 to
1,500 people*
► Study of possible diversification of Duisburg production
► The Executive Board renounces 2011 bonus
► Intention to freeze salaries in 2012
United States ► Reducing the number of sites under consideration
► Expense reduction at head office
* including sub-contracting

AREVA Strategic Action Plan – 2012-2016 – December 13, 2011 – p.57
Performance improvement decisions taken since 2011 2nd half
Support functions and
external expenses
► Reduction in general & administrative, marketing & sales expenses as part of
CAP 2012: €200m in savings by the end of 2011, in line with the objectives –
acceleration over the 2nd half
► Contracts with external consultants interrupted, communication spending
reduced
Operational optimization
► Gradual phase-out of fuel manufacturing operations at the Dessel site in
Belgium
► Restructuring of the Biomass business in Brazil
► Establishment of a program for mobility towards Renewable energies BG
operations in Germany
► Establishment of a program for mobility from Saint-Marcel to Chalon Services
(150 people)
► Interruption of Comurhex production for a 2-month period over year-end 2011
Disposals ► Sale of SFAR-CIVAD
► Sale of 01DB Metravib
Crosscutting programs
► Simplification or elimination of indicators, reporting requirements and/or tools
for a dozen group programs
► "FOCUS" project to improve leadership of customer projects

AREVA Strategic Action Plan – 2012-2016 – December 13, 2011 – p.58
Human resources: developing the Group's talents
Training / knowledge transfer
Mobility
Skills / expertise
►Keeping 1.5 million hours of training per year (1 week per employee)
► Taking in 1,500 work/study positions in France in 2012
► Making professional and geographical mobility easier
► Developing AREVA METIERS
► Developing the expertise of the 5,100 engineers and 740 experts
► Strengthen knowledge transmission
Respectful and innovative social
dialogue
►Persevere in our commitment to a contractual policy
►Examples in 2011:
European agreement on management of professions
Mining BG becomes a subsidiary
Adaptation of operations at the sites
Culture of diversity and equal
opportunity
► Renewing the Diversity Label received in 2010
► More than 25% women in engineers and managers staffs
► 25% women in the executive committees
► Negotiating an agreement on quality of working life
► Increasing the employment rate of the disabled to 4% in 2012

AREVA Strategic Action Plan – 2012-2016 – December 13, 2011 – p.59
A performance plan managed and monitored
Safety
► Number of accidents (Frequency rate)
► Number of nuclear incidents
► Severity rate
► Radiation exposure
Financial
competitiveness
►Operating Cash Flow after investments
► Backlog margin
► Operating Income
► Opex savings
Operations &
Customers
►On-time delivery / BU
► Productivity / BU
► Costs of non-quality
► Orders in-take
► Customer satisfaction
Technology
► Added value: NPV of R&D portfolio
► Number of projects going to industrialization
► % of on time stage gate milestones
People
► People engagement survey
► Number of inter-BU mobility
► Talent development / Promotion
► Diversity index
Safety
Security
Economic
Competitiveness
Customer
Operations
Technology
Human
Resources Level 1 KPI Level 2 KPI
Pillars Key performance indicator

AREVA Strategic Action Plan – 2012-2016 – December 13, 2011 – p.60
Contents
Introduction
AREVA believes in the future of nuclear and
renewable energies
AREVA is consolidating its leadership
AREVA is committed to improving its performance
Financial outlook
Conclusion

AREVA Strategic Action Plan – 2012-2016 – December 13, 2011 – p.61
Financial outlook: two distinct phases
2012-2013
Transition period
2014-2016
Safe growth
and cash
generation

AREVA Strategic Action Plan – 2012-2016 – December 13, 2011 – p.62
2012-2013 Financial outlook
Revenue
EBITDA
Capex
Free operating
cash flow Excluding disposals
2012-2013
Nuclear: +3 to 6% p.a.
> €750m > €1.25bn
Renewables: > €750m*
€1.9bn p.a.
on average
Data at constant consolidation scope
> -€1.5bn Balanced
* vs €150m in 2010

AREVA Strategic Action Plan – 2012-2016 – December 13, 2011 – p.63
2015-2016 Financial outlook
Revenue
EBITDA
Capex
Free operating
cash flow excluding disposals
Data at constant consolidation scope
2012-2013 2015-2016
> -€1.5bn > +€1bn p.a.
from 2015
Nuclear: +3 to 6% p.a.
> €750m
€1.3bn p.a.
on average
on 2014-2016
> €1.25bn
Renewables: > €750m
Nuclear: +5 to 8% p.a.
Renewables: > €1.25bn
€1.9bn p.a.
on average
Balanced

AREVA Strategic Action Plan – 2012-2016 – December 13, 2011 – p.64
Dividend policy
Approved by the Supervisory Board on June 30, 2009
2012 and 2013 dividend (based on financial statements for
years ending December 31, 2011 and 2012) limited to 25% of
consolidated net income group share

AREVA Strategic Action Plan – 2012-2016 – December 13, 2011 – p.65
Conclusion
AREVA believes in the future of nuclear and
renewable energies
AREVA is consolidating its leadership
AREVA is committed to improving its performance

AREVA Strategic Action Plan – 2012-2016 – December 13, 2011 – p.66
Questions & Answers

AREVA Strategic Action Plan – 2012-2016 – December 13, 2011 – p.67