Embed Size (px)
Citation preview
Department of Mechanical and Aerospace Engineering
Improving the energy capture of solar collectors
[For cloudy regions by using controlled tracking system]
Author: Haytham Ayoub
Supervisor: Prof. Joe Clark
A thesis submitted in partial fulfilment for the requirement of the degree
Master of Science
Sustainable Engineering: Renewable Energy Systems and the Environment
2012

Improving the energy capture of solar collectors
Page 2 of 54
Copyright Declaration
This thesis is the result of the author’s original research. It has been composed by the author
and has not been previously submitted for examination which has led to the award of a
degree.
The copyright of this thesis belongs to the author under the terms of the United Kingdom
Copyright Acts as qualified by University of Strathclyde Regulation 3.50. Due
acknowledgement must always be made of the use of any material contained in, or derived
from, this thesis.
Signed: Haytham Ayoub Date: 05/09/2012
Improving the energy capture of solar collectors
Page 3 of 54
Abstract
This project investigated methods of harvesting solar radiation for a flat plate collector in
cloudy sky condition in order to optimize the energy capture of the systems in this condition,
and it proposed an improved method for irradiance optimization by using a controlled
tracking system. It includes the development of a simulation model that built in ESP-r
software which analysed the performance of the collector at different configuration in a
chosen location in Glasgow which is assumed to be a cloudy region. The project has
improved the performance of solar tracking devices in these regions. It is a common
knowledge that the traditional 2-axis solar tracking system tracks the beam radiation during
the day and it improves the capture efficiency by around 30 to 50% versus a system with
optimum fixed tilt, this is effective in clear sky conditions only, because the beam component
contributes by around 90% of the global radiation and only 10% for diffuse in that conditions.
However, the study showed that, when considering a collector in cloudy conditions where the
diffuse component contributes by a significant amount to the global radiation, the use of solar
collector decrease the energy capture by 23%, thus because of the shortcoming of capturing
most of the valuable diffuse radiation. When the collector was on the optimum fixed tilt mode
the capture efficiency was the highest at 84%, and when mounting the collector horizontally
the efficiency decreased but it captured all the available diffuse radiation. This observation
lead to an improved control system which uses a simple algorithm to manage the settings of
the collector instantaneously according to different conditions, in which a collector would
track the beam directly during clear periods to collect most of the beam radiation, go to the
optimum fixed tilt mode when the sky is partially cloudy to collect most of both radiation,
and go to the horizontal mode when it is totally cloudy to collect all the diffuse ones. The
paper investigated different approaches and after several attempts it has been found that, the
controlled tracking system would increase the capture efficiency by 11% versus a model with
optimum fixed tilt. The system can be applied by using sensors to measure the beam and
diffuse radiation, controlled system with the suggested algorithm, sun-pointing programme to
track the sun when needed and a step motor to rotate the collector. The project also showed
that, although the initial cost of the tracking system is higher than fixed one but it would be
attractive for investors since it has a slightly less payback period and with higher energy
value. And in terms of energy, it has been found that the use of any other system would lead
to exergy destroy.

Improving the energy capture of solar collectors
Page 4 of 54
Acknowledgment
This research project would not have been possible without the support of many people.
Therefore, I would like to take this opportunity to thank everyone who has supported me
during the period of my degree work to make this project comes into being.
First and foremost, I would like to thank the staff members of the Department of Mechanical
and Aerospace Engineering for their efforts during the course. I wish to express my sincere
gratitude to my supervisor Prof. Joe Clarke who was abundantly helpful and offered
invaluable assistance, support and guidance. Deepest gratitude are also due to Doc. Paul
Strachan for his valuable advices and works to make this course well organized. Besides, I
wish to express my gratitude to the other staff members who rendered their help during the
period and provided a very flexible environment. Also an honourable mention goes to my
family for their understandings and supports on me in completing this project. And at last but
not least, I wish to avail myself of this opportunity, express a sense of gratitude to all of my
colleagues and friends that I meet during the year and who shared with me the experience. To
Chris McGee for proofreading this paper, Will Laird for giving me some ideas and a special
thank you to Mr. Jack Maitles for his ultimate encouragement during the year.
Improving the energy capture of solar collectors
Page 5 of 54
Table of Contents
List of Figures ........................................................................................................................... 7
List of Tables ............................................................................................................................. 8
List of Equations ....................................................................................................................... 9
1. Introduction ...................................................................................................................... 10
2. Literature review .............................................................................................................. 13
3. Overview on solar radiation ............................................................................................. 17
3.1. Radiation from the sun .............................................................................................. 17
3.2. Daily insulation, latitude and season change ............................................................ 18
3.3. Sun positions ............................................................................................................. 19
3.4. Solar irradiance on tilted surfaces ............................................................................. 20
3.5. Horizontal surfaces .................................................................................................... 21
3.6. Fixed tilted surfaces .................................................................................................. 21
3.7. 2 axis – Direct Solar Tracking (DST) ....................................................................... 22
4. Review of optimizing energy capture .............................................................................. 23
4.1. Solar resource assessment ......................................................................................... 23
4.2. Current methods of energy capture ........................................................................... 24
5. Experimental procedure ................................................................................................... 28
5.1. Model description ...................................................................................................... 29
5.2. Resources assessment ................................................................................................ 29
5.3. Results ....................................................................................................................... 31
5.3.1. Approach one – Horizontal configuration (h) .................................................... 31
5.3.2. Approach two – Optimum Fixed Tilt (OFT) ..................................................... 31
5.3.3. Approach three – Direct Solar Tracking (DST) 2-axis system .......................... 32
5.3.4. Approach four – Monthly Tilt Modification (MTM) ........................................ 33
5.3.5. Approach five – Controlled Solar Tracking (CST) 2-axis system ..................... 34
6. Discussion ........................................................................................................................ 35
6.1. Implementing the CST system .................................................................................. 40
6.2. Financial analysis ...................................................................................................... 40
6.3. Energy analysis ......................................................................................................... 42
7. Conclusion ....................................................................................................................... 44
8. Further research ............................................................................................................... 46
8.1. Embodiments of controlled solar tracking system .................................................... 46

Improving the energy capture of solar collectors
Page 6 of 54
8.2. Algorithm improvement ............................................................................................ 46
8.3. Balance of plant for solar farms with solar tracking system ..................................... 46
Appendix A .............................................................................................................................. 50
Appendix B .............................................................................................................................. 51
Appendix D .............................................................................................................................. 53
Appendix E .............................................................................................................................. 54
Improving the energy capture of solar collectors
Page 7 of 54
List of Figures
Figure 1: Change of extraterrestrial solar radiation in a year. ................................................. 18
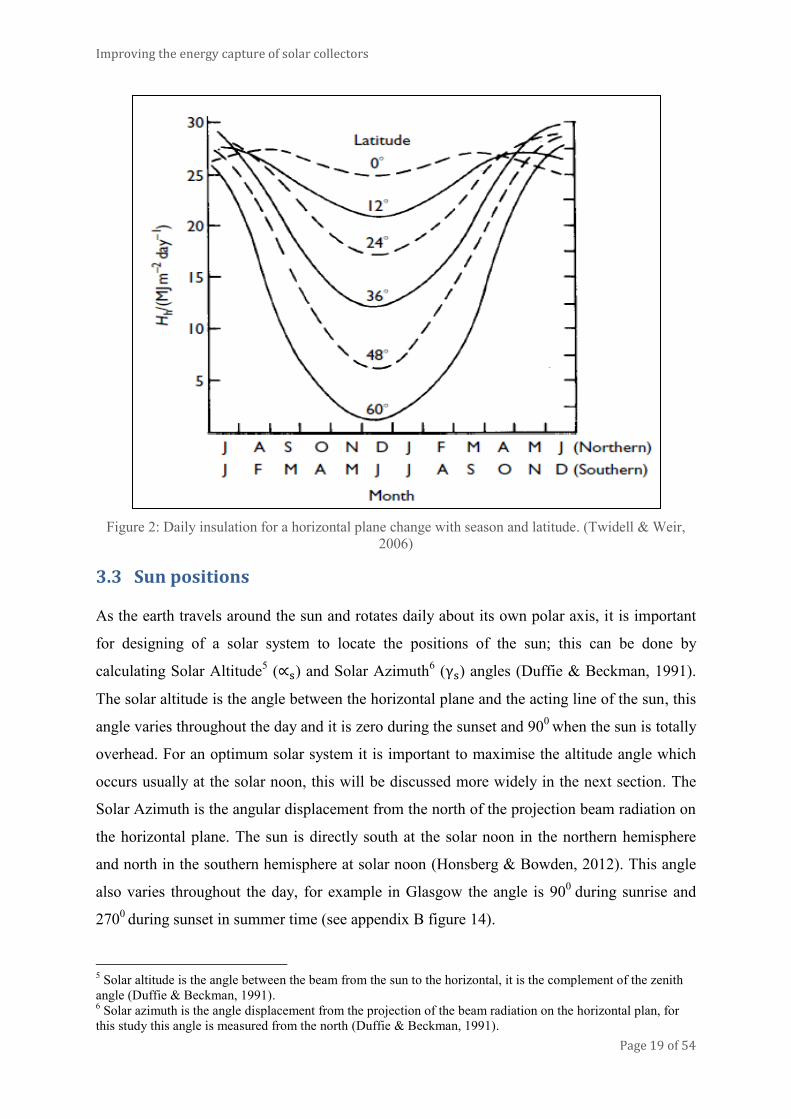
Figure 2: Daily insulation for a horizontal plane change with season and latitude. (Twidell &
Weir, 2006) .............................................................................................................................. 19
Figure 3: Insulation change with the tilt angle change all over the year for location 450
N
latitude (Twidell & Weir, 2006). ............................................................................................. 22
Figure 4: Tilt angle optimization of a collector (Messenger & Ventre, 2012) ........................ 25
Figure 5: Annual mean irradiance on tilted surfaces. Data for Edinburgh (1981-1992)(CIBSE,
2002). ....................................................................................................................................... 26
Figure 6: Model developed by ESP-r software. ....................................................................... 28
Figure 7: Monthly available direct normal and diffuse horizontal. ........................................ 29
Figure 8: Hourly direct normal and diffuse horizontal at the 7th of May................................ 30
Figure 9: Change of the tilt angle, during the 7th
of May. ....................................................... 37
Figure 10: Ineffectiveness of the DST system. For the 7th
of May. ......................................... 37
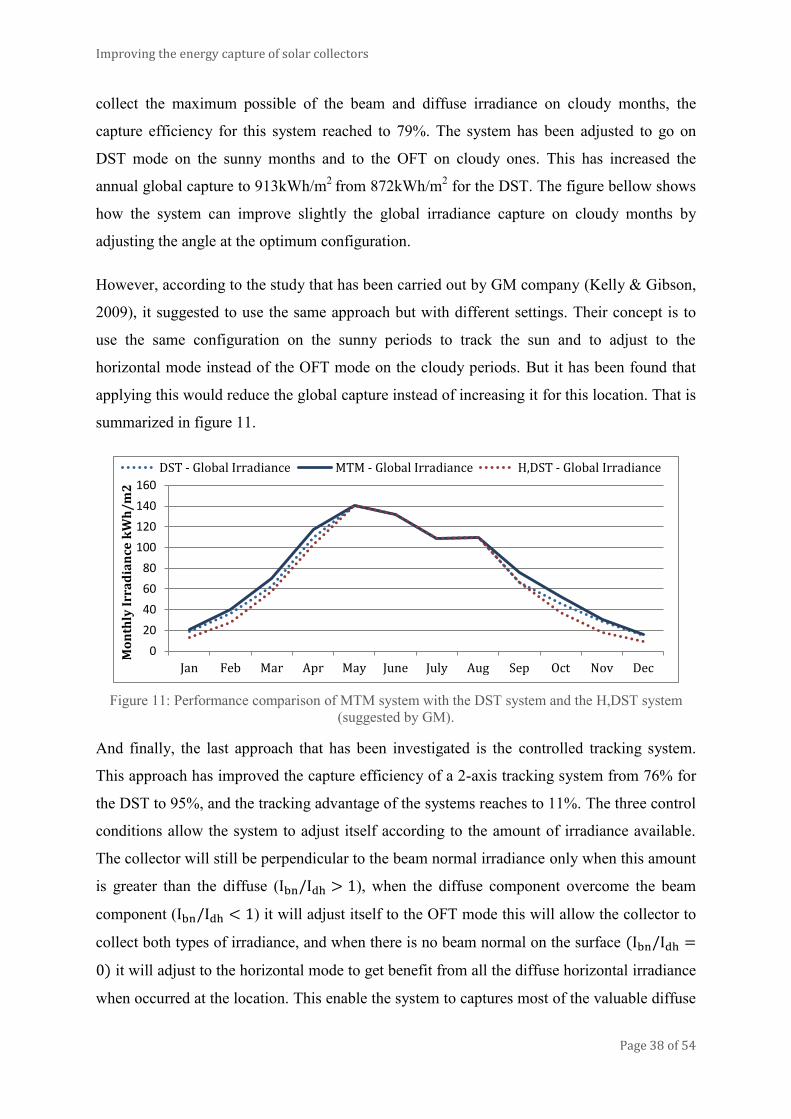
Figure 11: Performance comparison of MTM system with the DST system and the H,DST
system (suggested by GM)....................................................................................................... 38
Figure 12: Performance comparison the CST with the DST systems. .................................... 39
Figure 13 Global horizontal (Gh), diffuse horizontal (Idh), beam normal (Ibn), and beam
horizontal (Ibh) insolation (hourly integrated irradiance) for a – sunny days (June 2, 1986). b
– cloudy days (May 12, 1980). The data are taken from hourly NSRDB in Detroit USA
(NREL b, 2011). ...................................................................................................................... 50
Figure 15: Solar irradiance percentage according to different tilts and orientations. .............. 51
Figure 14: Sun positions for Glasgow 550
N............................................................................ 51
Figure 16 Geometry of a collector ........................................................................................... 52
Figure 17: Cell Efficiency ........................................................................................................ 53
Figure 18: Averaged global solar radiation map. (Centre for Energy and Processes, Ecole des
Mines de Paris, 2006) .............................................................................................................. 54
Improving the energy capture of solar collectors
Page 8 of 54
List of Tables
Table 1: Monthly available irradiance. .................................................................................... 30
Table 2: Monthly direct, diffuse and global irradiance capture. For the horizontal collector. 31
Table 3: Monthly direct, diffuse and global irradiance capture. For the optimum fixed tilt
angle collector. ......................................................................................................................... 32
Table 4 Monthly direct, diffuse and global irradiance capture, for the DST 2-axis tracking
system ...................................................................................................................................... 32
Table 5: Monthly direct, diffuse and global irradiance capture. For the MTM configurations.
.................................................................................................................................................. 33
Table 6: Monthly direct, diffuse and global irradiance capture. For the CST configurations. 34
Table 7: Summary of the irradiance capture for the different configurations. ........................ 35
Table 8: Annual return & initial cost of OFT & CST systems. This is for 4kW plant size,
34m2
of PV. .............................................................................................................................. 41
Table 9: Discount cash flow and payback period for the OFT and CST plants. Showing first
10 years only, with 4% discount rate. ...................................................................................... 42
Table 10: Exergy comparison of the OFT and CST systems................................................... 43
Improving the energy capture of solar collectors
Page 9 of 54
List of Equations
Equation 1: Global irradiance (Duffie & Beckman, 1991) ............................ 20
Equation 2: Beam irradiance (Duffie & Beckman, 1991) ....................... 20
Equation 3: Diffuse Irradiance (Duffie & Beckman, 1991) ............ 20
Equation 4: Horizontal beam irradiance (Duffie & Beckman, 1991) .. 21
Equation 5: Horizontal diffuse irradiance (Duffie & Beckman, 1991) ................. 21
Equation 6: Horizontal global irradiance (Duffie & Beckman, 1991) ...... 21
Equation 7: Beam irradiance (Duffie & Beckman, 1991) ..................................... 22
Equation 8: Diffuse irradiance (Duffie & Beckman, 1991) ............ 22
Improving the energy capture of solar collectors
Page 10 of 54
1 Introduction
Solar energy is clean, renewable and is the largest natural source of energy. In an hour the
earth receives an amount of energy that can meet the global energy consumption for almost a
year “this is about 5000 times the input to the earth’s energy budget from all other
sources”(Messenger & Ventre, 2012). For thousands of years this energy has been used to
produce heat, light and to grow plants. Modern day, technologies are being developed to
harness the utilization of such a clean energy applications in order to address the global
challenges of climate change, energy security and sustainable development. Solar energy can
be used used for electricity production and solar heating thus by harvesting the sun’s
radiation through solar collectors. The current global demand on solar power is less than 1%
and although this figure is small compared with other conventional sources but it offers a
very promising future. According to the International Energy Agency, the global Photovoltaic
(PV) capacity has been increasing since 2000 at an average annual growth rate of 40% and
the roadmap envisioned for PV is to provide 11% of the global electricity production in 2050
which means a contribution of 4500TWh annually, to achieve this will requires installing
3000GW of PV capacity (IEA, 2010). However, achieving this require a strong optimal
technology progress and cost reduction for the PV market. This target identifies technology
goals and expansion areas to enable the most cost-efficient development of solar energy.
Solar applications are currently facing lot of challenges because of their limitations. It is
unlikely that the current solar applications can not convert all the available solar radiation to
DC energy and the amount of energy of the applications depends strongly on the efficiency of
the technology being used. For example, the performance of a PV panel can be defined
according to two types of efficiencies, cell and capture efficiency. Cell-efficiency can be
defined as the collector’s ability to convert photons energy to DC energy; It is affected by
voltage loss that can reach up to approximately 20% of the total power output, band gap loss
(23%) and excess photon energy losses (33%) (Twidell & Weir, 2006) and the maximum
cell-efficiency achieved to date is 43.5% (NREL c, 2012). The capture efficiency can be
defined as the ability of the collector to harvest the maximum possible amount of solar
radiation that are available at a specific site. This can be affected by the design of the system
and the method of mounting the collector, and is going to consider improving the
performance of solar collectors in regards to the energy capture only.
Improving the energy capture of solar collectors
Page 11 of 54
Different studies have been carried out to improve the amount of energy capture to increase
the overall efficiency for solar applications. As a result of this, different applications have
been invented that tend to maximise the utilization of solar power such as solar concentrators
and solar towers. One of the applications that is currently being used very widely, especially
in sunny climates is the solar tracking system. This system can be used as 1- axis which can
increase the energy output of a collector by around 30% versus a fixed tilt, and 2-axis
tracking this can increase the figure to 50% (Kelly & Gibson, 2009). But these figures
change from one location to another and depend strongly on the climate condition at the
specific site. For the 2-axis tracking system, it has been found that the system can collect
approximately 50% more energy in summer and 20% in winter; this is for clear sky countries.
In cloudy conditions where there is a high volume of clouds in the sky the system would
collect around 35% in summer and 5% only in winter and it has been found that in some
conditions the use of solar tracking devices can decrease the performance of the energy
capture (Messenger & Ventre, 2012). This can make the system a relatively ineffective
approach in cloudy regions especially because the cost of such systems is more expensive
than the cost of a fixed amount collector.
In the past, different pieces of research have been focussed on analysing the effect of these
systems in clear sky condition only. Most of these studies used the direct solar tracking DST
system, which is designed to follow the position of the sun during the day without
considering the effect of heavy clouds on the global radiation (Duffie & Beckman,
1991)(Messenger & Ventre, 2012). The studies concluded that use of solar tracking systems
can be an ineffective option in regards to energy capture and they are costly in high forecast
sky conditions as they are effective only in clear sky locations (Kelly & Gibson, 2009).
Recent studies have tried to focus on improving the performance of tracking systems in
different climates especially for a cloudy sky condition and it has been found that this can
ultimately improve the performance of the system for regions that are considered to be cloudy
throughout the year such as the UK, Ireland and the Northern Europe region(Armstrong &
Hurley, 2009).
This paper will investigate different approaches to improve the energy capture of solar
collectors in cloudy regions by using a 2-axis solar tracking system. It aims to find a way to
optimize the performance of solar collectors by comparing different configurations that
appear to be the most effective ones and will suggest a better method for ensuring energy
optimization.

Improving the energy capture of solar collectors
Page 12 of 54
The next section of this paper is going to discuss the literature reviews relevant to the
objective of the study. It will then look at the fundamentals of solar radiation in order to
understand the characteristics and the nature of the solar resource, and illustrate some
methodologies that this work will follow. After that it is going to discuss different approaches
for optimizing the energy capture. The project is going to model each approach to examine its
effect on the energy capture and it will suggest an improved approach using a simple
algorithm. The discussion section will include a brief financial analysis as well as energy
analysis. Finally this paper will refer to further related research considered to be relevant to
this subject; however for the purpose of this study it is not discussed in detail.
Improving the energy capture of solar collectors
Page 13 of 54
2 Literature review
It is common knowledge now that the use of tracking systems increases the energy output of
solar systems. However, it has been found that most of the research that has been
implemented on solar systems and solar tracking mechanisms were focusing on improving
the energy capture on clear sky condition only and did not consider the climate effect on the
system.
For example, in 2001, The Worcester Polytechnic Institute carried out a study to investigate
the performance of 2-axis solar tracking systems (Catarius, 2010). The aim of the study was
to investigate increasing the energy output of a solar collector by using a 2-axis tacking
system. According to their report, the 2-axis tracking system increases the annual energy by
around 48% than a fixed model and by around 36% than a 1-axis system. And using of these
systems can be very attractive in regards to the tracking advantage and the associated
economic scale of the system. Also most of the studies that have implemented in the UK and
in Europe such as the works that have been done by the European Photovoltaic Technology
Platform were studying improving these systems on clear sky conditions only (European
Photovoltaic Technology Platform, 2011). These studies did not consider the solar tracking
performance in cloudy conditions, and therefore their results can be applicable for only clear
sky locations.
Then some studies came to compare the performance of tracking systems in different
locations. Messenger & Ventre have discussed maximizing of the irradiation on solar
collectors (Messenger & Ventre, 2012). They have looked at optimizing the performance of
flat solar collectors and discussed briefly the performance of solar tracking system under
different conditions. They have chosen two locations at different climate condition, one at
clear sky condition and another at somewhat cloudy condition. And they have found that the
performance of a tracking system reduces with the increase of clouds layer at the location.
“Approximately 50% more energy can be collected in the summer in dry climate such
as Phoenix, Arizona, by using a tracking collector. During winter months only 20%
more energy is collected. In Seattle, Washington which receives somewhat more
diffuse sunlight than Phoenix the collector will capture 35% in summer and 5% in
winter” (Messenger & Ventre, 2012).

Improving the energy capture of solar collectors
Page 14 of 54
The energy capture percentage has reduced from 50% for Phonix to 35% for Seattle in the
same season. This reduction is a result to the relative decrease of the beam to diffuse
radiation ratio in Seattle. The study concluded that the performance of a tracking system
depends strongly on the location of the collector and the sky condition. However, it is
important to note that Phoenix and Seattle latitudes are 330
and 450 respectively, and they are
located in the most favourable belt for harvesting solar energy, between the latitude of 00
and
450 (see Appendix E, figure 18). It is expected that for locations above the 45
0 the energy
capture percentage would show more decrease.
A study that has been done by the International Solar Energy Society has discussed the
ineffectiveness of these systems in cloudy climates; it has been found the tracking systems
can be ineffective in cloudier conditions when comparing it with a fixed mounted collector.
“…the total energy available to a fixed flat plate collector is approximately the same
as the direct beam available to a tracking collector and may exceed that of a tracked
beam in cloudier climates”(ISEC, 2001).
In addition to that, the study has highlighted the difficulties of harvesting solar radiation in
cloudy conditions where the diffuse radiation are higher than the beam ones and
recommended using of different approaches for energy capturing according to the nature of
the radiation at a specific site. For example it has illustrated the importance of using flat
collectors instead of concentrating ones at these locations. In the Solar Radiation book the
author has considered also the same point (Iqbal, 1983). It dealt with measuring of solar
radiation according to the climate conditions and it developed models that classify these
conditions as cloudless and cloudy skies.
It is important to note that all these studies have focused on a model that tracks the sun
positions all over the year or in other words tracks the direct beam radiation, and according to
this they concluded that implementing these systems in cloudier climates seems to be
inefficient. Then some studies came to investigate improving of energy capture by
considering different approaches that consider increasing the harvest of beam as well as
diffuse radiation.
A study carried out in the National University of Ireland has addressed this issue (Armstrong
& Hurley, 2009). It aimed to find a new method to maximise that solar energy harvest under
cloudy condition which can be useful for a country such as Ireland. The study highlighted the
Improving the energy capture of solar collectors
Page 15 of 54
problem of predicting the power output of the solar collectors in cloudy countries and
included new method which improves harvesting of diffuse radiation that tend to be
important approach for the Northern Europe countries.
“For a climate susceptible to overcast skies, where the beam radiation is eliminated, a
new approach is necessary that takes into account the frequency of clouds. The
proposed methodology combines hourly observations of cloud conditions with
monthly sunshine hour’s data in order to determine the frequency of clear, partly
cloudy and overcast skies in order to calculate the solar radiation. Using these solar
radiation values and knowledge of cloud conditions, the tilt angle can be chosen that
optimises the available solar radiation between the beam radiation on sunny days and
the diffuse radiation on overcast days”(Armstrong & Hurley, 2009).
According to the research, for maximizing the solar energy capture it is important to part the
solar radiation to direct beams and diffuse beams while predicting this energy, and then the
optimized tilt sitting should be selected according to the two kinds of radiation together. The
proposed method uses localized condition to determine a Sunshine Hours Ratio (r), this ratio
is used to distinguish between clear, bright and dark forecast days and accordingly calculate
the actual global horizontal radiation ( ). After that a set of equations will calculate the
optimum tilt angle for the collector.
Equation A: (Armstrong & Hurley, 2009)
Where is the calculated global horizontal radiation.
The proposed approach seems to be suitable for all locations with different sky conditions
and it has been tested in sunny locations.
And finally a research has been done by the R&D Centre at General Motor Company to
investigate new method of improving the energy output of photovoltaic systems in cloudy
conditions by using solar tacking devices(Kelly & Gibson, 2009) (Kelly & Gibson, 2010).
They have used the Duffie & Bechman model (B&C) to measure the amount of global
radiation ( ) on horizontal surfaces for different conditions. The aim of the study was to
develop an algorithm for the 2-axis tracking system to improve the energy output of solar
systems which can be applicable for cloudy and sunny days.
They proved that global horizontal radiation can be increased by increasing the beam
horizontal ( ) and this can be achieved by minimizing the azimuth angle ( ) to reach zero
Improving the energy capture of solar collectors
Page 16 of 54
( ). However, the positions of the sun change during the day the only way to achieve
that is to keep the collector face perpendicular to the incoming light from the sun all over the
day by using a Direct Solar Tracking (DST).
Equation B: (Kelly & Gibson, 2009)
Equation C: (Kelly & Gibson, 2010)
Where is the global horizontal radiation, beam for horizontal surface, diffuse for
horizontal surface, all in kWh/m2.
On sunny sky conditions where 90% of the radiation contributed from the direct beam while
the remaining 10% only from diffuse radiation, the 2-axis DST can dramatically increases the
solar energy harvested because the direct beams are greater than the diffuse ( ) and the
response of the collector to the cosine of azimuth angle. According to their results the system
increases the solar energy for a collector by 52% compared with a horizontal model and with
41% tracking advantage. Controversially, on cloudy days tracking the sun reduces the energy
capture and that the horizontal surfaces increase the energy by 47% than a tracker system.
And therefore it was thought to find a better way to maximise the diffuse radiation collected
by a surface on a cloudy days. The study proposed an optimized tracking system to track the
sun on clear sky periods and to tilt horizontally on cloudy periods. According to their results,
this system can increase the solar energy capture by 25% than a horizontal model.
The study has highlighted the importance of using different tracking approach to track the sun
positions on clear sky period and to adjust to different settings on cloudy sky periods. It
focused on a mathematical analysis of Duffie & Beckman equations to optimize the global
radiation conponant. However, it has been thought that the study was by somehow limitted
sine it has been noticed that the work presented a concipt only and did not model this
approach. In addition to that, the study has ignored to include the performance of the
optimum fixed tilt model and the results are used to compare with a horizontal surface only.
Based on these studies, it has been found that using of solar tracking devices in cloudy
climates can improve the ammount of energy capture of solar systems, this by applying some
modification and inhansments to the system. Theroefre, this study is going to investigate that
and it will try to improve the efficiency of solar systems by using of solar tracking devices.
Improving the energy capture of solar collectors
Page 17 of 54
3 Overview on solar radiation
Improving the performance of solar collectors to capture of solar radiation and to convert it to
useful form of energy depends strongly on the understanding of radiation properties.
Therefore this section is going to represent the importance of solar phenomena, atmospheric
and location effect, calculation of sun positions and components of solar radiation on
different tilted surfaces. It will include also some definitions, figures and equations that
thought to be essential for this paper. It has been noticed that references use different symbols
and terms for solar radiation and angles, therefore this section is going to characterize that.
3.1 Radiation from the sun
The sun has an effective blackbody temperature of 5777K, radiation emitted by the sun
reaches the earth’s surface at a maximum flux density of 1kW/m2
as a short wave radiation.
Depending on the time, place and weather the energy flux can vary from 3MJ/m2
to 30 MJ/m2
in a single day. This energy is a very high energy and can be used for thermally,
photophysical or photochemical processes (Twidell & Weir, 2006)(Messenger & Ventre,
2012).
The emitted radiation reaches the earth atmosphere at almost fixed intensity at a solar
constant of 1367W/m2
(Duffie & Beckman, 1991). This number varies with the variation of
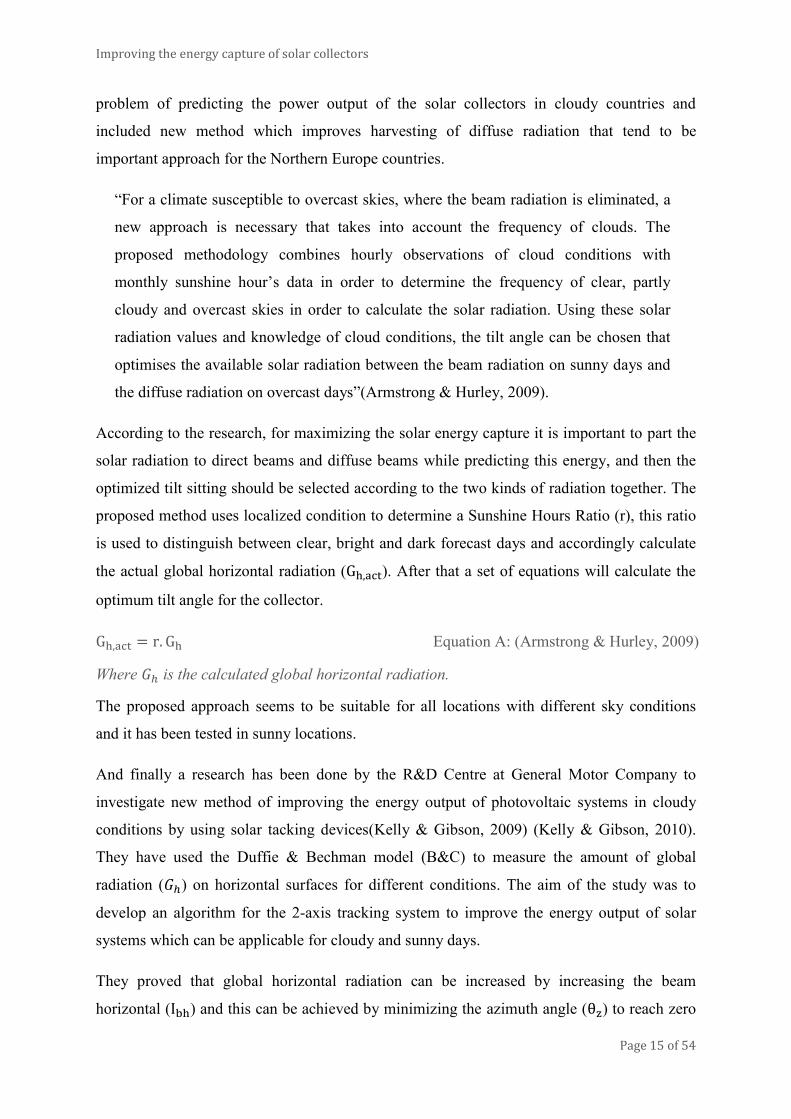
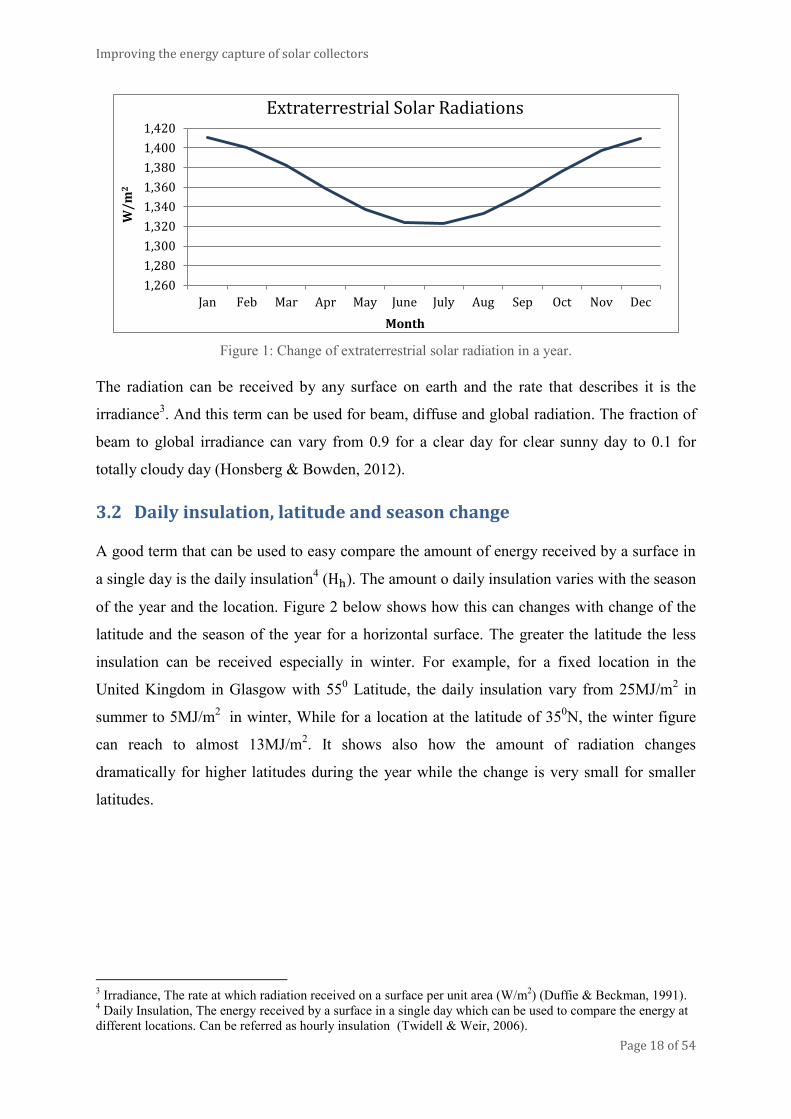
the earth-sun distance and therefore it is dependant with the time of the year. Figure 1 shows
that it shows the variation of these radiation during different seasons in one year. Beneath the
atmosphere, the solar radiation will enter the earth surface as extraterrestrial beam radiation
and it will varies widely due to local atmospheric variations, location (latitude), time of the
day and season of the year. After entering the earth’s atmosphere, the extraterrestrial beams
will part to beam radiation1 that received without having being scattered by the atmosphere
and diffuse radiation2 that received after its direction has been changed by scattering by the
atmosphere. And the sum of both radiation called the global radiation. However, the amount
of these radiation depends on the sky condition and therefore the portion of these radiation
varies but there is always be at least 10% of diffuse radiation, this is because the effect of the
particles and molecules radiation’s absorption in the atmosphere (ISEC, 2001).
1 Beam Radiation, The radiation that received from the sun without being scattered by the atmosphere. Some
references called it as direct solar radiation (Duffie & Beckman, 1991). 2 Diffuse Radiation, The radiation that received from the sun after have being affected by the atmosphere
(Duffie & Beckman, 1991).
Improving the energy capture of solar collectors
Page 18 of 54
Figure 1: Change of extraterrestrial solar radiation in a year.
The radiation can be received by any surface on earth and the rate that describes it is the
irradiance3. And this term can be used for beam, diffuse and global radiation. The fraction of
beam to global irradiance can vary from 0.9 for a clear day for clear sunny day to 0.1 for
totally cloudy day (Honsberg & Bowden, 2012).
3.2 Daily insulation, latitude and season change
A good term that can be used to easy compare the amount of energy received by a surface in
a single day is the daily insulation4 ( ). The amount o daily insulation varies with the season
of the year and the location. Figure 2 below shows how this can changes with change of the
latitude and the season of the year for a horizontal surface. The greater the latitude the less
insulation can be received especially in winter. For example, for a fixed location in the
United Kingdom in Glasgow with 550 Latitude, the daily insulation vary from 25MJ/m
2 in
summer to 5MJ/m2
in winter, While for a location at the latitude of 350N, the winter figure
can reach to almost 13MJ/m2. It shows also how the amount of radiation changes
dramatically for higher latitudes during the year while the change is very small for smaller
latitudes.
3 Irradiance, The rate at which radiation received on a surface per unit area (W/m
2) (Duffie & Beckman, 1991).
4 Daily Insulation, The energy received by a surface in a single day which can be used to compare the energy at
different locations. Can be referred as hourly insulation (Twidell & Weir, 2006).
1,260
1,280
1,300
1,320
1,340
1,360
1,380
1,400
1,420
Jan Feb Mar Apr May June July Aug Sep Oct Nov Dec
W/
m2
Month
Extraterrestrial Solar Radiations
Improving the energy capture of solar collectors
Page 19 of 54
Figure 2: Daily insulation for a horizontal plane change with season and latitude. (Twidell & Weir,
2006)
3.3 Sun positions
As the earth travels around the sun and rotates daily about its own polar axis, it is important
for designing of a solar system to locate the positions of the sun; this can be done by
calculating Solar Altitude5 ( ) and Solar Azimuth
6 ( ) angles (Duffie & Beckman, 1991).
The solar altitude is the angle between the horizontal plane and the acting line of the sun, this
angle varies throughout the day and it is zero during the sunset and 900
when the sun is totally
overhead. For an optimum solar system it is important to maximise the altitude angle which
occurs usually at the solar noon, this will be discussed more widely in the next section. The
Solar Azimuth is the angular displacement from the north of the projection beam radiation on
the horizontal plane. The sun is directly south at the solar noon in the northern hemisphere
and north in the southern hemisphere at solar noon (Honsberg & Bowden, 2012). This angle
also varies throughout the day, for example in Glasgow the angle is 900
during sunrise and
2700
during sunset in summer time (see appendix B figure 14).
5 Solar altitude is the angle between the beam from the sun to the horizontal, it is the complement of the zenith
angle (Duffie & Beckman, 1991). 6 Solar azimuth is the angle displacement from the projection of the beam radiation on the horizontal plan, for
this study this angle is measured from the north (Duffie & Beckman, 1991).
Improving the energy capture of solar collectors
Page 20 of 54
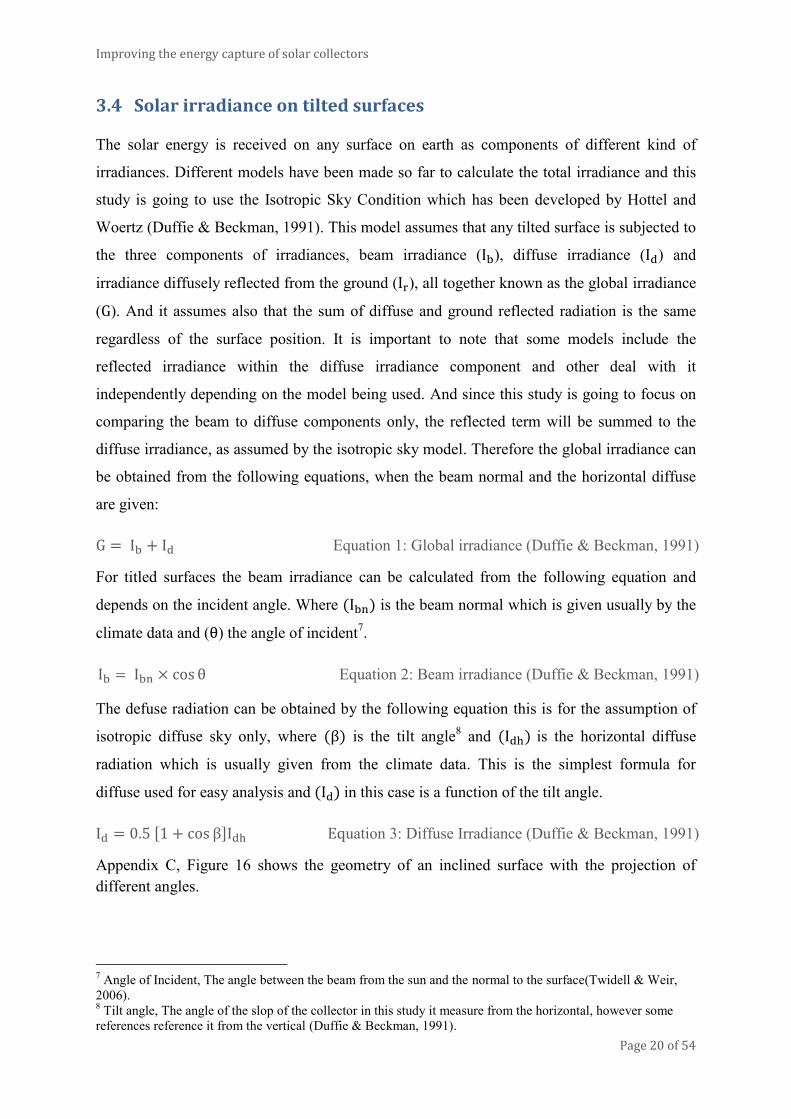
3.4 Solar irradiance on tilted surfaces
The solar energy is received on any surface on earth as components of different kind of
irradiances. Different models have been made so far to calculate the total irradiance and this
study is going to use the Isotropic Sky Condition which has been developed by Hottel and
Woertz (Duffie & Beckman, 1991). This model assumes that any tilted surface is subjected to
the three components of irradiances, beam irradiance ( ), diffuse irradiance ( ) and
irradiance diffusely reflected from the ground ( ), all together known as the global irradiance
( ). And it assumes also that the sum of diffuse and ground reflected radiation is the same
regardless of the surface position. It is important to note that some models include the
reflected irradiance within the diffuse irradiance component and other deal with it
independently depending on the model being used. And since this study is going to focus on
comparing the beam to diffuse components only, the reflected term will be summed to the
diffuse irradiance, as assumed by the isotropic sky model. Therefore the global irradiance can
be obtained from the following equations, when the beam normal and the horizontal diffuse
are given:
Equation 1: Global irradiance (Duffie & Beckman, 1991)
For titled surfaces the beam irradiance can be calculated from the following equation and
depends on the incident angle. Where is the beam normal which is given usually by the
climate data and ( ) the angle of incident7.
Equation 2: Beam irradiance (Duffie & Beckman, 1991)
The defuse radiation can be obtained by the following equation this is for the assumption of
isotropic diffuse sky only, where is the tilt angle8 and is the horizontal diffuse
radiation which is usually given from the climate data. This is the simplest formula for
diffuse used for easy analysis and in this case is a function of the tilt angle.
Equation 3: Diffuse Irradiance (Duffie & Beckman, 1991)
Appendix C, Figure 16 shows the geometry of an inclined surface with the projection of
different angles.
7 Angle of Incident, The angle between the beam from the sun and the normal to the surface(Twidell & Weir,
2006). 8 Tilt angle, The angle of the slop of the collector in this study it measure from the horizontal, however some
references reference it from the vertical (Duffie & Beckman, 1991).
Improving the energy capture of solar collectors
Page 21 of 54
3.5 Horizontal surfaces
The easiest configuration for the collector is the horizontal model. For this configuration the
title angle is equal to zero and the incident angle is equal to the zenith angle9 . The global
radiation for the horizontal position can be obtained from the following equations (Duffie &
Beckman, 1991):
Equation 4: Horizontal beam irradiance (Duffie & Beckman, 1991)
Equation 5: Horizontal diffuse irradiance (Duffie & Beckman, 1991)
Equation 6: Horizontal global irradiance (Duffie & Beckman, 1991)
The global irradiance of the collector for this case depends on the , and . The beam
irradiance is a function of and it will vary from unity when is equal to zero, to zero
when is equal to 900. The diffuse component for the horizontal configuration is equal to
the only, where for horizontal tilt is equal to zero.
3.6 Fixed tilted surfaces
The aim of tilting the collector to a fixed angle is to increase the collection of the solar
irradiance on the surface (Iqbal, 1983). From equation 2&3, the tilt and the incident angles of
the collector can affect the beam irradiance component and the diffuse irradiance (the
incident angle is a function of the title and the azimuth of the surface). It has been found that
the best orientation for a solar collector is to be south facing for most of the locations
(Messenger & Ventre, 2012). The tilt angle is usually chosen depending on the altitude angle
of the sun at solar noon in a day in summer. It has been found also that the best approach is to
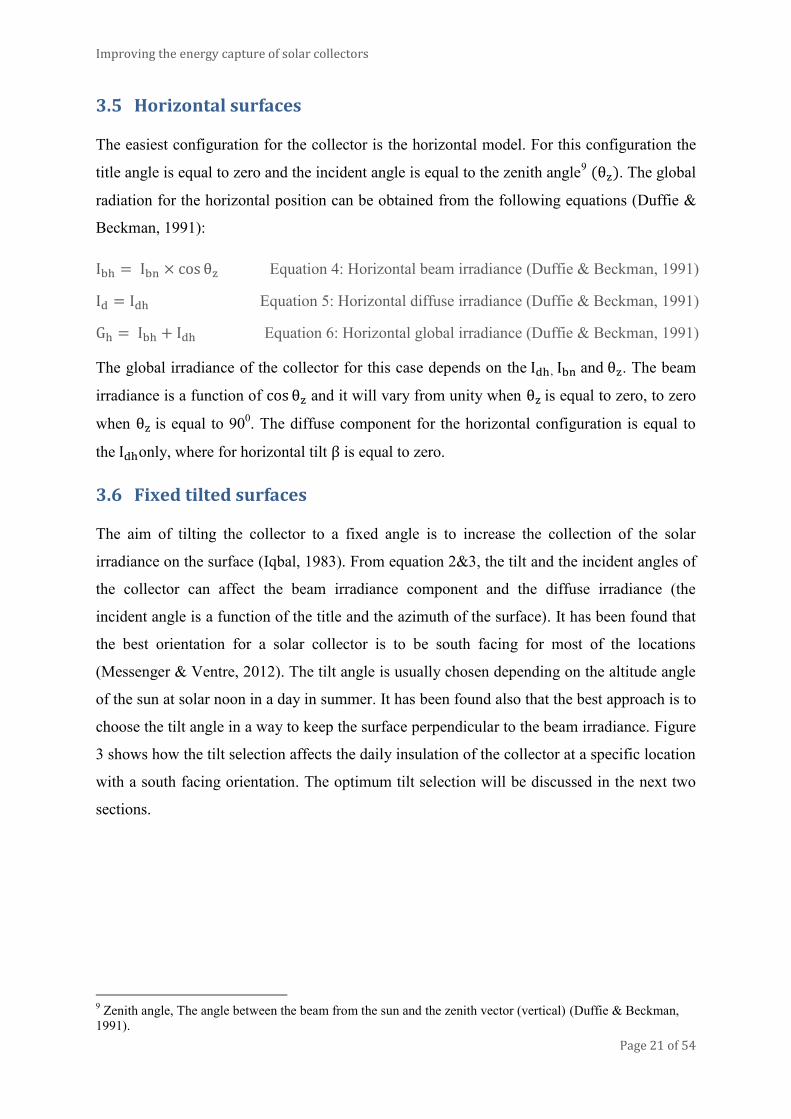
choose the tilt angle in a way to keep the surface perpendicular to the beam irradiance. Figure
3 shows how the tilt selection affects the daily insulation of the collector at a specific location
with a south facing orientation. The optimum tilt selection will be discussed in the next two
sections.
9 Zenith angle, The angle between the beam from the sun and the zenith vector (vertical) (Duffie & Beckman,
1991).
Improving the energy capture of solar collectors
Page 22 of 54
Figure 3: Insulation change with the tilt angle change all over the year for location 450 N latitude
(Twidell & Weir, 2006).
3.7 2 axis – Direct Solar Tracking (DST)
The 2-axis direct solar tracking system is approach used to allow the collector to follow
altitude and the azimuth of the sun all over the day. The approach is used to maximise the
system performance comparing with a fixed system (Kelly, 1993). Following the azimuth is
achieved by orienting the surface azimuth10
( typically to the solar azimuth across the year.
The solar altitude can be followed by subjecting the collector perpendicular to the beams, this
is achieved by tilting the collector to the zenith angle hence (Duffie & Beckman,
1991). And therefore, from equations 1&2 the beam and the diffuse components are equal to
the following for collectors with tracking devices:
Equation 7: Beam irradiance (Duffie & Beckman, 1991)
Equation 8: Diffuse irradiance (Duffie & Beckman, 1991)
Tracking the sun can be done by using a sun pointing programme that define the positions of
the sun during the day and rotates the collector by using a step motor (Kelly & Gibson,
2010).
10
Surface orientation (azimuth) the deviation of the projection on a horizontal plane of the normal to the surface
from the location meridian, measured from north.
Improving the energy capture of solar collectors
Page 23 of 54
4 Review of optimizing energy capture
The collector configuration should be designed in a way to collect the maximum available
from the total radiation at a proposed site. The characteristics of solar radiation change from
region to another and thus due to different factors. The portion of beam to diffuse radiation
also changes and depends strongly on the location and the sky condition at the selected site.
The configuration of the collector should be designed to utilized most of the available
radiation to increase the performance of the collector. This section is going to discuss that it
will show how different climate and location effects on the global component of the solar
irradiance and ultimately effect the design of solar system. And how assessing the solar
source affect in designing of solar systems
4.1 Solar resource assessment
Solar resource assessment is a significant process in the design of solar applications. The
process provides information about the sources characteristics and measurements that are
important inputs for any system simulation, that can be used for feasibility studies and design
purpose (ISEC, 2001). Assessing these data is important since it can address the major
influences on any the application, especially for optimizing the system to make it effective in
different seasons. As mentioned earlier, the solar irradiance for a specific location affected by
different factors including the cloudiness and the change of the sun position. Therefore
understanding the solar resource at the required location can significantly influence the
performance of any system. According to Jeffery Gordon:
“Informational parameters should allow a model to adjust to these major influences,
especially if one wants this model to be valid in different climates. Therefore, the
parameters should be able to characterize not only cloudiness, but also cloud opacity.
They should do it independently of the influence of the solar zenith angle. Of course,
the choice of parameters to be used for a model depends on what information is
available as input to the model (ISEC, 2001).”
The components of beam and diffuse insulation can vary for different locations. For example,
Appendix A, figure 13 compares the global, beam and diffuse insulation for cloudy and
sunny sky condition on a horizontal surface in Detroit. The figure shows how the contribution
of beam to diffuse can vary depending on the cloud cover at the sky. It is clear that in sunny
days the beam normal is greater than the diffuse. For example, at 1:00AM the bean normal to
Improving the energy capture of solar collectors
Page 24 of 54
diffuse horizontal ratio reach to 1.03 and during a cloudy day the ratio is reduced
dramatically to about 0.004. Assessing these data helps identify the parameters of the solar
systems. For example, the increase of clouds in the sky would decrease the global radiation
and the portion of the direct beam in the whole. And therefore, at clear sky condition that
subjected to high beam radiation are seen to be most suitable for beam collectors only such as
solar concentrators. And at cloudy condition which receives significant diffuse radiation, the
non-concentration collectors such as flat plate collectors are more suitable for these
conditions.
4.2 Current methods of energy capture
The performance of any solar collector system depends strongly on the method of mounting
the system during early design stages. Two factors that affect the energy capture are the tilt
angle and the orientation of the collector. These factors have to be designed to optimise the
performance of the system to harvest the maximum possible amount of radiation. According
to Duffie & Bechman equations 1&2, when the collector surface is perpendicular to the solar
beams the power density will be at its maximum, and when the surface is subjected
horizontally the diffuse power density will be at maximum. This then optimizes the energy
capture by increasing the global irradiance.
After assessing the solar radiation data, a model can be developed to choose the best
configuration for different systems Different methods can be followed to design a system
with the optimum energy capture. For example, the horizontal configuration cannot optimise
the energy collection but increase the collection of diffuse radiation. From equation 4, the
beam irradiance component is proportional to the for this configuration and this angle
changes during the day and therefore the collector might not be perpendicular to the beam
radiation. On the other hand the diffuse component will be maximized. From equation 3, the
diffuse component is proportional to the and will be equal to unity for this mode, as a
result to this the surface diffuse will equal to the horizontal diffuse (equation 5). That makes
the horizontal configuration attractive option for locations where there is great amount of
diffuse radiation.
Another alternative method is the fixed tilt angle. As the sun change its position during the
day the amount of insulation of any surface will change, and this portion will be at its largest
at solar noon when the sun is highest in the sky in summer time. Therefore, the optimum tilt
Improving the energy capture of solar collectors
Page 25 of 54
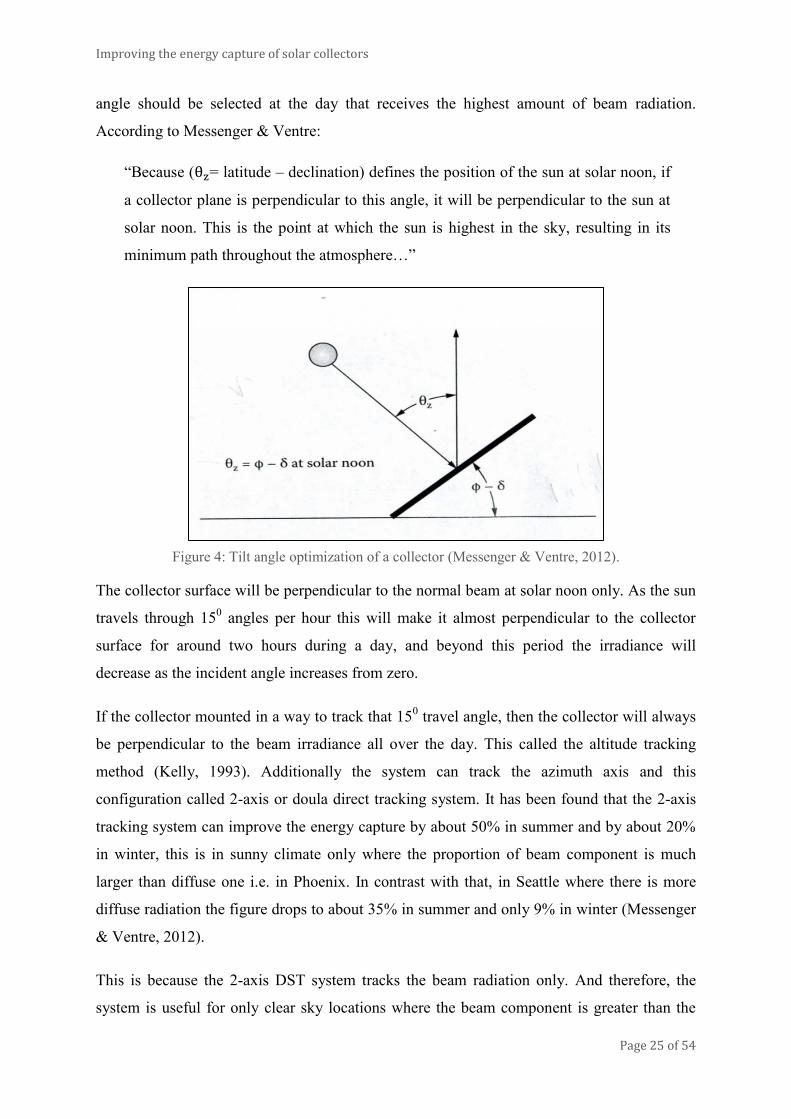
angle should be selected at the day that receives the highest amount of beam radiation.
According to Messenger & Ventre:
“Because ( = latitude – declination) defines the position of the sun at solar noon, if
a collector plane is perpendicular to this angle, it will be perpendicular to the sun at
solar noon. This is the point at which the sun is highest in the sky, resulting in its
minimum path throughout the atmosphere…”
Figure 4: Tilt angle optimization of a collector (Messenger & Ventre, 2012).
The collector surface will be perpendicular to the normal beam at solar noon only. As the sun
travels through 150 angles per hour this will make it almost perpendicular to the collector
surface for around two hours during a day, and beyond this period the irradiance will
decrease as the incident angle increases from zero.
If the collector mounted in a way to track that 150 travel angle, then the collector will always
be perpendicular to the beam irradiance all over the day. This called the altitude tracking
method (Kelly, 1993). Additionally the system can track the azimuth axis and this
configuration called 2-axis or doula direct tracking system. It has been found that the 2-axis
tracking system can improve the energy capture by about 50% in summer and by about 20%
in winter, this is in sunny climate only where the proportion of beam component is much
larger than diffuse one i.e. in Phoenix. In contrast with that, in Seattle where there is more
diffuse radiation the figure drops to about 35% in summer and only 9% in winter (Messenger
& Ventre, 2012).
This is because the 2-axis DST system tracks the beam radiation only. And therefore, the
system is useful for only clear sky locations where the beam component is greater than the
Improving the energy capture of solar collectors
Page 26 of 54
diffuse one. That makes it attractive solution for location between the latitudes of 50
N and
400
N – the favourable solar belt for capturing beam radiation (Armstrong & Hurley, 2009).
For example, the greatest amount of radiation are received in countries located between the
latitudes ok 150N and 35
0N such as Egypt where it receive the greatest radiation and the bean
component contribute by 90% of the global irradiance at the country. Countries located
between the latitudes of 350N and 45
0N such as Turkey and Spain receive fewer radiation
because of the huge seasonal variations at these locations. The countries that located beyond
the 450N (Northern Europe) are the least favourable locations for capturing beam irradiances
such as Scotland, Ireland and Norway, these countries receive the least amount of beam
irradiance, half of the global irradiance comes from the diffuse component and that’s due to
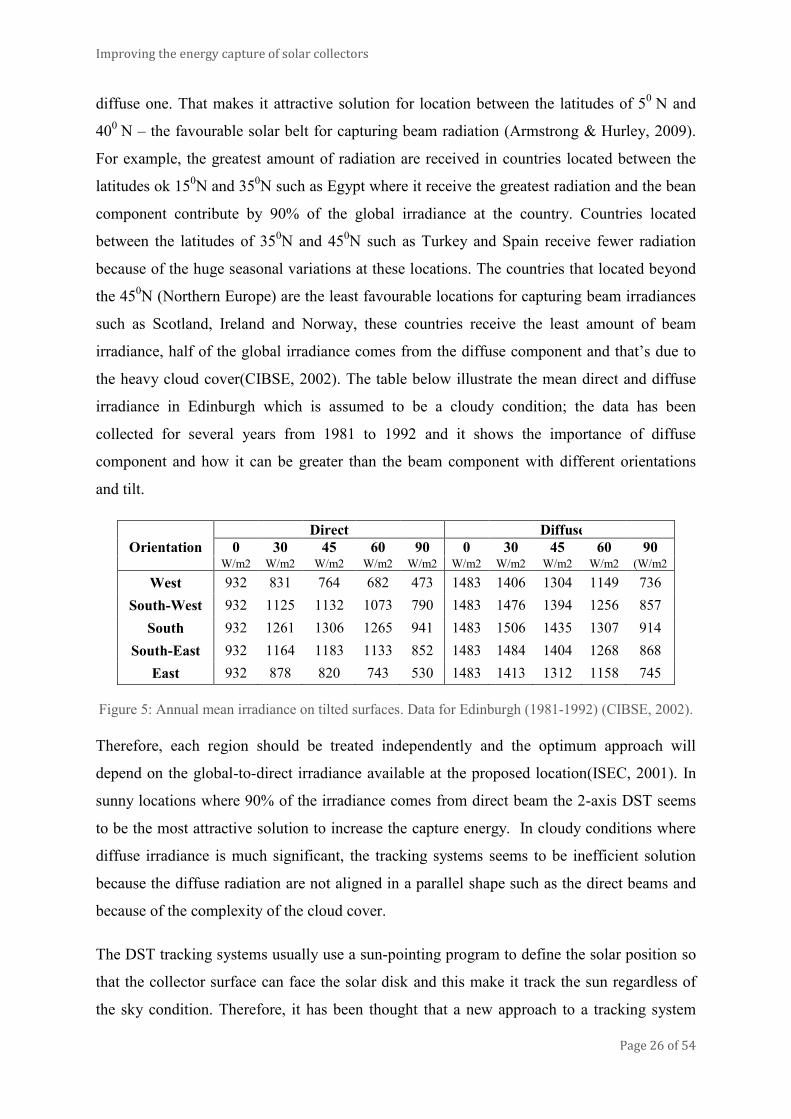
the heavy cloud cover(CIBSE, 2002). The table below illustrate the mean direct and diffuse
irradiance in Edinburgh which is assumed to be a cloudy condition; the data has been
collected for several years from 1981 to 1992 and it shows the importance of diffuse
component and how it can be greater than the beam component with different orientations
and tilt.
Direct
Diffuse
Orientation 0 30 45 60 90 0 30 45 60 90
W/m2 W/m2 W/m2 W/m2 W/m2 W/m2 W/m2 W/m2 W/m2 (W/m2
West 932 831 764 682 473 1483 1406 1304 1149 736
South-West 932 1125 1132 1073 790 1483 1476 1394 1256 857
South 932 1261 1306 1265 941 1483 1506 1435 1307 914
South-East 932 1164 1183 1133 852 1483 1484 1404 1268 868
East 932 878 820 743 530 1483 1413 1312 1158 745
Figure 5: Annual mean irradiance on tilted surfaces. Data for Edinburgh (1981-1992) (CIBSE, 2002).
Therefore, each region should be treated independently and the optimum approach will
depend on the global-to-direct irradiance available at the proposed location(ISEC, 2001). In
sunny locations where 90% of the irradiance comes from direct beam the 2-axis DST seems
to be the most attractive solution to increase the capture energy. In cloudy conditions where
diffuse irradiance is much significant, the tracking systems seems to be inefficient solution
because the diffuse radiation are not aligned in a parallel shape such as the direct beams and
because of the complexity of the cloud cover.
The DST tracking systems usually use a sun-pointing program to define the solar position so
that the collector surface can face the solar disk and this make it track the sun regardless of
the sky condition. Therefore, it has been thought that a new approach to a tracking system

Improving the energy capture of solar collectors
Page 27 of 54
should be investigated to optimize the irradiance capture for cloudy regions. This approach
has to consider the importance of capturing the diffuse radiation as well as the beam ones and
consequently this can increase the global capture and improves the performance of the solar
system. The system can combine different configurations such as the method that has been
developed by GM to use a combination of DST and the horizontal configurations
together(Kelly & Gibson, 2009). The optimized system has to utilize all the available
radiation that can be harvested to generate more energy and to improve the performance of
the system.
Improving the energy capture of solar collectors
Page 28 of 54
5 Experimental procedure
This section will examine the methods that are currently being used for improving energy
capture of solar collectors that have been discussed in the previous section. It will investigate
the performance of each approach in worst case scenario – in a cloudy region. The
examination will also analysis each approach and it will observe how it effects the efficiency
of the system. Based on that, it will present an improved approach which construct of a
simple algorithm that used to control the positions of the collector during the day in order to
optimize the performance of solar collectors.
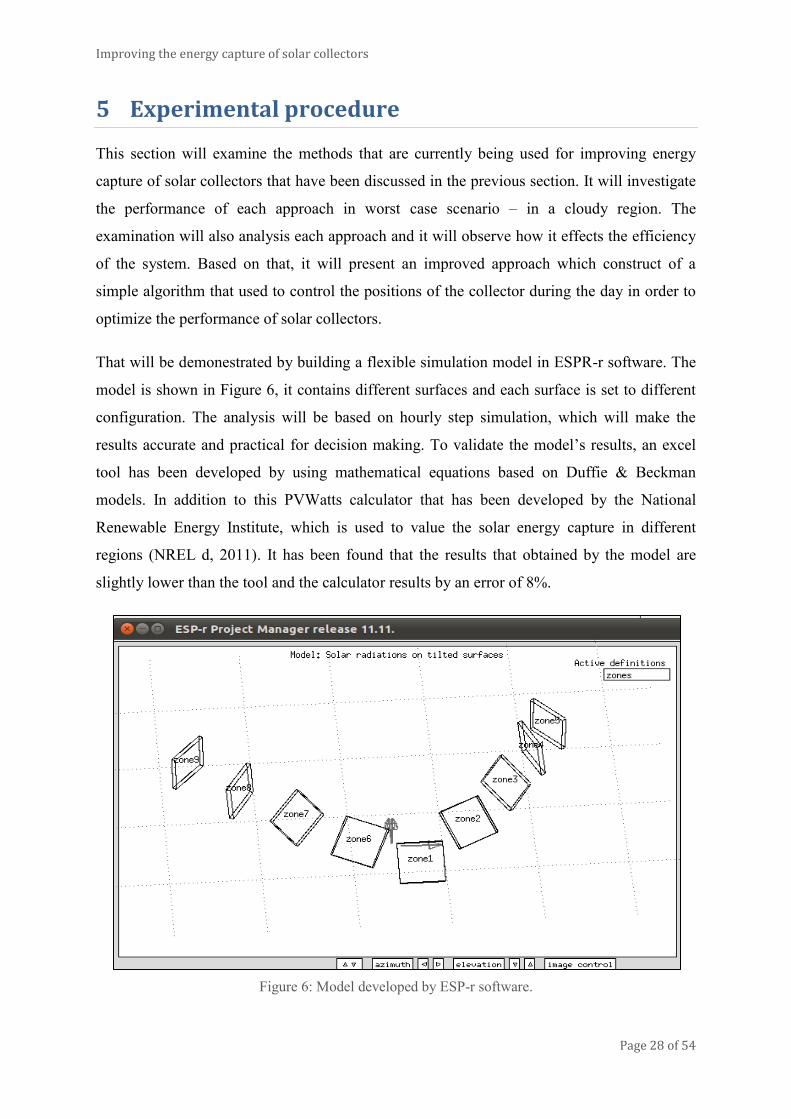
That will be demonestrated by building a flexible simulation model in ESPR-r software. The
model is shown in Figure 6, it contains different surfaces and each surface is set to different
configuration. The analysis will be based on hourly step simulation, which will make the
results accurate and practical for decision making. To validate the model’s results, an excel
tool has been developed by using mathematical equations based on Duffie & Beckman
models. In addition to this PVWatts calculator that has been developed by the National
Renewable Energy Institute, which is used to value the solar energy capture in different
regions (NREL d, 2011). It has been found that the results that obtained by the model are
slightly lower than the tool and the calculator results by an error of 8%.
Figure 6: Model developed by ESP-r software.
Improving the energy capture of solar collectors
Page 29 of 54
5.1 Model description
The model analyses a flat plated surfaces each with an area of 1m2 as a solar collector. This
to make the results applicable for different types of solar applications i.e. photovoltaic or
solar thermal collector and especially that this study is going to focus on the solar energy
capture only. Since the project is going to examine the performance of the solar collector in
cloudy regions the location has been chosen in the north of Europe with latitude more than
450N and the selected site is Glasgow with latitude of 55
0N.
5.2 Resources assessment
The available radiation data for this location were obtained by using the software from the
climate data file. The beam normal is the available direct irradiance at the location measured
by tracking the sun after considering the sky conditions, while the diffuse horizontal is the
available scattered measured irradiance at a horizontal surface. It has been assumed that the
amount of global available radiation ( ) at the site is the summation of the direct normal
and the diffuse horizontal and based on this, the method of optimizing the solar collector will
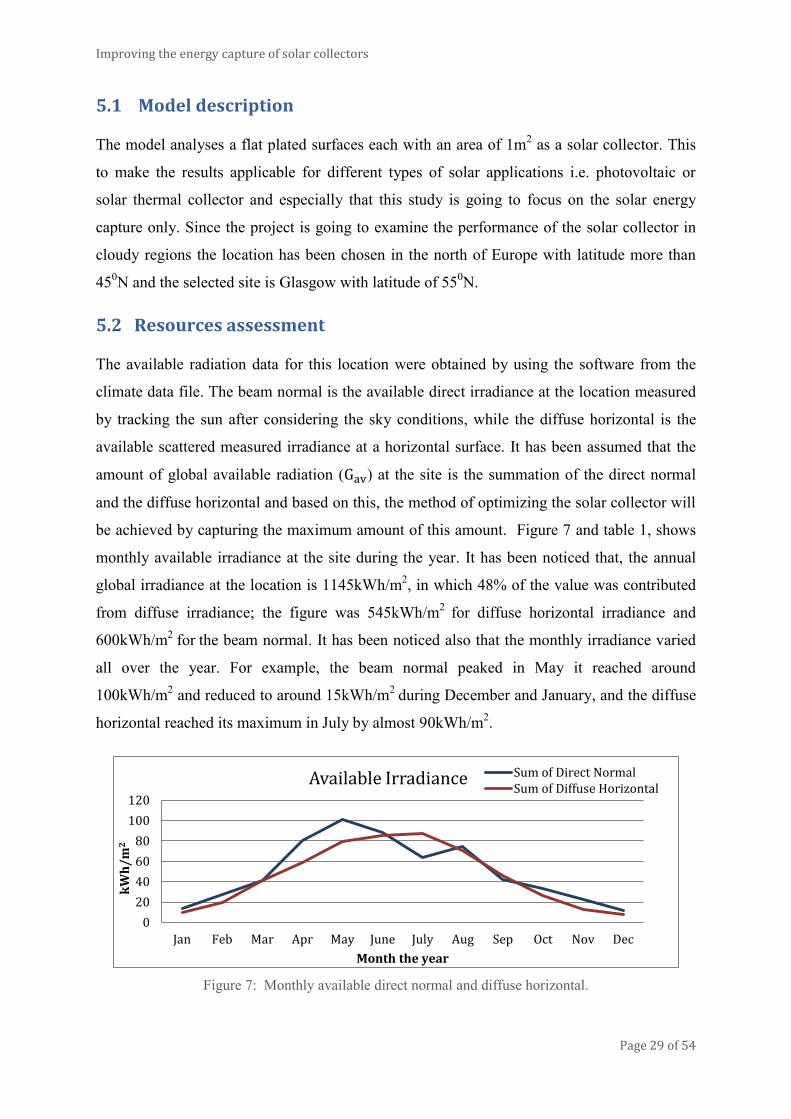
be achieved by capturing the maximum amount of this amount. Figure 7 and table 1, shows
monthly available irradiance at the site during the year. It has been noticed that, the annual
global irradiance at the location is 1145kWh/m2, in which 48% of the value was contributed
from diffuse irradiance; the figure was 545kWh/m2
for diffuse horizontal irradiance and
600kWh/m2
for the beam normal. It has been noticed also that the monthly irradiance varied
all over the year. For example, the beam normal peaked in May it reached around
100kWh/m2 and reduced to around 15kWh/m
2 during December and January, and the diffuse
horizontal reached its maximum in July by almost 90kWh/m2.
Figure 7: Monthly available direct normal and diffuse horizontal.
0
20
40
60
80
100
120
Jan Feb Mar Apr May June July Aug Sep Oct Nov Dec
kW
h/
m2
Month the year
Available Irradiance Sum of Direct Normal Sum of Diffuse Horizontal
Improving the energy capture of solar collectors
Page 30 of 54
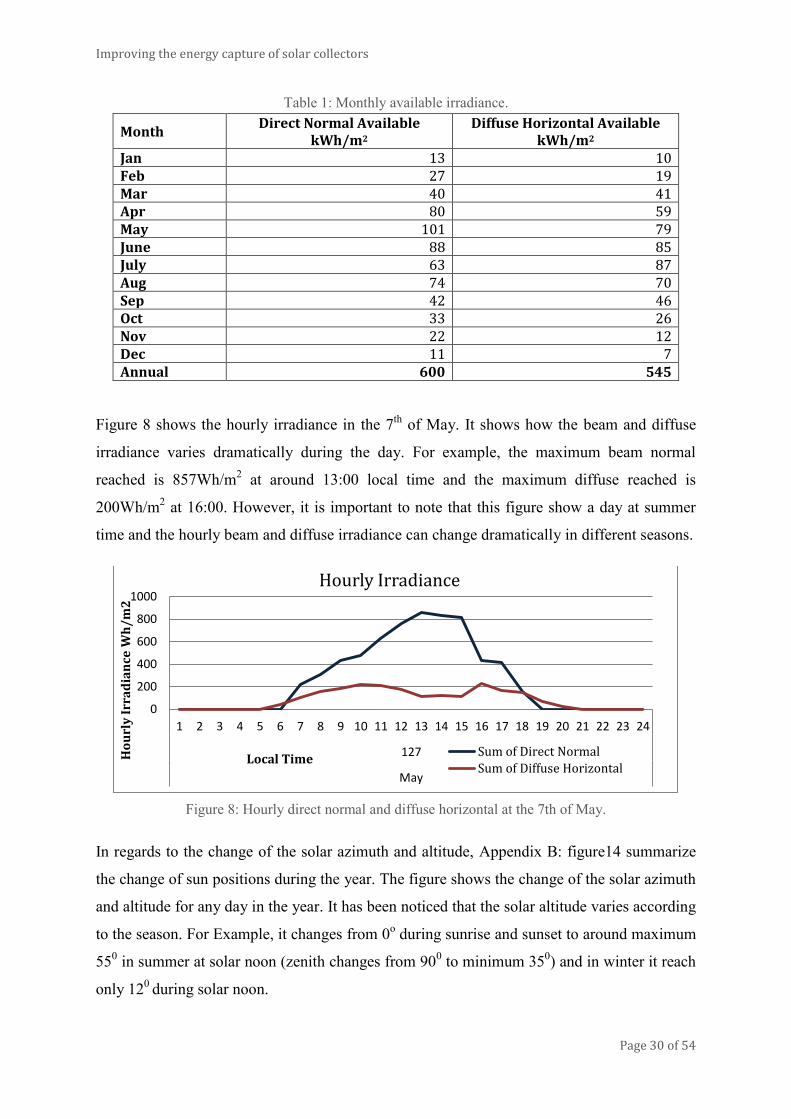
Table 1: Monthly available irradiance.
Month Direct Normal Available
kWh/m2
Diffuse Horizontal Available kWh/m2
Jan 13 10 Feb 27 19 Mar 40 41 Apr 80 59 May 101 79 June 88 85 July 63 87 Aug 74 70 Sep 42 46 Oct 33 26 Nov 22 12 Dec 11 7 Annual 600 545
Figure 8 shows the hourly irradiance in the 7th
of May. It shows how the beam and diffuse
irradiance varies dramatically during the day. For example, the maximum beam normal
reached is 857Wh/m2 at around 13:00 local time and the maximum diffuse reached is
200Wh/m2 at 16:00. However, it is important to note that this figure show a day at summer
time and the hourly beam and diffuse irradiance can change dramatically in different seasons.
Figure 8: Hourly direct normal and diffuse horizontal at the 7th of May.
In regards to the change of the solar azimuth and altitude, Appendix B: figure14 summarize
the change of sun positions during the year. The figure shows the change of the solar azimuth
and altitude for any day in the year. It has been noticed that the solar altitude varies according
to the season. For Example, it changes from 0o during sunrise and sunset to around maximum
550 in summer at solar noon (zenith changes from 90
0 to minimum 35
0) and in winter it reach
only 120
during solar noon.
0
200
400
600
800
1000
1 2 3 4 5 6 7 8 9 10 11 12 13 14 15 16 17 18 19 20 21 22 23 24
127
May
Ho
url
y I
rra
dia
nce
Wh
/m
2
Local Time
Hourly Irradiance
Sum of Direct Normal
Sum of Diffuse Horizontal
Improving the energy capture of solar collectors
Page 31 of 54
5.3 Results
After assessing the solar radiation data at the location, different surfaces have been
implemented in the model and each one has been designed according to certain approach, and
then a simulation has been done. This section will presents the simulation results for each
approach. It will include five surfaces of five different approaches that showed the most
important effect on the system. The first four approaches will demonstrate surfaces with the
configurations that have been discussed earlier in the previous section, and approach five will
present a surface with the improved method for optimizing energy capture for the surface.
5.3.1 Approach one – Horizontal configuration (h)
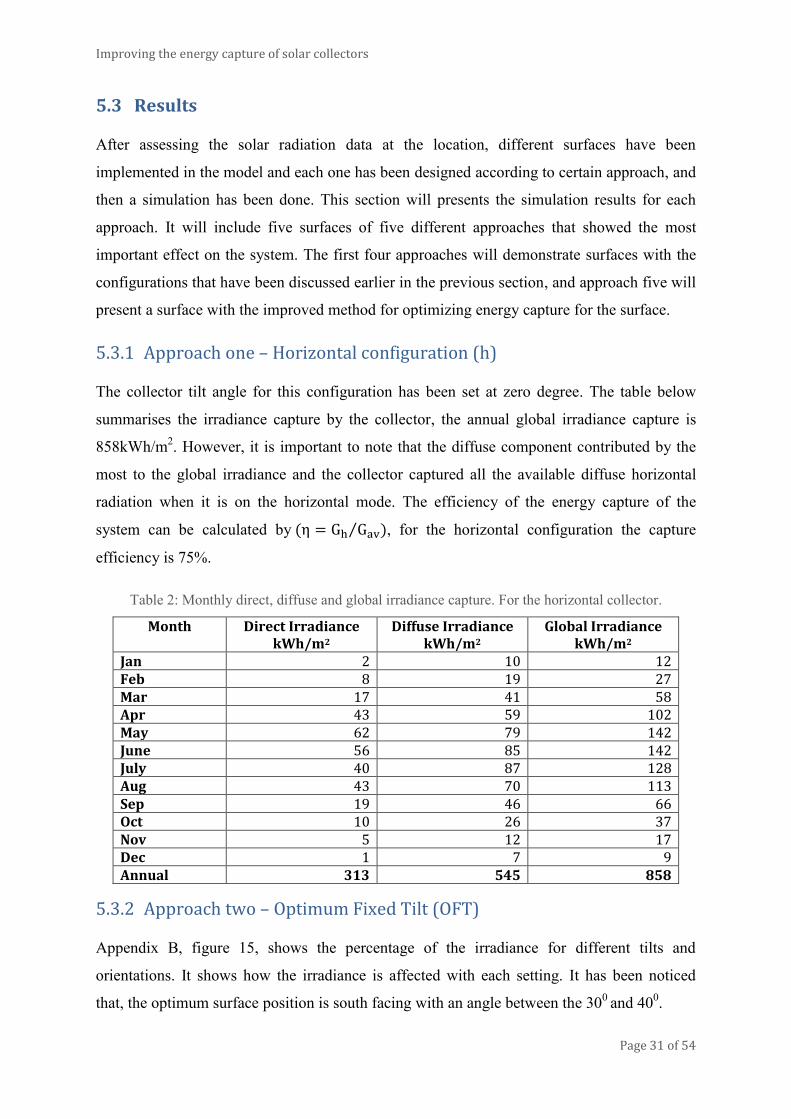
The collector tilt angle for this configuration has been set at zero degree. The table below
summarises the irradiance capture by the collector, the annual global irradiance capture is
858kWh/m2. However, it is important to note that the diffuse component contributed by the
most to the global irradiance and the collector captured all the available diffuse horizontal
radiation when it is on the horizontal mode. The efficiency of the energy capture of the
system can be calculated by , for the horizontal configuration the capture
efficiency is 75%.
Table 2: Monthly direct, diffuse and global irradiance capture. For the horizontal collector.
Month Direct Irradiance kWh/m2
Diffuse Irradiance kWh/m2
Global Irradiance kWh/m2
Jan 2 10 12 Feb 8 19 27 Mar 17 41 58 Apr 43 59 102 May 62 79 142 June 56 85 142 July 40 87 128 Aug 43 70 113 Sep 19 46 66 Oct 10 26 37 Nov 5 12 17 Dec 1 7 9 Annual 313 545 858
5.3.2 Approach two – Optimum Fixed Tilt (OFT)
Appendix B, figure 15, shows the percentage of the irradiance for different tilts and
orientations. It shows how the irradiance is affected with each setting. It has been noticed
that, the optimum surface position is south facing with an angle between the 300
and 400.
Improving the energy capture of solar collectors
Page 32 of 54
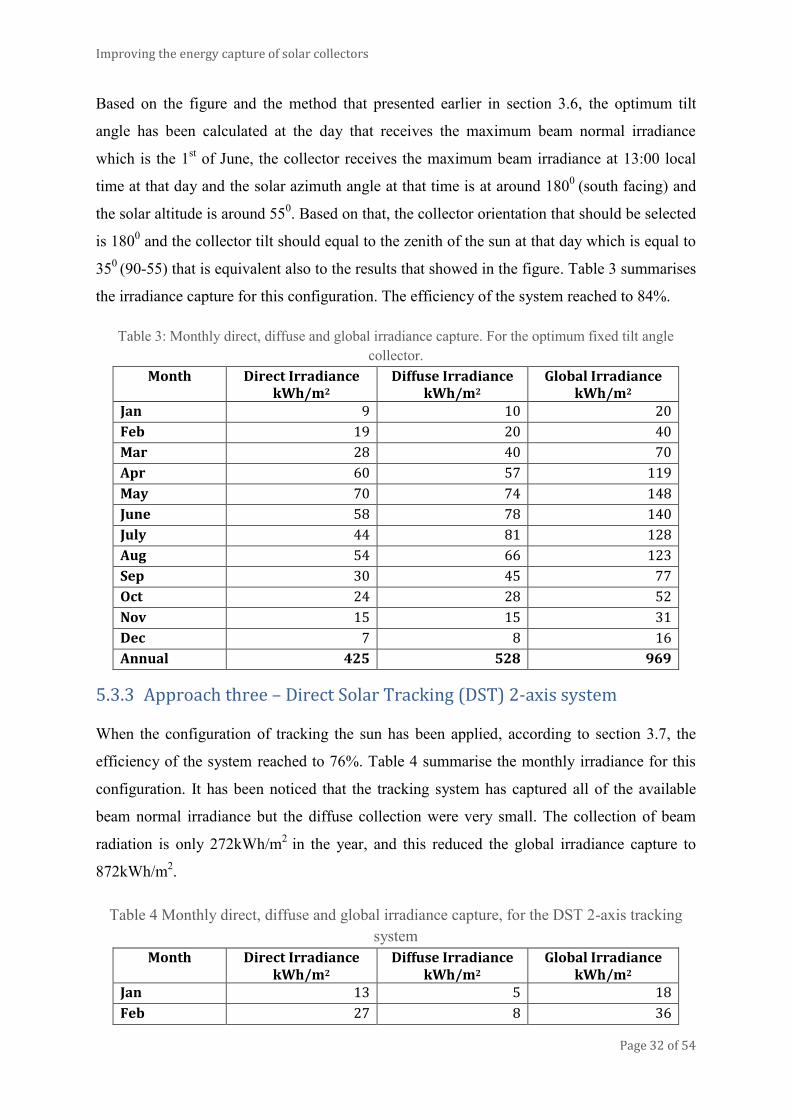
Based on the figure and the method that presented earlier in section 3.6, the optimum tilt
angle has been calculated at the day that receives the maximum beam normal irradiance
which is the 1st of June, the collector receives the maximum beam irradiance at 13:00 local
time at that day and the solar azimuth angle at that time is at around 1800
(south facing) and
the solar altitude is around 550. Based on that, the collector orientation that should be selected
is 1800 and the collector tilt should equal to the zenith of the sun at that day which is equal to
350
(90-55) that is equivalent also to the results that showed in the figure. Table 3 summarises
the irradiance capture for this configuration. The efficiency of the system reached to 84%.
Table 3: Monthly direct, diffuse and global irradiance capture. For the optimum fixed tilt angle
collector.
Month Direct Irradiance kWh/m2
Diffuse Irradiance kWh/m2
Global Irradiance kWh/m2
Jan 9 10 20
Feb 19 20 40
Mar 28 40 70
Apr 60 57 119
May 70 74 148
June 58 78 140
July 44 81 128
Aug 54 66 123
Sep 30 45 77
Oct 24 28 52
Nov 15 15 31
Dec 7 8 16
Annual 425 528 969
5.3.3 Approach three – Direct Solar Tracking (DST) 2-axis system
When the configuration of tracking the sun has been applied, according to section 3.7, the
efficiency of the system reached to 76%. Table 4 summarise the monthly irradiance for this
configuration. It has been noticed that the tracking system has captured all of the available
beam normal irradiance but the diffuse collection were very small. The collection of beam
radiation is only 272kWh/m2
in the year, and this reduced the global irradiance capture to
872kWh/m2.
Table 4 Monthly direct, diffuse and global irradiance capture, for the DST 2-axis tracking
system
Month Direct Irradiance kWh/m2
Diffuse Irradiance kWh/m2
Global Irradiance kWh/m2
Jan 13 5 18
Feb 27 8 36
Improving the energy capture of solar collectors
Page 33 of 54
Mar 40 21 62
Apr 80 29 109
May 101 38 140
June 88 43 131
July 63 44 108
Aug 74 35 109
Sep 42 23 66
Oct 33 12 46
Nov 22 6 29
Dec 11 2 14
Annual 600 272 872
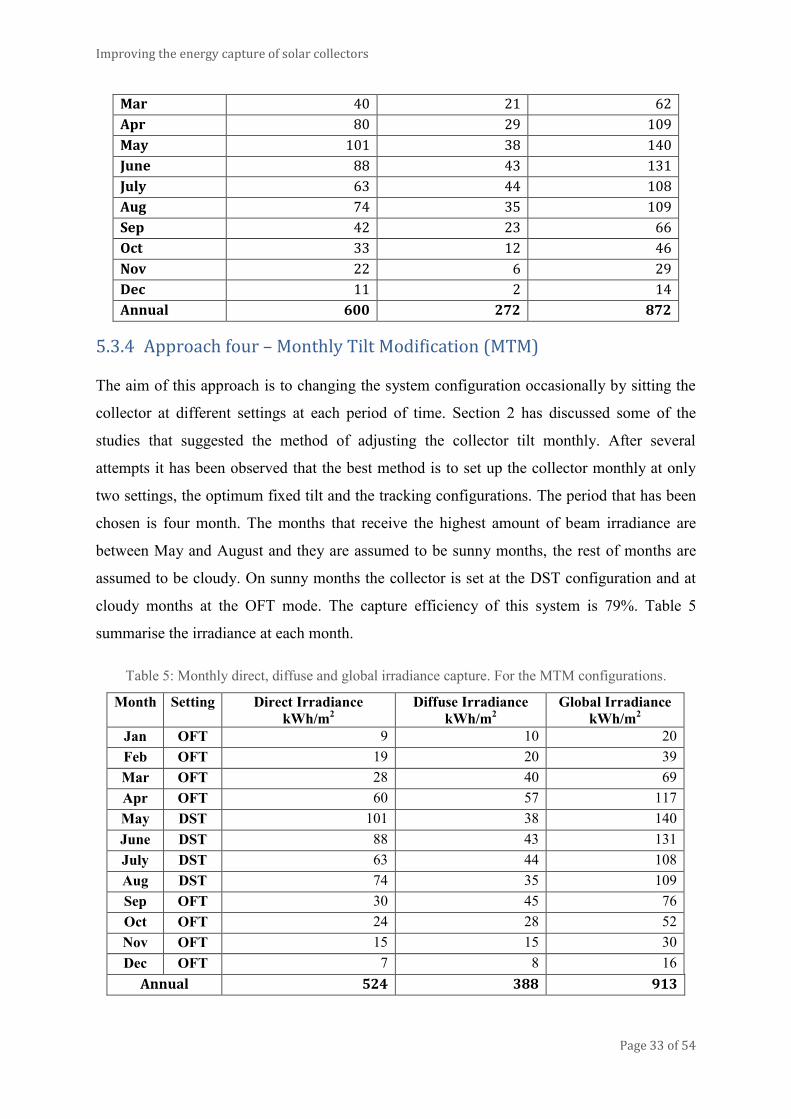
5.3.4 Approach four – Monthly Tilt Modification (MTM)
The aim of this approach is to changing the system configuration occasionally by sitting the
collector at different settings at each period of time. Section 2 has discussed some of the
studies that suggested the method of adjusting the collector tilt monthly. After several
attempts it has been observed that the best method is to set up the collector monthly at only
two settings, the optimum fixed tilt and the tracking configurations. The period that has been
chosen is four month. The months that receive the highest amount of beam irradiance are
between May and August and they are assumed to be sunny months, the rest of months are
assumed to be cloudy. On sunny months the collector is set at the DST configuration and at
cloudy months at the OFT mode. The capture efficiency of this system is 79%. Table 5
summarise the irradiance at each month.
Table 5: Monthly direct, diffuse and global irradiance capture. For the MTM configurations.
Month Setting Direct Irradiance
kWh/m2
Diffuse Irradiance
kWh/m2
Global Irradiance
kWh/m2
Jan OFT 9 10 20
Feb OFT 19 20 39
Mar OFT 28 40 69
Apr OFT 60 57 117
May DST 101 38 140
June DST 88 43 131
July DST 63 44 108
Aug DST 74 35 109
Sep OFT 30 45 76
Oct OFT 24 28 52
Nov OFT 15 15 30
Dec OFT 7 8 16
Annual 524 388 913
Improving the energy capture of solar collectors
Page 34 of 54
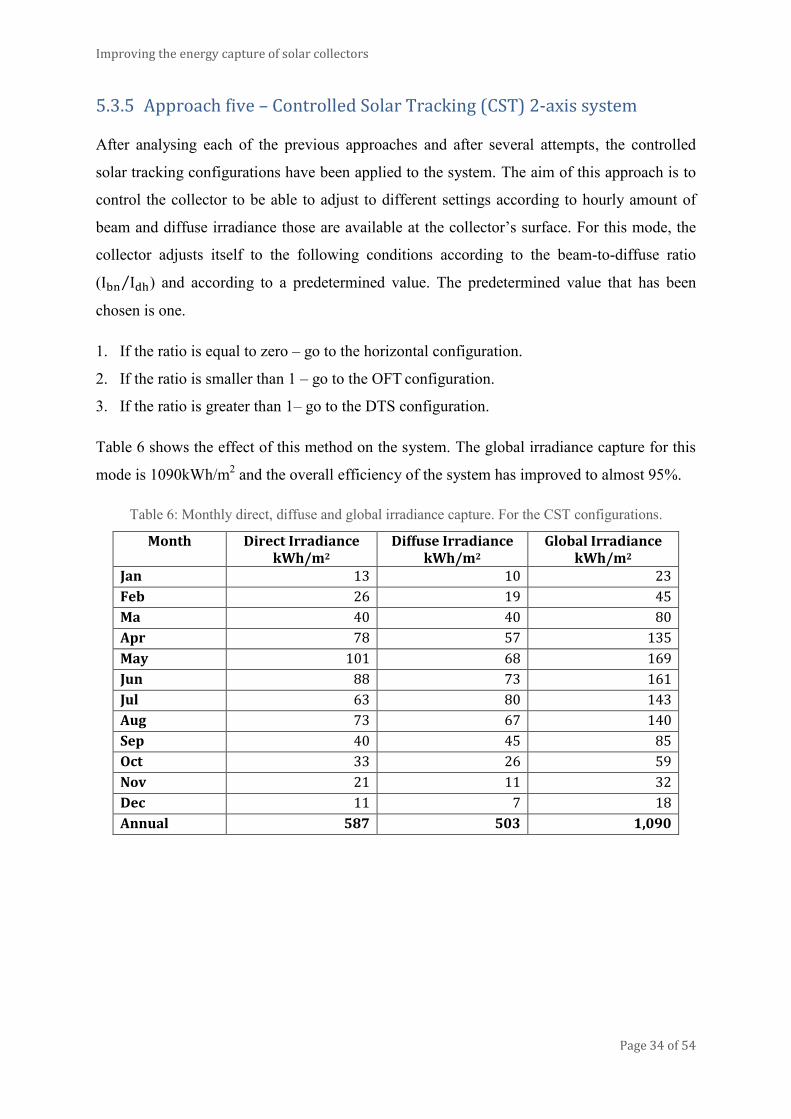
5.3.5 Approach five – Controlled Solar Tracking (CST) 2-axis system
After analysing each of the previous approaches and after several attempts, the controlled
solar tracking configurations have been applied to the system. The aim of this approach is to
control the collector to be able to adjust to different settings according to hourly amount of
beam and diffuse irradiance those are available at the collector’s surface. For this mode, the
collector adjusts itself to the following conditions according to the beam-to-diffuse ratio
( ) and according to a predetermined value. The predetermined value that has been
chosen is one.
1. If the ratio is equal to zero – go to the horizontal configuration.
2. If the ratio is smaller than 1 – go to the OFT configuration.
3. If the ratio is greater than 1– go to the DTS configuration.
Table 6 shows the effect of this method on the system. The global irradiance capture for this
mode is 1090kWh/m2 and the overall efficiency of the system has improved to almost 95%.
Table 6: Monthly direct, diffuse and global irradiance capture. For the CST configurations.
Month Direct Irradiance kWh/m2
Diffuse Irradiance kWh/m2
Global Irradiance kWh/m2
Jan 13 10 23
Feb 26 19 45
Ma 40 40 80
Apr 78 57 135
May 101 68 169
Jun 88 73 161
Jul 63 80 143
Aug 73 67 140
Sep 40 45 85
Oct 33 26 59
Nov 21 11 32
Dec 11 7 18
Annual 587 503 1,090
Improving the energy capture of solar collectors
Page 35 of 54
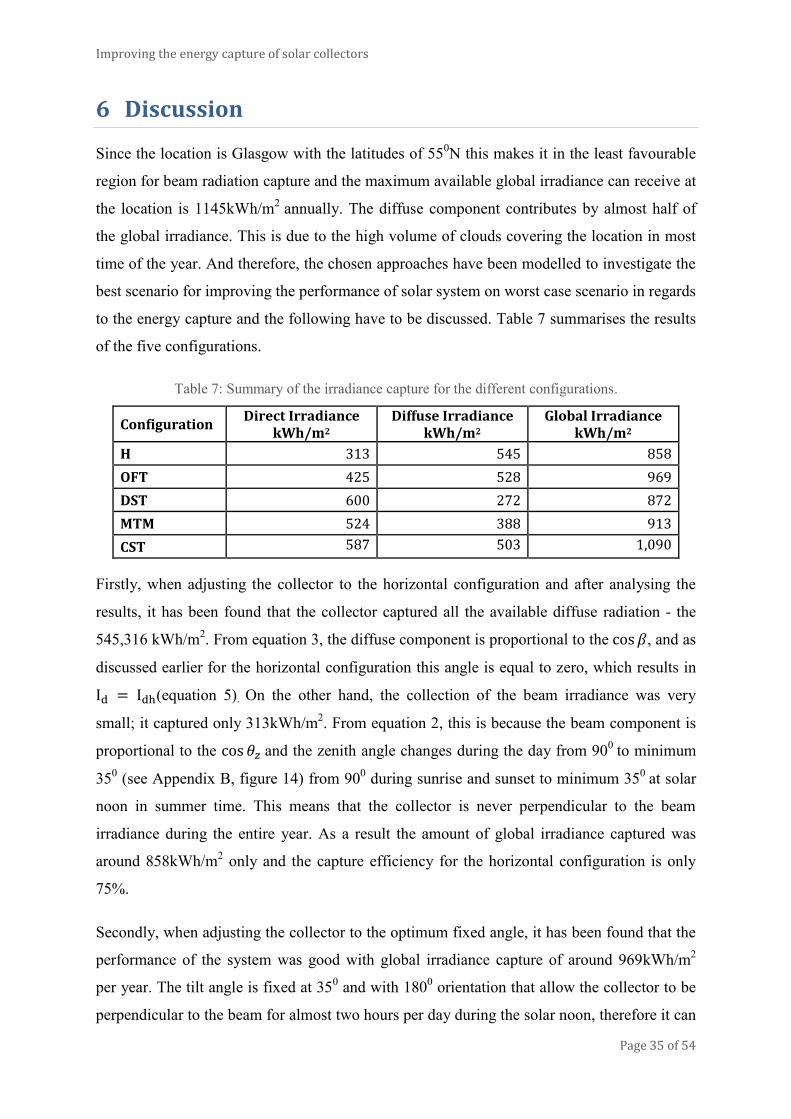
6 Discussion
Since the location is Glasgow with the latitudes of 550N this makes it in the least favourable
region for beam radiation capture and the maximum available global irradiance can receive at
the location is 1145kWh/m2
annually. The diffuse component contributes by almost half of
the global irradiance. This is due to the high volume of clouds covering the location in most
time of the year. And therefore, the chosen approaches have been modelled to investigate the
best scenario for improving the performance of solar system on worst case scenario in regards
to the energy capture and the following have to be discussed. Table 7 summarises the results
of the five configurations.
Table 7: Summary of the irradiance capture for the different configurations.
Configuration Direct Irradiance
kWh/m2 Diffuse Irradiance
kWh/m2 Global Irradiance
kWh/m2
H 313 545 858
OFT 425 528 969
DST 600 272 872
MTM 524 388 913
CST 587 503 1,090
Firstly, when adjusting the collector to the horizontal configuration and after analysing the
results, it has been found that the collector captured all the available diffuse radiation - the
545,316 kWh/m2. From equation 3, the diffuse component is proportional to the , and as
discussed earlier for the horizontal configuration this angle is equal to zero, which results in
(equation 5). On the other hand, the collection of the beam irradiance was very
small; it captured only 313kWh/m2. From equation 2, this is because the beam component is
proportional to the and the zenith angle changes during the day from 900
to minimum
350 (see Appendix B, figure 14) from 90
0 during sunrise and sunset to minimum 35
0 at solar
noon in summer time. This means that the collector is never perpendicular to the beam
irradiance during the entire year. As a result the amount of global irradiance captured was
around 858kWh/m2 only and the capture efficiency for the horizontal configuration is only
75%.
Secondly, when adjusting the collector to the optimum fixed angle, it has been found that the
performance of the system was good with global irradiance capture of around 969kWh/m2
per year. The tilt angle is fixed at 350 and with 180
0 orientation that allow the collector to be
perpendicular to the beam for almost two hours per day during the solar noon, therefore it can
Improving the energy capture of solar collectors
Page 36 of 54
collects more beam irradiance than the horizontal model, the beam collection reached
425kWh/m2 per year. On the other hand, this configuration reduced the diffuse collection.
From equation 3, adjusting the tilt to 350
has led to decrease the diffuse component
comparing with the horizontal configuration, so that . It has been noticed that
reducing this optimum angle would increase the diffuse component but unlikely it will reduce
the beam component at the same time and as a result this will shrink the global capture. The
contribution of beam irradiance was high enough to left the capture energy efficiency to 84%.
When tracking the sun with the DST configuration, it has been noticed that the energy
efficiency reached to 76% which is less than the efficiency of the OFT configuration. The
DST mode allows the collector to be perpendicular to the beam irradiance all the year and
therefore to collect all available normal beam radiation. According to equation 7, the beam
component is equal to the beam normal for this configuration and it collect the maximum
available direct normal irradiance the 600kWh/m2. On the other hand, the diffuse contribution
was relatively very small, this because the collector is following the zenith angle all the year.
From equation 8, as the zenith angle increases from zero the diffuse component decreases. To
calculate the tracking advantage following formula can be used
it compares the tracking advantage to the OFT mode. The tracking advantage is
-23% which means that the DST approach is inefficient for optimizing irradiance capture in
cloudy conditions and there will be a performance drawback of 23% than the performance of
the OFT model.
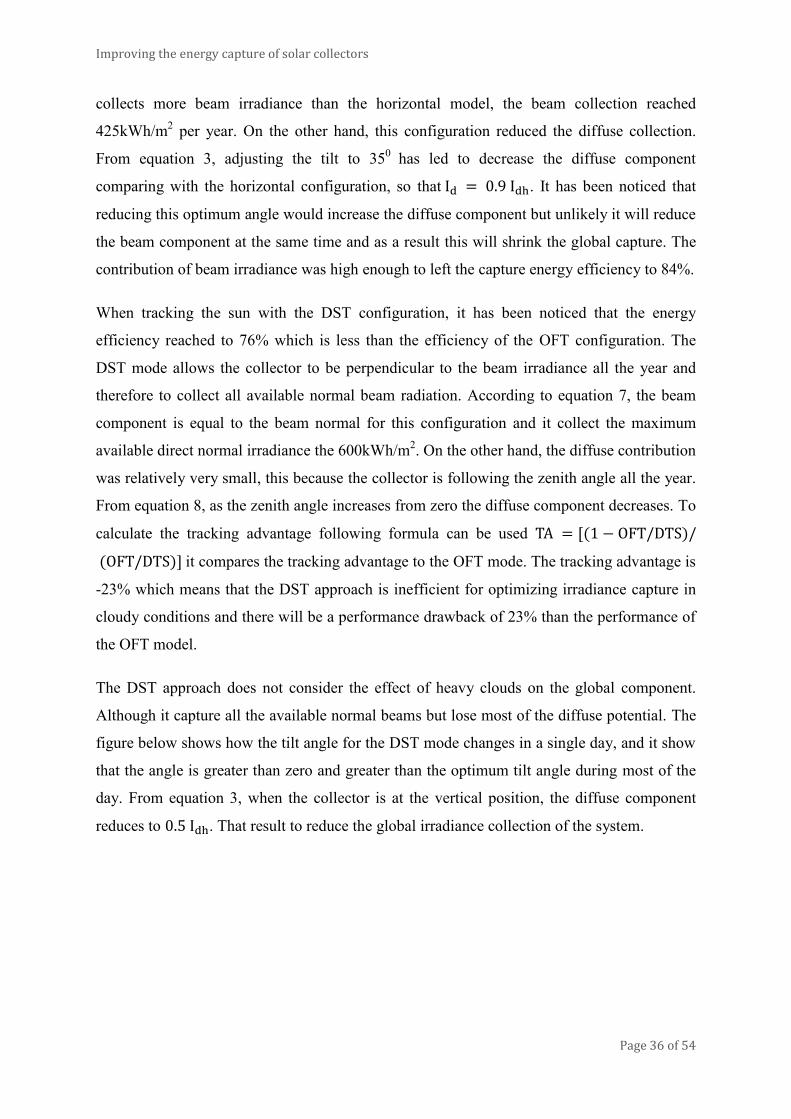
The DST approach does not consider the effect of heavy clouds on the global component.
Although it capture all the available normal beams but lose most of the diffuse potential. The
figure below shows how the tilt angle for the DST mode changes in a single day, and it show
that the angle is greater than zero and greater than the optimum tilt angle during most of the
day. From equation 3, when the collector is at the vertical position, the diffuse component
reduces to . That result to reduce the global irradiance collection of the system.
Improving the energy capture of solar collectors
Page 37 of 54
Figure 9: Change of the tilt angle, during the 7th of May.
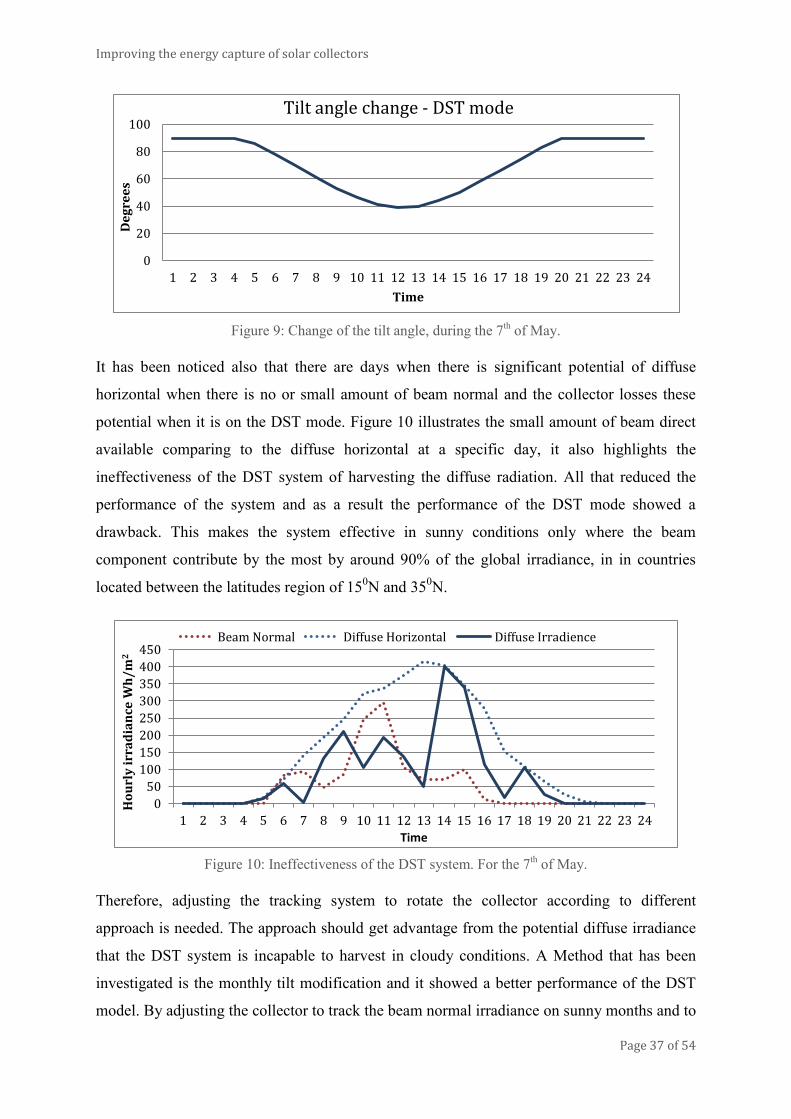
It has been noticed also that there are days when there is significant potential of diffuse
horizontal when there is no or small amount of beam normal and the collector losses these
potential when it is on the DST mode. Figure 10 illustrates the small amount of beam direct
available comparing to the diffuse horizontal at a specific day, it also highlights the
ineffectiveness of the DST system of harvesting the diffuse radiation. All that reduced the
performance of the system and as a result the performance of the DST mode showed a
drawback. This makes the system effective in sunny conditions only where the beam
component contribute by the most by around 90% of the global irradiance, in in countries
located between the latitudes region of 150N and 35
0N.
Figure 10: Ineffectiveness of the DST system. For the 7th of May.
Therefore, adjusting the tracking system to rotate the collector according to different
approach is needed. The approach should get advantage from the potential diffuse irradiance
that the DST system is incapable to harvest in cloudy conditions. A Method that has been
investigated is the monthly tilt modification and it showed a better performance of the DST
model. By adjusting the collector to track the beam normal irradiance on sunny months and to
0
20
40
60
80
100
1 2 3 4 5 6 7 8 9 10 11 12 13 14 15 16 17 18 19 20 21 22 23 24
De
gre
es
Time
Tilt angle change - DST mode
0
50
100
150
200
250
300
350
400
450
1 2 3 4 5 6 7 8 9 10 11 12 13 14 15 16 17 18 19 20 21 22 23 24
Ho
url
y i
rra
dia
nce
Wh
/m
2
Time
Beam Normal Diffuse Horizontal Diffuse Irradience
Improving the energy capture of solar collectors
Page 38 of 54
collect the maximum possible of the beam and diffuse irradiance on cloudy months, the
capture efficiency for this system reached to 79%. The system has been adjusted to go on
DST mode on the sunny months and to the OFT on cloudy ones. This has increased the
annual global capture to 913kWh/m2
from 872kWh/m2 for the DST. The figure bellow shows
how the system can improve slightly the global irradiance capture on cloudy months by
adjusting the angle at the optimum configuration.
However, according to the study that has been carried out by GM company (Kelly & Gibson,
2009), it suggested to use the same approach but with different settings. Their concept is to
use the same configuration on the sunny periods to track the sun and to adjust to the
horizontal mode instead of the OFT mode on the cloudy periods. But it has been found that
applying this would reduce the global capture instead of increasing it for this location. That is
summarized in figure 11.
Figure 11: Performance comparison of MTM system with the DST system and the H,DST system
(suggested by GM).
And finally, the last approach that has been investigated is the controlled tracking system.
This approach has improved the capture efficiency of a 2-axis tracking system from 76% for
the DST to 95%, and the tracking advantage of the systems reaches to 11%. The three control
conditions allow the system to adjust itself according to the amount of irradiance available.
The collector will still be perpendicular to the beam normal irradiance only when this amount
is greater than the diffuse ( ), when the diffuse component overcome the beam
component ( ) it will adjust itself to the OFT mode this will allow the collector to
collect both types of irradiance, and when there is no beam normal on the surface
it will adjust to the horizontal mode to get benefit from all the diffuse horizontal irradiance
when occurred at the location. This enable the system to captures most of the valuable diffuse
0
20
40
60
80
100
120
140
160
Jan Feb Mar Apr May June July Aug Sep Oct Nov Dec
Mo
nth
ly I
rra
dia
nce
kW
h/
m2
DST - Global Irradiance MTM - Global Irradiance H,DST - Global Irradiance
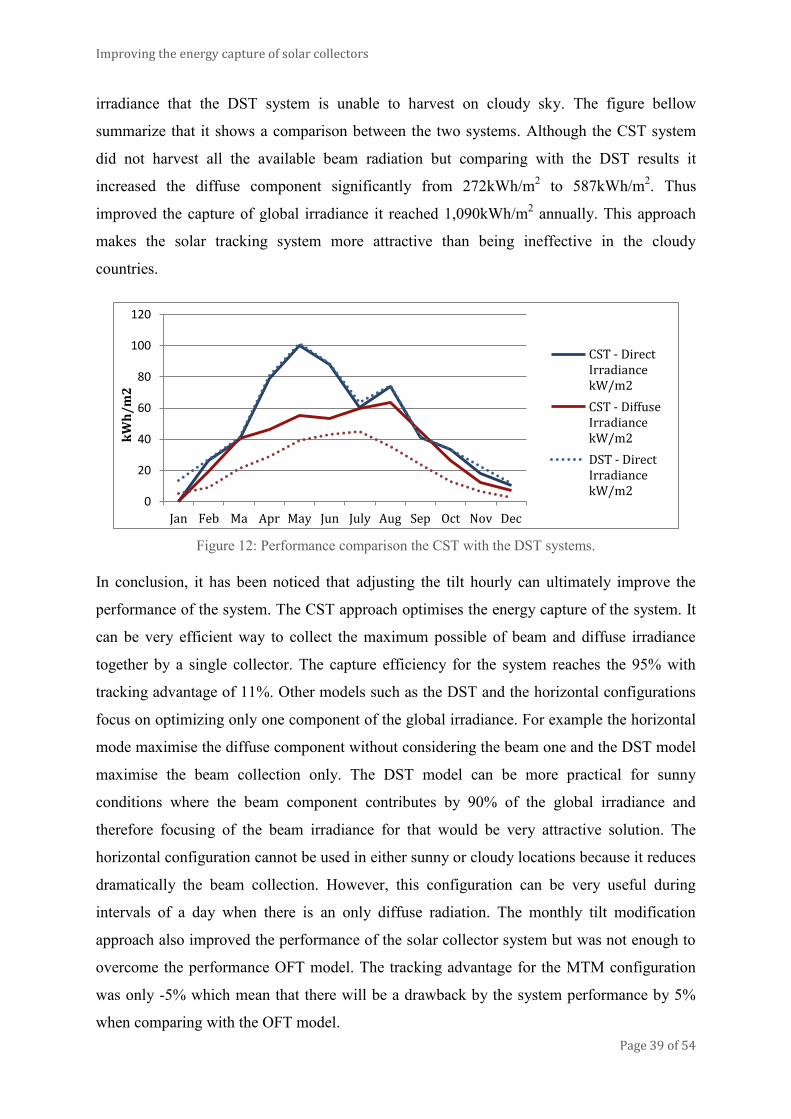
Improving the energy capture of solar collectors
Page 39 of 54
irradiance that the DST system is unable to harvest on cloudy sky. The figure bellow
summarize that it shows a comparison between the two systems. Although the CST system
did not harvest all the available beam radiation but comparing with the DST results it
increased the diffuse component significantly from 272kWh/m2 to 587kWh/m
2. Thus
improved the capture of global irradiance it reached 1,090kWh/m2 annually. This approach
makes the solar tracking system more attractive than being ineffective in the cloudy
countries.
Figure 12: Performance comparison the CST with the DST systems.
In conclusion, it has been noticed that adjusting the tilt hourly can ultimately improve the
performance of the system. The CST approach optimises the energy capture of the system. It
can be very efficient way to collect the maximum possible of beam and diffuse irradiance
together by a single collector. The capture efficiency for the system reaches the 95% with
tracking advantage of 11%. Other models such as the DST and the horizontal configurations
focus on optimizing only one component of the global irradiance. For example the horizontal
mode maximise the diffuse component without considering the beam one and the DST model
maximise the beam collection only. The DST model can be more practical for sunny
conditions where the beam component contributes by 90% of the global irradiance and
therefore focusing of the beam irradiance for that would be very attractive solution. The
horizontal configuration cannot be used in either sunny or cloudy locations because it reduces
dramatically the beam collection. However, this configuration can be very useful during
intervals of a day when there is an only diffuse radiation. The monthly tilt modification
approach also improved the performance of the solar collector system but was not enough to
overcome the performance OFT model. The tracking advantage for the MTM configuration
was only -5% which mean that there will be a drawback by the system performance by 5%
when comparing with the OFT model.
0
20
40
60
80
100
120
Jan Feb Ma Apr May Jun July Aug Sep Oct Nov Dec
kW
h/
m2
CST - Direct Irradiance kW/m2
CST - Diffuse Irradiance kW/m2
DST - Direct Irradiance kW/m2
Improving the energy capture of solar collectors
Page 40 of 54
6.1 Implementing the CST system
To set up the solar collector at the CST system some enhancements are required to add to the
embodiment of the DST system. The simplest method is by using historical data of solar
irradiance at the selected site and uses it to manage the tilt angle of the collector. It has to be
hourly step data for around 20 years and after analysing this data a specific algorithm would
be created into a computerized control system. For example, when the available beam
radiation is greater than a predetermined value according to the algorithm used, the control
system will give a signal to the collector to align with the step motor and to adjust to the DST
settings by using a sun pointing programme, and when the beam radiation is less than the
predetermined value the control system will adjust the collector to either the horizontal or the
OFT settings. However, this method requires historical data and it can vary from year to
another and therefore the efficiency of this method can be very limited.
The other method which it is the preferred one is by using solar radiation sensors to measure
the global-to-direct irradiance (ISEC, 2001). This require two sensors the first can be
pyroheliometer which measures the beam normal irradiance and the second solarimeter
which measures the global irradiance. According to the ratio of the two measurements a
predetermined value would be set to determine the mode of the collectors and when to align
to the tracking motor. This method can be more accurate than using historical data since it
measures the irradiances instinctually. The sensors can be mounted in different ways and this
is beyond the study of this paper but is highly recommended for further research and studies.
Both options require computerized control system with a defined algorithm, step motor to
rotate the angles of the collector and sensors or sun pointing programme (Kelly & Gibson,
2010). Different embodiments can be applied for the CST approach and different
technologies have been developed so far to measure the solar radiation. For example, the
Single Detector Rotating Shadowband Radiometer SDR-1 can be used to replace the sensors,
this measure the three types of radiation (pyrheliometer/pyranometer/shaded pyranometer)
(Yankee Environmental Systems, Inc, 2003).
6.2 Financial analysis
The economic problem of solar systems design is to find the lowest and size for the same
capacity. Although the financial scale of solar collectors is not the focus of this paper but it is
important to highlight the effect of solar tracking system on the cost. This section is going to
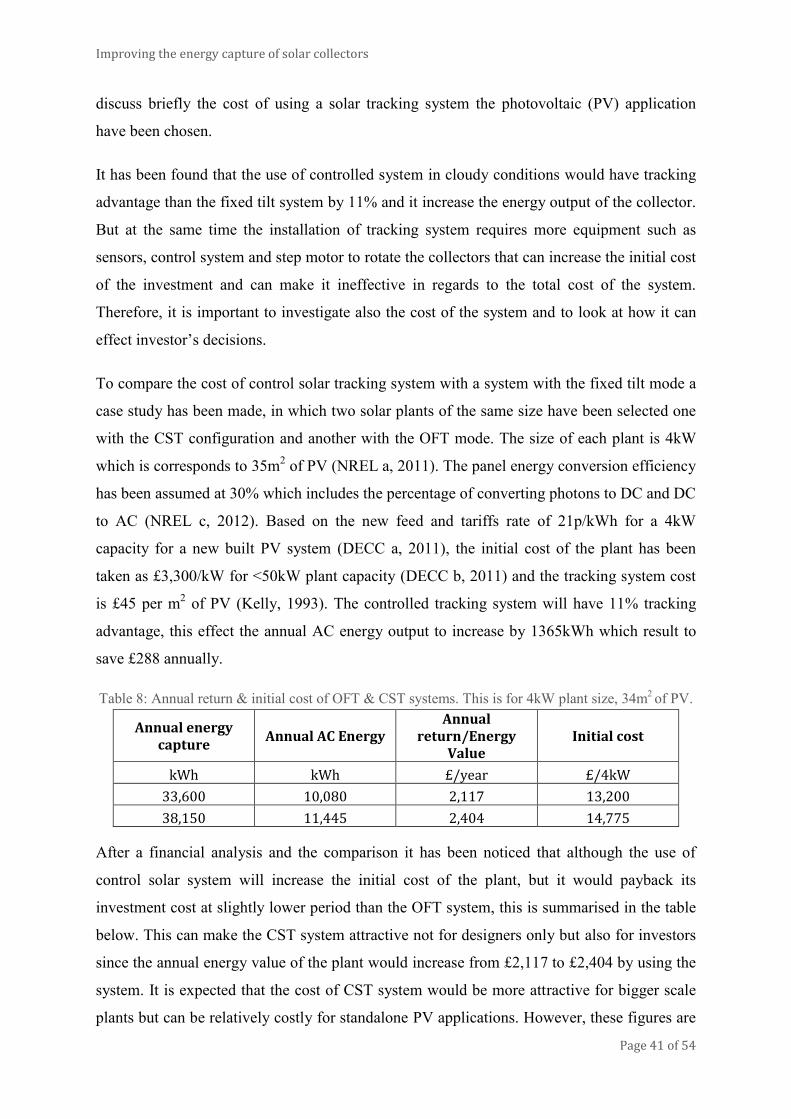
Improving the energy capture of solar collectors
Page 41 of 54
discuss briefly the cost of using a solar tracking system the photovoltaic (PV) application
have been chosen.
It has been found that the use of controlled system in cloudy conditions would have tracking
advantage than the fixed tilt system by 11% and it increase the energy output of the collector.
But at the same time the installation of tracking system requires more equipment such as
sensors, control system and step motor to rotate the collectors that can increase the initial cost
of the investment and can make it ineffective in regards to the total cost of the system.
Therefore, it is important to investigate also the cost of the system and to look at how it can
effect investor’s decisions.
To compare the cost of control solar tracking system with a system with the fixed tilt mode a
case study has been made, in which two solar plants of the same size have been selected one
with the CST configuration and another with the OFT mode. The size of each plant is 4kW
which is corresponds to 35m2 of PV (NREL a, 2011). The panel energy conversion efficiency
has been assumed at 30% which includes the percentage of converting photons to DC and DC
to AC (NREL c, 2012). Based on the new feed and tariffs rate of 21p/kWh for a 4kW
capacity for a new built PV system (DECC a, 2011), the initial cost of the plant has been
taken as £3,300/kW for <50kW plant capacity (DECC b, 2011) and the tracking system cost
is £45 per m2 of PV (Kelly, 1993). The controlled tracking system will have 11% tracking
advantage, this effect the annual AC energy output to increase by 1365kWh which result to
save £288 annually.
Table 8: Annual return & initial cost of OFT & CST systems. This is for 4kW plant size, 34m2 of PV.
Annual energy capture
Annual AC Energy Annual
return/Energy Value
Initial cost
kWh kWh £/year £/4kW
33,600 10,080 2,117 13,200
38,150 11,445 2,404 14,775
After a financial analysis and the comparison it has been noticed that although the use of
control solar system will increase the initial cost of the plant, but it would payback its
investment cost at slightly lower period than the OFT system, this is summarised in the table
below. This can make the CST system attractive not for designers only but also for investors
since the annual energy value of the plant would increase from £2,117 to £2,404 by using the
system. It is expected that the cost of CST system would be more attractive for bigger scale
plants but can be relatively costly for standalone PV applications. However, these figures are
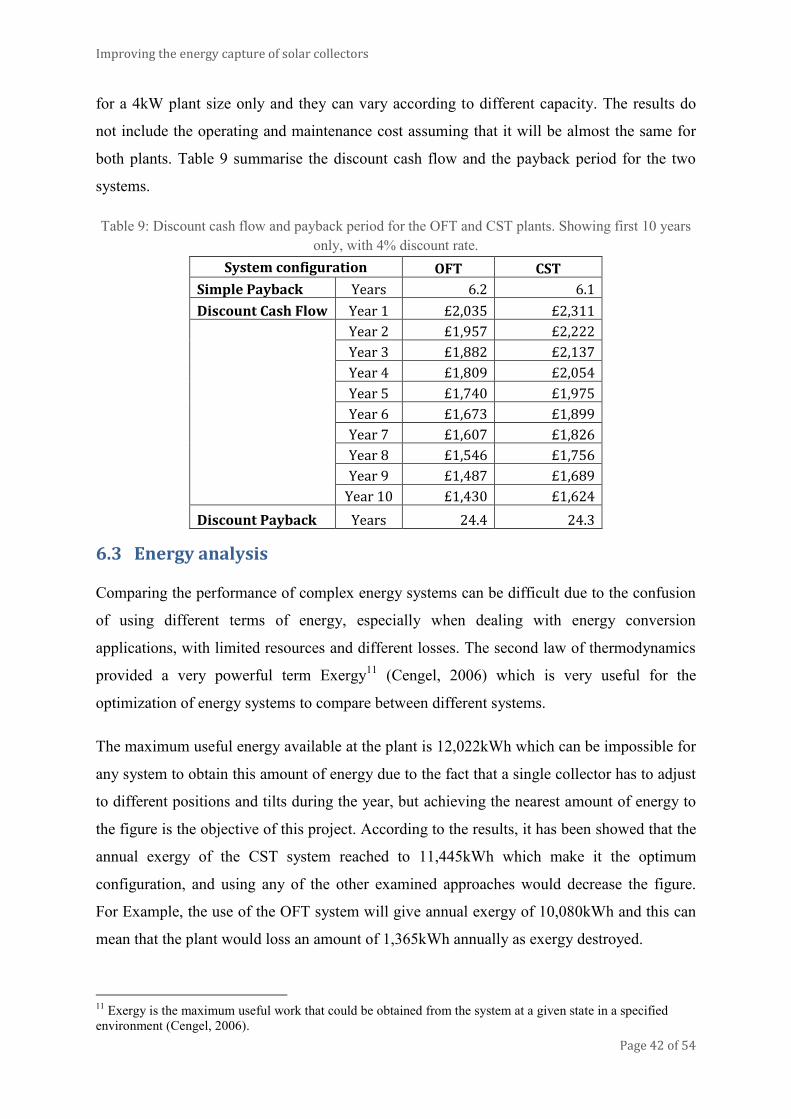
Improving the energy capture of solar collectors
Page 42 of 54
for a 4kW plant size only and they can vary according to different capacity. The results do
not include the operating and maintenance cost assuming that it will be almost the same for
both plants. Table 9 summarise the discount cash flow and the payback period for the two
systems.
Table 9: Discount cash flow and payback period for the OFT and CST plants. Showing first 10 years
only, with 4% discount rate.
System configuration OFT CST
Simple Payback Years 6.2 6.1
Discount Cash Flow Year 1 £2,035 £2,311
Year 2 £1,957 £2,222
Year 3 £1,882 £2,137
Year 4 £1,809 £2,054
Year 5 £1,740 £1,975
Year 6 £1,673 £1,899
Year 7 £1,607 £1,826
Year 8 £1,546 £1,756
Year 9 £1,487 £1,689
Year 10 £1,430 £1,624
Discount Payback Years 24.4 24.3
6.3 Energy analysis
Comparing the performance of complex energy systems can be difficult due to the confusion
of using different terms of energy, especially when dealing with energy conversion
applications, with limited resources and different losses. The second law of thermodynamics
provided a very powerful term Exergy11
(Cengel, 2006) which is very useful for the
optimization of energy systems to compare between different systems.
The maximum useful energy available at the plant is 12,022kWh which can be impossible for
any system to obtain this amount of energy due to the fact that a single collector has to adjust
to different positions and tilts during the year, but achieving the nearest amount of energy to
the figure is the objective of this project. According to the results, it has been showed that the
annual exergy of the CST system reached to 11,445kWh which make it the optimum
configuration, and using any of the other examined approaches would decrease the figure.
For Example, the use of the OFT system will give annual exergy of 10,080kWh and this can
mean that the plant would loss an amount of 1,365kWh annually as exergy destroyed.
11
Exergy is the maximum useful work that could be obtained from the system at a given state in a specified
environment (Cengel, 2006).

Improving the energy capture of solar collectors
Page 43 of 54
Table 10: Exergy comparison of the OFT and CST systems.
Single PV 4kW plant Global available
Irradiance kWh/m2/year AC Energy kWh/year
1,145 12,022 Global captured
Irradiance kWh/m2/year Exergy kWh/year
OFT 969 10,080 CST 1,090 11,445
Improving the energy capture of solar collectors
Page 44 of 54
7 Conclusion
Solar energy is a valuable renewable source that can be utilized to provide electrical and
thermal power. It offers the greatest energy potential compared with other currently known
renewable resources. Harnessing the use of solar energy requires more research and
development to improve the efficiency of solar applications. The solar energy received by
any surface on earth as component of beam and diffuse radiation and the total amount of
daily insulation varies according to location, season and time. Understanding of these factors
is important for the design of any solar application because it can affect its performance.
Optimizing the mounting of the solar systems can ultimately improve the energy capture and
ultimately increase the performance of the system.
According to the study, 2-axis solar tracking devices are designed to improve the
performance of solar collectors by following the sun positions. The traditional tracking
systems track the normal beams directly and it increases the performance of solar collectors
by around 50% in summer and around 30% in winter for a clear sky condition. It has been
established that these figures can vary widely in a cloudy conditions and the efficiency
decreases as the volume of the clouds in the sky increases. It is clear that the tracking devices
are useful for sunny countries where they receive a significant amount of direct radiation;
however the system is less efficient in cloudy conditions or in countries that are assumed to
be cloudy throughout the year. The study has showed how the beam-to diffuse radiation can
dramatically vary from 0.9 to a minimum of 0.1 in different locations and sky conditions; it
draws attention to the importance of diffuse radiation in cloudy regions. This paper
investigated different mounting methods that can improve the performance of solar collectors
by using a 2-axis solar tracking system in cloudy regions.
The project specifically included a model which investigated different approaches for
mounting the collector in a chosen location in Glasgow. It has been found that, when the
collector is on the optimum fixed tilt angle configuration the capture efficiency is at 84%.
When the collector is aligned to a direct tracking device the energy capture of the system
reduced to 23% which means that the direct tracking system is inefficient in cloudy regions.
The paper suggested an approach to use a controlled tracking system, which aimed to manage
the collector to adjust to different settings during the day according to different conditions.
This can be achieved by using a simple algorithm that controls the collector according to the
beam-to-diffuse ratio. When the beam component is higher than the diffuse the collector will

Improving the energy capture of solar collectors
Page 45 of 54
track the solar beams, when the beam component is less than the diffuse it will adjust to the
optimum fixed tilt angle and when there is no beam radiation the collector will take the
horizontal position. The approach increased the energy capture by 11% and the efficiency of
the system reach to 95%, making it the optimum solution for improving the energy capture
for the chosen case. The study suggested recommends embodiment of the controlled tracking
system by using sensors to measure the beam and diffuse radiation, sun-pointing programme,
control system and step motor to rotate the collector.
In regards to the financial scale of the system, an analysis has been done to compare the cost
of two solar plants, one uses moving collectors aligned to tracking device and another with a
fixed collectors mounted according to the optimum tilt settings. It has been concluded that the
controlled tracking system saves £288 annually, and although its initial cost is higher than a
fixed collector, the system pays its investment in slightly shorter period.
Finally the paper introduced the term exergy to compare the useful power of the suggested
system with the optimum fixed tilt approach. According to the case study, the use of the
system will give an annual exergy of 11,445kWh, whilst implementing any other approach
will lead to energy loss. It used an example to show that there will be an amount of
1,365kWh of exergy destroyed annually when using the optimum fixed tilt approach.
In conclusion tracking devices can be useful to increase the harvesting of solar energy not
only in clear sky conditions but also in cloudy ones. Assessing the solar radiation during early
design stages is important, since it helps choosing of the optimum configuration for the solar
system. The diffuse component in cloudy regions is very important to consider during design
of the system. Finally, the study concludes the improvement of solar collectors in cloudy
regions can be achieved by using a controlled tracking system, which is designed in such a
way as to consider both beam and diffuse components.
Improving the energy capture of solar collectors
Page 46 of 54
8 Further research
The objective of this paper is to focus solely on improving the performance of flat solar
collectors in regards of energy capture. It should be noted that there are other inter-related
subjects not covered in detail in this paper but where further research would be relevant.
These are:
8.1 Embodiments of controlled solar tracking system
Using the concept of the CST system require different embodiments than a normal tracking
system. The paper suggested two types of flat plate collectors with controlled tracking system
by using either historical data or by using instantaneous measuring devices such as sensors to
measure the available direct and diffuse radiation. The embodiments of such systems require
more investigation to address the best eco-efficient approach. However, this kind of research
can be classified under the measurements of solar radiation area, which is a very wide subject
and it is not the scope of this study.
8.2 Algorithm improvement
The model included a very simple algorithm that manage when the collector has to follow the
sun, when to adjust to the OFT position and to the horizontal position. The predetermined
value has been taken as one as it is found to be the best value for a collector in Glasgow, and
this value can vary according to different locations and different sky condition at the location.
Therefore, an improved algorithm can be further investigated to manage the tracking system
to make it valuable for all conditions and locations.
8.3 Balance of plant for solar farms with solar tracking system
The major problem effecting the development of solar energy is the initial cost of the system
and especially for PV. Although finding ways to optimize the energy capture of solar
systems are seriously needed but this should be achieved in a way not to increase the cost and
the size of the system. CST 2-axis tracking systems require more equipment and
configurations than the fixed tilt systems that will increase the initial and the operating cost of
the system and therefore research is needed to investigate the cost of different equipment’s, to
compare the effect of CST system for different plants size. Thus can be done by
implementing a balance of plant analysis for solar plants, this subjected method would give

Improving the energy capture of solar collectors
Page 47 of 54
more figures and numbers in regards to the finical factor of installing a solar tracking system
in cloudy conditions.
Improving the energy capture of solar collectors
Page 48 of 54
9 Bibliography
Armstrong, S. & Hurley, W.G., 2009. A New Methodology to Optimise solar Energy
Extraction Under Cloudy Conditions. Renewable Energy, 35(2010), pp.780-87.
Catarius, A., 2010. Azimuth-Altitude Dual Axis Solar Tracker. [Online] Available at:
http://www.wpi.edu/Pubs/E-project/Available/E-project-121710-
140419/unrestricted/Dual_Axis_Tracker_Final_Report.pdf [Accessed 12 August 2012].
Cengel, Y.A., 2006. Thermodynamics And engineering approach. New Your: McGrow- Hill
Education.
Centre for Energy and Processes, Ecole des Mines de Paris, 2006. Maps of Irradiation,
Irradiance, and UV. [Online] Available at: http://www.soda-
is.com/eng/map/maps_for_free.html#monde [Accessed 2012 August 28].
CIBSE, 2002. Weather, solar and illuminance data. Guide. London: The Chartered
Institution of Building Services Engineers The Chartered Institution of Building Services
Engineers.
DECC a, 2011. Comprehensive Review Phase 1: Consulation On Feed-In Tariffs for Solar
PV. [Online] Available at:
http://www.decc.gov.uk/en/content/cms/consultations/fits_comp_rev1/fits_comp_rev1.aspx
[Accessed 08 August 2012].
DECC b, 2011. Job number 215030 Review of the Generation Costs and Deployment
potential of Renewable Electricity Technologies in the UK, Study Report. London: Ove Arup
& Partners Ltd.
Duffie, J.A. & Beckman, W.A., 1991. Solar engineering of thermal processes. Hoboken,
N.J.: Wiley-Interscience Publication.
European Photovoltaic Technology Platform, 2011. Europian Commission Reseach &
Inovation. [Online] European Union Available at:
http://ec.europa.eu/research/energy/eu/publications/index_en.cfm#results [Accessed 14
August 2012].
Honsberg, C. & Bowden, S., 2012. Photovoltaic Education Network. [Online] (Stuart May
2012) Available at: http://www.pveducation.org/ [Accessed 22 Jully 2012].
IEA, 2010. Technology Roadmap: Solar Photovoltaic Energy. IEA Publication. Paris: IEA
International Energy Agency.
Iqbal, M., 1983. An Introduction to Solar Radiations. Toronto, New York, London:
Academic Press.
ISEC, 2001. Solar Resources Assessment: A Review. In J. Gordon, ed. Solar Energy: The
State of the Art. London: James & James Ltd. Ch. 10. pp.497-562.
Improving the energy capture of solar collectors
Page 49 of 54
Kelly, H., 1993. Introduction to Photovoltaic Technology. In L. Burnham, ed. Renewable
Energy: Source for Fuel and Electricity. Washington: Island Press. Ch. 6. p.315.
Kelly, N.A. & Gibson, T.L., 2009. Improved photovoltaic energy output for cloudy
conditions with a solar tracking system. Solar Energy, 83(2009), pp.2092-102.
Kelly, N.A. & Gibson, T.L., 2010. Increasing the solar photovoltaic energy captur on sunny
and cloudy days. Solar Energy, 85(2011), pp.111-25.
Kreith, F., 2011. Principle of Sustainable Energy. New York: Taylor & Francis Group.
Messenger, R.A. & Ventre, J., 2012. Photovoltaic Systems Engineering. Third Edition ed.
London: Taylor & Francis Group.
NREL a, 2011. Changing System Parameters. [Online] Available at:
http://www.nrel.gov/rredc/pvwatts/changing_parameters.html [Accessed 9 August 2012].
NREL b, 2011. Device Performance Measurement Site, solar cell current versus voltage
using the Spectrolab X-25 solar simulator. [Online] Available at:
http://www.nrel.gov/pv/measurements/cell_iv.html#spectrolab [Accessed 22 June 2012].
NREL c, 2012. National Center for Photovoltaics. [Online] Available at:
http://www.nrel.gov/ncpv/ [Accessed 15 August 2012].
NREL d, 2011. PVWatts Grid Data Calculator (Version 2). [Online] Available at:
http://www.nrel.gov/rredc/pvwatts/grid.html [Accessed 9 August 2012].
Twidell, J. & Weir, T., 2006. Renewable Energy Resources. London: Tayler and Francis.
Yankee Environmental Systems, Inc, 2003. Visible/Near Infrared Radiometry. [Online]
Available at: http://www.yesinc.com/products/radvis.html [Accessed 2 Jully 2012].
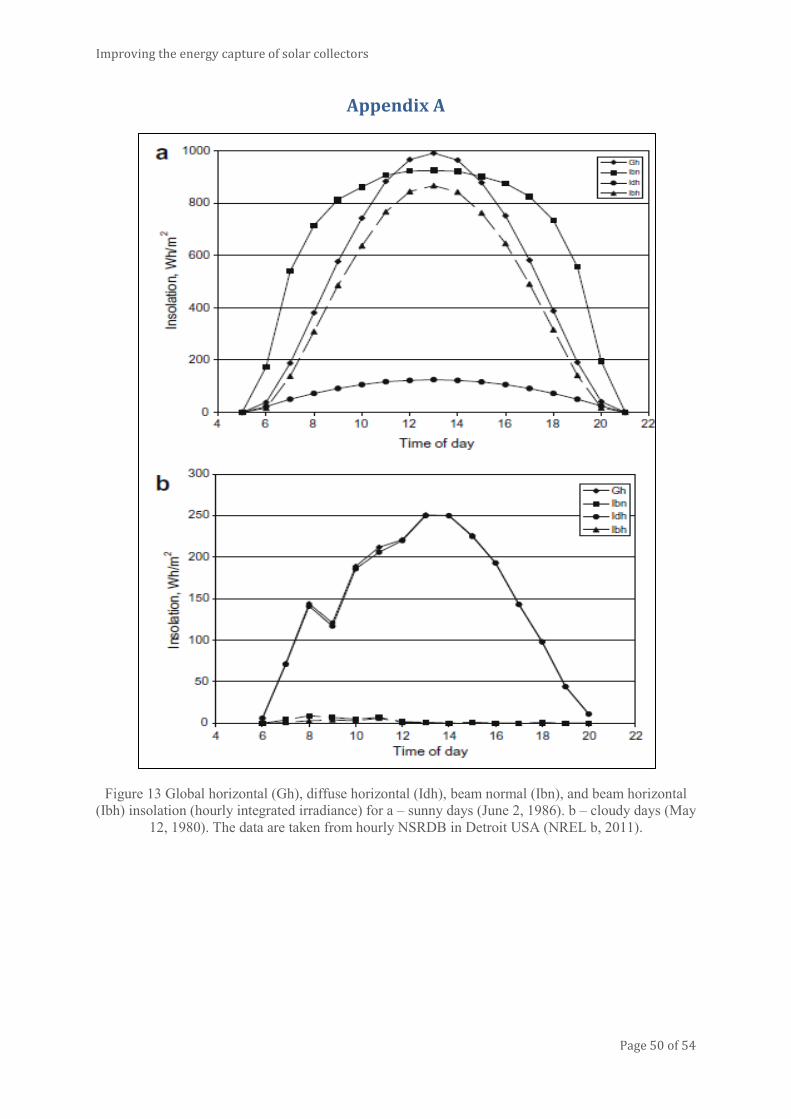
Improving the energy capture of solar collectors
Page 50 of 54
Appendix A
Figure 13 Global horizontal (Gh), diffuse horizontal (Idh), beam normal (Ibn), and beam horizontal
(Ibh) insolation (hourly integrated irradiance) for a – sunny days (June 2, 1986). b – cloudy days (May
12, 1980). The data are taken from hourly NSRDB in Detroit USA (NREL b, 2011).
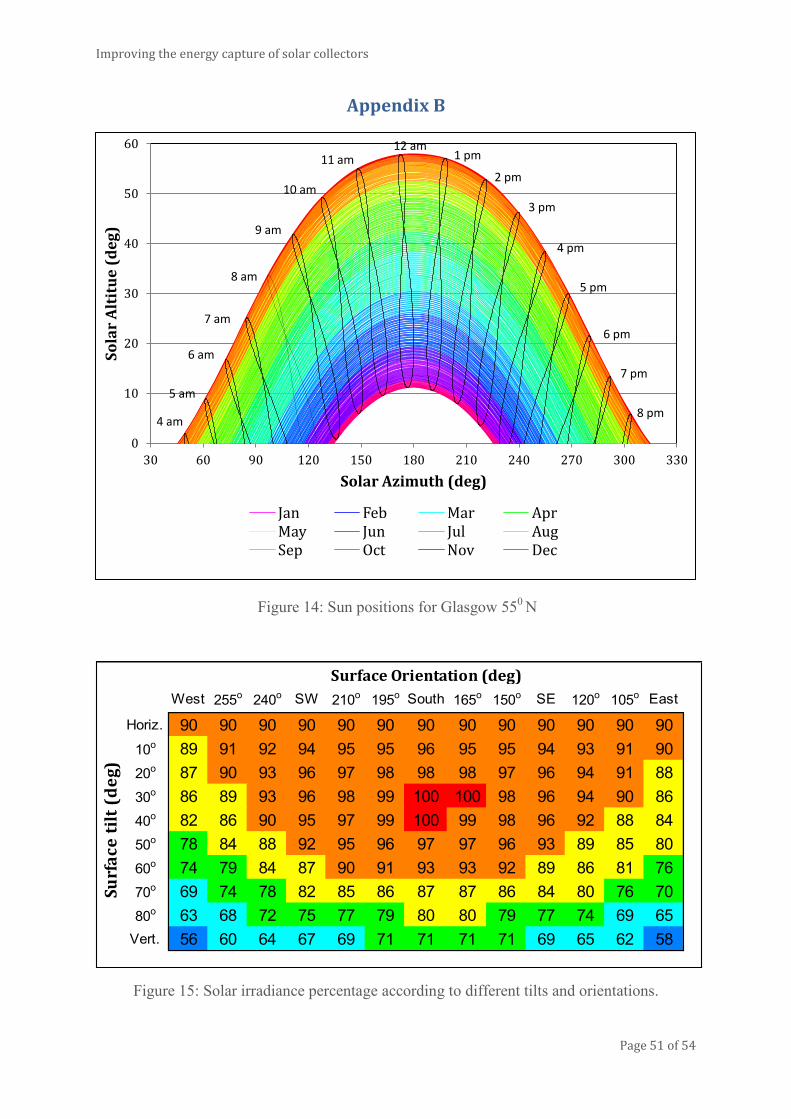
Improving the energy capture of solar collectors
Page 51 of 54
Appendix B
Figure 15: Solar irradiance percentage according to different tilts and orientations.
0
10
20
30
40
50
60
30 60 90 120 150 180 210 240 270 300 330
So
lar
Alt
itu
e (
de
g)
Solar Azimuth (deg)
Jan Feb Mar Apr May Jun Jul Aug Sep Oct Nov Dec
6 am
7 am
8 am
4 am
5 am
9 am
10 am
11 am 12 am
1 pm
2 pm
3 pm
4 pm
5 pm
6 pm
7 pm
8 pm
West 255o 240o SW 210o 195o South 165o 150o SE 120o 105o East
Horiz. 90 90 90 90 90 90 90 90 90 90 90 90 90
10o 89 91 92 94 95 95 96 95 95 94 93 91 90
20o 87 90 93 96 97 98 98 98 97 96 94 91 88
30o 86 89 93 96 98 99 100 100 98 96 94 90 86
40o 82 86 90 95 97 99 100 99 98 96 92 88 84
50o 78 84 88 92 95 96 97 97 96 93 89 85 80
60o 74 79 84 87 90 91 93 93 92 89 86 81 76
70o 69 74 78 82 85 86 87 87 86 84 80 76 70
80o 63 68 72 75 77 79 80 80 79 77 74 69 65
Vert. 56 60 64 67 69 71 71 71 71 69 65 62 58
Surf
ace
til
t (d
eg)
Surface Orientation (deg)
Figure 14: Sun positions for Glasgow 550
N
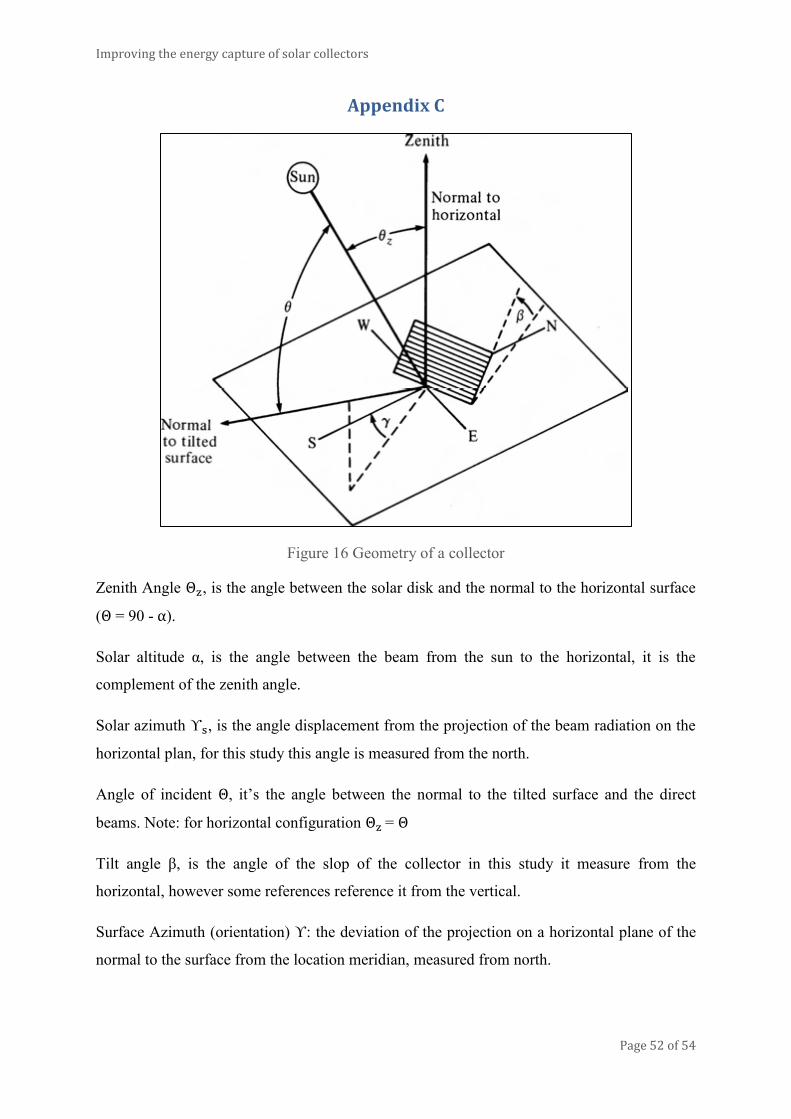
Improving the energy capture of solar collectors
Page 52 of 54
Appendix C
Figure 16 Geometry of a collector
Zenith Angle , is the angle between the solar disk and the normal to the horizontal surface
( = 90 - ).
Solar altitude α, is the angle between the beam from the sun to the horizontal, it is the
complement of the zenith angle.
Solar azimuth , is the angle displacement from the projection of the beam radiation on the
horizontal plan, for this study this angle is measured from the north.
Angle of incident , it’s the angle between the normal to the tilted surface and the direct
beams. Note: for horizontal configuration =
Tilt angle β, is the angle of the slop of the collector in this study it measure from the
horizontal, however some references reference it from the vertical.
Surface Azimuth (orientation) : the deviation of the projection on a horizontal plane of the
normal to the surface from the location meridian, measured from north.
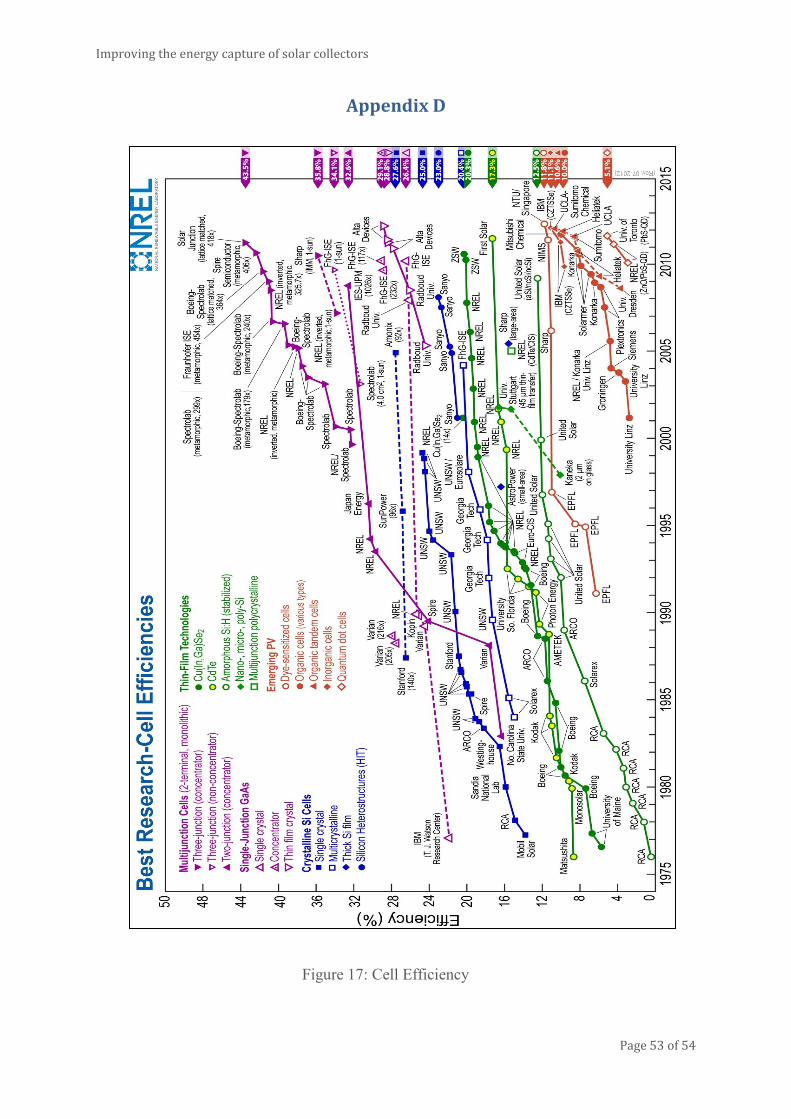
Improving the energy capture of solar collectors
Page 53 of 54
Appendix D
Figure 17: Cell Efficiency
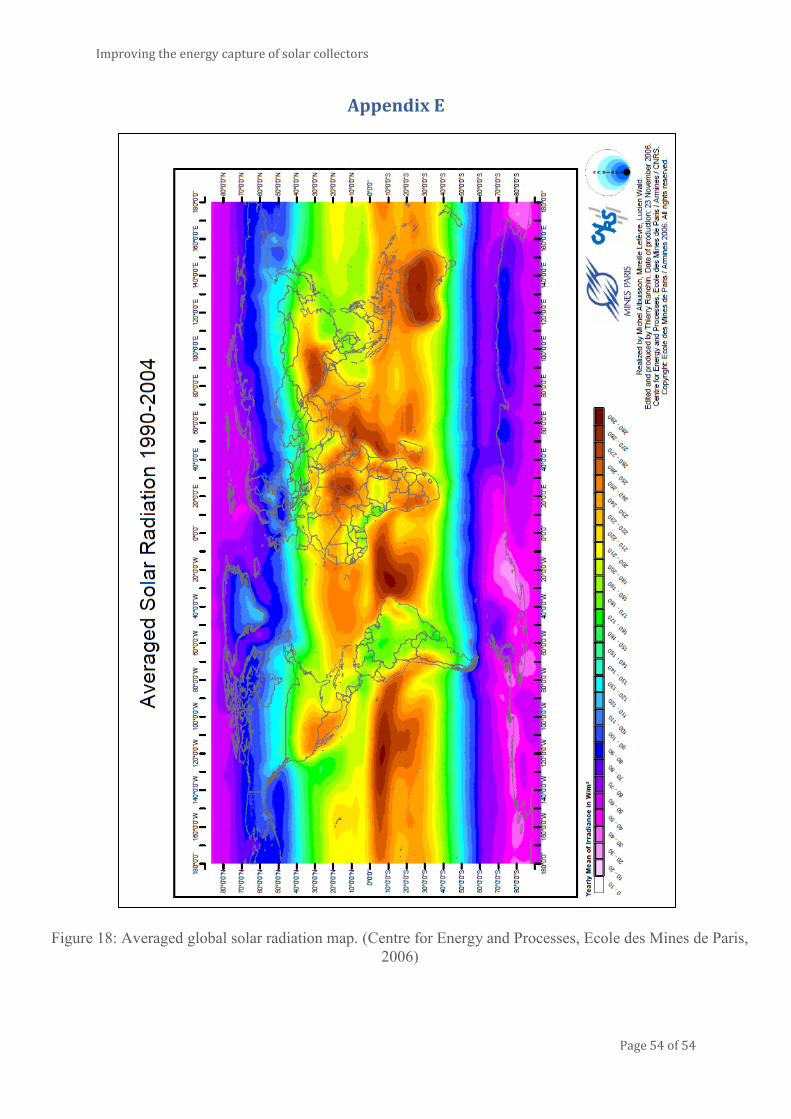
Improving the energy capture of solar collectors
Page 54 of 54
Appendix E
Figure 18: Averaged global solar radiation map. (Centre for Energy and Processes, Ecole des Mines de Paris,
2006)