Embed Size (px)
Citation preview

IMPROVING THE EFFICIENCY OF THE A.I. BY NEW TECHNICAL AND
DIAGNOSTIC METHODS IN CATTLE
1Gábor G, 1Tóth F, 2Szász F, 1Dept. Cattle Breeding and Dept. Cell Biology , Res.
Inst. Anim. Breed. Herceghalom, Hungary, 2Androvet Ltd., Budapest, Hungary
ÁTKHERCEGHALOM
INTRODUCTION
• Prediction of the male’s fertility is based on morphological examinations of the testis or scrotum and the evaluation of the semen quality. Prediction of the semen production would help to reject all those young bulls which certainly will not produce good quality of semen.
• Early pregnancy detection looks a useful tool to check the real fertility of the breeding bulls.
OBJECTIVES• The aims of all our examinations were:
1. to improve the standard BSE (Breeding Soundness Evaluation) by using of testicular tonometry and testicular ultrasonic echotexture,
2.checking semen quality by an objective
inexpensive instrument based method (CASPAR); 3. checking the real bull fertility by early pregnancy
detection used ultrasound and/or PSPB (Pregnancy Specific Protein B) ELISA test (Biopryn, BioTracking, Moscow, ID, USA) .
MATERIAL AND METHODS• 1. Improvement of the standard BSE Holstein-Friesian AI bulls were examined during the
BSE. • Morphological examinations of the testis: scrotal
circumference (SC; used Coulter scrotal tape); scrotal form: digital camera (storing format: jpg); testicular consistency (TM, Consitest electronic tonometer). The ultrasonic examination of the testes (ET) was done with a B-mode scanner (Pie Medical, Model 100 LC VET, Maastricht, The Netherlands) with an 8 MHz linear-array transducer as described earlier and the ultrasound-image was stored on floppy disk. TesTracto software was used for image analysis.
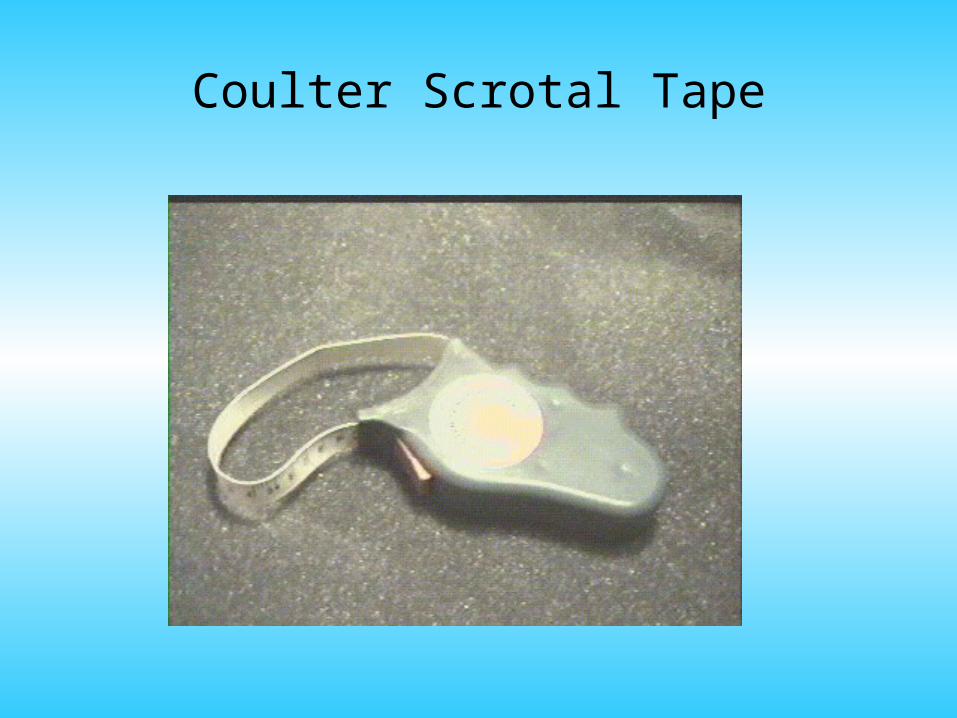
Coulter Scrotal Tape
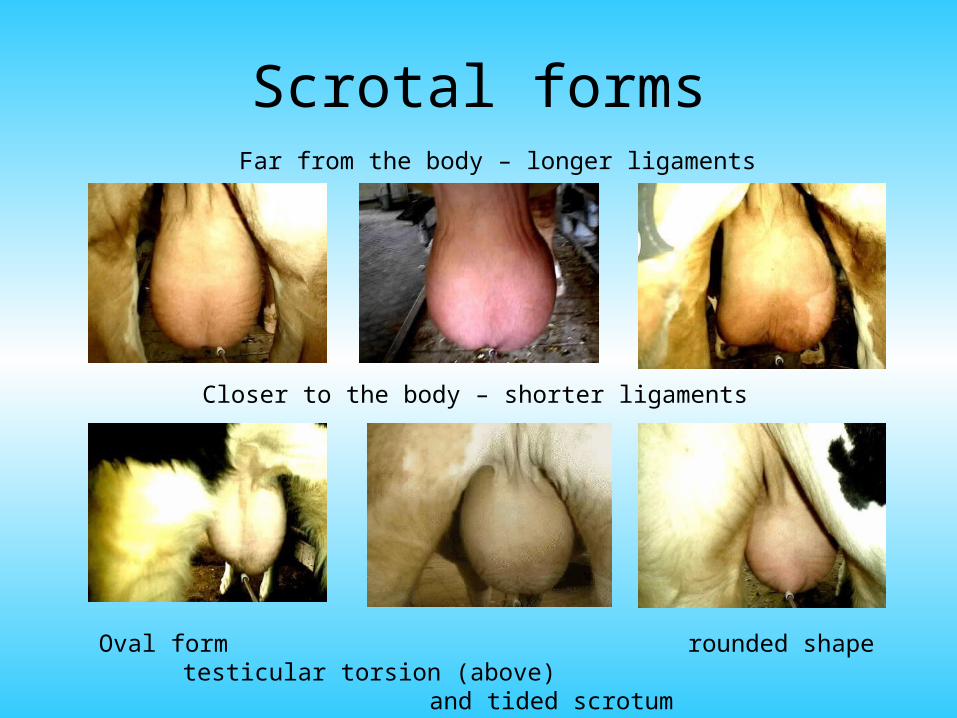
Scrotal formsFar from the body – longer ligaments
Closer to the body – shorter ligaments
Oval form rounded shape testicular torsion (above) and tided scrotum
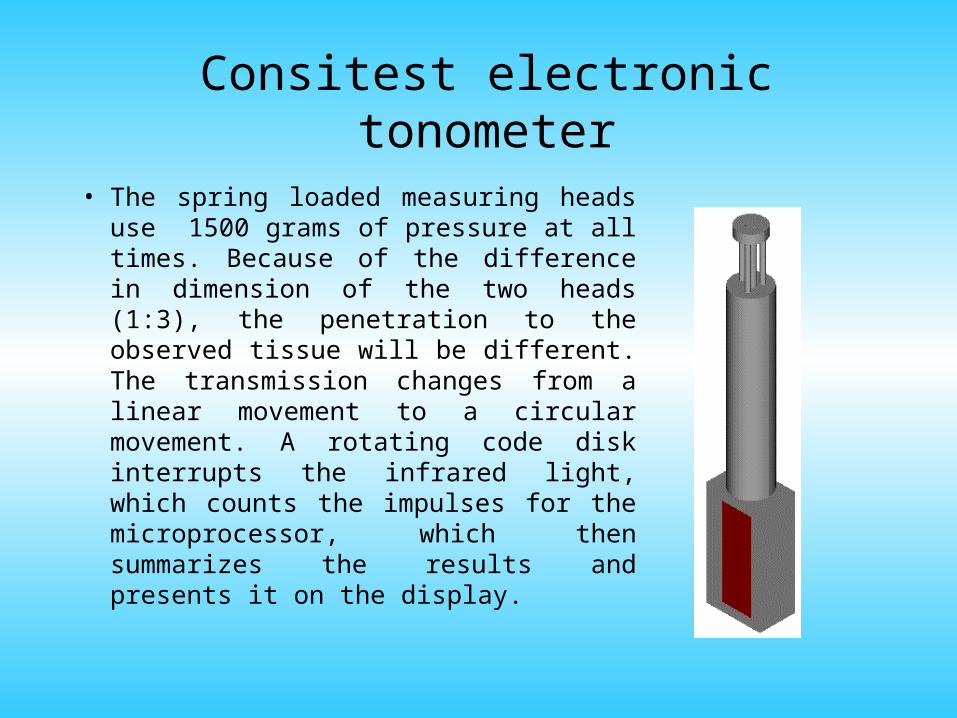
Consitest electronic tonometer
• The spring loaded measuring heads use 1500 grams of pressure at all times. Because of the difference in dimension of the two heads (1:3), the penetration to the observed tissue will be different. The transmission changes from a linear movement to a circular movement. A rotating code disk interrupts the infrared light, which counts the impulses for the microprocessor, which then summarizes the results and presents it on the display.
Examination of the testicular echotexture
• The ultrasonic examination of the testes was done with a B-mode scanner (Pie Medical, Model 100 LC VET) with an 8 MHz linear-array transducer. Gain was held constant for all examinations.
• The transducer was aligned at the center of each testis and perpendicular to the vertical axis. A custom, electro-mechanical device for holding the probe was used to assure that the same pressure was applied by the probe against tissues upon which liberal amounts of ultrasound coupling gel had been applied (except with dogs).
• At approximately 0.8 kg/cm2 pressure a spring-loaded switch was compressed. At that instance, the ultrasound image was frozen on the scanner and the image was stored.
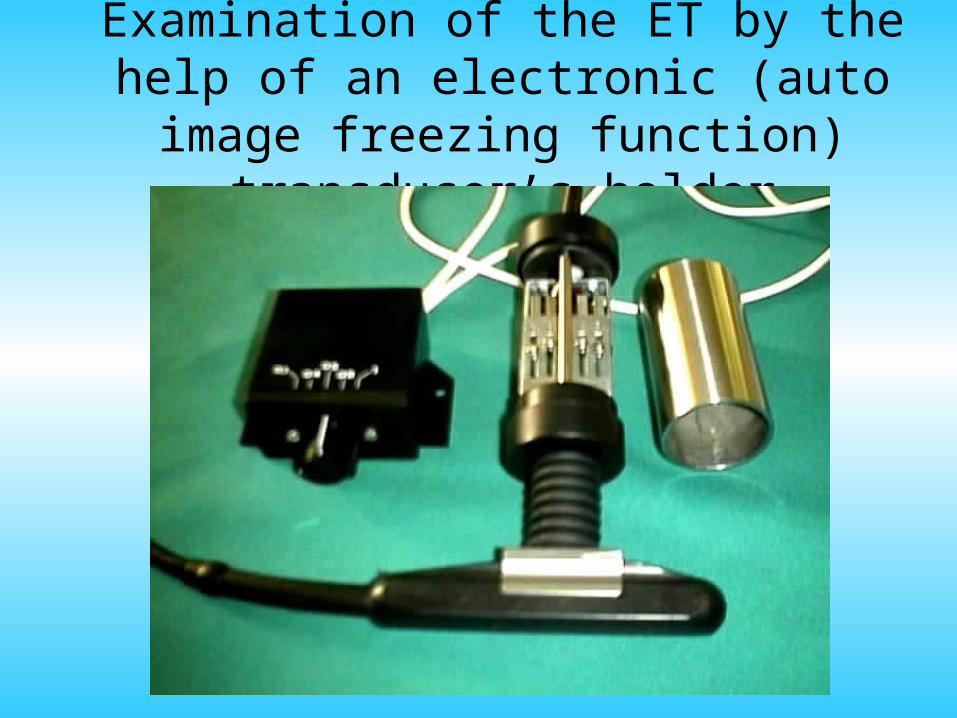
Examination of the ET by the help of an electronic (auto image freezing function)
transducer’s holder
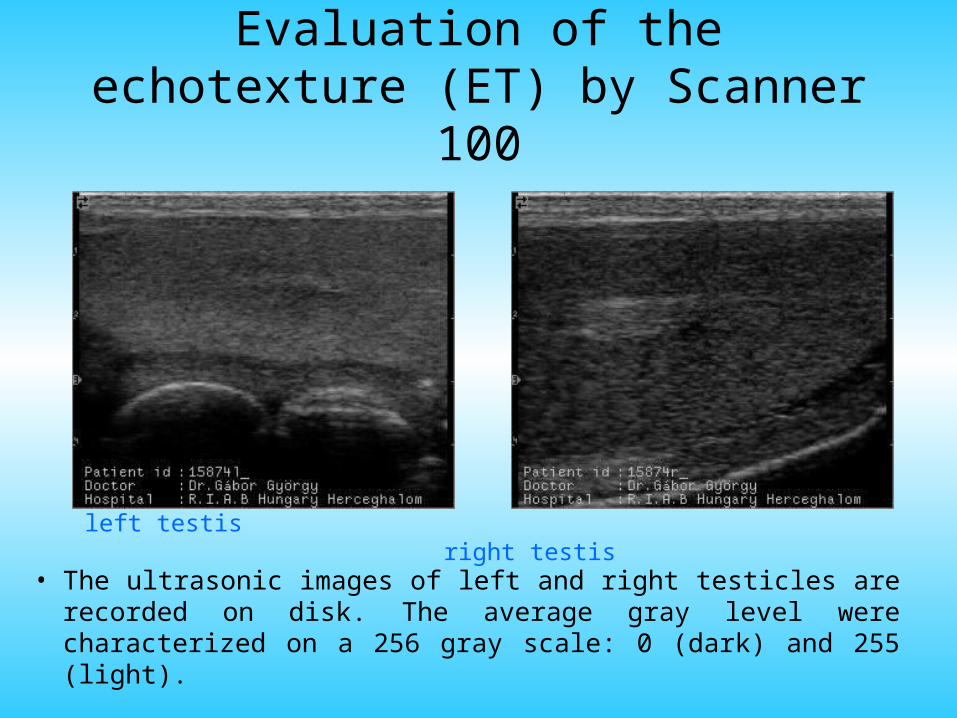
Evaluation of the echotexture (ET) by Scanner 100
• The ultrasonic images of left and right testicles are recorded on disk. The average gray level were characterized on a 256 gray scale: 0 (dark) and 255 (light).
left testis right testis
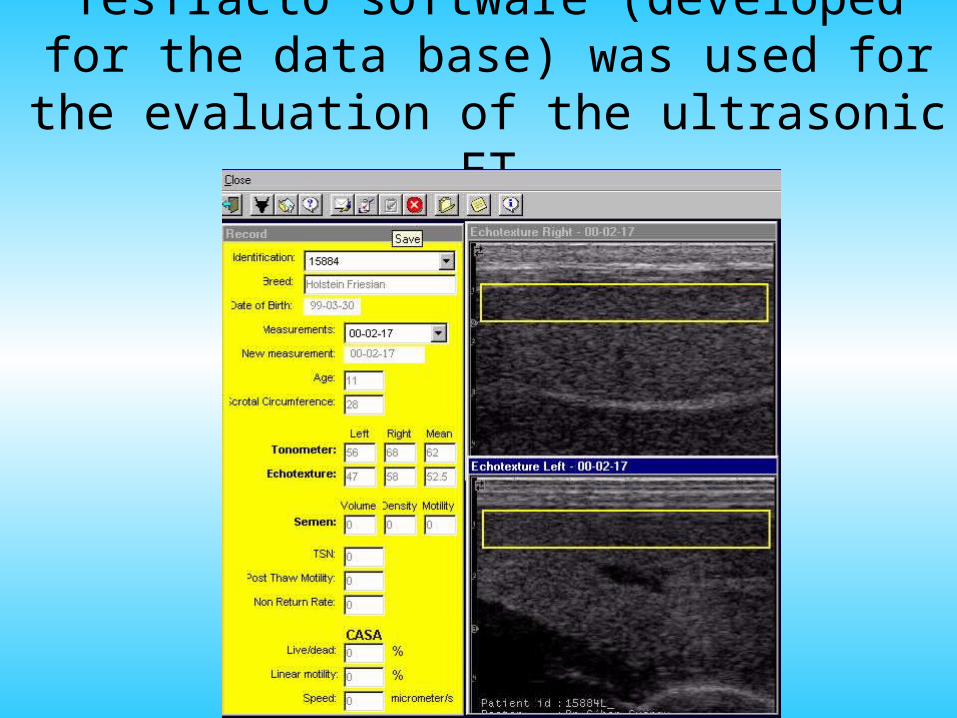
TesTracto software (developed for the data base) was used for the evaluation of the
ultrasonic ET
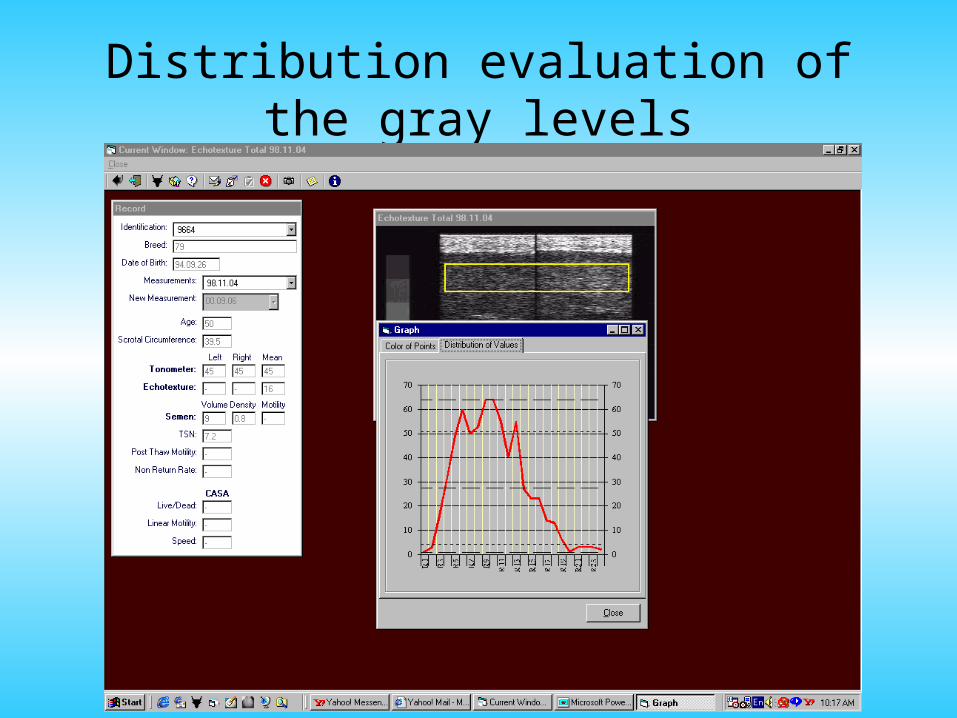
Distribution evaluation of the gray levels
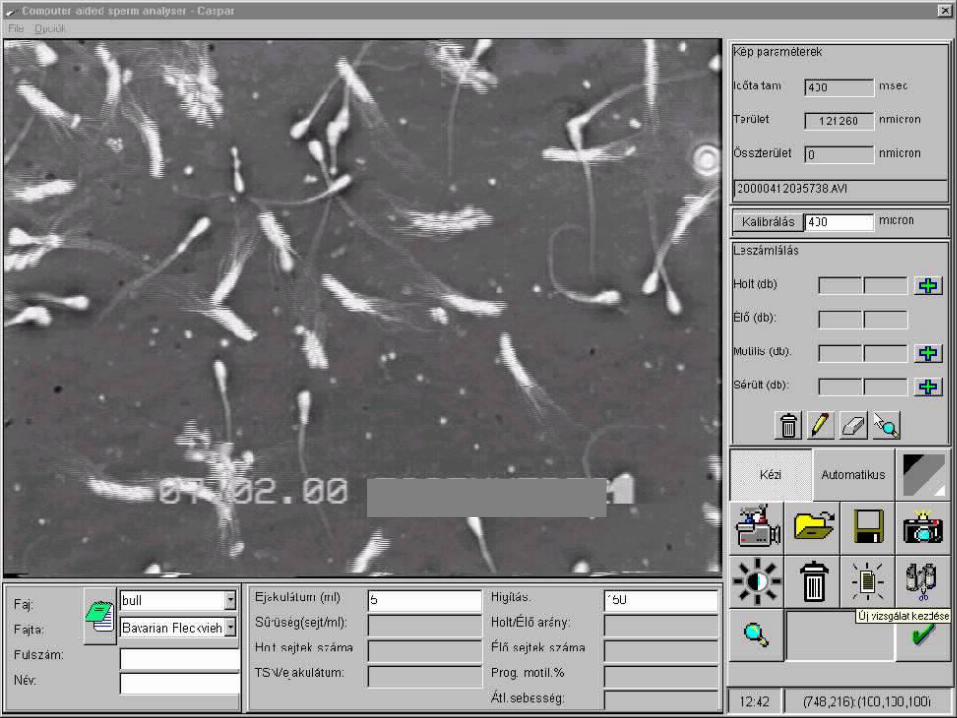
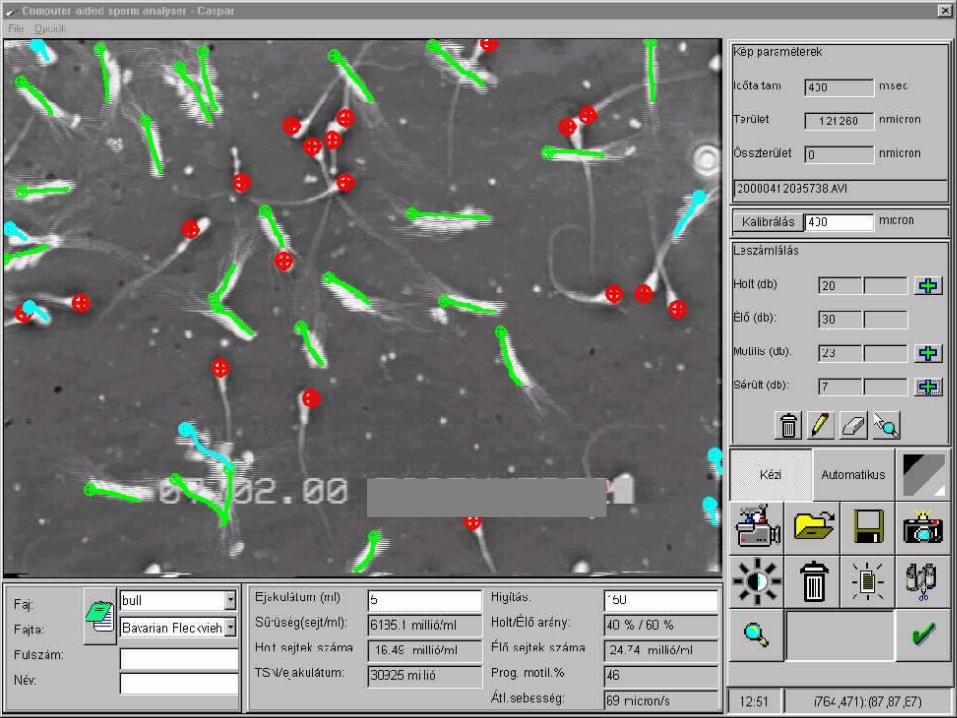
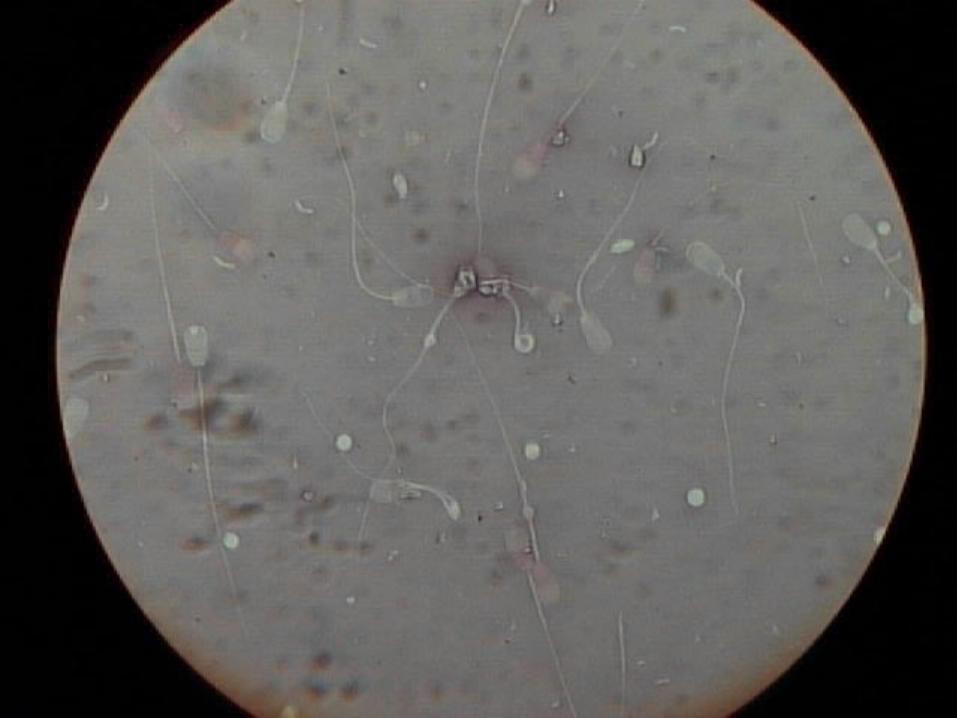
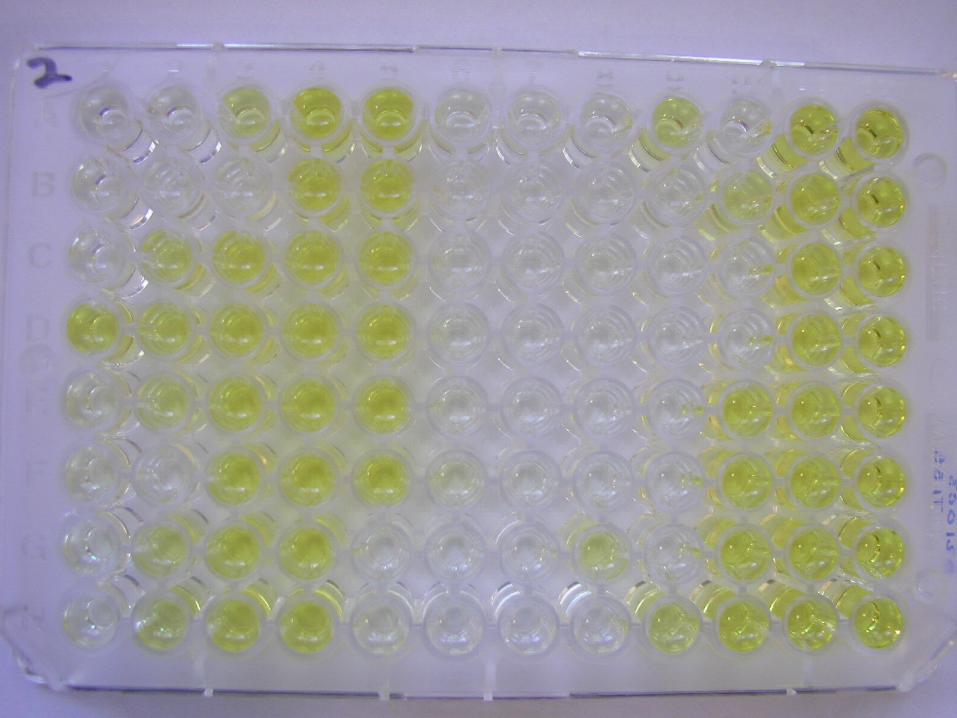
• Semen evaluation: the total number of spermatozoa per ejaculate (TNS), the percentage of the motile and progressive motile spermatozoa were determined. A Zeiss Laboval phase-contrast microscope with heated stages and a Makler chamber was used for preparing the images. All the images were saved to the HDD of a computer and image analysis was carried out by a custom software (CASPAR, Pictron Ltd., Budapest, Hungary). Morphological evaluation was done after Cerovsky’s staining.
2. Early pregnancy detection by ultrasound and PSPB test
The aims of these experiments were checking the bull fertility by early pregnancy detection.
• In Experiment 1 sixty-nine dairy cows were checked by a B-mode
ultrasound scanner (Pie Medical, Model 100 LC VET, Maastricht, The Netherlands) with a 6 MHz linear-array transducer, 29-55 days after AI in order to check the pregnancy status of them. At the same time blood samples were also taken from the tail vein to check the PSPB serum level of these cows.
• In a second experiment 4 bulls were selected during the BSE as a semen donor for a fertility experiment. After semen collection and freezing, 1742 artificial inseminations were carried out at 23 dairies with the frozen-thawed semen. Early pregnancy diagnosis was carried out once a week 30-36 days after the AI. For checking serum PSPB level, Biopryn test was used. Results were re-checked by rectal palpation 60 days after AI.
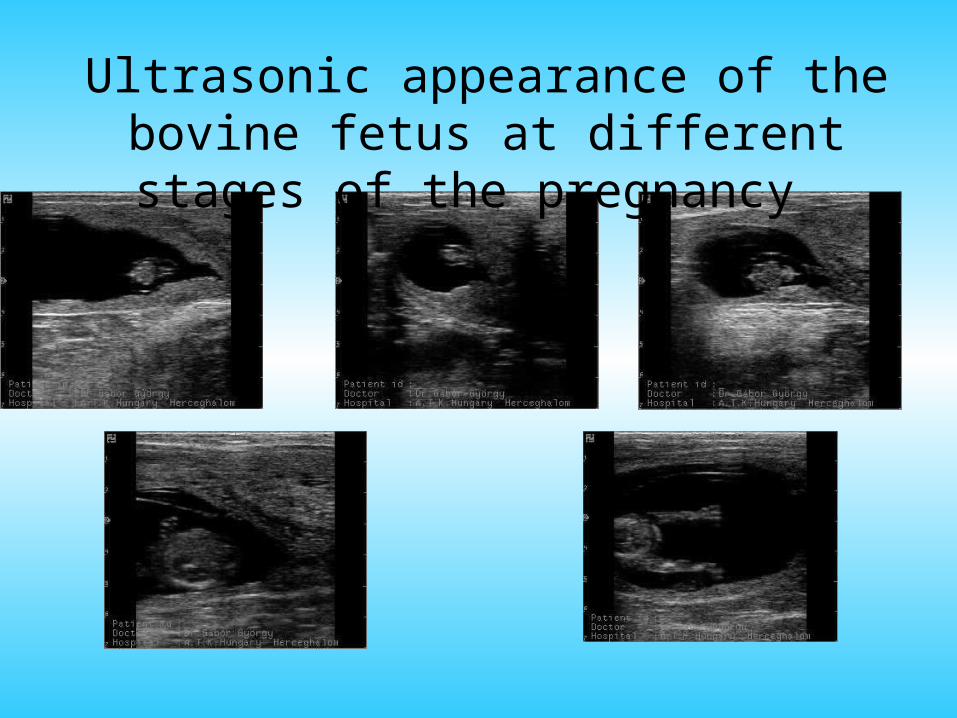
Ultrasonic appearance of the bovine fetus at different stages of the pregnancy
PSPB (Pregnancy Specific Protein B)• PSPB is a novel protein that was first reported by scientists at the University of
Idaho. First a double antibody radioimmunosassay (RIA) was developed with rabbit antisera against a more nearly pure form of PSPB. The assay was used to measure PSPB in sera of pregnant cows and provided an accurate, early serological test for pregnancy.
• PSPB is detectable in serum from 24 to 282 (parturition) days of gestation and can be applied reliably in dairy cow herds at 28 to 30 days after breading.
• PSPB is located in the giant binucleate cells of the trophoblastic ectoderm of the placenta and this indicated that is was either synthesized or sequestered by those cells.
• The PSPB was found in sera of some primiparous cows as early as 15 days following conception and in sera of most cows at 24 days following conception.
• Complete clearence of the protein from blood may not occur until 80 to 100 days after parturition. For this reason testing of blood for a new pregnancy following parturition may give false positive lests.
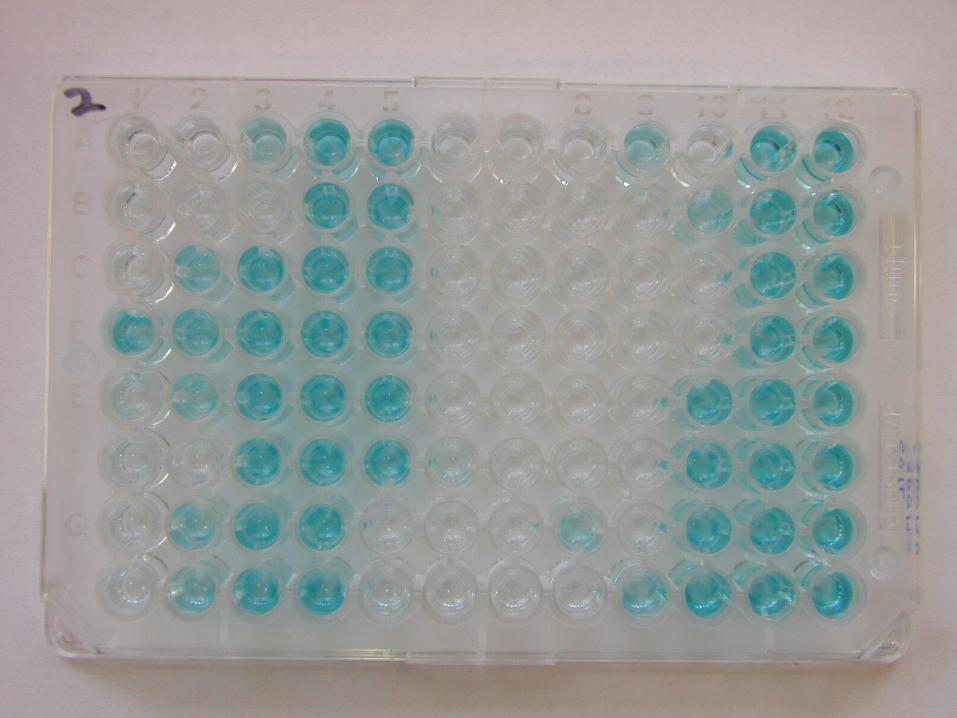
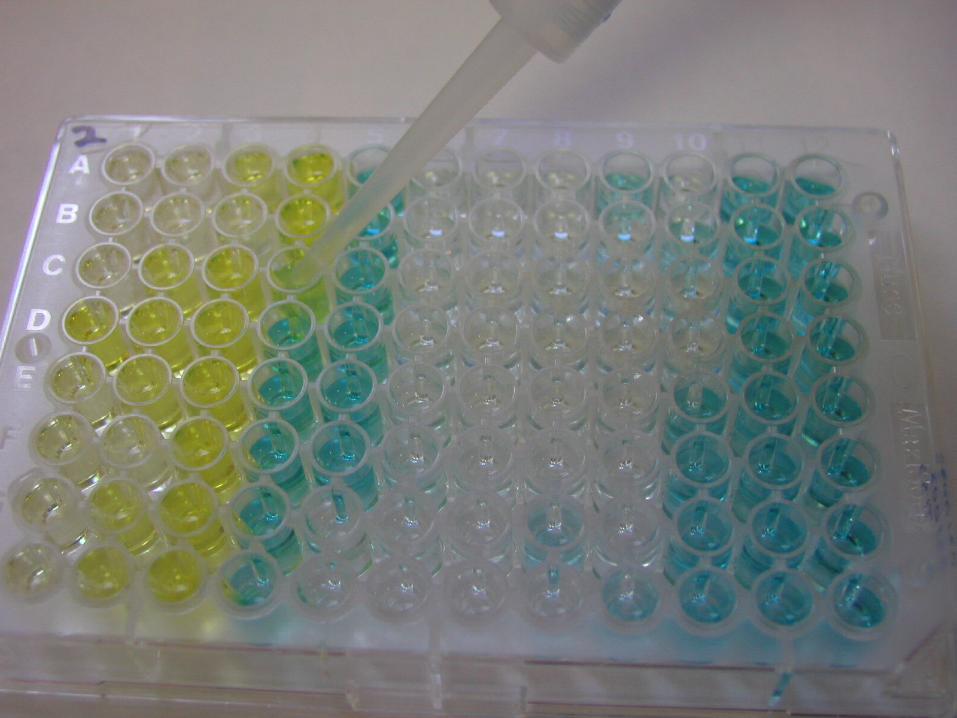
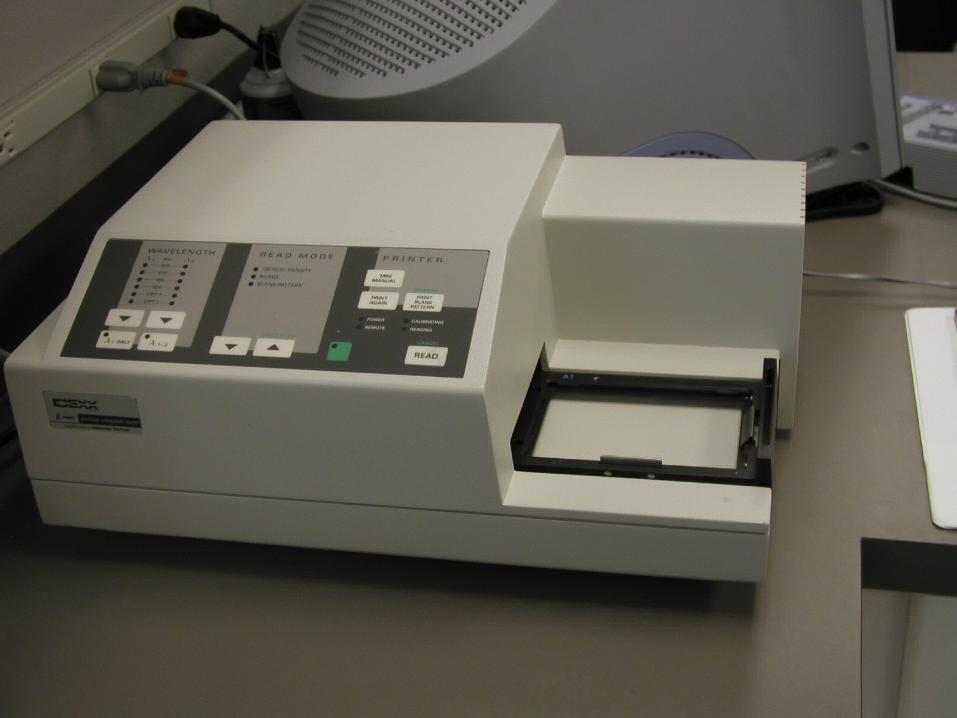
• An ELISA test (BioPryn® by BioTracking LLC)has been developed for the examination of the PSPB in cattle 30 days after AI (at least 90 days after the previous parturition).
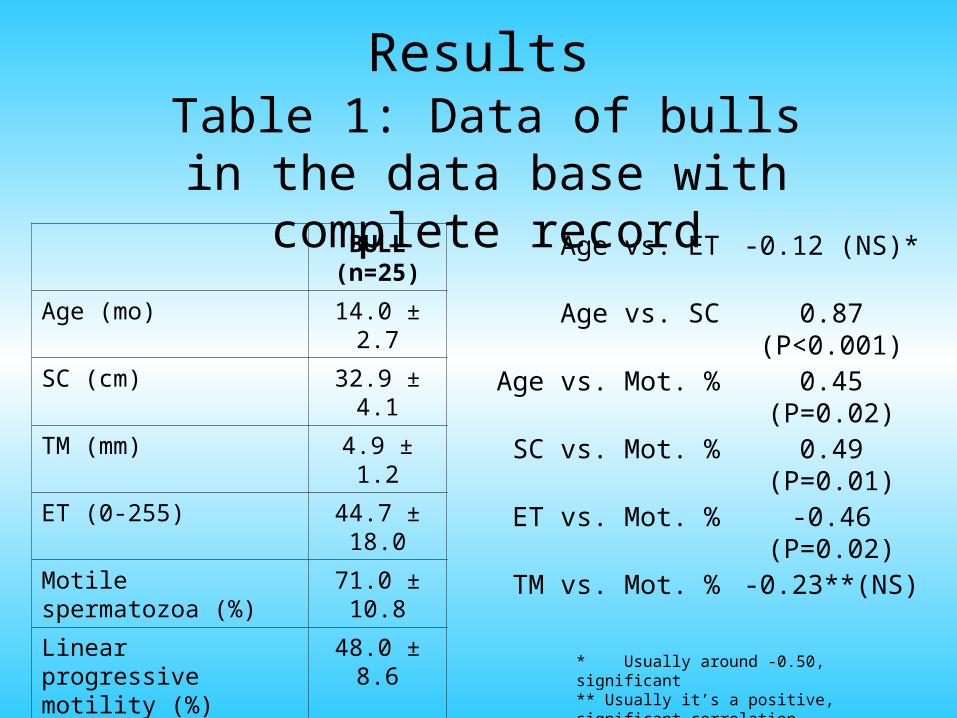
Results
BULL (n=25)
Age (mo) 14.0 ± 2.7
SC (cm) 32.9 ± 4.1
TM (mm) 4.9 ± 1.2
ET (0-255) 44.7 ± 18.0
Motile spermatozoa (%) 71.0 ± 10.8
Linear progressive motility (%)
48.0 ± 8.6
Speed (mm/s) 96.9 ± 10.9
Table 1: Data of bulls in the data base with complete record
* Usually around -0.50, significant ** Usually it’s a positive, significant correlation
Age vs. ET -0.12 (NS)*
Age vs. SC 0.87 (P<0.001)
Age vs. Mot. % 0.45 (P=0.02)
SC vs. Mot. % 0.49 (P=0.01)
ET vs. Mot. % -0.46 (P=0.02)
TM vs. Mot. % -0.23**(NS)
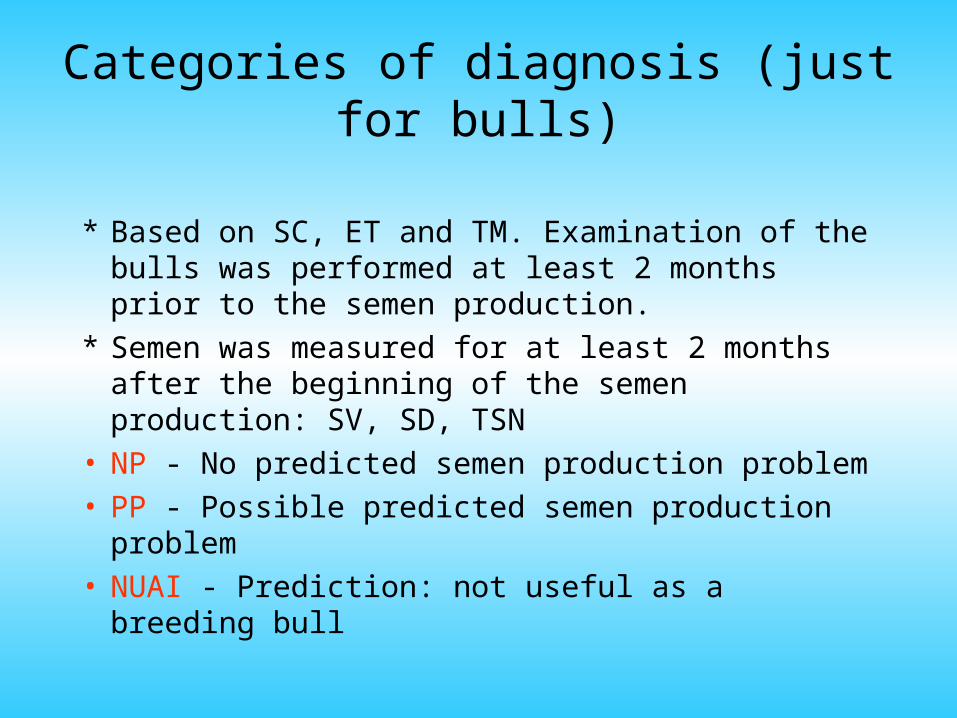
Categories of diagnosis (just for bulls)
* Based on SC, ET and TM. Examination of the bulls was performed at least 2 months prior to the semen production.
* Semen was measured for at least 2 months after the beginning of the semen production: SV, SD, TSN
• NP - No predicted semen production problem• PP - Possible predicted semen production problem• NUAI - Prediction: not useful as a breeding bull
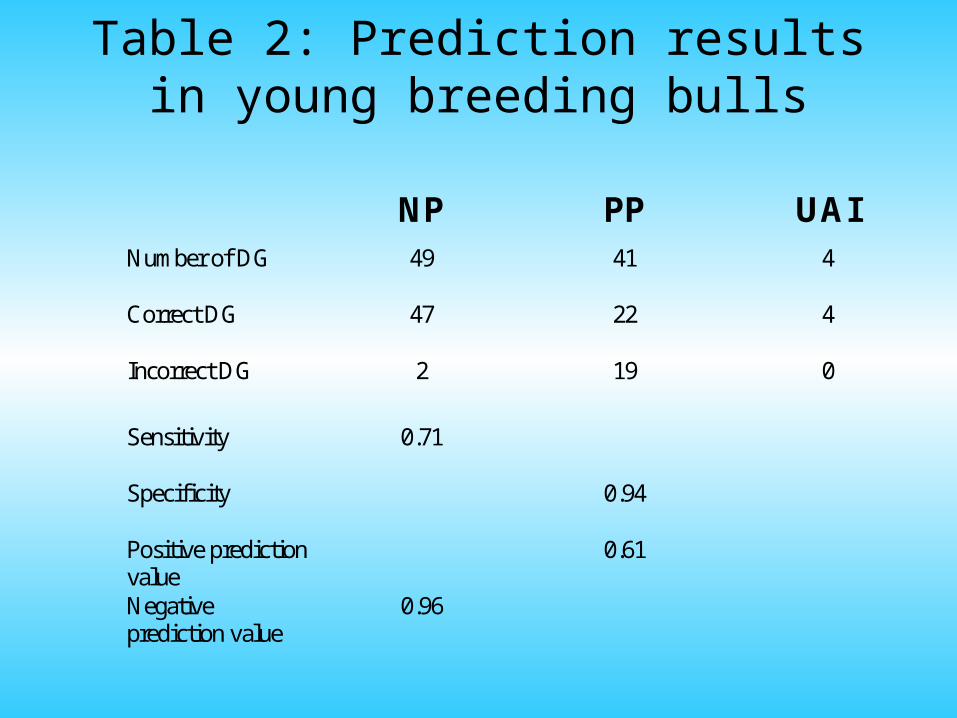
Table 2: Prediction results in young breeding bulls
NP PP UAI Number of DG 49 41 4
Correct DG 47 22 4
Incorrect DG 2 19 0
Sensitivity 0.71
Specificity 0.94
Positive prediction value
0.61
Negative prediction value
0.96
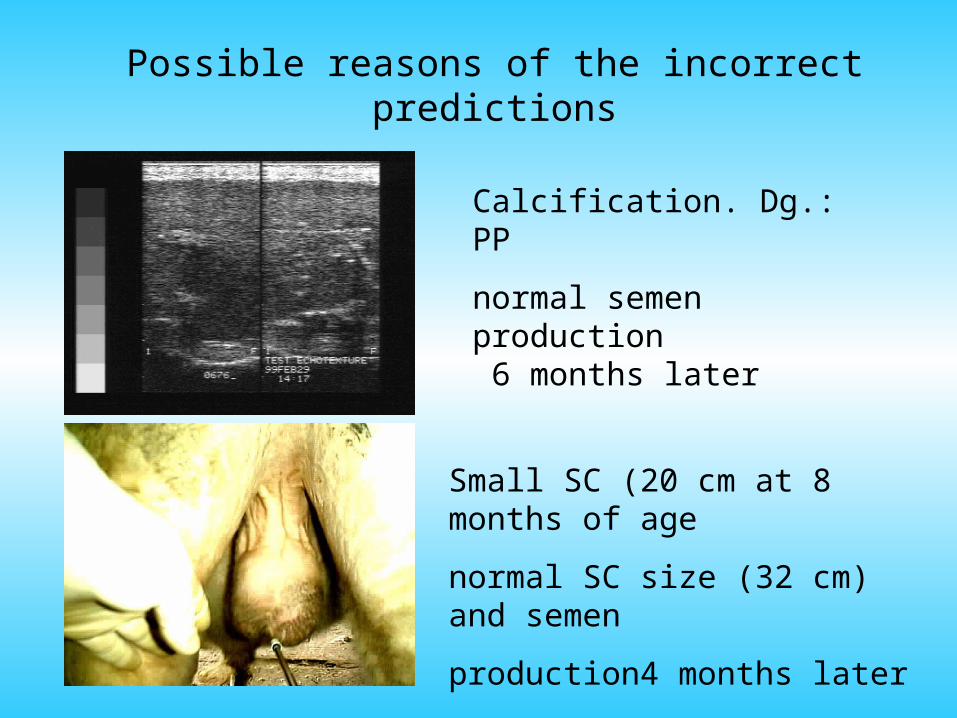
Possible reasons of the incorrect predictions
Calcification. Dg.: PP
normal semen production 6 months later
Small SC (20 cm at 8 months of age
normal SC size (32 cm) and semen
production4 months later
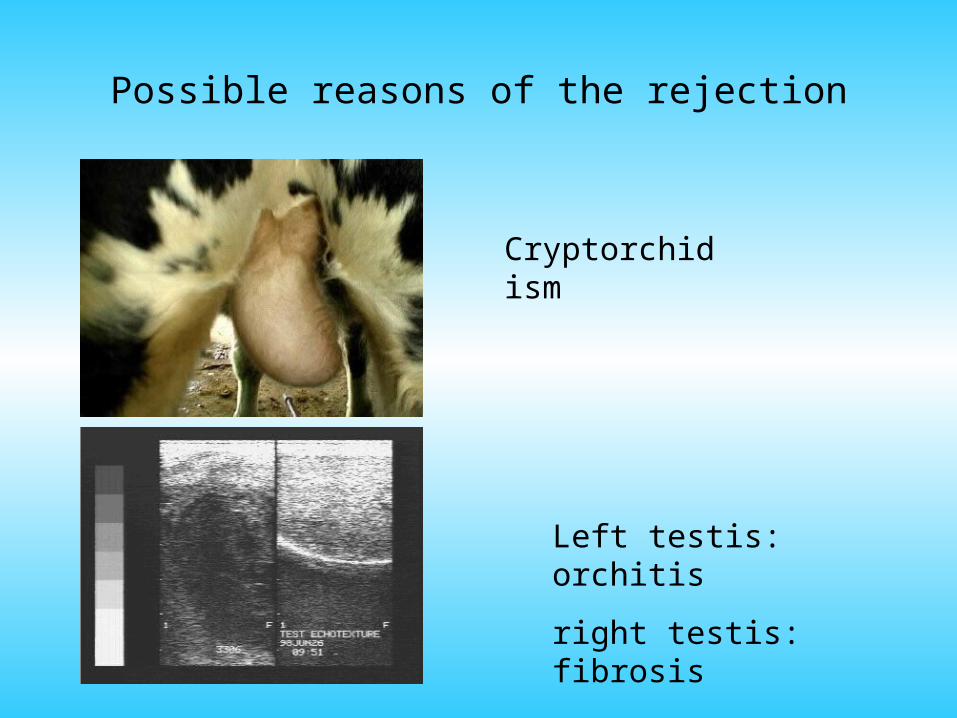
Possible reasons of the rejection
Cryptorchidism
Left testis: orchitis
right testis: fibrosis
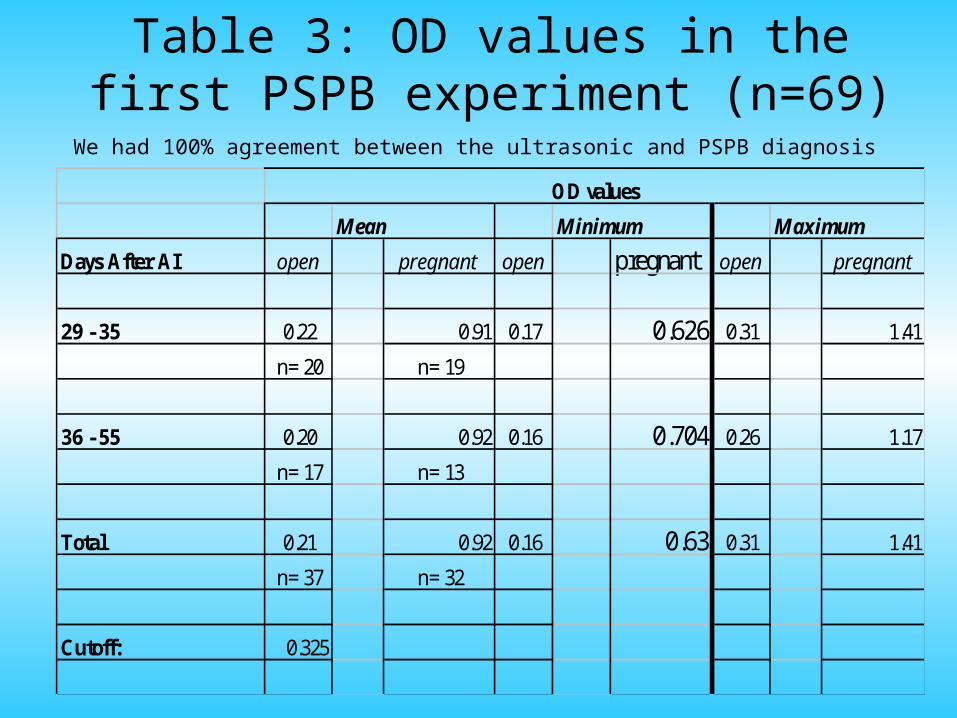
Mean Minimum Maximum
Days After AI open pregnant open pregnant open pregnant
29 - 35 0.22 0.91 0.17 0.626 0.31 1.41
n= 20 n= 19
36 - 55 0.20 0.92 0.16 0.704 0.26 1.17
n= 17 n= 13
Total 0.21 0.92 0.16 0.63 0.31 1.41
n= 37 n= 32
Cutoff: 0.325
OD values
Table 3: OD values in the first PSPB experiment (n=69)
We had 100% agreement between the ultrasonic and PSPB diagnosis
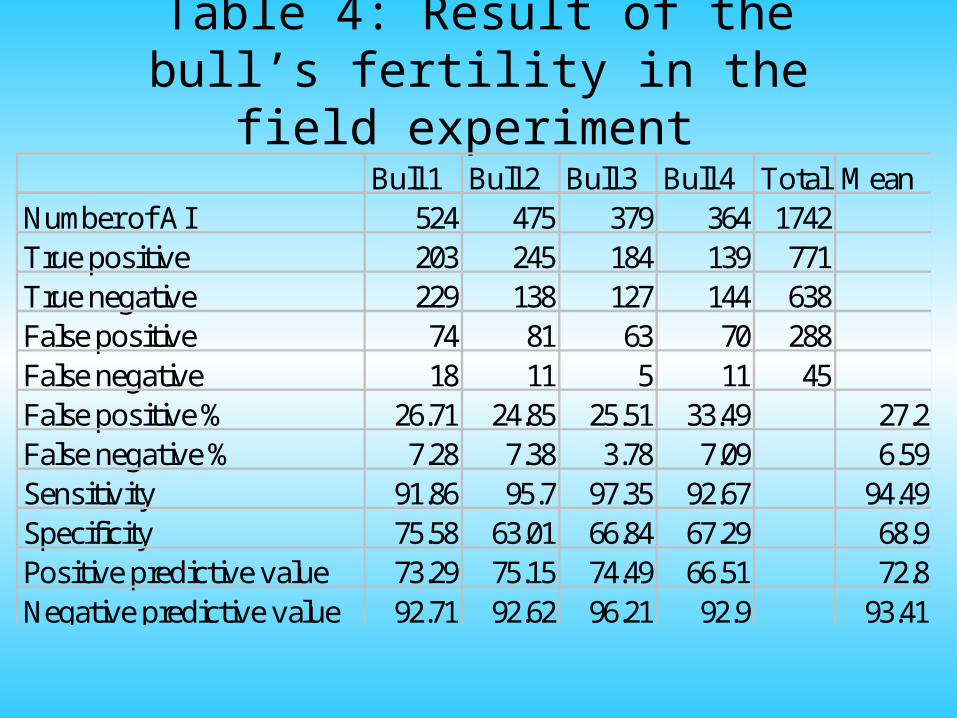
Table 4: Result of the bull’s fertility in the field experiment
Bull 1 Bull 2 Bull 3 Bull 4 Total MeanNumber of AI 524 475 379 364 1742 True positive 203 245 184 139 771 True negative 229 138 127 144 638 False positive 74 81 63 70 288 False negative 18 11 5 11 45 False positive % 26.71 24.85 25.51 33.49 27.2False negative % 7.28 7.38 3.78 7.09 6.59Sensitivity 91.86 95.7 97.35 92.67 94.49Specificity 75.58 63.01 66.84 67.29 68.9Positive predictive value 73.29 75.15 74.49 66.51 72.8Negative predictive value 92.71 92.62 96.21 92.9 93.41
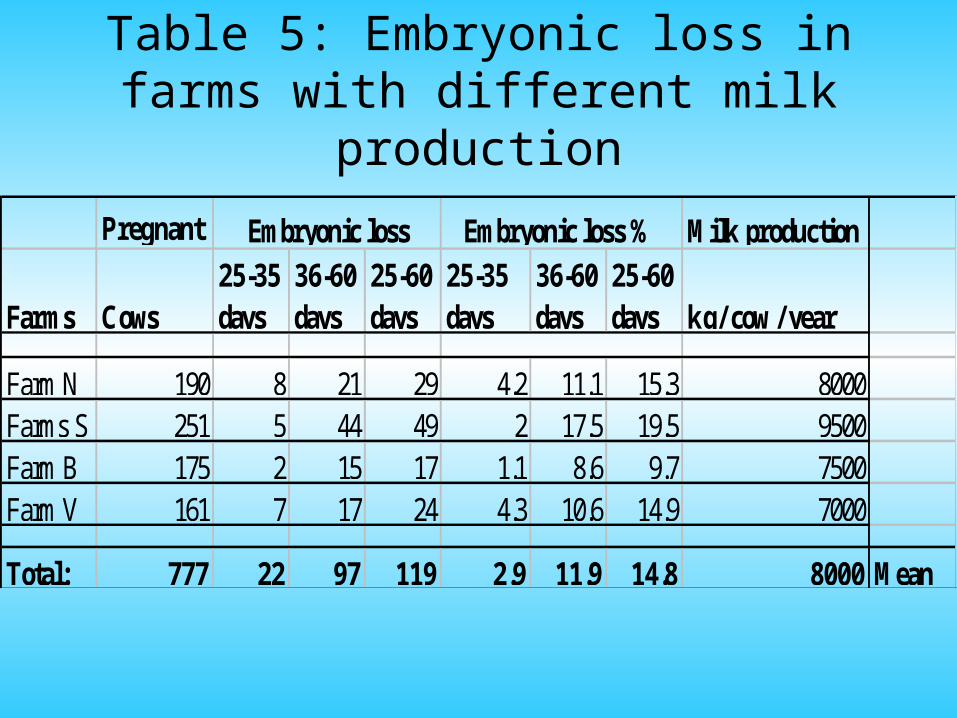
Table 5: Embryonic loss in farms with different milk production
Pregnant Milk production
Farms Cows25-35 days
36-60 days
25-60 days
25-35 days
36-60 days
25-60 days kg/ cow / year
Farm N 190 8 21 29 4.2 11.1 15.3 8000Farms S 251 5 44 49 2 17.5 19.5 9500Farm B 175 2 15 17 1.1 8.6 9.7 7500Farm V 161 7 17 24 4.3 10.6 14.9 7000
Total: 777 22 97 119 2.9 11.9 14.8 8000 Mean
Embryonic loss Embryonic loss %