Embed Size (px)
Citation preview

Improving Teacher Quality Grants, Cycle 5:
External Evaluation ReportDecember 8th, 2008
University of MissouriEvaluation Team
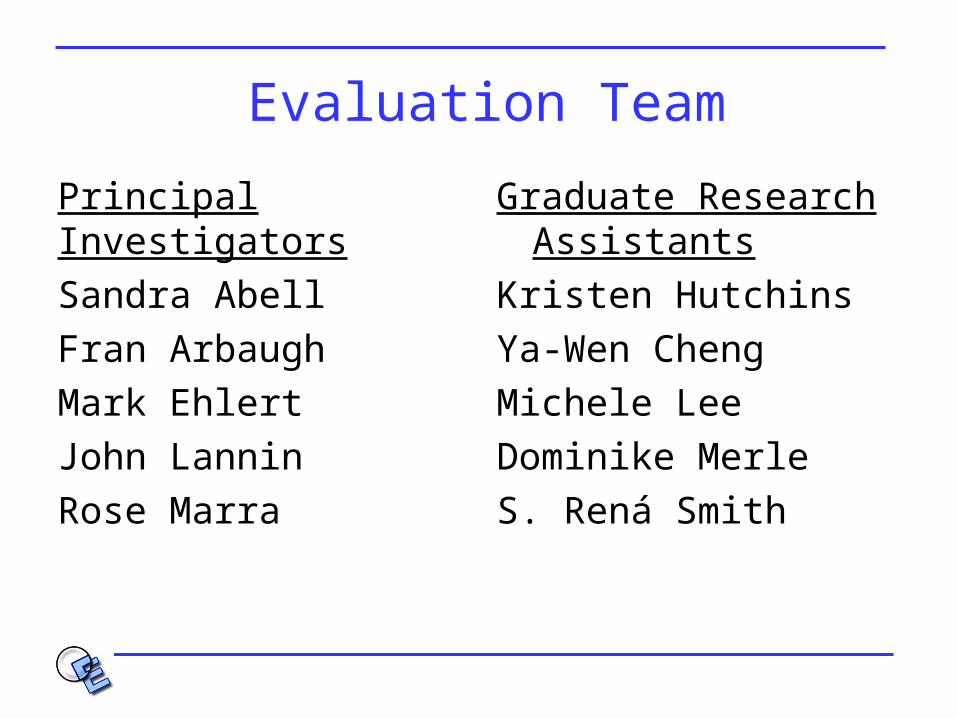
Evaluation Team
Principal Investigators
Sandra Abell
Fran Arbaugh
Mark Ehlert
John Lannin
Rose Marra
Graduate Research Assistants
Kristen Hutchins
Ya-Wen Cheng
Michele Lee
Dominike Merle
S. Rená Smith

Context of the Evaluation
• Improving Teacher Quality Grant program, Cycle 5, 2007-2008– Focus on high-need schools (Title II)– 6 funded professional development projects– Science and mathematics, grades 4-8– Formative and summative evaluation
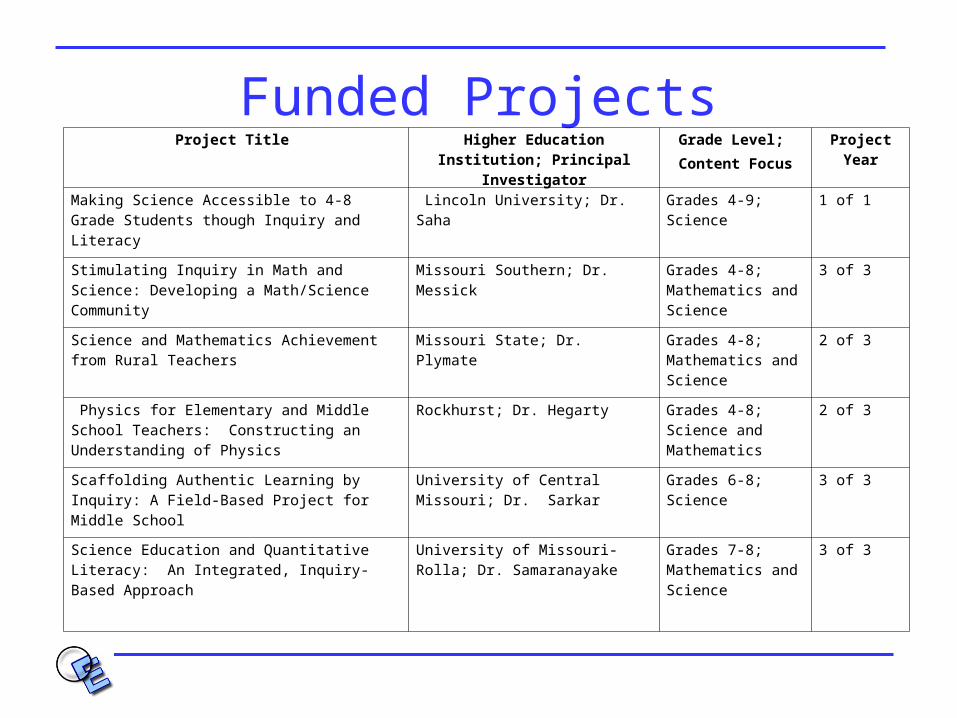
Funded ProjectsProject Title Higher Education Institution;
Principal InvestigatorGrade Level;
Content Focus
Project Year
Making Science Accessible to 4-8 Grade Students though Inquiry and Literacy
Lincoln University; Dr. Saha Grades 4-9; Science 1 of 1
Stimulating Inquiry in Math and Science: Developing a Math/Science Community
Missouri Southern; Dr. Messick Grades 4-8; Mathematics and Science
3 of 3
Science and Mathematics Achievement from Rural Teachers
Missouri State; Dr. Plymate Grades 4-8; Mathematics and Science
2 of 3
Physics for Elementary and Middle School Teachers: Constructing an Understanding of Physics
Rockhurst; Dr. Hegarty Grades 4-8; Science and Mathematics
2 of 3
Scaffolding Authentic Learning by Inquiry: A Field-Based Project for Middle School
University of Central Missouri; Dr. Sarkar
Grades 6-8; Science 3 of 3
Science Education and Quantitative Literacy: An Integrated, Inquiry-Based Approach
University of Missouri-Rolla; Dr. Samaranayake
Grades 7-8; Mathematics and Science
3 of 3

Participant Summary• 170 participants: 155 teachers, 6 pre-service teachers, 1
paraprofessional, and 8 administrators; • More taught mathematics and/or science at the end of
Cycle 5 than at the beginning;• Only 17.9% were new to the ITQG program;• Taught in 64 different Missouri school districts, and 4
private schools; • Directly impacted 13,282 students in the 2007-2008
school year.

Percentage of Participants from High-Need Districts
61.0%
39.0%
% participants from high-need districts % participants from non high-need districts

Model of PD Evaluation
ITQG Objectives
• Improve teacher pedagogical knowledge and practices in inquiry-based instruction
• Enhance teacher use of assessment• Increase teacher content knowledge• Improve student achievement• Impact pre-service teacher education in
higher education institutions

Teacher Knowledge and Practice of Inquiry
From the Cycle 5 RFP:
Improve teachers’ pedagogical knowledge and practices that utilize scientifically-based research findings and best practices in inquiry-based instruction.

Teacher Knowledge and Practice of Inquiry

Teacher Knowledge and Practice of Inquiry

Teacher Knowledge and Practice of Inquiry
Models for Inquiry • Learning Cycle (Lincoln)• Curriculum Specific (Rockhurst)• 3 Principles of Learning (MSSU)

Teacher Knowledge and Practice of Inquiry
• What aspects of instructional practice were emphasized in your project?
•What other aspects of instructional practice should be considered?

Teacher Assessment Knowledge
From the Cycle 5 RFP:
Enhance teachers’ use of assessment to monitor the effectiveness of their instruction

Teacher Assessment Knowledge

Teacher Assessment Knowledge
• What aspects assessment practices were emphasized in your project?
•What other aspects of assessment should be emphasized?
Teacher Content Knowledge
Content Knowledge Test ResultsSurvey Items
Level of Knowledge in Targeted TopicsRelevance of Growth in Content
KnowledgeConfidence in Content Knowledge

Results of Teacher Knowledge Tests
3831
36
5445
50
71 74
45
73
0
10
20
30
40
50
60
70
80
Lincoln-Science MSU-Science Rockhurst-Science MSU-Math
%C
orre
ct
Pre-test Post-Test Post-Test #2
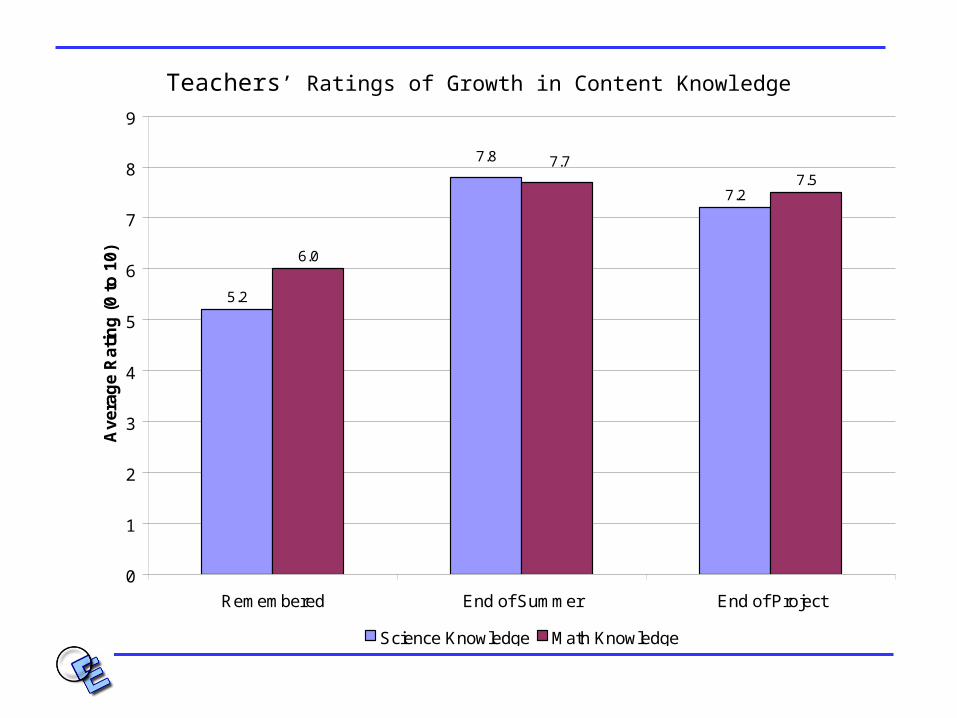
Teachers’ Ratings of Growth in Content Knowledge
5.2
7.2
6.0
7.5
7.8 7.7
0
1
2
3
4
5
6
7
8
9
Remembered End of Summer End of Project
Ave
rag
e R
atin
g (
0 to
10)
Science Knowledge Math Knowledge

Ratings of Relevance in Gains in Content Knowledge
4.2
3.53.6
3.9
0
0.5
1
1.5
2
2.5
3
3.5
4
4.5
End of Summer End of Project
Avg
Rel
evan
ce R
atin
g (
0 to
5)
Science Math
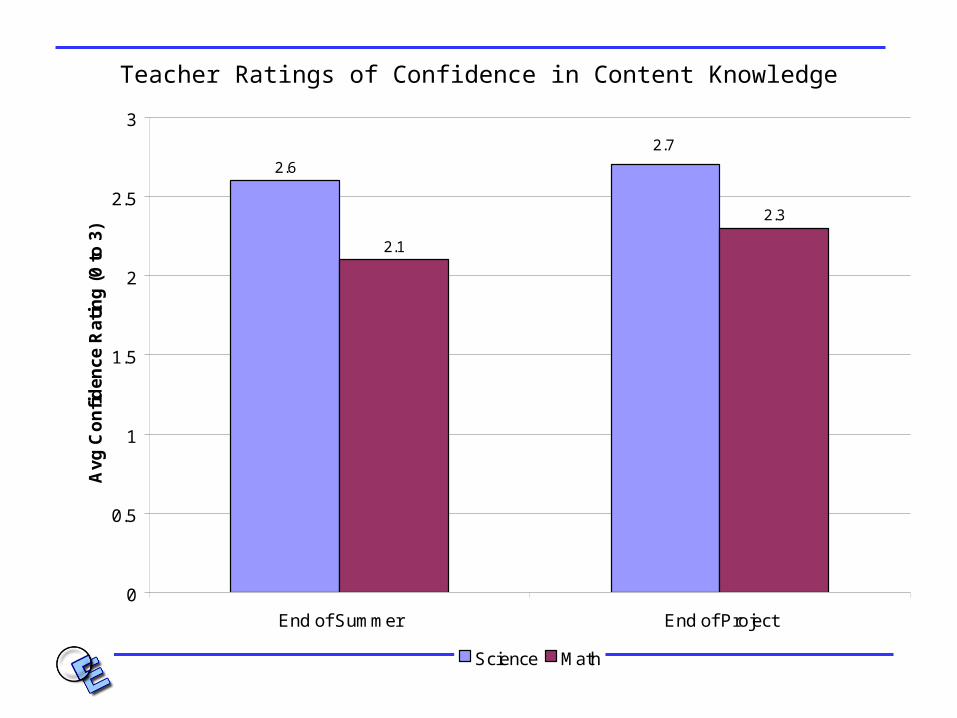
Teacher Ratings of Confidence in Content Knowledge
2.6
2.1
2.3
2.7
0
0.5
1
1.5
2
2.5
3
End of Summer End of Project
Avg
Co
nfi
den
ce R
atin
g (
0 to
3)
Science Math

Teacher ratings of PD influence on student learning <graphic>
Teacher developed and administered pre- and post-tests <graphic>
MAP exam results Science Levels <graphic>
Math Levels <graphic>
Math Gains <graphic>
Student Achievement

0.0 0.5 1.0 1.5 2.0 2.5 3.0
Analyzing student performance data
Using technology effectively toenhance your teaching
Assessing student learning
Creating lessons aligned with GLE’s
Improving my content knowledge
Collaborating with other teachers
Increasing student motivation
Developing materials for use withyour students
Implementing activities in yourclassroom
Participating in classroom activitiesas your students would
Managing inquiry-based/problem-centered classrooms
Using inquiry-based/problem-centered teaching
Average Rating
Perceptions of How Change in Practice from PD Improved Student Learning

Average Student Performance on Tested Science and Math Content
4939 38
26 29
47
28
7665 68 70
52
6470
0
10
20
30
40
50
60
70
80
MSU Lincoln -Science
MSSU-Science
Rockhurst -Science
UMR-Science
MSSU-Math UMR-Math
% C
orre
ct
Pretest Posttest
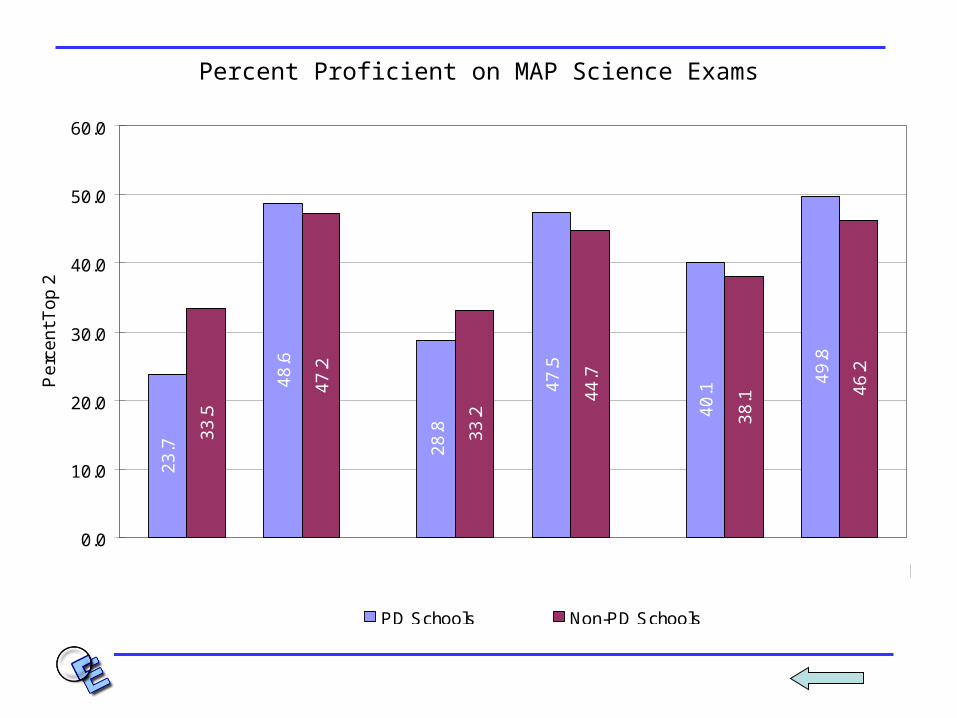
Percent Proficient on MAP Science Exams
23
.7
33
.5
48
.6
47
.2
28
.8 33
.2
47
.5
44
.7
40
.1
38
.1
49
.8
46
.2
0.0
10.0
20.0
30.0
40.0
50.0
60.0
Pe
rce
nt T
op
2
PD Schools Non-PD Schools
|-------- Grade 5 --------| |-------- Grade 11 --------||-------- Grade 8 --------|
High-Need High-Need High-NeedNot High-Need Not High-NeedNot High-Need
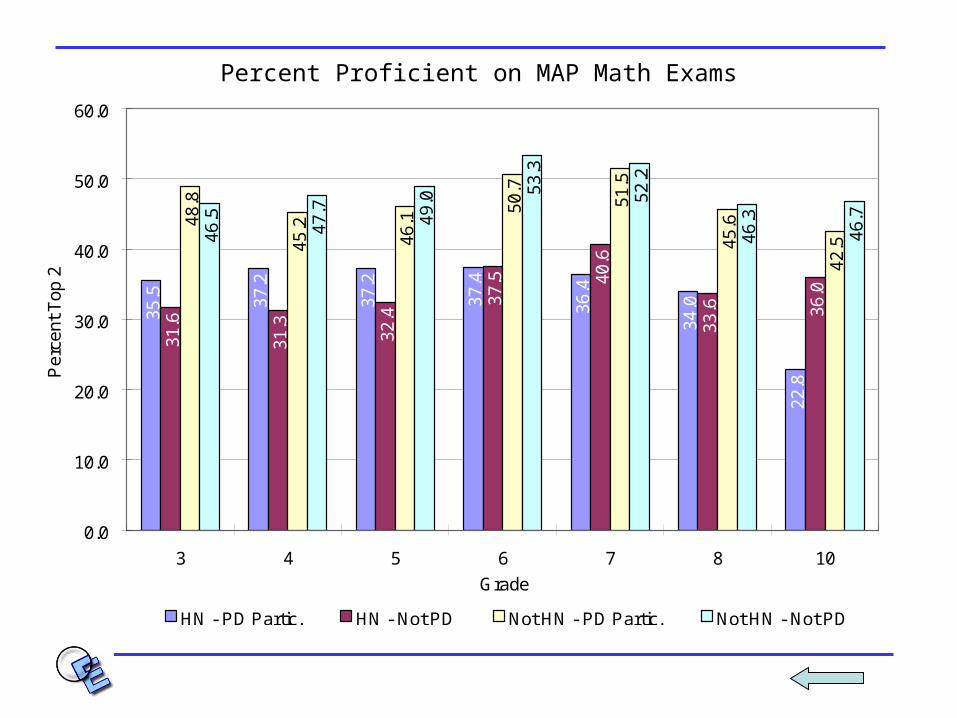
Percent Proficient on MAP Math Exams
35.5 37
.2
37.2
37.4
36.4
34.0
22.8
31.3
32.4
40.6
36.0
48.8
45.2
46.1
50.7
51.5
45.6
42.546
.5
47.7
49.0
53.3
52.2
46.3
46.7
33.637
.5
31.6
0.0
10.0
20.0
30.0
40.0
50.0
60.0
3 4 5 6 7 8 10
Grade
Per
cent
Top
2
HN - PD Partic. HN - Not PD Not HN - PD Partic. Not HN - Not PD

Changes in MAP Math Proficiency for Same Student Cohorts
-3.0
-9.0
-1.5
-6.9
2.5
-2.8
-0.1
4.2
2.3
-3.6
8.4
1.11.8
8.0
-2.1
-0.7
1.2
3.1
1.3
-3.1
-10.0
-8.0
-6.0
-4.0
-2.0
0.0
2.0
4.0
6.0
8.0
10.0
3 to 4 4 to 5 5 to 6 6 to 7 7 to 8Grades Compared
%T
op 2
HN - PD Partic. HN - Not PD Not HN - PD Partic. Not HN - Not PD

Impact on Higher Education
• Inclusion of pre-service teachers in PD (e.g., Rockhurst)
• Development of new courses for pre-service teachers (e.g., MSU)
• Changes to current curriculum and instruction (e.g., MSSU)
• Plans to develop a university Science Education Center (e.g., Lincoln)
• Renewed partnerships with K-12 (e.g., Rockhurst NSF grant proposal)

Cycle 7 Evaluation—Next Steps?
• What is missing in the evaluation?• What else should we ask?• What other suggestions for the
evaluation do you have?
Questions
Copies of the Cycle 5 Report and Executive Summary available at:
www.pdeval.missouri.edu