Embed Size (px)
Citation preview
HAL Id: tel-01690745https://tel.archives-ouvertes.fr/tel-01690745
Submitted on 23 Jan 2018
HAL is a multi-disciplinary open accessarchive for the deposit and dissemination of sci-entific research documents, whether they are pub-lished or not. The documents may come fromteaching and research institutions in France orabroad, or from public or private research centers.
L’archive ouverte pluridisciplinaire HAL, estdestinée au dépôt et à la diffusion de documentsscientifiques de niveau recherche, publiés ou non,émanant des établissements d’enseignement et derecherche français ou étrangers, des laboratoirespublics ou privés.
Improving TB management and control throughinnovative shorter anti-tuberculosis regimens
Daniel Atwine
To cite this version:Daniel Atwine. Improving TB management and control through innovative shorter anti-tuberculosisregimens. Human health and pathology. Université Montpellier, 2017. English. �NNT :2017MONTT041�. �tel-01690745�
Devant le jury composé de
Cécile GOUJARD, PU-PH, Hôpitaux Universitaires Paris-Sud, Bicêtre, AP-HP Président
Nicolas VEZIRIS, PU-PH, Hôpitaux Universitaires de l’Est Parisien, Centre National de Référence
des Mycobactéries Rapporteur
Rodolphe GARRAFFO, MCU-PH, Hôpitaux Universitaires de Nice Rapporteur Sylvain GODREUIL, PU-PH, Hôpitaux Universitaires Arnaud de Villeneuve/Université de Montpellier
Examinateur
THÈSE POUR OBTENIR LE GRADE DE DOCTEUR DE L’UNIVERSITÉ DE MONTPELLIER
En Biologie de la Santé
École doctorale CBS2
Unité de recherche UMI233 TRANSVIHMI
IMPROVING TB MANAGEMENT AND
CONTROL THROUGH INNOVATIVE SHORTER
ANTI-TUBERCULOSIS REGIMENS
Présentée par Daniel ATWINE
Le 24 novembre 2017
Sous la direction de Maryline BONNET Directeur de thèse
et Anne-Marie TABURET co-Directeur de thèse

Page 2 of 176
2
Page 3 of 176
3
DEDICATION
TO ALL PATIENTS BATTLING TUBERCULOSIS,
WHO FOR THE HOPE OF A MUCH SHORTER
AND SAFER TREATMENT, DESPITE BEING TO
THE BENEFIT OF FUTURE PATIENTS,
SELFLESSLY OFFERED TO PARTICIPATE IN
THIS RESEARCH JOURNEY.

Page 4 of 176
4
Page 5 of 176
5
ACRONYMS
3TC Lamivudine ABC Abacavir ADH Antidiuretic Hormone AE Adverse Event AFB Acid-Fast Bacilli AIDS Acquired Immuno-Deficiency Syndrome ALT Alanine Aminotransferase
ANRS French National Agency For Research On AIDS And Viral Hepatitis
ART Antiretroviral Therapy ARV Antiretroviral AST Aspartate Aminotransferase ATT Anti-Tuberculosis Treatment AUC Area Under Concentration Versus Time Curve c Cobicistat C12 Mid-Dose Concentration CI Confidence Interval Cmax Maximum Concentration Cmin/C24 Minimum Concentration/24-Hour Concentration CNS Central Nervous System CR Control Regimen CXR Chest X-Ray CYP Cytochrome P450 DAIDS Division Of AIDS DILI Drug Induced Liver Injury DNA Deoxyribonucleic Acid DOT Directly Observed Treatment DOTS Directly Observed Treatment Short Course Strategy DR-TB Drug Resistant Tuberculosis DST Drug Susceptibility Test DS-TB Drug Susceptible Tuberculosis DTG Dolutegravir DTH Delayed-Type Hypersensitivity DTM Domiciary Treatment Monitor E Ethambutol EBA Early Bactericidal Activity EFV Efavirenz EHRZ Ethambutol, Isoniazid, Rifampicin And Pyrazinamide EMA European Medicines Agency EMRC Epicentre Mbarara Research Centre FDA Food And Drug Administration FDC Fixed Dose Combination FI Fusion Inhibitor FTC Emtricitabine GCP Good Clinical Practice GM Geometric Mean
Page 6 of 176
6
GMR Geometric Mean Ratio H Isoniazid HBC High-Burden Country HBV Hepatitis B Virus HCV Hepatitis C Virus HIV Human Immunodeficiency Virus IC Infection Control ICF Intensified Case Finding INSTI Integrase Strand Transfer Inhibitors IPT Isoniazid Preventive Treatment IQR Interquartile Range IRIS Immune Reconstitution Inflammatory Syndrome IU/L International Units Per Litre LAM Lipoarabinomannan LJ Löwenstein Jensen LMICs Low And Middle Income Countries LPV/r Ritonavir Boosted Lopinavir LTBI Latent Tuberculosis Infection MAH Mono-Acetyl Hydrazine MDR-TB Multi-Drug Resistant Tuberculosis MGIT Mycobacteria Growth Indicator Tube mITT Modified Intention To Treat Population mm Millimeter MRC Medical Research Council MSF Médecins sans frontières MTB Mycobacterium Tuberculosis Complex NA Not Applicable NALC-NaOH N-Acetyl-L-Cysteine-Sodium Hydroxide NAT2 N-Acetyltransferase Type 2 NDA National Drug Authority ng/ml Nanogram Per Milliliter NNRTI Non-Nucleoside Reverse Transcriptase Inhibitor NRTI Nucleoside Reverse Transcriptase Inhibitor NVP Nevirapine OR Odds Ratio PCR Polymerase Chain Reaction PI Protease Inhibitor PK Pharmacokinetics POC Point-Of-Care PPD Purified Protein Derivative PTB Pulmonary Tuberculosis R Rifampicin r Ritonavir RCT Randomized Clinical Trials RCT Randomized Clinical Trial RH Rifampicin And Isoniazid RNA Ribonucleic Acid RR Risk Ratio RR-TB Rifampicin Resistant Tuberculosis
Page 7 of 176
7
SAE Serious Adverse Event SGOT Serum Glutamic Oxaloacetic Transaminase SR Study Regimen TB Tuberculosis TDF Tenofovir Disoproxil Fumarate Tmax Time To Reach Maximum Concentration TTD Time-To-Detection ULN Upper Limit of Normal UNAIDS United Nations Programme On HIV/AIDS UNCST Uganda National Council of Science and Technology USPHS United States Public Health Service VL Viral Load VOT Video Observed Treatment WHO World Health Organization XDR-TB Extensively Drug-Resistant Tuberculosis Z Pyrazinamide ZDV Zidovudine

Page 8 of 176
8
Page 9 of 176
9
Table of Contents ACRONYMS ............................................................................................................................................................................. 5
LIST OF FIGURES ................................................................................................................................................................. 11
LIST OF TABLES.................................................................................................................................................................... 11
CHAPTER 1 INTRODUCTION ......................................................................................................................................... 13
1.1 MICROBIOLOGY, PHYSIOPATHOLOGY, IMMUNOLOGY, RISK FACTORS AND CLINICAL PRESENTATION OF
TUBERCULOSIS ........................................................................................................................................................................................................... 15 1.1.1 Microbiology ................................................................................................................................................................................................ 15 1.1.2 Physiopathology and immunology ................................................................................................................................................................. 16 1.1.3 Risk-factors of tuberculosis .......................................................................................................................................................................... 17 1.1.4 Clinical features of tuberculosis .................................................................................................................................................................... 18
1.2 EPIDEMIOLOGY OF TUBERCULOSIS ...................................................................................................................................................... 19 1.2.1 Global TB burden ....................................................................................................................................................................................... 19 1.2.2 Burden of HIV-TB co-infection .................................................................................................................................................................. 21
1.3 TUBERCULOSIS DIAGNOSIS ..................................................................................................................................................................... 22 1.4 TREATMENT OF TUBERCULOSIS ........................................................................................................................................................... 24
1.4.1 History of tuberculosis drug development ...................................................................................................................................................... 24 1.4.2 Treatment of drug-susceptible TB................................................................................................................................................................. 25
1.4.2.2 Anti-tuberculosis drug induced liver injury ...................................................................................................................................................... 27 1.4.2.3 Treatment outcomes of drug susceptible tuberculosis .................................................................................................................................. 31 1.4.2.4 Adherence to TB treatment ................................................................................................................................................................................ 31
1.4.3 Drug-resistant tuberculosis ........................................................................................................................................................................... 32 1.4.3.1 Burden of drug-resistant tuberculosis ............................................................................................................................................................... 32 1.4.3.2 Multi and extensive-drug resistant tuberculosis .............................................................................................................................................. 32 1.4.3.3 Treatment of drug-resistant tuberculosis .......................................................................................................................................................... 33
1.5 TREATMENT OF TB-HIV CO-INFECTION .......................................................................................................................................... 34 1.5.1 Anti-retroviral treatment ............................................................................................................................................................................. 34 1.5.2 Drug interaction between anti-tuberculosis and antiretroviral therapy. .......................................................................................................... 36
1.5.2.1 Mechanism of interaction between anti-tuberculosis s and antiretroviral drugs ...................................................................................... 36 1.5.3 TB-HIV coinfection treatment recommendation ........................................................................................................................................... 37 1.5.4 Key Safety considerations for ART and ATT co-administration ................................................................................................................. 38
1.5.4.1 CNS toxicity ........................................................................................................................................................................................................... 38 1.5.4.2 Drug-induced liver injury during ART and ATT co-administration........................................................................................................... 39 1.5.4.3 TB associated Immune reconstitution inflammatory syndrome (TB-IRIS) .............................................................................................. 39
1.6 STRATEGIES FOR TB CONTROL ............................................................................................................................................................. 41
CHAPTER 2 JUSTIFICATION, OBJECTIVES AND METHODS .................................................................................. 45
2.1 JUSTIFICATION ........................................................................................................................................................................................... 47 2.1.1 Justification for a shorter treatment regimen .................................................................................................................................................. 47 2.1.2 Justification for high-dose rifampicin ............................................................................................................................................................ 48
2.2 OBJECTIVES ................................................................................................................................................................................................. 50 2.2.1 General objective .......................................................................................................................................................................................... 50 2.2.2 Specific objectives ......................................................................................................................................................................................... 50
2.3 MATERIALS AND METHODS ................................................................................................................................................................... 51 2.3.1.1 Mbarara.................................................................................................................................................................................................................... 51 2.3.1.2 Epicentre ................................................................................................................................................................................................................. 52
CHAPTER 3 STUDIES ........................................................................................................................................................ 55
CHAPTER 3.1 SAFETY OF HIGH-DOSE RIFAMPICIN AMONG HIV-NEGATIVE TB PATIENTS .......................................................... 57 3.1.1 Justification and objectives ............................................................................................................................................................................ 59 3.1.2 Methods, Results and Conclusion ................................................................................................................................................................ 59 3.1.3 Involvement in this work ............................................................................................................................................................................. 60
CHAPTER 3.2 PHARMACOKINETICS AND SAFETY OF EFAVIRENZ DURING CO-ADMINISTRATION WITH ANTI-TUBERCULOSIS
TREATMENT IN HIGH HIV AND TUBERCULOSIS BURDEN COUNTRIES: A SYSTEMATIC REVIEW ....................................................... 71 3.2.1 Justification and objectives ............................................................................................................................................................................ 73 3.2.2 Methods, results and conclusion ................................................................................................................................................................... 73 3.2.3 Involvement in this work ............................................................................................................................................................................. 73
CHAPTER 3.3 ............................................................................................................................................................................................................ 101 SAFETY AND PHARMACOKINETICS OF HIGH-DOSE RIFAMPICIN AND EFAVIRENZ DURING CO-ADMINISTRATION AMONG HIV-POSITIVE TB PATIENTS ......................................................................................................................................................................................... 101
Page 10 of 176
10
3.3.1 Justification and objectives .......................................................................................................................................................................... 103 3.3.2 Methods .................................................................................................................................................................................................... 103
3.3.2.1 Study population .................................................................................................................................................................................................. 103 3.3.2.2 Randomization ..................................................................................................................................................................................................... 104 3.3.2.3 Treatment allocation ........................................................................................................................................................................................... 104 3.3.2.4 Follow-up .............................................................................................................................................................................................................. 105 3.3.2.6 Trial Endpoints .................................................................................................................................................................................................... 107 3.3.2.7 Statistical analysis ................................................................................................................................................................................................. 107
3.3.3 Results ...................................................................................................................................................................................................... 108 3.3.3.1 Characteristics of the patients ........................................................................................................................................................................... 108 3.3.3.2 Pharmacokinetics of efavirenz .......................................................................................................................................................................... 110 3.3.3.3 Safety ...................................................................................................................................................................................................................... 114 3.3.3.4 Efficacy of antiretroviral treatment ................................................................................................................................................................. 116 3.3.3.5 Efficacy of tuberculosis treatment ................................................................................................................................................................... 117
3.3.4 Discussion and Conclusion ........................................................................................................................................................................ 117 3.3.4.1 Pharmacokinetics ................................................................................................................................................................................................. 117 3.3.4.2 Safety of high-dose R in HIV-TB co-infected patients ............................................................................................................................... 118 3.3.4.3 Efficacy of antiretroviral therapy ..................................................................................................................................................................... 119 3.3.4.4 Efficacy of anti-tuberculosis therapy ............................................................................................................................................................... 119 3.3.4.5 Limitations ............................................................................................................................................................................................................ 119 3.3.4.6 Conclusion ............................................................................................................................................................................................................ 119
3.3.5 Involvement in this work ........................................................................................................................................................................... 120 CHAPTER 3.4 CHALLENGES RELATED TO EARLY SURROGATE MARKERS OF TB CHEMOTHERAPY EFFICACY WITHIN PHASE
2 TRIALS. .................................................................................................................................................................................................................... 125 3.4.1 Justification and objectives .......................................................................................................................................................................... 127 3.4.2 Methods, results and conclusion ................................................................................................................................................................. 127 3.4.3 Involvement in this work ........................................................................................................................................................................... 128
CHAPTER 4 DISCUSSION ............................................................................................................................................... 137
4.1 SAFETY OF HIGH-DOSE RIFAMPICIN .................................................................................................................................................. 139 4.2 DRUG-DRUG INTERACTION BETWEEN RIFAMPICIN AND EFAVIRENZ AND EFFECT OF DOUBLING THE DOSE OF
RIFAMPICIN ............................................................................................................................................................................................................... 140 4.3 EFFICACY OF HIGH DOSE RIFAMPICIN .............................................................................................................................................. 141 4.4 EARLY EFFICACY MARKERS FOR TUBERCULOSIS CHEMOTHERAPEUTIC TRIALS ................................................................... 141
4.4.1 Does the performance of month-2 culture conversion differ across HIV status? ........................................................................................... 142 4.4.2 What influences month-2 culture conversion among both TB and HIV-TB co-infected populations? .......................................................... 143 4.4.3 What is the impact of the culture media type used on early treatment response indicators, and in context of shorter treatment regimens? ...... 143
4.5 PERSPECTIVE OF TB TREATMENT SHORTENING .......................................................................................................................... 144 4.6 CONCLUSION ............................................................................................................................................................................................ 145
SUMMARY............................................................................................................................................................................. 147
SHORT SUMMARY .................................................................................................................................................................................................... 149
RESUME ................................................................................................................................................................................ 151
RESUME COURT ....................................................................................................................................................................................................... 152
REFERENCES ...................................................................................................................................................................... 153
ACKNOWLEDGEMENTS ................................................................................................................................................... 171
PHD PORTFOLIO ................................................................................................................................................................ 173
ABOUT THE AUTHOR ....................................................................................................................................................... 175
Page 11 of 176
11
List of Figures
FIGURE 1. TB SPECTRUM FROM MYCOBACTERIUM TUBERCULOSIS INFECTION TO ACTIVE (PULMONARY) TB DISEASE, FROM: PAI M, ET
AL. 2016 [13] ............................................................................................................................................................................................................ 17 FIGURE 2. RISK-FACTORS OF TB INFECTION AND DISEASE, FROM NARASIMHAN P, ET AL. 2013 [14] ............................................................ 18 FIGURE 3. ESTIMATED INCIDENCE RATES, 2015, FROM WHO TB REPORT 2016.
HTTP://WWW.WHO.INT/TB/PUBLICATIONS/GLOBAL_REPORT/EN/ [16] ................................................................................................. 20 FIGURE 4. GLOBAL TRENDS IN THE ESTIMATED NUMBER OF DEATHS CAUSED BY TB AND HIV (IN MILLIONS), 2000-2015, FROM WHO
TB REPORT, 2016. HTTP://WWW.WHO.INT/TB/PUBLICATIONS/GLOBAL_REPORT/EN/ [16] ................................................................ 20 FIGURE 5. THE THREE HIGH BURDEN COUNTRIES’ (HBC) LISTS (TB, MDR-TB AND TB/HIV) OF 30 COUNTRIES EACH THAT WILL BE
USED BY WHO 2016–2020, FROM WHO, 2015. HTTP://WWW.WHO.INT/TB/PUBLICATIONS/GLOBAL_REPORT/HIGH_TB_BURDENCOUNTRYLISTS2016-2020.PDF?UA=1 [3] ....... 21
FIGURE 6. ESTIMATED HIV PREVALENCE IN NEW AND RELAPSE TB CASES, 2015, FROM WHO TB REPORT 2016. HTTP://WWW.WHO.INT/TB/PUBLICATIONS/GLOBAL_REPORT/EN/ [16] ................................................................................................. 22
FIGURE 7. SCHEMATIC REPRESENTATION SHOWING THE DIFFERENT FORMS OF TUBERCULOSIS-ASSOCIATED IRIS AND ART-ASSOCIATED TUBERCULOSIS, FROM MEINTJES G., ET AL.2008 [200]............................................................................................................ 40
FIGURE 8. DESIRED DECLINE IN GLOBAL TB INCIDENCE RATES TO REACH THE 2035 TARGETS, FROM WHO: THE END TB STRATEGY. URL: HTTP://WWW.WHO.INT/TB/END_TB_BROCHURE.PDF [207] ........................................................................................................... 42
FIGURE 9. LIST OF ON-GOING CLINICAL TRIALS, FROM WORKING GROUP ON NEW TB DRUGS [224] ............................................................ 47 FIGURE 10. EBA OVER 2 DAYS RELATED TO RIFAMPICIN DOSE SIZE, FROM DIACON A. H, ET AL.2007 [241] .............................................. 49 FIGURE 11. STUDY SCHEME ......................................................................................................................................................................................... 105 FIGURE 12. STUDY PROFILE ......................................................................................................................................................................................... 109 FIGURE 13. EFAVIRENZ AUC PER TREATMENT ARM .............................................................................................................................................. 112 FIGURE 14. SHOWS INDIVIDUAL CMIN ON AND OFF R IN THE THREE TREATMENT ARMS. ............................................................................. 113 FIGURE 15. ONSET OF GRADE 3 OR 4 ELEVATED TRANSAMINASES DURING FIRST 8 WEEKS BEFORE AND AFTER ART INITIATION PER
TREATMENT ARM. ................................................................................................................................................................................................ 115 FIGURE 16. EVOLUTION IN MEDIAN ALT PER TREATMENT REGIMEN DURING STUDY INTERVENTION (FIRST 8 WEEKS) ....................... 115
List of Tables
TABLE 1. MAIN TUBERCULOSIS DRUGS IN CLINICAL USE, THEIR YEAR OF DISCOVERY AND TARGETS, FROM ZUMLA A., ET AL. 2013
[43]. ........................................................................................................................................................................................................................... 25 TABLE 2. RECOMMENDED DOSES OF FIRST-LINE ANTI-TUBERCULOSIS DRUGS FOR ADULTS, FROM WHO REPORT, 2017 [37] ................. 26 TABLE 3. ADVERSE EFFECTS OF FIRST LINE ANTI-TUBERCULOSIS DRUGS, FROM ARBEX MA, ET AL. 2010 [52]. ........................................... 27 TABLE 4. WHO RECOMMENDED FIRST-LINE ART REGIMENS FOR ADULTS, PREGNANT OR BREASTFEEDING WOMEN, ADOLESCENTS
AND CHILDREN, FROM WHO REPORT, 2016 [34] ............................................................................................................................................ 35 TABLE 5. ADVERSE EVENTS ATTRIBUTED TO ANTI-TUBERCULOSIS AND ANTIRETROVIRAL DRUGS, FROM ZUMLA A. ET AL. 2015 [119] 38 TABLE 6. SUMMARY OF THE DIFFERENT STUDIES CONDUCTED PER STUDY OBJECTIVE .................................................................................... 54 TABLE 7. BASELINE PARTICIPANT’S CHARACTERISTICS (MITT POPULATION).................................................................................................... 110 TABLE 8. PHARMACOKINETIC PARAMETERS OF EFV ............................................................................................................................................. 111 TABLE 9. GEOMETRIC MEAN RATIO (GMR) WEEK8/WEEK28 OF THE CMIN AND AUC. .................................................................................. 111 TABLE 10. PATIENTS WITH AT LEAST ONE SERIOUS ADVERSE EVENT ................................................................................................................. 114 TABLE 11. NON-HEPATIC GRADE 3 AND 4 ADVERSE EVENTS ............................................................................................................................... 116 TABLE 12. LEVEL OF REDUCTION IN HIV1 RNA AT 4, 12 AND 24 WEEKS AFTER ART INITIATION, ACROSS TREATMENT ARMS– MITT
POPULATION AFTER EXCLUSION OF 3 PATIENTS WITH BASELINE RESISTANCE TO NNRTI ................................................................. 116 TABLE 13. NUMBER OF PATIENTS WITH POSITIVE MTB CULTURE AT WEEK 8 AND END OF TB TREATMENT OUTCOMES – MITT
POPULATION ......................................................................................................................................................................................................... 117 TABLE 14. MONTH-2 CULTURE CONVERSION RATES REPORTED WITHIN 2 HIGH R DOSE TRIALS, THAT IS, AMONG HIV NEGATIVE TB
PATIENTS (RIFATOX TRIAL) AND HIV-TB CO-INFECTED PATIENTS (RIFAVIRENZ TRIAL) IN UGANDA (EXTRACTED FROM
CHAPTERS 3.1 AND 3.3). ..................................................................................................................................................................................... 142

Page 12 of 176
12

Page 13 of 176
13
CHAPTER 1
INTRODUCTION

Page 14 of 176
14
Page 15 of 176
15
Tuberculosis (TB) is the most important infectious disease of all time, a global plague, with far reaching devastating
effects to its victims, affecting the marginalized persons of lower socioeconomic status and with roots in both the
history and present of humanity [1, 2]. The disease is not selective across age groups. In 1993, TB was declared a
health emergency by the World Health Organization (WHO). It is one of the world's major infectious diseases
with 2-3 billion people infected, 10.4 million new (incident) TB cases worldwide (56% and 34% in males and
females respectively). It is most prevalent in poor countries and countries affected by the human
immunodeficiency virus (HIV) pandemic, particularly in sub-Saharan Africa and Asia. In about 80% of cases, it
manifests itself in a pulmonary form at the origin of its transmission. The disease is curable if treated with
appropriate treatment and with optimal adherence. Unfortunately, TB management has two important obstacles:
the lack of simple and effective point-of-care diagnostic tests and the length of TB treatment. A long treatment
creates problems of adherence and promotes the emergence of the resistant forms of the disease. It is unlikely
that new drugs will be available in the near future for shortening TB treatment for drug-susceptible TB so as to
avert the poor treatment outcomes which include treatment failure, drug-resistance, drug toxicity, TB recurrence,
mortality due to TB, and increases in TB-related costs at household and health-facility level among low and middle
income countries with dual epidemic of TB and HIV.
Our work was conducted in Uganda, one of the TB-HIV high-burden countries [3], so as to evaluate the potential
of using high rifampicin doses as a strategy towards shortening of drug-susceptible pulmonary TB treatment
duration to lower than the current 6 months among adult TB and TB-HIV co-infected patients .
1.1 Microbiology, physiopathology, immunology, risk factors and clinical presentation of
tuberculosis
1.1.1 Microbiology
Tuberculosis is caused by a mycobacterium belonging to the tuberculosis complex consisting of Mycobacterium (M)
tuberculosis, M. bovis, M. africanum, M. canettii and M. pinipedii. M. tuberculosis or bacillus of Koch, named after the
scientist who discovered it in 1882, is the principal agent responsible for human tuberculosis. M. bovis is responsible
for about 1% of infections. M. africanum infection occurs mainly in West and Central Africa where it accounts for
between 20% and 50% of cases of tuberculosis. Mycobacteria are aerobic bacilli, microaerophilic, acid-fast bacilli
(AFB), having the general structure of gram positive bacilli and characterized by a thick outer parietal layer rich in
mycolic acids. They are characterized by their culture requirement and the slow growth with an average split time
of 20 hours, the cultures being positive only after one to several weeks of incubation at 37°C [4]. Secondary
identification makes it possible to differentiate mycobacteria from the tuberculosis complex from other non-
tuberculous mycobacteria. These atypical mycobacteria from the environment are usually non-pathogenic but can
sometimes give clinical manifestations simulating those of TB in immunosuppressed patients or in patients with
chronic bronchial conditions [5]. The sequence of the genome of M. tuberculosis has recently been identified. It is
composed of approximately 4 000 genes and is characterized by the importance of the coding sequences dedicated

Page 16 of 176
16
to the production of enzymes involved in the synthesis and degradation of lipids [6]. The deciphering of the
genome has allowed the development of molecular diagnostic tests for TB and tests for the identification of
mutations associated with anti-tuberculosis drug resistance.
The tuberculosis complex has as its essential reservoir the patients with TB, besides M. bovis whose reservoir is
animal (domestic or wild bovids). The transmission is human-airborne and all the more important it is related to
the density of the bacilli in the air breathed. Patients with "pulmonary caverns" that are very rich in bacilli (100
million bacilli for a cavern about 2 cm in diameter) are the most contagious.
1.1.2 Physiopathology and immunology
After inhalation, the bacilli enter the pulmonary alveolus and are phagocytosed by the alveolar macrophages within
which they multiply. Other macrophages and monocytes are attracted, and thus participate in the process of
defense against infection. The infectious focus thus constituted is the initial focus. The bacilli and the antigens
they release are drained by the macrophages to the lymph node satellite. Within the ganglion, T lymphocytes
identify M. tuberculosis (MTB) antigens and transform into specific T lymphocytes, resulting in the release of
lymphokines and activation of macrophages that inhibit the growth of phagocytic bacilli. At the level of the initial
focus an inflammatory tissue is formed, then fibrous scar tissue, in which the macrophages containing bacilli are
isolated and die. This initial focus or "chancre inoculation" is then the site of a case-specific necrosis specific to
TB. There are then between 1 000 and 10 000 bacilli which gradually lose their viability and have a very slow
multiplication. Bacilli called "quiescent" can persist for several years [7]. The same evolution occurs in the lymph
node, resulting in the formation of the caseous ganglion which evolves spontaneously, in the majority of cases,
towards the fibrous healing then the calcification.
It is on average 2 to 3 weeks after infection that the delayed hypersensitivity reaction to humoral mediation and
cell-mediated immunity occur. Delayed cell-mediated hypersensitivity is conventionally evidenced by the
intradermal injection of tuberculin (inactivated MTB). All these clinical and immunological phenomena observed
after the contamination of a healthy subject constitute the primary TB infection. This phase is usually
asymptomatic but may, in rare cases, be accompanied by clinical manifestations of hypersensitivity. This patient
with non-symptomatic TB infection is considered to have Latent TB infection (LTBI) In 90% of cases (in HIV
negative patients), there is no further development with the disappearance of lung lesions, except for the
persistence of calcifications [8]. It confers on the infected subject a certain degree of immunity. It translates into
tuberculin conversion. The intradermal reaction (IDR) to tuberculin becomes positive 6 to 12 weeks after the
infecting contact. This tuberculin conversion is evidence of recent infection and reflects the resulting immunity
[7]. The recent identification of genome regions encoding specific proteins of MTB (CFP-10 and EAST-6) has
led to the development of novel diagnostic tests for TB infection. These tests are based on the measurement of
the release of interferon gamma in the blood of patients after sensitization by these specific antigens [9, 10].
Page 17 of 176
17
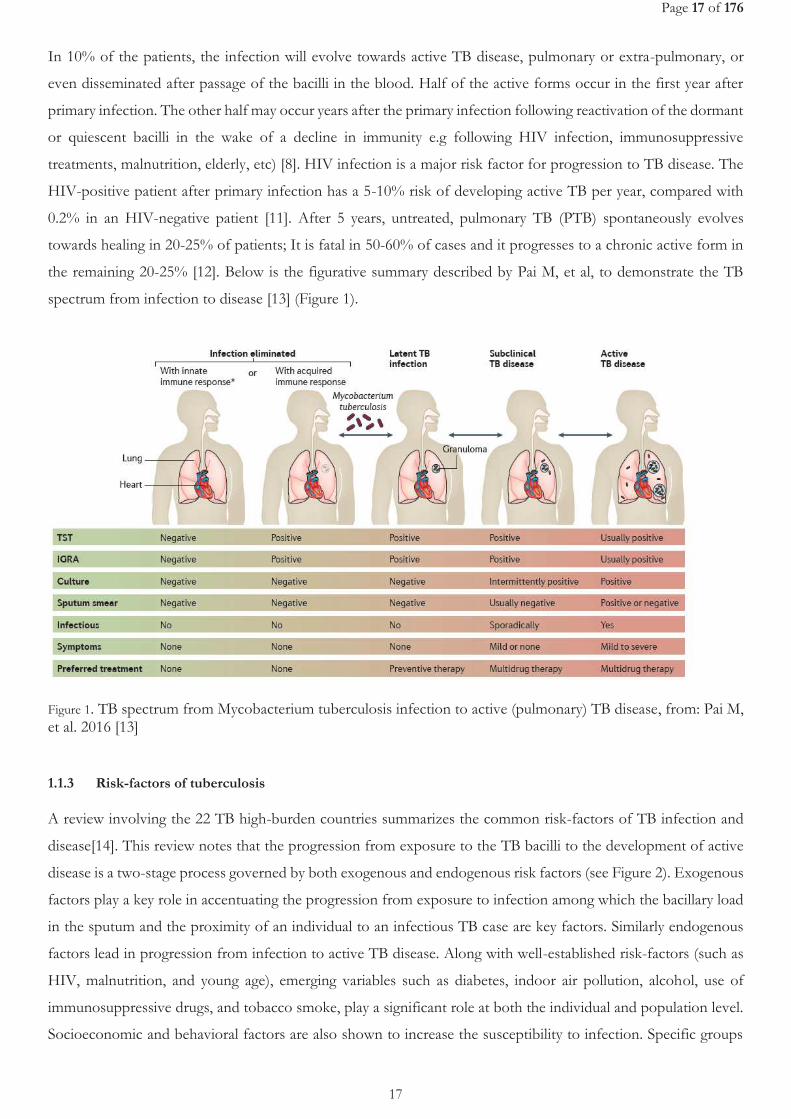
In 10% of the patients, the infection will evolve towards active TB disease, pulmonary or extra-pulmonary, or
even disseminated after passage of the bacilli in the blood. Half of the active forms occur in the first year after
primary infection. The other half may occur years after the primary infection following reactivation of the dormant
or quiescent bacilli in the wake of a decline in immunity e.g following HIV infection, immunosuppressive
treatments, malnutrition, elderly, etc) [8]. HIV infection is a major risk factor for progression to TB disease. The
HIV-positive patient after primary infection has a 5-10% risk of developing active TB per year, compared with
0.2% in an HIV-negative patient [11]. After 5 years, untreated, pulmonary TB (PTB) spontaneously evolves
towards healing in 20-25% of patients; It is fatal in 50-60% of cases and it progresses to a chronic active form in
the remaining 20-25% [12]. Below is the figurative summary described by Pai M, et al, to demonstrate the TB
spectrum from infection to disease [13] (Figure 1).
Figure 1. TB spectrum from Mycobacterium tuberculosis infection to active (pulmonary) TB disease, from: Pai M, et al. 2016 [13]
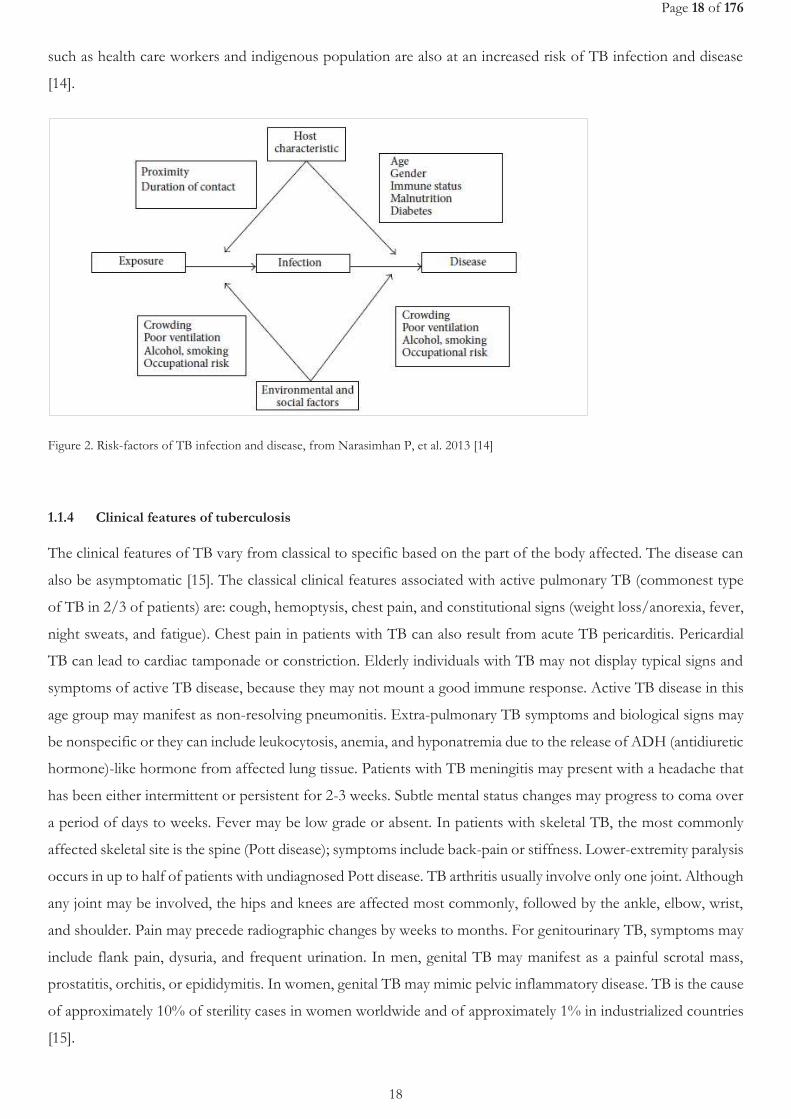
1.1.3 Risk-factors of tuberculosis
A review involving the 22 TB high-burden countries summarizes the common risk-factors of TB infection and
disease[14]. This review notes that the progression from exposure to the TB bacilli to the development of active
disease is a two-stage process governed by both exogenous and endogenous risk factors (see Figure 2). Exogenous
factors play a key role in accentuating the progression from exposure to infection among which the bacillary load
in the sputum and the proximity of an individual to an infectious TB case are key factors. Similarly endogenous
factors lead in progression from infection to active TB disease. Along with well-established risk-factors (such as
HIV, malnutrition, and young age), emerging variables such as diabetes, indoor air pollution, alcohol, use of
immunosuppressive drugs, and tobacco smoke, play a significant role at both the individual and population level.
Socioeconomic and behavioral factors are also shown to increase the susceptibility to infection. Specific groups
Page 18 of 176
18
such as health care workers and indigenous population are also at an increased risk of TB infection and disease
[14].
Figure 2. Risk-factors of TB infection and disease, from Narasimhan P, et al. 2013 [14]
1.1.4 Clinical features of tuberculosis
The clinical features of TB vary from classical to specific based on the part of the body affected. The disease can
also be asymptomatic [15]. The classical clinical features associated with active pulmonary TB (commonest type
of TB in 2/3 of patients) are: cough, hemoptysis, chest pain, and constitutional signs (weight loss/anorexia, fever,
night sweats, and fatigue). Chest pain in patients with TB can also result from acute TB pericarditis. Pericardial
TB can lead to cardiac tamponade or constriction. Elderly individuals with TB may not display typical signs and
symptoms of active TB disease, because they may not mount a good immune response. Active TB disease in this
age group may manifest as non-resolving pneumonitis. Extra-pulmonary TB symptoms and biological signs may
be nonspecific or they can include leukocytosis, anemia, and hyponatremia due to the release of ADH (antidiuretic
hormone)-like hormone from affected lung tissue. Patients with TB meningitis may present with a headache that
has been either intermittent or persistent for 2-3 weeks. Subtle mental status changes may progress to coma over
a period of days to weeks. Fever may be low grade or absent. In patients with skeletal TB, the most commonly
affected skeletal site is the spine (Pott disease); symptoms include back-pain or stiffness. Lower-extremity paralysis
occurs in up to half of patients with undiagnosed Pott disease. TB arthritis usually involve only one joint. Although
any joint may be involved, the hips and knees are affected most commonly, followed by the ankle, elbow, wrist,
and shoulder. Pain may precede radiographic changes by weeks to months. For genitourinary TB, symptoms may
include flank pain, dysuria, and frequent urination. In men, genital TB may manifest as a painful scrotal mass,
prostatitis, orchitis, or epididymitis. In women, genital TB may mimic pelvic inflammatory disease. TB is the cause
of approximately 10% of sterility cases in women worldwide and of approximately 1% in industrialized countries
[15].
Page 19 of 176
19
Physical examination findings associated with TB also depend on the organs involved. Patients with pulmonary
TB have abnormal breath sounds, especially over the upper lobes or involved areas. Rales or bronchial breath
signs may be noted, indicating lung consolidation. Signs of extra-pulmonary TB differ according to the tissues
involved. They may include the following: confusion, coma, neurologic deficit, chorioretinitis, lymphadenopathy,
and cutaneous lesions. Lymphadenopathy in TB occurs as painless swelling of 1 or more lymph nodes.
Lymphadenopathy is usually bilateral and typically involves the anterior and posterior cervical chain or
supraclavicular nodes. The absence of any significant physical findings does not exclude active TB. Classical
symptoms are often absent in high-risk patients, particularly those who are immunocompromised or elderly. Up
to 20% of patients with active TB may be asymptomatic. Therefore, further investigations are essential when chest
radiographic findings are suggestive of TB [15]. It is important to note that atypical presentation of TB occurs in
HIV infected people.
1.2 Epidemiology of tuberculosis
1.2.1 Global TB burden
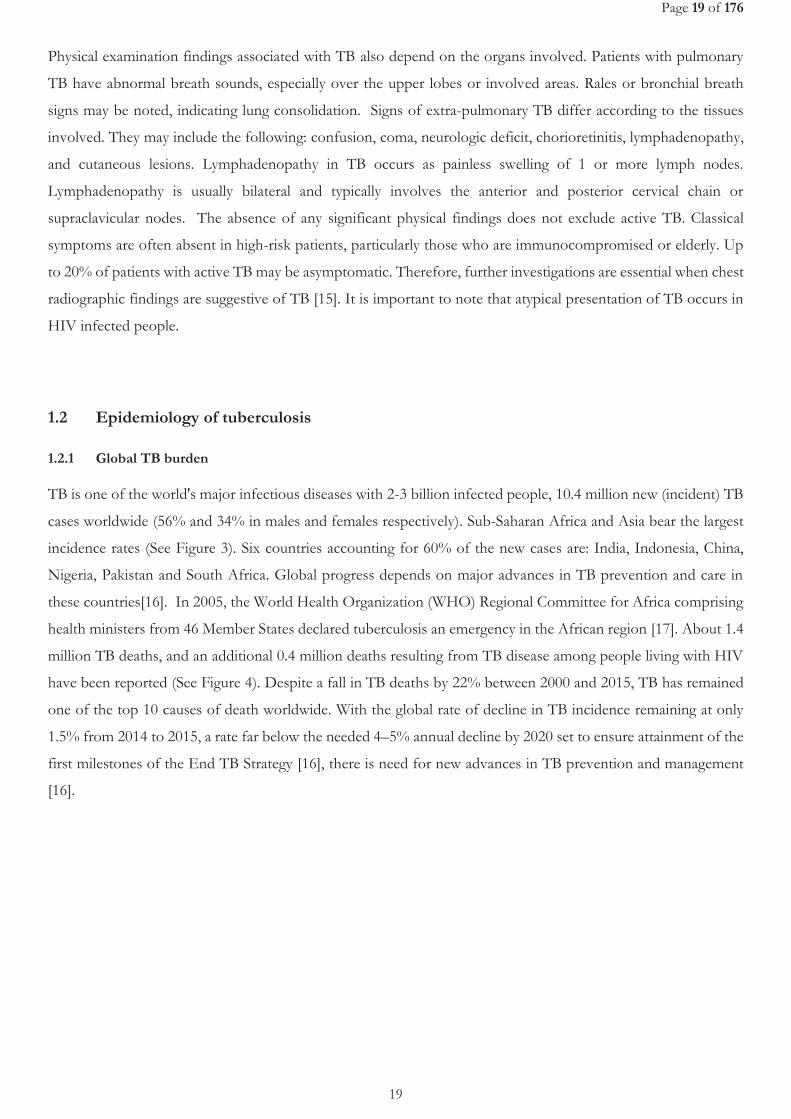
TB is one of the world's major infectious diseases with 2-3 billion infected people, 10.4 million new (incident) TB
cases worldwide (56% and 34% in males and females respectively). Sub-Saharan Africa and Asia bear the largest
incidence rates (See Figure 3). Six countries accounting for 60% of the new cases are: India, Indonesia, China,
Nigeria, Pakistan and South Africa. Global progress depends on major advances in TB prevention and care in
these countries[16]. In 2005, the World Health Organization (WHO) Regional Committee for Africa comprising
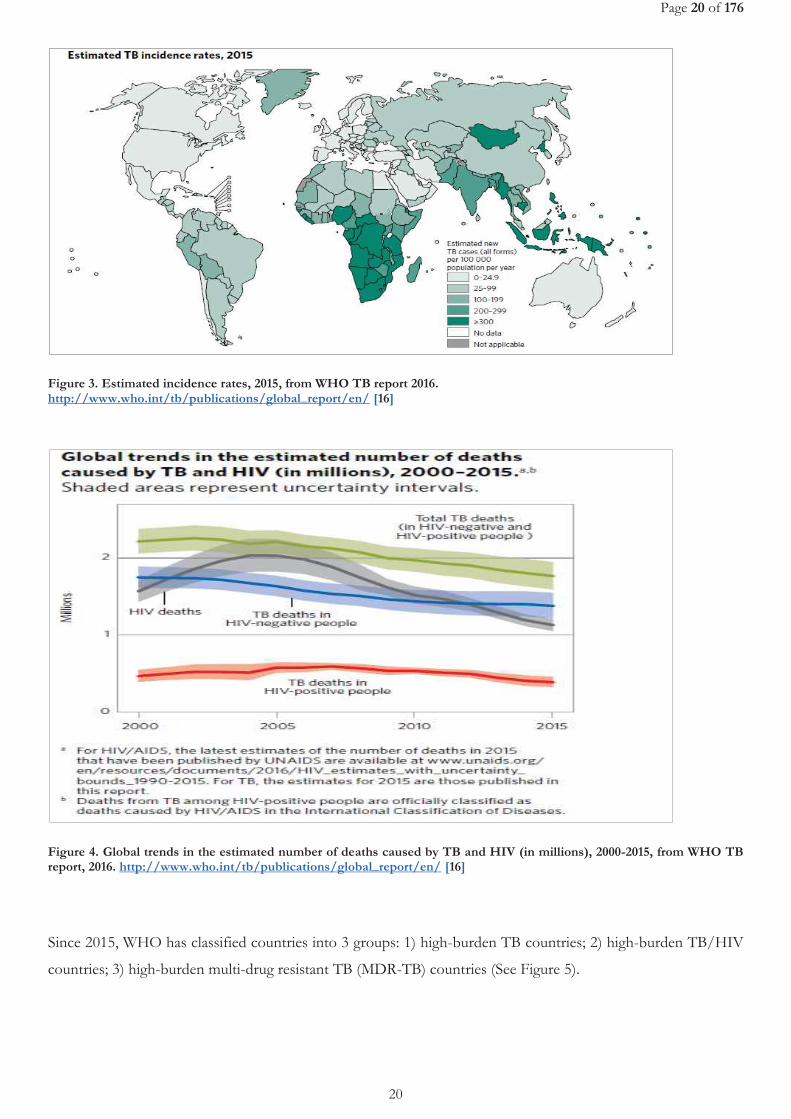
health ministers from 46 Member States declared tuberculosis an emergency in the African region [17]. About 1.4
million TB deaths, and an additional 0.4 million deaths resulting from TB disease among people living with HIV
have been reported (See Figure 4). Despite a fall in TB deaths by 22% between 2000 and 2015, TB has remained
one of the top 10 causes of death worldwide. With the global rate of decline in TB incidence remaining at only
1.5% from 2014 to 2015, a rate far below the needed 4–5% annual decline by 2020 set to ensure attainment of the
first milestones of the End TB Strategy [16], there is need for new advances in TB prevention and management
[16].
Page 20 of 176
20
Figure 3. Estimated incidence rates, 2015, from WHO TB report 2016. http://www.who.int/tb/publications/global_report/en/ [16]
Figure 4. Global trends in the estimated number of deaths caused by TB and HIV (in millions), 2000-2015, from WHO TB report, 2016. http://www.who.int/tb/publications/global_report/en/ [16]
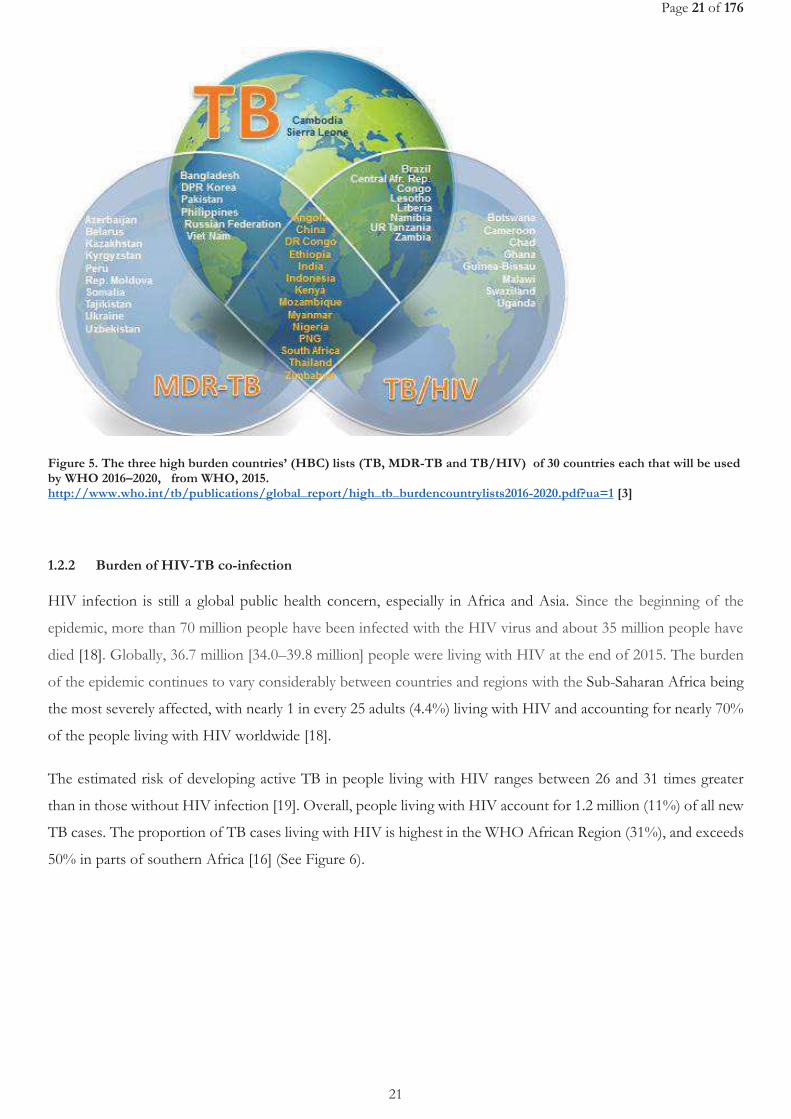
Since 2015, WHO has classified countries into 3 groups: 1) high-burden TB countries; 2) high-burden TB/HIV
countries; 3) high-burden multi-drug resistant TB (MDR-TB) countries (See Figure 5).
Page 21 of 176
21
Figure 5. The three high burden countries’ (HBC) lists (TB, MDR-TB and TB/HIV) of 30 countries each that will be used by WHO 2016–2020, from WHO, 2015. http://www.who.int/tb/publications/global_report/high_tb_burdencountrylists2016-2020.pdf?ua=1 [3]
1.2.2 Burden of HIV-TB co-infection
HIV infection is still a global public health concern, especially in Africa and Asia. Since the beginning of the
epidemic, more than 70 million people have been infected with the HIV virus and about 35 million people have
died [18]. Globally, 36.7 million [34.0–39.8 million] people were living with HIV at the end of 2015. The burden
of the epidemic continues to vary considerably between countries and regions with the Sub-Saharan Africa being
the most severely affected, with nearly 1 in every 25 adults (4.4%) living with HIV and accounting for nearly 70%
of the people living with HIV worldwide [18].
The estimated risk of developing active TB in people living with HIV ranges between 26 and 31 times greater
than in those without HIV infection [19]. Overall, people living with HIV account for 1.2 million (11%) of all new
TB cases. The proportion of TB cases living with HIV is highest in the WHO African Region (31%), and exceeds
50% in parts of southern Africa [16] (See Figure 6).
Page 22 of 176
22
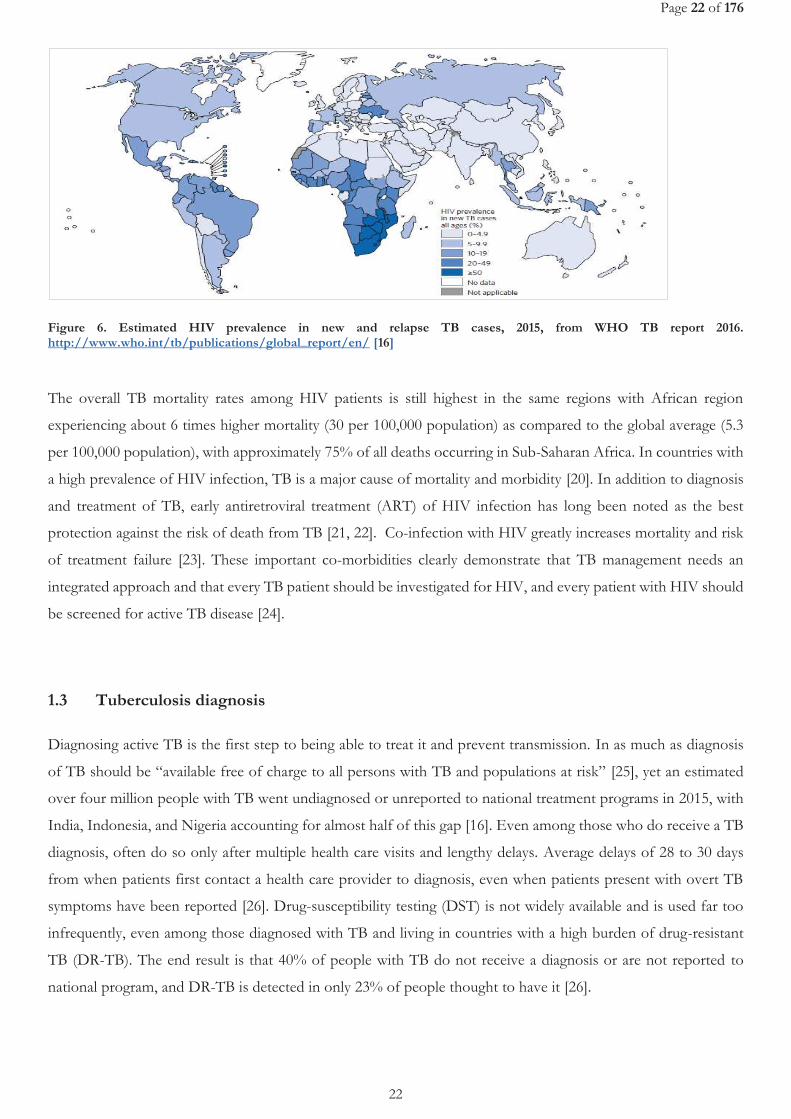
Figure 6. Estimated HIV prevalence in new and relapse TB cases, 2015, from WHO TB report 2016. http://www.who.int/tb/publications/global_report/en/ [16]
The overall TB mortality rates among HIV patients is still highest in the same regions with African region
experiencing about 6 times higher mortality (30 per 100,000 population) as compared to the global average (5.3
per 100,000 population), with approximately 75% of all deaths occurring in Sub-Saharan Africa. In countries with
a high prevalence of HIV infection, TB is a major cause of mortality and morbidity [20]. In addition to diagnosis
and treatment of TB, early antiretroviral treatment (ART) of HIV infection has long been noted as the best
protection against the risk of death from TB [21, 22]. Co-infection with HIV greatly increases mortality and risk
of treatment failure [23]. These important co-morbidities clearly demonstrate that TB management needs an
integrated approach and that every TB patient should be investigated for HIV, and every patient with HIV should
be screened for active TB disease [24].
1.3 Tuberculosis diagnosis
Diagnosing active TB is the first step to being able to treat it and prevent transmission. In as much as diagnosis
of TB should be “available free of charge to all persons with TB and populations at risk” [25], yet an estimated
over four million people with TB went undiagnosed or unreported to national treatment programs in 2015, with
India, Indonesia, and Nigeria accounting for almost half of this gap [16]. Even among those who do receive a TB
diagnosis, often do so only after multiple health care visits and lengthy delays. Average delays of 28 to 30 days
from when patients first contact a health care provider to diagnosis, even when patients present with overt TB
symptoms have been reported [26]. Drug-susceptibility testing (DST) is not widely available and is used far too
infrequently, even among those diagnosed with TB and living in countries with a high burden of drug-resistant
TB (DR-TB). The end result is that 40% of people with TB do not receive a diagnosis or are not reported to
national program, and DR-TB is detected in only 23% of people thought to have it [26].
Page 23 of 176
23
Microscopy has been the commonly used method that detects the AFB although not specific as in to distinguish
between live and dead bacilli, but also atypical mycobacteria from MTB. It is also simple, fast, and inexpensive.
However, microscopy has low and variable sensitivity (20 to 60%) [27], especially among patients co-infected with
HIV [28]. This low sensitivity is due to low level of detection. Nevertheless, it is widely implemented in limited
resource countries.
On the other-hand, culture methods are the definitive diagnostic tests of TB, given their ability to distinguish
between alive from dead bacilli. Its use is hindered by the long turn-around time. On average 3 weeks may be
needed for mycobacterium growth to occur. This hinders its use as a point-of-care test. More so, the lack of
appropriate laboratory infrastructure with good infection control mechanisms in many resource limited settings
limit its use and left only in reference laboratories. Two types of culture media exist: 1) solid media e.g. Lowenstein-
Jensen (LJ) and mycobacteria growth indicator tube (MGIT). Specifically, LJ tend to exhibit a slower growth and
lower sensitivity as compared to MGIT [29, 30].
Molecular diagnostic methods can provide the data needed more rapidly, and in many cases it is more cost-
effective than traditional culture methods [31, 32]. Nucleic acid amplification assays including polymerase chain
reaction (PCR) have revolutionized the detection of MTB. It is a useful and sensitive tool for the early diagnosis
of MTB in variety of clinical samples[33]. Xpert MTB/RIF is an automated PCR test (that is, a molecular test)
utilizing the GeneXpert platform (Cepheid, Sunnyvale, CA, United States). Xpert MTB/RIF is a single test that
can detect both MTB complex and rifampicin resistance within 2 hours after starting the assay, with minimal
hands-on technical time. Given that all steps in the assay are automated and contained within its cartridge, that
fact that it requires limited infrastructure and expertise to do, increases its access even in low and middle-income
countries (LMICs). The fact that the assay’s sample reagent, used to liquefy sputum, is tuberculocidal, it largely
eliminates concerns about biosafety during the test procedure and allow the technology to be decentralized for
use nearer to patients[34].
In an effort to enhance early detection of TB and prompt initiation of appropriate treatment, there has been a
switch in the recommendations to Xpert MTB/RIF use rather than conventional microscopy, culture and DST
as the initial diagnostic test in adults and children suspected of having TB or MDR-TB [35]. This also applies in
case of non-respiratory specimens like cerebrospinal fluid, lymph nodes and other tissues from patients suspected
of having TB. However, microscopy still remain key for treatment monitoring given that it is readily available in
remote settings and despite not being able to differentiate alive from dead bacilli, it can show reduction in bacillary
load with treatment [36].
Chest X-ray (CXR) is used to diagnose intra-thoracic lesions due to TB. CXR has high sensitivity for PTB and
thus is a valuable tool to diagnose PTB and allow also to identify differential diagnosis of TB. However, CXR has
poor specificity; although some CXR abnormalities are rather specific for PTB (for example, cavities), many CXR
abnormalities that are consistent with pulmonary TB are also common in several other lung pathologies.
Moreover, there is significant intra- and inter-observer variation in the reading of CXRs. Relying only on CXR for
Page 24 of 176
24
TB diagnosis leads to over-diagnosis, as well as under-diagnosis [37, 38]. Rigorous efforts should always be made
to base a TB diagnosis on bacteriological confirmation. WHO classifies TB diagnosis into bacteriologically
confirmed TB, if it is based on bacteriological confirmation, or clinically diagnosed TB, if it is based on clinical
assessment including CXR, only , the latter receiving an empirical TB treatment [37]. However, it should be noted
that the low access to X-ray in limited resource countries, issues of poor quality and the fact that its costs are often
not covered by National TB programs (NTP) limits its use among patients that would need it. In 2016, the WHO
issued a summary of its existing recommendations on CXR as a screening tool for TB disease, indicating its
sensitivity, its importance for diagnosing childhood TB, its additive value with Xpert MTB/RIF, its use in
diagnosing TB in people with HIV, and its role in ruling out active TB before treating LTBI [37].
It is noteworthy that the lack of antibody or antigen sputum-based rapid test or non-sputum based point of care
test is a limitation in the effort to diagnose TB, especially in patients with advanced HIV infection and children.
This leaves many patients being started on empirical TB treatment.
However, recently, the WHO endorsed use of urine lipoarabinomannan (LAM) test for active TB screening and
diagnosis among HIV/AIDS patients with advance disease or with severe immune-suppression. LAM antigen is
a lipopolysaccharide present in mycobacterial cell walls, which is released from metabolically active or degenerating
bacterial cells and appears to be present only in people with active TB disease. Urine-based testing would have
advantages over sputum-based testing because urine is easy to collect and store, and lacks the infection control
risks associated with sputum collection. However, it suffers poor sensitivity[39].
1.4 Treatment of Tuberculosis
The aims of TB treatment are: to cure the patient and restore quality of life and productivity; to prevent death
from active TB or its late effects; to prevent relapse of TB; to reduce transmission of TB to others; and to prevent
the development and transmission of drug resistance [40]. Anti-TB treatment (ATT) is a combination of
antibiotics, to avoid the risk of selection of resistant strains of MTB. It is of long duration so as to increase the
chances of sterilization of quiescent bacilli and reduce the risk of TB recurrence. Given the long waiting times for
the results of DST and their low access in countries with a high TB prevalence, TB treatment has for long been
an empirical standardized treatment [41].
1.4.1 History of tuberculosis drug development
The first antibiotic to be discovered with proven activity against MTB was streptomycin. It is an antibiotic purified
from Streptomyces griseus, discovered almost 70 years ago, thus providing the first hope of a TB-specific therapy [42,
43]. Nevertheless, uncertainties remained with regard to its ability to consistently cure patients, and this was closely
followed by the realization that drug resistance develops rapidly when a single agent is used for the treatment of
Page 25 of 176
25
TB. Following the launch of the Medical Research Council (MRC) TB unit in the United Kingdom in 1946, the
unit conducted the first recorded randomized, controlled clinical trial designed to compare streptomycin plus bed
rest versus bed rest alone [44]. The study showed that streptomycin plus bed rest achieved greater clinical
improvement but only modest pathological improvement (as assessed by CXR) in comparison to bed rest alone.
Importantly, improvement in TB was greatest in the first 3 months of therapy, after which many patients began
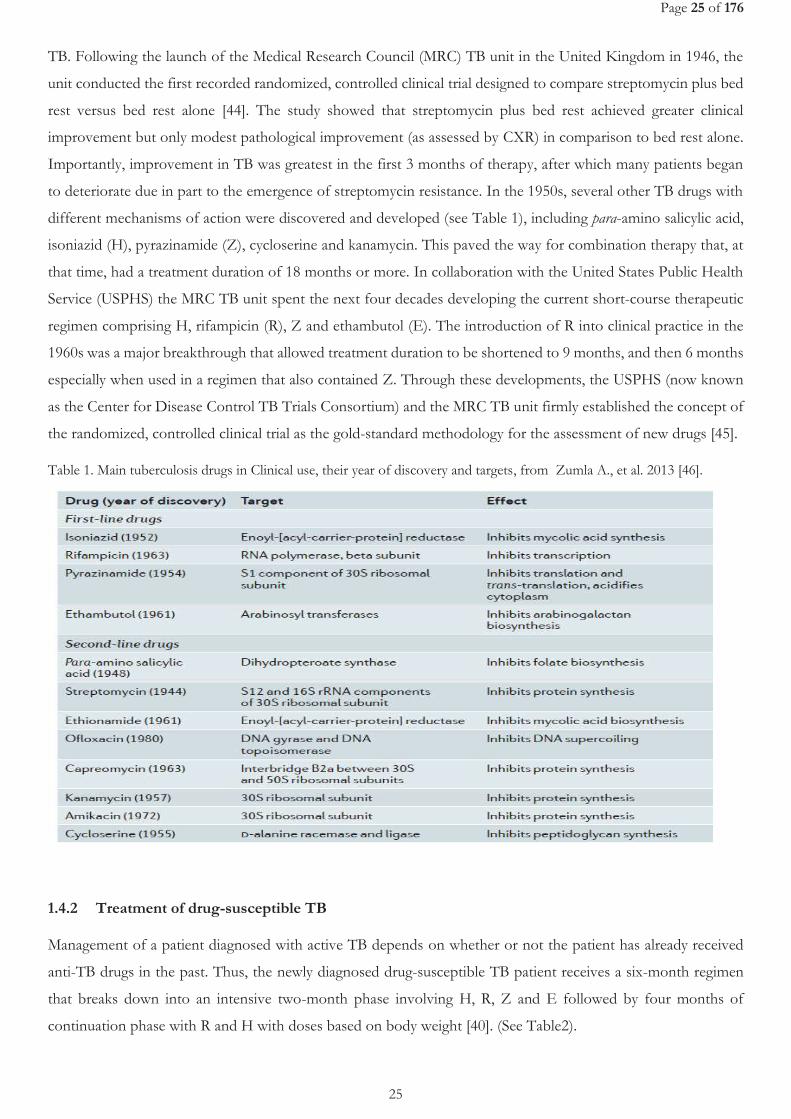
to deteriorate due in part to the emergence of streptomycin resistance. In the 1950s, several other TB drugs with
different mechanisms of action were discovered and developed (see Table 1), including para-amino salicylic acid,
isoniazid (H), pyrazinamide (Z), cycloserine and kanamycin. This paved the way for combination therapy that, at
that time, had a treatment duration of 18 months or more. In collaboration with the United States Public Health
Service (USPHS) the MRC TB unit spent the next four decades developing the current short-course therapeutic
regimen comprising H, rifampicin (R), Z and ethambutol (E). The introduction of R into clinical practice in the
1960s was a major breakthrough that allowed treatment duration to be shortened to 9 months, and then 6 months
especially when used in a regimen that also contained Z. Through these developments, the USPHS (now known
as the Center for Disease Control TB Trials Consortium) and the MRC TB unit firmly established the concept of
the randomized, controlled clinical trial as the gold-standard methodology for the assessment of new drugs [45].
Table 1. Main tuberculosis drugs in Clinical use, their year of discovery and targets, from Zumla A., et al. 2013 [46].
1.4.2 Treatment of drug-susceptible TB
Management of a patient diagnosed with active TB depends on whether or not the patient has already received
anti-TB drugs in the past. Thus, the newly diagnosed drug-susceptible TB patient receives a six-month regimen
that breaks down into an intensive two-month phase involving H, R, Z and E followed by four months of
continuation phase with R and H with doses based on body weight [40]. (See Table2).
Page 26 of 176
26
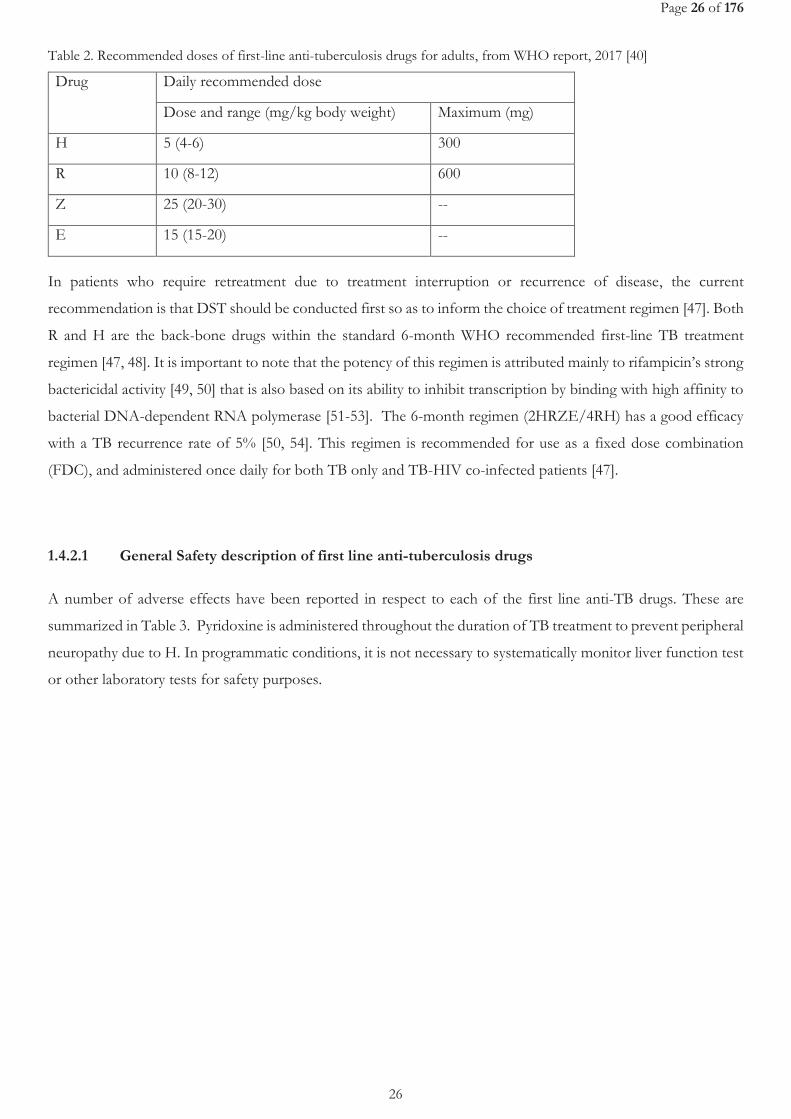
Table 2. Recommended doses of first-line anti-tuberculosis drugs for adults, from WHO report, 2017 [40]
Drug Daily recommended dose
Dose and range (mg/kg body weight) Maximum (mg)
H 5 (4-6) 300
R 10 (8-12) 600
Z 25 (20-30) --
E 15 (15-20) --
In patients who require retreatment due to treatment interruption or recurrence of disease, the current
recommendation is that DST should be conducted first so as to inform the choice of treatment regimen [47]. Both
R and H are the back-bone drugs within the standard 6-month WHO recommended first-line TB treatment
regimen [47, 48]. It is important to note that the potency of this regimen is attributed mainly to rifampicin’s strong
bactericidal activity [49, 50] that is also based on its ability to inhibit transcription by binding with high affinity to
bacterial DNA-dependent RNA polymerase [51-53]. The 6-month regimen (2HRZE/4RH) has a good efficacy
with a TB recurrence rate of 5% [50, 54]. This regimen is recommended for use as a fixed dose combination
(FDC), and administered once daily for both TB only and TB-HIV co-infected patients [47].
1.4.2.1 General Safety description of first line anti-tuberculosis drugs
A number of adverse effects have been reported in respect to each of the first line anti-TB drugs. These are
summarized in Table 3. Pyridoxine is administered throughout the duration of TB treatment to prevent peripheral
neuropathy due to H. In programmatic conditions, it is not necessary to systematically monitor liver function test
or other laboratory tests for safety purposes.
Page 27 of 176
27
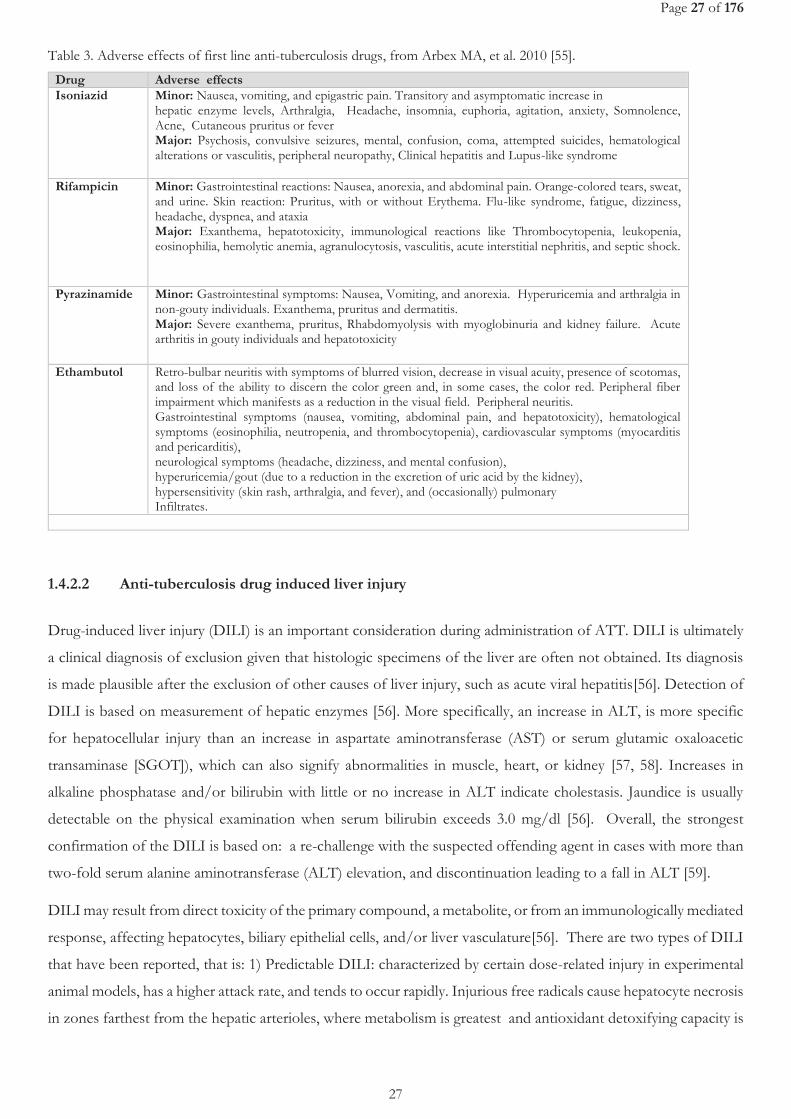
Table 3. Adverse effects of first line anti-tuberculosis drugs, from Arbex MA, et al. 2010 [55].
Drug Adverse effects Isoniazid Minor: Nausea, vomiting, and epigastric pain. Transitory and asymptomatic increase in
hepatic enzyme levels, Arthralgia, Headache, insomnia, euphoria, agitation, anxiety, Somnolence, Acne, Cutaneous pruritus or fever Major: Psychosis, convulsive seizures, mental, confusion, coma, attempted suicides, hematological alterations or vasculitis, peripheral neuropathy, Clinical hepatitis and Lupus-like syndrome
Rifampicin Minor: Gastrointestinal reactions: Nausea, anorexia, and abdominal pain. Orange-colored tears, sweat, and urine. Skin reaction: Pruritus, with or without Erythema. Flu-like syndrome, fatigue, dizziness, headache, dyspnea, and ataxia Major: Exanthema, hepatotoxicity, immunological reactions like Thrombocytopenia, leukopenia, eosinophilia, hemolytic anemia, agranulocytosis, vasculitis, acute interstitial nephritis, and septic shock.
Pyrazinamide Minor: Gastrointestinal symptoms: Nausea, Vomiting, and anorexia. Hyperuricemia and arthralgia in non-gouty individuals. Exanthema, pruritus and dermatitis. Major: Severe exanthema, pruritus, Rhabdomyolysis with myoglobinuria and kidney failure. Acute arthritis in gouty individuals and hepatotoxicity
Ethambutol Retro-bulbar neuritis with symptoms of blurred vision, decrease in visual acuity, presence of scotomas, and loss of the ability to discern the color green and, in some cases, the color red. Peripheral fiber impairment which manifests as a reduction in the visual field. Peripheral neuritis. Gastrointestinal symptoms (nausea, vomiting, abdominal pain, and hepatotoxicity), hematological symptoms (eosinophilia, neutropenia, and thrombocytopenia), cardiovascular symptoms (myocarditis and pericarditis), neurological symptoms (headache, dizziness, and mental confusion), hyperuricemia/gout (due to a reduction in the excretion of uric acid by the kidney), hypersensitivity (skin rash, arthralgia, and fever), and (occasionally) pulmonary Infiltrates.
1.4.2.2 Anti-tuberculosis drug induced liver injury
Drug-induced liver injury (DILI) is an important consideration during administration of ATT. DILI is ultimately
a clinical diagnosis of exclusion given that histologic specimens of the liver are often not obtained. Its diagnosis
is made plausible after the exclusion of other causes of liver injury, such as acute viral hepatitis[56]. Detection of
DILI is based on measurement of hepatic enzymes [56]. More specifically, an increase in ALT, is more specific
for hepatocellular injury than an increase in aspartate aminotransferase (AST) or serum glutamic oxaloacetic
transaminase [SGOT]), which can also signify abnormalities in muscle, heart, or kidney [57, 58]. Increases in
alkaline phosphatase and/or bilirubin with little or no increase in ALT indicate cholestasis. Jaundice is usually
detectable on the physical examination when serum bilirubin exceeds 3.0 mg/dl [56]. Overall, the strongest
confirmation of the DILI is based on: a re-challenge with the suspected offending agent in cases with more than
two-fold serum alanine aminotransferase (ALT) elevation, and discontinuation leading to a fall in ALT [59].
DILI may result from direct toxicity of the primary compound, a metabolite, or from an immunologically mediated
response, affecting hepatocytes, biliary epithelial cells, and/or liver vasculature[56]. There are two types of DILI
that have been reported, that is: 1) Predictable DILI: characterized by certain dose-related injury in experimental
animal models, has a higher attack rate, and tends to occur rapidly. Injurious free radicals cause hepatocyte necrosis
in zones farthest from the hepatic arterioles, where metabolism is greatest and antioxidant detoxifying capacity is
Page 28 of 176
28
the least [60, 61]. 2) Unpredictable or idiosyncratic reactions: comprise most types of DILI and these
hypersensitivity or metabolic reactions occur largely independent of dose and relatively rarely for each drug, and
may result in hepatocellular injury and/or cholestasis. Hepatocyte necrosis is often distributed throughout hepatic
lobules rather than being zonal, as is often seen with predictable DILI [62]. Metabolic idiosyncratic reactions may
result from genetic or acquired variations in drug biotransformation pathways, with synthesis or abnormally slow
detoxification of a hepatotoxic metabolite. Metabolic idiosyncratic reactions may have a widely variable latent
period, but recur within days to weeks after re-exposure [63].
DILI may occur with all currently recommended regimens for the treatment of TB infection or disease [64]. This
can occur with R, Z and H [65-67]. Metabolic idiosyncratic reactions appear to be responsible for most DILI from
the ATT [56]. The onset of DILI bears some differences depending on the type of TB drug responsible.
Rifampicin-related DILI
R has been reported to occasionally cause dose-dependent interference with bilirubin uptake, resulting in
subclinical, unconjugated hyperbilirubinemia or jaundice without hepatocellular damage. This may be transient
and occur early in treatment or in some individuals with preexisting liver disease [68-71]. R occasionally can cause
hepatocellular injury and potentiate hepatotoxicities of other anti-TB medications [72, 73]. The conjugated
hyperbilirubinemia occasionally reported during treatment of TB using R-based combinations, is probably caused
by R inhibiting the major bile salt exporter pump [74]. Asymptomatic elevated bilirubin may also result from dose-
dependent competition with bilirubin for clearance at the sinusoidal membrane or from impeded secretion at the
canalicular level [63, 68, 69]. Rare hepatocellular injury appears to be a hypersensitivity reaction, and it may be
more common with large, intermittent doses [68]. Hypersensitivity reactions have been reported in combination
with renal dysfunction, hemolytic anemia, or “flulike syndrome” [75, 76]. R-induced hepatotoxicity is characterized
by cholestasis which may be insidious. Idiosyncratic hypersensitivity reaction to R, manifest as anorexia, nausea,
vomiting, malaise, fever, mildly elevated ALT, and elevated bilirubin, usually occurs in the first month of treatment
initiation [68, 76-78].
Isoniazid-related DILI
Two potential explanations for onset of isoniazid DILI have been raised. The first one is based on acetylation
rate, a claim that is still controversial. . In contrast to early studies [79-81], slow acetylators may actually have
greater cumulative mono-acetyl hydrazine (MAH) exposure, which could be further metabolized to other toxic
intermediaries especially reactive metabolites[45]. Slow acetylators also had higher peak ALT than did fast
acetylators and, when rechallenged with H, more frequently developed transaminase elevation of at least three
times the upper limit of normal (ULN) [79]. Secondly, metabolic idiosyncratic mechanisms have been implicated
in H-induced hepatotoxicity. The H metabolite acetyl-hydrazine covalently binds to liver macromolecules, a
process mediated by microsomal enzymes [80]. Patients with homozygous cytochrome P450 2E1 c1/c1 host gene
polymorphism, who have enhanced cytochrome P450 2E1 activity, in one study had a higher risk of
Page 29 of 176
29
hepatotoxicity, particularly in slow acetylators [82]. R appears to enhance a metabolic hepatocellular idiosyncratic
reaction in patients receiving H, perhaps by promoting the formation of toxic H metabolites [83, 84].
At presentation, some individuals may be asymptomatic, whereas others may experience symptomatic
hepatotoxicity at varying serum transaminase concentrations. Constitutional symptoms may be seen early in severe
hepatotoxicity, and may last from days to weeks. Nausea, vomiting, and abdominal pain are seen in 50 to 75% of
patients with severe illness, whereas fever is noted in 10% and rash in 5% of patients. Overt jaundice, dark urine,
and clay-colored stools are late signs of clinical worsening. Coagulopathy, hypoalbuminemia, and hypoglycemia
signify life-threatening hepatic dysfunction. The regression of H hepatotoxicity usually takes weeks. Recovery is
complete in most after discontinuation of H [85].
H induced hepatotoxicity occurs generally within weeks to months rather than the days to weeks of onset seen
with hypersensitivity reactions [85, 86]. Unlike a classical hypersensitivity reaction, H re-challenge does not always
elicit rapid recurrence of hepatotoxicity [85]. Approximately 60% of the hepatotoxicity incidence is reported to
occur in the first 3 months of treatment, and 80% of the incidence in the first 6 months [87-89]. A retrospective
case fatality review found that the median interval from treatment initiation to symptom onset was 16 weeks [90].
Most H-associated hepatotoxicity is age associated, with symptomatic transaminase elevation: ranging from 0%
in <14 years to 0.28% in those >65 years in the Seattle study [91]; 0.44% in <35years to 2.08% in >49 years
having AST elevation more than five times the ULN in the Tennessee study, a difference that was statistically
significant [89]. However, the differences in the findings among these studies have been attributed to differing
definitions of hepatotoxicity, patient selection, and inability to exclude confounding causes of hepatotoxicity [56].
The severity of H-related hepatitis has been reported to also increase with age, with higher mortality in those older
than 50 years [85, 90, 92].
Combined Rifampicin and Isoniazid related DILI
The rate of symptomatic hepatitis with the combination of R and H has been estimated at 2.55% in a meta-analysis
that included patients with TB disease, a higher incidence than in regimens containing one or the other drug [93].
It is thought that the observed elevation in transaminases may partly or fully be due to H, a phenomenon that is
supported by studies reporting transaminase elevations above the upper-limit of normal ranges being seen more
commonly in people with LTBI on H alone as compared to those on R alone [73], or even the absence of
significant transaminase elevations even with intake of R alone for 4-months [72]. Secondly, that perhaps the
observed ALT elevations may actually be equivalent to what we would normally expect even without any treatment
administration. This is supported by results of a study that showed a non-significant difference in geometric mean
of serum ALT between the placebo and R groups [94].
Pyrazinamide-related DILI
Transaminase elevation more than four times the ULN were reported with administration of Z and either E (58%)
or levofloxacin (18%) or ofloxacin (41%) for treatment of LTBI after exposure to MDR TB [65, 66]. The half-
Page 30 of 176
30
life (t1/2) of Z is notably longer than that of either H or R, approximately 10 hours [82]. In patients with
preexisting hepatic disease, t1/2 is increased to 15 hours (101). Z, a nicotinic acid derivative, is de-amidated to
pyrazinoic acid in the liver and subsequently metabolized to 5-hydroxy-pyrazinoic acid by xanthine oxidase [95],
aldehyde oxidase [96], and xanthine dehydrogenase [97, 98]. In addition, 5-hydroxy-pyrazinamide may be
generated during metabolism [99]. The kidneys clear metabolites of Z, hence requiring intermittent dosing in
patients with renal insufficiency [100]. Z may exhibit both dose-dependent and idiosyncratic hepatotoxicity.
Historically, daily use of Z at 40 to 50 mg/kg commonly resulted in hepatotoxicity, and a relationship to dose was
noted [101]. It is thought that there might be shared mechanisms of injury for H and Z, because there is some
similarity in molecular structure. This is implied in the evidence that patients who previously had hepatotoxic
reactions with H have had more severe reactions with R and Z given for LTBI [102]. Z may induce hypersensitivity
reactions with eosinophilia and liver injury [102] or granulomatous hepatitis [103].
There has been few reports of ethambutol-related liver cholestatic jaundice, with unclear circumstances [104].
Otherwise, E has not been linked to liver injury.
Factors associated with onset of DILI during TB treatment
An increased risk of hepatotoxicity has been associated with: being woman [105-108] though contradicted in other
studies [87, 109]; alcohol use [87, 110, 111], contrary to other two studies [106, 109]; having abnormal baseline
transaminases [107]; NAT2 slow acetylators as determined by phenotypic assays [83, 110, 112] or by genotypic
assays [79, 113]; malnutrition or hypoalbuminemia [110, 114-116] ; presence of HLA-DQB1*0201 [116]; gene
polymorphisms at loci of genes coding for cytochrome P450 2E1 and for glutathione S-transferase [79, 117];
higher EFV concentrations [113, 118]; CYP2B6*6 genotype [113, 118]; extensive TB disease [105, 110]; and
patients under-going liver transplant [119]. In a meta-analysis, the presence of R in a multidrug treatment regimen
increased the incidence of significant hepatotoxicity for adults from 1.6 to 2.55% and in children from 1.0 to 6.9%
[93]. Z is considered as a contributor to increased incidence or severity of hepatotoxicity [107, 109, 120, 121],
although some studies could not demonstrate this link [122-125]. The role of hepatitis B infection on incidence
of TB DILI has been demonstrated in some studies [126, 127] but not on others [110]. Hepatitis B virus carriage
has been linked to incidence of more severe hepatic disease from treatment-associated liver injury [126, 128].
Additional studies are needed, but the limited data leave sufficient concern that hepatitis B may be a risk factor
for more frequent or severe hepatotoxicity during treatment of TB disease[45]. The role of Hepatitis C Virus
infection on DILI during treatment for TB disease was shown in a study conducted in Florida, in which patients
received at least 5 days of H, R or rifabutin, or Z, and had not received alcohol or drugs of abuse for at least 10
days before starting anti-TB therapy. Hepatotoxicity was reported in 30% versus 11% of patients with and without
hepatitis C–infection respectively. Hepatitis C was independently associated with fivefold risk of transaminase
elevation of at least 120 U/L, or of serum bilirubin of at least 1.5 mg/dl. Co-infection with both hepatitis C and
HIV elevated the risk of hepatotoxicity more than 14-fold [129].
Page 31 of 176
31
1.4.2.3 Treatment outcomes of drug susceptible tuberculosis
Assessment of therapeutic response is based on systematic microscopic examination of sputum at the end of the
intensive phase (two months), at five months and at the end of treatment (6 months)[130]. A patient is considered
cured if he has received full treatment and is smear-negative twice between the end of the intensive phase and the
end of treatment. One is considered to have treatment failure if smear-positive at five months or later [41].
Needless to say, microscopy is poorly adapted to this evaluation of therapeutic response given its inability to
differentiate live from a dead bacillus. Indeed, smear-positive persistence is not uncommon after five months of
treatment in patients with large pulmonary cavities [131]. Although accessibility to Xpert MTB/RIF is increasing,
it is also not adequate in differentiating dead from live bacilli and therefore not recommended for treatment
monitoring. The only test to assess response is culture but it is poorly available and with long delays that make
difficult treatment decision.
There is no effective early surrogate markers of TB treatment efficacy yet. Culture conversion at week 8 though
used commonly in TB chemotherapeutic trials, has been reported to be a poor surrogate marker for treatment
efficacy [132-134] and therefore create a challenge in precise estimation of new anti-tuberculosis drug or regimen
efficacy. The delayed culture conversion beyond week 8 in East African populations [135, 136], has challenged
the use of week-8 culture conversion rate, with researchers suggesting the use of months-3 instead of month-2
culture conversion endpoint as a surrogate of treatment efficacy within the phase II East African trials [133].
Because of the weakness of month-2 culture conversion, phase 3 confirmatory trials still rely on relapse free cure
as the primary endpoint for efficacy which implies very long post treatment follow-up for a minimum of 12
months, which is time consuming and costly, something that could explain why there are so few randomized
clinical trials (RCT) in TB.
1.4.2.4 Adherence to TB treatment
The effectiveness of the 6-month TB treatment regimen is based on attaining good patient adherence. This is also
key in prevention of onset of rifampicin resistance [137, 138]. Directly Observed Treatment (DOT) and the use
of FDC, is strongly promoted by WHO to enhance adherence [41]. Treatment administration approaches
currently being recommended by the WHO are: a) Community- or home-based DOT is recommended over health
facility-based DOT or unsupervised treatment; b) DOT administered by trained lay providers or health-care
workers is recommended over DOT administered by family members or unsupervised treatment; c) Video
observed treatment (VOT) can replace DOT when the video communication technology is available and can be
appropriately organized and operated by health-care providers and patients [47].
In addition to DOT, patients are entitled to effective care and support interventions, which are: a) Health
education and counselling on the disease and treatment adherence; b) A package of treatment adherence
intervention such as social support (e.g. food, financial incentive, and transport fee); psychological support; home
Page 32 of 176
32
visit or digital health communication (e.g. SMS, telephone call); medication monitor. The interventions should be
selected on the basis of the assessment of individual patient's needs, provider's resources and conditions for
implementation; c) Support in selection of a suitable treatment administration option, which include DOT, VOT,
non-daily DOT (e.g. not every dose supervised treatment, weekly or a few times per week supervision), or
unsupervised treatment. All of this is good in theory but represents a significant cost for the TB programs, which
explains why it is often poorly implemented [47].
1.4.3 Drug-resistant tuberculosis
1.4.3.1 Burden of drug-resistant tuberculosis
Development of resistance against any of the anti-tuberculosis drugs arises by bacterial chromosomal
mutations[29]. While these mutations are rare events, a mutation early in multiplication produces a clone of
resistant bacilli that are found more frequently. The mutation rates were thus found to be about 2.6 × 10⁻⁸ for H
and 2.2 × 10⁻¹⁰ for R, while the more useful estimates of the highest proportion of mutants that can be expected
in an unselected bacterial population were found to be 3.5 × 10⁻⁶ for H and 3.3 × 10⁻⁸ for R[139]. A recent
calculation has made these proportions somewhat greater [140]. During the initial phase of treatment, when
bacterial populations are large, treatment is almost always with Z, known to prevent resistance emerging [141],
and sometimes E as well as R and H. The origins of drug resistance appear to be due to 1) irregularity in drug
taking by mechanisms described elsewhere [142]; while attempts to simulate the emergence of resistance by
irregular drug taking have failed [143], resistance does emerge, although rarely, in relapse cultures [144, 145]; 2)
inadequate dosage, particularly of R [146], leading to a slow response and eventual resistance; and 3) the
prescription of single-drug treatment for financial reasons by private practitioners, a common but regrettable
practice in some countries[147]. Resistant strains therefore have their own epidemiology, and are capable of
creating disastrous epidemics, with treatment that is expensive and of low efficacy.
1.4.3.2 Multi and extensive-drug resistant tuberculosis
Multi-drug resistant TB (MDR-TB) is defined as resistance to rifampicin and isoniazid, the two most effective
anti-TB drugs. In 2015, WHO estimated 480 000 new cases of MDR-TB and an additional 100 000 people with
R-resistant TB (RR-TB) who were also newly eligible for MDR-TB treatment. India, China and the Russian
Federation accounted for 45% of the combined total of 580 000 cases. There were about 250 000 (range, 160
000–340 000) deaths from RR-TB in 2015[16]. In May 2016, WHO issued guidance [148] that people with RR-
TB should be treated with second line drugs.
There is evidence on the growing resistance against second line anti-TB drugs and Z. By the end of 2015,
extensively drug-resistant TB (XDR-TB) had been reported by 117 WHO Member States. XDR-TB is defined as
Page 33 of 176
33
MDR-TB plus resistance to at least one fluoroquinolone and a second-line injectable agent. The average
proportion of MDR-TB cases with XDR-TB was 9.5% (95% CI: 7.0–12.1%), similar to estimates for previous
years (9.7% in 2014 and 9.0% in 2013) [16]. The proportion of MDR-TB cases with resistance to any
fluoroquinolone for which testing was done – including ofloxacin, levofloxacin and moxifloxacin – was 21.0%
(95% CI: 8.8–33.3%). A total of 51% (30–70%) of patients with MDR-TB have resistance to a fluoroquinolone
or a second-line injectable agent, or both [16]. In a recent multi-country project assessing the level of resistance
to both Z and fluoroquinolone in five countries – Azerbaijan, Bangladesh, Belarus, Pakistan and South Africa
and coordinated by WHO, substantial variations in levels of resistance were noted among the different settings
(3.1–42.1%) [149]. Resistance to Z was reported to be significantly associated with R resistance (0.5–4.2% among
R-susceptible cases and 36.7–81.3% among R-resistant cases). Resistance ranged from 1.0% to 16.6% for
ofloxacin, from 0.5% to 12.4% for levofloxacin and from 0.9% to 14.6% for moxifloxacin when tested at 0.5
μg/ml. The study recommended that the presence of R resistance, which currently is easily identified because of
the wide availability of new rapid molecular technology, should prompt attention to the possibility of the
simultaneous presence of resistance to Z and, in some settings, the earlier generation fluoroquinolones. Resistance
to the latest generation fluoroquinolones at the clinical breakpoint is still uncommon, a finding that supports
current WHO recommendations to use moxifloxacin or gatifloxacin in the treatment of MDR-TB [149].
1.4.3.3 Treatment of drug-resistant tuberculosis
The currently recommended medicines for RR-TB and MDR-TB treatment are categorized into groups A-D, as
summarized below. Group A. Fluoroquinolones (Levofloxacin, Moxifloxacin, Gatifloxacin); Group B. Second-
line injectable agents (Amikacin, Capreomycin, Kanamycin, Streptomycin); Group C. Other core second-line
agents (Ethionamide / prothionamide, Cycloserine / terizidone, Linezolid, Clofazimine); Group D. Add-on
agents and not part of the core MDR-TB regimen (D1: Z, E, high-dose H; D2: Bedaquiline, Delamanid; D3: p-
aminosalicylic acid, Imipenem–cilastatin, Meropenem, Amoxicillin-clavulanated, (Thioacetazone))[150]. WHO
recommends both shorter and longer MDR-TB regimens based on different circumstances[150]. Most of these
drugs are repurposed or old TB drugs abandoned before due to toxicity..
The longer MDR-TB regimens of 18-24 months apply to both adults and children and covers all forms of RR-
TB, that is those who are H susceptible, MDR-TB, resistant to other medicines from firstline group (poly-
resistant). In patients with RR-TB or MDR-TB, a regimen with at least five effective TB medicines during the
intensive phase is recommended, including Z and four core secondline TB medicines – one chosen from Group
A, one from Group B, and at least two from Group C6 (conditional recommendation, very low certainty in the
evidence). If the minimum number of effective TB medicines cannot be composed as given above, an agent from
Group D2 and other agents from Group D3 may be added to bring the total to five. In patients with RR-TB or
MDR-TB, it is recommended that the regimen be further strengthened with high-dose H and/or E (conditional
recommendation, very low certainty in the evidence). It is recommended that any patient – child or adult – with
Page 34 of 176
34
RR-TB in whom H resistance is absent or unknown be treated with a recommended MDR-TB regimen. It could
either be a shorter MDR-TB regimen, or a longer MDR-TB regimen to which isoniazid is added [150].
A shorter MDR-TB regimen of 9–12 months may be used instead of the longer regimens in adults and children
with RR-TB or MDR-TB who were not previously treated with second-line drugs and in whom resistance to
fluoroquinolones and second-line injectable agents was excluded or is considered highly unlikely. The shorter
MDR-TB treatment regimens are standardized in content and duration and split into two distinct parts. The first
is an intensive phase of four months (extended up to a maximum of six months in case of lack of sputum smear
conversion) and included the following drugs: gatifloxacin (or moxifloxacin), kanamycin, prothionamide,
clofazimine, high-dose H, Z, and E. This is followed by a continuation phase of five months with the following
medicines: gatifloxacin (or moxifloxacin), clofazimine, pyrazinamide and ethambutol (with or without
prothionamide kept in the continuation phase in earlier studies).
Bedaquilline and delamanid were approved by FDA after phase 2 trials, and have received a conditional
recommendation by WHO for use in the treatment of adults with drug-resistant TB in 2013 and 2014 respectively
[151, 152].
Among patients with H mono-resistance or populations with known or suspected high levels of H mono-
resistance, administration of 7RZE or 9RE as therapy in the continuation phase is an alternative to HR to prevent
relapses [47].
Surgery has also been reported to have a role especially among patients with lung cavities and tuberculomas. Its
need is demonstrated in the study from Tbilisi Georgia, that described pulmonary surgery in 137 patients with
half having MDR/XDR TB. The study recommended the revisiting of the need for surgery especially in patients
with extensive pulmonary lesions even those with bacterial cure or patients where bacterial cure is not possible
[153].
1.5 Treatment of TB-HIV co-infection
1.5.1 Anti-retroviral treatment
Since 1987, more than 25 antiretroviral (ARV) drugs in 6 mechanistic classes for treatment of HIV infection have
been approved by Food and Drug Administration (FDA) [154]. These 6 classes include the nucleoside/nucleotide
reverse transcriptase inhibitors (NRTIs), non-nucleoside reverse transcriptase inhibitors (NNRTIs), protease
inhibitors (PIs), a fusion inhibitor (FI), a CCR5 antagonist, and integrase strand transfer inhibitors (INSTIs). In
addition, two drugs, ritonavir (r) and cobicistat (COBI or c), potent CYP3A inhibitors, are used solely as
pharmacokinetic (PK) enhancers (i.e. boosters) to improve the PK profiles of some ARV drugs highly metabolized
by CYP3A (e.g. PIs and the INSTI elvitegravir [EVG])[155]. The two commonly used NNRTIs as part of the
treatment of HIV patients in low-resource settings, that is efavirenz and nevirapine, received FDA approval in
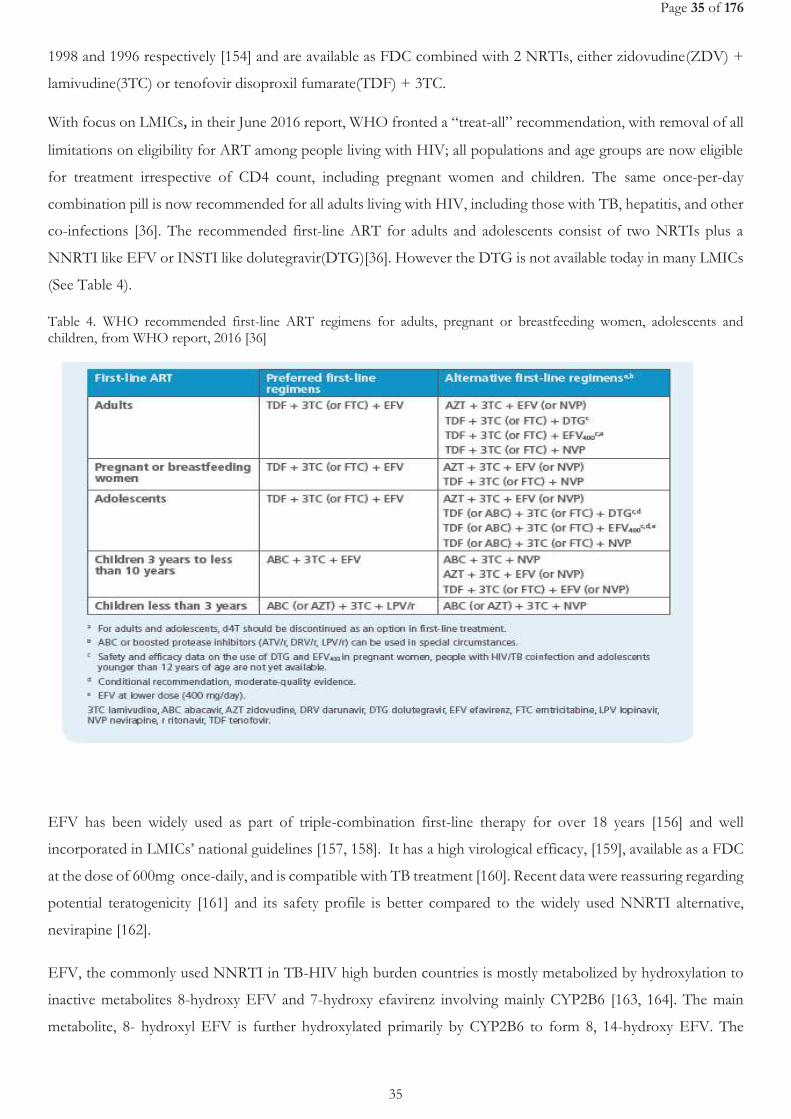
Page 35 of 176
35
1998 and 1996 respectively [154] and are available as FDC combined with 2 NRTIs, either zidovudine(ZDV) +
lamivudine(3TC) or tenofovir disoproxil fumarate(TDF) + 3TC.
With focus on LMICs, in their June 2016 report, WHO fronted a “treat-all” recommendation, with removal of all
limitations on eligibility for ART among people living with HIV; all populations and age groups are now eligible
for treatment irrespective of CD4 count, including pregnant women and children. The same once-per-day
combination pill is now recommended for all adults living with HIV, including those with TB, hepatitis, and other
co-infections [36]. The recommended first-line ART for adults and adolescents consist of two NRTIs plus a
NNRTI like EFV or INSTI like dolutegravir(DTG)[36]. However the DTG is not available today in many LMICs
(See Table 4).
Table 4. WHO recommended first-line ART regimens for adults, pregnant or breastfeeding women, adolescents and children, from WHO report, 2016 [36]
EFV has been widely used as part of triple-combination first-line therapy for over 18 years [156] and well
incorporated in LMICs’ national guidelines [157, 158]. It has a high virological efficacy, [159], available as a FDC
at the dose of 600mg once-daily, and is compatible with TB treatment [160]. Recent data were reassuring regarding
potential teratogenicity [161] and its safety profile is better compared to the widely used NNRTI alternative,
nevirapine [162].
EFV, the commonly used NNRTI in TB-HIV high burden countries is mostly metabolized by hydroxylation to
inactive metabolites 8-hydroxy EFV and 7-hydroxy efavirenz involving mainly CYP2B6 [163, 164]. The main
metabolite, 8- hydroxyl EFV is further hydroxylated primarily by CYP2B6 to form 8, 14-hydroxy EFV. The
Page 36 of 176
36
oxidative metabolites undergo conjugation by UDP-glucuronosyltransferase (UGT) pathway and are excreted in
the urine as glucuronides[165]. There is a wide inter-individual variability in EFV concentrations[166] that is
partially explained by genetic factors as shown by the strong association between CYP2B6 516G>T single
nucleotide polymorphism (SNP) and EFV exposure [167]. The CYP2B6 516G>T is a common polymorphism
that has been consistently associated with reduced enzyme activity, higher EFV exposure and increased toxicity
[163, 167, 168].
1.5.2 Drug interaction between anti-tuberculosis and antiretroviral therapy.
Co-administration of both ART and ATT bear complex interactions especially with R which is a very potent
inducer of many drug-metabolizing enzymes [169]. Specifically, EFV use among patients who are concurrently on
R-based ATT bears three concerns; 1) drug interactions resulting in reduced plasma concentrations of EFV; 2)
Overlapping toxicities of ATT and ART e.g DILI and central nervous system (CNS) events, necessitating
discontinuation of therapy and increasing the risk of non-adherence; 3) Immunopathological reactions, termed
"the immune reconstitution inflammatory syndrome," that can occur when ART is initiated in patients with TB
[170].
1.5.2.1 Mechanism of interaction between anti-tuberculosis s and antiretroviral drugs
Interactions between R and PIs [171-174], NNRTIs [173], INSTIs [174], and CCR5 receptor antagonists [171] are
well documented at least for the newer drugs from clinical pharmacokinetic studies conducted in healthy
volunteers. Despite these interactions and their potential clinical consequences, R-sparing regimens were
ineffective in HIV-co-infected patients [171].
Rifamycins induce liver enzymes, and of the three rifamycins (rifampicin, rifabutin and rifapentine) R is the most
potent inducer of the hepatic cytochrome P450 3A (CYP3A) system and reduces serum concentrations of protease
inhibitors such as indinavir, nelfinavir, saquinavir, ritonavir, amprenavir, atazanavir and fosamprenavir. Rifabutin
is the least potent inducer of CYP3A and rifapentine falls in between R and rifabutin in its capacity to induce
CYP3A [46].
R activates hepatotocyte pregnane X receptors, leading to induction of cytochromes. R also induces uridine
diphosphate-glucuronosyl-transferases and P-glycoprotein transport, which are involved in the metabolism and
transport of other drugs [175-177]. R interacts with numerous drugs metabolized by these and other hepatic
enzymes, including warfarin, prednisone, digitoxin, quinidine, ketoconazole, itraconazole, propranolol, clofibrate,
sulfonylureas, phenytoin, HIV protease inhibitors, and HIV NNRTIs [178].Through induction of isoenzyme
CYP2B6, R slightly enhances EFV drug metabolism and may lead to sub-therapeutic EFV plasma concentration
[179].
Page 37 of 176
37
The other cornerstone anti-TB drug, H, is metabolized mainly through N-acetyltransferase type 2 (NAT2) and
was demonstrated in vitro to have an inhibitory effect on several CYP450 enzymes (CYP2C19, CYP1A2, CYP2A6,
CYP2C19, and CYP3A4) [180]. H is cleared mostly by the liver, primarily by acetylation by NAT-2. Acetyl-
isoniazid is metabolized mainly to mono-acetyl hydrazine (MAH) and to the nontoxic diacetyl hydrazine, as well
as other minor metabolites [79]. Inter-individual variation in plasma elimination half-life (t1/2), independent of
drug dose and concentration, is considerable, with individuals with prolonged t1/2 having extended exposure to
the drug. Genetic polymorphisms of NAT-2 correlate with fast, slow, and intermediate acetylation phenotypes
[79, 82, 181]. Microsomal enzymes (e.g., CYP 2E1) further metabolize H intermediates through phase 1 pathways
[82]. From recent studies, there is some growing evidence that the inducing effect of combined R+H is less potent
than R alone [182, 183]. Such effect could be different according to patient CYP2B6 516 G>T genetic
polymorphism.
Co-administration of EFV with R revealed EFV Area Under the Concentration vs time curve (AUC), maximum
concentration (Cmax) and minimum concentration (Cmin) reduced by 26, 20 and 32% among healthy volunteers, a
finding that led to the FDA recommendation of an increase in efavirenz dosing to 800 mg once a day when
combined with TB drugs [179, 184]. Reduction in mid-dose EFV plasma concentrations to below 1000 ng/mL
during co-administration with R, have been associated with increased risk of virological failure in HIV-infected
patients, while concentrations above 4000 ng/mL have been associated with risk of central nervous system (CNS)
side effects [166, 185]. It is important to note that as already mentioned, genetic polymorphism of CYP2B6
influence greatly the EFV plasma concentrations even without co-administration with ATT. Other factors have
also been reported to influence EFV concentrations although to a lesser extent: gender, body weight, having
hepatitis B surface antigen, and baseline white blood cell counts [169, 182, 186-188].
R is also known to significantly lower plasma concentrations of DTG, mainly metabolized by UGT, hence may
necessitate an increase in DTG dose to 50mg twice-daily. To date, there are very few studies and limited clinical
experience with this combination, particularly in TB co-infected patients [189, 190]. More evidence on DTG
interaction with R is expected from the ongoing studies [191, 192]. In contrast, R does not affect concentrations
of TDF or 3TC, mainly eliminated unchanged through the kidney.
1.5.3 TB-HIV coinfection treatment recommendation
Concomitant use of ART and ATT improves survival rates in HIV-infected individuals [171]. Delaying initiation
of ART until ATT is completed significantly increases mortality across the spectrum of immunodeficiency. Clinical
trials have shown that early initiation of ART in TB-HIV co- patients reduces mortality in patients with very
advanced HIV infection [193, 194]. The WHO currently recommend the use of the same EFV-based ART, with
TDF, and either lamivudine (3TC) or emtricitabine (FTC) for treatment of TB-HIV coinfection (TDF + 3TC (or
FTC) + EFV). Further recommendations are: 1) ART should be started in all TB patients living with HIV
regardless of their CD4 cell count; 2) TB treatment should be initiated first, followed by ART as soon as possible
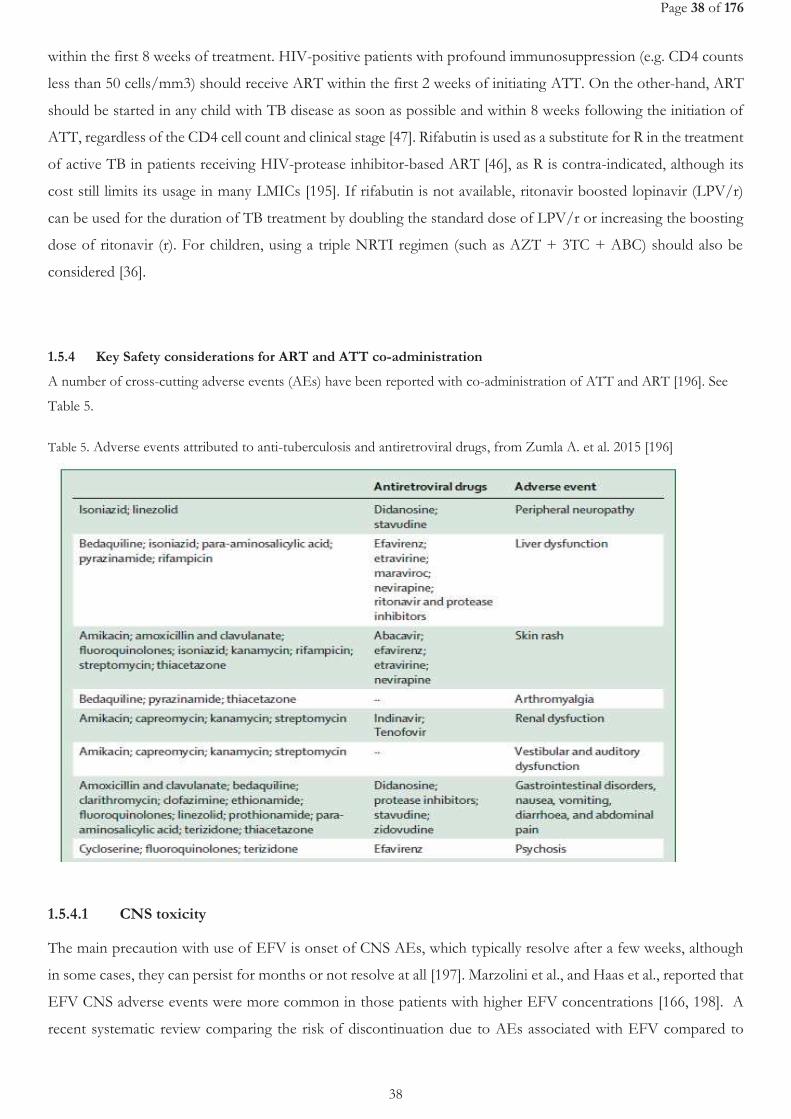
Page 38 of 176
38
within the first 8 weeks of treatment. HIV-positive patients with profound immunosuppression (e.g. CD4 counts
less than 50 cells/mm3) should receive ART within the first 2 weeks of initiating ATT. On the other-hand, ART
should be started in any child with TB disease as soon as possible and within 8 weeks following the initiation of
ATT, regardless of the CD4 cell count and clinical stage [47]. Rifabutin is used as a substitute for R in the treatment
of active TB in patients receiving HIV-protease inhibitor-based ART [46], as R is contra-indicated, although its
cost still limits its usage in many LMICs [195]. If rifabutin is not available, ritonavir boosted lopinavir (LPV/r)
can be used for the duration of TB treatment by doubling the standard dose of LPV/r or increasing the boosting
dose of ritonavir (r). For children, using a triple NRTI regimen (such as AZT + 3TC + ABC) should also be
considered [36].
1.5.4 Key Safety considerations for ART and ATT co-administration
A number of cross-cutting adverse events (AEs) have been reported with co-administration of ATT and ART [196]. See
Table 5.
Table 5. Adverse events attributed to anti-tuberculosis and antiretroviral drugs, from Zumla A. et al. 2015 [196]
1.5.4.1 CNS toxicity
The main precaution with use of EFV is onset of CNS AEs, which typically resolve after a few weeks, although
in some cases, they can persist for months or not resolve at all [197]. Marzolini et al., and Haas et al., reported that
EFV CNS adverse events were more common in those patients with higher EFV concentrations [166, 198]. A
recent systematic review comparing the risk of discontinuation due to AEs associated with EFV compared to
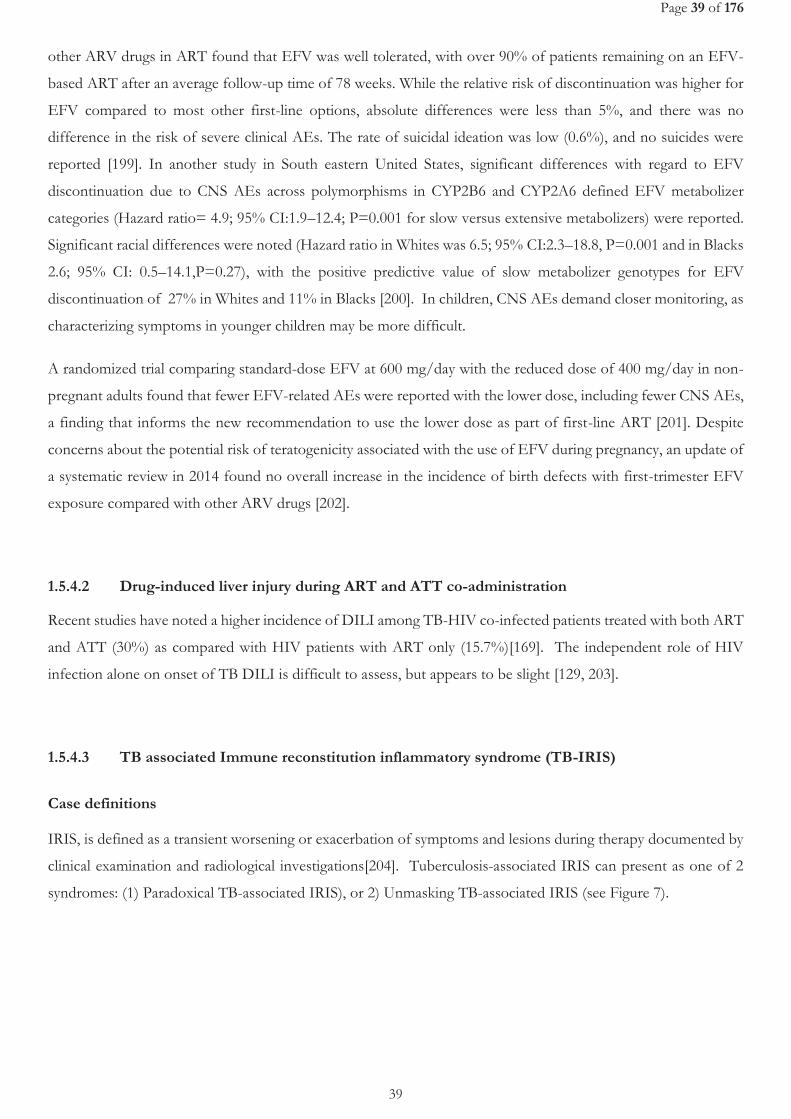
Page 39 of 176
39
other ARV drugs in ART found that EFV was well tolerated, with over 90% of patients remaining on an EFV-
based ART after an average follow-up time of 78 weeks. While the relative risk of discontinuation was higher for
EFV compared to most other first-line options, absolute differences were less than 5%, and there was no
difference in the risk of severe clinical AEs. The rate of suicidal ideation was low (0.6%), and no suicides were
reported [199]. In another study in South eastern United States, significant differences with regard to EFV
discontinuation due to CNS AEs across polymorphisms in CYP2B6 and CYP2A6 defined EFV metabolizer
categories (Hazard ratio= 4.9; 95% CI:1.9–12.4; P=0.001 for slow versus extensive metabolizers) were reported.
Significant racial differences were noted (Hazard ratio in Whites was 6.5; 95% CI:2.3–18.8, P=0.001 and in Blacks
2.6; 95% CI: 0.5–14.1,P=0.27), with the positive predictive value of slow metabolizer genotypes for EFV
discontinuation of 27% in Whites and 11% in Blacks [200]. In children, CNS AEs demand closer monitoring, as
characterizing symptoms in younger children may be more difficult.
A randomized trial comparing standard-dose EFV at 600 mg/day with the reduced dose of 400 mg/day in non-
pregnant adults found that fewer EFV-related AEs were reported with the lower dose, including fewer CNS AEs,
a finding that informs the new recommendation to use the lower dose as part of first-line ART [201]. Despite
concerns about the potential risk of teratogenicity associated with the use of EFV during pregnancy, an update of
a systematic review in 2014 found no overall increase in the incidence of birth defects with first-trimester EFV
exposure compared with other ARV drugs [202].
1.5.4.2 Drug-induced liver injury during ART and ATT co-administration
Recent studies have noted a higher incidence of DILI among TB-HIV co-infected patients treated with both ART
and ATT (30%) as compared with HIV patients with ART only (15.7%)[169]. The independent role of HIV
infection alone on onset of TB DILI is difficult to assess, but appears to be slight [129, 203].
1.5.4.3 TB associated Immune reconstitution inflammatory syndrome (TB-IRIS)
Case definitions
IRIS, is defined as a transient worsening or exacerbation of symptoms and lesions during therapy documented by
clinical examination and radiological investigations[204]. Tuberculosis-associated IRIS can present as one of 2
syndromes: (1) Paradoxical TB-associated IRIS), or 2) Unmasking TB-associated IRIS (see Figure 7).
Page 40 of 176
40
Figure 7. Schematic representation showing the different forms of tuberculosis-associated IRIS and ART-associated
tuberculosis, from Meintjes G., et al.2008 [205]
Paradoxical worsening of TB after initiation of ATT has been reported in about 2–23% [206, 207] of treated TB
patients without HIV infection; it occurs more frequently in patients with extra-pulmonary and disseminated TB.
In HIV-seronegative patients with paradoxical reactions, there was a lower baseline absolute lymphocyte count,
and a greater increase in lymphocytes during a paradoxical response [207]. The incidence of TB IRIS among HIV-
positive patients with active TB treated with ART varies between 11% and 45% [204]. In patients taking ART,
IRIS against TB antigens probably account for one third of all HIV-related IRIS events [208], particularly in
developing countries where HIV and TB co-infection is very common. The data for Africa was limited by the lack
of consensus on the case definition for TB-IRIS that could be used in LMICs [204]. In this regard, a group of
scientists met and reviewed the definition of different forms of TB-IRIS with an intent to ensure consistence and
standardization in how researchers report [205]. The following definitions were agreed upon for use in LMICs
and perhaps internationally.
The proposed case definition for paradoxical TB-IRIS has 3 components[205]:
(A) Antecedent requirements: Both of the two following requirements must be met; 1) Diagnosis of TB should
have been made before starting ART and this should fulfil WHO criteria for diagnosis of smear-positive PTB,
smear-negative PTB, or extra-pulmonary TB; 2) the patient’s condition should have stabilized or improved on
appropriate ATT before ART initiation eg, cessation of night sweats, fevers, cough, weight loss.
(B) Clinical criteria: The onset of TB-IRIS manifestations should be within 3 months of ART initiation, re-
initiation, or regimen change because of treatment failure. Of the following, at least one major criterion or two
minor clinical criteria are required:
Major criteria: 1) New or enlarging lymph nodes, cold abscesses, or other focal tissue involvement e.g., tuberculous
arthritis; 2) New or worsening radiological features of TB; 3)New or worsening CNS TB; 4) New or worsening
serositis.
Minor criteria: 1) New or worsening constitutional symptoms such as fever, night sweats, or weight loss; 2) New or
worsening respiratory symptoms such as cough, dyspnoea, or stridor; 3) New or worsening abdominal pain
accompanied by peritonitis, hepatomegaly, splenomegaly, or abdominal adenopathy
Page 41 of 176
41
(C) Alternative explanations for clinical deterioration must be excluded if possible, that is: 1) Failure of tuberculosis
treatment because of tuberculosis drug resistance; 2) Poor adherence to tuberculosis treatment; 3) Another
opportunistic infection or neoplasm; 4) Drug toxicity or reaction.
The following provisional case definitions for unmasking tuberculosis-associated IRIS has been suggested [205]:
Patient is not receiving ATT when ART is initiated and then presents with active TB within 3 months of starting
ART AND one of the following criteria must be met: 1)Heightened intensity of clinical manifestations,
particularly if there is evidence of a marked inflammatory component to the presentation. Examples include TB
lymphadenitis or TB abscesses with prominent acute inflammatory features, presentation with PTB that is
complicated by respiratory failure due to adult respiratory distress syndrome, and those who present with a marked
systemic inflammatory syndrome related to TB; 2)Once established on ATT, a clinical course that is complicated
by a paradoxical reaction.
Pathogenesis of TB IRIS
The pathogenesis of TB-IRIS in generally poorly understood. It is generally thought to be the restoration of the
immune responses to antigens (viable or not) producing exuberant inflammatory reactions. Given the fact that
shortly after the initiation of highly active ART (HAART) there is a rapid recirculation of memory cells[209], these
memory cells may play a role in the development of IRIS. Such reactions do not require the presence of viable
organisms because they can occur after successful TB treatment. AFB identified in IRIS events are often not
found to be viable. In certain TB-IRIS patients, rapid restoration of the cutaneous tuberculin reaction has been
observed [210]. The immune-pathogenic mechanisms causing IRIS seem to be determined by the pathogen. For
example, mycobacterial IRIS is associated with delayed-type hypersensitivity responses to mycobacterial antigens,
whereas there is evidence of a CD8 T-cell response in herpes virus IRIS. Furthermore, the association of different
cytokine gene polymorphisms with mycobacterial or herpes virus IRIS provides evidence for differences in
pathogenic mechanisms as well as in genetic susceptibility to IRIS [211].
Risk factors for TB-IRIS include: starting ART within 6 weeks of starting TB treatment; extra-pulmonary or
disseminated disease; a low CD4 lymphocyte count and a high viral load at the start of ART; a good immunological
and virological response during HAART; black ethnic origin, and purified protein derivative conversion [204,
205].
1.6 Strategies for TB control
Currently, there are two key global strategies that constitute clear TB control strategies: END-TB Strategy; and
Sustainable Development Goals (SDGs). The End-TB strategy was launched in 2015 to replace the STOP-TB
strategy, with a goal of ensuring a world free of TB, Zero deaths, disease and suffering due to TB and a complete
end to the global TB epidemic [212]. This strategy is synonymous with the third goal of the United Nations
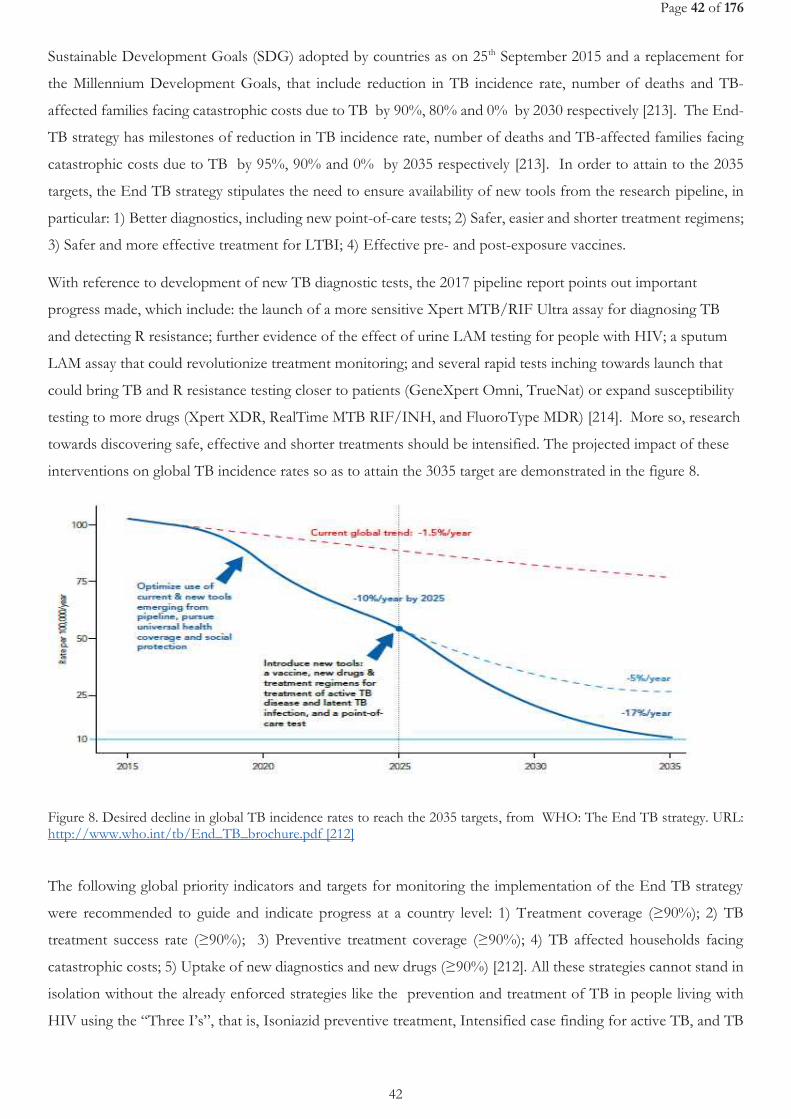
Page 42 of 176
42
Sustainable Development Goals (SDG) adopted by countries as on 25th September 2015 and a replacement for
the Millennium Development Goals, that include reduction in TB incidence rate, number of deaths and TB-
affected families facing catastrophic costs due to TB by 90%, 80% and 0% by 2030 respectively [213]. The End-
TB strategy has milestones of reduction in TB incidence rate, number of deaths and TB-affected families facing
catastrophic costs due to TB by 95%, 90% and 0% by 2035 respectively [213]. In order to attain to the 2035
targets, the End TB strategy stipulates the need to ensure availability of new tools from the research pipeline, in
particular: 1) Better diagnostics, including new point-of-care tests; 2) Safer, easier and shorter treatment regimens;
3) Safer and more effective treatment for LTBI; 4) Effective pre- and post-exposure vaccines.
With reference to development of new TB diagnostic tests, the 2017 pipeline report points out important
progress made, which include: the launch of a more sensitive Xpert MTB/RIF Ultra assay for diagnosing TB
and detecting R resistance; further evidence of the effect of urine LAM testing for people with HIV; a sputum
LAM assay that could revolutionize treatment monitoring; and several rapid tests inching towards launch that
could bring TB and R resistance testing closer to patients (GeneXpert Omni, TrueNat) or expand susceptibility
testing to more drugs (Xpert XDR, RealTime MTB RIF/INH, and FluoroType MDR) [214]. More so, research
towards discovering safe, effective and shorter treatments should be intensified. The projected impact of these
interventions on global TB incidence rates so as to attain the 3035 target are demonstrated in the figure 8.
Figure 8. Desired decline in global TB incidence rates to reach the 2035 targets, from WHO: The End TB strategy. URL: http://www.who.int/tb/End_TB_brochure.pdf [212]
The following global priority indicators and targets for monitoring the implementation of the End TB strategy
were recommended to guide and indicate progress at a country level: 1) Treatment coverage (≥90%); 2) TB
treatment success rate (≥90%); 3) Preventive treatment coverage (≥90%); 4) TB affected households facing
catastrophic costs; 5) Uptake of new diagnostics and new drugs (≥90%) [212]. All these strategies cannot stand in
isolation without the already enforced strategies like the prevention and treatment of TB in people living with
HIV using the “Three I’s”, that is, Isoniazid preventive treatment, Intensified case finding for active TB, and TB
Page 43 of 176
43
Infection control, which are key public health strategies to decrease the impact of TB on people living with HIV
[215]. Also, to be successful in achieving TB elimination, there should be a strong funding commitment by funders
and governments for further investment in TB prevention, diagnosis, and treatments that are safe and shorter
[216].
In a nutshell, it is worth noting that the current TB elimination strategies, are hinged on the historical approaches
that are based on understanding the key drivers of the TB epidemiology so as to achieve TB control. The 4 main
TB epidemiological and control scenarios were originally described by Karel Styblo (1921–1998) with his famous
model [217, 218] but recently simplified by Rosella Centis [219]. These scenarios are discussed below: 1) In the
absence of interventions, an infectious (e.g., a sputum smear-positive) patient infects 10 persons a year for 2 years
before healing spontaneously or dying. So, given a 10% lifetime probability of acquiring disease given the infection
and the 50% probability of becoming sputum smear-positive, a case generates another case, contributing to
keeping the epidemic level stable; This forms the basis why TB services (that is, diagnostic, preventive and curative
services) should be accessible to all people irrespective of their socio-economic status, something that has been
described as an ethical and human right approach that should guide the pursuit of END-TB targets[25] 2) With
rapid/early diagnosis and effective treatment, only five individuals are infected and, as a result, only 0.25 cases are
generated by the original infectious case. This would mean that we need four sputum smear-positive cases to
generate a new infectious one. This shows that an adequate implementation of the directly observed treatment
short course strategy, could have a substantial impact on the epidemic in the absence of factors working in an
opposite direction, like HIV or any other factor increasing the probability of acquiring TB disease given infection
(e.g., diabetes, stress as observed in war areas or in migrants/refugees, etc.). This scenario, also strengthens the
case for more research towards developing more sensitive POC diagnostics, shorter and effective TB treatments
but also the need to not only emphasize coverage but also quality of TB services with implementation of a
comprehensive care package to TB patients as recently recommended by WHO [47]; 3) If irregularities or
interruptions occur during treatment, it is sufficient to prevent death and prolong the infectious period, so that
one case can produce up to 1.5 new infectious cases, which in turn will gradually result in a more severe drug
resistance pattern. This scenario could risk a global drug-susceptible TB epidemic replacement with drug-resistant
TB, a phenomenon that has been recently reported [220]. Ensuring reliable TB drug supplies by governments is a
key action needed for TB control; 4) Under the hypothetical scenario of a population with TB co-infected by HIV
not undergoing ART, one infectious case generates another two cases, again contributing to reducing the speed
of decline in TB incidence. This scenario emphasizes that in addition to pursuing the End-TB targets, there should
be a concurrent pursuit of the 90-90-90 targets defined by the Joint United Nations Programme on HIV/AIDS
(UNAIDS) which include: 90% of persons living with HIV must be diagnosed, 90% of those diagnosed should
be on sustained therapy and 90% of those on therapy should have an undetectable viral load [221]. These HIV
control targets continue to be monitored by employing the cascade of care analysis to identify and address major
gaps in the continuum and quality of HIV care, from diagnosis to successful virological suppression after
antiretroviral therapy [26, 222]. Actually, a recent global HIV care cascade showed that a considerable number of
HIV positive patients are still not diagnosed (54%), not treated though diagnosed (41%), and with no viral load
Page 44 of 176
44
(VL) suppression despite being on ART (32%) between 2014/2015 [26]. Meaning that this could still affect TB
control. Inadequate TB control has already been highlighted as a barrier to achievement of the 90–90–90 targets
in children and so calls for specific attention to TB care in HIV-infected children [223].

Page 45 of 176
45
CHAPTER 2 JUSTIFICATION, OBJECTIVES AND METHODS

Page 46 of 176
46
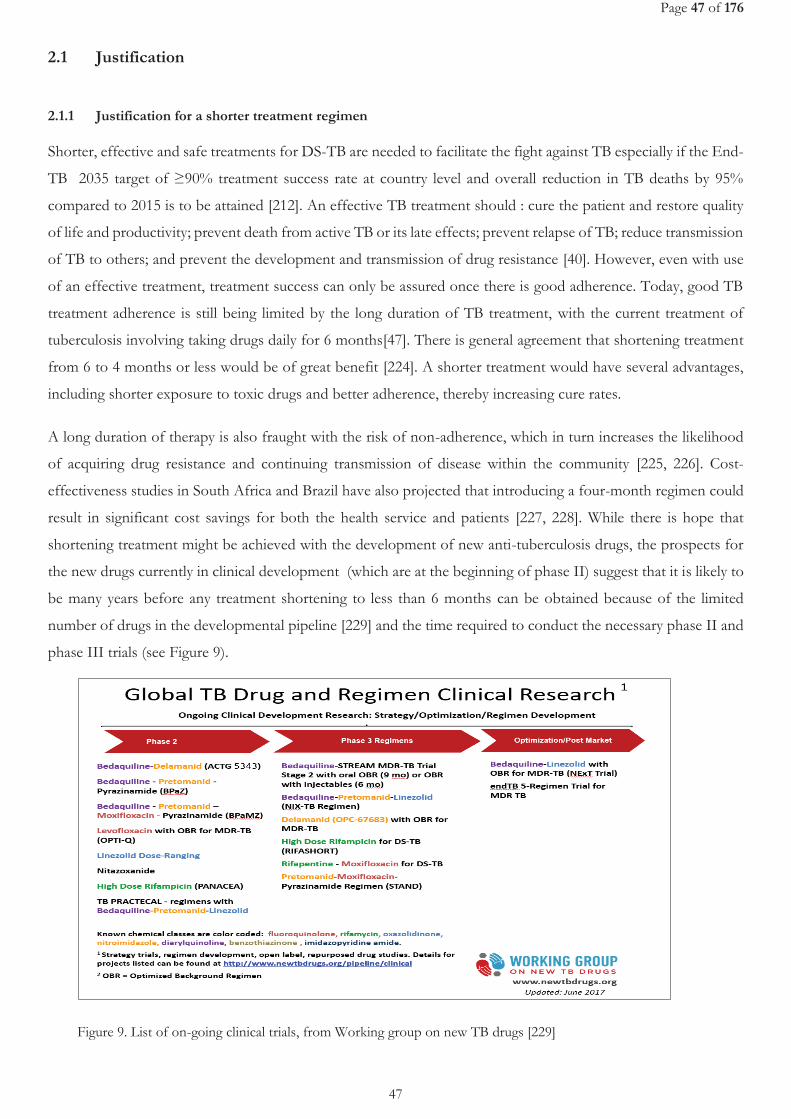
Page 47 of 176
47
2.1 Justification
2.1.1 Justification for a shorter treatment regimen
Shorter, effective and safe treatments for DS-TB are needed to facilitate the fight against TB especially if the End-
TB 2035 target of ≥90% treatment success rate at country level and overall reduction in TB deaths by 95%
compared to 2015 is to be attained [212]. An effective TB treatment should : cure the patient and restore quality
of life and productivity; prevent death from active TB or its late effects; prevent relapse of TB; reduce transmission
of TB to others; and prevent the development and transmission of drug resistance [40]. However, even with use
of an effective treatment, treatment success can only be assured once there is good adherence. Today, good TB
treatment adherence is still being limited by the long duration of TB treatment, with the current treatment of
tuberculosis involving taking drugs daily for 6 months[47]. There is general agreement that shortening treatment
from 6 to 4 months or less would be of great benefit [224]. A shorter treatment would have several advantages,
including shorter exposure to toxic drugs and better adherence, thereby increasing cure rates.
A long duration of therapy is also fraught with the risk of non-adherence, which in turn increases the likelihood
of acquiring drug resistance and continuing transmission of disease within the community [225, 226]. Cost-
effectiveness studies in South Africa and Brazil have also projected that introducing a four-month regimen could
result in significant cost savings for both the health service and patients [227, 228]. While there is hope that
shortening treatment might be achieved with the development of new anti-tuberculosis drugs, the prospects for
the new drugs currently in clinical development (which are at the beginning of phase II) suggest that it is likely to
be many years before any treatment shortening to less than 6 months can be obtained because of the limited
number of drugs in the developmental pipeline [229] and the time required to conduct the necessary phase II and
phase III trials (see Figure 9).
Figure 9. List of on-going clinical trials, from Working group on new TB drugs [229]
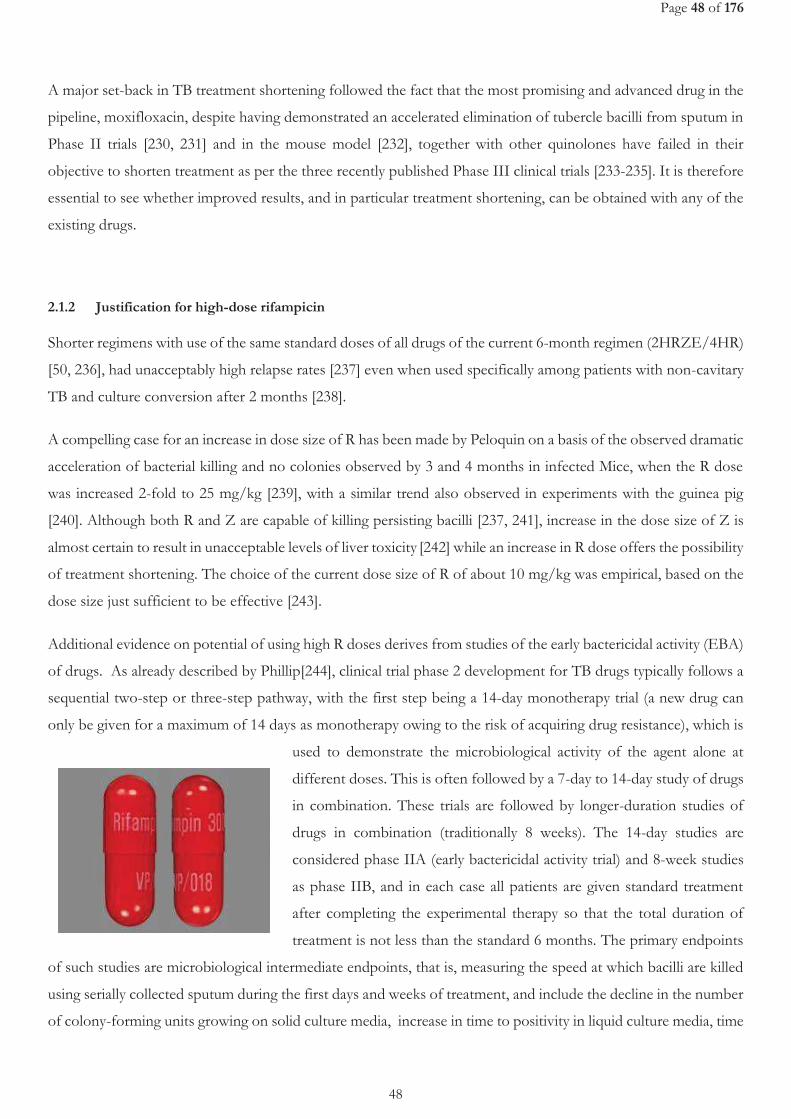
Page 48 of 176
48
A major set-back in TB treatment shortening followed the fact that the most promising and advanced drug in the
pipeline, moxifloxacin, despite having demonstrated an accelerated elimination of tubercle bacilli from sputum in
Phase II trials [230, 231] and in the mouse model [232], together with other quinolones have failed in their
objective to shorten treatment as per the three recently published Phase III clinical trials [233-235]. It is therefore
essential to see whether improved results, and in particular treatment shortening, can be obtained with any of the
existing drugs.
2.1.2 Justification for high-dose rifampicin
Shorter regimens with use of the same standard doses of all drugs of the current 6-month regimen (2HRZE/4HR)
[50, 236], had unacceptably high relapse rates [237] even when used specifically among patients with non-cavitary
TB and culture conversion after 2 months [238].
A compelling case for an increase in dose size of R has been made by Peloquin on a basis of the observed dramatic
acceleration of bacterial killing and no colonies observed by 3 and 4 months in infected Mice, when the R dose
was increased 2-fold to 25 mg/kg [239], with a similar trend also observed in experiments with the guinea pig
[240]. Although both R and Z are capable of killing persisting bacilli [237, 241], increase in the dose size of Z is
almost certain to result in unacceptable levels of liver toxicity [242] while an increase in R dose offers the possibility
of treatment shortening. The choice of the current dose size of R of about 10 mg/kg was empirical, based on the
dose size just sufficient to be effective [243].
Additional evidence on potential of using high R doses derives from studies of the early bactericidal activity (EBA)
of drugs. As already described by Phillip[244], clinical trial phase 2 development for TB drugs typically follows a
sequential two-step or three-step pathway, with the first step being a 14-day monotherapy trial (a new drug can
only be given for a maximum of 14 days as monotherapy owing to the risk of acquiring drug resistance), which is
used to demonstrate the microbiological activity of the agent alone at
different doses. This is often followed by a 7-day to 14-day study of drugs
in combination. These trials are followed by longer-duration studies of
drugs in combination (traditionally 8 weeks). The 14-day studies are
considered phase IIA (early bactericidal activity trial) and 8-week studies
as phase IIB, and in each case all patients are given standard treatment
after completing the experimental therapy so that the total duration of
treatment is not less than the standard 6 months. The primary endpoints
of such studies are microbiological intermediate endpoints, that is, measuring the speed at which bacilli are killed
using serially collected sputum during the first days and weeks of treatment, and include the decline in the number
of colony-forming units growing on solid culture media, increase in time to positivity in liquid culture media, time
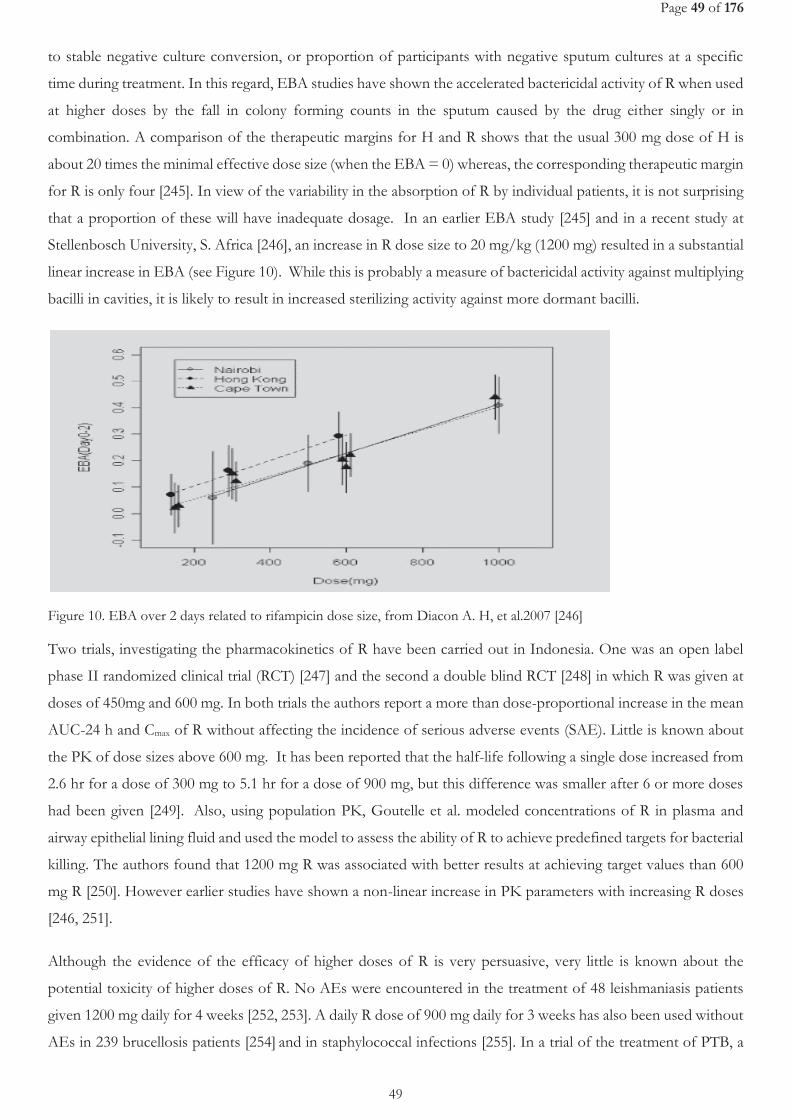
Page 49 of 176
49
to stable negative culture conversion, or proportion of participants with negative sputum cultures at a specific
time during treatment. In this regard, EBA studies have shown the accelerated bactericidal activity of R when used
at higher doses by the fall in colony forming counts in the sputum caused by the drug either singly or in
combination. A comparison of the therapeutic margins for H and R shows that the usual 300 mg dose of H is
about 20 times the minimal effective dose size (when the EBA = 0) whereas, the corresponding therapeutic margin
for R is only four [245]. In view of the variability in the absorption of R by individual patients, it is not surprising
that a proportion of these will have inadequate dosage. In an earlier EBA study [245] and in a recent study at
Stellenbosch University, S. Africa [246], an increase in R dose size to 20 mg/kg (1200 mg) resulted in a substantial
linear increase in EBA (see Figure 10). While this is probably a measure of bactericidal activity against multiplying
bacilli in cavities, it is likely to result in increased sterilizing activity against more dormant bacilli.
Figure 10. EBA over 2 days related to rifampicin dose size, from Diacon A. H, et al.2007 [246]
Two trials, investigating the pharmacokinetics of R have been carried out in Indonesia. One was an open label
phase II randomized clinical trial (RCT) [247] and the second a double blind RCT [248] in which R was given at
doses of 450mg and 600 mg. In both trials the authors report a more than dose-proportional increase in the mean
AUC-24 h and Cmax of R without affecting the incidence of serious adverse events (SAE). Little is known about
the PK of dose sizes above 600 mg. It has been reported that the half-life following a single dose increased from
2.6 hr for a dose of 300 mg to 5.1 hr for a dose of 900 mg, but this difference was smaller after 6 or more doses
had been given [249]. Also, using population PK, Goutelle et al. modeled concentrations of R in plasma and
airway epithelial lining fluid and used the model to assess the ability of R to achieve predefined targets for bacterial
killing. The authors found that 1200 mg R was associated with better results at achieving target values than 600
mg R [250]. However earlier studies have shown a non-linear increase in PK parameters with increasing R doses
[246, 251].
Although the evidence of the efficacy of higher doses of R is very persuasive, very little is known about the
potential toxicity of higher doses of R. No AEs were encountered in the treatment of 48 leishmaniasis patients
given 1200 mg daily for 4 weeks [252, 253]. A daily R dose of 900 mg daily for 3 weeks has also been used without
AEs in 239 brucellosis patients [254] and in staphylococcal infections [255]. In a trial of the treatment of PTB, a
Page 50 of 176
50
R dose of 1200 mg was given daily or intermittently to 91 patients and no SAEs were reported [256]. A R dose as
high as 1800 mg was also given, in a PK study, but intermittently [257] with no SAE reported. Another study on
the potential toxicity of increased size doses of another rifamycin, rifapentine, has been carried out within a CDC
study [258] with 150 patients. Treatment was discontinued in 6%, 4% and 6% in the 600, 900 and 1200 mg
treatment arms respectively. Only one discontinuation, in the 1200mg arm, was due to an adverse event (AE)
possibly associated with the study therapy.
In summary SAEs due to R appear to be sporadic and not dose related. Nevertheless the data are limited and the
possibility of dose related AEs cannot be excluded at this time and merits further systematic investigation. More
so, there is no data on the effect of high dose R on EFV during co-administration among TB-HIV confected
patients.
As already depicted, in the failure of phase III fluoroquinolone trials [233-235], month-2 culture conversion is not
a good surrogate marker and its use within high R dose trials need to be evaluated.
We hypothesize that optimization of the current treatment regimen especially with use of high-dose R, might
result in a shorter TB treatment duration (3-4 months). An exploration of safety of R use at higher dose sizes and
its impact on PK profile of EFV, and resultant impact of ART efficacy among either HIV negative or HIV/TB
co-infected patients within the global TB and HIV high-burden countries, offers the prospect of a substantial
improvement in TB control efforts by shortening of the treatment period. This study also reports results from
an exploration for potential surrogate markers for TB chemotherapy efficacy.
2.2 Objectives
2.2.1 General objective
To establish the safety and efficacy of high-dose R, and also its interaction and impact on ART efficacy when co-
administered with EFV among TB patients with or without HIV in TB/HIV high-burden settings.
2.2.2 Specific objectives
1) To assess the safety of using high-dose R in HIV negative pulmonary tuberculosis (PTB) patients.
2) To describe the pharmacokinetics of EFV during co-administration with ATT in high HIV and TB burden
countries.
3) To assess the safety of high-dose R and EFV during co-administration among HIV-positive TB patients
4) To determine the effect of high-dose R on the EFV plasma concentration and effectiveness in HIV/TB
co-infected patients.
5) To establish the predictors of week-8 culture non-conversion and the effect of culture media on early
treatment efficacy estimation in TB chemotherapeutic trials.
Page 51 of 176
51
2.3 Materials and Methods
2.3.1 Site and population
2.3.1.1 Mbarara
The studies were implemented in Mbarara (Uganda), at the Epicentre Mbarara Research Centre, with Mbarara
Regional Referral Hospital (MRRH) and surrounding health facilities as the main sources of TB patients.
Uganda had an estimated population of 39 million people by end of 2015. Uganda is still among the 30 TB-HIV
high-burden countries globally [3]. However, the country has recorded a twist in the above statistics following
the recent country-wide TB survey by ministry of health, whose results were availed in August 2017[259] and with
findings that may influence its position in the global rankings of high-burden countries. The survey reported an
overall TB prevalence of 253 per 100,000 people (159 per 100,000 in 2015) and TB incidence of 234 per 100,000
people (161 per 100,000 in 2015). The HIV prevalence among TB patients was 27%. From the same survey,
prevalence of TB among men is 4 times higher than in women (734 versus 178 per 100,000), and the burden of
TB highest among people aged 35-44, whereas age group 15-24 has the highest missed cases. The prevalence of
TB was highest in urban areas than rural (504 versus 370 per 100,000) [259]. Based on 2015 statistics, the country
had an overall incidence of MDR/RR-TB of 4.9 (2.6-7.2) per 100 000 population. MDR/RR-TB was detected in
1.6% (0.78-2.4) versus 12% (5.9-18) of new cases and previously treated cases respectively. No XDR-TB case was
notified by 2015. Treatment success rate for all forms of TB is about 75%. The country implemented the 6-month
TB treatment in 2014. The National TB budget is mainly funded by international donors (78%), with a 19%
funding gap [16].
Mbarara town, in Mbarara district is the largest urban center and main business capital of Western Uganda, a
region commonly referred to as "the land of milk and honey", given its historical and present legacy as a cattle-keeping
area, although its biggest population also depend on subsistence farming. In the 2014 Census, Mbarara district
had a population of 472,629, of which 195,158 stay in urban setting[260]. On 7th August 2015 it was granted city
status. Built on an elevated basin that forms part of the African Rift Valley and nestled amongst hills and shallow
valleys, Mbarara was almost destroyed in the internal Ugandan conflicts of 1972, 1979 and again in 1985 before
emerging into the vibrant and bustling town. It is position as a gateway to the Great Lakes Region. Mbarara is 180
miles south-west of Kampala.
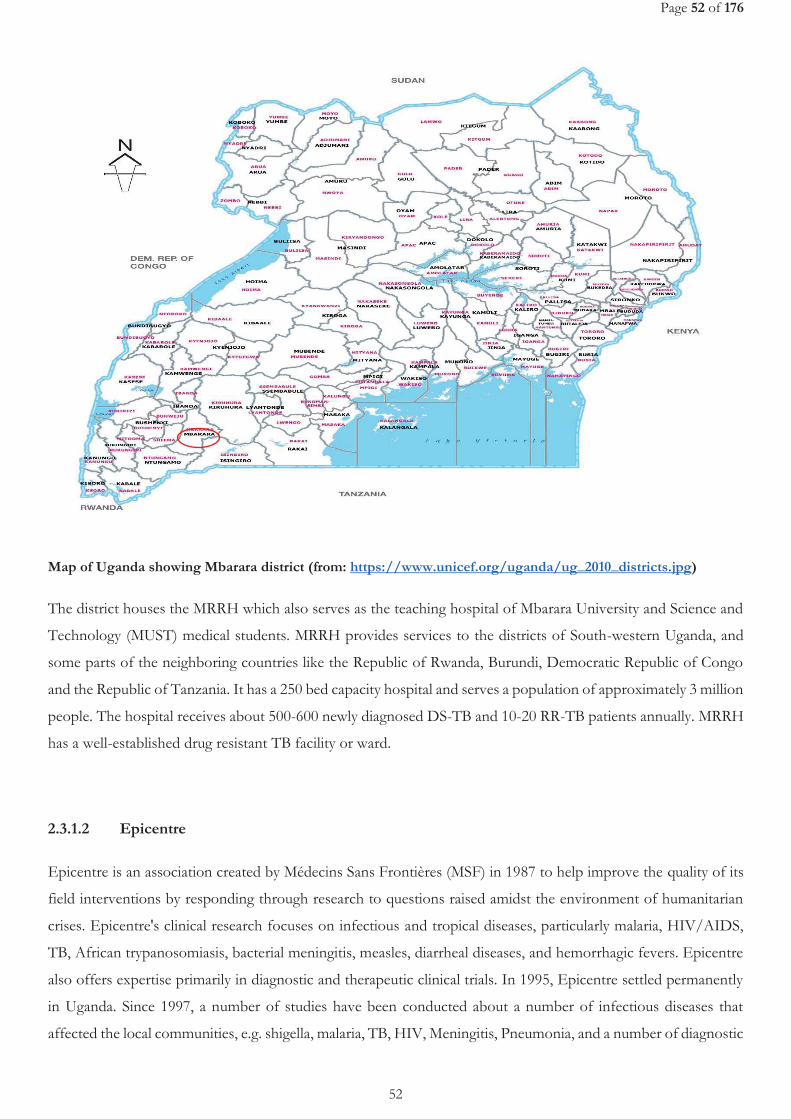
Page 52 of 176
52
Map of Uganda showing Mbarara district (from: https://www.unicef.org/uganda/ug_2010_districts.jpg)
The district houses the MRRH which also serves as the teaching hospital of Mbarara University and Science and
Technology (MUST) medical students. MRRH provides services to the districts of South-western Uganda, and
some parts of the neighboring countries like the Republic of Rwanda, Burundi, Democratic Republic of Congo
and the Republic of Tanzania. It has a 250 bed capacity hospital and serves a population of approximately 3 million
people. The hospital receives about 500-600 newly diagnosed DS-TB and 10-20 RR-TB patients annually. MRRH
has a well-established drug resistant TB facility or ward.
2.3.1.2 Epicentre
Epicentre is an association created by Médecins Sans Frontières (MSF) in 1987 to help improve the quality of its
field interventions by responding through research to questions raised amidst the environment of humanitarian
crises. Epicentre's clinical research focuses on infectious and tropical diseases, particularly malaria, HIV/AIDS,
TB, African trypanosomiasis, bacterial meningitis, measles, diarrheal diseases, and hemorrhagic fevers. Epicentre
also offers expertise primarily in diagnostic and therapeutic clinical trials. In 1995, Epicentre settled permanently
in Uganda. Since 1997, a number of studies have been conducted about a number of infectious diseases that
affected the local communities, e.g. shigella, malaria, TB, HIV, Meningitis, Pneumonia, and a number of diagnostic
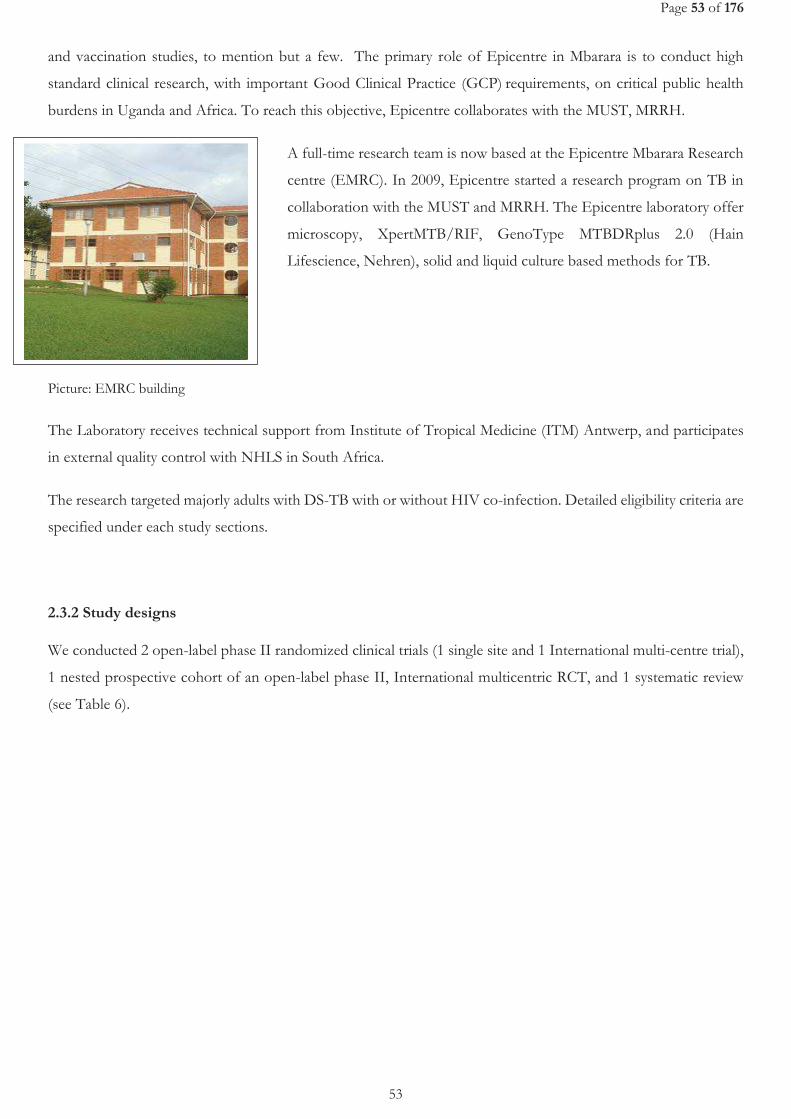
Page 53 of 176
53
and vaccination studies, to mention but a few. The primary role of Epicentre in Mbarara is to conduct high
standard clinical research, with important Good Clinical Practice (GCP) requirements, on critical public health
burdens in Uganda and Africa. To reach this objective, Epicentre collaborates with the MUST, MRRH.
A full-time research team is now based at the Epicentre Mbarara Research
centre (EMRC). In 2009, Epicentre started a research program on TB in
collaboration with the MUST and MRRH. The Epicentre laboratory offer
microscopy, XpertMTB/RIF, GenoType MTBDRplus 2.0 (Hain
Lifescience, Nehren), solid and liquid culture based methods for TB.
Picture: EMRC building
The Laboratory receives technical support from Institute of Tropical Medicine (ITM) Antwerp, and participates
in external quality control with NHLS in South Africa.
The research targeted majorly adults with DS-TB with or without HIV co-infection. Detailed eligibility criteria are
specified under each study sections.
2.3.2 Study designs
We conducted 2 open-label phase II randomized clinical trials (1 single site and 1 International multi-centre trial),
1 nested prospective cohort of an open-label phase II, International multicentric RCT, and 1 systematic review
(see Table 6).
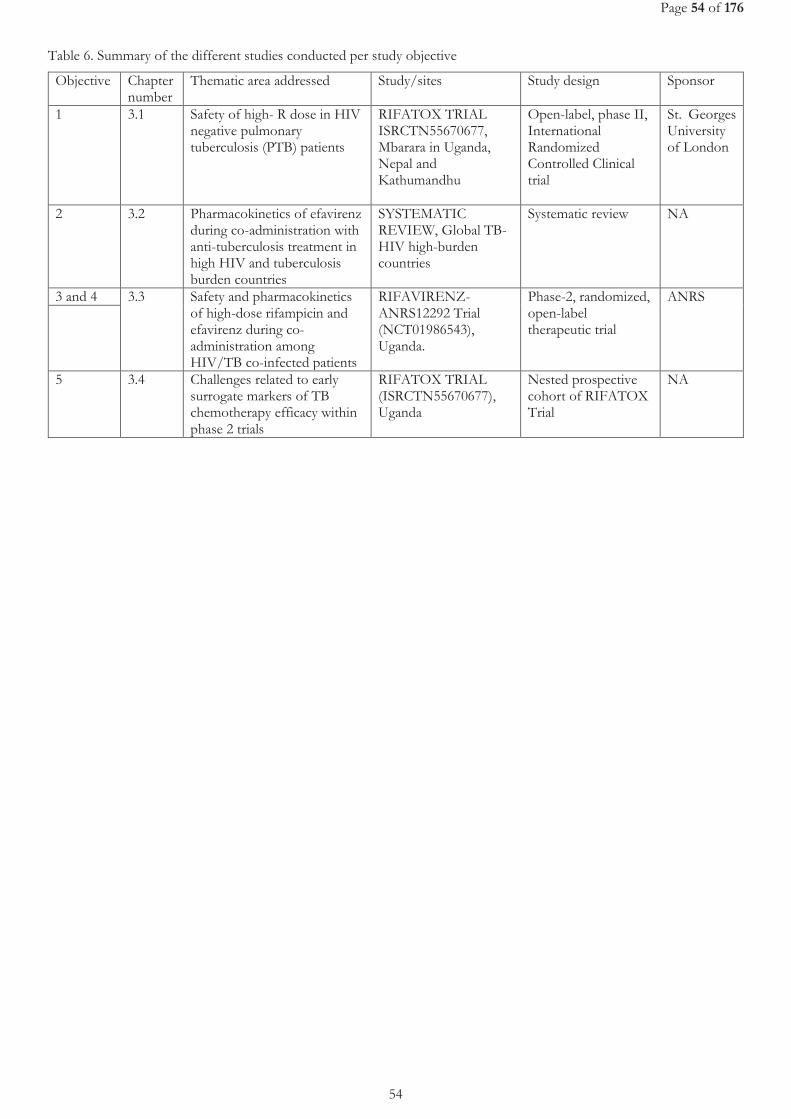
Page 54 of 176
54
Table 6. Summary of the different studies conducted per study objective
Objective Chapter number
Thematic area addressed Study/sites Study design Sponsor
1 3.1 Safety of high- R dose in HIV negative pulmonary tuberculosis (PTB) patients
RIFATOX TRIAL ISRCTN55670677, Mbarara in Uganda, Nepal and Kathumandhu
Open-label, phase II, International Randomized Controlled Clinical trial
St. Georges University of London
2 3.2 Pharmacokinetics of efavirenz during co-administration with anti-tuberculosis treatment in high HIV and tuberculosis burden countries
SYSTEMATIC REVIEW, Global TB-HIV high-burden countries
Systematic review NA
3 and 4 3.3
Safety and pharmacokinetics of high-dose rifampicin and efavirenz during co-administration among HIV/TB co-infected patients
RIFAVIRENZ-ANRS12292 Trial (NCT01986543), Uganda.
Phase-2, randomized, open-label therapeutic trial
ANRS
5 3.4 Challenges related to early surrogate markers of TB chemotherapy efficacy within phase 2 trials
RIFATOX TRIAL (ISRCTN55670677), Uganda
Nested prospective cohort of RIFATOX Trial
NA

Page 55 of 176
55
CHAPTER 3
STUDIES

Page 56 of 176
56
Page 57 of 176
57
Chapter 3.1 Safety of high-dose rifampicin among HIV-
negative TB patients
Published article related to this chapter
Amina Jindani, Gabor Borgulya, Ilona Westermann de Patiño, Tomás Gonzales, Rosario Alvarez de Fernandes, Bhabana
Shrestha, Daniel Atwine, Maryline Bonnet, Marcos Burgos, Faisal Dubash, Nanita Patel, Anna M. Checkley, Thomas S.
Harrison and Denny Mitchison. (2016): A randomised Phase II trial to evaluate the toxicity of high-dose rifampicin to
treat pulmonary tuberculosis. The International Journal of Tuberc Lung Dis, 2016. 20 (6): 832-838
(Full Published Manuscript attached at the end of this chapter)
Presentations related to this chapter
Atwine D. et al. Is it safe to double the dose of rifampicin to shorten tuberculosis treatment duration? In. Epicentre
Scientific Conference, Kampala, 5th July2017. URL: http://epicentre.msf.org/en/uganda-scientific-day-2017 (Oral
presentation).
Atwine D. et al. An International Multicentre Controlled Clinical Trial to Evaluate the Toxicity of High Dose
Rifampicin in the Treatment of Pulmonary Tuberculosis (RIFATOX). In. Annual Grande doctors’ Conference, 11-
13th August 2016, Kampala, Uganda (Oral presentation).
Atwine D. et al. An International Multicentre Controlled Clinical Trial to Evaluate the Toxicity of High Dose
Rifampicin in the Treatment of Pulmonary Tuberculosis (RIFATOX). In. MSF at 30 years in Uganda Exhibition,
2015, Kampala, Uganda (Poster presentation).

Page 58 of 176
58
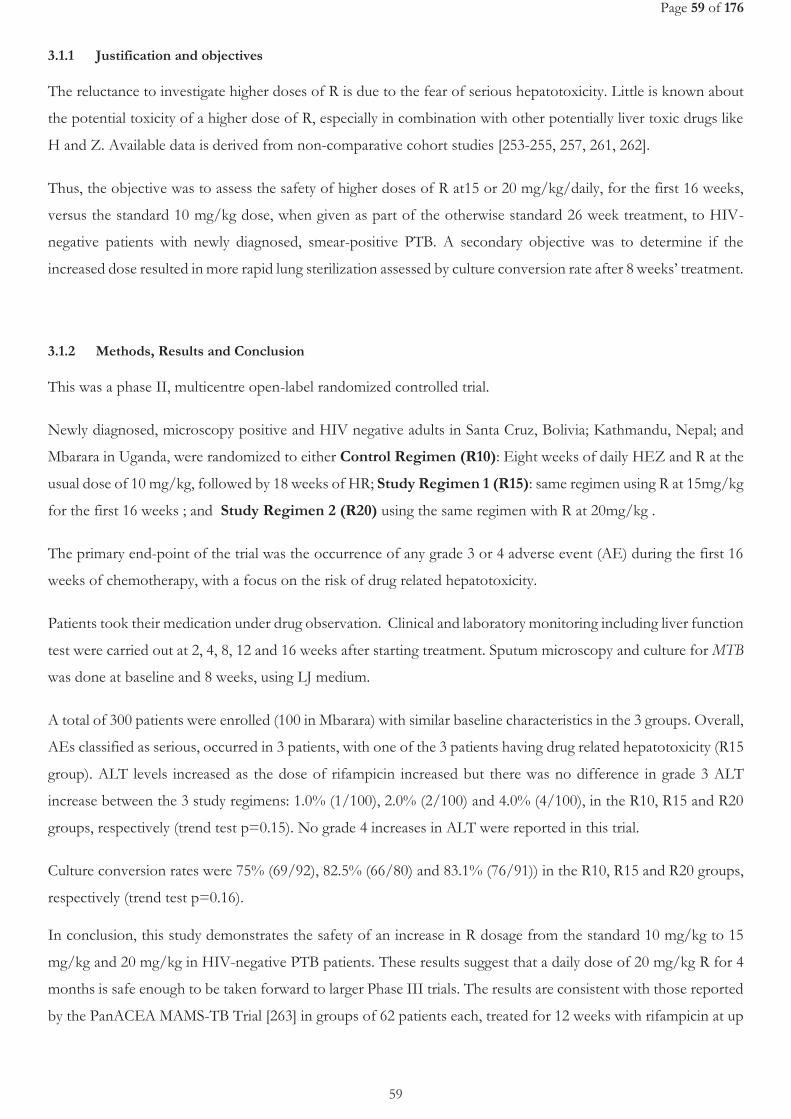
Page 59 of 176
59
3.1.1 Justification and objectives
The reluctance to investigate higher doses of R is due to the fear of serious hepatotoxicity. Little is known about
the potential toxicity of a higher dose of R, especially in combination with other potentially liver toxic drugs like
H and Z. Available data is derived from non-comparative cohort studies [253-255, 257, 261, 262].
Thus, the objective was to assess the safety of higher doses of R at15 or 20 mg/kg/daily, for the first 16 weeks,
versus the standard 10 mg/kg dose, when given as part of the otherwise standard 26 week treatment, to HIV-
negative patients with newly diagnosed, smear-positive PTB. A secondary objective was to determine if the
increased dose resulted in more rapid lung sterilization assessed by culture conversion rate after 8 weeks’ treatment.
3.1.2 Methods, Results and Conclusion
This was a phase II, multicentre open-label randomized controlled trial.
Newly diagnosed, microscopy positive and HIV negative adults in Santa Cruz, Bolivia; Kathmandu, Nepal; and
Mbarara in Uganda, were randomized to either Control Regimen (R10): Eight weeks of daily HEZ and R at the
usual dose of 10 mg/kg, followed by 18 weeks of HR; Study Regimen 1 (R15): same regimen using R at 15mg/kg
for the first 16 weeks ; and Study Regimen 2 (R20) using the same regimen with R at 20mg/kg .
The primary end-point of the trial was the occurrence of any grade 3 or 4 adverse event (AE) during the first 16
weeks of chemotherapy, with a focus on the risk of drug related hepatotoxicity.
Patients took their medication under drug observation. Clinical and laboratory monitoring including liver function
test were carried out at 2, 4, 8, 12 and 16 weeks after starting treatment. Sputum microscopy and culture for MTB
was done at baseline and 8 weeks, using LJ medium.
A total of 300 patients were enrolled (100 in Mbarara) with similar baseline characteristics in the 3 groups. Overall,
AEs classified as serious, occurred in 3 patients, with one of the 3 patients having drug related hepatotoxicity (R15
group). ALT levels increased as the dose of rifampicin increased but there was no difference in grade 3 ALT
increase between the 3 study regimens: 1.0% (1/100), 2.0% (2/100) and 4.0% (4/100), in the R10, R15 and R20
groups, respectively (trend test p=0.15). No grade 4 increases in ALT were reported in this trial.
Culture conversion rates were 75% (69/92), 82.5% (66/80) and 83.1% (76/91)) in the R10, R15 and R20 groups,
respectively (trend test p=0.16).
In conclusion, this study demonstrates the safety of an increase in R dosage from the standard 10 mg/kg to 15
mg/kg and 20 mg/kg in HIV-negative PTB patients. These results suggest that a daily dose of 20 mg/kg R for 4
months is safe enough to be taken forward to larger Phase III trials. The results are consistent with those reported
by the PanACEA MAMS-TB Trial [263] in groups of 62 patients each, treated for 12 weeks with rifampicin at up
Page 60 of 176
60
to 35 mg/kg/day. Grade 3, or higher, AE were reported in 12% R10, 12% R20, and 14% of the R35 (35
mg/kg/day) group.
Increasing R doses also showed a non-significant increasing trend in culture conversion at 8 weeks. However, it
is important to note that the trial was not powered to determine an effect on culture conversion.
3.1.3 Involvement in this work
I was both the principal investigator and the clinical investigator for the Mbarara site. As principal investigator
participated in the review of the trial documents and development of site specific documents for the Mbarara site;
implementation of the trial in the Mbarara site; coordination of the trial activities; and overseeing the
communication with the Ugandan regulatory authorities. As clinical investigator, I was involved in patient
recruitment, eligibility checking, randomization, patients’ clinical assessment and management, patient follow-up,
AE detection and reporting. Since all trial sites data management processes were handled at Mbarara site, I also
ensured that proper data management procedures are followed. Overall, I ensured that the conduct of the trial
was in accordance to good clinical practice (GCP) guidelines. Furthermore, I participated in the, review of the
manuscript and dissemination of the results of the trial in national conferences, that is: Epicentre Scientific
Conference, Kampala, 5th July2017 (URL: http://epicentre.msf.org/en/uganda-scientific-day-2017), the Annual
Grande doctors’ Conference, 11-13th August 2016, Kampala, Uganda and at MSF at 30 years in Uganda exhibition,
2015, Kampala, Uganda. (Further details included in PHD Portfolio at the end of the book)

Page 61 of 176
61
Page 61 ofofofofofofofofofofofofofof 176
61
Page 62 of 176
62
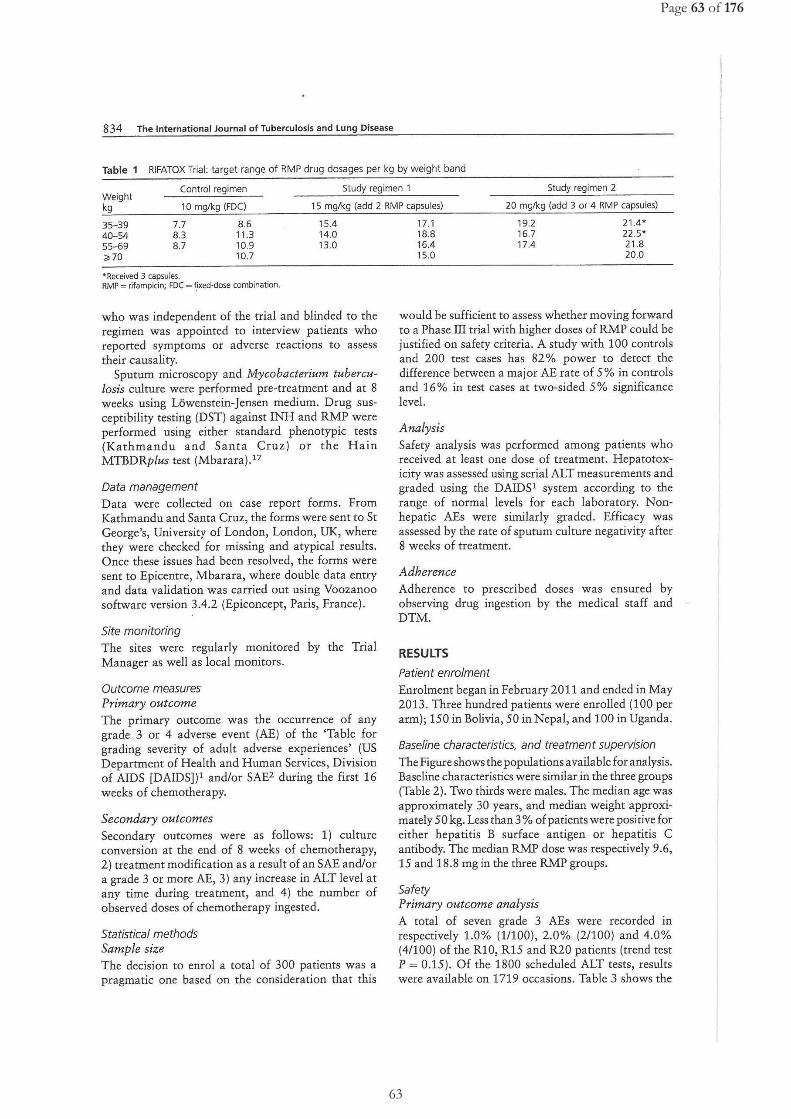
Page 63 of 176
63
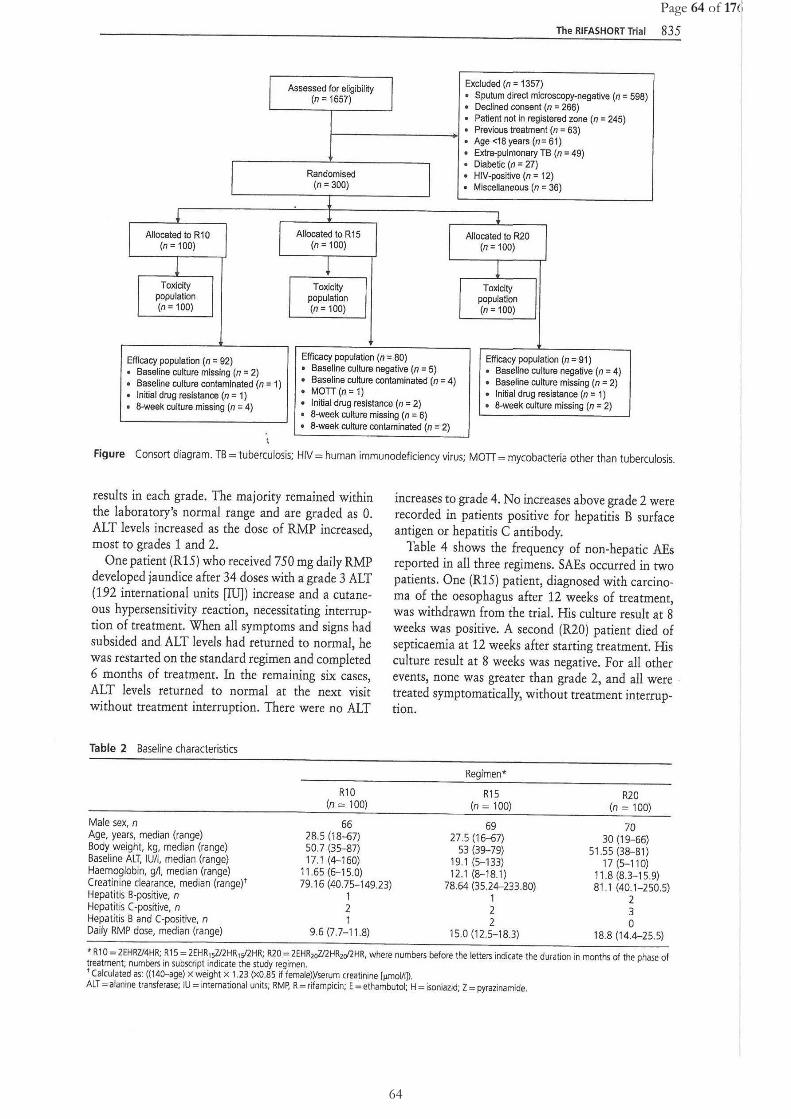
Page 64 of 176
64
Page 64 of 1766666666666666
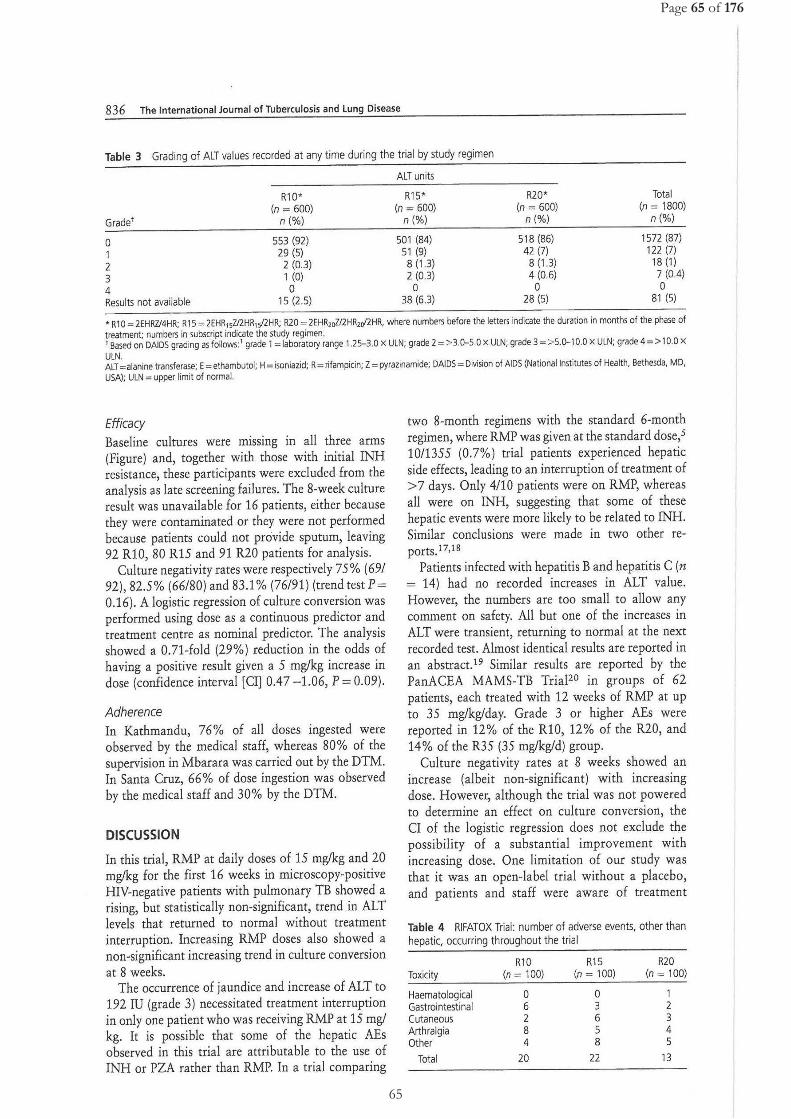
Page 65 of 176
65 65
Page 66 of 176
66
Page 66 of 1717171717171717171717171717176
66
Page 67 of 176 Page 67 of 17666666

Page 68 of 176
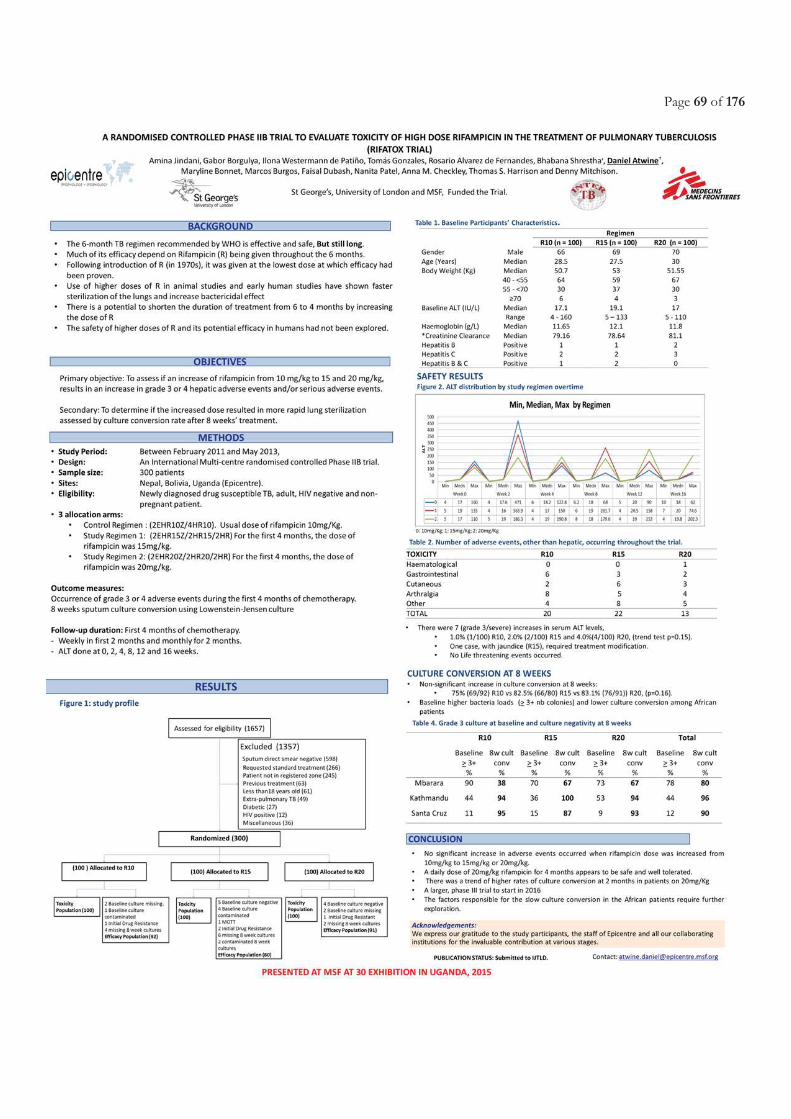
Page 69 of 176

Page 70 of 176
Page 71 of 176
Chapter 3.2 Pharmacokinetics and safety of efavirenz during
co-administration with anti-tuberculosis treatment in high HIV and tuberculosis burden
countries: a systematic review
Atwine D., Bonnet M. and Taburet AM. Pharmacokinetics of efavirenz during co-administration with
antituberculosis treatment in high HIV and tuberculosis burden countries: A systematic review

Page 72 of 176
Page 73 of 176
3.2.1 Justification and objectives
Co-administration of both EFV-based ART and ATT for TB-HIV co-infection continues to be the practice among
high TB and HIV burden countries despite the reported drug-drug interactions especially between EFV and R. This
is majorly because of EFV’s good efficacy [162], tolerability, cost, formulation as a FDC administered at 600mg dose
once-daily, but also being well incorporated among LMICs and high HIV burden countries’ national guidelines [157-
159]. Dolutegravir despite its improved tolerance compared to EFV, its limited experience in HIV-TB co-infected
patients will make EFV-based ART regimen the cornerstone of HIV treatment in those patients for many years [36,
264]. Meaning that clinicians and pharmacologists may have to continue facing the challenges of drug-drug interaction
between ART and ATT regimens and this will continue to be an important consideration in developing and
implementation of new drugs or regimens for either HIV or TB.
Despite attempts made previously in describing the pharmacokinetics and pharmacogenetics of EFV with RH-based
ATT co-administration [165, 265-267], an extensive focus on the world’s highest TB/HIV burden countries that may
be affected most by drug-drug interactions is lacking. We therefore conducted a systematic review to gather existing
information on the PK of EFV when combined with ATT among TB and HIV high-burden countries. We assessed
the effect of body weight, gender, EFV dosing and the CYP2B6 homozygous slow metabolizer genetic polymorphism,
CYP2B6 516 G>T, on the EFV concentrations during R and H co-administration, and the effect of the EFV
pharmacokinetic parameters on the virological response, CNS and hepatic toxicity.
3.2.2 Methods, results and conclusion
The detailed methodology, results and conclusions of this systematic review are as presented in the attached complete
manuscript (for submission soon to Clinical Pharmacokinetics journal).
3.2.3 Involvement in this work
In this systematic review, I wrote the protocol based on PRISMA guidelines [268], developed the search strategy,
developed all data collection tools, did the systematic search of Cochrane Library, EMBASE.COM and MEDLINE
(via OvidSP), screened articles, extracted data from included articles onto a standardized data extraction form and
validated by a second reviewer. I designed a database designed using Epi Info™ software (V7.2, 1600 Clifton Road
Atlanta, GA 30329-4027 USA), entered data, performed the analysis with Stata software (v. 13, College Station, Texas,
USA) and wrote the manuscript, all with support of my PhD Directors.

Page 74 of 176
Pharmacokinetics of efavirenz during co-administration with antituberculosis treatment in high HIV and
tuberculosis burden countries: A systematic review
Authors:
Daniel Atwine1, 2, 4, Maryline Bonnet1, 3, 4 and Anne-Marie Taburet5,6
Affiliations:
1Epicentre Mbarara Research Centre, PO box 1956, Mbarara, Uganda
2Mbarara University of Science and Technology, Mbarara, Uganda
3IRD UMI233 TransVIHMI-INSERM U1175, Montpellier, France
4University of Montpellier, Montpellier, France
5Bicetre hospital, Paris, France
6 INSERM UMR 1184, CEA, Université Paris-Sud
Running head: Pharmacokinetics of Efavirenz with Rifampicin
Address reprint requests to: Daniel Atwine, Epicentre Mbarara Research Centre, P.O Box 1956, Mbarara,
Uganda. Tel: + 256793328410.
Email: [email protected] or [email protected]
ORCID ID: 0000-0001-8169-9156
Co-Authors contact details:
Maryline Bonnet : [email protected]
Anne-Marie Taburet: anne-marie.taburet@ aphp.fr
Page 75 of 176
Abstract
Background: Efavirenz (EFV) and Rifampicin-Isoniazid (RH) are cornerstone drugs in tuberculosis (TB)-HIV
co-infection treatment but their co-administration bares complex interactions with efficacy and safety challenges.
We reviewed recent data on EFV and RH interaction in TB/HIV high-burden countries.
Methods: We conducted a systematic review of studies conducted in the 41 high TB/HIV-burden countries
between 1990 and 2016, on EFV pharmacokinetics (PK) during RH co-administration in co-infected patients.
Article screening and data collection were done by 2 reviewers.
Results: Of 119 records retrieved, 22 were included (14 Africa, 7 Asia, 1 inter-continental), all observational
studies reporting either EFV mid-dose (C12) or pre-dose (Cmin) concentrations. Of 20 studies in adults, 19 had
average concentrations between 1000-4000ng/mL on RH. Increased concentrations on versus off RH were
reported in 6/10 African studies (3.7 – 33.3 %) and 2/4 Asian studies (9.5 – 26.3%). Sub-therapeutic
concentrations frequency ≥ 20% reported in 5/13 studies during RH. Five of 8 studies reporting virological
response > 80%, had < 20% of the population with sub-therapeutic concentrations. High frequency of
supratherapeutic concentrations (≥20%) were reported in all 7 studies reporting these data. The CYP2B6 516G>T
polymorphism was consistently associated with higher plasma EFV concentrations, whatever the ethnic
background of the patients. Effect of EFV and RH co-administration on hepatic and central nervous system
toxicity was noted in 2/8 and 3/9 studies, respectively.
Conclusions:
These findings support the use of 600mg EFV in co-infected patients in high-burden countries. CYP2B6 loss of
function genes frequency may explain the variability of EFV concentrations in African and Asian populations
and should be considered prior to EFV-400mg implementation in TB-HIV co-infected patients.
Page 76 of 176
BACKGROUND
HIV infection is still a global public health concern, especially in Africa and Asia. Sub-Saharan Africa remains most
severely affected, with nearly 1 in every 25 adults (4.4%) living with HIV and accounting for nearly 70% of the people
living with HIV worldwide [1]. The estimated risk of developing tuberculosis (TB) in people living with HIV ranges
between 26 and 31 times greater than in those without HIV infection [2]. The highest TB incidence rates among HIV patients
are reported in Africa and Asia. The overall TB mortality rate among HIV patients is about 6 times higher in Africa (30 per
100,000 population) than the global average (5.3 per 100,000 population), with approximately 75% of all deaths occurring
in Sub-Saharan Africa [3].
The recommended first-line anti-retroviral treatment (ART) for adults and adolescents consist of two nucleoside reverse-
transcriptase inhibitors (NRTIs) plus a non-nucleoside reverse-transcriptase inhibitor (NNRTI) or an integrase inhibitor
(INSTI)[4]. Recommended WHO NRTI backbone was zidovudine and lamivudine and recently tenofovir +lamivudine,
those two drugs being eliminated unchanged through the kidney, which makes drug-drug interactions unlikely [4]. The
recommended NNRTI is efavirenz (EFV) given its proven high virological efficacy, its availability as a fixed-dose
combination (FDC) administered at 600mg dose once-daily, under generic formulation preferably in the night so as to
minimize central nervous system (CNS) adverse events, and to ensure good adherence. EFV is well incorporated among
low income and high HIV burden countries’ national guidelines [5-7]. There is reassuring data regarding its safety in
pregnancy [8] and improved efficacy compared to the former widely used NNRTI, nevirapine [9]. Although dolutegravir
an HIV-integrase inhibitor may be available in resource limited countries shortly, despite improved tolerance compared to
EFV, limited experience in HIV-TB co-infected patients will make EFV-based ART regimen the corner stone of HIV
treatment in those patients for many years [4, 10].
EFV is mostly metabolized by hydroxylation to inactive metabolites 8-hydroxy EFV and 7-hydroxy efavirenz involving
mainly CYP2B6 [11, 12]. The main metabolite, 8- hydroxy efavirenz is further hydroxylated primarily by CYP2B6 to form
8, 14-hydroxy efavirenz. The oxidative metabolites undergo conjugation by UDP-glucuronyltransferase (UGT) pathway
and are excreted in the urine as glucuronides [13]. Mid-dose (12h) EFV plasma concentrations below 1000 ng/mL have
been associated with increased risk of virological failure in HIV-infected patients, while concentrations above 4000 ng/mL
have been associated with risk of CNS side effects [14, 15]. There is a wide inter-individual variability in EFV
concentrations [15] that is partially explained by genetic factors as shown by the strong association between CYP2B6
516G>T single nucleotide polymorphism (SNP) and EFV exposure [16]. The CYP2B6 516G>T is a common polymorphism
that has been consistently associated with reduced enzyme activity, higher EFV exposure and increased toxicity [11, 16,
17]. On the other hand, there is no clear evidence supporting the association with gender and body weight [13, 18].
With regard to drug susceptible TB, a six-month regimen broken down into an intensive two-month phase involving
isoniazid (H, 5 mg/kg), rifampicin (R, 10 mg/kg), pyrazinamide (Z, 25 mg/kg) and Ethambutol (E, 15 mg/kg) followed by
Page 77 of 176
four months of continuation phase with R and H [19]. Both R and H are the cornerstone drugs within this regimen [20, 21]
that has a very good efficacy [22]. This regimen is used with FDC, and administered once daily [21].
Rifampicin has a strong bactericidal activity [22, 23] given its ability to inhibit transcription by binding with high affinity
to bacterial DNA-dependent RNA polymerase [24-26] and the best sterilizing drug to prevent relapses of TB. R is also a
potent inducer of several liver or gut drug metabolizing enzymes, especially isoenzymes of cytochrome P450 (CYP), mainly
isoenzyme CYP3A4 and CYP2B6. This results in enhanced NNRTI drug metabolism and may lead to sub-therapeutic
NNRTI plasma concentration during co-administration [27]. In healthy volunteers, EFV Area Under the Curve (AUC),
maximum concentration (Cmax) and minimum concentration (Cmin) are reduced by 26, 20 and 32% when co-administered
with R as compared to EFV alone, respectively, which led to the Food and Drug Authority (FDA) recommendation of an
increase in EFV dosing to 800 mg once a day when combined with TB drugs [27, 28]. However, due to the potential of
increased risk of CNS toxicity with the increase of EFV dose and reassuring virological response in co-infected patients
receiving EFV at 600mg once daily in high HIV burden countries, it is recommended to maintain EFV at usual dose
(600mg/day once daily) [14, 29-33]. The other cornerstone anti-TB drug, isoniazid, is metabolized mainly through N-
acetyltransferase type 2 (NAT2) and was demonstrated in vitro to have an inhibitory effect on several cytochrome P450
enzymes (CYP2C19, CYP1A2, CYP2A6, CYP2C19, and CYP3A4) [34]. From recent studies, there is some growing
evidence that the inducing effect of combined R and H (RH) is less potent than R alone [35, 36]. Such effect could be
different according to patient CYP2B6 516 G>T genetic polymorphism [37].
However, despite attempts made previously in describing the pharmacokinetics (PK) and pharmacogenetics of EFV with
RH co-administration [13, 38-40], an extensive focus on the world’s highest TB/HIV burden countries that may be affected
most by drug-drug interactions is lacking.
We conducted a systematic review to gather existing information on the pharmacokinetics of EFV when combined with
anti-TB treatment among TB and HIV high-burden countries. We assessed the effect of body weight, gender, EFV dosing
and the CYP2B6 homozygous slow metabolizer genetic polymorphism, CYP2B6 516 G>T, on the EFV concentrations
during RH co-administration, and the effect of the EFV PK results on the virological response, CNS and hepatic toxicity.
METHODS
Study eligibility criteria
A study was considered eligible for inclusion if it was a randomized controlled trial, cohort, case-control or cross-sectional
study, that report PK of the EFV (minimum or mid-dose concentrations at least) following co-administration with RH in
TB/HIV co-infected patients for at least 4 weeks (that is to ensure a minimum steady state) and conducted among the 41
TB/HIV high burden countries according to the WHO Post-2015 list [41]. Studies that enrolled patients with comorbidities
Page 78 of 176
that require co-administration of other drugs with known interaction with EFV, and studies enrolling patients on anti-TB
prophylaxis, or using other rifamycins like rifapentine and rifabutin were excluded. Only studies published in English were
included.
Search strategy
We conducted this review according to PRISMA guidelines [42]. We identified relevant articles through a systematic search
of Cochrane Library, EMBASE.COM and MEDLINE (via OvidSP) published from 1st January 1990 to 31st August 2016
in the English language. The choice of 1990 as start point was based on the consideration that in most of the TB/HIV high-
burden countries, access to antiretroviral treatment took place after 1990, with EFV receiving FDA approval in 1998 [43].
We also searched the Web-of-science and carried out manual searches (hand searching) to retrieve other reports of studies
that are reported in journals, conference proceedings, bibliographies of review articles and retrieved articles, monographs,
and sources other than those mentioned above. We used the following abbreviated search strategy: ("Efavirenz" or "Stocrin"
or "Sustiva") and ("Rifampicin" or "RIFAFOUR" or "RIFAMPIN" or "RIFAMYCIN") and ("pharmacokinetics" or "drug
assay" or "plasma drug concentration" or "Ctrough" or "pharmacology" or "drug interaction" or "drug-drug interaction" or
"Efavirenz concentration" or "Rifampicin concentration" or "non-nucleoside reverse transcriptase inhibitors
concentration").
Bibliography search and screening of titles and abstracts were done by one reviewer (DA), duplicate records were eliminated
and full texts of potentially relevant articles retrieved. The selection was validated by a second reviewer (MB), blinded to
the initial assessment. Full texts retained through this process were independently screened by two reviewers (DA and
AMT). Disagreements were examined by the third reviewer (MB).
Records with inaccessible full text but with author contact details were retrieved after contacting authors by email. Abstract
only records were excluded from further data collection processes.
Data collection and analysis
Data collected from each study were recorded by one reviewer (DA) in a standardized data extraction form (see Appendix
1) and validated by the second reviewer (AMT). Authors were contacted for clarification whenever needed. All
discrepancies were discussed and resolved by consensus between the three reviewers (DA, AMT, and MB).
Data extraction forms were entered into a database using Epi Info™ software (V7.2, 1600 Clifton Road Atlanta, GA 30329-
4027 USA) and analysis used the Stata software (v. 13, College Station, Texas, USA). We performed descriptive
presentation of the studies’ and patients’ characteristics. EFV mid-dose concentrations measured 12h post dose or pre-dose
concentration (Cmin) measured before next dose intake were the PK parameters chosen as a surrogate of EFV exposure
Page 79 of 176
based on their availability in all selected articles. They were presented with or without RH co-administration globally, by
gender, body weight, and EFV dose. Proportions of patients with sub-therapeutic (<1000ng/mL) or supra-therapeutic EFV
concentrations (>4000ng/mL)[15] and the attributable rate percent (AR%) defined by the difference in proportions of
patients with sub-therapeutic or supratherapeutic concentrations during EFV co-administration with anti-TB drugs and EFV
alone, were calculated and presented per study.
EFV concentrations and frequency of CYP2B6 homozygous slow and extensive metabolizer genetic polymorphism,
CYP2B6 516 G>T were presented by study.
RESULTS
Of the total 119 records retrieved, 22 records were included in the analysis (Fig I). Of these, 20 studies had data on at least
EFV C12 or Cmin during RH co-administration [14, 32, 35, 44-60], while 1 study only reported body weight-specific EFV
C12 data during RH co-administration [61] and one reported only proportions of patients with sub-therapeutic EFV
concentrations [62].
General characteristics of studies
Table I shows characteristics of the 22 included studies. All were published between 2006 and 2016. They were all
observational studies and 64% were conducted exclusively in Africa. The majority included adult patients (91%). The 2
children studies were conducted in South Africa. EFV was systematically administered at bed-time to improve the
tolerability and reduce adverse events [63], except for 2 adult studies when it was taken in the morning [46, 64] and a 6-
month anti-TB treatment was used and administered daily at recommended dosing in all studies except one [48]. Slightly
more than half of the studies (59%) reported EFV concentrations on and off RH within the same patients. All studies had
EFV concentrations during RH co-administration, with sampling done during intensive phase or continuation phase.
Individual study-specific characteristics are shown in Appendix 2.
Effect of RH co-administration on the PK of EFV in HIV/TB co-infected patients
Overall, 19/20 studies reported that the average EFV concentrations were in the allegated therapeutic window (1000-4000
ng/mL) during RH co-administration irrespective of the geographical region (Table II). One study in Thai patients [45]
reported an average EFV concentration >4000 ng/mL although without specifying the proportion of patients with
supratherapeutic concentrations. Of the 14 studies conducted among adult patients that reported EFV concentrations on and
Page 80 of 176
off RH, 10 were in Africa and 4 in Asia. Among studies conducted in Africa, with RH co-administration, an increased EFV
concentration was noted compared to the off RH period in 6 studies ranging from 3.7% up to 33.3% across studies and
countries.
Among studies in Asia, increased EFV concentration with RH co-administration was noted compared to the off RH period
in 2 studies ranging from 9.5% up to 26.3% while reduced concentrations were seen in 2 studies ranging from 3.6% up to
22.2% across, studies and countries.
In the two studies among the South African children, the earlier study by Ren (2009) indicated a slight increase in median
C12 with RH co-administration (0.8%), while a recent study by McIlleron (2013) indicated a decrease of 16.3%.
Sub-therapeutic EFV concentration and virological response
Fig II shows the proportion of patients with sub-therapeutic EFV levels on or off RH as reported in different studies. Of the
13 studies reporting information on the proportion of patients with sub-therapeutic EFV concentrations, 10 studies had
comparative concentration with and without RH. On RH, 5/13 studies reported concentrations <1000ng/ml in more than
20% of patients but only one study in South-Africa reported a proportion of patients with sub-therapeutic concentrations
higher during RH co-administration by > 10% as compared to without RH. Two studies (one in adult and one in children)
reported the very high proportion of patients (>50%) with sub-therapeutic concentrations either with or without RH.
Table III shows results of virological response with EFV and RH co-administration. Out of 10 studies (8 in adults, 2 in
children) reporting both EFV exposure and virological response, 8 had a virological response > 80% between 6 and 12
months follow-up (6 in adults, 2 in children). Of them, 5 studies had less than 20% of patients with sub-therapeutic
concentrations (4 in adults, 1 in children). In contrast, both studies (all in adults) with virological suppression lower than
80% had more than 20% of patients with sub-therapeutic levels.
Supra-therapeutic EFV concentration and safety
Fig III shows that all the 7 studies, reported a proportion of approximately 20% or above among the patients on RH with
supra-therapeutic EFV concentrations (>4000ng/mL). Only 5 studies had comparative results in same patients on and off
RH and reported all higher proportions on versus off RH, although the difference was highly variable ranging from ~1% up
to 23%. Interestingly, the 3 studies conducted in Africa reported higher EFV concentration on versus off RH [56, 60, 64].
Table IV shows the hepatic adverse events among HIV-TB co-infected patients. Of the 8 studies that assessed and reported
data on hepatic events, the 4 African adult studies reported incidence of any grade alanine aminotransferase (ALT) rises
Page 81 of 176
ranging between 2.8-30% among TB-HIV co-infected patients [32, 46, 55, 56], though a relationship between ALT rise and
EFV/RH co-administration was demonstrated in only one study [55]. Among the 3 Asian studies [53, 58, 62], incidence of
any grade ALT rises ranged between 0-16.7%, with a significant relationship with EFV/RH co-administration reported only
in one study [58]. The only children study conducted in South Africa reported all grade ALT rises in 2.5% of children [35].
Table IV shows the central nervous system adverse events among HIV-TB co-infected patients. Nine studies that is, 6
African, 2 Asian, 1 international study assessed and reported data on incidence of any grade CNS symptoms. Among African
studies, 2/6 showed a significant relationship between CNS adverse events and supratherapeutic EFV plasma concentrations
[50, 57]. Of the 2 Asian studies 1 reported a significant relationship between developing incidence of CNS side-effects of
any grade with having at least one-time supratherapeutic EFV concentrations [58].
EFV concentration by body weight, EFV dose, and Gender
Three studies reported plasma EFV concentrations stratified by body weight when given at a 600 mg dose with anti-TB
drugs co-administration [54, 55, 61]. Two studies reported lower EFV concentrations in patients with weight > 50Kg than
in patients with weight < 50Kg, with median C12 (interquartile range, IQR) of 2060 ng/mL (IQR: 1425, 3575) vs 2859
(IQR: 1787, 4749) in Cambodian patients [61] and mean Cmin of 1860ng/mL vs 2080ng/mL in a study that included
African, Latin American and Asian sites [54]. On the other hand, in the third study in Ethiopia the median (IQR) C12 was
slightly higher in patients with weight > 50Kg compared to those with weight < 50Kg: 1515ng/mL (962, 3019) vs
1345ng/mL (765, 3058) [55]. However, in the same study, without co-administration, there was a trend towards lower
concentrations in patients with higher body weight: 1233ng/ml (848, 1670) vs 1410ng/mL (1067, 2155) [55].
Only one study in South Africa included patients on high EFV dose (800mg) [32]. A higher median (IQR) C12 of EFV
during RH co-administration was noted in the patients on 800mg EFV (2900 ng/mL, IQR: 1800, 5600) as compared to the
group on 600mg EFV (2400ng/mL, IQR: 1200, 5100).
Only one study presented plasma EFV concentrations stratified by gender during co-administration with anti-TB drugs. The
mean Cmin was lower for males than for females (1870 ng/mL vs 2370 ng/mL) [54].
The frequency of CYP2B6 slow metabolizers and effect on EFV concentration during anti-TB treatment co-
administration
A total of 9 studies (6 from Africa and 3 from Asia) reported EFV concentrations according to the CYP2B6 G516T genetic
polymorphism encoding for a defective CYP2B6 enzyme, and 8/9 studies (5 from Africa and 3 from Asia) reported the
frequency of CYP2B6 homozygous slow metabolizer genetic polymorphism within the studies’ populations. Most of the
Page 82 of 176
studies reported only frequencies for the most frequent polymorphism CYP2B6 516 G>T (CYP2B6*6 allele). In all studies,
except for one conducted in Tanzania [49], patients who carried this loss of function variant allele had higher EFV
concentrations both off and on RH as compared to those carrying the wild-type gene as shown in figure IV, panels A and B
respectively. The frequency of slow metabolizers ranged between 10% in one study in Rwanda [59] and 28% in another
study in Ethiopia [55].
DISCUSSION
In this review, we note that, 19 out of the 20 selected studies reported average EFV concentrations within the allegated
therapeutic range (1000-4000 ng/mL) during RH-based standard TB drug co-administration, and many of which also
showed an increase in EFV concentrations during RH co-administration. This observation was demonstrated to be
dependent on CYP2B6 and NAT2 genetic polymorphism. Indeed, patients who are slow metabolizers for CYP2B6, had
higher concentrations of EFV (>4000 ng/ml). In those patients, R has little effect on minor drug metabolizing enzymes
involved in EFV biotransformation, although H which is metabolized by the polymorphic NAT2 was demonstrated to inhibit
these enzymes [37, 65]. Except in Ethiopia, we observe a reduction of EFV concentration during co-administration with
anti-TB drugs in the Eastern African region and an increase in the Southern African region. This variability may partially
be explained by the difference in the frequency of CYP2B6 polymorphisms [30, 66]. In the study done in Rwanda, the
frequency of the CYP2B6 983 T>C polymorphism associated with extensive metabolizing activity was particularly high
(83%) in the study population [59] that experienced a major decrease in concentrations during RH co-administration
compared to EFV alone (33.3%); and the frequency of slow metabolizing genotypes was higher (28%) in the Ethiopian
study population [55] where an increase of EFV concentrations during co-administration (17.4%) was also observed.
Studies from only three countries (Cambodia, Thailand and India) were available for South East Asia with discordant results
on effect of RH co-administration on EFV PK even within studies conducted in the same country. This is demonstrated in
studies conducted in Thailand, in which one reported an increase [45] while another reported a decrease [52] in EFV
concentrations during RH co-administration. Similar intra-country variability was observed in adult studies conducted in
Tanzania [46, 49], and in the two children studies in South Africa [35, 47], and could partially be explained by the difference
in sample size and methodology between the studies. The influence of age on CYP2B6 expression has not been well
established although some studies hypothesized that it may also depend on sex, as significant increase in liver CYP2B6 is
more linked to only males at higher age [67].
In this review, the lower EFV concentrations among males reported in one study [54] are in agreement with what has been
reported in another study in Zimbabwe without anti-TB drugs co-administration that showed a mean EFV C12 lower in
males than in females [68] although this study was excluded in this review given a non-specified timing of PK sampling.
This might also be dependent on the genetic polymorphism (CYP2B6*6, *18 and CYP2A6*9) and age [67].
Page 83 of 176
Although the proportion of patients with sub-therapeutic EFV levels was very high in some studies, there were no major
differences in EFV concentrations between on and off anti-TB treatment. As expected, there was a trend of lower virological
response in studies with very high proportion of patients with sub-therapeutic concentrations. However, some discordances
between the EFV concentrations and the virological response in some studies [47, 55, 64], illustrate the difficulty to correlate
the drug plasma concentration measured at one point of time with the virological response. This is in agreement with the
PK/Pharmaco-dynamic results of the ENCORE1 study where patients were randomized to receive EFV once daily either at
400 mg or 600 mg. It was shown that despite predicted C12<1000 ng/mL in 5% and 2% for EFV 400 and EFV600
respectively, 1 patient in the EFV400 group and 3 in the EFV600 group had detectable plasma viral load at 48weeks of
therapy [69]. In addition, it also highlights the limitation of the commonly used sub-therapeutic threshold of 1000ng/mL for
mid-dose EFV concentration, which is based on very low level of evidence [15]. Furthermore, the use of the same threshold
for studies reporting C12 (mid dose concentration) or Cmin (trough concentration) concentrations overestimated the
proportion of patients with sub-therapeutic concentrations [47].
The occurrence of supratherapeutic EFV levels was very common both in African and Asian studies. However, higher
increases in proportion of patients with supratherapeutic EFV levels with RH co-administration than without, were noted
in African studies (range: 10-23%) as compared to Asia (3.0%) and in one inter-continental study (0.8%). Despite the low
frequency of slow-metabolizer CYP2B6 genes among study patients, their presence was almost always associated with
supratherapeutic EFV concentrations, something that could partly explain the observed supratherapeutic EFV variability.
Higher EFV concentrations during co-administration with anti-TB treatment could increase the occurrence of adverse
events. Marzolini et al., and Haas et al., reported that EFV CNS adverse effects were more common in those patients with
higher EFV concentrations [15, 70]. However, due to the very low number of studies reporting both safety and PK data
during co-administration with anti-TB treatment, it is very difficult to draw strong conclusions based on this current review.
In addition, the lack of information or standardization in reporting safety information between studies, especially for CNS
makes the interpretation even more difficult. Nevertheless, we note that no clear correlation could be made between EFV
supratherapeutic levels and occurrence of CNS adverse events during RH co-administration within the exclusively African
studies [14, 50, 60]. This lack of association might also be biased by the other common causes of neuropsychiatric disorders
besides EFV treatment in HIV infected patients [71, 72]. Some studies have however attempted to explain this disparity
between plasma EFV concentrations and onset of CNS adverse events on grounds of the high lipophillic nature of EFV
which allows it to penetrate the blood brain barrier easily and so give disproportionate EFV concentrations between plasma
and brain [62]. Interestingly it was recently suggested that among 563 patients who had initiated EFV-containing regimens
at an HIV primary care clinic in the South-eastern United States, slow metabolizer genotypes were associated significantly
with EFV discontinuation for reported CNS symptoms although this association was considerably stronger in Whites than
in Blacks [73].
Page 84 of 176
Regarding, hepatotoxicity, the reported overall incidence of ALT rises to any grade among TB-HIV co-infected patients
was higher among the African adult studies (2.8-30%) as compared to Asian studies (0-16.7%). Nevertheless, only one adult
study revealed a significant relationship between any grade ALT rise with EFV and RH co-administration [58]. In this
review, it was not possible to distinguish the individual drug contribution of R and H on ALT rises of any grade given that
in all studies RH was administered within FDC, but also since the timing of onset was not well clarified in all studies. In
one children study conducted in South Africa, all grade ALT rises were noted in 2.5% of children, with only 1 child suffering
a grade 3 elevation in ALT in the month after completion of anti-TB treatment, which turned to normal without treatment
adjustment [35].
With the few studies available, it was not possible to satisfactorily assess the effect of body weight and EFV dose during
co-administration with anti-TB drugs. Two of three studies showed a decrease of EFV concentration among patients with
high body weight (>50Kg) as previously reported in patients on EFV alone [37, 52, 68] and children [35].
This systematic review has some limitations, i) the great heterogeneity between studies with regard to study designs, PK
parameters explored, and reporting, hindered any potential meta-analysis; ii) The small sample sizes for TB-HIV co-
infected populations in many studies, may have contributed to the observed variability in EFV exposure due to RH co-
administration even within same country; iv) The effect of body weight, gender, and EFV dose could not be properly
assessed due to the very small number of studies and their low sample sizes; v) Most papers never correlated sub-therapeutic
and supra-therapeutic rates of EFV during RH co-administration with CYP2B6 metabolizer genes, and so hindered clear
quantification of changes attributable to various CYP2B6 genetic polymorphisms. vi) The few children studies could not
allow a thorough evaluation and conclusions on EFV exposure with RH co-administration. vii) Analysis of safety
information was limited by the very few number of studies correlating both safety and PK data and by the variability in the
assessment of CNS adverse events, with only one study using a standard scale [50]. Viii) No study utilized R doses higher
than 10 mg/kg, leaving the PK, safety and efficacy implications related with co-administration of ART and anti-TB regimens
utilizing higher R doses to remain unknown.
In conclusion, this systematic review supports the current recommendation for co- administration of ART regimen with
EFV 600mg daily and anti-TB treatment in TB-HIV high burden countries. This systematic review is important as
ritonavir/cobicistat boosted PI cannot be used with R, and yet sufficient data is not yet available on potential use of
raltegravir or dolutegravir [74, 75]. The interpretation and management of elevations in ALT and CNS adverse events
should done not only in the context of EFV and RH interaction but also looking at other independent predictors like advanced
disease, liver diseases, adherence and patients’ demographic characteristics. Despite the reported good PK, efficacy and
safety profile of the 400mg dose of EFV as compared to 600mg in HIV patients [69, 76], its use among TB/HIV co-infected
patients who are having concurrent TB treatment will necessitate further PK and pharmacogenetic exploration in both
African and Asian populations. Finally, there is need for research that explores the safety and effect of high R doses on EFV
PK as a strategy towards developing treatment shortening regimens.
Page 85 of 176
DECLARATIONS
Funding source
This systematic review had no funding.
Conflict of Interest
Author AD, Author MB and Author AMT declare that they have no conflict of interest.
References
1. World Health Organization. Global Health Observatory (GHO) data: HIV/AIDS Global situation and Trends. 2016 [cited 2017 13th July]; Available from: http://www.who.int/gho/hiv/en/.
2. World Health Organization. Tuberculosis and HIV. 2014 [cited 2017 12th July]; Available from: http://www.who.int/hiv/topics/tb/about_tb/en/.
3. World Health Organization. Global Tuberculosis Report. . 2016 [cited 2017 21st June ]; Available from: http://www.who.int/tb/publications/global_report/en/.
4. World Health Organization. Consolidated guidelines on the use of antiretroviral drugs for treating and preventing hiv infection: recommendations for a public health approach 2016 [cited 2017 29th July]; 2nd [Available from: http://apps.who.int/iris/bitstream/10665/208825/1/9789241549684_eng.pdf.
5. Nelson LJ., et al., Adoption of national recommendations related to use of antiretroviral therapy before and shortly following the launch of the 2013 WHO consolidated guidelines. AIDS, 2014. 28(Suppl 2): p. S217-224.
6. AIDSinfo. Guidelines for the Use of Antiretroviral Agents in HIV-1-Infected Adults and Adolescents. 2016 28th January 2016 [cited 2016 01/02].
7. Gulick RM., et al., Triple-nucleoside regimens versus efavirenz-containing regimens for the initial treatment of HIV-1 infection. N Engl J Med, 2004. 350: p. 1850-1861.
8. Anon., March 2014 supplement to the 2013 consolidated guidelines on the use of antiretroviral drugs for treating and preventing HIV infection. Recommendations for a public health approach. 2013.
9. Shubber Z., et al., Adverse events associated with nevirapine and efavirenzbased first-line antiretroviral therapy: a systematic review and meta-analysis. AIDS, 2013. 27.: p. 1403-1412.
10. Clinton Health Access Initiative (CHAI). ARV Market Report: The State of the Antiretroviral Drug Market in Low- and Middle-Income Countries, 2014-2019. 2015 [cited 2017 29th July]; Available from: http://www.clintonhealthaccess.org/content/uploads/2015/11/CHAI-ARV-Market-Report-2015_FINAL.pdf.
11. Desta Z., et al., Impact of CYP2B6 polymorphism on hepatic efavirenz metabolism in vitro. Pharmacogenomics., 2007. 8(6): p. 547-58.
12. Ward B.A., et al., The cytochrome P450 2B6 (CYP2B6) is the main catalyst of efavirenz primary and secondary metabolism : implication for HIV/AIDS therapy and utility of efavirenz as a substrate marker of CYP2B6 catalytic activity. J. Pharmacol. Exp. Ther. , 2003. 306: p. 287-300.
Page 86 of 176
13. Kwara A., Ramachandran G., and Swaminathan S., Dose adjustment of the non-nucleoside reverse transcriptase inhibitors during concurrent rifampicin-containing tuberculosis therapy: one size does not fit all. l 6(1):55-68. Expert Opin Drug Metab Toxico, 2010 6(1): p. 55-68.
14. Friedland G, et al., Administration of efavirenz (600 mg/day) with rifampicin results in highly variable levels but excellent clinical outcomes in patients treated for tuberculosis and HIV. J Antimicrob Chemother. , 2006. 58(6): p. 1299-302.
15. Marzolin C., et al., Efavirenz plasma levels can predict treatment failure and central nervous system side effects in HIV-1 infected patients. AIDS, 2001. 15: p. 71-75.
16. Motsinger AA., et al., Multilocus genetic interactions and response to efavirenz-containing regimens: an adult AIDS clinical trials group study. . Pharmacogenet Genomics, 2006. 16(11): p. 837-45.
17. Gounden V., et al., Presence of the CYP2B6 516G> T polymorphism, increased plasma Efavirenz concentrations and early neuropsychiatric side effects in South African HIV-infected patients. . AIDS Res Ther., 2010. 7: p. 32.
18. Chou M, et al., Pharmacokinetics of efavirenz in combination with rifampicin in HIV-infected adults: results of the PECAN (ANRS 121454) study. , in 13th Int.Workshop on Clin.Pharmacology of HIV pharmacology . . 2012.
19. World Health Organization. Treatment of Tuberculosis guidelines. 2016 [cited 2017 30th July]; 4th [Available from: http://apps.who.int/iris/bitstream/10665/44165/1/9789241547833_eng.pdf.
20. World Health Organisation., Treatment of Tuberculosis Guidelines. 2010: Geneva. 21. World Health Organization. Treatment of tuberculosis: Guidelines for treatment of drug-susceptible tuberculosis and patient
care. 2017. 22. Jindani A., N. A.J., and Enarson D.A., Two 8-month regimens of chemotherapy for treatment of newly diagnosed pulmonary
tuberculosis: international multicentre randomised trial. The Lancet, 2004. 364: p. 1244-1251. 23. Mitchison DA., Role of individual drugs in the chemotherapy of tuberculosis. Int J Tuberc Lung Dis, 2000. 4: p. 796-
806. 24. Hartmann G., et al., The specific inhibition of the DNA-directed RNA synthesis by rifamycin. Biochim. Biophys. Acta,
1967. 145: p. 843–844. 25. Jin D. J. and Gross C. A., RpoB8, a rifampicin-resistant termination-proficient RNA polymerase, has an increased Km for
purine nucleotides during transcription elongation. J. Biol. Chem., 1991. 266: p. 14478–14485. 26. Campbell E. A., et al., Structural mechanism for rifampicin inhibition of bacterial rna polymerase. Cell, 2001. 104: p. 901–
912. 27. Piscitelli SC. and Gallicano KD., Interactions among drugs for HIV and opportunistic infections. . N Engl J Med 2001.
344(13): p. 984-96. 28. Sustiva (efavirenz) highlights of prescribinhg information. http://packageinserts bms com/pi/pi_sustiva pdf 12 A.D. March
4. Available from: http://packageinserts.bms.com/pi/pi_sustiva.pdf. 29. World Health Organization., Antiretroviral therapy for HIV infection in adults and adolescents: recommendations for a
public health approach. 2010 rev. . 2010. 30. Manosuthi W., et al., Plasma nevirapine levels and 24-week efficacy in HIV-infected patients receiving nevirapine-based highly
active antiretroviral therapy with or without rifampicin. . Clin Infect Dis., 2006 43(2): p. 253-5. 31. Manosuthi W., et al., Efavirenz 600 mg/day versus efavirenz 800 mg/day in HIV-infected patients with tuberculosis
receiving rifampicin: 48 weeks results. . AIDS, 2006. 20(1): p. 131-2. 32. Orrell C, et al., Efavirenz and rifampicin in the South African context: is there a need to dose-increase efavirenz with concurrent
rifampicin therapy? Antivir Ther. , 2011. 16(4): p. 527-34. 33. Brennan-Benson P., et al., Pharmacokinetic interactions between efavirenz and rifampicin in the treatment of HIV and
tuberculosis: one size does not fit all. . AIDS 2005. 19(14): p. 1541-3. 34. Wen X., et al., Isoniazid is a mechanism-based inhibitor of cytochrome P450 1A2, 2A6, 2C19 and 3A4 isoforms in human
liver microsomes. . Eur J Clin Pharmacol 2002. 57(11): p. 799-804. 35. McIlleron HM., et al., Effects of rifampin-based antituberculosis therapy on plasma efavirenz concentrations in children vary
by CYP2B6 genotype. AIDS. , 2013. 27(12): p. 1933-40. 36. Gengiah TN., et al., The influence of tuberculosis treatment on efavirenz clearance in patients co-infected with HIV and
tuberculosis. Eur J Clin Pharmacol 2012. 68(5): p. 689-95.
Page 87 of 176
37. Bertrand J., et al., Dependence of efavirenz- and rifampicin-isoniazid-based antituberculosis treatment drug-drug interaction on CYP2B6 and NAT2 genetic polymorphisms: ANRS 12154 study in Cambodia. The Journal of infectious diseases, 2013. 209(3): p. 399-408.
38. DiGiacinto J.L., et al., Are Literature References Sufficient for Dose Recommendations? An FDA Case Study of Efavirenz and Rifampin. Journal of Clinical Pharmacology, 2008. 48: p. 518-523.
39. Zanger U.M. and Klein K., Pharmacogenetics of cytochrome P450 2B6 (CYP2B6) : advances on polymorphisms ,mechanisms, and clinical relevance. Frontiers in Genetics, 2013. 4(24): p. 1-12.
40. Lang T., Klein K., and Fischer J, Extensive genetic polymorphism in the human CYP2B6 gene with impact on expression and function in human liver. . Pharmacogenetics. , 2001. 11: p. 399-415.
41. World Health Organization. Use of high burden country lists for TB by WHO in the post-2015 era. . 2015 [cited 2017 15th August]; Available from: http://www.who.int/tb/publications/global_report/high_tb_burdencountrylists2016-2020.pdf?ua=1.
42. Moher D., et al., Preferred reporting items for systematic review and meta-analysis protocols (PRISMA-P) 2015 statement. Systematic Reviews, 2015. 4: p. 1.
43. Tseng A., Seet J., and Phillips E.J., The evolution of three decades of antiretroviral therapy: challenges, triumphs and the promise of the future. British Journal of Clinical Pharmacology, 2014. 79(2): p. 182-194.
44. Yimer G , et al., Pharmacogenetic & pharmacokinetic biomarker for efavirenz based ARV and rifampicin based anti-TB drug induced liver injury in TB-HIV infected patients. PLoS One., 2011. 6(12): p. e27810.
45. Uttayamakul S, et al., Effects of CYP2B6 G516T polymorphisms on plasma efavirenz and nevirapine levels when co-administered with rifampicin in HIV/TB co-infected Thai adults. AIDS Res Ther. , 2010. 7: p. 8.
46. Semvua HH., et al., Efavirenz, tenofovir and emtricitabine combined with first-line tuberculosis treatment in tuberculosis-HIV-coinfected Tanzanian patients: a pharmacokinetic and safety study. Antivir Ther. , 2013. 18(1): p. 105-13.
47. Ren Y, et al., Effect of rifampicin on efavirenz pharmacokinetics in HIV-infected children with tuberculosis. J Acquir Immune Defic Syndr. , 2009. 50(5): p. 439-43.
48. Ramachandran G, et al., Lack of association between plasma levels of non-nucleoside reverse transcriptase inhibitors & virological outcomes during rifampicin co-administration in HIV-infected TB patients. . Indian J Med Res. , 2013. 138(6): p. 955-61.
49. Ngaimisi E, et al., Effect of rifampicin and CYP2B6 genotype on long-term efavirenz autoinduction and plasma exposure in HIV patients with or without tuberculosis. Clin Pharmacol Ther. , 2011. 90(3): p. 406-13.
50. Mukonzo JK., et al., Influence of efavirenz pharmacokinetics and pharmacogenetics on neuropsychological disorders in Ugandan HIV-positive patients with or without tuberculosis: a prospective cohort study. BMC Infect Dis. , 2013. 13: p. 261.
51. Mukonzo JK., et al., CYP2B6 genotype, but not rifampicin-based anti-TB cotreatments, explains variability in long-term efavirenz plasma exposure. Pharmacogenomics. , 2014. 15(11): p. 1423-35.
52. Manosuthi W., et al., Impact of pharmacogenetic markers of CYP2B6, clinical factors, and drug-drug interaction on efavirenz concentrations in HIV/tuberculosis-coinfected patients. Antimicrob Agents Chemother., 2013. 57(2): p. 1019-24.
53. Manosuthi W, et al., A randomized trial comparing plasma drug concentrations and efficacies between 2 nonnucleoside reverse-transcriptase inhibitor-based regimens in HIV-infected patients receiving rifampicin: the N2R Study. Clin Infect Dis. , 2009. 48(12): p. 1752-9.
54. Luetkemeyer AF, et al., Relationship between weight, efavirenz exposure, and virologic suppression in HIV-infected patients on rifampin-based tuberculosis treatment in the AIDS Clinical Trials Group A5221 STRIDE Study. Clin Infect Dis. , 2013. 57(4): p. 586-93.
55. Habtewold A., et al., Is there a need to increase the dose of efavirenz during concomitant rifampicin-based antituberculosis therapy in sub-Saharan Africa? The HIV-TB pharmagene study. Pharmacogenomics. , 2015. 16(10): p. 1047-64.
56. Gengiah TN., et al., Efavirenz dosing: influence of drug metabolizing enzyme polymorphisms and concurrent tuberculosis treatment. Antivir Ther. , 2015. 20(3): p. 297-306.
57. Cohen K, et al., Effect of rifampicin-based antitubercular therapy and the cytochrome P450 2B6 516G>T polymorphism on efavirenz concentrations in adults in South Africa. Antivir Ther. , 2009. 14(5): p. 687-95.
58. Borand L., et al., Plasma concentrations, efficacy and safety of efavirenz in HIV-infected adults treated for tuberculosis in Cambodia (ANRS 1295-CIPRA KH001 CAMELIA trial). PLoS One. , 2014. 9(3): p. e90350. .
Page 88 of 176
59. Bienvenu E., et al., The role of genetic polymorphisms in cytochrome P450 and effects of tuberculosis co-treatment on the predictive value of CYP2B6 SNPs and on efavirenz plasma levels in adult HIV patients. Antiviral Res. , 2014. 102: p. 44-53.
60. Bhatt NB, et al., Nevirapine or efavirenz for tuberculosis and HIV coinfected patients: exposure and virological failure relationship. J Antimicrob Chemother., 2015. 70: p. 225-232.
61. Borand, L., et al., Plasma concentrations of efavirenz with a 600 mg standard dose in Cambodian HIV-infected adults treated for tuberculosis with a body weight above 50 kg. Antiviral Therapy, 2013. 18(3): p. 419-423.
62. Mariana N., et al., Efavirenz Plasma Concentrations and HIV Viral Load in HIV/AIDS-tuberculosis Infection Patients Treated with Rifampicin. Acta Med Indones., 2016. 48(1): p. 10-6.
63. Sustiva., US Prescrition 2004. Princeton, NJ: Bristol-Myer Squibb; 1998. 2004. 64. Friedland G., et al., Administration of efavirenz (600 mg/day) with rifampicin results in highly variable levels but excellent
clinical outcomes in patients treated for tuberculosis and HIV. Journal of Antimicrobial Chemotherapy 2006 58 (6 ): p. 1299-1302
65. Luetkemeyer AF., et al., Combined effect of CYP2B6 and NAT2 genotype on plasma efavirenz exposure during rifampin-based antituberculosis therapy in the STRIDE study. . Clin Infect Dis., 2015. 60(12): p. 1860-3.
66. Helen M., Graeme M., and William B.J., Complications of antiretroviral therapy in patients with tuberculosis: Drug interactions, toxicity, and immune reconstitution inflammatory syndrome. JOURNAL OF INFECTIOUS DISEASES, 2007. 196(Supplement: 1): p. S63-S75.
67. Yang X., et al., Systematic genetic and genomic analysis of cytochrome P450 enzyme activities in human liver. . Genome Res. , 2010. 20: p. 1020-1036.
68. Dhoro M., et al., CYP2B6*6, CYP2B6*18, Body weight and sex are predictors of efavirenz pharmacokinetics and treatment response: population pharmacokinetic modeling in an HIV/AIDS and TB cohort in Zimbabwe. . BMC Pharmacol Toxicol., 2015. 16: p. 4.
69. Dickinson L., et al., Pharmacokinetic and Pharmacodynamic Comparison of Once-Daily Efavirenz (400 mg vs. 600 mg) in treatment-Naıve HIV-Infected Patients: Results of the ENCORE1 Study. Clinical Pharmacology & Therapeutics, 2015. 98(4): p. 406-416.
70. Haas D.W., et al., Pharmacogenetics of efavirenz and central nervous system side effects : an Adult AIDS Clinical Trials Group study. AIDS, 2004. 18: p. 2391-2400.
71. Dube B., et al., Neuropsychiatric manifestations of HIV Infection and AIDS. J Psychiatry Neurosci, 2005. 30(4): p. 237-46.
72. Ciesla J. A. and Roberts J. E., Meta-Analysis of the Relationship Between HIV Infection and Risk for Depressive Disorders The American Journal of Psychiatry, 2001. 158(5): p. 725-730.
73. Leger P., et al., Pharmacogenetics of efavirenz discontinuation for reported central nervous system symptoms appears to differ by race. . Pharmacogenet Genomics., 2016. 26(10): p. 473-80.
74. Dooley KE., et al., Phamacokinetics of efavirenz and treatment of HIV-1 among pregnant women with and without tuberculosis coinfection. . J Infect Dis., 2015. 211(2): p. 197-205.
75. Dooley KE., Sayre P., and Borland J., Safety, tolerability, and pharmacokinetics of the HIV integrase inhibitor dolutegravir given twice daily with rifampin or once daily with rifabutin: results of a phase 1 study among healthy subjects. J Acquir Immune Defic Syndr, 2013. 62: p. 21 – 27.
76. Puls R., et al., Effi cacy of 400 mg efavirenz versus standard 600 mg dose in HIV-infected, antiretroviral-naive adults (ENCORE1): a randomised, double-blind, placebo-controlled, non-inferiority trial. Lancet, 2014. 383: p. 1474-82.
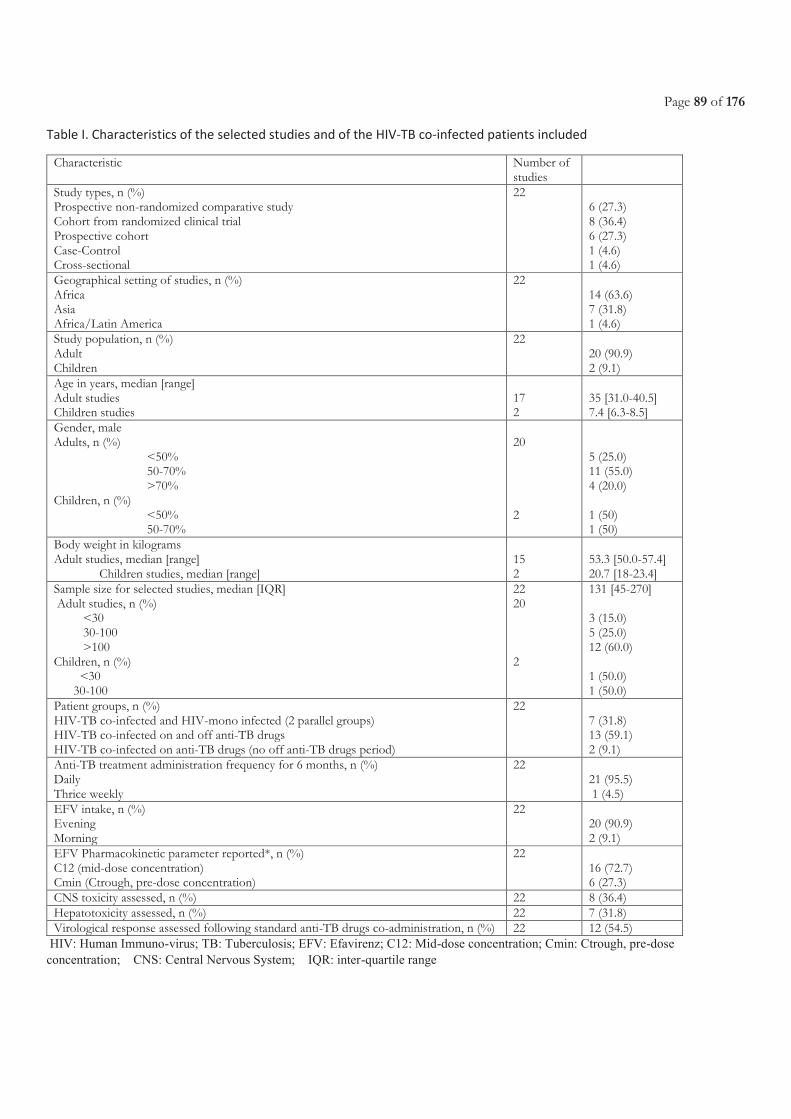
Page 89 of 176
Table I. Characteristics of the selected studies and of the HIV-TB co-infected patients included
Characteristic Number of studies
Study types, n (%) Prospective non-randomized comparative study Cohort from randomized clinical trial Prospective cohort Case-Control Cross-sectional
22 6 (27.3) 8 (36.4) 6 (27.3) 1 (4.6) 1 (4.6)
Geographical setting of studies, n (%) Africa Asia Africa/Latin America
22 14 (63.6) 7 (31.8) 1 (4.6)
Study population, n (%) Adult Children
22 20 (90.9) 2 (9.1)
Age in years, median [range] Adult studies Children studies
17 2
35 [31.0-40.5] 7.4 [6.3-8.5]
Gender, male Adults, n (%)
<50% 50-70% >70%
Children, n (%) <50% 50-70%
20 2
5 (25.0) 11 (55.0) 4 (20.0) 1 (50) 1 (50)
Body weight in kilograms Adult studies, median [range] Children studies, median [range]
15 2
53.3 [50.0-57.4] 20.7 [18-23.4]
Sample size for selected studies, median [IQR] Adult studies, n (%) <30 30-100 >100 Children, n (%) <30 30-100
22 20 2
131 [45-270] 3 (15.0) 5 (25.0) 12 (60.0) 1 (50.0) 1 (50.0)
Patient groups, n (%) HIV-TB co-infected and HIV-mono infected (2 parallel groups) HIV-TB co-infected on and off anti-TB drugs HIV-TB co-infected on anti-TB drugs (no off anti-TB drugs period)
22 7 (31.8) 13 (59.1) 2 (9.1)
Anti-TB treatment administration frequency for 6 months, n (%) Daily Thrice weekly
22
21 (95.5) 1 (4.5)
EFV intake, n (%) Evening Morning
22 20 (90.9) 2 (9.1)
EFV Pharmacokinetic parameter reported*, n (%) C12 (mid-dose concentration) Cmin (Ctrough, pre-dose concentration)
22 16 (72.7) 6 (27.3)
CNS toxicity assessed, n (%) 22 8 (36.4) Hepatotoxicity assessed, n (%) 22 7 (31.8) Virological response assessed following standard anti-TB drugs co-administration, n (%) 22 12 (54.5)
HIV: Human Immuno-virus; TB: Tuberculosis; EFV: Efavirenz; C12: Mid-dose concentration; Cmin: Ctrough, pre-dose
concentration; CNS: Central Nervous System; IQR: inter-quartile range
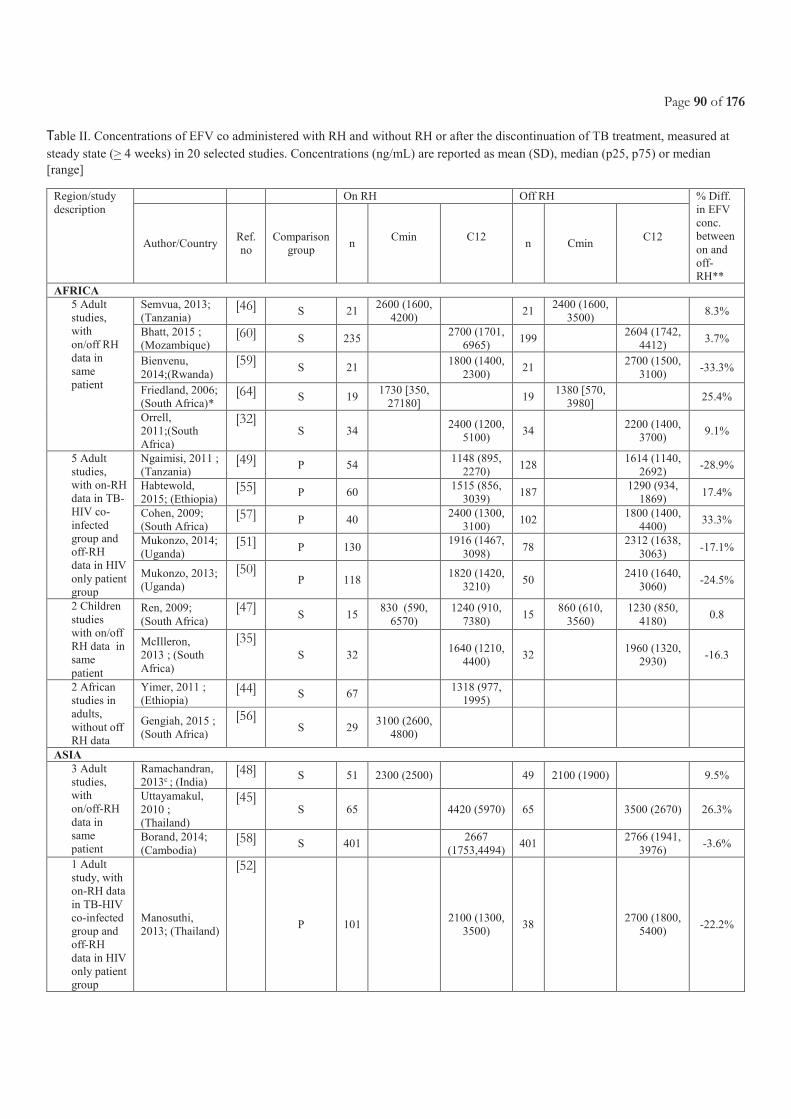
Page 90 of 176
Table II. Concentrations of EFV co administered with RH and without RH or after the discontinuation of TB treatment, measured at
steady state (> 4 weeks) in 20 selected studies. Concentrations (ng/mL) are reported as mean (SD), median (p25, p75) or median
[range]
Region/study
description
On RH Off RH % Diff.
in EFV
conc.
between
on and
off-
RH**
Author/Country Ref.
no
Comparison
group n
Cmin
C12
n Cmin
C12
AFRICA
5 Adult
studies,
with
on/off RH
data in
same
patient
Semvua, 2013;
(Tanzania) [46] S 21
2600 (1600,
4200) 21
2400 (1600,
3500) 8.3%
Bhatt, 2015 ;
(Mozambique) [60] S 235
2700 (1701,
6965) 199
2604 (1742,
4412) 3.7%
Bienvenu,
2014;(Rwanda)
[59] S 21
1800 (1400,
2300) 21
2700 (1500,
3100) -33.3%
Friedland, 2006;
(South Africa)* [64] S 19
1730 [350,
27180] 19
1380 [570,
3980] 25.4%
Orrell,
2011;(South
Africa)
[32] S 34
2400 (1200,
5100) 34
2200 (1400,
3700) 9.1%
5 Adult
studies,
with on-RH
data in TB-
HIV co-
infected
group and
off-RH
data in HIV
only patient
group
Ngaimisi, 2011 ;
(Tanzania) [49] P 54
1148 (895,
2270) 128
1614 (1140,
2692) -28.9%
Habtewold,
2015; (Ethiopia) [55] P 60
1515 (856,
3039) 187
1290 (934,
1869) 17.4%
Cohen, 2009;
(South Africa) [57] P 40
2400 (1300,
3100) 102
1800 (1400,
4400) 33.3%
Mukonzo, 2014;
(Uganda) [51] P 130 1916 (1467,
3098) 78
2312 (1638,
3063) -17.1%
Mukonzo, 2013;
(Uganda)
[50] P 118 1820 (1420,
3210) 50
2410 (1640,
3060) -24.5%
2 Children
studies
with on/off
RH data in
same
patient
Ren, 2009;
(South Africa)
[47] S 15
830 (590,
6570)
1240 (910,
7380) 15
860 (610,
3560)
1230 (850,
4180) 0.8
McIlleron,
2013 ; (South
Africa)
[35] S 32
1640 (1210,
4400) 32
1960 (1320,
2930) -16.3
2 African
studies in
adults,
without off
RH data
Yimer, 2011 ;
(Ethiopia) [44] S 67
1318 (977,
1995)
Gengiah, 2015 ;
(South Africa)
[56] S 29
3100 (2600,
4800)
ASIA
3 Adult
studies,
with
on/off-RH
data in
same
patient
Ramachandran,
2013c ; (India) [48] S 51 2300 (2500) 49 2100 (1900) 9.5%
Uttayamakul,
2010 ;
(Thailand)
[45] S 65 4420 (5970) 65 3500 (2670) 26.3%
Borand, 2014;
(Cambodia) [58] S 401
2667
(1753,4494) 401
2766 (1941,
3976) -3.6%
1 Adult
study, with
on-RH data
in TB-HIV
co-infected
group and
off-RH
data in HIV
only patient
group
Manosuthi,
2013; (Thailand)
[52]
P 101 2100 (1300,
3500) 38
2700 (1800,
5400) -22.2%
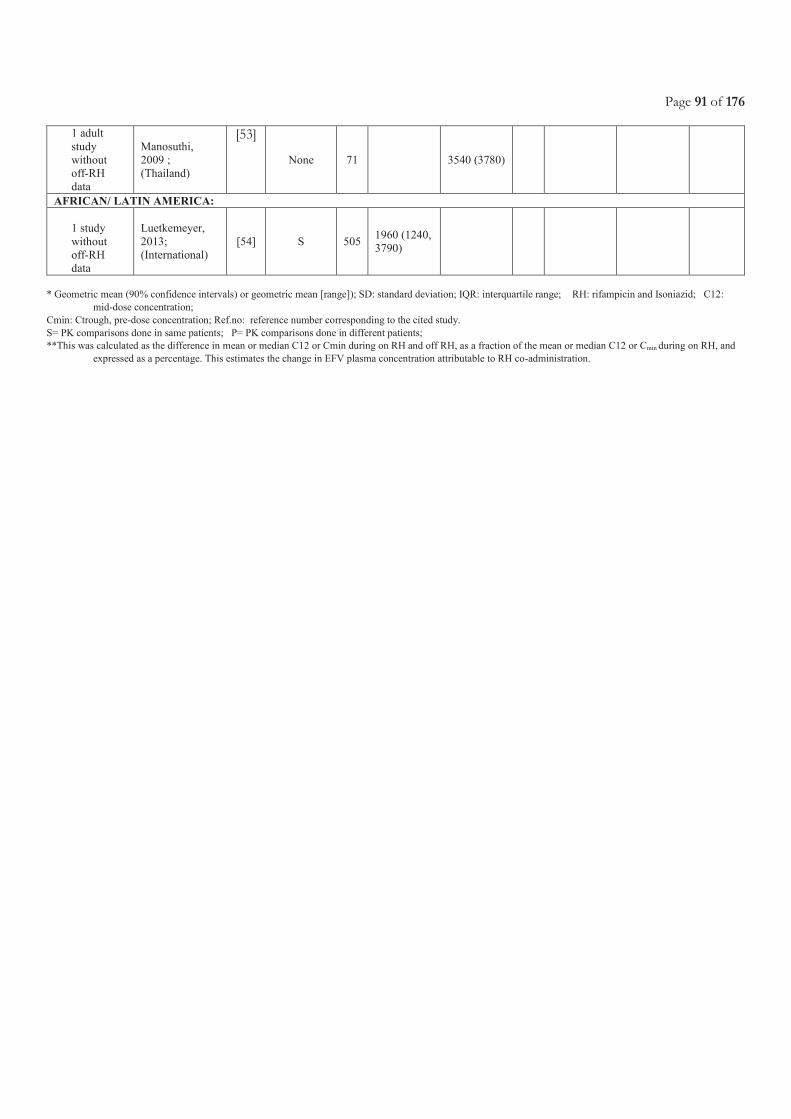
Page 91 of 176
1 adult
study
without
off-RH
data
Manosuthi,
2009 ;
(Thailand)
[53]
None 71 3540 (3780)
AFRICAN/ LATIN AMERICA:
1 study
without
off-RH
data
Luetkemeyer,
2013;
(International)
[54] S 505 1960 (1240,
3790)
* Geometric mean (90% confidence intervals) or geometric mean [range]); SD: standard deviation; IQR: interquartile range; RH: rifampicin and Isoniazid; C12:
mid-dose concentration;
Cmin: Ctrough, pre-dose concentration; Ref.no: reference number corresponding to the cited study.
S= PK comparisons done in same patients; P= PK comparisons done in different patients;
**This was calculated as the difference in mean or median C12 or Cmin during on RH and off RH, as a fraction of the mean or median C12 or Cmin during on RH, and
expressed as a percentage. This estimates the change in EFV plasma concentration attributable to RH co-administration.
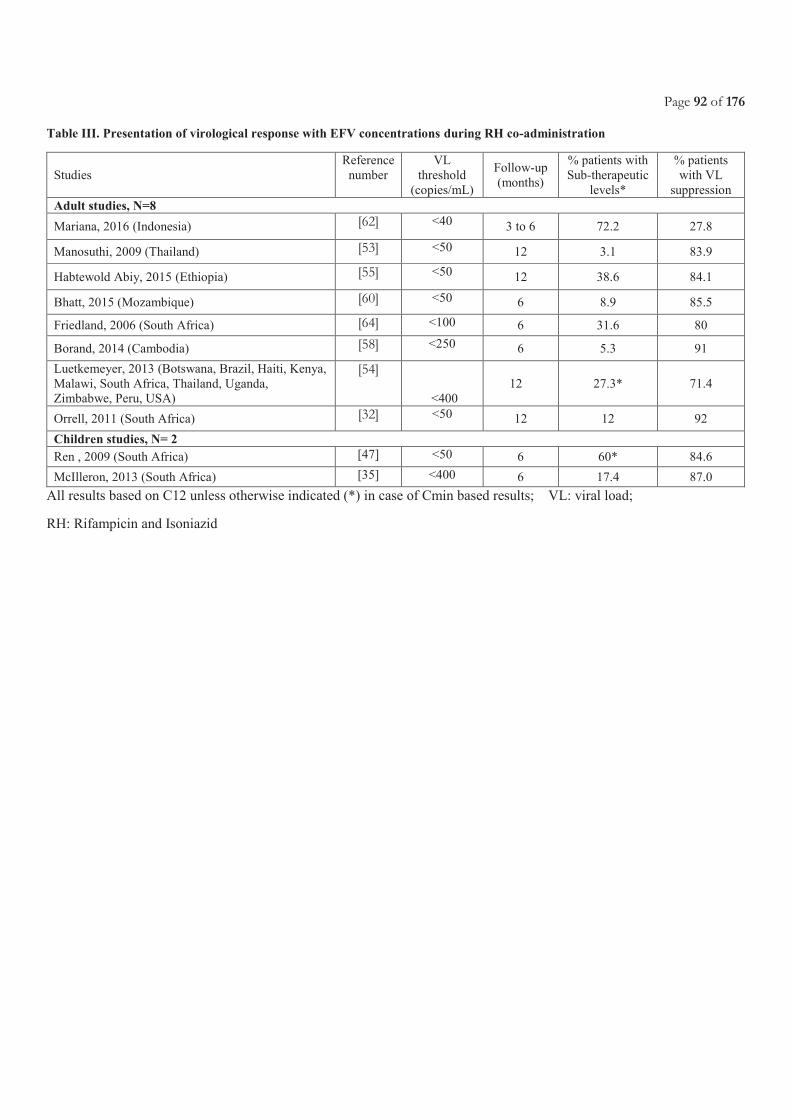
Page 92 of 176
Table III. Presentation of virological response with EFV concentrations during RH co-administration
Studies
Reference
number
VL
threshold
(copies/mL)
Follow-up
(months)
% patients with
Sub-therapeutic
levels*
% patients
with VL
suppression
Adult studies, N=8
Mariana, 2016 (Indonesia) [62] <40 3 to 6 72.2 27.8
Manosuthi, 2009 (Thailand) [53] <50 12 3.1 83.9
Habtewold Abiy, 2015 (Ethiopia) [55] <50 12 38.6 84.1
Bhatt, 2015 (Mozambique) [60] <50 6 8.9 85.5
Friedland, 2006 (South Africa) [64] <100 6 31.6 80
Borand, 2014 (Cambodia) [58] <250 6 5.3 91
Luetkemeyer, 2013 (Botswana, Brazil, Haiti, Kenya,
Malawi, South Africa, Thailand, Uganda,
Zimbabwe, Peru, USA)
[54]
<400
12 27.3* 71.4
Orrell, 2011 (South Africa) [32] <50 12 12 92
Children studies, N= 2
Ren , 2009 (South Africa) [47] <50 6 60* 84.6
McIlleron, 2013 (South Africa) [35] <400 6 17.4 87.0
All results based on C12 unless otherwise indicated (*) in case of Cmin based results; VL: viral load;
RH: Rifampicin and Isoniazid
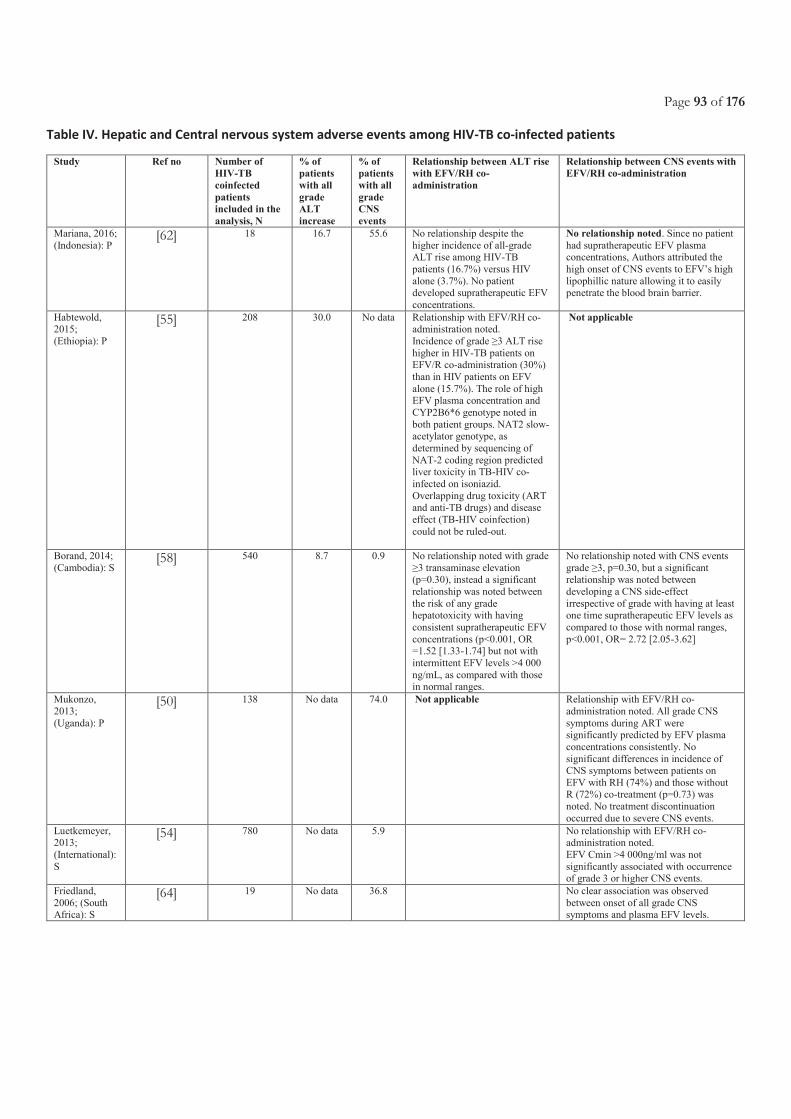
Page 93 of 176
Table IV. Hepatic and Central nervous system adverse events among HIV-TB co-infected patients
Study Ref no Number of
HIV-TB
coinfected
patients
included in the
analysis, N
% of
patients
with all
grade
ALT
increase
% of
patients
with all
grade
CNS
events
Relationship between ALT rise
with EFV/RH co-
administration
Relationship between CNS events with
EFV/RH co-administration
Mariana, 2016;
(Indonesia): P [62] 18 16.7 55.6 No relationship despite the
higher incidence of all-grade ALT rise among HIV-TB
patients (16.7%) versus HIV
alone (3.7%). No patient developed supratherapeutic EFV
concentrations.
No relationship noted. Since no patient
had supratherapeutic EFV plasma concentrations, Authors attributed the
high onset of CNS events to EFV’s high
lipophillic nature allowing it to easily penetrate the blood brain barrier.
Habtewold, 2015;
(Ethiopia): P
[55] 208 30.0 No data Relationship with EFV/RH co-administration noted.
Incidence of grade ≥3 ALT rise
higher in HIV-TB patients on EFV/R co-administration (30%)
than in HIV patients on EFV
alone (15.7%). The role of high EFV plasma concentration and
CYP2B6*6 genotype noted in
both patient groups. NAT2 slow-acetylator genotype, as
determined by sequencing of
NAT-2 coding region predicted liver toxicity in TB-HIV co-
infected on isoniazid.
Overlapping drug toxicity (ART and anti-TB drugs) and disease
effect (TB-HIV coinfection)
could not be ruled-out.
Not applicable
Borand, 2014;
(Cambodia): S [58] 540 8.7 0.9 No relationship noted with grade
≥3 transaminase elevation (p=0.30), instead a significant
relationship was noted between
the risk of any grade hepatotoxicity with having
consistent supratherapeutic EFV
concentrations (p<0.001, OR =1.52 [1.33-1.74] but not with
intermittent EFV levels >4 000
ng/mL, as compared with those in normal ranges.
No relationship noted with CNS events
grade ≥3, p=0.30, but a significant relationship was noted between
developing a CNS side-effect
irrespective of grade with having at least one time supratherapeutic EFV levels as
compared to those with normal ranges,
p<0.001, OR= 2.72 [2.05-3.62]
Mukonzo,
2013;
(Uganda): P
[50] 138 No data 74.0 Not applicable Relationship with EFV/RH co-
administration noted. All grade CNS
symptoms during ART were significantly predicted by EFV plasma
concentrations consistently. No
significant differences in incidence of CNS symptoms between patients on
EFV with RH (74%) and those without R (72%) co-treatment (p=0.73) was
noted. No treatment discontinuation
occurred due to severe CNS events.
Luetkemeyer, 2013;
(International):
S
[54] 780 No data 5.9 No relationship with EFV/RH co-administration noted.
EFV Cmin >4 000ng/ml was not
significantly associated with occurrence of grade 3 or higher CNS events.
Friedland,
2006; (South Africa): S
[64] 19 No data 36.8 No clear association was observed
between onset of all grade CNS symptoms and plasma EFV levels.
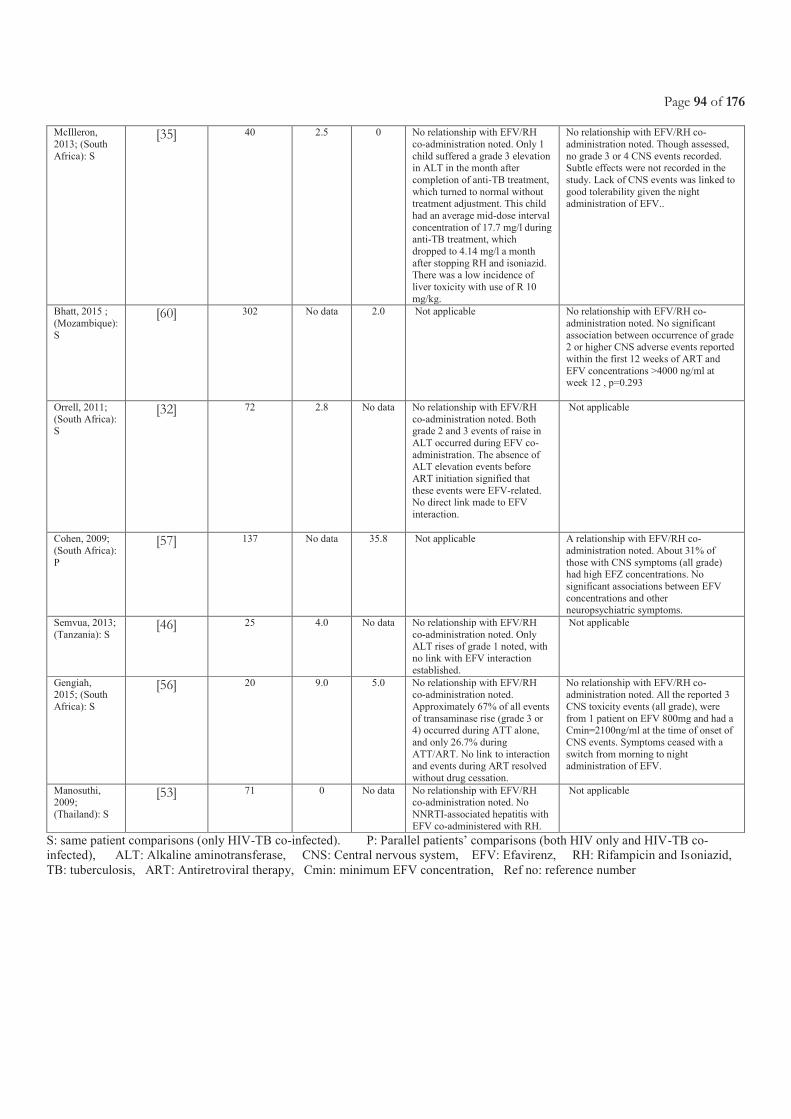
Page 94 of 176
McIlleron,
2013; (South
Africa): S
[35] 40 2.5 0 No relationship with EFV/RH
co-administration noted. Only 1
child suffered a grade 3 elevation in ALT in the month after
completion of anti-TB treatment,
which turned to normal without treatment adjustment. This child
had an average mid-dose interval
concentration of 17.7 mg/l during anti-TB treatment, which
dropped to 4.14 mg/l a month
after stopping RH and isoniazid. There was a low incidence of
liver toxicity with use of R 10
mg/kg.
No relationship with EFV/RH co-
administration noted. Though assessed,
no grade 3 or 4 CNS events recorded. Subtle effects were not recorded in the
study. Lack of CNS events was linked to
good tolerability given the night administration of EFV..
Bhatt, 2015 ;
(Mozambique):
S
[60] 302 No data 2.0 Not applicable No relationship with EFV/RH co-
administration noted. No significant
association between occurrence of grade 2 or higher CNS adverse events reported
within the first 12 weeks of ART and
EFV concentrations >4000 ng/ml at
week 12 , p=0.293
Orrell, 2011;
(South Africa): S
[32] 72 2.8 No data No relationship with EFV/RH
co-administration noted. Both grade 2 and 3 events of raise in
ALT occurred during EFV co-
administration. The absence of ALT elevation events before
ART initiation signified that
these events were EFV-related. No direct link made to EFV
interaction.
Not applicable
Cohen, 2009;
(South Africa):
P
[57] 137 No data 35.8 Not applicable A relationship with EFV/RH co-
administration noted. About 31% of
those with CNS symptoms (all grade) had high EFZ concentrations. No
significant associations between EFV
concentrations and other
neuropsychiatric symptoms.
Semvua, 2013;
(Tanzania): S [46] 25 4.0 No data No relationship with EFV/RH
co-administration noted. Only ALT rises of grade 1 noted, with
no link with EFV interaction
established.
Not applicable
Gengiah, 2015; (South
Africa): S
[56] 20 9.0 5.0 No relationship with EFV/RH co-administration noted.
Approximately 67% of all events
of transaminase rise (grade 3 or 4) occurred during ATT alone,
and only 26.7% during
ATT/ART. No link to interaction and events during ART resolved
without drug cessation.
No relationship with EFV/RH co-administration noted. All the reported 3
CNS toxicity events (all grade), were
from 1 patient on EFV 800mg and had a Cmin=2100ng/ml at the time of onset of
CNS events. Symptoms ceased with a
switch from morning to night administration of EFV.
Manosuthi, 2009;
(Thailand): S
[53] 71 0 No data No relationship with EFV/RH co-administration noted. No
NNRTI-associated hepatitis with
EFV co-administered with RH.
Not applicable
S: same patient comparisons (only HIV-TB co-infected). P: Parallel patients’ comparisons (both HIV only and HIV-TB co-
infected), ALT: Alkaline aminotransferase, CNS: Central nervous system, EFV: Efavirenz, RH: Rifampicin and Isoniazid,
TB: tuberculosis, ART: Antiretroviral therapy, Cmin: minimum EFV concentration, Ref no: reference number
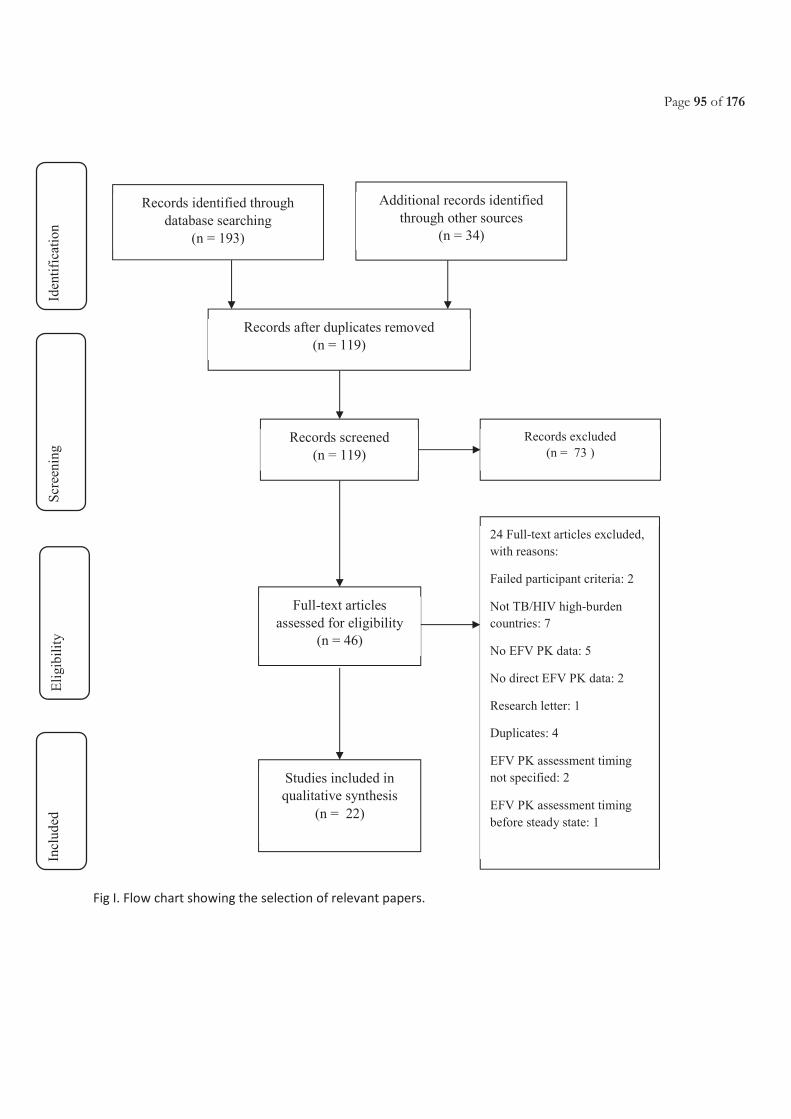
Page 95 of 176
Fig I. Flow chart showing the selection of relevant papers.
Records identified through
database searching
(n = 193)
Scr
een
ing
Incl
ud
ed
Eli
gib
ilit
y
Iden
tifi
cati
on
Additional records identified
through other sources
(n = 34)
Records after duplicates removed
(n = 119)
Records screened
(n = 119)
Records excluded
(n = 73 )
Full-text articles
assessed for eligibility
(n = 46)
24 Full-text articles excluded,
with reasons:
Failed participant criteria: 2
Not TB/HIV high-burden
countries: 7
No EFV PK data: 5
No direct EFV PK data: 2
Research letter: 1
Duplicates: 4
EFV PK assessment timing
not specified: 2
EFV PK assessment timing
before steady state: 1
Studies included in
qualitative synthesis
(n = 22)
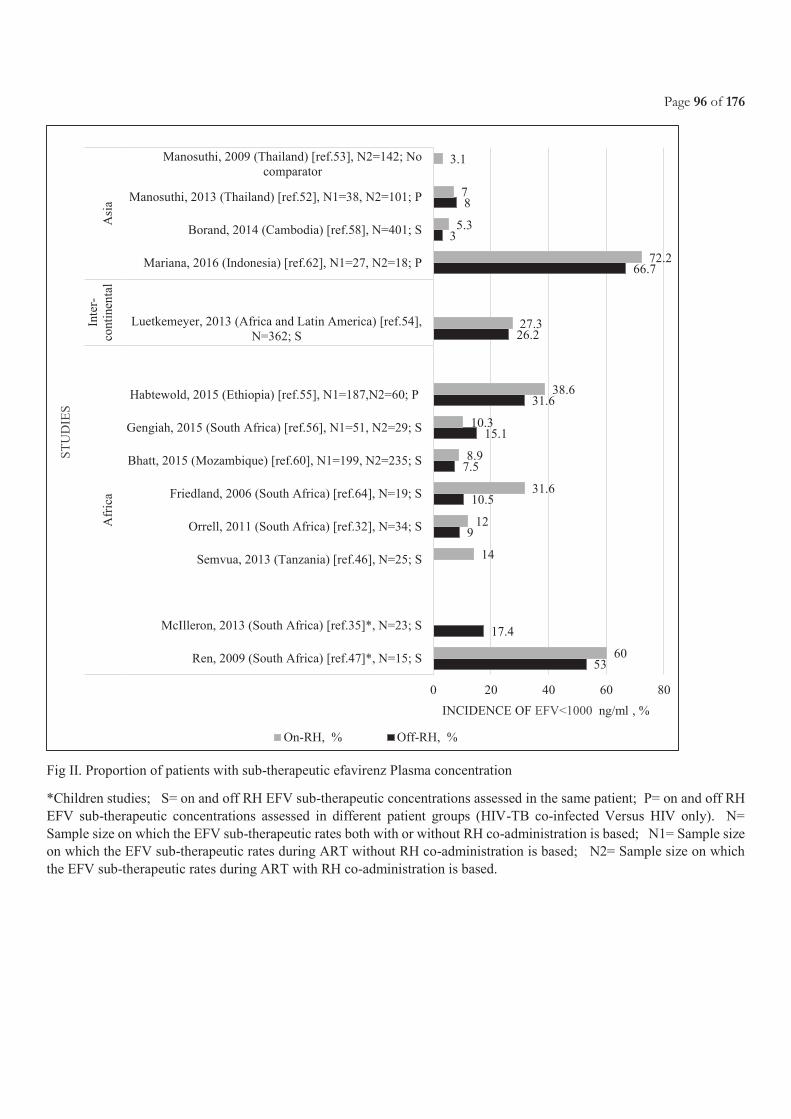
Page 96 of 176
Fig II. Proportion of patients with sub-therapeutic efavirenz Plasma concentration
*Children studies; S= on and off RH EFV sub-therapeutic concentrations assessed in the same patient; P= on and off RH
EFV sub-therapeutic concentrations assessed in different patient groups (HIV-TB co-infected Versus HIV only). N=
Sample size on which the EFV sub-therapeutic rates both with or without RH co-administration is based; N1= Sample size
on which the EFV sub-therapeutic rates during ART without RH co-administration is based; N2= Sample size on which
the EFV sub-therapeutic rates during ART with RH co-administration is based.
53
17.4
9
10.5
7.5
15.1
31.6
26.2
66.7
3
8
60
14
12
31.6
8.9
10.3
38.6
27.3
72.2
5.3
7
3.1
0 20 40 60 80
Ren, 2009 (South Africa) [ref.47]*, N=15; S
McIlleron, 2013 (South Africa) [ref.35]*, N=23; S
Semvua, 2013 (Tanzania) [ref.46], N=25; S
Orrell, 2011 (South Africa) [ref.32], N=34; S
Friedland, 2006 (South Africa) [ref.64], N=19; S
Bhatt, 2015 (Mozambique) [ref.60], N1=199, N2=235; S
Gengiah, 2015 (South Africa) [ref.56], N1=51, N2=29; S
Habtewold, 2015 (Ethiopia) [ref.55], N1=187,N2=60; P
Luetkemeyer, 2013 (Africa and Latin America) [ref.54],
N=362; S
Mariana, 2016 (Indonesia) [ref.62], N1=27, N2=18; P
Borand, 2014 (Cambodia) [ref.58], N=401; S
Manosuthi, 2013 (Thailand) [ref.52], N1=38, N2=101; P
Manosuthi, 2009 (Thailand) [ref.53], N2=142; No
comparator
Afr
ica
Inte
r-
conti
nen
tal
Asi
a
INCIDENCE OF EFV<1000 ng/ml , %
ST
UD
IES
On-RH, % Off-RH, %
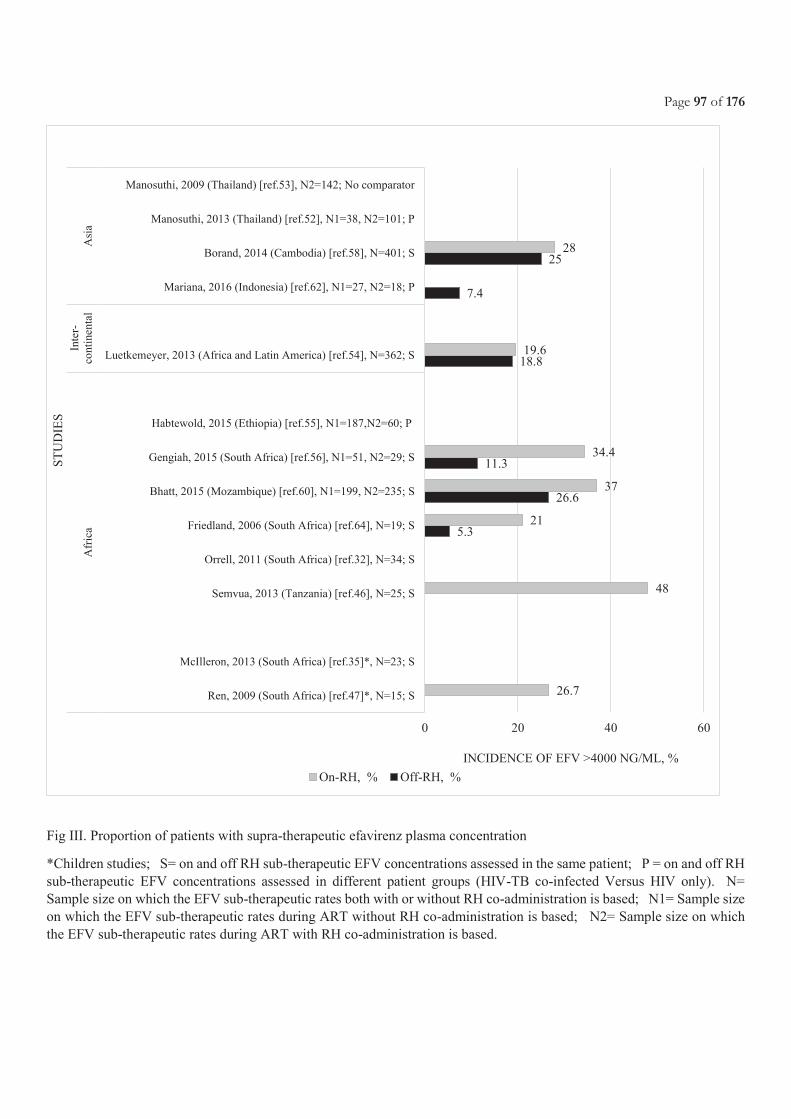
Page 97 of 176
Fig III. Proportion of patients with supra-therapeutic efavirenz plasma concentration
*Children studies; S= on and off RH sub-therapeutic EFV concentrations assessed in the same patient; P = on and off RH
sub-therapeutic EFV concentrations assessed in different patient groups (HIV-TB co-infected Versus HIV only). N=
Sample size on which the EFV sub-therapeutic rates both with or without RH co-administration is based; N1= Sample size
on which the EFV sub-therapeutic rates during ART without RH co-administration is based; N2= Sample size on which
the EFV sub-therapeutic rates during ART with RH co-administration is based.
5.3
26.6
11.3
18.8
7.4
25
26.7
48
21
37
34.4
19.6
28
0 20 40 60
Ren, 2009 (South Africa) [ref.47]*, N=15; S
McIlleron, 2013 (South Africa) [ref.35]*, N=23; S
Semvua, 2013 (Tanzania) [ref.46], N=25; S
Orrell, 2011 (South Africa) [ref.32], N=34; S
Friedland, 2006 (South Africa) [ref.64], N=19; S
Bhatt, 2015 (Mozambique) [ref.60], N1=199, N2=235; S
Gengiah, 2015 (South Africa) [ref.56], N1=51, N2=29; S
Habtewold, 2015 (Ethiopia) [ref.55], N1=187,N2=60; P
Luetkemeyer, 2013 (Africa and Latin America) [ref.54], N=362; S
Mariana, 2016 (Indonesia) [ref.62], N1=27, N2=18; P
Borand, 2014 (Cambodia) [ref.58], N=401; S
Manosuthi, 2013 (Thailand) [ref.52], N1=38, N2=101; P
Manosuthi, 2009 (Thailand) [ref.53], N2=142; No comparator
Afr
ica
Inte
r-
conti
nen
tal
Asi
a
INCIDENCE OF EFV >4000 NG/ML, %
ST
UD
IES
On-RH, % Off-RH, %
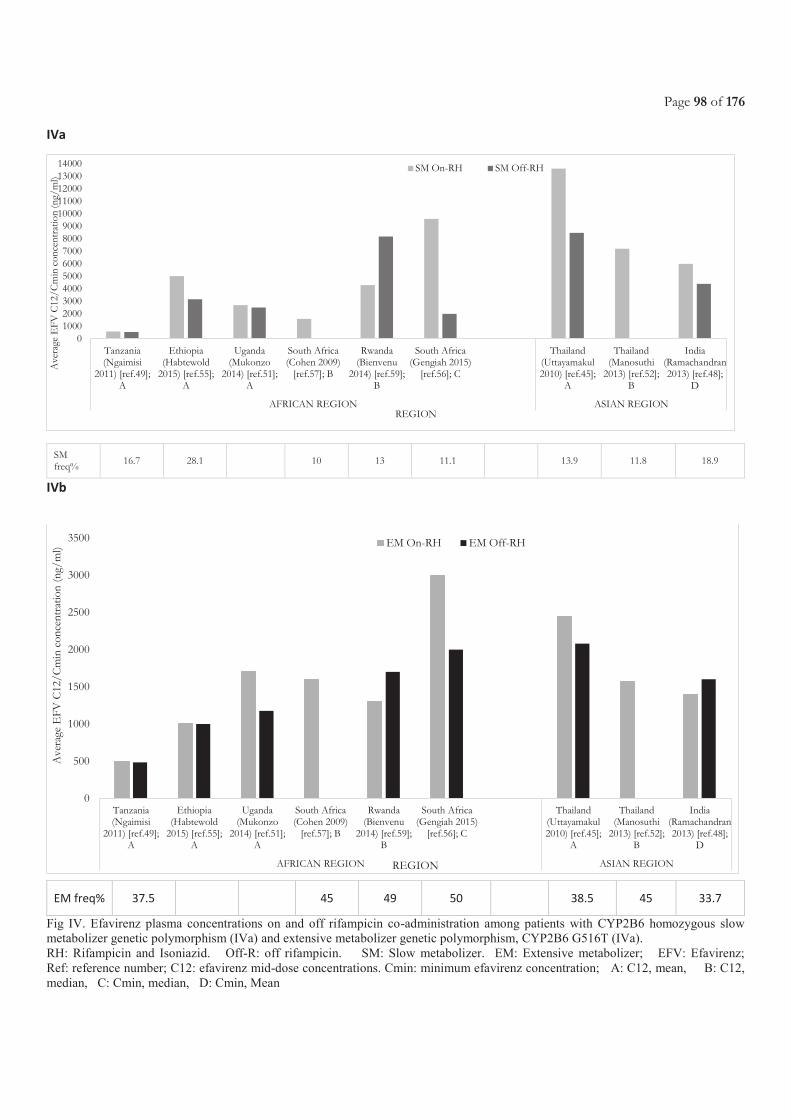
Page 98 of 176
IVa
IVb
Fig IV. Efavirenz plasma concentrations on and off rifampicin co-administration among patients with CYP2B6 homozygous slow
metabolizer genetic polymorphism (IVa) and extensive metabolizer genetic polymorphism, CYP2B6 G516T (IVa).
RH: Rifampicin and Isoniazid. Off-R: off rifampicin. SM: Slow metabolizer. EM: Extensive metabolizer; EFV: Efavirenz;
Ref: reference number; C12: efavirenz mid-dose concentrations. Cmin: minimum efavirenz concentration; A: C12, mean, B: C12,
median, C: Cmin, median, D: Cmin, Mean
0100020003000400050006000700080009000
1000011000120001300014000
Tanzania(Ngaimisi
2011) [ref.49];A
Ethiopia(Habtewold
2015) [ref.55];A
Uganda(Mukonzo
2014) [ref.51];A
South Africa(Cohen 2009)
[ref.57]; B
Rwanda(Bienvenu
2014) [ref.59];B
South Africa(Gengiah 2015)
[ref.56]; C
Thailand(Uttayamakul2010) [ref.45];
A
Thailand(Manosuthi
2013) [ref.52];B
India(Ramachandran2013) [ref.48];
D
AFRICAN REGION ASIAN REGION
Ave
rage
EF
V C
12/C
min
con
cent
ratio
n (n
g/m
l)
REGION
SM On-RH SM Off-RH
0
500
1000
1500
2000
2500
3000
3500
Tanzania(Ngaimisi
2011) [ref.49];A
Ethiopia(Habtewold
2015) [ref.55];A
Uganda(Mukonzo
2014) [ref.51];A
South Africa(Cohen 2009)
[ref.57]; B
Rwanda(Bienvenu
2014) [ref.59];B
South Africa(Gengiah 2015)
[ref.56]; C
Thailand(Uttayamakul2010) [ref.45];
A
Thailand(Manosuthi
2013) [ref.52];B
India(Ramachandran2013) [ref.48];
D
AFRICAN REGION ASIAN REGION
Ave
rage
EF
V C
12/C
min
con
cent
ratio
n (n
g/m
l)
REGION
EM On-RH EM Off-RH
SM freq%
16.7 28.1 10 13 11.1 13.9 11.8 18.9
EM freq% 37.5
45 49 50
38.5 45 33.7
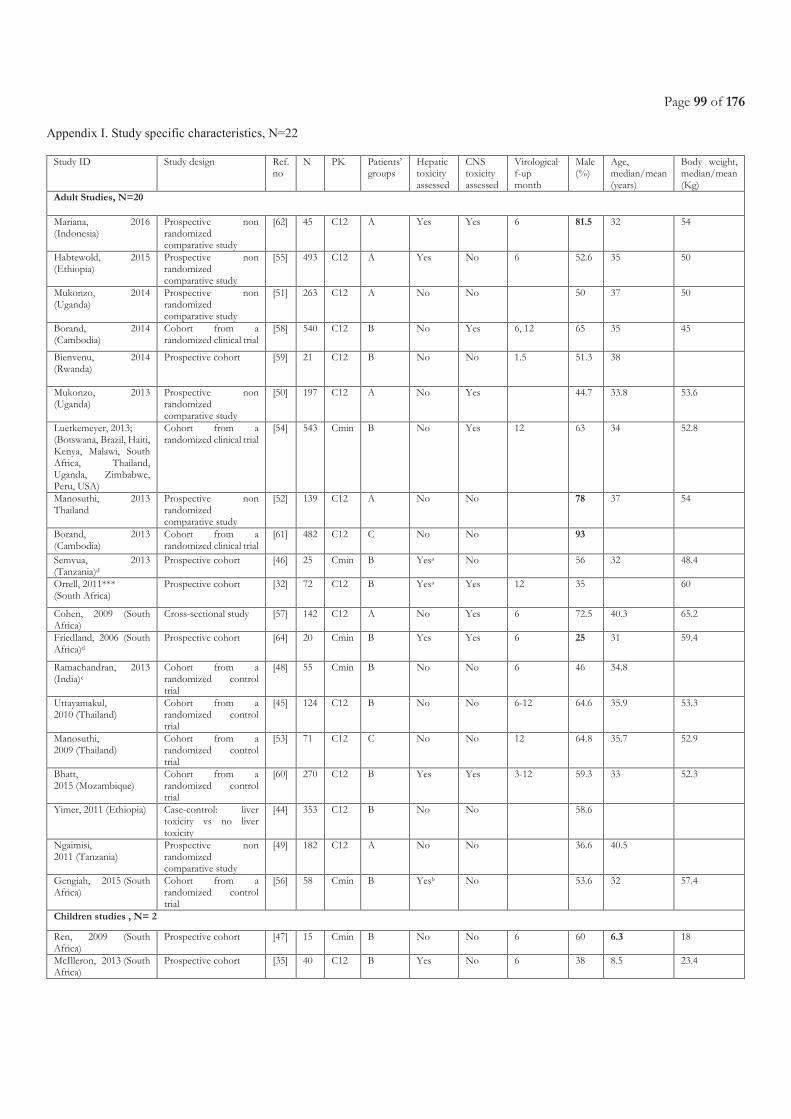
Page 99 of 176
Appendix I. Study specific characteristics, N=22
Study ID Study design Ref.
no N PK Patients’
groups Hepatic toxicity assessed
CNS toxicity assessed
Virological f-up month
Male (%)
Age, median/mean (years)
Body weight, median/mean (Kg)
Adult Studies, N=20
Mariana, 2016 (Indonesia)
Prospective non randomized comparative study
[62] 45 C12 A Yes Yes 6 81.5 32 54
Habtewold, 2015 (Ethiopia)
Prospective non randomized comparative study
[55] 493 C12 A Yes No 6 52.6 35 50
Mukonzo, 2014 (Uganda)
Prospective non randomized comparative study
[51] 263 C12 A No No
50 37 50
Borand, 2014 (Cambodia)
Cohort from a randomized clinical trial
[58] 540 C12 B No Yes 6, 12 65 35 45
Bienvenu, 2014 (Rwanda)
Prospective cohort [59] 21 C12 B No No 1.5 51.3 38
Mukonzo, 2013 (Uganda)
Prospective non randomized comparative study
[50] 197 C12 A No Yes
44.7 33.8 53.6
Luetkemeyer, 2013; (Botswana, Brazil, Haiti, Kenya, Malawi, South Africa, Thailand, Uganda, Zimbabwe, Peru, USA)
Cohort from a randomized clinical trial
[54] 543 Cmin B No Yes 12 63 34 52.8
Manosuthi, 2013 Thailand
Prospective non randomized comparative study
[52] 139 C12 A No No
78 37 54
Borand, 2013 (Cambodia)
Cohort from a randomized clinical trial
[61] 482 C12 C No No
93
Semvua, 2013 (Tanzania)d
Prospective cohort [46] 25 Cmin B Yesa No
56 32 48.4
Orrell, 2011*** (South Africa)
Prospective cohort [32] 72 C12 B Yesa Yes 12 35 60
Cohen, 2009 (South Africa)
Cross-sectional study [57] 142 C12 A No Yes 6 72.5 40.3 65.2
Friedland, 2006 (South Africa)d
Prospective cohort [64] 20 Cmin B Yes Yes 6 25 31 59.4
Ramachandran, 2013
(India)c Cohort from a randomized control trial
[48] 55 Cmin B No No 6 46 34.8
Uttayamakul, 2010 (Thailand)
Cohort from a randomized control trial
[45] 124 C12 B No No 6-12 64.6 35.9 53.3
Manosuthi, 2009 (Thailand)
Cohort from a randomized control trial
[53] 71 C12 C No No 12 64.8 35.7 52.9
Bhatt, 2015 (Mozambique)
Cohort from a randomized control trial
[60] 270 C12 B Yes Yes 3-12 59.3 33 52.3
Yimer, 2011 (Ethiopia) Case-control: liver toxicity vs no liver toxicity
[44] 353 C12 B No No 58.6
Ngaimisi, 2011 (Tanzania)
Prospective non randomized comparative study
[49] 182 C12 A No No 36.6 40.5
Gengiah, 2015 (South Africa)
Cohort from a randomized control trial
[56] 58 Cmin B Yesb No 53.6 32 57.4
Children studies , N= 2
Ren, 2009 (South Africa)
Prospective cohort [47] 15 Cmin B No No 6 60 6.3 18
McIlleron, 2013 (South Africa)
Prospective cohort [35] 40 C12 B Yes
No 6 38 8.5 23.4
Page 100 of 176
a On and off RH values not reported. bNumber of patients with adverse events not clear. cATT given thrice a week throughout the 6
months of treatment. dEfavirenz intake in the morning.
Note: Same R-dose of 10mg/kg used, *Also used EFV= 800mg. ***Calculated as an average of the 3 medians provided for the different
SNPs (41, 54 and 67 for GG, GT and TT respectively). **Only for On-RH group. For off-RH it is 234 cells/ml.
A: 2 different groups: HIV-TB co-infected and HIV infected without TB
B: HIV-TB co-infected patients on and off antituberculosis drugs C: One group of HIV-TB co-infected patients on antituberculosis
drugs
D: Two groups of HIV-TB co-infected patients on antituberculosis drugs with two different dose of efavirenz
Page 101 of 176
Chapter 3.3 Safety and pharmacokinetics of high-dose
rifampicin and efavirenz during co-administration among HIV-positive TB patients
Presentations related to this chapter:
Atwine D, Baudin E., Muyindike E., Kananura K., Nyehangane D., Orikiriza P., Nanjebe D., Logoose S, Rinah A., Mwanga-
Amumpaire J., Taburet AM., Bonnet M. Eight weeks safety results of high-dose Rifampicin in HIV-Tuberculosis co-infected
patients in Uganda: RIFAVIRENZ-ANRS 12292 Trial. [Abstr MOPEB0340] July 2017. in International AIDS Conference. July
2017. Paris, France. (Poster Presentation and obtained an ANRS scholarship for the presentation)
Atwine DW., Baudin E., Gelé T., Muyindike W., Kenneth M., Kyohairwe R., Kananura K.., Nyehangane D., Orikiriza P., Furlan
V., Taburet AM., Barrail-Tran A., Bonnet M., and the ANRS12292 Rifavirenz study group. Efavirenz pharmacokinetics with high-
dose rifampicin in tuberculosis-HIV infected patients. [Abstract number 329] submitted to the CROI conference March 2018,
Boston, United States.
Article under writing

Page 102 of 176
Page 103 of 176
3.3.1 Justification and objectives
Despite the already demonstrated safety of doses of R as high as 15, 20 and 35mg/kg [262, 263, 269] among HIV-
negative patients with PTB, there is no corresponding data on the safety of higher doses of R when co-administered
with EFV-based ART in HIV-TB co-infected patients[65, 66]. In addition, the uncertainty of the drug-drug
interactions that could arise with co-administration of EFV and high R doses and their impact on both ART and ATT
efficacy [270].
We report the results of the ANRS12292 RIFAVIRENZ trial that compared the PK parameters of EFV in HIV-TB
co-infected patients, with and without co-administration of R, when using two different dosing regimen of R (10 and
20mg/Kg/day) and EFV (600 and 800mg daily), respectively. Secondarily, we report results on: the safety of
concurrent administration of ATT with high dose R and EFV-based ART in HIV-TB co-infected patients by week-
8 after ATT initiation and throughout the 28 weeks of study follow-up; HIV virological response after starting ART;
eight weeks MTB culture conversion after starting ATT; outcomes of ATT; and patients’ adherence to the ART and
ATT. Also, the PK of R and H and the pharmacogenetic analysis planned in this trial are still ongoing and are not
presented in this report. The manuscript could not be submitted before the completion of the PHD due to these
pending results. So we detail in the PhD book the results available as per the Trial objectives.
3.3.2 Methods
The RIFAVIRENZ Trial was approved by the Research Ethics Committee of Mbarara University of Science and
Technology, Uganda National Council for Science and Technology (UNCST) and National Drug Authority (NDA)
for Uganda.
The study design was a single site phase-2, open-label RCT among Ugandan patients conducted between 2014 and
2017. The trial enrolled patients from Mbarara Regional Referral Hospital and other surrounding health facilities
within Mbarara district in Uganda.
3.3.2.1 Study population
Patients were eligible if they were; ≥18 years of age, newly diagnosed with pulmonary tuberculosis confirmed by
XpertMTB/RIF test, HIV positive, ART naïve, for women of childbearing age: having a negative urine test for
pregnancy on the day of enrolment, and accept to take a barrier contraception during the trial. Participants had to be
stable enough to receive ambulatory treatment, weight> 35Kg, having a readily accessible home address and providing
informed consent to participate in the trial. A patient was excluded if the patient had RR-TB based on
Page 104 of 176
XpertMTB/RIF result confirmed by Genotype MTBDR plus assay, had concomitant opportunistic infection
requiring additional medication, had Karnofsky score <80%, alanine aminotransferases (ALT) or bilirubin > 5.0 x
ULN (hepatitis grade 3 or 4), grade 4 clinical sign or biological result according to the DAIDS grading scale, not able
to give his/her informed consent or unable to cooperate with sampling procedures, patients receiving or requiring
medications that may interfere with study drugs, having a formal contraindication to any drug used in the trial, and
pregnant or lactating women.
Written informed consent was obtained from all patients prior to their participation in the study.
3.3.2.2 Randomization
A randomization schedule was created by the trial statistician and patients were randomized in a 1:1:1 ratio to each of
the three treatment groups. A fixed randomization method was used thus ensuring that the probability of being
assigned in one of the three arms remained constant throughout the study. A block-randomization ensured that a
comparable set of patients is included in each group at all times. The study site was supplied with a batch of sealed
and serially numbered opaque envelopes each containing a slip of paper showing the allocated regimen. There was no
attempt to conceal the treatment after randomization from patients, researchers, or healthcare staff.
3.3.2.3 Treatment allocation
PTB and ART-naïve patients were randomized to one of the 3 treatment arms below:
- Arm 1: 8 weeks R20mg/Kg + H + Z + E and EFV600mg/day +tenofovir-lamivudine fixed dose
combination (TDF/3TC);
- Arm 2: 8 weeks R20mg/Kg + H+Z+ E and EFV800mg/day + TDF/3TC;
- Standard arm: 8 weeks R10mg/Kg + H+Z+ E and EFV600mg/day + TDF/3TC.
All ATT doses were calculated according to WHO weight-band recommendation[195]. ART treatment was started
after first 2 weeks or 4 weeks of ATT for patients with baseline CD4<50 and >50 cells/mm3, respectively. At 8
weeks, all patients were switched to standard R (10mg/kg) and EFV (600mg) doses (see Figure 12).
Patients took ART in the evening during the first two weeks in order to facilitate the tolerance to EFV and then
switched to morning intake for organisational reason, that is, in order to perform the EFV PK assessment during the
day. For patients who could not tolerate the EFV after this switch, were returned to the evening intake and the PK
assessment done during the night. Pyridoxine and cotrimoxazole were administered to all patients. Only WHO pre-
qualified drugs were used in this study.
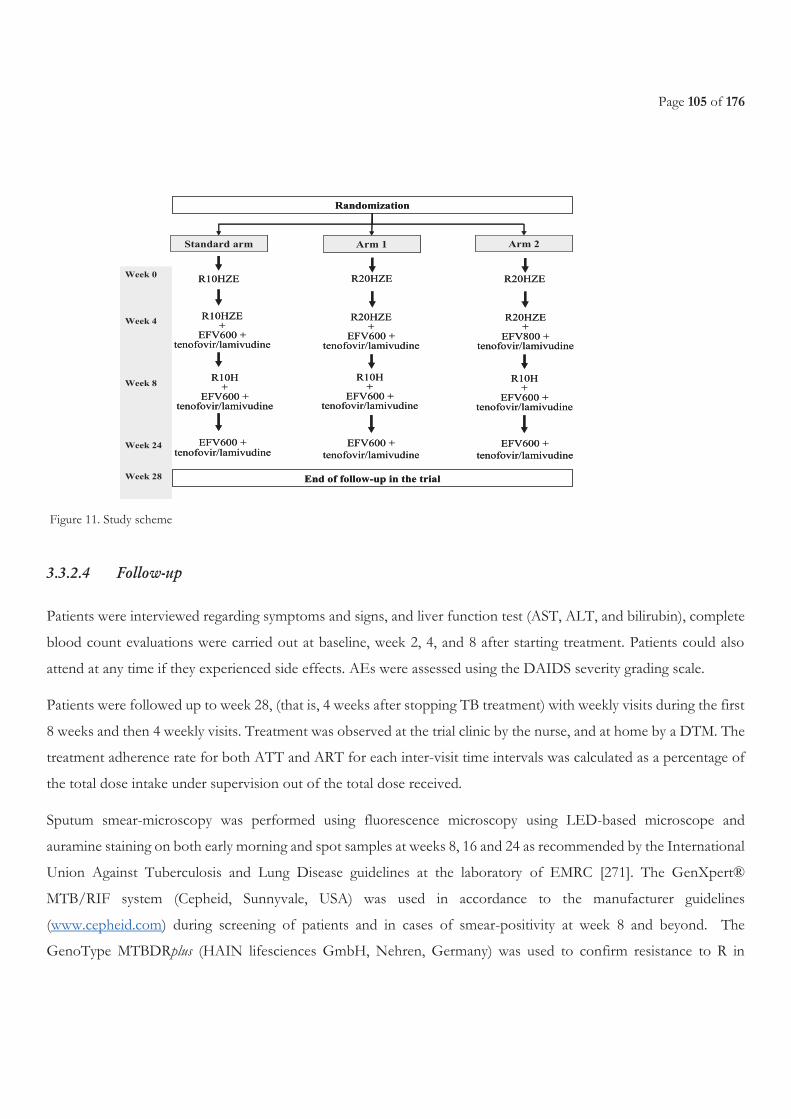
Page 105 of 176
Figure 11. Study scheme
3.3.2.4 Follow-up
Patients were interviewed regarding symptoms and signs, and liver function test (AST, ALT, and bilirubin), complete
blood count evaluations were carried out at baseline, week 2, 4, and 8 after starting treatment. Patients could also
attend at any time if they experienced side effects. AEs were assessed using the DAIDS severity grading scale.
Patients were followed up to week 28, (that is, 4 weeks after stopping TB treatment) with weekly visits during the first
8 weeks and then 4 weekly visits. Treatment was observed at the trial clinic by the nurse, and at home by a DTM. The
treatment adherence rate for both ATT and ART for each inter-visit time intervals was calculated as a percentage of
the total dose intake under supervision out of the total dose received.
Sputum smear-microscopy was performed using fluorescence microscopy using LED-based microscope and
auramine staining on both early morning and spot samples at weeks 8, 16 and 24 as recommended by the International
Union Against Tuberculosis and Lung Disease guidelines at the laboratory of EMRC [271]. The GenXpert®
MTB/RIF system (Cepheid, Sunnyvale, USA) was used in accordance to the manufacturer guidelines
(www.cepheid.com) during screening of patients and in cases of smear-positivity at week 8 and beyond. The
GenoType MTBDRplus (HAIN lifesciences GmbH, Nehren, Germany) was used to confirm resistance to R in
Randomization
Standard arm Arm 1 Arm 2
R10HZE R20HZE R20HZE
R10HZE+
EFV600 + tenofovir/lamivudine
R20HZE+
EFV600 + tenofovir/lamivudine
R20HZE+
EFV800 + tenofovir/lamivudine
R10H+
EFV600 + tenofovir/lamivudine
R10H+
EFV600 + tenofovir/lamivudine
R10H+
EFV600 + tenofovir/lamivudine
EFV600 + tenofovir/lamivudine
EFV600 +
tenofovir/lamivudine
EFV600 +
tenofovir/lamivudine
Week 0
Week 4
Week 8
Week 24
Week 28 End of follow-up in the trial
Page 106 of 176
sputum specimens collected at screening and collection visits according to the manufacturer guidelines (www.hain-
lifescience.de).
Sputum specimens were tested with two MTB culture methods, that is, Lowenstein-Jensen (LJ) and mycobacteria
growth indicator tube (MGIT) at enrolment and after eight weeks. Culture was also performed at week 24 though
only in culture-positive patients at week 8. Sample decontamination was done using the N-acetyl-L-cysteine-sodium
hydroxide (NALC-NaOH) method. The decontaminated pellet was then suspended into 2.5 mL of sodium chloride.
For LJ, two drops of decontaminated sample were inoculated into one LJ medium and the LJ tube incubated for 56
days before reporting a negative result. Whenever growth would be detected, then smear microscopy would be
performed to confirm the presence of acid fast bacilli. The number of colonies on the whole tube would then be
estimated and reported. For MGIT, 500 µL from decontaminated sample were inoculated in MGIT tube. MGIT
tubes were also incubated for 56 days before reporting a negative result. Whenever a MGIT tube was found positive,
inoculation on blood agar was processed to check contamination and smear microscopy done for AFB detection.
Distinction between MTB and non-tuberculosis mycobacteria (NTM) was confirmed using the P-nitrobenzoic acid
and Bioline Ag MPT64 Rapid (Standard Diagnostics Inc, Kyonggi-do, Korea). In case of positive culture results at
week 8, the MTB isolate were sent to the national TB laboratory in Kampala for DST.
The patients’ CD4 counts were measured at the screening visit and at week 28. CD4 cell count and percentage results
were generated using the BD FACSCountTM system (BD Biosciences, San Jose, USA) according to the manufacturer
guidelines (http://www.bdbiosciences.com/documents/BD_FACSCount_Brochure.pdf).
For HIV-1 RNA, a blood sample was centrifuged locally and serum stored at -80°C at Epicentre research laboratory
until shipment to the laboratory of the Joint Clinical Research Centre in Kampala for analysis using the automate PCR
amplification and detection COBAS® AMPLICOR Analyzer (Roche Molecular Diagnostics, Indianapolis, USA) In
addition, resistance mutations to NNRTI and NRTI were systematically searched in patients with more than
500copies/mL 24 weeks after starting ART and in specific cases according to protocol specific decisional algorithms
at the MRC reference laboratory in Entebbe (Uganda).
3.3.2.5 PK procedures
All PK sampling was performed at therapy steady state: at least 2 weeks for RH and 4 weeks for EFV, respectively.
Patients were admitted at the Epicentre TB research clinic for the evening prior and during the PK sampling.
PK sampling was performed at 8 time points over 24 hours, that is: -0.5 h (30 minutes prior to treatment
administration), then 1, 2, 3, 4, 8, 12, 24 hours after treatment administration. For each PK sample collection for R,
H (at week 2) and R, H, EFV (at week 8), 6 ml of blood were drawn, resulting in a total 48 ml of blood /patient/day.
Page 107 of 176
For PK of EFV alone (at week 28), 4 mL of blood were collected, resulting in a total of 32 mL. After collection, fresh
blood samples were sent to the Epicentre laboratory. As R and H are not stable in plasma at room temperature and
at –20°C, all samples were immediately deep frozen at -70°C. After centrifugation within 40 min after blood collection,
500µL of plasma exactly measured was half diluted with the ascorbic acid solution for rifampin assay and remaining
plasma stored frozen at -70°C until shipment to the pharmacy department of the Bicêtre hospital in Paris (France)
for analysis. Assays of EFV in plasma samples were performed using validated High Performance Liquid
Chromatography (HPLC). Assays of R and H are still ongoing. The analytical laboratory was accredited for the
purpose of quantifying drug concentrations in biological samples including assay development.
3.3.2.6 Trial Endpoints
The primary endpoint was the PK parameters of EFV with (4 weeks after starting EFV) and without R (4 weeks after
completion of R): trough concentrations before drug intake (Cmin), maximal concentration (Cmax), time to achieve the
Cmax (Tmax) and area under the curve of concentrations vs time at steady state during a 24-hour dosing interval (AUC0-
24).
The secondary endpoints include: 8 weeks MTB culture conversion; ATT outcome based on standard WHO case
definitions; HIV-1 RNA after 4, 12 and 24 weeks on ART (in ART naïve patients, a reduction of 2 logs copies/mL
is expected after 4 weeks of ART. After 12 and 24 weeks, the HIV-1 RNA is expected to be below 400 and 50
copies/mL, respectively); resistance mutations to NNRTI and NRTI in patients with HIV-1 RNA>500copies/mL
24 weeks after ART; proportion of patients with more than 95% adherence rate for ART and ATT, respectively;
serious adverse event (SAE); major AE of interest: biological hepatitis, rash, neurological and psychiatric disorders.
3.3.2.7 Statistical analysis
We used a non-inferiority approach to show that the decrease in AUC of EFV when given with R20mg/Kg compared
to EFV alone (EFV+R - EFV) is not greater than 30%. In each study arm, the EFV pharmacokinetic parameters with
R were to be compared with the parameters without R in same patients. Therefore, with a number of 28 patients, at
the 5% significance level (one sided), we will have 80% power to reject the null hypothesis that the decrease in AUC
will be greater than 30%, assuming a standard deviation of the differences of the log AUC of 0.29 (reflecting the 15%
intra-patient variability of EFV clearance based on the data from the PECAN study), and an expected difference of
AUC of 20%, value in between the PECAN results (decrease of 13%) and the 26% decrease in AUC reported in the
manufacturer's insert package [272]. The same sample size was estimated for each arm, including the arm using
R10mg/Kg. There was a 20% increase in the sample size to take into account potential withdrawals between the PK
assessments, resulting in 34 patients per study arm and a total of 105 patients.
Page 108 of 176
Data were double data entered using Voozanoo (Epiconcept, Paris, France) software version 3.4.2 and analyzed using
Stata version 3.0.
From individual plots of drug plasma concentrations versus time the following pharmacokinetic parameters were
estimated using the software Win Nonlin v6.1 (Pharsight Corporation). Geometric mean ratios (GMR) of log
transformed Cmin and AUC of EFV with TB drugs over the Cmin and AUC of EFV without TB drugs was calculated
and presented with 90% confidence intervals (CI) in each study arm according to current FDA and EMA guidelines
for drug-drug interaction studies. The limits of the confidence interval in each arm were compared to the 0.70-1.43
interval owing to the EFV therapeutic range.
Proportions were calculated to describe patients with week 8 MTB culture conversion, 24 week ATT outcomes,
virological response at weeks 4 (HIV-1 RNA reduction of at least 2 logs), 12 (< 400copies/mL) and 24 (<
100copies/mL) after starting ART, and anti-TB and ART adherence above 95% and 80%. The safety analysis was
performed on all patients who received at least one dose of treatment. The frequency of AEs and proportion of
patients affected within the first 8 and 28 weeks post initiation of ATT were calculated by treatment regimen. The
diagnosis of hepatotoxicity was based on rises in transaminases (ALT and AST) while that of CNS toxicity was based
on symptom and clinical assessments.
3.3.3 Results
3.3.3.1 Characteristics of the patients
A total of 98 patients were randomized between April 2014 and August 2016.
Four populations were considered for the analysis (see Figure 13):
- Safety population: all patients exposed to the trial intervention (randomized patients).
- Modified intention to treat population: randomized patient after exclusion of one patient who was not HIV
infected after PCR.
- EFV+R population: all patients who were exposed to EFV and anti-tuberculosis drug and had PK at week 8
- PK population: all patients who had samples drawn for PK at week 8 and 28 for comparison of EFV PK
parameters on and off TB drugs. The GMR (primary endpoint) was analyzed in this population.
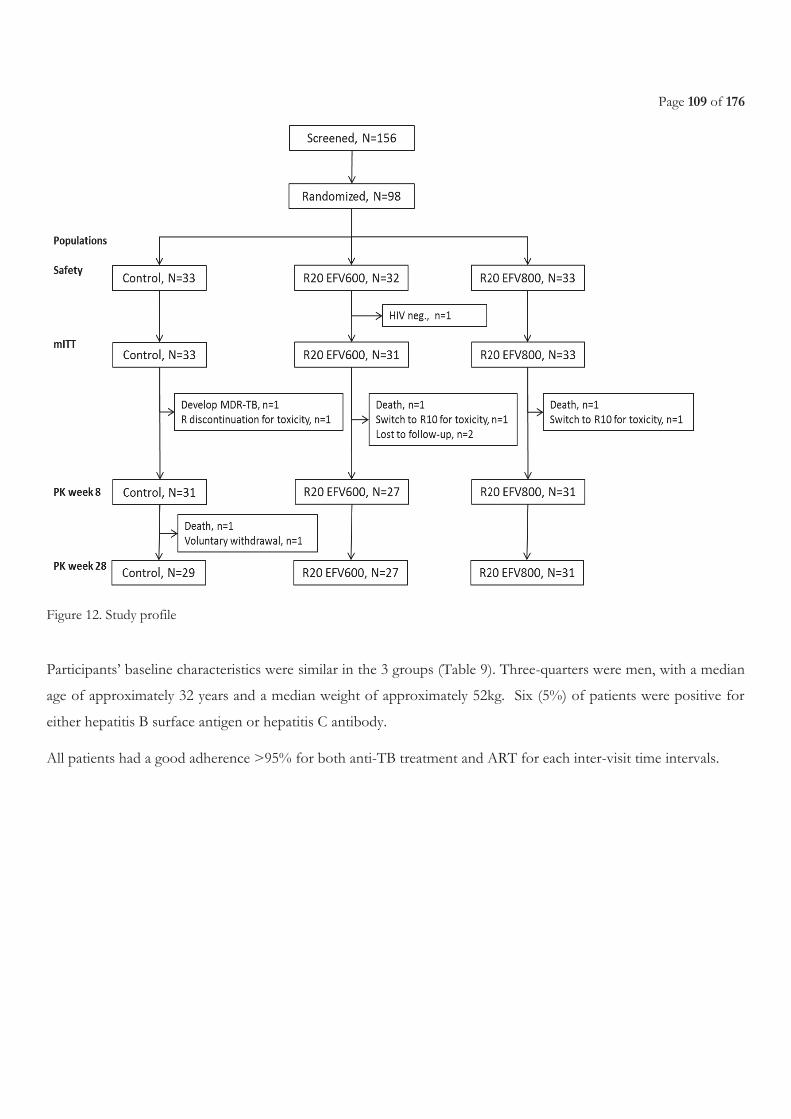
Page 109 of 176
Figure 12. Study profile
Participants’ baseline characteristics were similar in the 3 groups (Table 9). Three-quarters were men, with a median
age of approximately 32 years and a median weight of approximately 52kg. Six (5%) of patients were positive for
either hepatitis B surface antigen or hepatitis C antibody.
All patients had a good adherence >95% for both anti-TB treatment and ART for each inter-visit time intervals.
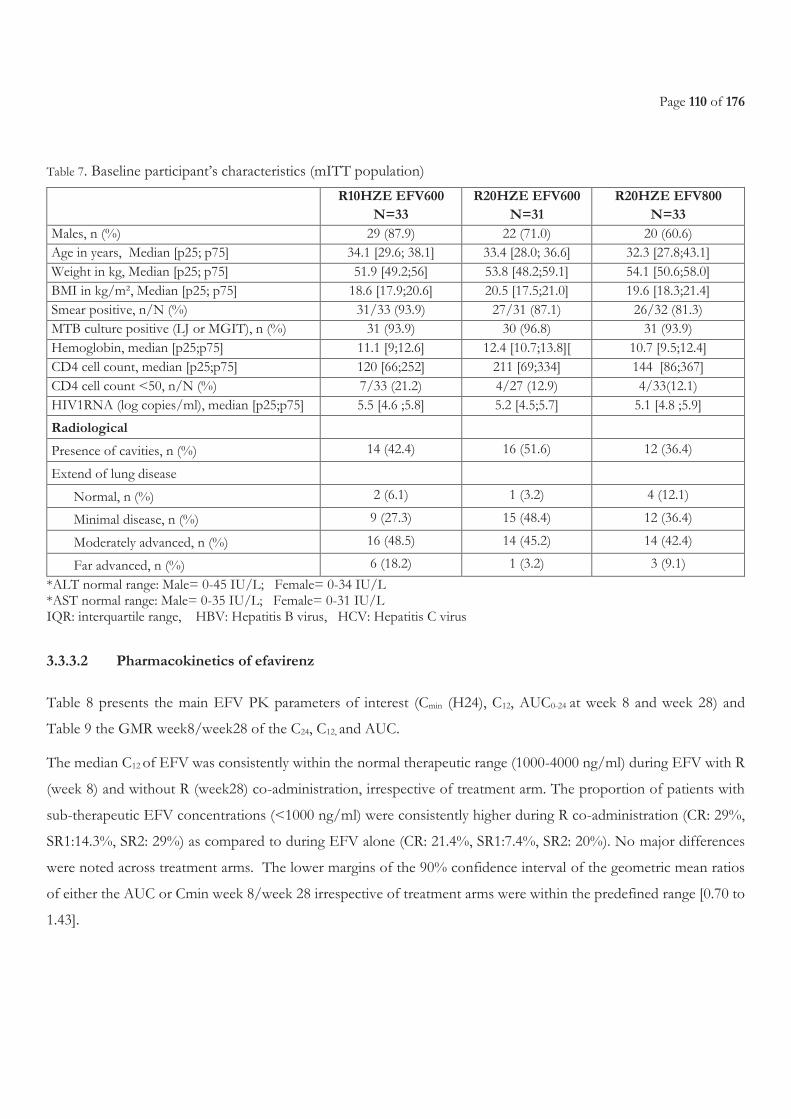
Page 110 of 176
Table 7. Baseline participant’s characteristics (mITT population)
R10HZE EFV600
N=33 R20HZE EFV600
N=31 R20HZE EFV800
N=33 Males, n (%) 29 (87.9) 22 (71.0) 20 (60.6) Age in years, Median [p25; p75] 34.1 [29.6; 38.1] 33.4 [28.0; 36.6] 32.3 [27.8;43.1] Weight in kg, Median [p25; p75] 51.9 [49.2;56] 53.8 [48.2;59.1] 54.1 [50.6;58.0] BMI in kg/m², Median [p25; p75] 18.6 [17.9;20.6] 20.5 [17.5;21.0] 19.6 [18.3;21.4] Smear positive, n/N (%) 31/33 (93.9) 27/31 (87.1) 26/32 (81.3) MTB culture positive (LJ or MGIT), n (%) 31 (93.9) 30 (96.8) 31 (93.9) Hemoglobin, median [p25;p75] 11.1 [9;12.6] 12.4 [10.7;13.8][ 10.7 [9.5;12.4] CD4 cell count, median [p25;p75] 120 [66;252] 211 [69;334] 144 [86;367] CD4 cell count <50, n/N (%) 7/33 (21.2) 4/27 (12.9) 4/33(12.1) HIV1RNA (log copies/ml), median [p25;p75] 5.5 [4.6 ;5.8] 5.2 [4.5;5.7] 5.1 [4.8 ;5.9]
Radiological
Presence of cavities, n (%) 14 (42.4) 16 (51.6) 12 (36.4)
Extend of lung disease
Normal, n (%) 2 (6.1) 1 (3.2) 4 (12.1)
Minimal disease, n (%) 9 (27.3) 15 (48.4) 12 (36.4)
Moderately advanced, n (%) 16 (48.5) 14 (45.2) 14 (42.4)
Far advanced, n (%) 6 (18.2) 1 (3.2) 3 (9.1)
*ALT normal range: Male= 0-45 IU/L; Female= 0-34 IU/L *AST normal range: Male= 0-35 IU/L; Female= 0-31 IU/L
IQR: interquartile range, HBV: Hepatitis B virus, HCV: Hepatitis C virus
3.3.3.2 Pharmacokinetics of efavirenz
Table 8 presents the main EFV PK parameters of interest (Cmin (H24), C12, AUC0-24 at week 8 and week 28) and
Table 9 the GMR week8/week28 of the C24, C12, and AUC.
The median C12 of EFV was consistently within the normal therapeutic range (1000-4000 ng/ml) during EFV with R
(week 8) and without R (week28) co-administration, irrespective of treatment arm. The proportion of patients with
sub-therapeutic EFV concentrations (<1000 ng/ml) were consistently higher during R co-administration (CR: 29%,
SR1:14.3%, SR2: 29%) as compared to during EFV alone (CR: 21.4%, SR1:7.4%, SR2: 20%). No major differences
were noted across treatment arms. The lower margins of the 90% confidence interval of the geometric mean ratios
of either the AUC or Cmin week 8/week 28 irrespective of treatment arms were within the predefined range [0.70 to
1.43].
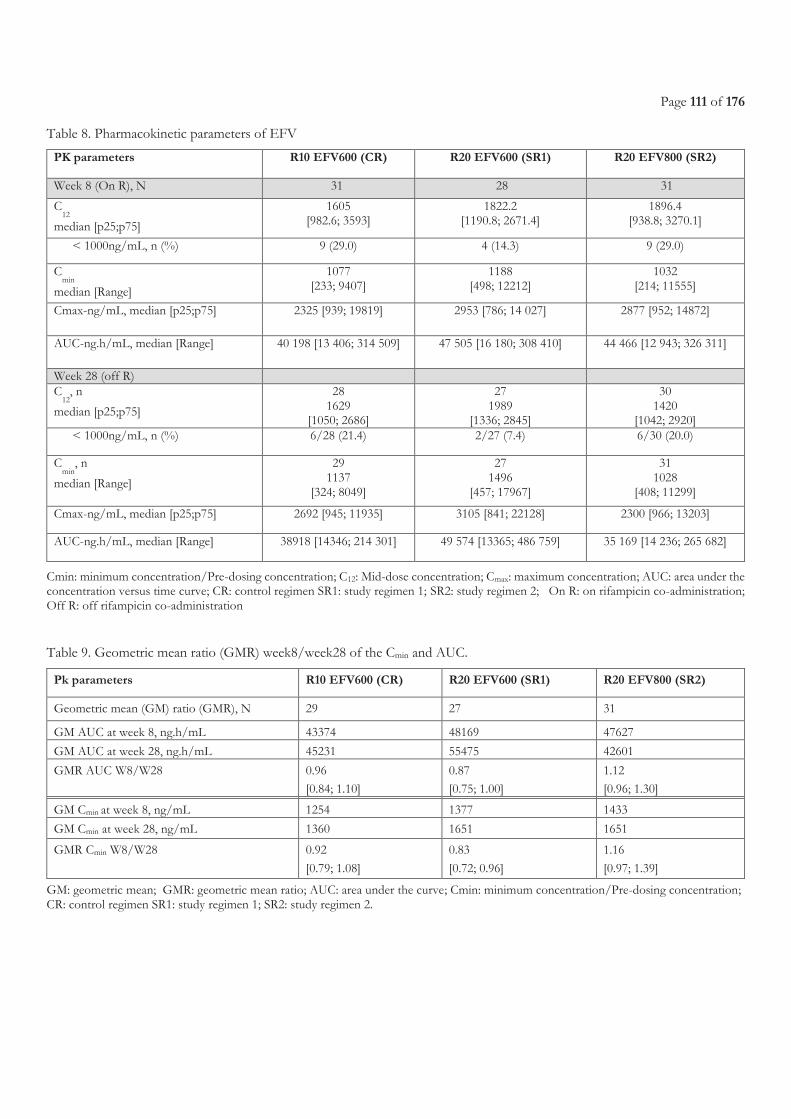
Page 111 of 176
Table 8. Pharmacokinetic parameters of EFV
PK parameters R10 EFV600 (CR) R20 EFV600 (SR1) R20 EFV800 (SR2)
Week 8 (On R), N 31 28 31
C12
median [p25;p75]
1605 [982.6; 3593]
1822.2 [1190.8; 2671.4]
1896.4 [938.8; 3270.1]
< 1000ng/mL, n (%) 9 (29.0) 4 (14.3) 9 (29.0)
Cmin
median [Range]
1077 [233; 9407]
1188 [498; 12212]
1032 [214; 11555]
Cmax-ng/mL, median [p25;p75] 2325 [939; 19819] 2953 [786; 14 027] 2877 [952; 14872]
AUC-ng.h/mL, median [Range] 40 198 [13 406; 314 509] 47 505 [16 180; 308 410] 44 466 [12 943; 326 311]
Week 28 (off R)
C
12, n
median [p25;p75]
28 1629
[1050; 2686]
27 1989
[1336; 2845]
30 1420
[1042; 2920] < 1000ng/mL, n (%) 6/28 (21.4) 2/27 (7.4) 6/30 (20.0)
Cmin
, n
median [Range]
29 1137
[324; 8049]
27 1496
[457; 17967]
31 1028
[408; 11299]
Cmax-ng/mL, median [p25;p75] 2692 [945; 11935] 3105 [841; 22128] 2300 [966; 13203]
AUC-ng.h/mL, median [Range] 38918 [14346; 214 301] 49 574 [13365; 486 759] 35 169 [14 236; 265 682]
Cmin: minimum concentration/Pre-dosing concentration; C12: Mid-dose concentration; Cmax: maximum concentration; AUC: area under the concentration versus time curve; CR: control regimen SR1: study regimen 1; SR2: study regimen 2; On R: on rifampicin co-administration; Off R: off rifampicin co-administration
Table 9. Geometric mean ratio (GMR) week8/week28 of the Cmin and AUC.
Pk parameters R10 EFV600 (CR) R20 EFV600 (SR1) R20 EFV800 (SR2)
Geometric mean (GM) ratio (GMR), N 29 27 31
GM AUC at week 8, ng.h/mL 43374 48169 47627
GM AUC at week 28, ng.h/mL 45231 55475 42601
GMR AUC W8/W28 0.96
[0.84; 1.10]
0.87
[0.75; 1.00]
1.12
[0.96; 1.30] GM Cmin at week 8, ng/mL 1254 1377 1433
GM Cmin at week 28, ng/mL 1360 1651 1651
GMR Cmin W8/W28 0.92
[0.79; 1.08]
0.83
[0.72; 0.96]
1.16
[0.97; 1.39]
GM: geometric mean; GMR: geometric mean ratio; AUC: area under the curve; Cmin: minimum concentration/Pre-dosing concentration; CR: control regimen SR1: study regimen 1; SR2: study regimen 2.
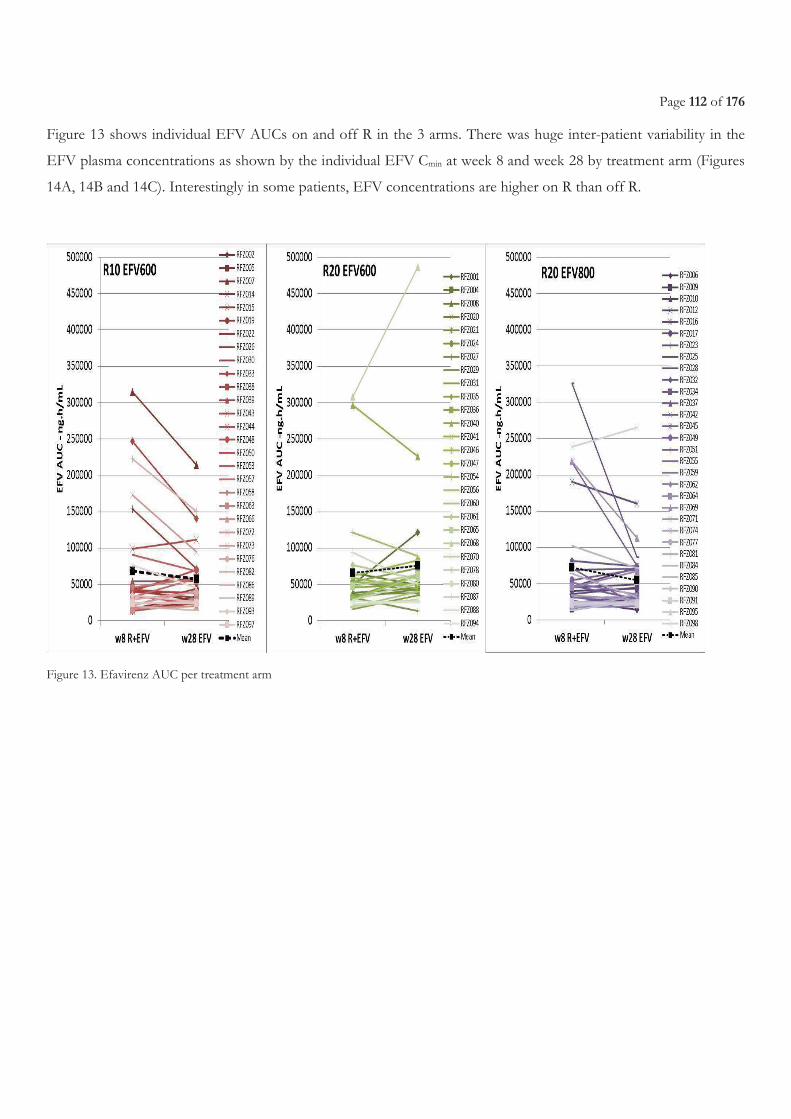
Page 112 of 176
Figure 13 shows individual EFV AUCs on and off R in the 3 arms. There was huge inter-patient variability in the
EFV plasma concentrations as shown by the individual EFV Cmin at week 8 and week 28 by treatment arm (Figures
14A, 14B and 14C). Interestingly in some patients, EFV concentrations are higher on R than off R.
Figure 13. Efavirenz AUC per treatment arm
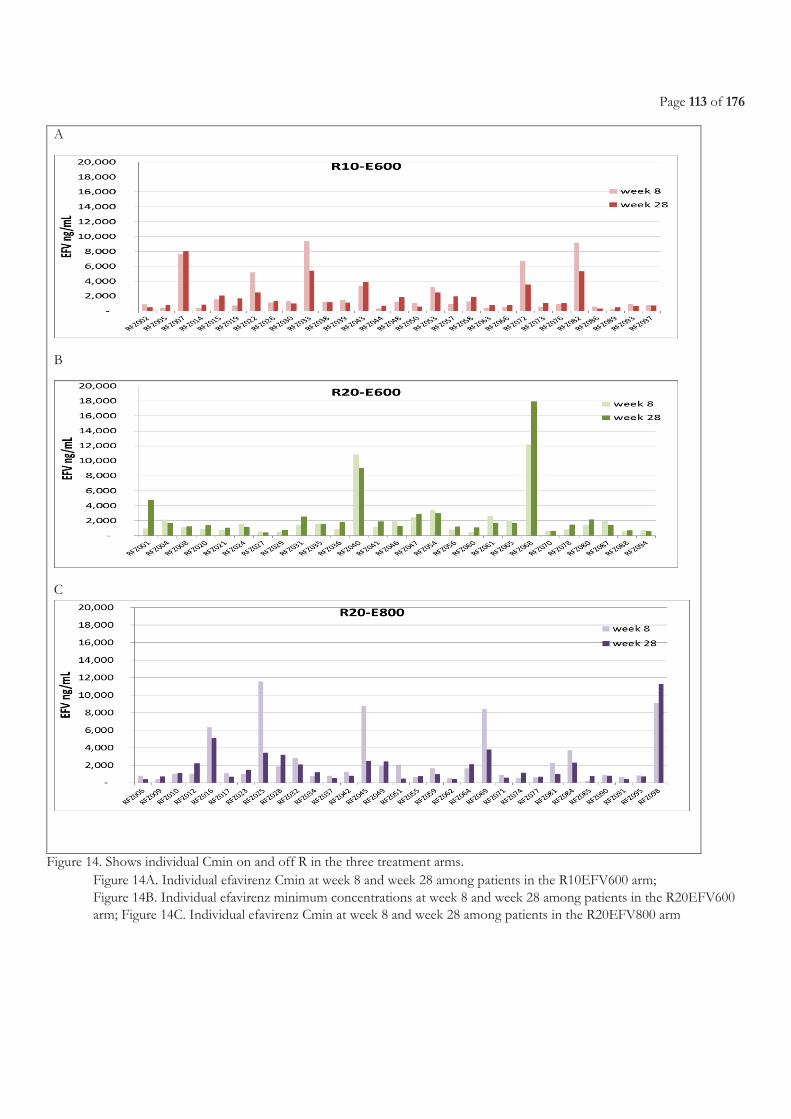
Page 113 of 176
A
B
C
Figure 14. Shows individual Cmin on and off R in the three treatment arms. Figure 14A. Individual efavirenz Cmin at week 8 and week 28 among patients in the R10EFV600 arm; Figure 14B. Individual efavirenz minimum concentrations at week 8 and week 28 among patients in the R20EFV600 arm; Figure 14C. Individual efavirenz Cmin at week 8 and week 28 among patients in the R20EFV800 arm
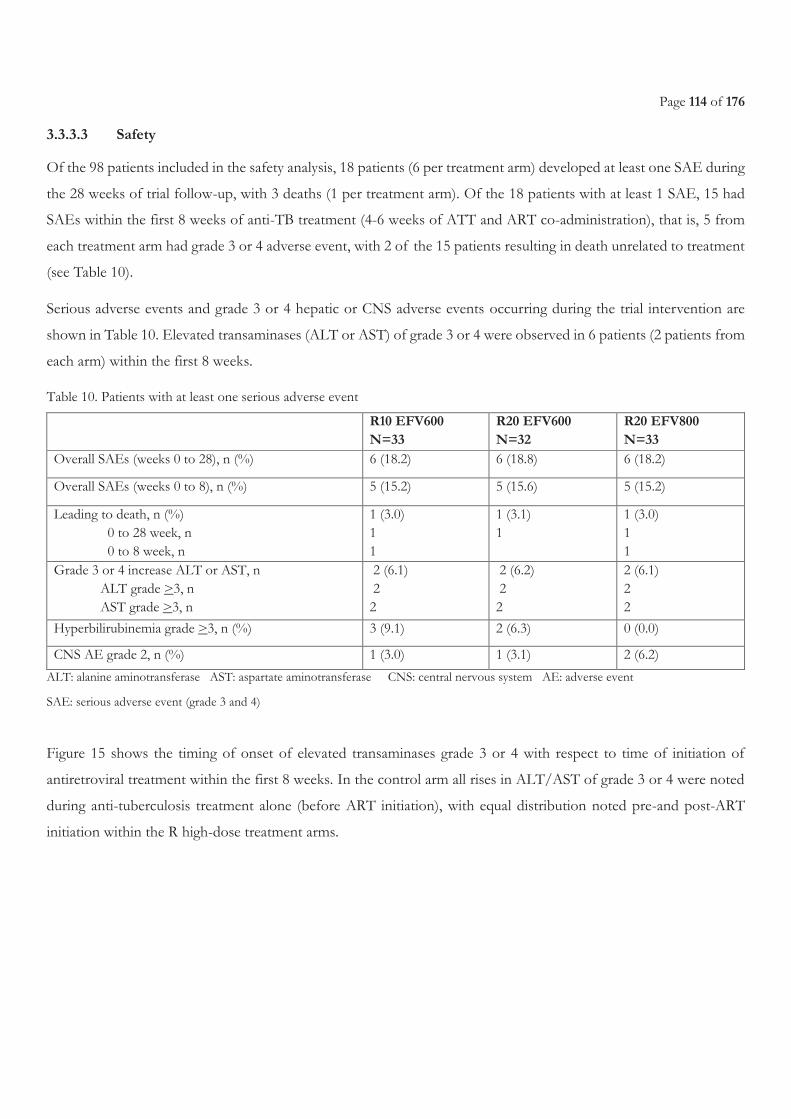
Page 114 of 176
3.3.3.3 Safety
Of the 98 patients included in the safety analysis, 18 patients (6 per treatment arm) developed at least one SAE during
the 28 weeks of trial follow-up, with 3 deaths (1 per treatment arm). Of the 18 patients with at least 1 SAE, 15 had
SAEs within the first 8 weeks of anti-TB treatment (4-6 weeks of ATT and ART co-administration), that is, 5 from
each treatment arm had grade 3 or 4 adverse event, with 2 of the 15 patients resulting in death unrelated to treatment
(see Table 10).
Serious adverse events and grade 3 or 4 hepatic or CNS adverse events occurring during the trial intervention are
shown in Table 10. Elevated transaminases (ALT or AST) of grade 3 or 4 were observed in 6 patients (2 patients from
each arm) within the first 8 weeks.
Table 10. Patients with at least one serious adverse event
R10 EFV600 N=33
R20 EFV600 N=32
R20 EFV800 N=33
Overall SAEs (weeks 0 to 28), n (%) 6 (18.2) 6 (18.8) 6 (18.2)
Overall SAEs (weeks 0 to 8), n (%) 5 (15.2) 5 (15.6) 5 (15.2)
Leading to death, n (%) 0 to 28 week, n 0 to 8 week, n
1 (3.0) 1 1
1 (3.1) 1
1 (3.0) 1 1
Grade 3 or 4 increase ALT or AST, n ALT grade >3, n AST grade >3, n
2 (6.1) 2 2
2 (6.2) 2 2
2 (6.1) 2 2
Hyperbilirubinemia grade >3, n (%) 3 (9.1) 2 (6.3) 0 (0.0)
CNS AE grade 2, n (%) 1 (3.0) 1 (3.1) 2 (6.2)
ALT: alanine aminotransferase AST: aspartate aminotransferase CNS: central nervous system AE: adverse event
SAE: serious adverse event (grade 3 and 4)
Figure 15 shows the timing of onset of elevated transaminases grade 3 or 4 with respect to time of initiation of
antiretroviral treatment within the first 8 weeks. In the control arm all rises in ALT/AST of grade 3 or 4 were noted
during anti-tuberculosis treatment alone (before ART initiation), with equal distribution noted pre-and post-ART
initiation within the R high-dose treatment arms.
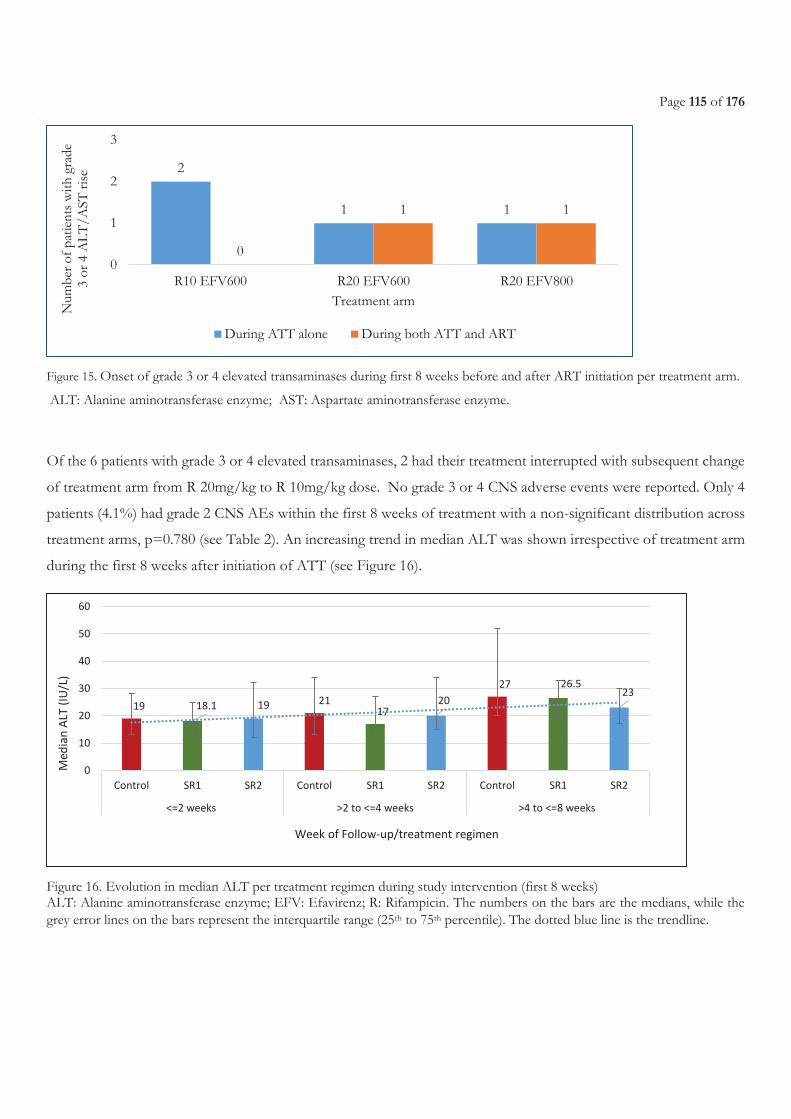
Page 115 of 176
Figure 15. Onset of grade 3 or 4 elevated transaminases during first 8 weeks before and after ART initiation per treatment arm.
ALT: Alanine aminotransferase enzyme; AST: Aspartate aminotransferase enzyme.
Of the 6 patients with grade 3 or 4 elevated transaminases, 2 had their treatment interrupted with subsequent change
of treatment arm from R 20mg/kg to R 10mg/kg dose. No grade 3 or 4 CNS adverse events were reported. Only 4
patients (4.1%) had grade 2 CNS AEs within the first 8 weeks of treatment with a non-significant distribution across
treatment arms, p=0.780 (see Table 2). An increasing trend in median ALT was shown irrespective of treatment arm
during the first 8 weeks after initiation of ATT (see Figure 16).
Figure 16. Evolution in median ALT per treatment regimen during study intervention (first 8 weeks) ALT: Alanine aminotransferase enzyme; EFV: Efavirenz; R: Rifampicin. The numbers on the bars are the medians, while the grey error lines on the bars represent the interquartile range (25th to 75th percentile). The dotted blue line is the trendline.
2
1 1
0
1 1
0
1
2
3
R10 EFV600 R20 EFV600 R20 EFV800
Num
ber
of p
atie
nts
with
gra
de
3 or
4 A
LT
/AST
ris
e
Treatment arm
During ATT alone During both ATT and ART
19 18.1 19 2117
20
27 26.523
0
10
20
30
40
50
60
Control SR1 SR2 Control SR1 SR2 Control SR1 SR2
<=2 weeks >2 to <=4 weeks >4 to <=8 weeks
Me
dia
n A
LT (
IU/L
)
Week of Follow-up/treatment regimen
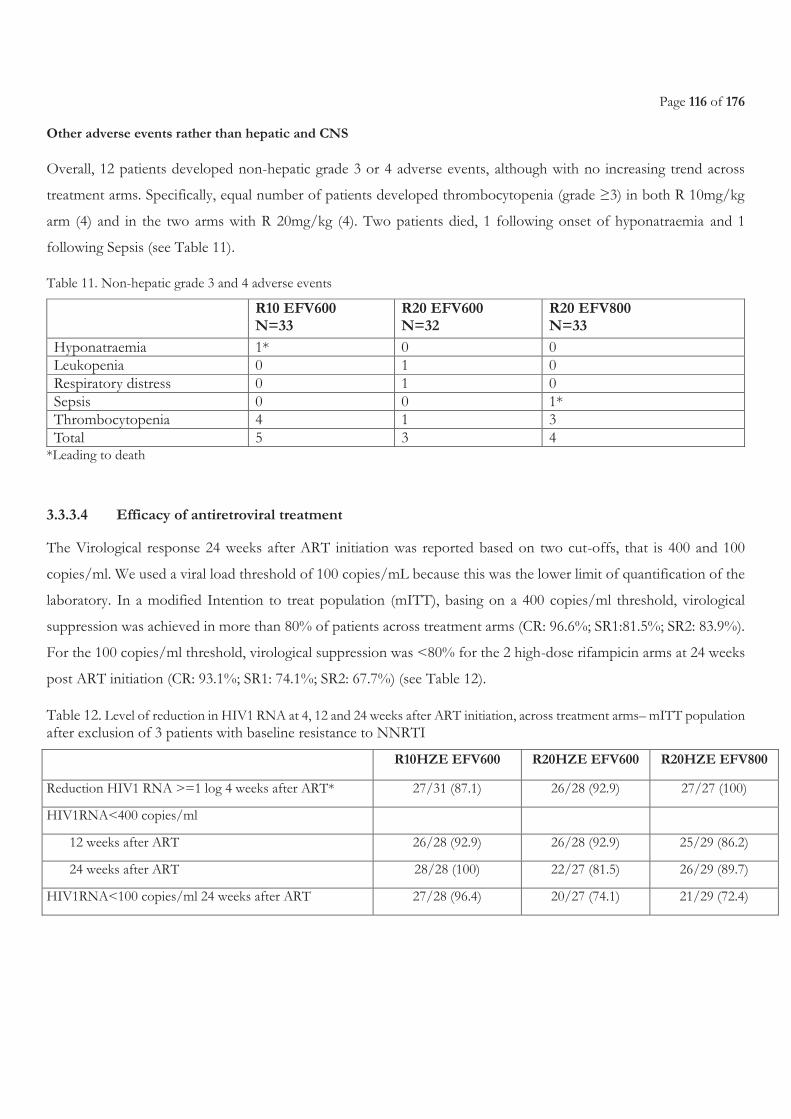
Page 116 of 176
Other adverse events rather than hepatic and CNS
Overall, 12 patients developed non-hepatic grade 3 or 4 adverse events, although with no increasing trend across
treatment arms. Specifically, equal number of patients developed thrombocytopenia (grade ≥3) in both R 10mg/kg
arm (4) and in the two arms with R 20mg/kg (4). Two patients died, 1 following onset of hyponatraemia and 1
following Sepsis (see Table 11).
Table 11. Non-hepatic grade 3 and 4 adverse events
R10 EFV600 N=33
R20 EFV600 N=32
R20 EFV800 N=33
Hyponatraemia 1* 0 0 Leukopenia 0 1 0 Respiratory distress 0 1 0 Sepsis 0 0 1* Thrombocytopenia 4 1 3 Total 5 3 4
*Leading to death
3.3.3.4 Efficacy of antiretroviral treatment
The Virological response 24 weeks after ART initiation was reported based on two cut-offs, that is 400 and 100
copies/ml. We used a viral load threshold of 100 copies/mL because this was the lower limit of quantification of the
laboratory. In a modified Intention to treat population (mITT), basing on a 400 copies/ml threshold, virological
suppression was achieved in more than 80% of patients across treatment arms (CR: 96.6%; SR1:81.5%; SR2: 83.9%).
For the 100 copies/ml threshold, virological suppression was <80% for the 2 high-dose rifampicin arms at 24 weeks
post ART initiation (CR: 93.1%; SR1: 74.1%; SR2: 67.7%) (see Table 12).
Table 12. Level of reduction in HIV1 RNA at 4, 12 and 24 weeks after ART initiation, across treatment arms– mITT population after exclusion of 3 patients with baseline resistance to NNRTI
R10HZE EFV600 R20HZE EFV600 R20HZE EFV800
Reduction HIV1 RNA >=1 log 4 weeks after ART* 27/31 (87.1) 26/28 (92.9) 27/27 (100)
HIV1RNA<400 copies/ml
12 weeks after ART 26/28 (92.9) 26/28 (92.9) 25/29 (86.2)
24 weeks after ART 28/28 (100) 22/27 (81.5) 26/29 (89.7)
HIV1RNA<100 copies/ml 24 weeks after ART 27/28 (96.4) 20/27 (74.1) 21/29 (72.4)
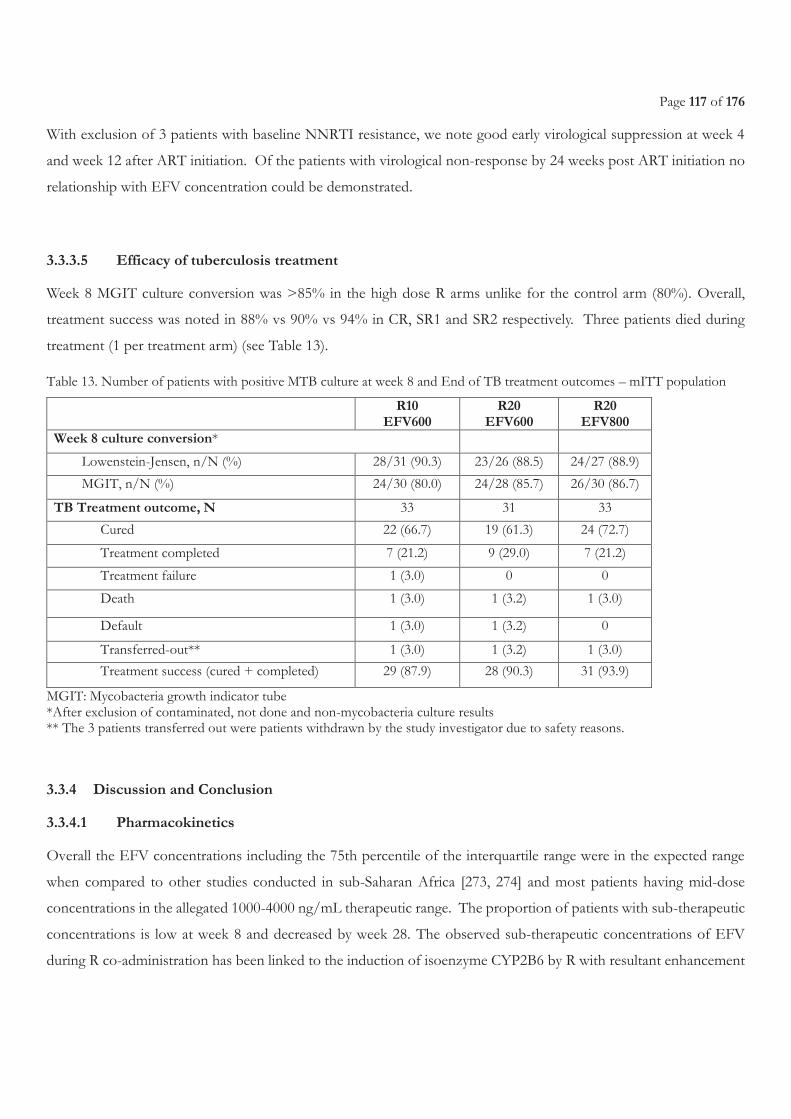
Page 117 of 176
With exclusion of 3 patients with baseline NNRTI resistance, we note good early virological suppression at week 4
and week 12 after ART initiation. Of the patients with virological non-response by 24 weeks post ART initiation no
relationship with EFV concentration could be demonstrated.
3.3.3.5 Efficacy of tuberculosis treatment
Week 8 MGIT culture conversion was >85% in the high dose R arms unlike for the control arm (80%). Overall,
treatment success was noted in 88% vs 90% vs 94% in CR, SR1 and SR2 respectively. Three patients died during
treatment (1 per treatment arm) (see Table 13).
Table 13. Number of patients with positive MTB culture at week 8 and End of TB treatment outcomes – mITT population
R10 EFV600
R20 EFV600
R20 EFV800
Week 8 culture conversion*
Lowenstein-Jensen, n/N (%) 28/31 (90.3) 23/26 (88.5) 24/27 (88.9)
MGIT, n/N (%) 24/30 (80.0) 24/28 (85.7) 26/30 (86.7)
TB Treatment outcome, N 33 31 33
Cured 22 (66.7) 19 (61.3) 24 (72.7)
Treatment completed 7 (21.2) 9 (29.0) 7 (21.2)
Treatment failure 1 (3.0) 0 0
Death 1 (3.0) 1 (3.2) 1 (3.0)
Default 1 (3.0) 1 (3.2) 0
Transferred-out** 1 (3.0) 1 (3.2) 1 (3.0)
Treatment success (cured + completed) 29 (87.9) 28 (90.3) 31 (93.9)
MGIT: Mycobacteria growth indicator tube *After exclusion of contaminated, not done and non-mycobacteria culture results ** The 3 patients transferred out were patients withdrawn by the study investigator due to safety reasons.
3.3.4 Discussion and Conclusion
3.3.4.1 Pharmacokinetics
Overall the EFV concentrations including the 75th percentile of the interquartile range were in the expected range
when compared to other studies conducted in sub-Saharan Africa [273, 274] and most patients having mid-dose
concentrations in the allegated 1000-4000 ng/mL therapeutic range. The proportion of patients with sub-therapeutic
concentrations is low at week 8 and decreased by week 28. The observed sub-therapeutic concentrations of EFV
during R co-administration has been linked to the induction of isoenzyme CYP2B6 by R with resultant enhancement
Page 118 of 176
in NNRTI drug metabolism [179]. However, in our study, similar proportions of patients with EFV sub-therapeutic
concentrations (29%) with regard to C12 were noted for both patients in R10 mg/kg with EFV 600mg/day and those
in R 20mg/kg and EFV 800mg/day treatment arm, hence suggesting a potential non-increased induction of
isoenzyme CYP2B6 with higher R doses. However, this is pending clarification when pharmacogenetic analysis is
completed. Whatever the treatment arm, a number of patients had higher EFV concentrations on vs off R as
previously described in African population [56, 60, 64].
3.3.4.2 Safety of high-dose R in HIV-TB co-infected patients
We note that co-administration of a double-dose of R with EFV (600 or 800mg) among HIV/TB co-infected patients
was well tolerated with very few severe transaminitis occurring during the first 8 weeks of TB treatment (4-6 weeks
of co-administration of ATT with ART) and no severe CNS disorders throughout the study.
The incidence of elevated ALT seen in this study among HIV positive TB patients, that is, 6/98 (6.1%) is comparable
to that previously reported among HIV negative TB patients (7%) in Rifatox trial [275] and lower than rates reported
in other African [169, 276, 277] and Asian countries [278]. The distribution of the ALT rises of grade3 or 4 shows no
increasing trend with co-administration with ART as noted by 4 of the 6 events occurring prior to ART initiation.
The study also revealed onset of hyperbilirubinemia though no clear R-dose dependence can be concluded given that
in the arm with R 20mg/kg and EFV 800 mg, grade 3 or 4 rises in bilirubin were not noted. This is consistent with
the documented occasional dose dependent interference effect of R on bilirubin uptake occurring early in treatment
with resultant transient subclinical, unconjugated hyperbilirubinemia or jaundice without hepatocellular damage [68-
71]. The overall mild increase in mean ALT reported across treatment arms during the first 8 weeks of TB treatment
(Figure 3) is typical of the expected idiosyncratic hypersensitivity reaction to R, and usually occurring in the first
months of treatment initiation [68, 76-78]. Nonetheless, the role of H in inducing liver injury could not be excluded
[169] given that no NAT2 genotypic sequencing was done.
The overall absence of onset of CNS adverse events of grade ≥3 in this study, further confirms the safety of using
EFV at 600mg dose even with dose of R as high as 20mg/kg. This is consistent with the already established safety of
EFV among HIV-TB co-infected patients [199]. Few all grade CNS adverse-effects were observed in our study as
compared to the incidence reported in Ugandan patients within another study [279]. No specific adverse events
questionnaire was administered to patients and events were collected on the basis of spontaneous information given
by the patient or following clinician’s observation during follow-up visits. It is likely that AEs were under-reported by
these patients.
Page 119 of 176
3.3.4.3 Efficacy of antiretroviral therapy
Despite the known virological and immunological efficacy of EFV at 600 mg [36], the effect of R co-administration
on EFV dose is not expected to greatly affect its efficacy. Nevertheless, in as much as our study showed good
virological efficacy at 4 and 12 weeks post ART initiation, decline was noted at 24 weeks especially in the two high
dose R arms despite all patients (irrespective of treatment arm) being on standard treatment between week 8 and 28.
These surprising data which could not be fully explained by adherence given that the adherence rates for ART was
good (>95%) throughout the 28 weeks of follow-up in our study and irrespective of treatment arm, have warranted
an ongoing further investigation on the effect of high R doses on the late virological failure.
3.3.4.4 Efficacy of anti-tuberculosis therapy
On the other-hand we noted a slight increase in the week 8 conversion rate, and treatment success rates in the two
treatment arms with R 20 mg/kg, a finding that supports the rifampicin dose-dependent bactericidal effect already
demonstrated in an earlier EBA study [245] and in a recent study at Stellenbosch University, S. Africa [246], in which
an increase in rifampicin dose size to 20 mg/kg (1200 mg) resulted in a substantial linear increase in EBA. Also,
treatment success rates were good (>85%) for all arms.
3.3.4.5 Limitations
This study had some limitations: 1) It was not powered for safety and efficacy determination; 2) Due to laboratory
inability to provide HIV viral load results below the 100 copies/ml, limited the use of a lower threshold at week 24
post ART initiation; 3) The trial only evaluated R doses up to 20 mg/kg limiting the generalizability of the results in
cases of higher R doses like 35 mg/kg which is already evaluated in HIV negative TB patients; 4) We only evaluated
EFV at 600 and 800mg and not lower doses (specifically EFV400) or any other ART drug including the new
dolutegravir.
3.3.4.6 Conclusion
A double-dose of R in co-administration with EFV (600 or 800mg) among HIV/TB co-infected patients is safe, with
no significant effects on EFV blood concentrations, and with resultant good ATT and early ART efficacy. Additional
consideration is required especially to investigate the observed decreased virological suppression at 24 weeks post
ART initiation among the high R dose with EFV 600 mg or 800mg. There is still need to establish the safety of R
Page 120 of 176
doses as high as 35 mg/kg and their effect on the PK of EFV during co-administration before HIV-TB co-infected
patients could be included in the on-going phase III treatment shortening efficacy trials like Rifashort trial. This study
was limited in that it was not powered to evaluate treatment efficacy. These results will need to be further interpreted
in line with the viral genotyping results and R and H PK results, and pharmacogenetic findings.
3.3.5 Involvement in this work
In this study, I was the South principal investigator. I participated in the protocol writing and grant submission. I also
participated in the development of all Trial documents, implementation, patient recruitment, randomization, patients’
clinical assessments, AE detection and reporting, sample shipments, coordination of collaborating laboratories and
recruitment sites, scientific advisory board and Data safety management board meetings, data analysis, interpretation
of results and dissemination at international conference (IAS, 2017 in Paris). I also rotated in the pharmacology
laboratory in Bicetre Hospital under supervision of my PhD Co-director to be acquainted with some of the processes
involved in PK analysis.
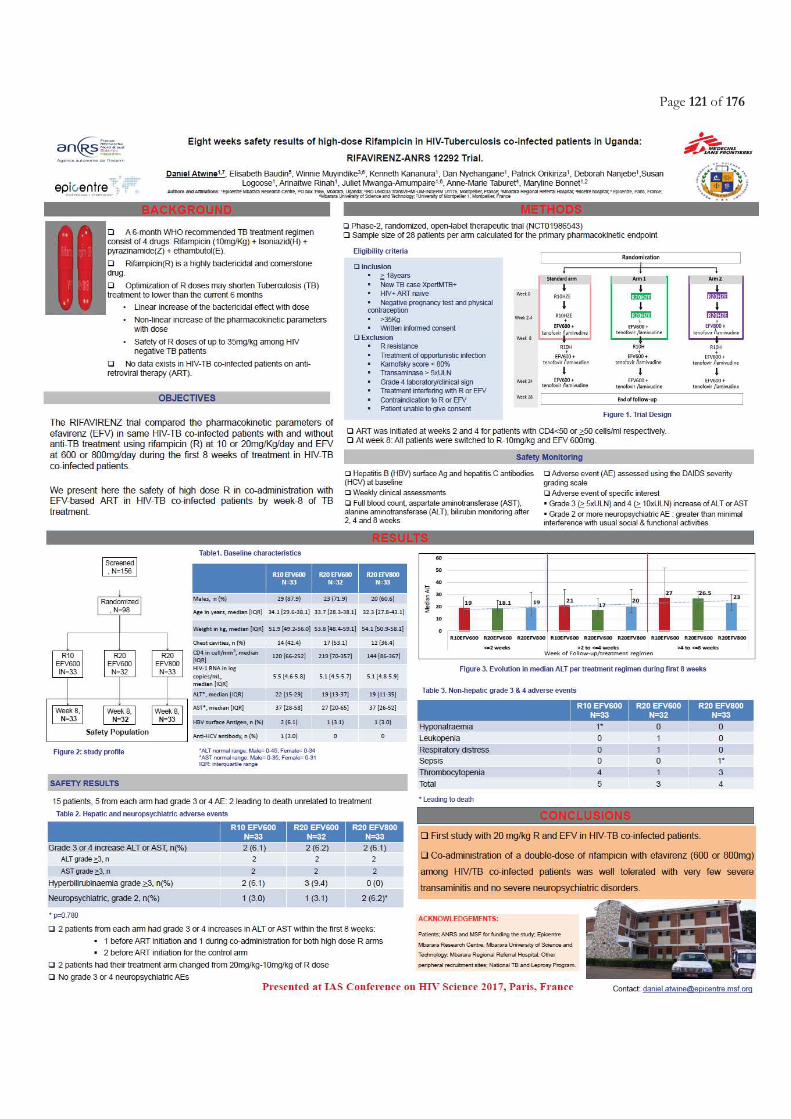
Page 121 of 176

Page 122 of 176
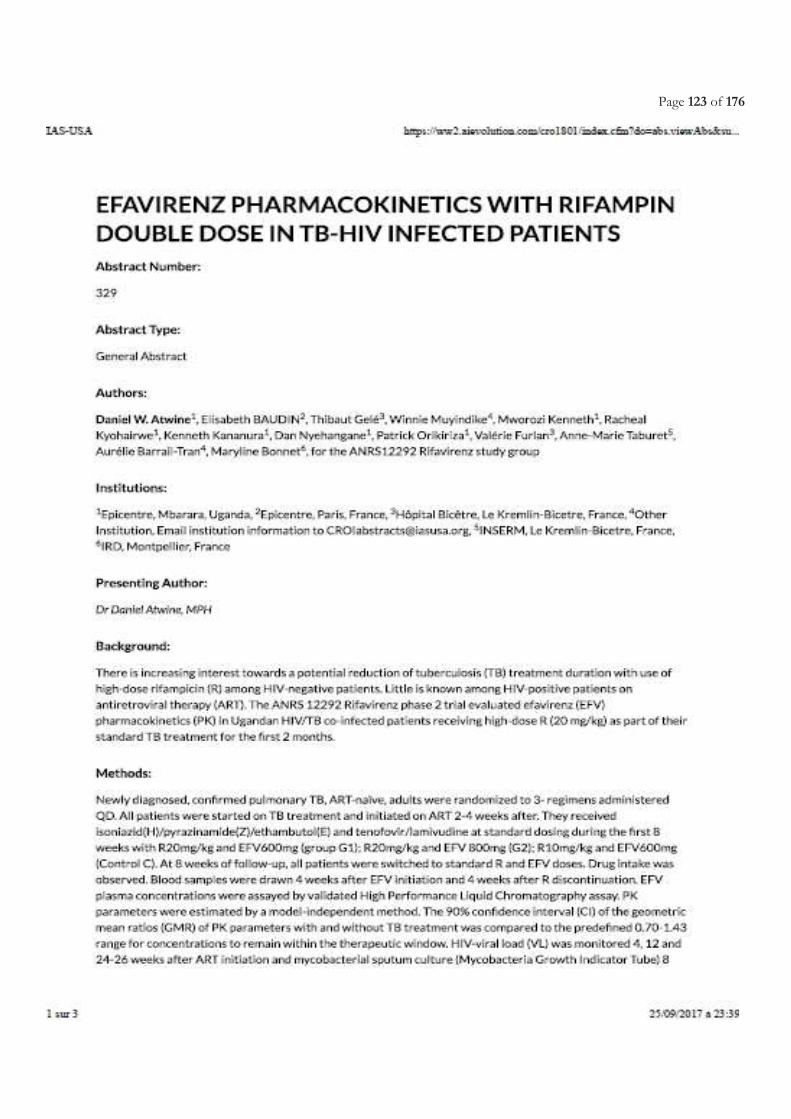
Page 123 of 176
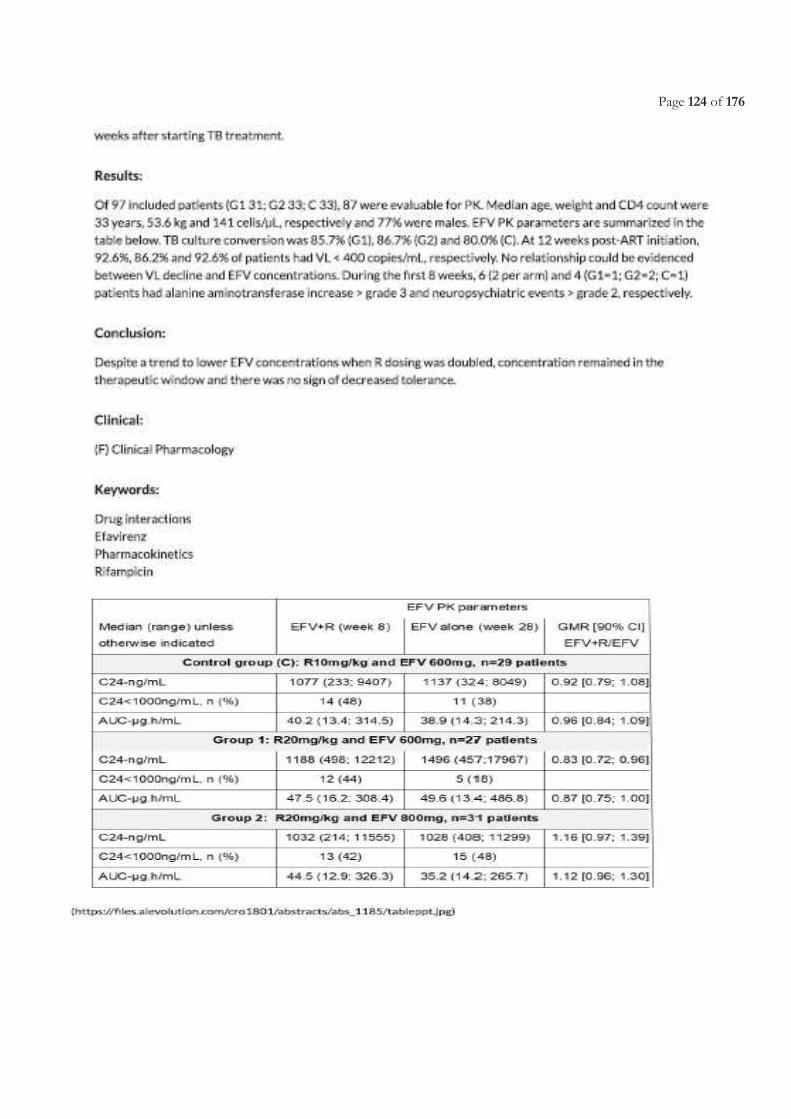
Page 124 of 176
Page 125 of 176
Chapter 3.4 Challenges related to early surrogate markers of TB chemotherapy efficacy within phase 2
trials.
Published article related to this chapter
Atwine Daniel, Orikiriza Patrick, Taremwa Ivan, Arnold Ayebare, Suzan Logoose, Juliet Mwanga-Amumpaire, Amina
Jindani, Maryline Bonnet. Predictors of delayed culture conversion among Ugandan patients. BMC Infectious Diseases (2017)
17:299. URL. https://bmcinfectdis.biomedcentral.com/articles/10.1186/s12879-017-2335-7
(Full Published Manuscript attached at the end of this chapter)
Presentations related to this chapter
Atwine D. Delayed tuberculosis culture conversion: Predictors and mycobacterial culture effect among Ugandan patients.
In. Annual Grande doctors’ Conference, 11-13th August 2016, Kampala, Uganda (Oral presentation)
Atwine D. Delayed tuberculosis culture conversion: Predictors and mycobacterial culture effect among Ugandan patients.
In. 47th Union World Conference on Lung Health, 26 to 29 October 2016 - Liverpool, UK [Abstr ID: SOA-505-27] (Oral
presentation)

Page 126 of 176
Page 127 of 176
3.4.1 Justification and objectives
Culture conversion at month-2, is globally used as proxy indicator of TB chemotherapy efficacy in phase 2 clinical
trials [29, 135, 280].
In addition to the treatment effect, several factors can affect the culture conversion at month-2, such as genetic
polymorphism [281], age above 45 years, high pre-treatment sputum bacterial load, drug resistance extent of the
radiographic involvement or presence of lung cavities, baseline time-to-detection (TTD) of TB, infection with W-
Beijing genotype of M. Tuberculosis, smoking, and alcohol abuse [282-287]. Treatment interruption, irregularity in drug
intake, and inadequate dosage, particularly of rifampicin may also lead to delayed culture conversion [142, 146, 288].
This may explain variability of culture conversion at month-2 across sites in multicenter clinical trials or amongst
trials.
Although not much explored, the variations in culture conversion may also be influenced by type of culture media
[280, 289]. Specifically, the solid culture medium (Löwenstein-Jensen [LJ]) tend to exhibit a slower growth and lower
sensitivity as compared to liquid culture in a mycobacterium growth indicator tube (MGIT) [29, 30]. There is no clear
guidance whether both solid and liquid based culture media should be used in tuberculosis clinical trials for outcome
assessment. This is particularly important for some sites from high TB burden and LMICs which still do have limited
access to liquid culture medium. Therefore, the impact of parallel use of different culture media within the same
geographical patient population on the outcome evaluation of tuberculosis treatment regimen needs further
assessment.
We present results from a sub-study of the Rifatox trial [270]. This sub-study took advantage that within the Rifatox
trial, the Ugandan site used both LJ and MGIT cultures for all patients during the 6 months treatment as per site
guidelines unlike other international sites that used LJ alone and only up to month 2, so as to compare TB detection
rates on different culture media, within and across R-based treatment regimens over a 6-month treatment follow-up
period, and to establish predictors of month-2 culture non-conversion.
3.4.2 Methods, results and conclusion
The study is a nested cohort of the Rifatox trial using data of the patients enrolled from the Mbarara site.
We compared the culture conversion after 2, 4 and 6 months between different culture methods and by study arms
and we identified the baseline patients’ characteristics associated with month 2 culture conversion;
Page 128 of 176
Overall, using both LJ and MGIT, 45% (45/100) had converted on culture by month-2. Culture conversion was 50%
(17/34), 40.6% (13/32) and 44.1% (15/34) for patients in the 10, 15 and 20mg/Kg rifampicin arms, respectively,
p=0.721. It increased to 91.2% (31/34), 83.3% (25/30) and 86.7% (26/30) at month-4 (p=0.685). All patients were
culture negative at month-6.
The overall estimates of culture conversion by LJ were higher than with MGIT at months 2 (56.0% vs 48.4%,
p=0.0707) and month-4 (98.9% vs 88.4%, p=0.0391). Although none showed statistical significance the differences
in conversion rates between LJ and MGIT at month-2 seem more higher within patients in high-dose rifampicin arms
(10% for 15mg/Kg and 14.1% for 20mg/Kg) than patients in the control arm (-1.5%).
Patients with baseline time to detection below 14 days had a 2-fold increased risk of month-2 non-conversion as
compared to those with time to detection of 14 days and above, (aRR=2.1, [95% CI: [1.18-3.93], p=0.013). Patients
working in “social service jobs”, which in this study accounts mostly for motor-bike passenger riders, had a 3-fold
increased risk of month-2 culture non-conversion (RR=3.0, [95%CI:1.11-8.19], p=0.031) as compared to other
patients.
In conclusion, we observed that the low culture conversion at Month 2 was due to delayed culture conversion. It
confirms the slow bacteriological response to treatment or the potential presence of persister bacilli populations
reported among African patients something that has complicated the estimation of early TB chemotherapy efficacy
in a number of multi-centric clinical trials [29, 135, 136, 275]. No significant difference was observed in the conversion
rates across 10, 15 and 20mg/kg rifampicin-based regimens using LJ, MGIT or combination of LJ and MGIT. As
expected, LJ which is known to be a less sensitive culture method than MGIT increased by an average of 10% the
Month 2 culture conversion compared to MGIT. Surprisingly, this effect of culture media used, seem higher in the
high rifampicin dose groups, a phenomenon that may perhaps be explained by a faster reduction in LJ sensitivity
following a more rapid decline in bacilli population due to high doses of rifampicin [146]. The month-2 culture
conversion used in phase 2 clinical trials as surrogate marker of treatment efficacy is influenced by the culture method.
Multi-centric TB therapeutic trials using early efficacy endpoint should use the same culture method across sites.
3.4.3 Involvement in this work
I developed the research synopsis for this sub-analysis, developed data collection tools, extracted data from the trial
database, analyzed data and wrote the manuscript. I also disseminated the results through local and international
conferences, that is Grande doctors’ Conference in Kampala, and Union World Conference on Lung Health in
Liverpool, UK.
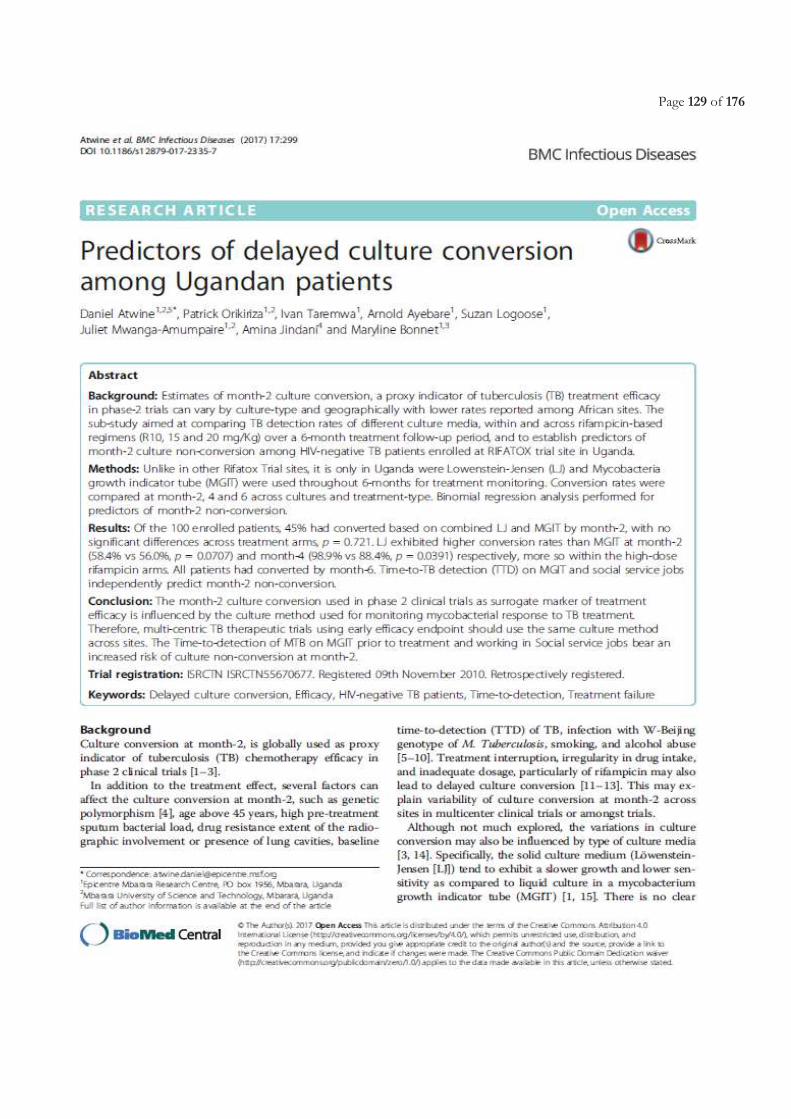
Page 129 of 176
Page 130 of 176
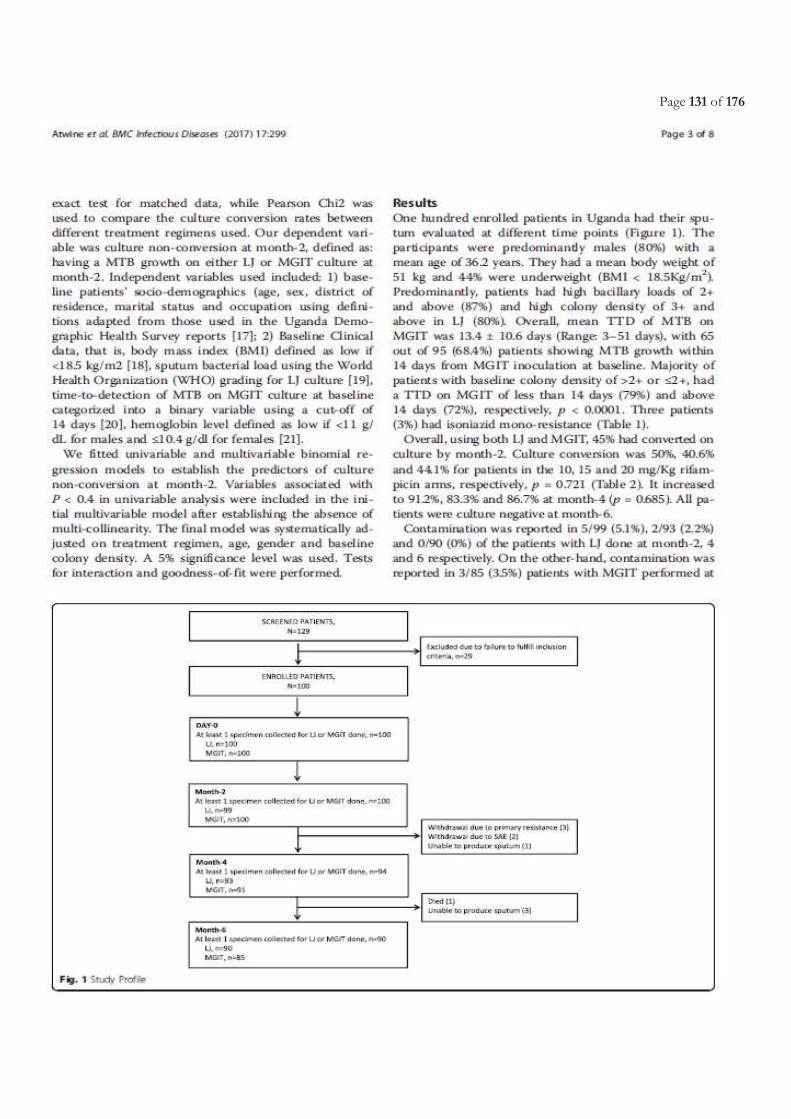
Page 131 of 176
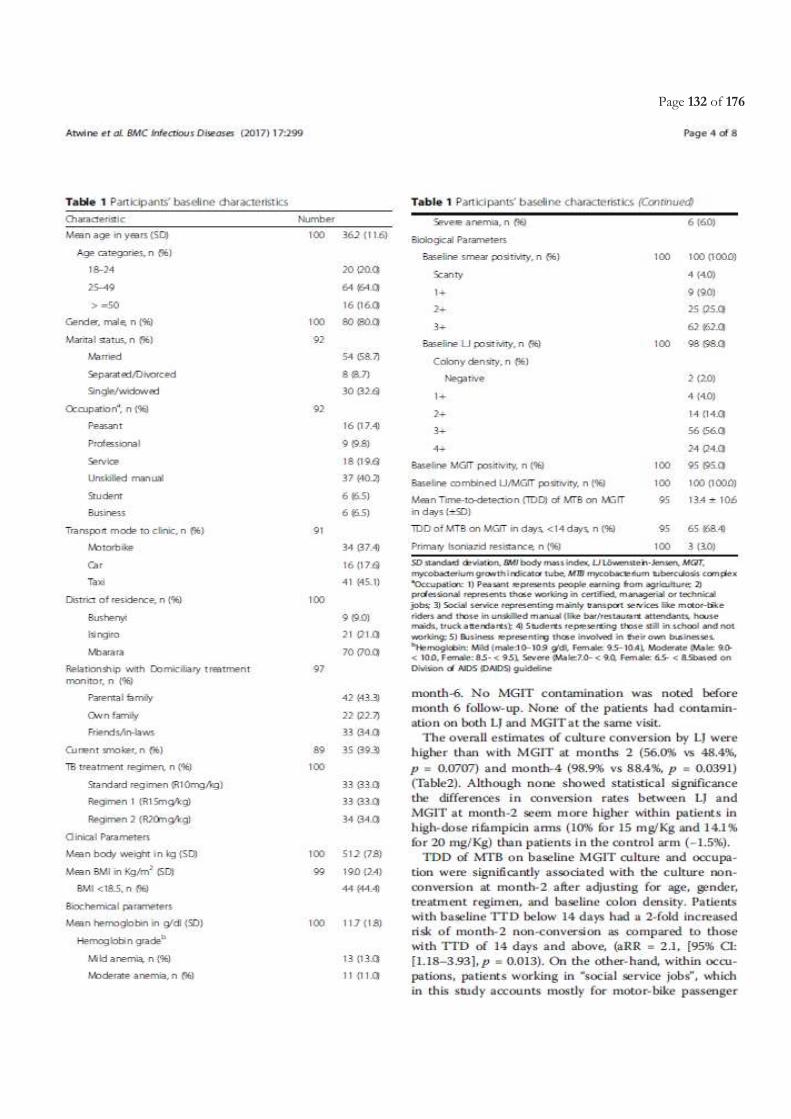
Page 132 of 176
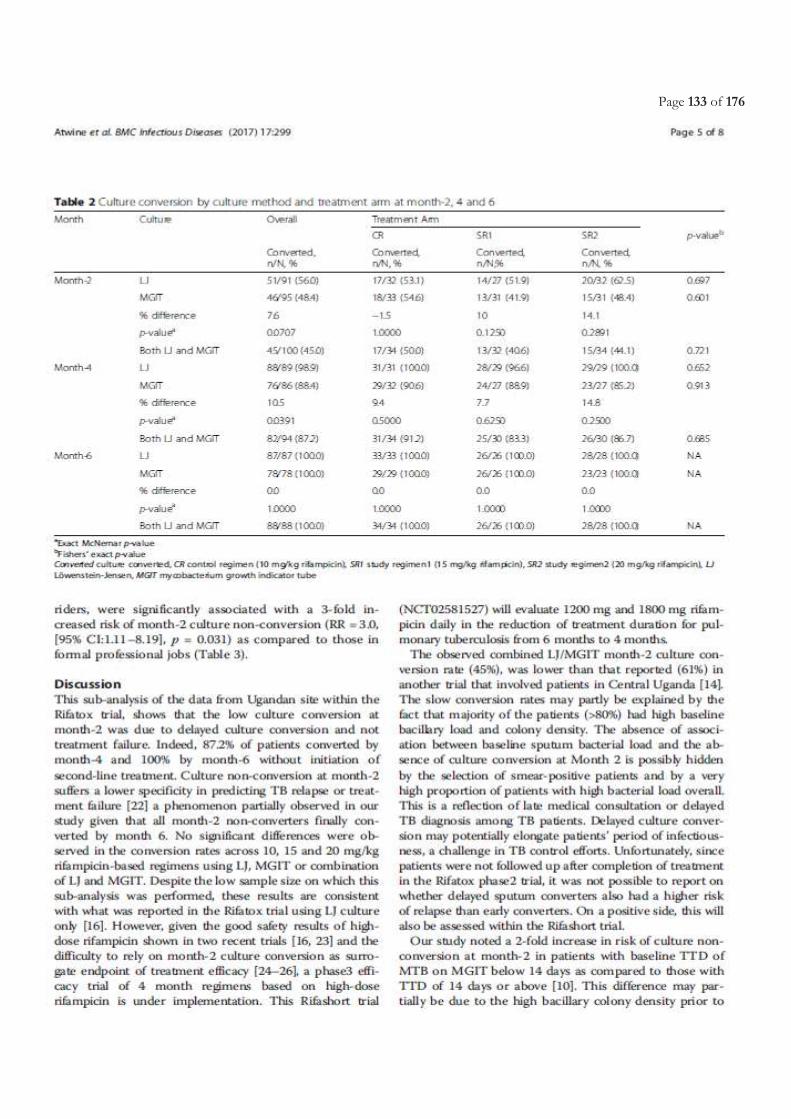
Page 133 of 176
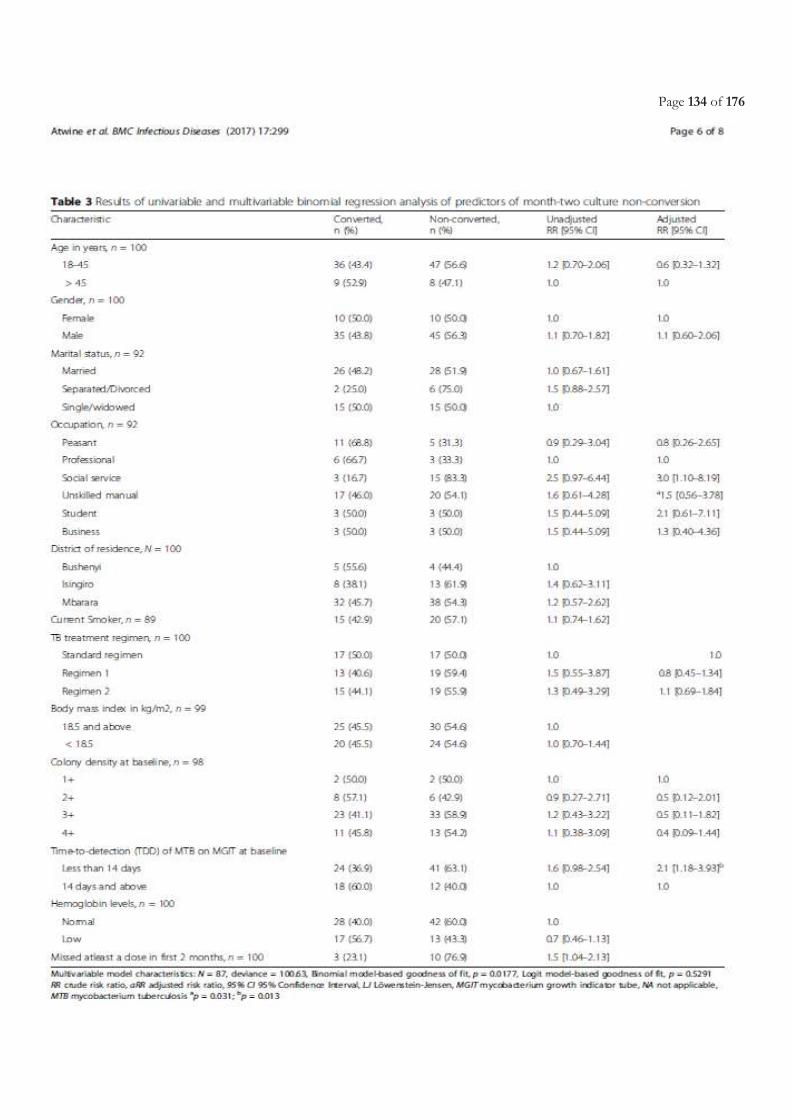
Page 134 of 176
Page 135 of 176
Page 136 of 176

Page 137 of 176
CHAPTER 4
DISCUSSION

Page 138 of 176
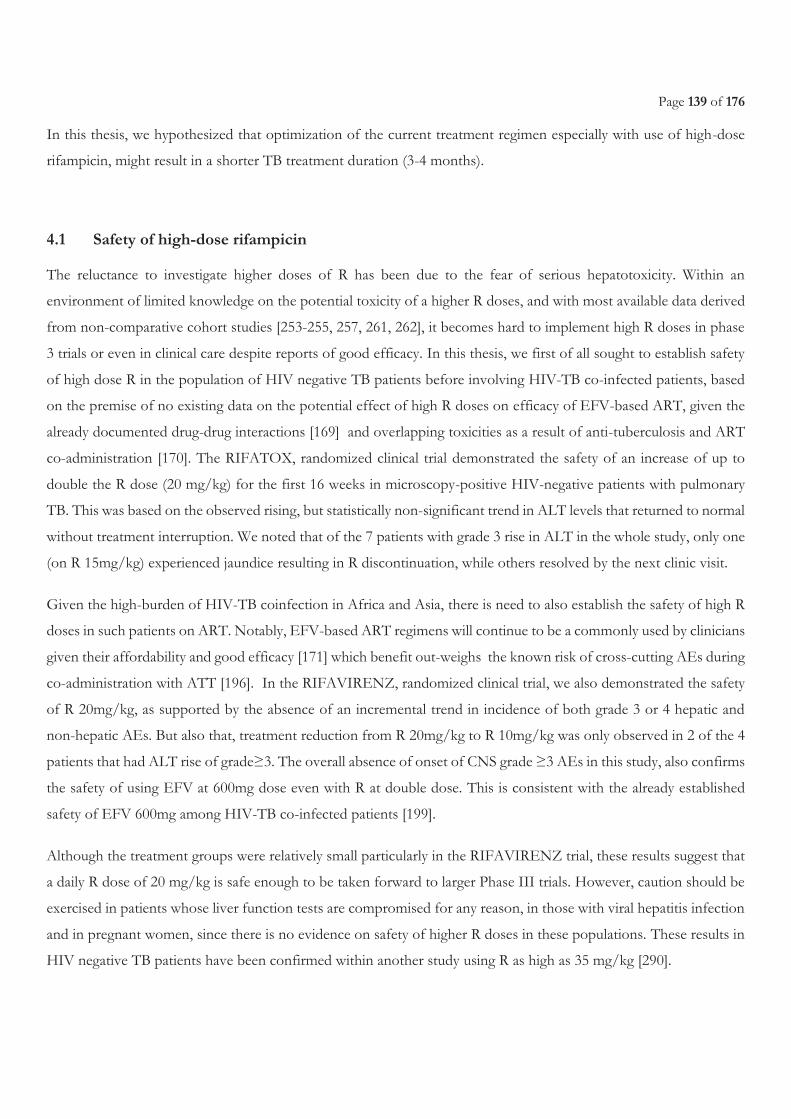
Page 139 of 176
In this thesis, we hypothesized that optimization of the current treatment regimen especially with use of high-dose
rifampicin, might result in a shorter TB treatment duration (3-4 months).
4.1 Safety of high-dose rifampicin
The reluctance to investigate higher doses of R has been due to the fear of serious hepatotoxicity. Within an
environment of limited knowledge on the potential toxicity of a higher R doses, and with most available data derived
from non-comparative cohort studies [253-255, 257, 261, 262], it becomes hard to implement high R doses in phase
3 trials or even in clinical care despite reports of good efficacy. In this thesis, we first of all sought to establish safety
of high dose R in the population of HIV negative TB patients before involving HIV-TB co-infected patients, based
on the premise of no existing data on the potential effect of high R doses on efficacy of EFV-based ART, given the
already documented drug-drug interactions [169] and overlapping toxicities as a result of anti-tuberculosis and ART
co-administration [170]. The RIFATOX, randomized clinical trial demonstrated the safety of an increase of up to
double the R dose (20 mg/kg) for the first 16 weeks in microscopy-positive HIV-negative patients with pulmonary
TB. This was based on the observed rising, but statistically non-significant trend in ALT levels that returned to normal
without treatment interruption. We noted that of the 7 patients with grade 3 rise in ALT in the whole study, only one
(on R 15mg/kg) experienced jaundice resulting in R discontinuation, while others resolved by the next clinic visit.
Given the high-burden of HIV-TB coinfection in Africa and Asia, there is need to also establish the safety of high R
doses in such patients on ART. Notably, EFV-based ART regimens will continue to be a commonly used by clinicians
given their affordability and good efficacy [171] which benefit out-weighs the known risk of cross-cutting AEs during
co-administration with ATT [196]. In the RIFAVIRENZ, randomized clinical trial, we also demonstrated the safety
of R 20mg/kg, as supported by the absence of an incremental trend in incidence of both grade 3 or 4 hepatic and
non-hepatic AEs. But also that, treatment reduction from R 20mg/kg to R 10mg/kg was only observed in 2 of the 4
patients that had ALT rise of grade≥3. The overall absence of onset of CNS grade ≥3 AEs in this study, also confirms
the safety of using EFV at 600mg dose even with R at double dose. This is consistent with the already established
safety of EFV 600mg among HIV-TB co-infected patients [199].
Although the treatment groups were relatively small particularly in the RIFAVIRENZ trial, these results suggest that
a daily R dose of 20 mg/kg is safe enough to be taken forward to larger Phase III trials. However, caution should be
exercised in patients whose liver function tests are compromised for any reason, in those with viral hepatitis infection
and in pregnant women, since there is no evidence on safety of higher R doses in these populations. These results in
HIV negative TB patients have been confirmed within another study using R as high as 35 mg/kg [290].
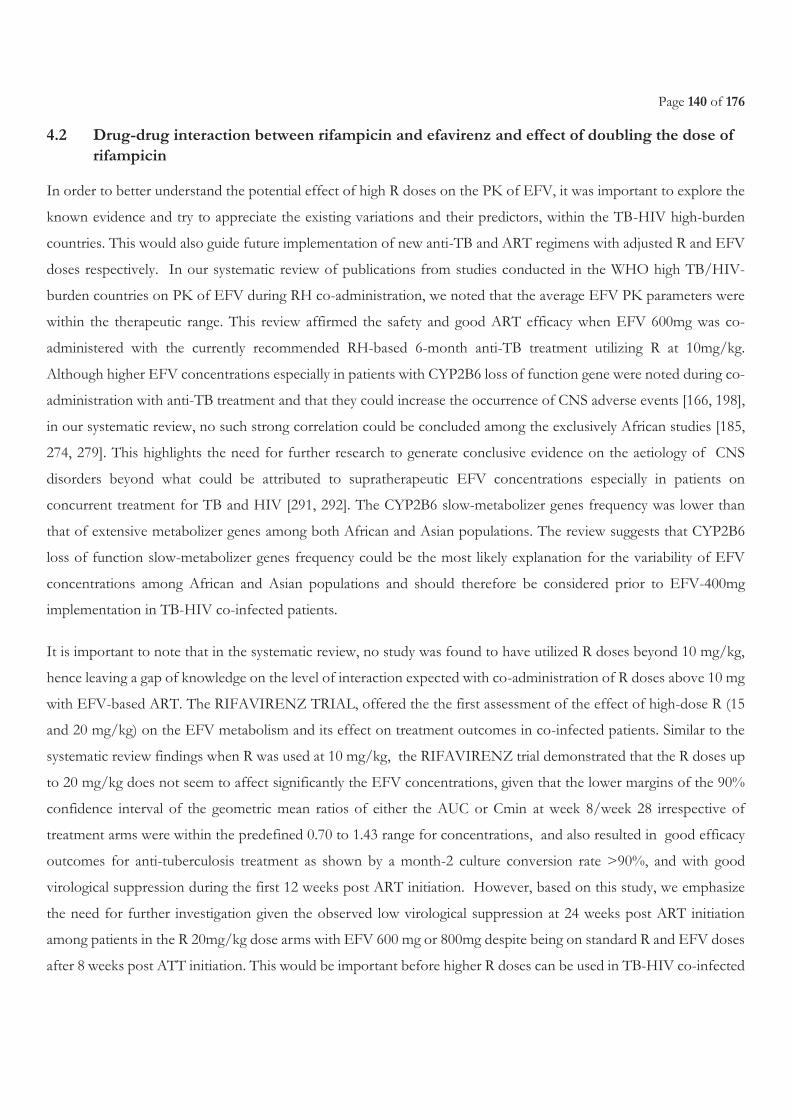
Page 140 of 176
4.2 Drug-drug interaction between rifampicin and efavirenz and effect of doubling the dose of rifampicin
In order to better understand the potential effect of high R doses on the PK of EFV, it was important to explore the
known evidence and try to appreciate the existing variations and their predictors, within the TB-HIV high-burden
countries. This would also guide future implementation of new anti-TB and ART regimens with adjusted R and EFV
doses respectively. In our systematic review of publications from studies conducted in the WHO high TB/HIV-
burden countries on PK of EFV during RH co-administration, we noted that the average EFV PK parameters were
within the therapeutic range. This review affirmed the safety and good ART efficacy when EFV 600mg was co-
administered with the currently recommended RH-based 6-month anti-TB treatment utilizing R at 10mg/kg.
Although higher EFV concentrations especially in patients with CYP2B6 loss of function gene were noted during co-
administration with anti-TB treatment and that they could increase the occurrence of CNS adverse events [166, 198],
in our systematic review, no such strong correlation could be concluded among the exclusively African studies [185,
274, 279]. This highlights the need for further research to generate conclusive evidence on the aetiology of CNS
disorders beyond what could be attributed to supratherapeutic EFV concentrations especially in patients on
concurrent treatment for TB and HIV [291, 292]. The CYP2B6 slow-metabolizer genes frequency was lower than
that of extensive metabolizer genes among both African and Asian populations. The review suggests that CYP2B6
loss of function slow-metabolizer genes frequency could be the most likely explanation for the variability of EFV
concentrations among African and Asian populations and should therefore be considered prior to EFV-400mg
implementation in TB-HIV co-infected patients.
It is important to note that in the systematic review, no study was found to have utilized R doses beyond 10 mg/kg,
hence leaving a gap of knowledge on the level of interaction expected with co-administration of R doses above 10 mg
with EFV-based ART. The RIFAVIRENZ TRIAL, offered the the first assessment of the effect of high-dose R (15
and 20 mg/kg) on the EFV metabolism and its effect on treatment outcomes in co-infected patients. Similar to the
systematic review findings when R was used at 10 mg/kg, the RIFAVIRENZ trial demonstrated that the R doses up
to 20 mg/kg does not seem to affect significantly the EFV concentrations, given that the lower margins of the 90%
confidence interval of the geometric mean ratios of either the AUC or Cmin at week 8/week 28 irrespective of
treatment arms were within the predefined 0.70 to 1.43 range for concentrations, and also resulted in good efficacy
outcomes for anti-tuberculosis treatment as shown by a month-2 culture conversion rate >90%, and with good
virological suppression during the first 12 weeks post ART initiation. However, based on this study, we emphasize
the need for further investigation given the observed low virological suppression at 24 weeks post ART initiation
among patients in the R 20mg/kg dose arms with EFV 600 mg or 800mg despite being on standard R and EFV doses
after 8 weeks post ATT initiation. This would be important before higher R doses can be used in TB-HIV co-infected
Page 141 of 176
patients. We also noted that sub-therapeutic EFV rates did not differ between the high R dose arm and the standard
treatment arm during co-administration with ART. This finding further suggests that EFV exposure may be greatly
influenced by CYP450 genetic polymorphisms rather than just the drug-drug interactions. In addition to this, as
observed in the systematic review, the role of CYP2B6 loss of function genes frequency in the EFV exposure will be
of great importance to further interpret the RIFAVIRENZ trial results in addition to adherence.
4.3 Efficacy of high dose Rifampicin
Despite the fact that both RIFATOX and RIFAVIRENZ trials were not powered for efficacy, we noted an increasing
trend in week-8 culture conversion rates with increase of R to 20 mg/kg. The R dose-response relationship has also
been demonstrated with use of R 35 mg/kg [290]. In this study by Boree, et al, R35 mg/kg exhibited a significantly
faster month-2 culture conversion in liquid media, hence giving more strength to its potential use in shorter regimens
for DS-TB. Time to stable culture conversion in liquid media was faster in the 35 mg/kg rifampicin group than in the
control group (median 48 days vs 62 days, adjusted hazard ratio 1·78; 95% CI 1·22–2·58, p=0·003), but not in other
experimental arms. There was no difference in any of the groups in time to culture conversion on solid media In the
same study, treatment arms containing SQ109 and moxifloxacin failed to show superiority to the standard of care
[290].
4.4 Early efficacy markers for tuberculosis chemotherapeutic trials
Having a good early surrogate marker for TB treatment efficacy in phase II trials, ensures confident decisions for
evaluating potential candidate drugs or regimen in large phase III trials and averts potential enormous losses on
research investment, time and disappointing results in such large trials. The case in point is the 3 quinolone phase 3
trials which despite proven efficacy based on week-8 culture conversion in Phase II trials [230, 231] failed in their
objective to shorten treatment [233-235]. Here, we will address three key questions with regard to use of month-2
culture conversion as a surrogate marker for TB treatment efficacy: 1) Does the performance of month-2 culture conversion
differ across HIV status?; 2) What influences month-2 culture conversion among both TB and HIV-TB co-infected populations?; 3)
What is the impact of the culture media type used on early treatment response indicators, and in the context of shorter TB treatment
regimens? . With the same context within which the two phase II randomized clinical trials (RCTs), that is RIFATOX
(in HIV negative TB patients) and RIFAVIRENZ (in HIV-TB co-infected patients) were implemented, that is among
Ugandan patients, same Ugandan site, using up to double the normal R dose (that is 20 mg/kg), same patient
catchment area, same laboratory facility and used MGIT-based month-2 culture conversion as an early surrogate
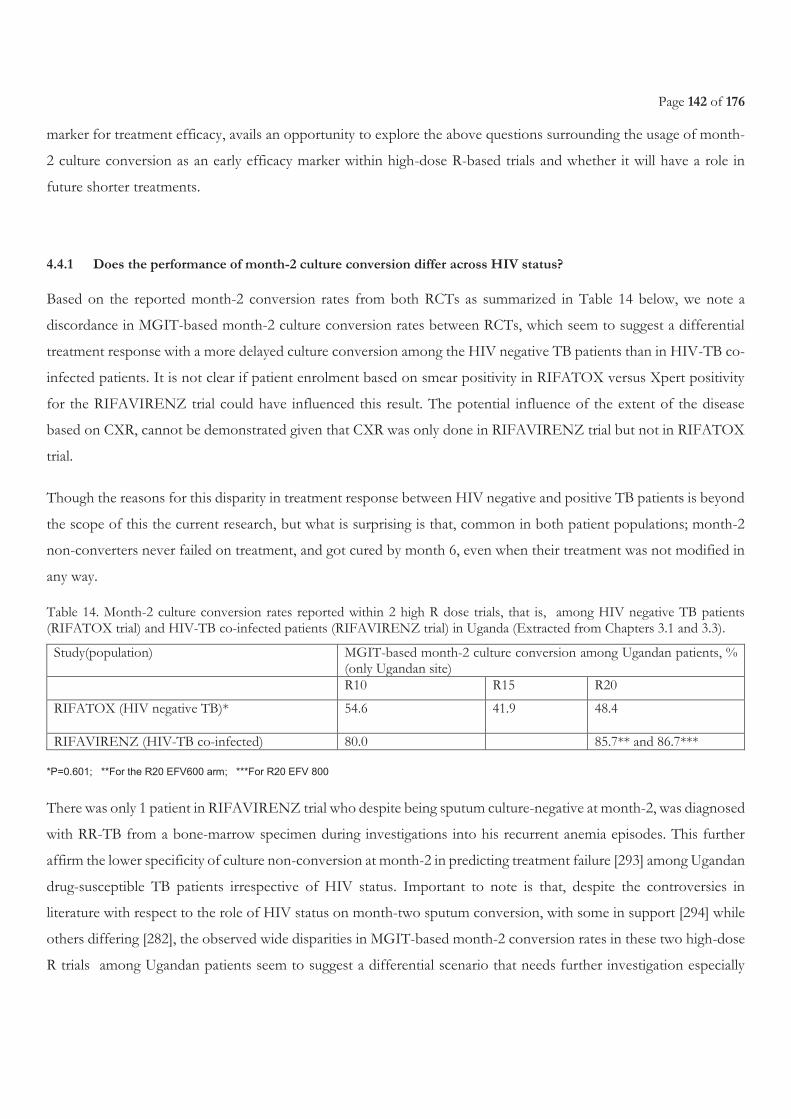
Page 142 of 176
marker for treatment efficacy, avails an opportunity to explore the above questions surrounding the usage of month-
2 culture conversion as an early efficacy marker within high-dose R-based trials and whether it will have a role in
future shorter treatments.
4.4.1 Does the performance of month-2 culture conversion differ across HIV status?
Based on the reported month-2 conversion rates from both RCTs as summarized in Table 14 below, we note a
discordance in MGIT-based month-2 culture conversion rates between RCTs, which seem to suggest a differential
treatment response with a more delayed culture conversion among the HIV negative TB patients than in HIV-TB co-
infected patients. It is not clear if patient enrolment based on smear positivity in RIFATOX versus Xpert positivity
for the RIFAVIRENZ trial could have influenced this result. The potential influence of the extent of the disease
based on CXR, cannot be demonstrated given that CXR was only done in RIFAVIRENZ trial but not in RIFATOX
trial.
Though the reasons for this disparity in treatment response between HIV negative and positive TB patients is beyond
the scope of this the current research, but what is surprising is that, common in both patient populations; month-2
non-converters never failed on treatment, and got cured by month 6, even when their treatment was not modified in
any way.
Table 14. Month-2 culture conversion rates reported within 2 high R dose trials, that is, among HIV negative TB patients (RIFATOX trial) and HIV-TB co-infected patients (RIFAVIRENZ trial) in Uganda (Extracted from Chapters 3.1 and 3.3).
Study(population) MGIT-based month-2 culture conversion among Ugandan patients, % (only Ugandan site)
R10 R15 R20
RIFATOX (HIV negative TB)* 54.6 41.9 48.4
RIFAVIRENZ (HIV-TB co-infected) 80.0 85.7** and 86.7***
*P=0.601; **For the R20 EFV600 arm; ***For R20 EFV 800
There was only 1 patient in RIFAVIRENZ trial who despite being sputum culture-negative at month-2, was diagnosed
with RR-TB from a bone-marrow specimen during investigations into his recurrent anemia episodes. This further
affirm the lower specificity of culture non-conversion at month-2 in predicting treatment failure [293] among Ugandan
drug-susceptible TB patients irrespective of HIV status. Important to note is that, despite the controversies in
literature with respect to the role of HIV status on month-two sputum conversion, with some in support [294] while
others differing [282], the observed wide disparities in MGIT-based month-2 conversion rates in these two high-dose
R trials among Ugandan patients seem to suggest a differential scenario that needs further investigation especially
Page 143 of 176
through establishing factors associated with this high month-2 culture conversion in HIV-TB co-infection within the
same setting as we have done for the HIV negative TB population [295], but also to establish its predictability of TB
relapse and recurrence. Also, this disparity based on HIV status, questions the applicability of the suggestion made
in the retrospective study of several phase 3 TB trials conducted by the British Medical Council in Hong Kong and
East Africa, recommending the use of months-3 instead of month-2 culture conversion endpoint as a surrogate of
treatment efficacy within the phase II East African trials [133]. Although this could apply to the HIV negative TB
population who according to our study suffered delayed month-2 conversion rates, but this may not be the case for
the HIV-TB co-infected population. However, given the search for shorter TB regimens, the focus should be on even
much early (less than 2 months) biomarkers or surrogate markers.
4.4.2 What influences month-2 culture conversion among both TB and HIV-TB co-infected populations?
As reported in Chapter 3.4 of the thesis, from our analysis of the RIFATOX data for the Ugandan site, the observed
low month-2 culture conversion rates could not be explained by treatment regimen. Contrary to other studies[282],
baseline colony density revealed no influence on month 2 culture non-conversion potentially because the study
population was almost homogeneous in the respect that over 80% of the participants had high baseline bacillary loads
and colony density (≥2+). On the other-hand, pre-treatment time-to-detection (TTD) of MTB on MGIT of <14
days independently predicted month-2 culture non-conversion as compared to TTD of 14 days and above, something
that confirms results in previous reports [283]. However, though TTD has also been associated with TB recurrence
and relapse [280, 286], this could not be evaluated in this thesis since RIFATOX trial lacked an extended post-
treatment follow-up. The influence of socio-economic indictors, precisely the type of occupation was noted as an
important predictor of month-2 culture non-conversion. Beside the need to consider these factors during efficacy
analysis in future phase II trials, the question necessitating further research is on whether the same or different factors
do influence month-2 culture conversion among HIV-TB co-infected patients in the context of high R dose research.
4.4.3 What is the impact of the culture media type used on early treatment response indicators, and in context of
shorter treatment regimens?
As reported in Chapter 3.4 of the thesis, we demonstrated that the reported month-2 culture conversion rates in phase
II trials, vary across different culture media used, something that could affect interpretation and comparability of
treatment efficacy between phase II trials in a bid to facilitate decisions for progression to phase II trials. In our study,
we demonstrated that LJ (solid media) always gave culture conversion rates that are higher than those of MGIT (liquid
Page 144 of 176
media) with differences becoming wider or more pronounced in all patients by month-4 of treatment follow-up of
the 6 month TB treatment. Beyond the already known higher sensitivity of MGIT over LJ [29, 30], the fact that
significantly wider difference in MTB detection between LJ and MGIT tend to occur earlier (by month 2) among
patients on high R dose regimens (15 or 20 mg/kg) as compared to those on R10 mg/kg, may imply an early or faster
reduction in LJ sensitivity following an early R dose-dependent faster clearance of tubercle bacilli population [146].
In this analysis, it was evident that in the environment of high R dose use, its usage as a treatment monitoring culture
tool could be down-played because of this early loss of sensitivity and so could give over-estimated early indication
of treatment efficacy. Though not easily accessible, with few but increasing number of laboratories with liquid culture
infrastructure among LMICs, it may offer a more reliable early indication of treatment response given its ability to
detect even persister populations of TB. Based on these results, we also recommend that the same culture media to
be used across sites especially within the context of multi-centric TB chemotherapeutic trials so as to enable inter-site
comparisons.
With the much anticipated and soon to come shorter TB treatments, early treatment efficacy indicators, that is earlier
than 2 months will be needed so as to guide early treatment and diagnostic decisions. The question of whether month-
2 culture conversion will still have a place as a surrogate marker for treatment efficacy within the context of future 4
months or less TB treatment lies in balance and cannot be answered by the results of our phase 2 high-dose R trials
(RIFATOX and RIFAVIRENZ). However, our results suggests the evaluation of early markers like pre-treatment
TTD and less than 2 months culture conversion, especially in studies evaluating the use of high-dose R or other drug
compounds in shortening TB treatment that have a long post-TB treatment follow-ups. Also, given the observed
disparities in month 2 culture conversion rates across HIV status, it is paramount that this should be considered in
future evaluation of efficacy markers appropriate in shorter treatment durations.
4.5 Perspective of TB treatment shortening
RIFASHORT trial- NCT02581527 is one of the only two ongoing phase III trials globally, with a focus to shorten
TB treatment duration to 4 months in HIV negative patients with drug-susceptible tuberculosis by using high doses
of rifampicin or rifapentine with or without moxifloxacin [229]. Epicentre in Mbarara is participating as one of the
Trial sites. It is an international multicentre open-label 3-arm controlled clinical trial comparing a standard 6-month
control regimen with two 4-month treatment regimens utilizing either R 20 mg/kg or R 35 mg/kg, for the treatment
of TB. The trial is supported by safety data from phase 2 trials that have explored safety, pharmacokinetics and
bactericidal effects of high R doses, in patients with TB [263, 270, 296]. The second ongoing Phase III trial TBTC
31/ACTG A5349 (NCT02410772) utilizes another rifapentine given at 1200 mg as part of two four-month regimens
Page 145 of 176
for the treatment of DS-TB. The first experimental regimen in this trial simply replaces R with rifapentine and reduces
the continuation phase to two months. The second experimental regimen is the same as the first, but replaces
ethambutol with moxifloxacin and continues moxifloxacin for the continuation phase[229].
There is currently no treatment shortening Phase III clinical trial enrolling TB-HIV co-infected patients. Both ongoing
and some completed trials on high R doses have only included HIV negative TB patients [263, 270, 296]. The inclusion
of TB-HIV co-infected patients in phase III trials will necessitate additional evidence on the magnitude of interaction
between ART and high R doses and its impact on safety and efficacy of ART. Our results from the RIFAVIRENZ-
ANRS 12292 Trial (ClinicalTrials.gov Identifier: NCT01986543) offer the initial hope for future involvement of HIV-
TB co-infected patients into treatment shortening phase III trials. However, prior to their inclusion in phase III trials,
more RCTs evaluating R-doses higher than 20mg/kg may need to be done. On the other hand, within the ongoing
RIFASHORT trial, the potential of R 20 mg/kg and R 35 mg/kg in shortening TB treatment to 4 months among
HIV negative TB populations will finally be concluded, with results expected by late 2019.
The research progress towards TB treatment shortening using high R doses may be affected by the parallel advances
in HIV treatments, especially with the introduction of DTG and recommendation of EFV at 400mg as alternatives
to EFV 600 in the first-line regimen [36]. Nevertheless, though the effect of R on EFV PK when administered at
the standard dose of 600 mg/day is well documented and with still good ART efficacy [297], it is not clear whether
the same consistent efficacy will be seen for the lower 400-mg dose of EFV when co-administered with normal or
high-dose R. On the other-hand, the safety and efficacy of DTG among TB/HIV co-infected patients using R has
not been established [298]. Therefore, given the expected increasing adoption of DTG among HIV and TB high-
burden countries, it is pertinent that phase II RCTs be conducted to evaluate the safety, efficacy and pharmacokinetics
of DTG with use of high R doses among HIV-TB co-infected patients, as part of the preliminary steps in fast-tracking
TB treatment shortening among HIV-TB co-infected patients.
4.6 Conclusion
In conclusion, we have demonstrated that doubling R dose is safe and with good TB treatment outcomes in both TB
and HIV-TB infected patients. Our study findings support the progression to phase III efficacy trials focused on
treatment shortening to 4 months with use of atleast double the normal R doses among HIV negative TB patients.
We recommend further preliminary phase II trials to investigate the safety and effect of high R doses up to 35 mg/kg
(as already utilized in RIFASHORT trial) on the EFV and dolutegravir-based ART regimen efficacy among HIV-TB
Page 146 of 176
co-infected patients prior to their involvement in treatment shortening phase III trials. We also recommend further
studies to investigate the effect of higher R doses on persister bacilli clearance. Studies evaluating new and existing
biomarkers and early surrogate markers for treatment efficacy that would be appropriate for future shorter treatment
durations are needed to ensure a more accurate prediction of late TB treatment efficacy (TB recurrence, relapse and
treatment failure).and should be incorporated within the ongoing and future TB treatment shortening RCTs.

Page 147 of 176
SUMMARY
Page 148 of 176
The recommended 6-month treatment for drug-susceptible tuberculosis (DS-TB) is too long, hence threatening patient
adherence, with resulting treatment failure and drug-resistance. Consequently, this complicates efforts towards achieving the TB
control and elimination goal. Currently, no new drug is expected in the short term for reducing treatment duration. We
hypothesized that optimization of the current treatment regimen with use of high-dose rifampicin (R), above the 10mg/kg
current dose, might result in a shorter TB treatment duration (3-4 months). Clinical trials were conducted to investigate two
research areas: first, Safety of high-dose R in HIV-negative TB and in HIV-TB co-infected patients; secondly, drug-drug
interaction between high-dose R and antiretroviral drugs. A 3rd research area addressed the use of 2 months sputum culture
conversion as surrogate marker for treatment efficacy in TB trials.
A Phase II, open-label randomized controlled trial (RIFATOX) was conducted with sites in Bolivia, Peru and Uganda. Three
hundred HIV-negative smear-positive TB patients were randomised between three regimens differing only by R dose during the
first 16 weeks of the standard 24 weeks treatment: R at 10 mg/kg and two high-R doses (15mg/kg or 20mg/kg). Liver function
and bacteriological response were monitored. There was no significant increase in hepatotoxicity with high-dose R. Using data
from the cohort of patients from the Ugandan site only, we showed that month-2 culture conversion, a commonly used surrogate
marker in phase 2 trials was influenced by the culture method used with significantly higher conversion rates noted with solid
versus liquid media within patients on high-R dose regimens. We therefore recommend use the same culture method across sites
within multi-centric TB trials.
We conducted a systematic review to gather existing information on the pharmacokinetics, adverse effects and efficacy of
efavirenz (EFV), the most commonly used antiretroviral drug, co-administered with R-based TB regimens among high TB/HIV-
burden countries. Twenty-two articles published between 2006 and 2016 were analyzed. With the use of 600mg EFV daily,
plasma concentrations on average were above the minimum therapeutic concentrations during R co-administration with good
safety and efficacy. No clear relationship between supratherapeutic EFV concentrations and occurrence of neurological and
hepatic adverse events was observed.
Then, we conducted a phase-2, randomized, open-label pharmacokinetic trial (ANRS12292 RIFAVIRENZ trial) among 97 DS-
TB patients and antiretroviral therapy (ART)-naïve Ugandan patients. These were randomized between 3 drug regimens: 2 using
R (20mg/Kg) with ART initiation 2-4 weeks later with EFV600mg/day or 800mg/day) and a control regimen using R10mg/kg
and EFV600mg/day. At 8 weeks, all patients were switched to standard R and EFV doses. All patients had intensive
pharmacokinetic sampling 4 weeks after EFV-R co-administration, and 4 weeks after R discontinuation. Despite a trend of lower
EFV concentration when the R dose was doubled, concentrations remained within the therapeutic window. Treatment with
high-dose R was well tolerated. Virological efficacy was high during the first 12 weeks on ART but reduced in the R arms after
24 weeks. We conclude that, use of high-dose R at 20mg/Kg is safe and could be evaluated in larger trials towards shortening
of treatment for DS-TB patients. Due to late virological failures in patients on R 20 mg/kg and standard EFV dose,
comprehensive efforts through additional research are needed to fast-track the inclusion of TB-HIV co-infected patients in
phase 3 trials.
Page 149 of 176
Short summary
The 6 months treatment for tuberculosis (TB) is too long, a challenge to patients and need shortening. Unfortunately, there are
no promising new drugs to achieve this. Another option is using higher than usual doses of one of the existing TB drugs
especially rifampicin. This needs evidence on whether it would kill TB germs faster, without increasing dangerous side-effects
or interfering with efavirenz, the commonly used HIV drug in Africa and reducing their ability to adequately kill and reduce
numbers of HIV viruses in blood.
In our investigations, we found that up to double the normal dose of rifampicin was safe either in TB mono-infected patients
or in HIV-TB co-infected patients. We also demonstrated in HIV-TB co-infected patients that a double dose of rifampicin did
not impair very much the amount of efavirenz in the body.
Additional work is needed to explain the decreased efficacy of efavirenz in patients who received the rifampicin double dose
and standard efavirenz dose.

Page 150 of 176
Page 151 of 176
Résumé
Le traitement actuel de la tuberculose chimio-sensible est de 6 mois, ce qui est beaucoup trop long et entraine des défauts
d’adhésion au traitement, des échecs thérapeutiques par sélection de bactéries résistantes. Puisque dans le futur proche, aucun
nouveau traitement ne permettra de raccourcir la durée de traitement, d’autres voies doivent être recherchées, entre autres
l’augmentation de la posologie de rifampicine (R) au-delà des 10 mg/kg actuellement recommandés qui pourrait permettre un
traitement de 3-4 mois.
Notre travail, réalisé dans le cadre d’essais cliniques, a consisté d’une part à étudier la tolérance d’une dose élevée de R au sein
du traitement antituberculeux standard chez des patients tuberculeux séronégatifs ou séropositifs pour le VIH, et d’autre part
l’interaction entre une double dose de R (20mg/kg) et le traitement antirétroviral, en particulier l’efavirenz (EFV). Enfin un
autre axe de recherche a consisté à étudier si la négativation des cultures de crachat à 2 mois pouvait être un marqueur de
l’efficacité du traitement antituberculeux dans les essais cliniques. Afin de répondre à ces objectifs, les études suivantes ont été
réalisées.
Une étude ouverte, de Phase II, randomisée, contrôlée (RIFATOX) a été mise en place (Bolivie, Pérou and Ouganda). Trois
cent patients tuberculeux, séronégatifs pour le VIH ont été randomisés entre 3 schémas thérapeutiques se différenciant par la
posologie de la R durant les 16 premières semaines : R à 10, 15 ou 20 mg/kg. La fonction hépatique et la réponse bactériologiques
ont été monitorées. La toxicité hépatique n’était pas plus importante à dose élevée de R. En utilisant les résultats des patients
ougandais, nous avons montré que la négativation des cultures à deux mois était influencée par le type de milieu de culture utilisé,
avec négativation plus importante en milieu solide qu’en milieu liquide pour les traitements avec dose élevée de R. Ces résultats
nous amènent à recommander que le même milieu de culture soit utilisé dans tous les sites lors d’essais multicentriques visant à
étudier l’efficacité de traitement antituberculeux.
Une étude bibliographique « systématique » a été réalisée afin de colliger les informations existantes sur l’efficacité, la tolérance
et les interactions pharmacocinétiques de l’EFV associé au traitement antituberculeux à posologie standard dans les pays à forte
endémie. Vingt-deux articles publiés entre 2006 et 2016 ont été sélectionnés. Aucune relation entre des concentrations élevées
d’EFV et la survenue d’effets indésirables neurologiques ou hépatiques n’a pu être mise en évidence.
Au vu de ces informations, un essai pharmacocinétique de phase 2, ouvert (ANRS12292 RIFAVIRENZ trial) a randomisé 97
patients tuberculeux vivant avec le VIH et naïfs de traitement antirétroviral entre 3 bras de traitement : R20mg/kg+EFV 600mg,
R20mg/kg +EFV 800 mg et R10mg/kg+EFV600mg (bras contrôle). R était associé au traitement antituberculeux à posologie
standard et EFV associé à deux analogues nucléosidiques (tenofovir+lamivudine) a été initié 2-4 semaines après le traitement
antituberculeux. Après 8 semaines de suivi, tous les patients ont reçu les traitements à posologie standard. Des prélèvements
sanguins ont été réalisés pour étudier la pharmacocinétique de l’EFV associé à R ou administré seul (4 semaines après arrêt du
traitement antituberculeux). Malgré une légère diminution des concentrations d’EFV dans le bras R20 mg/kg+EFV 600mg, les
concentrations sont restées dans la zone des concentrations thérapeutiques. Quelque soit le bras de traitement, le traitement a
été bien toléré. Cependant s’il n’y avait pas de différence sur l’efficacité virologique mesurée à 12 semaines, elle était diminuée à
24 semaines dans le bras R20 mg/kg+EFV 600mg. La pertinence clinique de ce résultat est en cours d’évaluation pour que des
patients tuberculeux vivant avec le VIH puissent être inclus dans de futurs essais de phase 3.
Page 152 of 176
Résumé court
La durée du traitement antituberculeux actuellement de 6 mois est trop longue et doit être raccourcie. Pour atteindre cet objectif,
malheureusement, aucun nouveau médicament ne sera disponible prochainement. Une autre possibilité est d’augmenter la
posologie des médicaments actuels en particulier de la rifampicine. Cependant il est nécessaire de vérifier que la tolérance reste
acceptable et qu’il n’y a pas d’interaction avec les médicaments prescrits dans le VIH en Afrique, en particulier l’efavirenz. Dans
notre travail réalisé en Ouganda, nous avons montré qu’une double dose de rifampicine au sein d’un traitement standard était
bien toléré aussi bien chez des patients monoinfectés par la tuberculose que ceux coinfectés par le VIH. Par ailleurs la dose
augmentée de rifampicine modifie très peu la quantité d’efavirenz dans l’organisme lorsque ces traitements sont associés. Ce
travail devra néanmoins être poursuivi pour comprendre la diminution d’efficacité virologique observée.

Page 153 of 176
REFERENCES
Page 154 of 176
References
1. Vilaplana C., A literary approach to tuberculosis: lessons learned from Anton Chekhov, Franz Kafka, and Katherine
Mansfield. International Journal of Infectious Diseases 2017. 56: p. 283-285.
2. Lauzardoa M. and Peloquin C.A., Tuberculosis therapy for 2016 and beyond Expert Opinion on Pharmacotherapy,
2016. 17(14): p. 1859-1872.
3. World Health Organization. Use of high burden country lists for TB by WHO in the post-2015 era. . 2015 [cited
2017 15th August]; Available from:
http://www.who.int/tb/publications/global_report/high_tb_burdencountrylists2016-2020.pdf?ua=1.
4. Minor L.M. and Véron M., Mycobacterium tuberculosis. Bactériologie médicale. Flammarion Médecines Sciences.
2nd ed. Vol. 966-82. 1989.
5. Official statement of the american thoracic society., Diagnosis and Treatment of Disease Caused by
Nontuberculous Mycobacteria. . Am J Respir Crit Care Med, 1997. 156: p. S1-S25.
6. Vincent V. , Actualité des mycobactéries. . Traité de microbiologie clinique. , 2000. Piccin 2nd: p. 57-62.
7. Ait-Khaled N. and Enarson D., Tuberculose Manuel pour les Etudiants en Medecine. Organisation mondiale de la
santé 1999.
8. Crofton J., Horne N., and Miller F., Clinical Tuberculosis. MacMillan Education LTD,. 2nd ed. 1999.
9. Andersen P., et al., Specific immune-based diagnosis of tuberculosis. Lancet, 2000. 356: p. 1099-104.
10. Ferrara G., et al., Use in routine clinical practice of two commercial blood tests for diagnosis of infection with
mycobacterium tuberculosis: a prospective study. . Lancet, 2006. 367: p. 1328-34.
11. Rieder H.L., Epidemiologic Basis of Tuberculosis Control. Internation Union Against Tuberculosis and Lung
Diseases & World Health Organisation, . 1st ed. 1999.
12. Pio A. and Chaulet P., Tuberculosis handbook. World Health Organisation 1st ed. 1998.
13. Pai M., et al., Tuberculosis. Disease Primers, 2016. 2: p. 1-23.
14. Narasimhan P., et al., Risk Factors for Tuberculosis. Hindawi Publishing Corporation Pulmonary Medicine, 2013.
2013: p. 1-11.
15. Herchline T.E. Tuberculosis Clinical Presentation. 2016 25th October 2016 [cited 2017 05th September];
Available from: http://emedicine.medscape.com/article/230802-clinical#b3.
16. World Health Organization. Global Tuberculosis Report. . 2016 [cited 2017 21st June ]; Available from:
http://www.who.int/tb/publications/global_report/en/.
17. World Health Organisation. WHO declares TB an emergency in Africa: Call for "urgent and extraordinary actions”
to halt worsening epidemic. 2005 [cited 2017 15th August]; Available from:
http://www.who.int/mediacentre/news/releases/2005/africa_emergency/en/.
18. World Health Organization. Global Health Observatory (GHO) data: HIV/AIDS Global situation and Trends. 2016
[cited 2017 13th July]; Available from: http://www.who.int/gho/hiv/en/.
19. World Health Organization. Tuberculosis and HIV. 2014 [cited 2017 12th July]; Available from:
http://www.who.int/hiv/topics/tb/about_tb/en/.
Page 155 of 176
20. Harries A., Maher D., and Graham S., TB/HIV: a clinical manual. World Health Organisation 2nd ed. 2004.
21. Santoro-Lopes G., et al., Reduced risk of tuberculosis among Brazilian patients with advanced human
immunodeficiency virus infection treated with highly active antiretroviral therapy. . CID, 2002. 34: p. 543-6.
22. Badri M., Wilson D., and Wood R., Effect of highly active antiretroviral therapy on incidence of tuberculosis in
South Africa: a cohort study. Lancet, 2002. 359: p. 2059-64.
23. Nagu TJ., et al., Tuberculosis associated mortality in a prospective cohort in Sub-Saharan Africa: Association with
HIV and antiretroviral therapy. . Intl J Infect Dis, 2017. 56: p. 39-44.
24. Girardi E., et al., The global dynamics of diabetes and tuberculosis: the impact of migration and policy
implications. Intl J Infect Dis, 2017. 56: p. 45-53.
25. World Health Organisation. Ethics guidance for the implementation of the End TB Strategy. . 2017 [cited 2017
14th August]; Available from: http://www.who.int/tb/publications/2017/ethics-guidance/en/.
26. Cazabon D., et al., Quality of tuberculosis care in high burden countries: the urgent need to address gaps in the
care cascade. . Int J Infect Dis., 2017.
27. Steingart K.R., et al., Sputum processing methods to improve the sensitivity of smear microscopy for tuberculosis:
a systematic review. Lancet Infect Dis, 2006. 6: p. 664–674.
28. Colebunders R. and Bastian I., A review of the diagnosis and treatment of smear-negative pulmonary
tuberculosis. . Int. J. Tuberc. Lung Dis., 2000. 4: p. 97-107.
29. Mitchison D. and Davies G., The chemotherapy of tuberculosis: past, present and future. Int J Tuberc Lung Dis,
2012. 16(6): p. 724-732.
30. Thornton C.G., et al., In vitro comparison of NALC-NaOH, Tween 80, and C18-carboxypropylbetaine for
processing of specimens for recovery of mycobacteria. J. Clin. Microbiol., 1998. 36: p. 3558–3566.
31. Urdea M., Penny A., and Olmsted S., Requirements for high impact diagnostics in the developing world. . Nature
reviews, 2006. 444: p. 73-79.
32. Raja S., Ching J., and Xi L., Technology for automated, rapid, and quantitative PCR or reverse transcription-PCR
clinical testing. Clin Chem, 2005. 51: p. 882-890.
33. Amin I., et al., PCR could be a method of choice for identification of both pulmonary and extra-pulmonary
tuberculosis. BMC Research Notes, 2011. 4: p. 332.
34. World Health Organisation., Automated real-time nucleic acid amplification technology for rapid and
simultaneous detection of tuberculosis and rifampicin resistance: Xpert MTB/RIF assay for the diagnosis of
pulmonary and extrapulmonary TB in adults and children. Policy update. 2013: Geneva.
35. World Health Organisation., Xpert MTB/RIF assay for the diagnosis of TB: Meeting Report. 2016, WHO: Geneva.
36. World Health Organization. Consolidated guidelines on the use of antiretroviral drugs for treating and preventing
hiv infection: recommendations for a public health approach 2016 [cited 2017 29th July]; 2nd [Available from:
http://apps.who.int/iris/bitstream/10665/208825/1/9789241549684_eng.pdf.
37. World Health Organisation. Chest radiography in tuberculosis detection – summary of current WHO
recommendations and guidance on programmatic approaches. . 2016 [cited 2017 14th August]; Available from:
http://apps.who.int/iris/bitstream/10665/252424/1/9789241511506-eng.pdf.
38. Koppaka R. and Bock N., How reliable is chest radiography? In: Frieden T, editor. Toman’s tuberculosis: case
detection,treatment, and monitoring. Questions and answers, second edition. Geneva: World Health
Page 156 of 176
Organization; 2004. p.51-60 (WHO/HTM/TB/2004.344;
http://apps.who.int/iris/bitstream/10665/42701/1/9241546034.pdf, accessed 12 September 2017). 2016.
39. World Health Organisation. The use of lateral flow urine lipoarabinomannan assay (LF-LAM) for the diagnosis
and screening of active tuberculosis in people living with HIV. 2015 [cited 2017 27th September]; Available from:
http://apps.who.int/iris/bitstream/10665/193633/1/9789241509633_eng.pdf?ua=1&ua=1.
40. World Health Organization. Treatment of Tuberculosis guidelines. 2016 [cited 2017 30th July]; 4th [Available
from: http://apps.who.int/iris/bitstream/10665/44165/1/9789241547833_eng.pdf.
41. World Health Organization., Treatment of tuberculosis: guidelines for national programmes. . 3rd ed. 2003.
42. Schatz A., Bugie E., and Waksman S. A., Streptomycin, a substance exhibiting antibiotic activity against Gram-
positive and Gram-negative bacteria. Proc. Soc. Exp. Biol. Med. , 1944. 55: p. 66-69.
43. Wassersug, J.D., Pulmonary tuberculosis. . N. Engl. J. Med., 1946. 235: p. 220-229
44. Marshall G., Streptomycin in the treatment of pulmonary tuberculosis. A Medical Research Council investigation.
. BMJ, 1949. 1: p. 382-386.
45. American Thoracic Society, Treatment of tuberculosis. . Am. J. Respir. Crit. Care Med. , 2003. 167: p. 603-662.
46. Zumla A., Nahid P., and Cole S.T., Advances in the development of new tuberculosis drugs and treatment
regimens. Nature reviews, 2013. 12: p. 388-404.
47. World Health Organization. Treatment of tuberculosis: Guidelines for treatment of drug-susceptible tuberculosis
and patient care. 2017.
48. World Health Organisation., Treatment of Tuberculosis Guidelines. 2010: Geneva.
49. Mitchison DA., Role of individual drugs in the chemotherapy of tuberculosis. Int J Tuberc Lung Dis, 2000. 4: p.
796-806.
50. Jindani A., N. A.J., and Enarson D.A., Two 8-month regimens of chemotherapy for treatment of newly diagnosed
pulmonary tuberculosis: international multicentre randomised trial. The Lancet, 2004. 364: p. 1244-1251.
51. Hartmann G., et al., The specific inhibition of the DNA-directed RNA synthesis by rifamycin. Biochim. Biophys.
Acta, 1967. 145: p. 843–844.
52. Jin D. J. and Gross C. A., RpoB8, a rifampicin-resistant termination-proficient RNA polymerase, has an increased
Km for purine nucleotides during transcription elongation. J. Biol. Chem., 1991. 266: p. 14478–14485.
53. Campbell E. A., et al., Structural mechanism for rifampicin inhibition of bacterial rna polymerase. Cell, 2001. 104:
p. 901–912.
54. Jindani A., Nunn A. J., and Enarson D. A., Two 8-month regimens of chemotherapy for treatment of newly
diagnosed pulmonary tuberculosis: international multicentre randomised trial. The Lancet, 2004. 364(9441): p.
1244-1251.
55. Arbex MA., et al., Antituberculosis drugs: Drug interactions, adverse effects, and use in special situations. Part 1:
First-line drugs. J Bras Pneumol. , 2010. 36(5): p. 626-640.
56. Saukkonen J. J., et al., An Official ATS Statement: Hepatotoxicity of Antituberculosis Therapy. 2006.
57. Dufour DR., et al., Diagnosis and monitoring of hepatic injury: I. Performance characteristics of laboratory tests.
. Clin Chem, 2000. 46: p. 2027–2049.
Page 157 of 176
58. Dufour D.R., et al., Diagnosis and monitoring of hepatic injury: II. Recommendations for use of laboratory tests in
screening, diagnosis, and monitoring. . Clin Chem, 2000. 46: p. 2050-2068.
59. Benichou C., Criteria for drug-induced liver disorder: report of an international consensus meeting. . J Hepatol
1990. 11: p. 272–276.
60. Kaplowitz N., Drug-induced liver injury. . Clin Infect Dis., 2004. 38: p. S44-S48.
61. U.S. Public Health Service., Hepatic toxicity of pyrazinamide used with isoniazid in tuberculous patients. Am Rev
Respir Dis 1969. 59: p. 13.
62. Kaplowitz N., Biochemical and cellular mechanisms of toxic liver injury. Semin Liver Dis, 2002. 22: p. 137-144.
63. Chitturi S. and Farrell G., Drug-induced liver disease. In: Schiff ER, Sorrell MF, Maddrey WC, editors. Schiff’s
diseases of the liver, 9th ed. Philadelphia: Lippincott, Williams & Wilkins; 2002. 2002. p. 1059-1128.
64. American Thoracic Society/Centers for Disease Control and Prevention., Targeted tuberculin testing and
treatment of latent tuberculosis infection. Am J Respir Crit Care Med, 2000. 161: p. S221-S247.
65. Younossian AB., et al., High hepatotoxicity of pyrazinamide and ethambutol for treatment of latent tuberculosis. .
Eur Respir J 2005. 26: p. 462-464.
66. Papastavros T., et al., Adverse events associated with pyrazinamide and levofloxacin in the treatment of latent
multidrug-resistant tuberculosis. CMAJ, 2002. 167: p. 131–136.
67. Ridzon R., et al., Asymptomatic hepatitis in persons who received alternative preventive therapy with
pyrazinamide and ofloxacin. . Clin Infect Dis., 1997. 24: p. 1264-1265.
68. Grosset J. and Leventis S., Adverse effects of rifampin. . Rev Infect Dis, 1983. 5: p. S440-S450.
69. Capelle P., et al., Effect of rifampicin on liver function in man. Gut 1972. 13: p. 366-371.
70. Gabriel R., Rifampicin jaundice. . BMJ, 1971. 3: p. 182.
71. Erdil A., et al., Rifampicin test in the diagnosis of Gilbert’s syndrome. . Int J Clin Pract 2001. 55: p. 81-83.
72. Menzies D, et al., Treatment completion and costs of a randomized trial of rifampin for 4 months versus isoniazid
for 9 months. . Am J Respir Crit Care Med, 2004. 170: p. 445-449.
73. Hong Kong Chest Service, T.R.C., Madras, British Medical Research Council.,, Adouble-blind placebo-controlled
clinical trial of three anti-tuberculosis chemoprophylaxis regimens in patients with silicosis in Hong Kong. . Am
Rev Respir Dis, 1992. 145: p. 36-41.
74. Byrne JA., et al., The human bile salt export pump: characterization of substrate specificity and identification of
inhibitors. . Gastroenterology, 2002. 123: p. 1649-1658.
75. Covic A., et al., Rifampicin-induced acute renal failure: a series of 60 patients. Nephrol Dial Transplant, 1998. 13:
p. 924-929.
76. Martinez E., Collazos J., and Mayo J., Hypersensitivity reactions to rifampin. Medicine 1999. 78: p. 361-369.
77. Kremer JM., Lee RG., and Tolman KG., Liver histology in rheumatoid arthritis patients receiving long-term
methotrexate therapy: a prospective study with baseline and sequential biopsy samples. . Arthritis Rheum, 1989.
32: p. 121-127.
78. Scheuer PJ., et al., Rifampicin hepatitis: a clinical and histological study. Lancet, 1974. 1: p. 421-425.
Page 158 of 176
79. Huang YS., et al., Polymorphism of the N-acetyltransferase 2 gene as a susceptibility risk factor for
antituberculosis drug-induced hepatitis. Hepatology, 2002. 35: p. 883-889.
80. Mitchell JR., et al., Increased incidence of isoniazid hepatitis in rapid acetylators: possible relation to hydrazine
metabolites. . Clin Pharmacol Ther, 1975. 18: p. 70-79.
81. Yamamoto T., Suou T., and Hirayama C., Elevated serum aminotransferase induced by isoniazid in relation to
isoniazid acetylator phenotype. Hepatology, 1986. 6: p. 295-298.
82. Huang YS., et al., Cytochrome P450 2E1 genotype and the susceptibility to antituberculosis drug-induced
hepatitis. . Hepatology, 2003. 37: p. 924-930.
83. Dickinson D., Bailey W., and Hirschowitz B., The effect of acetylation status on isoniazid (INH) hepatitis. . Am Rev
Respir Dis, 1977. 115: p. 395.
84. Sarma GR., et al., Rifampin-induced release of hydrazine from isoniazid: a possible cause of hepatitis during
treatment of tuberculosis with regimens containing isoniazid and rifampin. . Am Rev Respir Dis, 1986. 133: p.
1072-1075.
85. Mitchell JR., et al., Isoniazid liver injury: clinical spectrum, pathology, and probable pathogenesis. . Ann Intern
Med, 1976. 84: p. 181-192.
86. Attri S., et al., Protective effect of N-acetylcysteine in isoniazid induced hepatic injury in growing rats. . Indian J
Exp Biol, 2001. 39: p. 436-440.
87. Kopanoff DE., Snider D., and Caras G., Isoniazid related hepatitis: a U.S. Public Health Service cooperative
surveillance study. . Am Rev Respir Dis 1979. 117: p. 991-1001.
88. International Union Against Tuberculosis Committee on Prophylaxis., Efficacy of various durations of isoniazid
preventive therapy for tuberculosis: five years of follow-up in the IUAT trial. . Bull World Health Organ, 1982. 60:
p. 555-564.
89. Fountain FF., et al., Isoniazid hepatotoxicity associated with treatment of latent tuberculosis infection: a 7-year
evaluation from a public health tuberculosis clinic. Chest, 2005. 128: p. 116-123.
90. Millard PS., et al., Isoniazid-related fatal hepatitis. . West J Med, 1996. 164: p. 486-491.
91. Nolan CM., Goldberg S., and Buskin S., Hepatotoxicity associated with isoniazid preventive therapy: a 7-year
survey from a public health tuberculosis clinic. . JAMA, 1999. 281: p. 1014-1018.
92. Snider DE. and Caras G., Isoniazid-associated hepatitis deaths: a review of available information. . Am Rev Respir
Dis, 1992. 145: p. 494-497.
93. Steele MA., Burk RF., and DesPrez RM., Toxic hepatitis with isoniazid and rifampin: a meta-analysis. . Chest,
1991. 99: p. 465-471.
94. Polesky A., et al., Rifampin preventive therapy for tuberculosis in Boston’s homeless. Am J Respir Crit Care Med
1996. 154: p. 1473-1477.
95. Lacroix C., et al., Pharmacokinetics of pyrazinamide and its metabolites in patients with hepatic cirrhotic
insufficiency. . Arzneimittelforschung 1990. 40: p. 76-79.
96. Moriwaki Y., et al., In vitro oxidation of pyrazinamide and allopurinol by rat liver aldehyde oxidase. . Biochem
Pharmacol, 1993. 46: p. 975-981.
Page 159 of 176
97. Yamamoto T., et al., Effect of BOF-4272 on the oxidation of allopurinol and pyrazinamide in vivo: is xanthine
dehydrogenase or aldehyde oxidase more important in oxidizing both allopurinol and pyrazinamide? . Biochem
Pharmacol, 1993. 46: p. 2277-2284.
98. Nasu S., et al., The effect of pyrazines on the metabolism of tryptophan and nicotinamide adenine dinucleotide in
the rat: evidence of the formation of a potent inhibitor of aminocarboxy-muconate-semialdehyde decarboxylase
from pyrazinamide. Biochim Biophys Acta, 1981. 677: p. 109-119.
99. Yamamoto T., et al., Study of the metabolism of pyrazinamide using a high-performance liquid chromatographic
analysis of urine samples. . Anal Biochem, 1987. 160: p. 346-349.
100. American Thoracic Society, C.f.D.C.a.P., Infectious Diseases Society of America.,, Treatment of tuberculosis.
MMWR Morbid Mortal Wkly Rep, 2003. 52: p. 1-88.
101. U.S. Public Health Service., Hepatic toxicity of pyrazinamide used with isoniazid in tuberculous patients. . Am Rev
Respir Dis, 1969. 59: p. 13.
102. Centers for Disease Control and Prevention, A.T.S., Update: fatal and severe liver injuries associated with
rifampin and pyrazinamide for latent tuberculosis infection, and revisions in American Thoracic Society/CDC
recommendations: United States, 2001. . MMWR Morb Mortal Wkly Rep, 2001. 50: p. 733-735.
103. Knobel B., et al., Pyrazinamide-induced granulomatous hepatitis. . J Clin Gastroenterol, 1997. 24: p. 264-266.
104. Gulliford M., Mackay AD., and Prowse K., Cholestatic jaundice caused by ethambutol. . Br Med J (Clin Res Ed),
1986. 292: p. 866.
105. Ormerod LP. and Horsfield N., Frequency and type of reactions to antituberculosis drugs: observations in routine
treatment. . Tuber Lung Dis, 1996. 77: p. 37-42.
106. Dossing M., et al., Liver injury during antituberculosis treatment: an 11-year study. . Tuber Lung Dis, 1996. 77: p.
335-340.
107. Teleman MD., et al., Hepatotoxicity of tuberculosis chemotherapy under general programme conditions in
Singapore. . Int J Tuberc Lung Dis, 2002. 6: p. 699-705.
108. Shakya R., Rao B.S., and Shrestha B., Incidence of hepatotoxicity due to antitubercular medicines and assessment
of risk factors. . Ann Pharmacother, 2004. 38: p. 1074-1079.
109. Schaberg T., Rebhan K., and Lode H., Risk factors for side-effects of isoniazid, rifampin and pyrazinamide in
patients hospitalized for pulmonary tuberculosis. Eur Respir J 1996. 9: p. 2026-2030.
110. Hwang SJ., et al., A prospective clinical study of isoniazid-rifampicin-pyrazinamideinduced liver injury in an area
endemic for hepatitis B. . J Gastroenterol Hepatol, 1997. 12: p. 87-91.
111. Cohn DL., et al., A 62-dose, 6-month therapy for pulmonary and extrapulmonary tuberculosis: a twice-weekly,
directly observed, and cost-effective regimen. Ann Intern Med 1990. 112: p. 407-415.
112. Gronhagen-Riska C., Hellstrom PE., and Froseth B., Predisposing factors in hepatitis induced by isoniazid-rifampin
treatment of tuberculosis. Am Rev Respir Dis, 1978. 118: p. 461-466.
113. Yimer G , et al., Pharmacogenetic & pharmacokinetic biomarker for efavirenz based ARV and rifampicin based
anti-TB drug induced liver injury in TB-HIV infected patients. PLoS One., 2011. 6(12): p. e27810.
114. Singh J., Garg P.K., and Tandon R.K., Hepatotoxicity due to antituberculosis therapy: clinical profile and
reintroduction of therapy. J Clin Gastroenterol, 1996. 22: p. 211-214.
Page 160 of 176
115. Krishnaswamy K., Prasad C.E., and Murthy K.J., Hepatic dysfunction in undernourished patients receiving
isoniazid and rifampicin. . Trop Geogr Med, 1991. 43: p. 156-160.
116. Sharma SK., et al., Evaluation of clinical and immunogenetic risk factors for the development of hepatotoxicity
during antituberculosis treatment. . Am J Respir Crit Care Med, 2002. 166: p. 916-919.
117. Roy B., et al., Increased risk of antituberculosis drug-induced hepatotoxicity in individuals with glutathione S-
transferase M1 ‘null’ mutation. J Gastroenterol Hepatol 2001. 16: p. 1033-1037.
118. Yimer G., Amogne W., and Habtewold A., High plasma efavirenz level and CYP2B6*6 are associated with
efavirenz-based HAART-induced liver injury in the treatment of naive HIV patients from Ethiopia: a prospective
cohort study. Pharmacogenomics J, 2012. 12(6): p. 499-506.
119. Meyers BR., et al., Tuberculosis in orthotopic liver transplant patients: increased toxicity of recommended agents;
cure of disseminated infection with nonconventional regimens. Transplantation, 2000. 69: p. 64-69.
120. Yee D., et al., Incidence of serious side effects from first-line antituberculosis drugs among patients treated for
active tuberculosis. Am J Respir Crit Care Med, 2003. 167: p. 1472-1477.
121. Cohen C.D., Sayed A.R., and Kirsch R.E., Hepatic complications of antituberculosis therapy revisited. S Afr Med J
1983. 63: p. 960-963.
122. Parthasarathy R., et al., Hepatic toxicity in South Indian patients during treatment of tuberculosis with short-
course regimens containing isoniazid, rifampicin and pyrazinamide. Tubercle, 1986. 67: p. 99-108.
123. Howell F., et al., Short course chemotherapy for pulmonary tuberculosis: a randomised controlled trial of a six
month versus a nine month oral regimen. . Ir Med J, 1989. 82: p. 11-13.
124. Zierski M. and Bek E., Side-effects of drug regimens used in short-course chemotherapy for pulmonary
tuberculosis: a controlled clinical study. Tubercle, 1980. 61: p. 41-49.
125. Combs D.L., O’Brien R.J., and Geiter L.J., USPHS Tuberculosis Short-Course Chemotherapy Trial 21: effectiveness,
toxicity and acceptability: report of the final results. . Ann Intern Med, 1990. 112: p. 397-406.
126. Wong WM., et al., Antituberculosis drug-related liver dysfunction in chronic hepatitis B infection. . Hepatology,
2000. 31: p. 201-206.
127. Lee BH., et al., Inactive hepatitis B surface antigen carrier state and hepatotoxicity during antituberculosis
chemotherapy. Chest, 2005. 127: p. 1304-1311.
128. Wu JC., et al., Isoniazid-rifampin-induced hepatitis in hepatitis B carriers. Gastroenterology, 1990. 98: p. 502-504.
129. Ungo JR., et al., Antituberculosis drug-induced hepatotoxicity: the role of hepatitis C virus and the human
immunodeficiency virus. . Am J Respir Crit Care Med, 1998. 157: p. 1871-1876.
130. World Health Organisation., Definitions and reporting framework for tuberculosis – 2013 revision. 2014.
131. Al-Moamary MS., et al., The significance of the persistent presence of acid-fast bacilli in sputum smears in
pulmonary tuberculosis. . Chest, 1999. 116: p. 726-31.
132. Wallis R.S., Surrogate markers to assess new therapies for drug-resistant tuberculosis. Expert Rev. Anti Infect.
Ther., 2007. 5(2): p. 163-168.
133. Phillips P.P. J., Fielding K., and Nunn A.J., An Evaluation of Culture Results during Treatment for Tuberculosis as
Surrogate Endpoints for Treatment Failure and Relapse. PLoS ONE 8(5): doi:10.1371/journal.pone.0063840,
2013. 8(5): p. e63840.
Page 161 of 176
134. Davies G . R., Early clinical development of anti-tuberculosis drugs: Science, statistics and sterilizing activity.
Tuberculosis, 2010. 20: p. 171-176.
135. Mitchison D.A., Assessment of new sterilizing drugs for treating pulmonary tuberculosis by culture at 2 months.
American Review of Respiratory Disease, 1993. 147: p. 1062–1063.
136. Burman W.J., et al., Moxifloxacin versus Ethambutol in the First 2 Months of Treatment for Pulmonary
Tuberculosis. Am J Respir Crit Care Med, 2006. 174: p. 331–338.
137. Pasipanodya J. G., et al., Serum drug concentrations predictive of pulmonary tuberculosis outcomes. J. Infect.
Dis., 2013. 208: p. 1464–1473.
138. Gumbo T., et al., Concentration-dependent Mycobacterium tuberculosis killing and prevention of resistance by
rifampin. Antimicrob. Agents Chemother, 2007. 51: p. 3781–3788.
139. David H.L., Probability distribution of drug-resistant mutants in unselected populations of Mycobacterium
tuberculosis. . Appl Microbiol, 1970. 20: p. 810-814.
140. Colijn C., et al., Spontaneous emergence of multiple drug resistance in tuberculosis before and during therapy.
PLoS ONE, 2011. 8: p. e18327.
141. Matthews J.H., Pyrazinamide and isoniazid used in the treatment of pulmonary tuberculosis. . Am Rev Respir Dis.
, 1960. 81: p. 348-351.
142. Mitchison D.A., How drug resistance emerges as a result of poor compliance during short course chemotherapy
for tuberculosis. . Int J Tuberc Lung Dis., , 1998. 2: p. 10-15.
143. Srivastava S., et al., Multidrug-resistant tuberculosis not due to non-compliance but to between-patient
pharmacokinetic variability. J Infect Dis., 2011. 204: p. 1951-1958.
144. East and Central African/British Medical Research Council., Controlled clinical trial of 4 shortcourse regimens of
chemotherapy (three 6-month and one 8 month) for pulmonary tuberculosis. Tubercle. , 1983. 64: p. 163-168.
145. Hong Kong Tuberculosis Treatment Services; East African and British Medical Research Councils., First-line
chemotherapy in the retreatment of bacteriological relapses of pulmonary tuberculosis following a short-course
regimen. . Lancet, 1976. 1: p. 162-168.
146. Peloquin C., What is the ‘right’ dose of rifampin? Int J Tuberc Lung Dis., 2003. 7(3-5).
147. Rustomjee R., Lienhardt C., and Kanyok T., A Phase II study of the sterilizing activities of ofloxacin, gatifloxacin
and moxifloxacin in pulmonary tuberculosis. . Int J Tuberc Lung Dis., 2008. 12: p. 128-138.
148. World Health Organization. WHO treatment guidelines for drug-resistant tuberculosis (2016 Update). 2016
[cited 2017 03rd August]; Available from: http://www.who.int/tb/areas-of-work/drug-resistant-
tb/MDRTBguidelines2016.pdf.
149. Zignol M., et al., Population-based resistance of Mycobacterium tuberculosis isolates to pyrazinamide and
fluoroquinolones: results from a multicountry surveillance project. Lancet Infect Dis., 2016. 16: p. 30190-30196
150. World Health Organisation. WHO treatment guidelines for drugresistant tuberculosis. 2016 update. 2016 [cited
2017 19th September]; Available from: http://apps.who.int/iris/bitstream/10665/250125/1/9789241549639-
eng.pdf?ua=1.
151. World Health Organisation. The use of bedaquiline in the treatment of multidrug-resistant tuberculosis. Interim
policy guidance(WHO/HTM/TB/2013.6) 2013 [cited 2017 27th September]; Available from:
http://apps.who.int/iris/bitstream/10665/84879/1/9789241505482_eng.pdf.
Page 162 of 176
152. World Health Organisation. The use of delamanid in the treatment of multidrug-resistant tuberculosis. Interim
policy guidance (WHO/HTM/TB/2014.23). 2014 [cited 2017 27th September]; Available from:
http://apps.who.int/iris/bitstream/10665/137334/1/WHO_HTM_TB_2014.23_eng.pdf.
153. Vashakidze S., et al., Clinical and pathological characterization of lung lesions from surgical treatment for Drug-
Sensitive (DR-TB) and Multi-drug/Extensively- Drug Resistant (MDR/XDR-TB) Tuberculosis in Georgia: a
retrospective study. . Intl J Infect Dis, 2017. 56: p. 200-7.
154. Tseng A., Seet J., and Phillips E.J., The evolution of three decades of antiretroviral therapy: challenges, triumphs
and the promise of the future. British Journal of Clinical Pharmacology, 2014. 79(2): p. 182-194.
155. Panel on Antiretroviral Guidelines for Adults and Adolescents. Guidelines for the use of antiretroviral agents in
HIV-1-infected adults and adolescents. Department of Health and Human Services. . 2016 July 14, 2016 [cited
2017 14th August]; Available from: http://www.aidsinfo.nih.gov/ContentFiles/AdultandAdolescentGL.pdf.
156. World Health Organization., A non-Consolidated guidelines on the use of antiretroviral drugs for treating and
preventing HIV infection. Recommendations for a public health approach. 2013, WHO: Geneva.
157. Nelson LJ., et al., Adoption of national recommendations related to use of antiretroviral therapy before and
shortly following the launch of the 2013 WHO consolidated guidelines. AIDS, 2014. 28(Suppl 2): p. S217-224.
158. AIDSinfo. Guidelines for the Use of Antiretroviral Agents in HIV-1-Infected Adults and Adolescents. 2016 28th
January 2016 [cited 2016 01/02].
159. Gulick RM., et al., Triple-nucleoside regimens versus efavirenz-containing regimens for the initial treatment of
HIV-1 infection. N Engl J Med, 2004. 350: p. 1850-1861.
160. Bonnet M, et al., Nevirapine versus efavirenz for patients co-infected with HIV and tuberculosis: a randomised
non-inferiority trial. Lancet Infect Dis, 2013. 13: p. 303-312.
161. Anon., March 2014 supplement to the 2013 consolidated guidelines on the use of antiretroviral drugs for treating
and preventing HIV infection. Recommendations for a public health approach. 2013.
162. Shubber Z., et al., Adverse events associated with nevirapine and efavirenzbased first-line antiretroviral therapy:
a systematic review and meta-analysis. AIDS, 2013. 27.: p. 1403-1412.
163. Desta Z., et al., Impact of CYP2B6 polymorphism on hepatic efavirenz metabolism in vitro. Pharmacogenomics.,
2007. 8(6): p. 547-58.
164. Ward B.A., et al., The cytochrome P450 2B6 (CYP2B6) is the main catalyst of efavirenz primary and secondary
metabolism : implication for HIV/AIDS therapy and utility of efavirenz as a substrate marker of CYP2B6 catalytic
activity. J. Pharmacol. Exp. Ther. , 2003. 306: p. 287-300.
165. Kwara A., Ramachandran G., and Swaminathan S., Dose adjustment of the non-nucleoside reverse transcriptase
inhibitors during concurrent rifampicin-containing tuberculosis therapy: one size does not fit all. l 6(1):55-68.
Expert Opin Drug Metab Toxico, 2010 6(1): p. 55-68.
166. Marzolin C., et al., Efavirenz plasma levels can predict treatment failure and central nervous system side effects
in HIV-1 infected patients. AIDS, 2001. 15: p. 71-75.
167. Motsinger AA., et al., Multilocus genetic interactions and response to efavirenz-containing regimens: an adult
AIDS clinical trials group study. . Pharmacogenet Genomics, 2006. 16(11): p. 837-45.
168. Gounden V., et al., Presence of the CYP2B6 516G> T polymorphism, increased plasma Efavirenz concentrations
and early neuropsychiatric side effects in South African HIV-infected patients. . AIDS Res Ther., 2010. 7: p. 32.
Page 163 of 176
169. Habtewold A., et al., Is there a need to increase the dose of efavirenz during concomitant rifampicin-based
antituberculosis therapy in sub-Saharan Africa? The HIV-TB pharmagene study. Pharmacogenomics. , 2015.
16(10): p. 1047-64.
170. Helen M., Graeme M., and William B.J., Complications of antiretroviral therapy in patients with tuberculosis:
Drug interactions, toxicity, and immune reconstitution inflammatory syndrome. JOURNAL OF INFECTIOUS
DISEASES, 2007. 196(Supplement: 1): p. S63-S75.
171. Gengiah T. N., et al., Initiating antiretrovirals during tuberculosis treatment: a drug safety review. . Expert Opin.
Drug Saf., 2011. 10: p. 559-574.
172. Decloedt EH., et al., The safety, effectiveness and concentrations of adjusted lopinavir/ritonavir in HIV-infected
adults on rifampicinbased antitubercular therapy. PLoS One, 2012. 7: p. e32173.
173. Boulle A., Van Cutsem G., and Cohen K., Outcomes of nevirapineand efavirenz-based antiretroviral therapy when
co-administered with rifampicin-based antitubercular therapy. . JAMA, 2008. 300: p. 530-39.
174. Wenning LA., Hanley WD., and Brainard DM., Effect of rifampin, a potent inducer of drug-metabolizing enzymes,
on the pharmacokinetics of raltegravir. . Antimicrob Agents Chemother 2009. 53: p. 2852-56.
175. Schuetz EG., et al., P-glycoprotein: a major determinant of rifampicin-inducible expression of cytochrome P4503A
in mice and humans. . Proc Natl Acad Sci USA, 1996. 93: p. 4001-4005.
176. Burk O., et al., The induction of cytochrome P450 3A5 (CYP3A5) in the human liver and intestine is mediated by
the xenobiotic sensors pregnane X receptor (PXR) and constitutively activated receptor (CAR). . J Biol Chem,
2004. 279: p. 38379-38385.
177. Rae JM., et al., Rifampin is a selective, pleiotropic inducer of drug metabolism genes in human hepatocytes:
studies with cDNA and oligonucleotide expression arrays. J Pharmacol Exp Ther 2001. 299: p. 849-857.
178. Niemi M., et al., Pharmacokinetic interactions with rifampicin: clinical relevance. . Clin Pharmacokinet, 2003. 42:
p. 819-850.
179. Piscitelli SC. and Gallicano KD., Interactions among drugs for HIV and opportunistic infections. . N Engl J Med
2001. 344(13): p. 984-96.
180. Wen X., et al., Isoniazid is a mechanism-based inhibitor of cytochrome P450 1A2, 2A6, 2C19 and 3A4 isoforms in
human liver microsomes. . Eur J Clin Pharmacol 2002. 57(11): p. 799-804.
181. Smith CA., et al., A simplified assay for the arylamine N-acetyltransferase 2 polymorphism validated by
phenotyping with isoniazid. . J Med Genet, 1997. 34: p. 758-760.
182. McIlleron HM., et al., Effects of rifampin-based antituberculosis therapy on plasma efavirenz concentrations in
children vary by CYP2B6 genotype. AIDS. , 2013. 27(12): p. 1933-40.
183. Gengiah TN., et al., The influence of tuberculosis treatment on efavirenz clearance in patients co-infected with
HIV and tuberculosis. Eur J Clin Pharmacol 2012. 68(5): p. 689-95.
184. Sustiva (efavirenz) highlights of prescribinhg information. http://packageinserts bms com/pi/pi_sustiva pdf 12
A.D. March 4. Available from: http://packageinserts.bms.com/pi/pi_sustiva.pdf.
185. Friedland G, et al., Administration of efavirenz (600 mg/day) with rifampicin results in highly variable levels but
excellent clinical outcomes in patients treated for tuberculosis and HIV. J Antimicrob Chemother. , 2006. 58(6): p.
1299-302.
Page 164 of 176
186. Dhoro M., et al., CYP2B6*6, CYP2B6*18, Body weight and sex are predictors of efavirenz pharmacokinetics and
treatment response: population pharmacokinetic modeling in an HIV/AIDS and TB cohort in Zimbabwe. BMC
Pharmacol Toxicol. , 2015. 16: p. 4.
187. Manosuthi W., et al., Impact of pharmacogenetic markers of CYP2B6, clinical factors, and drug-drug interaction
on efavirenz concentrations in HIV/tuberculosis-coinfected patients. Antimicrob Agents Chemother., 2013. 57(2):
p. 1019-24.
188. Bertrand J, et al., Dependence of efavirenz- and rifampicin-isoniazid-based antituberculosis treatment drug-drug
interaction on CYP2B6 and NAT2 genetic polymorphisms: ANRS 12154 study in Cambodia. . The Journal of
infectious diseases 2013. 209(3): p. 399-408.
189. Dooley KE., et al., Phamacokinetics of efavirenz and treatment of HIV-1 among pregnant women with and
without tuberculosis coinfection. . J Infect Dis., 2015. 211(2): p. 197-205.
190. Dooley KE., Sayre P., and Borland J., Safety, tolerability, and pharmacokinetics of the HIV integrase inhibitor
dolutegravir given twice daily with rifampin or once daily with rifabutin: results of a phase 1 study among
healthy subjects. J Acquir Immune Defic Syndr, 2013. 62: p. 21 – 27.
191. Brooks K., Pau A., and George J. Early termination of a PK study between dolutegravir and weekly
isoniazid/rifapentine. . in CROI Conference,. 2017. Seattle, Washington.
192. ViiV Healthcare. ING117175: a Phase IIIb, Randomized, Open-label Study of the Safety and Efficacy of
Dolutegravir or Efavirenz Each Administered With Two NRTIs in HIV-1-infected Antiretroviral Therapy-naïve
Adults Starting Treatment for Rifampicin-sensitive Tuberculosis. 2017 [cited 2017 29th July]; Available from:
https://clinicaltrials.gov/ct2/show/NCT02178592?term=dolutegravir&rank=89.
193. Havlir D. V., et al., Timing of antiretroviral therapy for HIV 1 infection and tuberculosis. N. Engl. J. Med, 2011.
365: p. 1482-1491.
194. Blanc FX, et al., Earlier versus Later Start of Antiretroviral Therapy in HIV-Infected Adults with Tuberculosis. N
Engl J Med 2011. 365: p. 1471-81.
195. World Health Organisation. Treatment of Tuberculosis Guidelines. . 2010.
196. Zumla A., et al., Tuberculosis treatment and management—an update on treatment regimens, trials, new drugs,
and adjunct therapies. Lancet Respir Med., 2015. 3: p. 220-34.
197. Muñoz-Moreno JA., et al., Neuropsychiatric symptoms associated with efavirenz: prevalence, correlates, and
management. A neurobehavioral review. AIDS Rev, 2009. 11(2): p. 103-9.
198. Haas D.W., et al., Pharmacogenetics of efavirenz and central nervous system side effects : an Adult AIDS Clinical
Trials Group study. AIDS, 2004. 18: p. 2391-2400.
199. Ford N., et al., Comparative safety and neuropsychiatric adverse events associated with efavirenz use in first-line
antiretroviral therapy: a systematic review and meta-analysis of randomized trials. . JAIDS, 2015. 69(4): p. 422-9.
200. Legera P., et al., Pharmacogenetics of efavirenz discontinuation for reported central nervous system symptoms
appears to differ by race. Pharmacogenetics and Genomics 2016. 26: p. 473-480.
201. Puls R., et al., Effi cacy of 400 mg efavirenz versus standard 600 mg dose in HIV-infected, antiretroviral-naive
adults (ENCORE1): a randomised, double-blind, placebo-controlled, non-inferiority trial. Lancet, 2014. 383: p.
1474-82.
Page 165 of 176
202. Ford N., et al., Safety of efavirenz in the first trimester of pregnancy: an updated systematic review and meta-
analysis article from AIDS supplement: 2013 WHO Consolidated Guidelines on the use of Antiretroviral drugs:
Evidence and Implementation. AIDS, 2014. 28 (Suppl 2): p. 9.
203. Chaisson RE., et al., Six-month supervised intermittent tuberculosis therapy in Haitian patients with and without
HIV infection. . Am J Respir Crit Care Med, 1996. 154: p. 1034-1038.
204. Colebunders R., et al., Tuberculosis immune reconstitution inflammatory syndrome in countries with limited
resources. Int J Tuberc Lung Dis, 2006. 10(9): p. 946-953.
205. Meintjes G., et al., Tuberculosis-associated immune reconstitution inflammatory syndrome: case defi nitions for
use in resource-limited settings Lancet Infect Dis, 2008. 8: p. 516-23.
206. Breen R.A., Smith C.J., and Bettinson H., Paradoxical reactions during tuberculosis treatment in patients with and
without HIV co-infection. Thorax, 2004. 59: p. 704-707.
207. Cheng V. C.., Yam W. C, and Woo P. C., Risk factors for development of paradoxical response during
antituberculosis therapy in HIV-negative patients. . Eur J Clin Microbiol Infect Dis, 2003. 22: p. 597-602.
208. Shelburne S. A. III., Hamill R. J., and Rodriguez-Barradas M. C., Immune reconstitution inflammatory syndrome:
emergence of a unique syndrome during highly active antiretroviral therapy. Medicine (Baltimore) 2002. 81: p.
213-227.
209. Pakker N. G., Notermans D. W., and de Boer R. J., Biphasic kinetics of peripheral blood T cells after triple
combination therapy in HIV-1 infection: a composite of redistribution and proliferation. Nat Med, 1998. 4: p. 208-
214.
210. Narita M., et al., Paradoxical worsening of tuberculosis following antiretroviral therapy in patients with AIDS. .
Am J Respir Crit Care Med, 1998. 158: p. 157-161.
211. French M. A., Price P., and Stone S. F., Immune restoration disease after antiretroviral therapy. . AIDS, 2004. 18:
p. 1615-1627.
212. World Health Organisation, Implementing The END TB Strategy:The essentials. 2015, World Health Organization:
Geneva, Switzerland.
213. United Nations. Sustainable Development Goals: 17 goals to transform our world. 2015 [cited 2017 9th August];
Available from: http://www.un.org/sustainabledevelopment/health/.
214. Frick M., et al. 2017 Pipeline Report: HIV, TB & HCV Drugs, diagnostics, vaccines, preventive Technologies, cure
research, and immune-based and gene therapies in development. 2017 [cited 2017 14th August]; Available
from: http://www.pipelinereport.org/sites/default/files/2017%20Pipeline%20Report%20Final.pdf.
215. A Joint World Health Organization HIV/AIDS and TB department meeting. WHO Three I’s Meeting: Intensified
Case Finding (ICF), Isoniazid Preventive Therapy (IPT) and TB Infection Control (IC) for people living with HIV 2008
[cited 2017 12th September]; Available from:
http://www.who.int/hiv/pub/meetingreports/WHO_3Is_meeting_report.pdf.
216. Schito M., Hanna D., and Zumla A., Tuberculosis eradication versus control. International Journal of Infectious
Diseases 2017. 56: p. 10-13.
217. Styblo K., Meijer J., and Sutherland I., Tuberculosis Surveillance Research Unit Report No. 1: the transmission of
tubercle bacilli; its trend in a human population. Bull Int Union Tuberc, 1969. 42: p. 5-104.
218. Styblo K., The relationship between the risk of tuberculous infection and the risk of developing infectious
tuberculosis. . Bull Int Union Tuberc Lung Dis, 1985. 60: p. 117-9.
Page 166 of 176
219. Centis R., Zumla A., and Migliori G.B., Shifting from tuberculosis control to elimination: Where are we? What are
the variables and limitations? Is it achievable? International Journal of Infectious Diseases 2017. 56: p. 30-33.
220. McBryde ES., et al., The risk of global epidemic replacement with drug-resistant Mycobacterium tuberculosis
strains. International Journal of Infectious Diseases 2017. 56: p. 14-20.
221. UNAIDS. 90–90–90 An ambitious treatment target to help end the AIDS epidemic. UNAIDS/JC2684; . 2014 [cited
2017 15th August]; Available from: http://www.unaids.org/sites/default/files/media_asset/90-90-90_en_0.pdf.
222. Levi J., et al., Can the UNAIDS 90-90-90 target be achieved?. A systematic analysis of national HIV treatment
cascades. . BMJ Glob Health, 2016. 1: p. e000010.
223. Rabie H., et al., Tuberculosis: opportunities and challenges for the 90–90–90 targets in HIV-infected children.
Journal of the International AIDS Society 2015. 18(Suppl 6): p. 20236.
224. Global Alliance for Tuberculosis Drug Development Scientific blueprint for tuberculosis drug development.
Tuberculosis, 2001. 8, s1-s52.
225. Gelband H., Regimens of less than six months for treating tuberculosis. Cochrane Database Syst Rev 2000. 2: p.
CD001362.
226. Volmink J. and Garner P., Directly observed therapy for treating tuberculosis. Cochrane Database Syst Rev, 2006.
2: p. CD003343.
227. Knight GM., et al., The Impact and Cost-Effectiveness of a Four-Month Regimen for First-Line Treatment of Active
Tuberculosis in South Africa. PLoS ONE 2015. 10(12): p. e0145796.
228. Trajman A., et al., Shortened first-line TB treatment in Brazil: potential cost savings for patients and health
services. BMC Health Services Research, 2016. 16: p. 27.
229. Working Group on New TB Drugs. Clinical Pipeline. 2017 [cited 2017 30th July]; Available from:
http://www.newtbdrugs.org/pipeline/clinical.
230. Rustomjee R., et al., Gatifloxacin for TB (OFLOTUB) study team. Phase II study of the sterilising activities of
ofloxacin, gatifloxacin and moxifloxacin in pulmonary tuberculosis. . Int J Tuberc Lung Dis. , 2008. 12(2): p. 128-
38.
231. Conde MB., et al., Moxifloxacin versus ethambutol in the initial treatment of tuberculosis: a double-blind,
randomised, controlled phase II trial. . Lancet., 2009. 373(9670): p. 1183-9.
232. Nuermberger EL., et al., Moxifloxacin- containing regimen greatly reduces time to culture conversion in murine
tuberculosis. . Am J Respir Crit Care Med 2004. 169: p. 421-426.
233. Jindani A., et al., High-Dose Rifapentine with Moxifloxacin for pulmonary tuberculosis. . N Engl J Med 2014.
371(17): p. 1599-1608.
234. Merle C.S., et al., A four-month gatifloxacin containing regimen for treating tuberculosis. . N Engl J Med, 2014.
371(17): p. 1588-1598.
235. Gillespie S.H., et al., Four-Month Moxifloxacin-Based Regimens for Drug-Sensitive Tuberculosis. . N Engl J Med,
2014. 371(17): p. 1577-1587.
236. Fox W., Ellard G.A., and Mitchison D.A., Studies on the treatment of tuberculosis undertaken by the British
Medical Research Council Tuberculosis Units, 1946-1986 with relevant subsequent publications. . Int J Tuberc
Lung Dis., 1999. 3: p. s231-s276.
237. Fox W., Whither short-course chemotherapy. . Br J Dis Chest, 1981. 75(4): p. 331-357.
Page 167 of 176
238. Johnson JL., et al., Shortening Treatment in Adults with Noncavitary Tuberculosis and 2-Month Culture
Conversion. Am J Respir Crit Care Med, 2009. 180: p. 558-563.
239. Peloquin C. A., What is the 'right' dose of rifampin? . Int J Tuberc Lung Dis., 2003. 7: p. 3-5.
240. Dickinson J.M. and Mitchison D.A., Suitability of rifampicin for intermittent administration in the treatment of
tuberculosis. . Tubercle 1970. 51: p. 82-94.
241. DA., M., Role of individual drugs in the chemotherapy of tuberculosis. Int J Tuberc Lung Dis., 2000. 4: p. 796-806.
242. Girling D.J., The hepatic toxicity of antituberculosis regimens containing isoniazid, rifampicin and pyrazinamide. .
Tubercle 1978. 59: p. 13-32.
243. Long M.W., Snider jr. D., and Farer L.S., UuSPHS cooperative trial of three rifampicin-isoniazid regimens in
treatment of pulmonary tuberculosis. . Am. Rev. Resp. Dis., 1979. 119: p. 879-894.
244. Phillips PPJ., et al., A new trial design to accelerate tuberculosis drug development: the Phase IIC Selection Trial
with Extended Posttreatment follow-up (STEP). BMC Medicine, 2016. 14: p. 51.
245. Jindani A., et al., The early bactericidal activity of drugs in patients with pulmonary tuberculosis. Am Rev Respir
Dis, 1980. 121: p. 939-949.
246. Diacon AH., et al., Early bactericidal activity of high-dose rifampin in patients with pulmonary tuberculosis
evidenced by positive sputum smears. . Antimicrob Agents and Chemother. , 2007. 51: p. 2994-2996.
247. Ruslami R., Nijland H., and Arnoutse R., Letter to the editor. evaluation of high- versus standard –dose rifampin in
Indonesia patients with pulmonary tuberculosis. . Antimocrob Agents and Chemother, 2006. 50: p. 822-823.
248. Ruslami R., et al., Pharmacokinetics and tolerability of a higher rifampin dose versus the standard dose in
pulmonary tuberculosis patients. . Antimicrob Agents Chemother 2007. 51(7): p. 2546-2551.
249. Acocella G., Clinical pharmacology of rifampicin. . Clin Pharmacokin, 1978. 3: p. 108-127.
250. Goutelle S., et al., Population modeling and Monte Carlo simulation study of the pharmacokinetics and
antituberculosis pharmacodynamics of rifampin in lungs. Antimicrob. Agents Chemother., 2009. 53: p. 2974–
2981.
251. Sirgel FA., et al., The early bactericidal activities of rifampin and rifapentine in pulmonary tuberculosis. . Am. J.
Respir. Crit. Care Med. , 2005. 172: p. 128-135.
252. Kochar DK., et al., The role of rifampicin in the management of cutaneous leishmaniasis. . Q J Med 2000. 93: p.
733-737.
253. Salim M.M. and Kandil E., Rifampicin in the treatment of cutaneous leishmaniasis. . J Kuwait Med Assoc, 1972. 6:
p. 159-166.
254. Cascio A., et al., Treatment of human brucellosis with rifampin plus minocycline. . J Chemother, 2003. 15: p. 248-
252.
255. Drancourt M., et al., Oral treatment of staphylococcus spp. infected orthopaedic implants with fusidic acid or
ofloxacin in combination with rifampicin. . J Antimicrob Chemother., 1997. 39: p. 235-240.
256. Kreis B., et al., Two three-month treatment regimens for pulmonary tuberculosis. . Bull Int Un Tuberc, 1976. 51:
p. 71-75.
257. Verbist L., Pharmacological study of rifampicin after repeated high dosage during intermittent combined
therapy. I. Variation of rifampicin serum levels (947 determinations). Respiration, 1971. 28: p. suppl 7-16.
Page 168 of 176
258. Bock NN., et al., A prospective, randomised continuation phase of tuberculosis treatment. . Am J Respir Crit Care
Med 2002. 165: p. 1526-1530.
259. world Health Organisation. Ministry of Health and partners review the National TB prevalence survey report.
2017 [cited 2017 10th September]; Available from: http://www.afro.who.int/news/ministry-health-and-
partners-review-national-tb-prevalence-survey-report.
260. Uganda Bureau of Statistics., The National Population and Housing Census 2014 – Main Report, . 2016: Kampala,
Uganda. p. 52.
261. Kochar D.K., et al., Aseri S, Sharma BV, Bumb RA, Mehta RD, Purohit SK. The role of rifampicin in the
management of cutaneous leishmaniasis. . Q J Med, 2000. 93(11): p. 733-737.
262. Kreis B., et al., Two three-month treatment regimens for pulmonary tuberculosis. . Bull Int Union Tuberc 1976.
51(1): p. 71-5.
263. Boeree M.J., et al., High-dose rifampicin, moxifl oxacin, and SQ109 for treating tuberculosis: a multi-arm, multi-
stage randomised controlled trial. Lancet Infect Dis 2016.
264. Clinton Health Access Initiative (CHAI). ARV Market Report: The State of the Antiretroviral Drug Market in Low-
and Middle-Income Countries, 2014-2019. 2015 [cited 2017 29th July]; Available from:
http://www.clintonhealthaccess.org/content/uploads/2015/11/CHAI-ARV-Market-Report-2015_FINAL.pdf.
265. DiGiacinto J.L., et al., Are Literature References Sufficient for Dose Recommendations? An FDA Case Study of
Efavirenz and Rifampin. Journal of Clinical Pharmacology, 2008. 48: p. 518-523.
266. Zanger U.M. and Klein K., Pharmacogenetics of cytochrome P450 2B6 (CYP2B6) : advances on polymorphisms
,mechanisms, and clinical relevance. Frontiers in Genetics, 2013. 4(24): p. 1-12.
267. Lang T., Klein K., and Fischer J, Extensive genetic polymorphism in the human CYP2B6 gene with impact on
expression and function in human liver. . Pharmacogenetics. , 2001. 11: p. 399-415.
268. Moher D., et al., Preferred reporting items for systematic review and meta-analysis protocols (PRISMA-P) 2015
statement. Systematic Reviews, 2015. 4: p. 1.
269. Jindani A., et al., A randomised Phase II trial to evaluate the toxicity of high-dose rifampicin to treat pulmonary
tuberculosis. . The International Journal of Tuberc Lung Dis, 2016. 20(6): p. 832-838(7).
270. Jindani A., et al., A randomised Phase II trial to evaluate the toxicity of high-dose rifampicin to treat pulmonary
tuberculosis. The International Journal of Tuberc Lung Dis, 2016. 20(6): p. 832-838(7).
271. Rieder HL. and Van Deun A., Priorities for tuberculosis bacteriology services in low-income countries. . 2nd ed.
2007, Paris
272. Kwara A, et al., Pharmacokinetics of efavirenz when co-administered with rifampin in TB/HIV co-infected
patients: pharmacogenetic effect of CYP2B6 variation. J Clin Pharmacol, 2008. 48(9): p. 1032-40.
273. Orrell C, et al., Efavirenz and rifampicin in the South African context: is there a need to dose-increase efavirenz
with concurrent rifampicin therapy? Antivir Ther. , 2011. 16(4): p. 527-34.
274. Bhatt NB, et al., Nevirapine or efavirenz for tuberculosis and HIV coinfected patients: exposure and virological
failure relationship. J Antimicrob Chemother., 2015. 70: p. 225-232.
275. Jindani A., et al., A randomised Phase II trial to evaluate the toxicity of high dose rifampicin to treat pulmonary
tuberculosis R1. Int J Tuberc Lung Dis (In press), 2016.
Page 169 of 176
276. Gengiah TN., et al., Efavirenz dosing: influence of drug metabolizing enzyme polymorphisms and concurrent
tuberculosis treatment. Antivir Ther. , 2015. 20(3): p. 297-306.
277. Borand L., et al., Plasma concentrations, efficacy and safety of efavirenz in HIV-infected adults treated for
tuberculosis in Cambodia (ANRS 1295-CIPRA KH001 CAMELIA trial). PLoS One. , 2014. 9(3): p. e90350. .
278. Mariana N., et al., Efavirenz Plasma Concentrations and HIV Viral Load in HIV/AIDS-tuberculosis Infection
Patients Treated with Rifampicin. Acta Med Indones., 2016. 48(1): p. 10-6.
279. Mukonzo JK., et al., Influence of efavirenz pharmacokinetics and pharmacogenetics on neuropsychological
disorders in Ugandan HIV-positive patients with or without tuberculosis: a prospective cohort study. BMC Infect
Dis. , 2013. 13: p. 261.
280. Dorman S.E., et al., Substitution of Moxifloxacin for Isoniazid during Intensive Phase Treatment of Pulmonary
Tuberculosis. American Journal of Respiratory and Critical Care Medicine, 2009. 180: p. 273–280.
281. Weiner M., Peloquin C., and Burman W., Effects of Tuberculosis, Race, and Human Gene SLCO1B1
Polymorphisms on Rifampin Concentrations. Antimicrob Agents Chemother., 2010. 54(10): p. 4192-4200.
282. Rekha V.V.B., Balasubramanian R., and Swaminathan S., Sputum conversion at the end of intensive phase of
Category-1 regimen in the treatment of pulmonary tuberculosis patients with diabetes mellitus or HIV infection:
An analysis of risk factors. Indian J Med Res, 2007. 126: p. 452-458.
283. Visser M.E., Stead M.C., and Walzl G., Baseline Predictors of Sputum Culture Conversion in Pulmonary
Tuberculosis: Importance of Cavities, Smoking, Time to Detection and W-Beijing Genotype. PLOS One., 2012.
7(1).
284. Nijenbandring de Boer, R., et al., Delayed culture conversion due to cigarette smoking in active pulmonary
tuberculosis patients. Tuberculosis, 2014. 94(1): p. 87-91.
285. Maciel E. L., Brioschi A. P., and Peres R. L., Smoking and 2-month culture conversion during anti-tuberculosis
treatment. The International Journal of Tuberculosis and Lung Disease, 2013. 17(2): p. 225-228(4).
286. Hesseling A. C., Walzl G., and Enarson D. A., Baseline sputum time to detection predicts month two culture
conversion and relapse in non-HIV-infected patients. The International Journal of Tuberculosis and Lung Disease,
2010. 14(5): p. 560-570(11).
287. Güler M., et al., Factors influencing sputum smear and culture conversion time among patients with new case
pulmonary tuberculosis. International Journal of Clinical Practice., 2007. 61(2): p. 231-235.
288. Singla, R., et al., Sputum smear positivity at two months in previously untreated pulmonary tuberculosis patients.
International Journal of Mycobacteriology, 2013. 2(4): p. 199-205.
289. William R., et al., Geographic Differences in Time to Culture Conversion in Liquid Media: Tuberculosis Trials
Consortium Study 28. Culture Conversion Is Delayed in Africa. PLoS ONE, 2011. 6(4).
290. Boeree MJ., et al., High-dose rifampicin, moxifloxacin, and SQ109 for treating tuberculosis: a multi-arm, multi-
stage randomized controlled trial. . Lancet Infect Dis., 2017. 17(1): p. 39–49.
291. Dube B., et al., Neuropsychiatric manifestations of HIV Infection and AIDS. J Psychiatry Neurosci, 2005. 30(4): p.
237-46.
292. Ciesla J. A. and Roberts J. E., Meta-Analysis of the Relationship Between HIV Infection and Risk for Depressive
Disorders The American Journal of Psychiatry, 2001. 158(5): p. 725-730.
Page 170 of 176
293. Horne D.J., et al., Sputum Monitoring during Tuberculosis Treatment for Predicting Outcome: A Systematic
Review and Meta-analysis. Lancet Infect Dis. , 2010. 10(6): p. 387-94.
294. Aliyu M.H., Salihu H.M., and Ratard R., HIV infection and sputum-culture conversion in patients diagnosed
withMycobacterium tuberculosis: A population-based study. Wiener Klinische Wochenschrift, 2003. 115(10): p.
340–346.
295. Atwine D., et al., Predictors of delayed culture conversion among Ugandan patients. BMC Infectious Diseases,
2017. 17: p. 299.
296. Boeree M. J., et al., A dose-ranging trial to optimize the dose of rifampin in the treatment of tuberculosis. Am. J.
Respir. Crit. Care Med., 2015. 191: p. 1058–1065.
297. Hill A., et al. The drug interaction between rifampicin and efavirenz is time-dependent: systematic review of 12
pharmacokinetic studies.[Abstr MOPE040] July 2014 . in International AIDS Conference. July 2014. Melbourne,
Australia.
298. Vitoria M., et al., When could new antiretrovirals be recommended for national treatment programmes in low-
income and middle-income countries: results of a WHO Think Tank. Curr Opin HIV AIDS 2017. 12(4): p. 414-422.
Page 171 of 176
ACKNOWLEDGEMENTS
My greatest gratitude goes to my God who has stood by my side, giving me hope even in the face of
hopelessness, weakness and despair. Faith kept me from giving up on this path. It is at this point that I would
like to appreciate ANRS for funding the RIFAVIRENZ trial and sponsoring part of my PhD expenses include
conference attendance. In the same breathe, my sincere thanks goes to Epicentre who have supported my PhD,
through financial support but also gave me time to attend to my studies. You have nurtured me and I have
grown in your midst and under your watch with your support. Thanks to the Emmanuel Baron, Rebecca Grais,
Nathalie, and the whole team in Epicentre, Paris who ensured that my annual registration processes is completed
and that my travels were facilitated. I may not mention names but know that I am exceedingly grateful.
Many people have contributed in one way or another to my PhD journey but some can’t go without mentioning.
To start with, my humble appreciation goes to my PhD Director Dr. Maryline Bonnet and my PhD Co-Director
Dr. Anne-Marie Taburet. The impact you have made in my life will stand endlessly. You saw this before I could
see it. You chose to take this journey with me and get me to the end of it. Amidst good and bad times when I
slowed down, when the studies failed to progress as expected, you never gave up on me. Thank you Maryline
for being a great selfless and strict mentor and better still my role model. Even when you had to join IRD, you
chose to move on with me. My sincere thanks to Prof Eric Delaporte for allowing me in and opening your
doors to me to pursue my PhD. Much more, thanks for introducing me to Anne-Marie. Thanks Anne-Marie for
all your kindness, selflessness and knowledge that you have passed on to me. You introduced me to your
workplace, to your laboratory, and team, so that I can get the best out of my PHD Journey. Both of you have
now an again postponed your programmes, kept me on your agendas, and all for the sake of guiding me
throughout this journey. Yes, what you may not know is that you did this not only for me, but for my whole
family, friends, work-mates and my admirers who have a dream of walking this path one day. I will never forget
you for this. You deserve a full chapter in my book. Thank you Prof. Juliet Mwanga-Amumpaire, for having
exceeded your previous title as ‘my best lecturer in medical school’. Your care, counsel and words of
encouragement have been incredible. All I needed at times was someone to understand me, and you did exactly
that. You have seen both my greatest laughters but also my tears as I negotiated around the storms. As my
immediate supervisor, you have done more than I expected. You ensured that I had enough time and
quarantined me under the notice ‘minimum interference’ for which I have been branded. Thanks to my
Epicentre team for enduring my closed space at times, you did well. Thanks Mathieu and Elisabeth Baudin, you
came in whenever I needed your support. To my Rifatox and Rifavirenz teams, Dr(s) Racheal, Viola, Mworozi
and Kananura, and also Pauline, Dinah and Amelius, Brenda, Emmanuel, Eve and the whole laboratory, data,
pharmacy and logistics, what a pleasure working with you. You have a great stake in this indeed. Special thanks
Page 172 of 176
to Dr Amina Jindani. For you, I would need a separate chapter also, because without you, I wouldn’t have
known the need to shorten tuberculosis treatment. Your long lived passion towards reducing the suffering of
Tuberculosis patients as they serve longer “treatment sentence” challenged me and inspired this work. My
commitment to you can only be through continuing with this agenda. Thanks Fabienne Nackers, for you, it is
beyond words. When my career was at stand still, when I was about to give-up because of depression, you saw
potential in me. You activated my desire to study more. You recommended me for my first Masters’ degree,
which became the cornerstone, was my first experience to travel out of Uganda, and in the country were I was
a stranger, you became my family, friend and encourager. You paid my ticket to attend my first international
conference in Paris. Thanks for having shared your PhD book with me before I even finished my first master.
This inspired me greatly. Thanks to the former Directors of Epicentre who have played a role in my career, to
mention, Dr Pierre, Margarita, Yap Boum and last but not least Patrice Piola who gave me a job in 2017 but
also told me that I would make a great researcher even at the time when I was seeing nothing. Here I am today,
still motivated to reach that goal. Shakila, Afsar, Ela and Agatha, you always made my journeys a success. Thanks
for the support. Thanks to my dear wife Dr. Atwine Sunday, my sweet children Glorious Grace Atwine and
Blessed Emmanuel Atwine. I did this for you, to give you the courage to go for what many fear to go for. Your
love, care and patience despite my absence at home, as I travelled to study and as I worked longer on my
research kept me from breaking down. To my spiritual father Bishop Allan Bukuru, thanks for the
encouragement. You taught me to work hard, stay focused, pray and fight to the end. Thanks for praying for
me. I needed great grace on this journey. To my mother Mrs Sarah Tulina-omubeezi, it is the foundation you
gave me that has brought me here. Thanks to my siblings, Nicholas, Priscilla, Gloria, Lawrence, David and
Mathias, know that it is possible. I can’t wait to cheer you up. To my dear friend Osemeke Oosokogu, you are
a special friend that stuck right from Brussels. Thanks for sharing your PhD thesis with me. It was such an
inspiration on my final journey. Dr Arunga Simon my best friend, thanks for believing in me, especially starting
to prepare my graduation party before I could even write my thesis. You are an incredible encourager. Thanks
Bernard for all the assistance. Thanks to my friends in the PhD race, Patrick Orikiriza and Dr Elizabeth, and I
wish you well. Thanks to Dr Francis Bajunirwe, for giving me my first opportunity to lecture students at Mbarara
University, I will always be grateful. Thanks to Sandrine Urvoy for the guidance and support throughout the
PhD journey. Last but not least, I would like to appreciate my PhD committee members especially Cécile
Goujard, Sylvain Godreuil for standing with me and my PhD directors to guide me through the tides of this
journey up till the final defense. Many thanks to my Phd Jury members/reviewers for accepting to take on this
final role of launching me into the future i have always looked up to. Thanks to Prof(s)Nicolas Veziris and
Rodolphe Garraffo.
Page 173 of 176
PHD PORTFOLIO Name: Atwine Daniel Director: Dr. Maryline Bonnet Co-Director: Dr. Anne-Marie Taburet Affiliation: MSF-Epicentre Department: Clinical Research PhD period: 2013 – November 2017 PhD Training Certified short trainings under-taken
2016 Field Management Training (FMT), Epicentre, Uganda 2016 Research Communication and Internationalization Training of Trainers, MUST/LUND
University, Uganda 2015 Systematic Review and Meta-analysis Course, University of Bern, Switzerland, 2015 Mentorship Training and Students Supervision Course, JCRC/COHRE 2014 Pharmaco-epidemiology, Erasmus MC University Medical Center, Rotterdam, 2014 Primary and Secondary Prevention Research, Erasmus MC University Medical Center,
Rotterdam 2014 Mbarara Training Program for Researchers, MSF- Epicentre, Uganda 2014 Leadership and Management Course, IMPLINT- UGANDA
Oral Presentations
- Is it safe to double the dose of rifampicin to shorten tuberculosis treatment duration? (Epicentre Scientific Conference, Kampala, 5th July2017)
- Delayed tuberculosis culture conversion: Predictors and mycobacterial culture effect among Ugandan patients. (Annual Grande doctors’ Conference, 11-13th August 2016, Kampala, Uganda)
- An International Multicentre Controlled Clinical Trial to Evaluate the Toxicity of High Dose Rifampicin in the Treatment of Pulmonary Tuberculosis (RIFATOX). (Annual Grande doctors’ Conference, 11-13th August 2016, Kampala, Uganda.)
- D Atwine, et al. Delayed tuberculosis culture conversion: Predictors and mycobacterial culture effect among Ugandan patients. In 47th Union World Conference on Lung Health, 26 to 29 October 2016 - Liverpool, UK [Abstr ID: SOA-505-27]
Poster presentations
- Daniel A., et al. Eight weeks safety results of high-dose Rifampicin in HIV-Tuberculosis co-infected patients in Uganda: RIFAVIRENZ-ANRS 12292 Trial. (IAS conference for HIV science, 23rd-26th July2017, Paris, France)
Page 174 of 176
- Delayed conversion or Treatment failure: Diagnosis, Predictors, and Outcomes of month-two non-conversion among immuno-competent TB patients in Uganda. (National Tuberculosis Stakeholders’ meeting,
2015)
- Atwine D. et al. An International Multicentre Controlled Clinical Trial to Evaluate the Toxicity of High
Dose Rifampicin in the Treatment of Pulmonary Tuberculosis (RIFATOX). In. MSF at 30 years in Uganda
Exhibition, 2015, Kampala, Uganda (Poster presentation).
Lecturing
Quantitative research methods Master in Health Information Technology, Uganda, 2016 -2017
Clinical Research Master in Public Health class, Mbarara University of Science and Technology, Uganda, 2016
Epidemiology Master in Public Health class, Mbarara University of Science and Technology, Uganda, 2015
Systematic review and meta-analysis Researchers at Epicentre Mbarara research Centre, Uganda, 2016 Students’ supervisory activities
2014 Namugerwa Shadia, Bsc Pharmacy Magnitude, self-reported reasons and perceived solutions for missed ART dose among pediatric patients treated from ISS-Clinic, MRRH.
2014 Aziiz Kapande, Bsc Pharmacy Patient and provider perceptions and clinical outcomes following prescribing medicines that is out of stock at Mbarara Regional Referral Hospital.
2017 Benedict Agaba, MSc Health Information Technology
Improving of diabetic patients’ self-management through a mobile phone intervention: a situation analysis
2017 Nyangoma Miria, MSc Health Information Technology
Effect of an innovative information delivery intervention on tuberculosis patients’ early post-disclosure experiences at household level
Professional Memberships
- Member of UNION. - Member of IAS
Page 175 of 176
About the Author
Atwine Daniel was born in Ssembabule district, Uganda. He is a second born in a family of 7 children. He completed his high school from Muntuyera High School in 2000. Having excelled, he joined Mbarara University of Science and Technology under a government sponsorship, and graduated with a Bachelors in Human Medicine and Surgery in 2006. He then joined MSF-Epicentre in November 2007 as a Clinical investigator in an International Multicentric EDCTP trial evaluating 4 Artemesinin-based combinations in treatment of uncomplicated malaria in Children. His interest in research grew, that he decided to build his career further by undertaking an Advanced Master in Public Health Methodology (MPHM) at the Université Libre de Bruxelles (ULB) in Belgium between 2009 and 2010, under CUD international scholarships. He
utilized this opportunity to also do a Post-graduate Diploma in advanced methodologies and also in communication. Having excelled with a Grande distinction master, he was further motivated to return to his parent organization (Epicentre) in Uganda in 2010, to further his new research interests and to apply his acquired skills. At this point, with the desire to share these skills, he engaged into occasional lecturing of post-graduate students at Mbarara University of Science and Technology. His turning point from Malaria into TB research started in 2010. He was first engaged in TB diagnostic studies which he coordinated and then to TB chemotherapeutic Trials from 2011. He has been the Ugandan principal investigator of RIFATOX, RIFAVIRENZ, and now RIFASHORT Trials. All these are focussed on TB treatment shortening with use of high rifampicin doses. In the Interim, he under-took an MPhil in Science and Technology at Stellenbosch University in South Africa with focus on research uptake, evaluation, impact assessment and science policy and communication, sponsored by DRUSSA. He started his PhD studies in 2013 as described in this thesis. Atwine’s PhD was directed by Dr. Maryline Bonnet and Dr Anne-Marie Taburet. During his PhD, he atended a number of courses nationally and internationally, specifically at University of Erasmus, Netherlands in Pharmaco-epidemiology and University of Bern, Switzerland in systematic review and meta-analysis. Other non-scientific courses taken in Uganda included: Leadership and managment, Research communication, students mentorship, among others. He has been involved in students’ research supervision, and acted as an External examiner at University of CapeTown in the course of Health Innovation. Atwine is adventurous and is open to new knowledge that can support his career dreams. Atwine is a licensed medical doctor and public health specialist by the Uganda medical and dental practitioners’ council. He is a member of UNION, IAS, and African biomedical engineering
consortium (ABEC). Atwine has continued to actively mentor young researchers, both students and non-students, something that he loves to do and desires to be known for in the future. His passion is in inspiring the young generation of professionals into research, and promoting biomedical research outputs on the African continent. In the field of Tuberculosis, his passion is on identifying innovative treatments that could lead to a shortening of treatment. Atwine is a God fearing man, married to a fellow doctor with two children. He loves to see people happy and will try to just get that out of them despite what they are going through. He loves making new collaborations, to play a guitar, piano, singing Christian songs and praying. He enjoys being with his family, travelling and he plays volley ball.

Page 176 of 176