Embed Size (px)
Citation preview
Improving Storm Forecasts by Data Assimilation of GPM-era Observations Sara Q. Zhang1,2, P. Chambon3, A. Y. Hou1, M. Zupanski4 and S. Cheung5
1 GSFC Code 612, 2SAIC, 3Météo France, 4Coloardo State Univ., 5Univ. of California
Earth Sciences Division - Atmospheres
The Goddard WRF ensemble data assimilation system has capabilities to utilize GPM-era precipitation observations to improve storm predictions. New techniques have been developed to assimilate satellite radiance at pixel resolution with observation bias correction and microphysics in control variables. The forecast during the storm evolution and advection has lower RMSE and higher correlation comparing to forecasts without data assimilation, verified against independent radar data.
satellite observations on the storm Storm forecast with GPM-constellation data assimilation
error reduction via data assimilation
RM
SE
Name: Sara Q. Zhang, NASA/GSFC, Code 612 / SAIC E-mail: [email protected] Phone: 301-614-6148
References:Chambon P., S.Q. Zhang, A. Y. Hou, M. Zupanski, and S. Cheung, 2014: Assessing the impact of pre-GPM constellation microwave precipitation radiance data in the Goddard WRF ensemble data assimilation system. Quart. J. Roy. Meteorol. Soc. , Volume 140, 681, 1219-1235 . DOI: 10.1002/qj.2215
Data Sources: Microwave radiance observations from GPM constellation satellites including SSMIS, MHS, AMSRE are assimilated; surface precipitation derived from European ARAMIS radar network is used as verification data; NCEP operational global analysis is used in lateral boundary conditions for regional forecasts.
Technical Description of Figures:
Storm forecasts with GPM-constellation data assimilation: high-resolution precipitation forecast ( at 9KM spatial resolution) with improved initial condition due to GPM constellation data assimilation. The data assimilation cycling uses level-1 microwave radiance observations following the storm development, and issues storm forecasts during the storm evolution and advection. The figure shows the surface rainfall accumulation during the storm, which has lower RMSE and higher correlation comparing to forecasts without data assimilation, verified against independent radar data.
Satellite observations: SSMIS overpass in the storm region with strong brightness temperature depression, the figure shows the radiance observations at 91 GHz.
Error reduction during assimilation of GPM constellation data: Domain averaged RMSE time series in comparison to GPM constellation observations ( radiance at 91 and 89 GHz in storm region), the vertical bars indicate the reduction of RMSE ( top point representing before assimilation, and bottom point representing after assimilation), The red curve (respectively blue curve) corresponds to the reduction of RMSE for samples with positive departures (respectively negative departures).
Scientific significance, societal relevance, and relationships to future missions: Precipitation plays key roles in the global and regional hydrological cycles. It is also a difficult environmental variable to predict because of the highly nonlinearity and large variability. Satellite radiance data can provide valuable information via data assimilation to improve storm predictions. The Goddard WRF ensemble data assimilation system has equipped state-of-art techniques to effectively utilize GPM-era global precipitation measurements and serve as an information integration tool to produce optimal precipitation estimates and associated dynamics for weather prediction and climate studies.
Earth Sciences Division - Atmospheres
Better Deep Blue Products: Aerosol Single Scattering Albedo and Heightfrom Combined S-NPP VIIRS, OMPS, and CALIOP Observations
Jaehwa Lee1,2, N. Christina Hsu1, Corey Bettenhausen1,3, Andrew Sayer1,4, and Nicholas Carletta1,3
1Code 613, NASA/GSFC, 2ESSIC/UMD, 3SSAI, 4GESTAR/USRA
Earth Sciences Division - Atmospheres
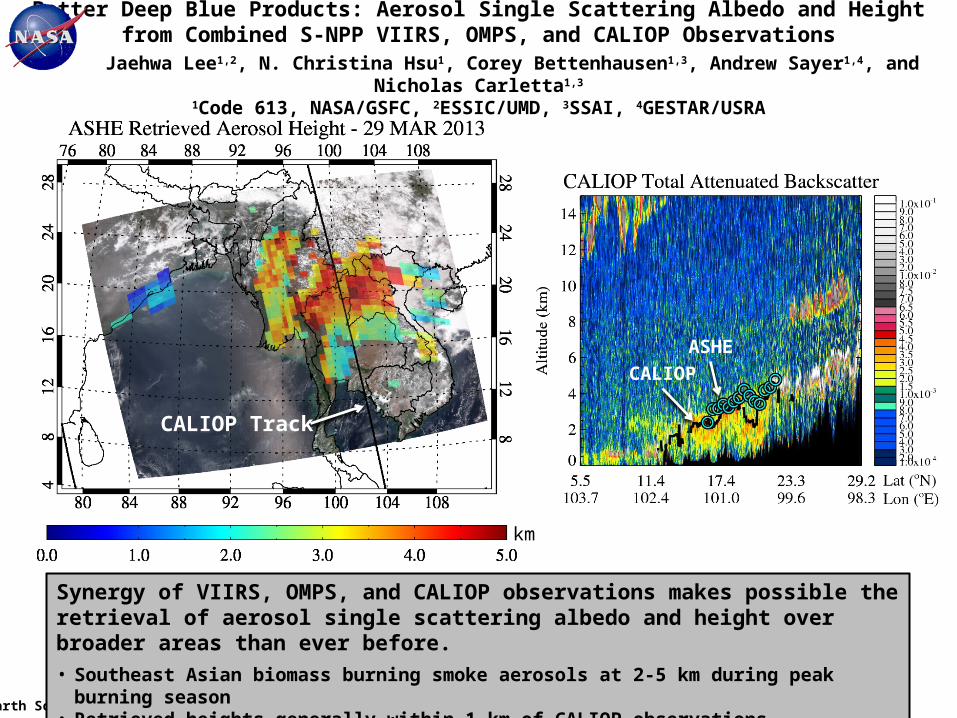
Synergy of VIIRS, OMPS, and CALIOP observations makes possible the retrieval of aerosol single scattering albedo and height over broader areas than ever before.
• Southeast Asian biomass burning smoke aerosols at 2-5 km during peak burning season• Retrieved heights generally within 1 km of CALIOP observations
CALIOP
ASHE
km
CALIOP Track
Name: Jaehwa Lee, NASA/GSFC, Code 613 and Earth System Science Interdisciplinary Center, University of Maryland E-mail: [email protected] Phone: 301-614-6407
References:Jeong, M.-J. and N. C. Hsu, 2008: Retrievals of aerosol single-scattering albedo and effective aerosol layer height for biomass-burning smoke: Synergy derived from “A-Train” sensors. Geophysical Research Letters, 35, L24801, doi:10.1029/2008GL036279.Lee, J., N. C. Hsu, C. Bettenhausen, A. M. Sayer, C. J. Seftor, and M.-J. Jeong, in press: Retrieving the height of smoke and dust aerosols by synergistic use of VIIRS, OMPS, and CALIOP observations. Journal of Geophysical Research-Atmospheres, doi:10.1002/2015JD023567.
Data Sources: VIIRS Deep Blue aerosol product; OMPS UV aerosol index; CALIOP aerosol backscatter coefficient profile; MPL aerosol backscatter coefficient profile; AERONET inversion data. This project was supported by NASA’s EOS program, managed by H. Maring. The VIIRS, OMPS, CALIOP, MPLNET, and AERONET teams are gratefully acknowledged for their efforts in maintaining the science data records used in this investigation.
Technical Description of Figures:Map (left panel): Application of the Aerosol Single-scattering albedo and Height Estimation (ASHE) algorithm to a smoke event observed over Indochina on 29 March 2013. The combined use of Visible Infrared Imaging Radiometer Suite (VIIRS), Ozone Mapping and Profiler Suite (OMPS), and Cloud-Aerosol Lidar with Orthogonal Polarization (CALIOP) observations allows our algorithm to retrieve single-scattering albedo (SSA) along the CALIOP swath which is then used for retrieving aerosol height information over broad areas extending outside of the CALIOP swath. The algorithm has been successfully applied to biomass burning smoke aerosols over Southeast Asia, wildfire smoke over North America, and Saharan dust over the Atlantic Ocean. Global data processing is planned in the future.
Curtain image (right panel): The retrieved aerosol heights (cyan symbols) compare well to the CALIOP observations (black line). Although the CALIOP heights are used to retrieve SSA, which is then used as input for retrievals of aerosol layer height, comparison between the two demonstrates how the algorithm behaves according to uncertainties in AOD, SSA, cloud contamination, etc. Extensive sensitivity studies and large scale comparisons of the retrieved heights suggest an uncertainty level of ~30%, which corresponds to 1.5 km for typical smoke and dust layers aloft at 5 km.
Supplementary information: The retrieved heights are also compared to ground-based Micro Pulse Lidar (MPL) measurements in order to assess the retrieval performance outside of the CALIOP swath. The comparison results at the Doi Ang Khang super site of the 7-SEAS/BASELInE (7-South-East Asian Studies/Biomass-burning Aerosols & Stratocumulus Environment: Lifecycles and Interactions Experiment) field campaign are promising, generally showing an uncertainty level of 30% (absolute error of ~1 km). In addition, the retrieved SSA is generally within 0.03 of AERONET inversion data at 440 nm if favorable conditions are met, i.e., high aerosol loading, sufficient number of collocations between VIIRS/OMPS and CALIOP data for SSA retrievals, and absence of clouds. The SSA of biomass burning smoke aerosols over continental Southeast Asia is found to be 0.89 ± 0.03 during the peak burning season.
Scientific significance, societal relevance, and relationships to future missions: Aerosol altitude is one of the key parameters required for better assessing the radiative effects of aerosols, as it is critical for determining the vertical structure of the radiation field. In particular, absorbing aerosols are known to have a significant impact on the atmospheric heating rate, which in turn modulates atmospheric stability and the lifetime of adjacent clouds. The height information can also be informative about possible long-range transport of aerosols and help to improve air quality monitoring. Currently, CALIOP spaceborne lidar provides aerosol vertical profiles in great detail, but the narrow swath makes it difficult to observe their spatial distribution over broad areas. The synergistic use of multiple satellite sensors can provide a more complete picture of the global distribution of aerosol heights, enhancing existing data sets. This synergy can continue with the current S-NPP and CATS missions and planned JPSS and ACE missions.
Earth Sciences Division - Atmospheres
What caused the steps in stratospheric global temperature anomalies?V. Aquila1,2, W. Swartz3, P. Colarco1, S. Pawson4, L. Polvani5, R. Stolarski6, D. Waugh6
1Code 614, NASA GSFC, 2GESTAR, 3Johns Hopkins University APL, 4GMAO, NASA GSFC, 5Columbia University, 6Johns Hopkins University
Earth Sciences Division - Atmospheres
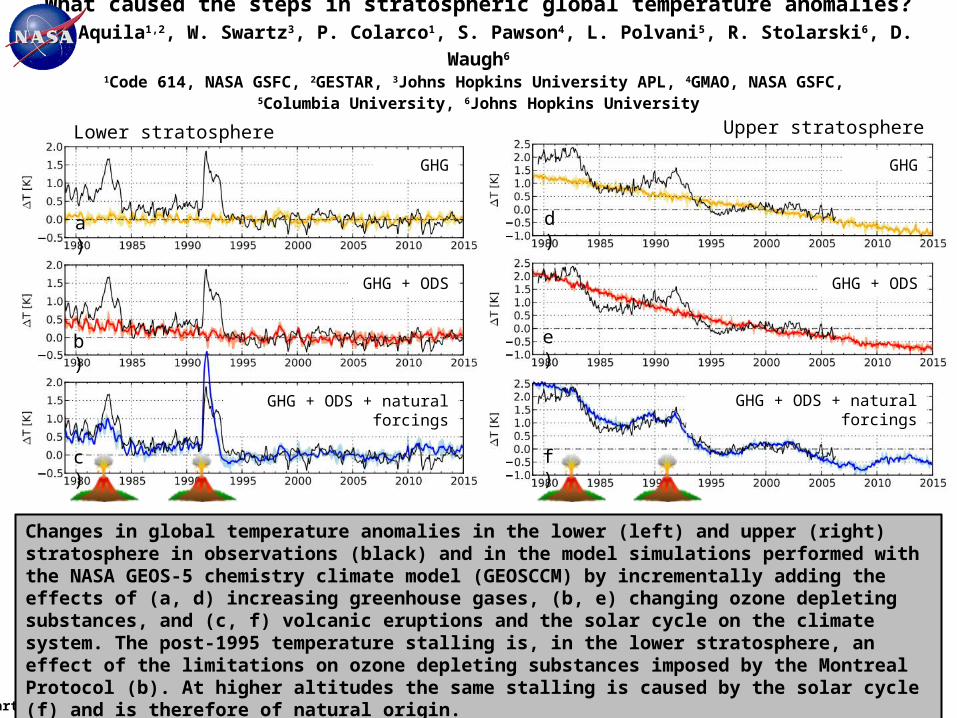
Changes in global temperature anomalies in the lower (left) and upper (right) stratosphere in observations (black) and in the model simulations performed with the NASA GEOS-5 chemistry climate model (GEOSCCM) by incrementally adding the effects of (a, d) increasing greenhouse gases, (b, e) changing ozone depleting substances, and (c, f) volcanic eruptions and the solar cycle on the climate system. The post-1995 temperature stalling is, in the lower stratosphere, an effect of the limitations on ozone depleting substances imposed by the Montreal Protocol (b). At higher altitudes the same stalling is caused by the solar cycle (f) and is therefore of natural origin.
Lower stratosphere Upper stratosphere
GHG
GHG + ODS
GHG + ODS + natural forcings
GHG
GHG + ODS
a)
b)
c)
d)
e)
f)
GHG + ODS + natural forcings
Name: Valentina Aquila, NASA/GSFC, Code 614; GESTAR/Johns Hopkins University E-mail: [email protected] Phone: 301-614-6927
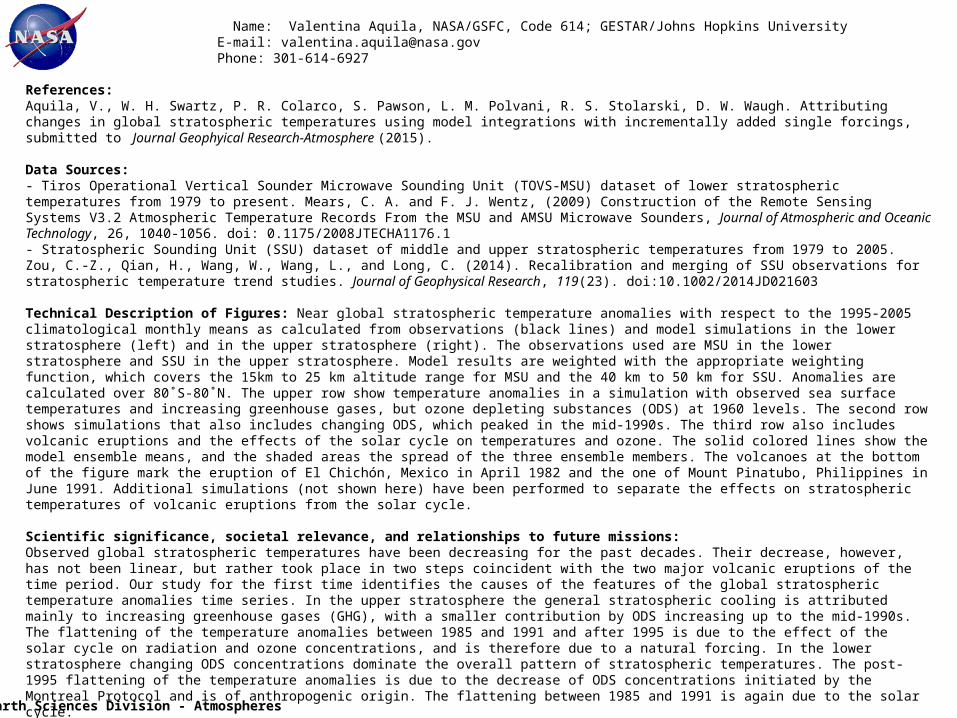
References: Aquila, V., W. H. Swartz, P. R. Colarco, S. Pawson, L. M. Polvani, R. S. Stolarski, D. W. Waugh. Attributing changes in global stratospheric temperatures using model integrations with incrementally added single forcings, submitted to Journal Geophyical Research-Atmosphere (2015).
Data Sources: - Tiros Operational Vertical Sounder Microwave Sounding Unit (TOVS-MSU) dataset of lower stratospheric temperatures from 1979 to present. Mears, C. A. and F. J. Wentz, (2009) Construction of the Remote Sensing Systems V3.2 Atmospheric Temperature Records From the MSU and AMSU Microwave Sounders, Journal of Atmospheric and Oceanic Technology, 26, 1040-1056. doi: 0.1175/2008JTECHA1176.1- Stratospheric Sounding Unit (SSU) dataset of middle and upper stratospheric temperatures from 1979 to 2005. Zou, C.-Z., Qian, H., Wang, W., Wang, L., and Long, C. (2014). Recalibration and merging of SSU observations for stratospheric temperature trend studies. Journal of Geophysical Research, 119(23). doi:10.1002/2014JD021603
Technical Description of Figures: Near global stratospheric temperature anomalies with respect to the 1995-2005 climatological monthly means as calculated from observations (black lines) and model simulations in the lower stratosphere (left) and in the upper stratosphere (right). The observations used are MSU in the lower stratosphere and SSU in the upper stratosphere. Model results are weighted with the appropriate weighting function, which covers the 15km to 25 km altitude range for MSU and the 40 km to 50 km for SSU. Anomalies are calculated over 80˚S-80˚N. The upper row show temperature anomalies in a simulation with observed sea surface temperatures and increasing greenhouse gases, but ozone depleting substances (ODS) at 1960 levels. The second row shows simulations that also includes changing ODS, which peaked in the mid-1990s. The third row also includes volcanic eruptions and the effects of the solar cycle on temperatures and ozone. The solid colored lines show the model ensemble means, and the shaded areas the spread of the three ensemble members. The volcanoes at the bottom of the figure mark the eruption of El Chichón, Mexico in April 1982 and the one of Mount Pinatubo, Philippines in June 1991. Additional simulations (not shown here) have been performed to separate the effects on stratospheric temperatures of volcanic eruptions from the solar cycle.
Scientific significance, societal relevance, and relationships to future missions: Observed global stratospheric temperatures have been decreasing for the past decades. Their decrease, however, has not been linear, but rather took place in two steps coincident with the two major volcanic eruptions of the time period. Our study for the first time identifies the causes of the features of the global stratospheric temperature anomalies time series. In the upper stratosphere the general stratospheric cooling is attributed mainly to increasing greenhouse gases (GHG), with a smaller contribution by ODS increasing up to the mid-1990s. The flattening of the temperature anomalies between 1985 and 1991 and after 1995 is due to the effect of the solar cycle on radiation and ozone concentrations, and is therefore due to a natural forcing. In the lower stratosphere changing ODS concentrations dominate the overall pattern of stratospheric temperatures. The post-1995 flattening of the temperature anomalies is due to the decrease of ODS concentrations initiated by the Montreal Protocol and is of anthropogenic origin. The flattening between 1985 and 1991 is again due to the solar cycle.The monitoring of stratospheric temperatures allows to identify a sign of the effect of the Montreal protocol on the global climate. With the progressive decrease of ozone depleting substances, stratospheric temperatures anomalies will reflect more and more the increase in greenhouse gases, showing even more clearly the fingerprint of anthropogenic greenhouse gases on the global climate.
Earth Sciences Division - Atmospheres