Embed Size (px)
Citation preview

IMPROVING
SPECIAL EDUCATION SERVICES
In the
Detroit Public Schools Community District
Submitted to the Board of Education
of the
Detroit Public Schools Community District
by the
Strategic Support Team
of the
Council of the Great City Schools
Summer 2018

Improving Special Education Services in the Detroit Community School District
Council of the Great City Schools Page i
Table of Contents
Acknowledgements ....................................................................................................................... 1
Chapter 1. Purpose and Origin of the Project .......................................................................... 2 The Work of the Strategic Support Team ..................................................................................................... 2 Methodology and Organization of Findings ................................................................................................. 3
Chapter 2. Background and Overview ....................................................................................... 5 State Oversight of Detroit Public Schools ..................................................................................................... 5
State Funding ............................................................................................................................................ 6 Education Achievement Authority (EAA) .................................................................................................. 6 School Choice ............................................................................................................................................ 7 Personnel Shortages ................................................................................................................................. 8
Detroit Public Schools Community District ................................................................................................... 8
Chapter 3. Executive Summary ................................................................................................ 10
Chapter 4. Findings and Recommendations ........................................................................... 12
I. Multi-Tiered Systems of Support ................................................................................................... 12 Michigan Guidance for MTSS ...................................................................................................................... 13
Top 10 in 10 Strategic Plan ..................................................................................................................... 14 State (Special Education) Systemic Improvement Plan (SSIP) ................................................................ 14 Michigan’s Integrated Behavior and Learning Support Initiative ........................................................... 14 Response to Intervention and Positive Behavior Intervention and Supports (PBIS) ............................... 15 Wayne RESA Guidance ............................................................................................................................ 15
Detroit Public Schools Prior Guidance and Practices .................................................................................. 16 RtI Handbook .......................................................................................................................................... 16 RtI Tool Kit............................................................................................................................................... 17 Focus Group Feedback ............................................................................................................................ 18 Blueprint 2020 ........................................................................................................................................ 19
AREAS OF STRENGTH .................................................................................................................................. 21 OPPORTUNITIES FOR IMPROVEMENT ........................................................................................................ 22 RECOMMENDATIONS ................................................................................................................................. 23
II. Disability Prevalence Rates and 2016-17 Evaluation Outcomes ...................................................... 27 District Prevalence Rates ............................................................................................................................ 27
Comparison of DPSCD, Urban Districts, National, and State Special Education Rates ........................... 27 Rates by Disability Areas for District, State and Nation ......................................................................... 28 DPSCD and Detroit Charter School Enrollment and Special Education Demographics .......................... 28 DPSCD Disability Rates by Grade ............................................................................................................ 32 English Learners by Grade ...................................................................................................................... 34 DPSCD Disability Incidence by Race/Ethnicity ........................................................................................ 35
Special Education Eligibility and Timeliness ................................................................................................ 37 Timeliness of Evaluations ........................................................................................................................ 38
AREAS OF STRENGTH .................................................................................................................................. 38 OPPORTUNITIES FOR IMPROVEMENT ........................................................................................................ 38 RECOMMENDATIONS ................................................................................................................................. 39
III. Teaching and Learning for Students with Disabilities .................................................................... 42
Improving Special Education Services in the Detroit Community School District
Council of the Great City Schools Page ii
Education of Young Children Ages Three to Five Years .............................................................................. 43 Achievement Outcomes for Children with IEPs (Three to Five Years of Age).......................................... 43 Educational Settings of Young Children Three to Five Years of Age ....................................................... 44
Student Achievement on the NAEP and Statewide Assessments for Grades 3-12 .................................... 45 NAEP Achievement Rates for Fourth, Eighth, and Twelfth Grade Students with IEPs ............................ 45 Statewide Assessments ........................................................................................................................... 48
Educational Settings for Students with Disabilities .................................................................................... 49 Comparison of Rates for District, State, and Nation............................................................................... 50 Educational Setting Rates by Grade ....................................................................................................... 51 Educational Setting Rates by Disability Areas ........................................................................................ 52 Educational Setting Rates by Race/Ethnicity .......................................................................................... 53
Suspension and Expulsion Rates ................................................................................................................. 55 Out-of-School Suspensions ..................................................................................................................... 55
Academic Instruction, Intervention, and Supports ..................................................................................... 57 Instruction and Specialized Support for Students in General Education Classes .................................... 59 Instruction for Students in Specialized Programs ................................................................................... 61 Configuration of DPSCD Specialized Programs ....................................................................................... 61 Specialized Programs in Regular Schools ................................................................................................ 62 Number of Specialized Classes by Regular School Grade Level .............................................................. 62 Number of Specialized Programs by Type of Program ........................................................................... 63 Students in Specialized Programs from Other Districts .......................................................................... 64 Specialized Programs by School Types .................................................................................................... 64 Percentage of Students with IEPs by School Type .................................................................................. 65 Percentage of Students with IEPs Enrolled in Examination and Application Schools ............................. 66 Focus Group Participant Feedback ......................................................................................................... 67 Instruction for Students in Specialized Schools ....................................................................................... 68 Percentage of Students by Specialized Program in Separate Schools .................................................... 68 Students from Other Districts ................................................................................................................. 69 Focus Group Participant Feedback ......................................................................................................... 69 Placement Center.................................................................................................................................... 70 Overall Observation of DPSCD’s Configuration of Special Education ..................................................... 71
Secondary Transition Services and Support ............................................................................................... 72 Dropout Rates ......................................................................................................................................... 73 IEP Compliance and Post School Experience ........................................................................................... 74 Importance of Community-Based Work Experiences for Students with Disabilities .............................. 75
Professional Learning .................................................................................................................................. 77 Professional Learning in DPSCD .............................................................................................................. 77
Parent and Community Involvement .......................................................................................................... 78 AREAS OF STRENGTH .................................................................................................................................. 79 OPPORTUNITIES FOR IMPROVEMENT ........................................................................................................ 81 RECOMMENDATIONS ................................................................................................................................. 85
IV. Support for Teaching and Learning for Students with Disabilities.................................................. 93 Interdepartmental Communication and Collaboration .............................................................................. 93 Administration and Operation of Special Education .................................................................................. 94
Special Education Organizational Structure ........................................................................................... 94 Focus Group Feedback about Special Education Department Operation............................................... 95 School-based Support for Special Education Management and Operation ........................................... 97

Improving Special Education Services in the Detroit Community School District
Council of the Great City Schools Page iii
Special Education Related Staffing Ratios and Information ....................................................................... 98 Special Educators .................................................................................................................................... 99 Paraeducators ....................................................................................................................................... 100 Related Services .................................................................................................................................... 101 Overall School District Rankings ........................................................................................................... 102 Personnel Shortages ............................................................................................................................. 103 Focus Group Feedback About Shortages .............................................................................................. 103 Recruitment & Incentives ...................................................................................................................... 103
Compliance Issues ..................................................................................................................................... 104 Written Guidance .................................................................................................................................. 104 Special Education .................................................................................................................................. 104 Section 504 ........................................................................................................................................... 104 Due Process ........................................................................................................................................... 104 State Complaints ................................................................................................................................... 105 Overdue IEPs ......................................................................................................................................... 105 IEP System ............................................................................................................................................. 105
Fiscal Issues ............................................................................................................................................... 106 Proportional Funding Sources ............................................................................................................... 106 Comparison of DPSCD and Charter Schools for Total Per Pupil Special Education Costs ..................... 106 Focus Group Participant Feedback on Fiscal Issues .............................................................................. 107
Accountability ........................................................................................................................................... 108 Focus Group Participant Feedback ....................................................................................................... 108
AREAS OF STRENGTH ................................................................................................................................ 109 OPPORTUNITIES FOR IMPROVEMENT ...................................................................................................... 110 RECOMMENDATIONS ............................................................................................................................... 114
Chapter 5. Summary of Recommendations........................................................................... 122 Recommendation Matrix .......................................................................................................................... 122 List of Recommendations ......................................................................................................................... 130
Appendices ................................................................................................................................. 148 Appendix B. Data and Documents Reviewed ........................................................................................... 155 Appendix C. Draft Working Agenda .......................................................................................................... 157 Appendix E. Strategic Support Team ........................................................................................................ 165 Appendix F. About the Council and History of Strategic Support Teams ................................................. 168

Improving Special Education Services in the Detroit Community School District
Council of the Great City Schools Page 1
ACKNOWLEDGEMENTS
The Council of the Great City Schools (Council) thanks the many individuals who
contributed to this review of special education programs in the Detroit Public Schools Community
District (DPSCD). Their efforts were critical to our ability to present the district with the best
possible proposals for improving special education and related-services in the school system.
First, we thank Dr. Nikolai Vitti, the school district’s superintendent. It is not easy to ask
one’s colleagues for the kind of reviews conducted by the Council’s teams. Typically, our reports
are very tough. It takes courage and openness to request them and a real desire for change and
improvement. Dr. Vitti has these in abundance.
Second, we thank the DPSCD school board, which approved and supported this review.
We hope this report meets your expectations and will help improve special education services
across the school system.
Third, we thank district staff members who contributed to this effort, particularly Iranetta
Wright, deputy superintendent of schools, and Michelle DeJaeger, senior executive director of
specialized student services. They arranged the interviews and provided the detailed data and
documents requested by the team. The time and effort required to organize a review such as this
are extraordinary, and their work and support of all the staff was much appreciated.
Fourth, the Council thanks the many individuals who met with us, including central office
administrators and personnel, principals, general and special educators, paraprofessionals and
aides, related-services personnel, parents, and representatives from the Detroit Federation of
Teachers and the Detroit Organization of School Administrators and Supervisors. They work
passionately to support children with disabilities and ensure the school district serves these
students in the best possible manner. District staff we met with were clearly dedicated to their
students and showed a strong desire to improve student achievement.
Fifth, the Council thanks Dr. Gregory Roberson, chief of exceptional children with the
Dayton Public Schools, and we thank his school system for allowing him to participate in this
project. We also thank Dr. Judy Elliott, former chief academic officer for the Los Angeles Unified
School District, who volunteered her time to participate in the site visit. Their contributions to this
review were enormous, and their enthusiasm and generosity serve as further examples of how the
nation’s urban public-school systems are banding together to help each other improve outcomes
for all urban students.
Finally, I thank Julie Wright Halbert, the Council’s legislative counsel, who facilitated the
work of the team prior to and during the team’s site visit, and Sue Gamm, a nationally recognized
expert in special education and a long-time consultant to the Council, who worked diligently with
Ms. Halbert to prepare the final report. Their work was outstanding, as always, and critical to the
success of this effort. Thank you.
Michael Casserly, Executive Director
Council of the Great City Schools

Improving Special Education Services in the Detroit Community School District
Council of the Great City Schools Page 2
CHAPTER 1. PURPOSE AND ORIGIN OF THE PROJECT
Dr. Nikolai Vitti asked the Council to review DPSCD’s services for students with
disabilities and provide recommendations to support the teaching and learning of these students.
It was clear to the Council’s team that the superintendent and his staff have a strong desire to
improve student outcomes. This report is designed to help DPSCD and its leaders achieve their
goal and maximize the district’s capacity to educate all students effectively.
The Work of the Strategic Support Team
To conduct its work, the Council assembled a team of experts who have successfully
administered and operated special education programs in other major urban school districts across
the country. These individuals also have firsthand expertise with the Individuals with Disabilities
Education Act (IDEA) and are well versed in best practices in the administration and operation of
special education programming.
The Council’s Strategic Support Team (Council team) visited the district on January 8-10,
2018. During this period, the Council team conducted interviews and focus groups with district
staff members and Michigan Department of Education personnel, Wayne County Regional
Education Service Agency (RESA), parents and parent representatives, the Detroit Federation of
Teachers, the Detroit Organization of School Administrators and Supervisors, and many others.
(A list of those interviewed is presented in the appendices of this report.) In addition, the team
reviewed numerous documents and reports, analyzed data, and developed initial recommendations
and proposals before finalizing this report. (See the appendices for a list of documents reviewed.)
On the final afternoon of its site visit, the team briefed the superintendent and deputy
superintendent on the team’s observations and preliminary recommendations.
This approach of providing technical assistance to urban school districts by using senior
managers from other urban school systems is unique to the Council and its members. The
organization finds it to be an effective approach for several reasons.
First, it allows the superintendent and staff members to work with a diverse set of talented,
successful practitioners from around the country. The teams provide a pool of expertise that
superintendents and staff can call on for advice as they implement the recommendations, face new
challenges, and develop alternative solutions.
Second, the recommendations from urban school peers have power because the individuals
who develop them have faced many of the same challenges encountered by the district requesting
the review. No one can say that these individuals do not know what working in an urban school
system is like or that their proposals have not been tested under the most rigorous conditions.
Third, using senior urban school managers from other urban school communities is less
expensive than retaining large management consulting firms that may have little to no
programmatic experience. The learning curve is rapid, and it would be difficult for any school
system to buy on the open market the level of expertise offered by the Council’s teams.
Members of the Strategic Support Team for this project included:

Improving Special Education Services in the Detroit Community School District
Council of the Great City Schools Page 3
Judy Elliot, Ph.D.
Former Chief Academic Officer
Los Angeles Unified School District
Sue Gamm, Esq.
Former Chief Officer for
Specialized Services
Chicago Public Schools
Julie Wright Halbert, Esq.
Legislative Counsel
Council of the Great City Schools
Gregory Roberson, Ed.D.
Chief, Office for Exceptional Children
Dayton Public Schools
Methodology and Organization of Findings
The findings in this report are based on information from multiple sources, including
documents provided by DPSCD and other organizations; electronic student data provided by
DPSCD; group and individual interviews; documents; and legal sources, including federal and
state requirements and guidance documents. No one is personally referred to or quoted in the
report, although school district position titles are referenced when necessary for contextual
purposes.
Chapter 2 of this report provides background information on the district. Chapter 3 presents
an executive summary of the report. Chapter 4 is the Council team’s findings and
recommendations. These findings and recommendations focus specifically on areas that the
superintendent and district leadership asked the Council’s team to address. These include
expanding equitable choices for students with disabilities, increasing their educational
opportunities, improving appropriate identification, enhancing teaching and learning, and
bolstering supports.
The findings and recommendations sections of the report, Chapter 4, contain a summary
of relevant information, along with descriptions of the district’s strengths, opportunities for
improvement, and recommendations for change. The chapter is divided into four broad sections:
a) Multi-tiered System of Supports
b) Disability Demographics and Referral/Identification of Disability
c) Achievement of Students with Disabilities
d) Support for Teaching and Learning for Students with Disabilities
Chapter 5 lists all recommendations in one place for easy reference, and provides a matrix
showing various components or features of the recommendations.
The appendices include the following information:
• Appendix A compares special education student incidence rates and staffing ratios in 75
major school systems across the country.
• Appendix B lists documents reviewed by the team
• Appendix C presents the team’s working agenda for its site visit.
• Appendix D lists individuals the team interviewed individually or in groups.

Improving Special Education Services in the Detroit Community School District
Council of the Great City Schools Page 4
• Appendix E presents brief biographical sketches of team members.
• Appendix F presents a description of the Council of the Great City Schools and a list of
Strategic Support Teams that the organization has fielded over the last 20 years.

Improving Special Education Services in the Detroit Community School District
Council of the Great City Schools Page 5
CHAPTER 2. BACKGROUND AND OVERVIEW
As the largest school district1 in Michigan, measuring more than 1,390 square miles, the
Detroit Public Schools Community District (DPSCD) enrolls 54,963 students, of which 9,980
(16.3 percent) have a disability. In addition, some 6,430 (12 percent) of the district’s students are
English learners (ELs). Of the EL students, 646 (10 percent) have a disability.
DPSCD students attend 108 schools, including 27 application schools, 6 schools attended
solely by students with disabilities, and 7 career/technical centers and adult education schools.
It is not possible to describe the school district of today without taking into account the
system’s history and state oversight. In 1966, the enrollment of the Detroit Public Schools’ (DPS)
was at its peak with some 300,000 students. The district had expanded for nearly 125 years until
the mid-to-late 1960s, but it began to decline precipitously when the city’s automobile industry
went into decline, court-mandated busing lead to substantial “white flight” to the suburbs, racial
unrest ensued, the population declined, and public trust was eroded with reports of misspending
of taxpayer dollars.
The spiral downward in enrollment and public confidence led, as it did in other cities at the
time, to reduced school funding and disinvestment.2 Finally, a series of reports, including by the
Council of the Great City Schools, led to state intervention.
State Oversight of Detroit Public Schools
From 1999 through May 2017, the State of Michigan exercised control over DPS in all but
about three years. During this period, there were four state appointed chief executive officers, four
emergency managers, and one transition manager, none of whom were able to completely stabilize
the school district or its finances.
Appointed School Board
In 1999, the Michigan legislature replaced DPS’s elected school board with a seven-
member “reform” board having six members appointed by the mayor and one selected by the state
superintendent of public instruction. It also selected a new superintendent to manage the district.
At the time of the reform board’s installation, DPS had a modestly increasing enrollment, a $100
million positive fund balance, and $1.2 billion remaining from a series of bonds that voters
approved five years earlier. By 2004, the surplus turned into a $200 million deficit, student
achievement had improved somewhat, and voters by a two-to-one margin won back the right to
have an elected school board.3
1 2018 Largest School Districts in Michigan, retrieved from https://www.niche.com/k12/search/largest-school-
districts/s/michigan/. 2 Unless otherwise stated, information in this section was based on A School District in Crisis, Detroit’s Public
Schools (1842-2015), retrieved from https://makeloveland.com/reports/schools. 3The vote was authorized by a sunset clause in the state law, After six years and four state-appointed managers, A
Detroit Public Schools’ debt has grown even deeper. Curt Guyette. Feb 25-March 3, 2015, retrieved from
https://www.metrotimes.com/detroit/after-six-years-and-four-state-appointed-managers-detroit-public-schools-debt-
is-deeper-than-ever/Content?oid=2302010

Improving Special Education Services in the Detroit Community School District
Council of the Great City Schools Page 6
Emergency Financial Management
The newly elected school board retained a new superintendent, but leadership was unable
to turnaround the district’s fortunes and audits showed the district’s finances and operations in
poor condition. Some three years later, in January 2009, the governor appointed the first
emergency financial manager for DPS. At that point, an appointed board of education was
reinstalled with little authority over the selection of a superintendent or the direction of district
resources. Through five successive managers over a period of eight years, the district’s enrollment
plummeted further, and more than 60 schools were shuttered while the district's financial
circumstance deteriorated. For students and district personnel at all levels, these circumstances
created a climate of uncertainty and discontent, further undermining public confidence.
The following data track some of the most recent circumstances.
• When in March 2009 the first emergency financial manager took office, DPS had 172
schools, 85,000 students, and a $219 million deficit.4
• By the end of the manager’s two-year term, the deficit had grown to over $284 million
dollars, 59 schools had closed, and the district had lost over 20,000 students.5
• By the end of 2013-14, DPS’s deficit had increased by almost $550 million to $763.7
million.
• By January 2016, DPS’s total debt topped $3.5 billion (from $1.5 billion in 2007-08).6
• By 2015, DPS enrollment had fallen from March 2009 by nearly 43 percent to 48,900
students.7
Exacerbating the district’s circumstances were changes in state funding; the initiation of
the Education Achievement Authority; the growth of school choice (charter schools and schools
of choice outside of DPS); and fiscal shortfalls related to personnel shortages.
State Funding
In 1994, there was a statewide referendum that shifted Michigan’s educational funding
from its primary reliance on local property taxes to a "per pupil" foundation grant provided by the
state. The loss of student enrollment and lower school funding for the city school system resulted
in lost revenue that would no longer be available to pay for DPS’s recent construction and
modernization activities.
Education Achievement Authority (EAA)
In September 2011, the state’s new EEA took over 15 DPS schools that enrolled some
11,000 students. By 2016, just under 6,000 students were enrolled in EEA schools, which served
a smaller proportion of students with disabilities than did DPS. EAA teachers were not unionized,
4 After six years and four state-appointed managers, Detroit Public Schools’ debt has grown even deeper. Ibid. 5 A School District in Crisis, Detroit’s Public Schools (1842-2015), retrieved from
https://makeloveland.com/reports/schools. 6 Metro Times. February 25, 2015; Detroit Free Press, retrieved from
https://www.freep.com/story/news/local/michigan/detroit/2016/01/06/dps-debt/78314708/. 7 After six years and four state-appointed managers, Detroit Public Schools’ debt has grown even deeper. Ibid.

Improving Special Education Services in the Detroit Community School District
Council of the Great City Schools Page 7
they received higher salaries than DPS teachers, and they did not pay into the state’s school
employee retirement system. When the EAA was disbanded in Detroit, 12 schools transferred back
to the district’s control and three converted into charter schools.8
School Choice
In addition to attending DPS, Detroit students have the choice of attending a charter school
in the city, or a charter or other public school outside the city.
Charter Schools
Beginning in 1994, with Michigan’s authorization of charter schools, charter growth in
Detroit aligned with DPS’s decline in district public schools.9 The initiative began with 14 charter
schools in 1995 and six years later over 19,000 students attended charter schools in Detroit. The
city’s charter sector expanded rapidly under DPS’s first emergency financial manager, 10 and
charter operators began to expand offerings to attract DPS students, advertising heavily in areas
where district schools had closed. Between 2010 and 2013, 32 new charter schools opened,
representing a 42 percent increase in just three years and bringing the total number of charter
schools to 109. Nearly half (47) of Detroit’s charter schools are now located in former DPS
buildings, all of which were sold or leased between 2000 and 2015. With more than 51,000
students, charter school enrollment in Detroit is about the same as the district’s current 54,000
student enrollment.
DPS Authorization of Charter Schools
As the oldest authorizer in Michigan, DPS chartered its first schools in 1995 and currently
authorizes 13 academies on 18 sites, educating about 4,200 students. The district monitors these
schools to ensure they are financially sound, meet their academic goals, and follow state and
federal requirements.
Schools of Choice
Michigan was also at the forefront of school choice efforts during this period, passing
legislation that allowed students to attend school districts outside of the one in which they resided.
These ‘receiving schools’ garnered the originating district’s per-pupil funding. In 2011 alone (the
second year of emergency financial management), DPS lost 7,856 students or about 10 percent of
its total enrollment to other school districts. By 2015, more than 25,000 students attended public
and charter schools in locations outside of Detroit.
Implications for Students Receiving Special Education
Students with disabilities were significantly less likely than their typically developing peers
to take advantage of school choice options and were more likely to attend Detroit’s traditional
8 A School District in Crisis, Ibid. 9 Unless otherwise stated, the information in this section is based on A School District in Crisis, Detroit’s Public
Schools. Ibid. 10 The Robert Bobb Legacy: Detroit schools still struggling as emergency manager exits. Retrieved from
http://www.mlive.com/news/detroit/index.ssf/2011/05/robert_bobbs_legacy_detroit_sc.html.

Improving Special Education Services in the Detroit Community School District
Council of the Great City Schools Page 8
public schools. In 2015, 18 percent of DPS students had an individualized education program
(IEP), compared to 10 percent of charter school students. This disparity has been explained as a
function of Detroit’s charter schools not having the special education supports in place to serve
these students.11
Charter Coordination in Detroit
As measured by percentage of total enrollment, Detroit has the third-largest charter sector
in the country after New Orleans and Washington, D.C.12 However, the number of charters and
the diversity of authorizers has not resulted in a coherent educational system for the city, according
to some. “Contributing to Detroit’s problems is a tangled web of a dozen authorizers that determine
where charter schools can open or close. Many of those authorizers are public universities and
community colleges that often don’t work together to plan comprehensively, which can create
chaotic situations in some neighborhoods.”13 Adding to this fragmentation is the frequent opening
and closing of schools. Reportedly, 80 percent of DPS’s public and charter schools have opened
or closed between 2010 and 2016.
Personnel Shortages
Because of DPS’s severe financial circumstances and to avoid personnel layoffs proposed
by the emergency financial manager in 2010, the Detroit Federation of Teachers (DFT) agreed that
teachers would loan some $9,000 each to the district, which would be repaid at the time they left
the district. Two years later, teachers received a 10 percent wage cut and were required to begin
paying for 20 percent of their health care benefits. Retirements, job uncertainties, budget cuts,
stagnant and noncompetitive wages, and personnel layoffs fueled significant teacher shortages,
leaving some schools understaffed.
Detroit Public Schools Community District
In July 2016, the state terminated the district’s emergency financial management and the
Education Achievement Authority and created the Detroit Public Schools Community District
(DPSCD) that would be governed by an elected school board working with the state-appointed
Detroit Financial Review Commission. DPSCD avoided insolvency with a $617 million legislative
package that resolved the district's debt. The legacy district—DPS—remained as a revenue-
collection entity to pay down the system’s $515 million in operating debt and DPSCD was
instituted to operate the district and serve the city’s children. The new DPSCD board of education
was off to a fresh start and hired district superintendent Nikolai Vitti in May 2017, who had a
strong track record of improving student outcomes in the Duval County (FL) school system. Still,
the new superintendent had to inform the school board in December 2017 that the district would
not receive $6.5 million in state funds to reduce old debt, because district officials had failed to
submit required paperwork by an August 15th deadline.
11 Fixing Detroit’s Broken School System. Education Next. Robin J. Lake, Ashley Jochim and Michael DeArmond.
Winter 2015, retrieved from http://educationnext.org/fixing-detroits-broken-school-system/. 12Drawing Detroit, Michigan’s charter schools concentrated in Detroit, July 13, 2015, retrieved from
http://www.drawingdetroit.com/michigans-charter-schools-concentrated-in-detroit/ 13 Inside Detroit’s Radical Experiment to Save Its Public Schools. Josh Sanburn. September 6, 2016. retrieved from
http://time.com/4390000/detroit-public-schools-charters-debt/.

Improving Special Education Services in the Detroit Community School District
Council of the Great City Schools Page 9
Personnel shortages, as well, continued to plague the new DPSCD, especially as the new
system acquired the 12 EAA schools. Only about 50 percent of the EAA teachers reapplied for
positions with DPSCD, as many of them had received higher salaries than DPS offered. In August
2017, 340 teacher vacancies existed, compared to 200 in August 2016. Of these 340 vacant
positions, 85 were in former EAA schools.14 Furthermore, 97 of the vacancies were among special
education teachers. In July 2017, the district and DFT agreed to a seven percent salary increase
over two years. However, health insurance options continued to have high deductibles and there
was a longer length of time necessary to reach the top of the salary schedule. Still, teachers received
a $1,750 bonus at the beginning of 2017-18 school year to help stabilize the system.
Hope for the Future
Despite the many challenges facing the district, there are now many signs of promise for a
brighter future.
• The Council team was impressed by the many focus group participants who spoke about
opportunities they have to work and receive higher salaries in neighboring school districts,
but who have chosen to remain with DPSCD because of their loyalty to their students and the
community. We salute these individuals for their commitment and perseverance.
• The new superintendent has a strong appreciation of the challenges facing students with
disabilities and he recognizes that he is their first and foremost advocate. Parents and
community advocates appreciated the August 2017 town hall meeting, which focused on
special education and included the superintendent and his wife, Rachel Vitti.
• The deputy superintendent of schools has an understanding of instruction and the academic
implications of special education.
• The executive director of curriculum and instruction has a strong vision of multi-tiered
systems of supports and the alignment of core curriculum to high standards.
• Parents remarked that principals and the new special education senior executive director have
been more responsive than personnel in the past.
• The special education senior executive director has a strong vision of special education, the
need for inclusivity, and the need for a paradigm shift to support instruction and supports for
students.
• The involvement of Dr. Eleanor Harris, former state official and Education Achievement
Authority special education director, is an invaluable resource to the district as a consultant
to the senior executive director.
• There is strong parental and community commitment to being valuable partners in the change
process.
14 Teacher shortage looms over Detroit. Jennifer Chambers and Mark Hicks. Detroit News. August 21, 2017.
Retrieved from http://www.detroitnews.com/story/news/local/detroit-city/2017/08/21/detroit-schools-faces-teacher-
shortage/104838298/.

Improving Special Education Services in the Detroit Community School District
Council of the Great City Schools Page 10
CHAPTER 3. EXECUTIVE SUMMARY
The Detroit Public Schools Community District asked the Council of the Great City
Schools to review the district’s special education programs and to make recommendations on how
to improve services for students with disabilities. To conduct its work, the Council assembled a
team of special education experts with strong reputations for improving services in their own
districts. The Council team visited Detroit in January, conducted numerous interviews, reviewed
documents, and analyzed data. At the end of the visit, the team formulated and presented
preliminary observations and recommendations.
The Council has reviewed numerous special education programs in big city schools across
the country, and the organization is not always able to point out positive features of each school
district’s work with students with disabilities. In this case, however, the DPSCD has several things
it can be proud of and assets it can use to build more effective services for students with disabilities
going forward. For instance, the district has a strong new superintendent who is determined to
improve the school system after years of state control.
In addition, the district completes some 99.8 percent of its initial evaluations on time and
most IEPs are completed in a timely fashion. There are problems implementing the IEPs, but the
district can complete them on time. Also, the district’s resource coordinating teams (RCTs) are a
good model and are used for collaborative problem solving. They are unevenly used from school-
to-school, but the model is an excellent one if it can be used more universally.
Moreover, the district has a relatively high special education identification rate, but there
were no substantial areas of disproportionality by race alone. There were circumstances, however,
where one race or another had higher identification rates depending on disability area. For instance,
African American students appeared to be at higher risk of being identified for a cognitive
impairment and white students appeared at higher risk of being identified for an emotional
impairment. In addition, there did not appear to be substantial disproportionality in the suspension
of students with disabilities, although it was not always clear that suspension data were accurate.
Even though students systemwide have very low scores on the National Assessment of
Educational Progress (NAEP), there was some evidence that students with disabilities in Detroit
had made progress over the last several years. In addition, there was solid evidence that the dropout
rate among students with disabilities had declined appreciably, 14.9 percent to 7.7 percent.
The district also has more time for professional development than the Council’s team
sometimes sees in other urban school systems it reviews. The time is often judged as inadequate
by staff given the level of need in the district, but the system has more such time than most. There
is also evidence of the use of RTI and PBIS programs in the district, although they are very
unevenly implemented. Moreover, the district claims some $6.0 in Medicaid reimbursements,
although the amount could be higher if its claiming system were automated. The system is also
working on a stronger accountability system. And the school district has strong and committed
parents who want to see the system get better and are willing to do everything they can for its
students with disabilities.

Improving Special Education Services in the Detroit Community School District
Council of the Great City Schools Page 11
At the same time, the district has substantial problems. It does have a higher rate of students
identified for special education services, but it appears that part of this problem is attributable to
the differing rates at which charter schools serve students with disabilities depending on the
severity of the need. There are also substantial data problems that the Council team encountered.
These were particularly prominent in assessing progress among early childhood pupils and
gauging the prevalence of out-of-school suspensions.
The instructional system also reflected challenges. Overall, the Tier I instructional system
was weak. The new superintendent has placed new emphasis on strengthening it, but there is still
considerable work to do. Moreover, the school district’s interventions were poorly defined, were
not regularly used, and training on them was uneven. There was no written MTSS framework and
no general use of UDL principles to guide the instructional work. In addition, there was no
systemic use of co-teaching as an instructional approach with students with disabilities. And once
English learners were placed in special education, their language acquisition needs were largely
unaddressed. The combination of these factors alone are more than enough to explain the low
proficiency rates among students with disabilities in the district.
Information gathered by the Council team also pointed to the fact that students with
disabilities were educated outside of the general education setting at much higher rates than was
the case in Wayne RESA, the state, or the nation. Students with disabilities were more segregated
from their non-disabled peers than is typically the case. Furthermore, uneven distribution of
programs for these students from school-to-school disproportionately impacts schools with high
disability rates.
The district was also having problems with staff shortages, partly due to untimely hiring
practices, and numerous vacancies that had to be filled sometimes at the last minute with staff who
were not fully qualified. Professional development was not well-defined around special education
issues for either general education teachers or others. And the organizational structure of the
special education unit and some lingering problems with staff relations added to the challenges
that the district was facing. Finally, the district has several compliance issues that it will need to
attend to.
The Council has put forward numerous recommendations to begin addressing the issues
the district faces in serving students with disabilities. The district does not have to address all of
them in the way presented in this report, but the team is most eager to point DCPSD officials to
other big city school systems who have successfully addressed some of the same issues. The
Council knows that the area of special education is only one of several challenges that the school
district is facing. It has been a considerable length of time since the district has turned its attention
to solving programmatic problems as it was sorting out its financial ones. The public should know
that it is going to take the district’s leadership some time to handle all the unmet needs that the
city’s children have. But the Council of the Great City Schools stands ready to help the district and
its leadership in any way the district thinks constructive.

Improving Special Education Services in the Detroit Community School District
Council of the Great City Schools Page 12
CHAPTER 4. FINDINGS AND RECOMMENDATIONS
This chapter presents the Council team’s findings in four areas described in Chapter 1:
multi-tiered systems of support, demographics and identification, academic achievement among
students with disabilities, and teaching and learning. Each section includes a summary of the
team’s findings and concludes with overall strengths, opportunities for improvement, and
recommendations.
I. Multi-Tiered Systems of Support
A multi-tiered system of supports (MTSS) involves the systematic use of multi-source
assessment data to efficiently allocate resources and improve learning for all students through a
series of integrated academic and behavioral supports.15As described in the Council of the Great
City Schools’ report, Common Core State Standards and Diverse Urban Students,16 MTSS is
designed to improve educational outcomes for all students. It focuses on prevention and early
identification of students who might benefit from instructional or behavioral interventions. The
framework is a merger of response to intervention (RTI), which typically focuses on academic
achievement, and systems to improve positive student behavior. When the term MTSS is used in
this report, it includes RTI, Positive Behavior Intervention and Supports (PBIS), or other systems
for supporting positive student behavior. It also applies to gifted students.
As described in the CGCS report, the essential components of an MTSS framework
include:
• Well-defined district- and school-based leadership and organizational structure;
• District policies and practices that align with and support a multi-tiered system;
• Technology sufficient to support instructional decision making and implementation of
instruction (e.g., Universal Design for Learning or UDL);
• Robust and valid core or Tier I instruction delivered to all students;
• Assessment of expected rates of progress;
• The use of three tiers of increasingly intensive (time and focus of instruction) instructional
supports and strategies;
• Professional development to ensure fidelity of implementation of MTSS methodology and
the Common Core State Standards;
• An evaluation process that monitors both implementation and outcomes; and
• The engagement of parents and caregivers.
In a functioning MTSS framework, schools have systems in place to identify the needs of
all students and monitor and evaluate progress throughout the school year, using multiple data
15 Florida’s Multi-tiered System of Supports, retrieved from http://florida-rti.org/floridaMTSS/mtf.htm. 16Retrieved from https://www.cgcs.org/cms/lib/DC00001581/Centricity/Domain/87/77--
Achievement%20Task%20Force--RTI%20White%20Paper-Final.pdf.

Improving Special Education Services in the Detroit Community School District
Council of the Great City Schools Page 13
measures (e.g., district assessments, attendance, suspensions, grades, numbers of office referrals,
etc.). Data are analyzed, and differentiated instruction and intervention are delivered based on
results. Teachers and leaders regularly review and monitor student progress to determine trends
and identify instructional adjustments needed for remediation, intervention, and acceleration.
When a student fails to make adequate progress when robust core or Tier I instruction has
been delivered, then instructional interventions are put into place and their effects are tracked.
Without this monitoring system in place, it is unlikely that schools will have the documentation
needed to determine whether underachievement is due to ineffective core instruction and
interventions or something else that might trigger a special education referral. Nevertheless, when
teachers and parents observe students who are struggling to learn and behave appropriately, there
is a predictable desire to seek legally protected special education services.
To make this system work, it is imperative that districts and schools have processes in place
to help educators determine why a student is not performing or when they might need acceleration.
When implemented as intended, an MTSS framework focuses on rigorous core instruction and
provides strategic and targeted interventions without regard to disability status. In addition, MTSS
can lead to better student engagement and lowered disciplinary referrals—and fewer students
requiring special education services. It can also help reduce disproportionate placements of
students from various racial/ethnic groups and those with developing levels of English proficiency
who might otherwise fall into the ranks of those needing special education services.
In fact, MTSS is recognized in the Every Student Succeeds Act (ESSA)17 as an appropriate
framework for supporting student achievement and positive behavior, and it is a permissible use
of federal Title I funds. The Act defines MTSS as “a comprehensive continuum of evidence-based,
systemic practices to support a rapid response to students’ needs, with regular observation to
facilitate data-based instructional decision-making.”
The subsections below describe the Michigan Department of Education’s (MDE) and
Wayne Regional Education Service Agency’s (RESA) support for and guidance on MTSS. They
also address the extent to which DPSCD has implemented this framework to support student
achievement/positive student behaviors and guide strategies, including referrals for special
education, when student progress is not evident.
Michigan Guidance for MTSS
According to MDE, schools that have implemented tiered models of instruction have
higher proficiency rates than those that do not. In addition, schools that have implemented tiered
intervention with fidelity have a higher percentage of students who are academically proficient
than schools that do not implement it well. In fact, the performance gap widened over the three-
year period encompassing MDE’s analysis of schools implementing MTSS with and without
fidelity.18
17 The Elementary and Secondary Education Act was reauthorized in 2015 as the Every Student Succeeds Act
(ESSA). 18 Fidelity, based on the Planning and Evaluation Tool for Effective Schoolwide Reading Programs-revised (PET-
R). The PET-R is used by a school's leadership team to rate their school's current reading program implementation
and to identify reading goals and priorities. This self-assessment tool addresses seven elements of an effective

Improving Special Education Services in the Detroit Community School District
Council of the Great City Schools Page 14
MTSS is the cornerstone of MDE’s ‘Top 10 in 10 Strategic Plan,’ and its special education
State Systemic Improvement Plan. This work builds on MDE’s earlier backing for response to
intervention (RtI), positive behavior supports (PBIS), and Michigan’s Integrated Behavior and
Learning Support Initiative.
Top 10 in 10 Strategic Plan
MDE’s Top 10 in 10 Strategic Plan19 (top 10 state in education in 10 years) uses MTSS as
its driver for better student outcomes. Accordingly, MDE has aligned all state and federal plans to
lift student achievement. In interviews with the Council team, the department indicated that it
selected MTSS to frame MDE activities because it sees the positive effects of the approach and
because the field is using many versions of the practice. Furthermore, MDE believes that utilizing
the MTSS framework will support effective implementation of the Top 10 in 10 Strategic Plan,
particularly those components contained in the Learner Centered Supports Focus Area. MDE has
pursued stakeholder feedback and tested usability during the 2017-18 school year in collaboration
with school districts in the state’s Transformation Zone, which does not include DPSCD. The state
reports promising results.
State (Special Education) Systemic Improvement Plan (SSIP)
As part of its results-driven accountability system for special education, the U.S.
Department of Education requires that each state develop and implement by 2018-19 a State
Systemic Improvement Plan (SSIP) to improve educational outcomes for students with disabilities.
MDE has embedded MTSS into its SSIP process, viewing this strategy as an opportunity for the
state to reorient its work around supporting local capacity to improve outcomes for all students.
Although SSIP is a special education requirement, MDE is embedding it into its Top 10 in 10
Focus Area Framework. This enables MDE to use the SSIP framework to articulate a
comprehensive, six-year plan for coordinating resources and aligning initiatives across the
department to focus improvement at all levels of the system.20
Michigan’s Integrated Behavior and Learning Support Initiative
The state is also building on the Michigan Integrated Behavior and Learning Support
Initiative (MIBLSI) that was funded by an IDEA grant to MDE.21 MIBLSI was designed to help
intermediate and local school districts implement and sustain MTSS to improve student outcomes
in behavior and learning. The MIBLSI webpage offers a plethora of high quality information and
training resources on:
• MTSS practices and related supports for reading and behavior at the three tiers of support.
• Data-based decision making using data collected at the district, school, and student levels,
school-wide reading program, including: Goals and Objectives, Assessment, Instructional Practices, Instructional
Time, Differentiated Instruction, Administration, and Professional Development. Retrieved from apr-2013b-mi-
indicator17-compiled-with-appendices-biblio-bkmrks-phasei.pdf and from
https://dibels.uoregon.edu/docs/pet_r_form_user.pdf. 19 Retrieved from http://www.michigan.gov/mde/0,4615,7-140-28753_65803-322534--,00.html. 20 Retrieved from apr-2013b-mi-indicator17-compiled-with-appendices-biblio-bkmrks-phasei.pdf. 21 Retrieved from https://miblsi.org/.
Improving Special Education Services in the Detroit Community School District
Council of the Great City Schools Page 15
including a MIBLSI data base with dashboards and reports.
• Student assessments to determine which students need additional supports and when
schoolwide supports need to be adjusted, including universal screening, progress monitoring,
diagnostic and summative assessments, and early warning indicators. Also, included are:
- A student risk screening scale;
- A school climate survey, and a schoolwide information system for screening and
monitoring student behavior;
- Fidelity assessments for MTSS practices related to behavior and reading;
- Capacity assessments to determine if the district can effectively support schools.
- Reach assessments to identify implementation stages on--
▪ How many schools are implementing MTSS to support students.
▪ How far along schools are in providing supports to students.
- Data analyses to help school teams problem solve by understanding what the data mean and
how to use it to positively impact students.
• Teams and roles for cross-functional teams.
Twenty-two DPS schools engaged with the MIBLSI initiative during the 2012-13 school
year. Various focus group participants reported that their schools continued to be engaged with
MIPLSI practices, including using universal screening and progress monitoring tools.
Response to Intervention and Positive Behavior Intervention and Supports (PBIS)
The state’s approach to MTSS is likely to continue building on its prior guidance and
resources for response to intervention (RtI) and positive behavior intervention and supports
(PBIS). In September 8, 2011, MDE provided RtI guidance materials to local and intermediate
school district (ISD) superintendents and principals.22 The documents provided a description of
essential components of Michigan’s RtI framework and indicated that additional guidance
materials and resource-based links would be forthcoming. The agency’s support for PBIS appears
to be considerably more developed now as evidenced by its webpage and related links.23 There,
multiple topics are addressed, including an overview of PBIS, implementation activities, research,
and resources.
Wayne RESA Guidance
Wayne RESA also has a webpage devoted to MTSS/RtI and to PBIS.24 The MTSS Quick
Guide provides worthwhile information on district, building, and classroom practices; working
with data; and coordinating and planning activities. It also contains field guides on Tier II and III
literacy interventions, as well as guidance on mathematics. 25 The PBIS webpage describes
22 Retrieved from https://www.michigan.gov/documents/mde/Response_to_Intervention_362712_7.pdf. 23 Retrieved from http://www.michigan.gov/mde/0,4615,7-140-74638_72831_72833-361319--,00.html#one. 24 MTSS/RtI retrieved from http://www.resa.net/specialeducation/rti/, and PBIS is retrieved from
http://www.resa.net/curriculum/schoolwide-positive-behavioral-interventions-supports/. 25 Retrieved from http://www.resa.net/curriculum/curriculum/math/mtss-mathematics/.
Improving Special Education Services in the Detroit Community School District
Council of the Great City Schools Page 16
administrative supports at the building and district levels, and information on engaging parents. It
also includes training opportunities on interventions at each tier and alternatives to suspension,
along with Wayne RESA resources, videos, links, PBIS presentations, and forums for 2017-18.
Detroit Public Schools26 Prior Guidance and Practices
The Detroit Public Schools (DPS) initiated multi-tiered interventions of support for
academics and behavior in 2009 with its excellent RtI Handbook and RtI Toolkit. 27 While the
district provided to the Council team an electronic copy of the RtI Handbook, we found the RtI
Tool Kit through a general Google search. However, it does not appear that practices reflected in
these two documents have been widespread throughout the district, according to those interviewed
by the team. Both tools are worth re-examining.
RtI Handbook
The RtI Handbook, which was developed by DPS’s school psychologists, describes the
problem-solving model for reviewing and analyzing student data. It also looks at the provision of
interventions at each of three tiered levels. Moreover, the document proposed a plan for DPS’s
implementation of RtI with parameters at each of the intervention levels. Also included were:
• Student case studies; and
• Sample forms and parent information letters, including a sample Tier II intervention
monitoring log; CBM/progress monitoring data recording sheets; a psychological report
template using RtI data to determine specific learning disabilities; a classroom observation
form; qualitative and quantifiable data; and information on English language learners.
Resource Coordinating Team
The RtI Handbook also described a resource coordinating team (RCT) model, a researched-
based student support program developed by the University of California at Los Angeles (UCLA)
School Mental Health Project. As a problem-solving team, an RCT is meant to coordinate services
in order to remove learning and achievement barriers at the school, classroom, and student levels.
When implemented as intended, the RCT operates and functions easily within an RtI framework.
According to information DPSCD provided to the Council team, the RCTs, which are still
used in the district:
• Coordinate, and integrate services and programs that address underlying problems and
barriers to learning, and facilitate understanding, prevention, and correction;
• Assist in structuring individual and school-based intervention plans that respond to student,
26 The district’s name as the “Detroit Public Schools” refers to DPS prior to the 2017-18 school year when it was
reconstituted as DPSCD. 27 The RtI Handbook was retrieved from
http://detroitk12.org/admin/academic_affairs/special_education/clinical_prevention_intervention_services/docs/RtI
Handbook.pdf; and the RtI Toolkit was retrieved from
http://detroitk12.org/admin/academic_affairs/special_education/clinical_prevention_intervention_services/docs/Inter
ventionToolkit.pdf.

Improving Special Education Services in the Detroit Community School District
Council of the Great City Schools Page 17
staff and family needs; and
• Advocate for proactive involvement and timely responses to staff, students, parents/families,
community, and others
Individuals in the school community (i.e., teachers, administrators, parents, and students)
may refer students to the RCT by completing an RCT referral form or parents may contact a school
administrator to request an RCT meeting. Members of the RCT may include principals/designees,
classroom teachers, and support personnel (psychologists, social workers, speech/ language
impaired teachers, nurses, guidance counselor, attendance agent, etc.).
The RCT process is based on three levels of problem solving that align with the three tiers
of increasingly intensive interventions described in the MTSS literature. During the most intensive
level of interventions (i.e., Tier III), if it is determined that students are not progressing, and
additional resources and services are needed, the RCT may consider referring the student for an
evaluation under either Section 504 or special education.
RtI Tool Kit
In addition to the RtI Handbook, DPSCD’s psychological services published an
Intervention Tool Kit for School Psychologists (Working Within the RtI Framework). Its goals
were to provide school psychologists with a list of interventions to assist them in the appropriate
selection, implementation, and monitoring of intervention services for students who need them.
The document is intended as a guide for translating the RtI model into a workable framework for
DPSCD use.
The RtI Tool Kit provides a sample of research-based and teacher-applied techniques to
increase student achievement and enhance positive behaviors. In addition, it describes how to
collect, analyze, and interpret data on making special education eligibility recommendations within
the RtI model. Interventions are provided to address:
• Fluency (letter naming, word study, oral reading);
• Vocabulary and reading comprehension;
• Math computation and concepts;
• Spelling and written expression;
• Behavior;
• Autism spectrum disorder (ASD); and
• Attention deficit/hyperactivity disorder (ADHD).
The RtI Tool Kit provides samples of the following: (a) psychological reports for intensive
interventions and special education eligibility using RtI; (b) DIBELs oral-reading fluency
materials; (c) a problem-identification interview form; (c) a procedure for self-monitoring
behavioral interventions; (d) discrete trials with beginning, middle, and end; (e) question and
response chart on the function of objects for ASD diagnosis; (f) social stories/pictures for social
skills instruction for ASD; (g) guidance on transforming negative to positive statements to help

Improving Special Education Services in the Detroit Community School District
Council of the Great City Schools Page 18
increase positive interactions; (h) a weekly organizational chart of interventions for students with
ADHD; and (i) an intervention for teaching desired behaviors to students with ADHD.
The Tool Kit is a good foundation for school psychologists, but it would benefit from
additional information on specific elementary, middle, and high school grade levels. It also
provides a good foundation for school staff members other than school psychologists.
Focus Group Feedback
Focus group participants provided the following feedback on their use of a multi-tiered
system of supports in the district.
• Leadership. The senior executive director for curriculum and instruction is knowledgeable
and experienced in implementing MTSS and understands what needs to be done to develop a
framework for the 2018-19 school year, according to interviewees.
• Familiarity with Tiered Supports/Instruction. While many focus group participants were not
familiar with the term “MTSS,” they were more familiar with the terms RtI, PBIS, and
MIBLSI. Generally, it appears that some schools have received professional development
and support from Wayne RESA on PBIS or MIBLSI. However, the district lacked an
operational and comprehensive MTSS framework.
• Improving Core Curriculum Instruction. There is a new emphasis in the district on
supporting teachers in improving the quality of “first teaching” (i.e., Tier I). Master
scheduling guidelines for teachers is now in development, and principals are engaging in
“data chats.” Still, there are no plans to embed universal design for learning (UDL) practices
in the curriculum framework or its implementation.28
• Master Teacher Initiative. Intensive training will be provided to 52 teachers (26 math and 26
ELA) to support school-based instruction. Although student behavior is frequently cited as
interfering with instruction, there was not systemwide professional development on this issue
that interviewees knew about. With only three behavioral interventionists in the district, it is
necessary for many more individuals to develop their own expertise to support positive
student behaviors and social/emotional development. The team noted that the district’s
master teacher initiative had not been designed to include special educators, bilingual
teachers, or teachers of gifted students.
• IReady/MiBLSi. IReady, an adaptive reading and math diagnostic data tool with reports and
instructional supports, is in place for grades kindergarten through three and will expand next
year to grade eight. MIBLSI’s data collection and reporting system also continues to be used
by some schools. Overall, data are inconsistently used by school personnel to drive
discussions about instruction.
• Intervention. Few interviewees described the use of specific interventions even though the
28 UDL is defined as “a scientifically valid framework for guiding educational practice that (a) provides flexibility in
the ways information is presented, in the ways students respond or demonstrate knowledge and skills, and in the
ways students are engaged; and (b) reduces barriers in instruction, provides appropriate accommodations, supports,
and challenges, and maintains high achievement expectations for all students, including students with disabilities
and students who are limited English proficient.” by Higher Education Opportunity Act (PL 110-135). See the
National Center on Universal Design for Learning at http://www.udlcenter.org/.

Improving Special Education Services in the Detroit Community School District
Council of the Great City Schools Page 19
team was told that elementary-level students who have not reached reading proficiency have
a reading plan. Other than Voyager, which is used for students in some special education
programs, participants did not mention any other intervention universally in place across the
district.
• Wayne RESA Support. The number of schools working with Wayne RESA grew from 9 to
42 between 2011-12 and 2016-17. This school year, the PBIS initiative associated with
Wayne RESA and MIBLSI is no longer under the special education department but is
supported by the department’s four behavioral specialists. The Culture and Climate unit,
which now houses the PBIS initiative, does not employ behavioral specialists or other
coaches and there is concern about access to personnel with sufficient expertise to continue
supporting schools. In the past behavioral specialists were available to coach teachers,
support data analysis, and facilitate school reviews of PBIS practices using a School-Wide
Evaluation Tool (SET). This school year, interviewees reported that communications
between Wayne RESA and schools engaged in PBIS had diminished.
• Use of RCT Process. There is no written requirement in the district that each school have an
RCT with practices consistent with the RtI Handbook. Although the process is available to
initiate a Section 504 or special education evaluation, every school does not consistently use
RCTs for problem-solving or for following up on a student’s low achievement or challenging
behaviors. Interviewees reported that the RCT process is more successful when the school
principal actively participates and sets expectations for school personnel. When principals are
uninvolved, the process is not likely to be effective. Because of personnel vacancies and
other reasons, some schools reported having as many as 25 students waiting for RCT review.
• English Learners. There was a desire among interviewees to have more information on and
resources to better support English learners through an MTSS framework.
• Age Six School Enrollment. Michigan students are not required by law to enroll in school
for the first time until they are six years of age. There were concerns by focus-group
participants that skill deficits related to late enrollment may be leading to special education
referrals without interventions that might otherwise address their achievement gaps.
Blueprint 2020
Blueprint 2020 is DPSCD’s new strategic plan for rebuilding Detroit’s public schools and
fulfilling the district’s mission to educate and empower every student, in every community, every
day, to build a stronger Detroit.29 The district’s vision is for all students to have the knowledge,
skills, and confidence necessary to thrive in the city, nation, and world. A “students first” focus in
the blueprint is designed to drive decisions that are in students’ best interests, and to use resources
strategically to meet individual student needs.
The strategic plan’s priorities and commitments are described below. Blueprint 2020 is an
excellent plan, but it does not mention the development and use of an MTSS framework as a
29 Retrieved from
http://detroit.k12.mi.us/admin/communications/strategic_plan/docs/Blueprint_2020_Strategies_Only.pdf

Improving Special Education Services in the Detroit Community School District
Council of the Great City Schools Page 20
component of its approach. However, as noted in the italicized text below, the framework is
sufficiently inclusive to be incorporated into the plan’s components.30
• Outstanding Achievement. Dramatically improve the academic experience of all students to
ensure they are college and career ready by –
- Adopting and implementing a highly aligned, consistent instructional curriculum reflecting
demands of Michigan’s core content standards PreK through 12, as well as the
pedagogical shifts in instruction required to support students in meeting these high
standards.
- Ensuring every student has access to a rigorous course progression that aligns with their
college, career and life goals while being culturally relevant.
- Updating data and assessment systems to ensure all stakeholders have an accurate picture
of each student’s progress toward grade level expectations and on time graduation.
- Revamping special education services to meet the individual needs of each student.
- Providing intensive support to improve the achievement of our students attending
Partnership Schools.
• Transformative Culture. Transform the culture so students, families, community members,
and staff feel safe, respected and connected by –
- Gathering, sharing and acting on feedback from students, staff, and families on the culture
of schools and district.
- Establishing and consistently implementing a code of conduct that encourages positive
behavior, maximizes instructional time for all students, and allows for restorative justice.
- Cultivating a school-going culture that dramatically reduces chronic absenteeism.
- Developing and providing, in partnership with community allies, comprehensive supports
and resources that empower students’ families.
- Building and implementing shared decision-making structures to ensure work of schools
and district meets needs of constituents.
- Implementing consistent communication channels to keep all stakeholders informed about
district operations, strategic direction, programs and opportunities, and progress.
• Whole Child Commitment. Champion a whole child approach that unlocks students’ full
potential by –
- Based on students’ individual needs, facilitating and aligning appropriate academic,
cultural, and leadership experiences, as well as social-emotional and health services, to
promote holistic well-being and development of students.
- Ensuring all students have access to robust programming in non-core subject areas,
including visual arts, music, dance, theater, physical education, world language,
technology and health, as well as service-based learning opportunities.
30 As noted earlier in this report, MTSS is a component of MDE’s strategic plan to become a “Top 10 state in
education in 10 years.”

Improving Special Education Services in the Detroit Community School District
Council of the Great City Schools Page 21
- Expanding access to and participation in high-quality activities outside of the school day,
including before and after school programs and summer experiences.
- Supporting students’ health, development, and learning by providing high-quality,
nutritious meals at schools.
• Talent. Build an excellent team of dedicated staff to serve DPSCD students by –
- Overhauling human capital policies/practices to make recruitment, hiring and onboarding
more efficient and effective.
- Pursuing innovative partnerships/programs that strengthen talent pipelines into open
school/district positions.
- Ensuring all staff have the professional development they need to support students and
maximize the efficiency and effectiveness of the district.
- Developing/implementing educator and staff evaluation, and succession planning systems
that support individual growth, allow top employees to pursue advancement within the
organization, and improve candidate pools for leadership vacancies.
• Responsible Stewardship. Manage/deploy resources responsibly, transparently, and equitably
to support student success by –
- Overhauling district/school budgeting processes to ensure a balanced budget that is aligned
to district strategic priorities.
- Developing/implementing a facilities management and technology infrastructure plan that
accounts for current/future needs and identifies funding strategies to support maintenance
and improvement.
- Establishing and consistently implementing a clear set of standard operating procedures
and routines across schools and district departments that exemplify our values, maximize
resources and efficiency.
- Aligning district, community, philanthropic and city partnerships to ensure coherent
programming and smart development.
- Ensuring systematic research/evaluation plans for all major initiatives so investments can
be made based on program effectiveness.
AREAS OF STRENGTH
The following are areas of strength related to the district’s support for teaching and learning
for students with disabilities and others.
• Leadership. The senior executive director for curriculum and instruction has knowledge of
and experience in implementing MTSS and understands what needs to be done to develop a
framework for the 2018-19 school year.
• Resource Foundation. Wayne RESA’s webpage includes field guides and training that
support MTSS framework, and the district’s RtI Handbook and Toolkit and its Psychological
Services webpage can be useful to DPSCD as it develops local procedures and training
activities.
Improving Special Education Services in the Detroit Community School District
Council of the Great City Schools Page 22
• RCT Model. DPSCD has a resource coordinating-team (RCI) model for collaborative
problem-solving, which is in use – although inconsistently – across the district.
• First Teaching. There is a new emphasis in the district on supporting teachers to provide
high quality “first teaching” or Tier I instruction.
• Master Teacher Initiative. Intensive training will be provided to 52 teachers (26 in math and
26 in ELA) to support school-based instruction.
• MIBLSI, RtI, and PBIS. Various schools across the district are implemented elements of
MIBLSI, RtI, and PBIS, providing a good foundation for improved practices.
OPPORTUNITIES FOR IMPROVEMENT
The following areas provide opportunities to improve teaching and learning for students
with disabilities and others in DPSCD.
• MTSS Framework. DPSCD does not have a written MTSS framework in place for all
students, including English learners and/or students with IEPs, that would define processes
and expectations for school practices and training across the school system. Such a
framework would support underperforming students who do not enroll in school until the age
of six years. While Blueprint 2020 does not mention the development and use of an MTSS
framework as one of its components or priorities, the framework could include many of the
plan’s components.
• UDL. There are no plans in place to embed universal design for learning (UDL) principles
into the curriculum development and implementation process.31
• Master Teacher Initiative. The master teacher initiative does not include professional
development on supporting positive behavior of students. Also, the master teacher initiative
is not designed to include special educators, bilingual teachers, and teachers of gifted
students.
• Use of RCT Process. There is no written requirements or expectations that each school have
an RCT and actively use its processes for data review and problem-solving.
• IReady/MIBLSI. IReady and MIBLSI provide tools to support instruction and data-based
decision making for students, but they are not consistently used across the district. In
addition, use of the two systems makes it difficult to review trends across schools, grades,
and groups of students.
• Interventions. Increasingly intensive interventions are not consistently defined, available, or
supported by the district.
• PBIS Initiative. With no behavior specialists or coaches involved in an PBIS initiative, there
31 UDL is defined as “a scientifically valid framework for guiding educational practice that (a) provides flexibility in
the ways information is presented, in the ways students respond or demonstrate knowledge and skills, and in the
ways students are engaged; and (b) reduces barriers in instruction, provides appropriate accommodations, supports,
and challenges, and maintains high achievement expectations for all students, including students with disabilities
and students who are limited English proficient.” by Higher Education Opportunity Act (PL 110-135). See the
National Center on Universal Design for Learning at http://www.udlcenter.org/.

Improving Special Education Services in the Detroit Community School District
Council of the Great City Schools Page 23
were concerns about ongoing supports to schools and school-based monitoring with the
School-Wide Evaluation Tool (SET). There were also concerns about communications with
Wayne RESA.
RECOMMENDATIONS
1. Systemwide MTSS Framework, Implementation Plan, and Oversight. Embed MTSS into the
district’s Blueprint 2020, making explicit how the strategic plan’s provisions fit into the MTSS
framework and vice versa. Make clear that the framework includes all students, including
students with disabilities, English learners, and accelerated learners.
a. District, Network and School Leadership Teams. Establish leadership teams at the district,
cohort, and school levels to support MTSS planning and oversee implementation activities.
• District MTSS Leadership Team. Have the deputy superintendent and senior executive
director of C/I share responsibility for the development and implementation of MTSS
across the system, utilizing a team of stakeholders, e.g., cohort leaders, central office
personnel, principals, and school-based personnel. When completed, schedule a two-
day overview for staff and monthly meetings with the MTSS leadership team to ensure
use of a common language, effective implementation, and effective resource
allocations.
• Cohort MTSS Leadership Teams. Have each cohort establish an MTSS leadership
team with principals and a diverse group of school personnel who would be responsible
for implementation.
• School-Based Leadership Teams. Based on the district’s MTSS-implementation plan
(Recommendation1b below), establish school-based leadership teams (SBLT) at each
site to provide training and guidance on activities that could be incorporated into each
school’s academic achievement plan. The SBLT should lead each school’s MTSS work
to ensure a common understanding of the framework. The SBLTs should also have
defined responsibilities, such as learning/applying/modeling the problem-solving
process, providing professional development and technical assistance, monitoring
implementation and supports, and conducting school-based data days.
• Resource Coordinating Teams. Establish written parameters for RCTs, including
evidence-based guidelines and expectation that RCTs be implemented as designed at
every school. Send a common message that RCTs are designed for problem-solving
purposes, and they are not a pipeline for special education.
b. Implementation Plan. Develop a multi-year MTSS implementation plan that includes
regular updates for the board of education. Have the district’s leadership team evaluate its
current methodologies and tools as it develops the district’s MTSS framework and plan,
including universal screeners, formative assessments, standard protocols for
interventions/supports, curricular materials, supplemental and intensive resources, data
platforms, use of data, professional learning, budget allocations, etc. In addition, include
the following components–
• Framework Design. Review information from MIBLSI, Wayne RESA, and the DPI
RtI Handbook and Tool Kit, and supplement them based on current best practices,

Improving Special Education Services in the Detroit Community School District
Council of the Great City Schools Page 24
including information for elementary, middle, and high school grade levels.
• UDL. Embed universal design for learning (UDL) principles into the MTSS
framework, and incorporate items discussed below.
• Department Alignment. Require each department to realign staff and priorities to
support the MTSS plan’s implementation. Ensure department deliverables are
collaboratively developed and do not produce competing priorities across schools.
• Social Emotional Learning. Establish goals and expectations that schools would
provide social emotional learning (SEL) as part of its MTSS work, including the use of
a SEL curriculum, community wraparound services, etc.
• Progress Monitoring. Include benchmark and other regular districtwide and school-
based progress-monitoring tools in the evaluation of MTSS implementation. Consider
whether to continue using both IReady and MIBLSI or have one set of data systemwide.
• Early School Enrollment. Consider a citywide campaign designed to educate parents
about the value of enrolling their children in early childhood programs and in
kindergarten. Communicate resources to help parents access these programs.
• Master Teacher Program. Add components to the Master Teacher Program to support
positive student social/emotional wellbeing and behavior. Ensure that participants are
knowledgeable about teaching and learning with students with disabilities, students
who are twice exceptional, English learners and those with disabilities, and gifted
students.
• School Walk Throughs. Include in current walk-through protocols any elements of
MTSS that current tools do not contain. Follow-up walkthrough results to identify
trends, strengths, and action items. Walkthroughs should be non-evaluative, but results
should be aggregated in a way that would inform central office strategies.
• Exemplary Implementation Models. Provide a forum where schools can highlight and
share best practices, lessons learned, victories, and challenges in implementing MTSS
for all student groups. Identify and encourage staff to visit exemplary schools and set
aside time for that to happen.
• District Website. Develop a highly visible, well-informed, and interactive web page
highlighting the district’s MTSS framework. Include links to other local and national
sites. Highlight schools in the district that are showing results with the approach and
share stories and data on the impact of MTSS on student outcomes.
Communication. When finalized, prominently post the MTSS implementation plan on the
district’s website, along with relevant links to district information and publicly available
resources. Communicate widely with all internal and external stakeholders, including
parents who are English learners, and share the purposes and expected outcomes of the
plan.
c. Map Resources and Analyze/Address Gaps. As part of the MTSS planning process, assess
current human resources and instructional materials provided by the district and funded by
schools to ascertain their effectiveness and return-on-investment in terms of improved
student outcomes. Compare the value of resources and materials currently in use in the
district with other evidence-based resources in the marketplace and replace low-value
Improving Special Education Services in the Detroit Community School District
Council of the Great City Schools Page 25
resources currently being used. Establish a menu of increasingly intensive interventions
and resources, which should be vetted against current evidence on effectiveness and
alignment. Ensure that the menu of interventions differentiates levels of intensity, criteria
for use, and contains strategies that are linguistically and culturally appropriate for a
diverse student population. Consider how federal Title I resources could enhance,
supplement, or pay for more effective interventions. If necessary, phase in new
interventions over a reasonably few number of years.
d. Written Expectations. Establish a school board policy32 in support of the district’s MTSS
framework (for academics and social/emotional learning/restorative practices). Charge the
administration with developing and implementing an MTSS framework and roll-out plan.
Include expectations that the framework will be used, and that it include all grades and
students and supports linguistically appropriate and culturally competent instruction.
Modify the plan as the district gains experience with it. Use information and resources that
district personnel, Wayne RESA, and MIBLSI have developed to inform this work.
e. Differentiated Professional Learning. Based on the MTSS framework, district goals and
expectations, and implementation plan, develop and put into place a professional
development program to support it. Target it on critical audiences, e.g., general/special
educators, related-services personnel, paraprofessionals, and parents. Provide at least four
to five days of training each year, if possible, for school-based MTSS leadership teams
over the next two years. Base training on the Learning Forward Standards for Professional
Learning. 33 Consider how training will be funded, e.g., through stipends, funds for
substitute coverage, incentives for after-school and Saturday training, or summer training.
Also, consider how training will be differentiated and sustained. In addition –
• Access to Differentiated Learning. Ensure that professional learning is engaging and
differentiated based on individual skills, experience, and need. Have professional
learning and technical assistance continue for new personnel and those needing
additional support.
• Multiple Formats. Use multiple formats (e.g., videos, webinars, and narrative text) and
presentation approaches (e.g., school-based, small groups) to provide professional
development on MTSS.
• Coaching/Modeling. Develop a plan to provide coaching and technical assistance to
principals and school-based leadership teams on practices covered in training sessions
and materials.
• Cross-Functional Teams. Cross-train individuals from all departments working with
schools to ensure a common language and understanding of MTSS. This will help align
and support schools as they work on implementation. Provide direct support,
mentoring, coaching, and technical assistance to principals and teachers on
implementation.
• High-Quality Trainers. Identify staff members at all levels who are knowledgeable
about and experienced in the components of MTSS and deploy them as professional
32 For example, see the Providence of Education policy, retrieved from http://pesb.ppsd.org/Attachments/3ae90fc9-
1936-439a-ab7f-1ebf78a0c2e2.docx 33 Retrieved from http://www.learningforward.org/standards

Improving Special Education Services in the Detroit Community School District
Council of the Great City Schools Page 26
developers. As necessary, supplement these staff members with experts from outside
the school district.
f. Data Analysis and Reports. Review current data collection, analyses, and reports and
supplement them with indicators or metrics that would be useful in determining whether
schools use MTSS practices and their relationship to student achievement, e.g., growth
based on appropriate instruction and intensive interventions.
g. Monitoring and Accountability. Evaluate the implementation, effectiveness, and results of
MTSS, and include the following as part of the assessments–
• Baseline Data and Fidelity Assessments. Use the Self-Assessment of MTSS (SAM)34
or other protocols for schools to self-assess their MTSS practices. Have network and
districtwide leadership teams periodically review these self-assessments for validity.
Incorporate SAM results into the school review process to assess fidelity to the
framework.
• Data Checks. Using data and reports proposed in Recommendation 1f, have the
superintendent, deputy superintendent, and senior executive director for C/I host
regular data conversations with departments, network leaders, and principals to discuss
results, anomalies, needed supports, follow-up activities, and outcomes.
• Timely Communication and Feedback. Assign responsibility for communicating the
MTSS work to stakeholders through multiple channels, e.g., website, television, radio,
social media, etc. Design feedback loops involving central office, school personnel,
parents, and the community to assess problems and successes on the ground. Use this
feedback to provide regular and timely feedback to the district MTSS leadership team
on where and how schools require additional assistance.
34 Retrieved from
http://www.floridarti.usf.edu/resources/presentations/2016/nasp/eval/SAM%20Packet_October%202015.pdf

Improving Special Education Services in the Detroit Community School District
Council of the Great City Schools Page 27
II. Disability Prevalence Rates and 2016-17 Evaluation Outcomes
This section presents demographic data on DPSCD students with disabilities who have
individualized education programs (IEPs).35When available, DPSCD data are compared with
students at state and national levels and with other urban school districts across the country.
In addition, data are analyzed by grade, race/ethnicity, and English learner (Els) status, so
readers can fully understand the context in which DPSCD services are provided. This section also
provides information about special education evaluations and the timeliness of IEPs and
placements.
District Prevalence Rates
In this subsection, the percentages of DPSCD students receiving special education services
are compared to urban school districts across the country and to the nation. Also, incidence data
are disaggregated for early childhood and kindergarten children, and school-age students by
disability area, grade, race/ethnicity, and English learner status.36
Comparison of DPSCD, Urban Districts, National, and State Special Education Rates
DPSCD enrolls 8,731 students with IEPs who are three through 26 years of age, including
those in separate schools (in and outside the district). This number comprises 16.1 percent of all
students enrolled in the school district. This figure is higher than the average of 13.1 percent across
75 urban school districts on which we have data.37 Among these urban districts, DPSCD ranks 55th
in the percentage of students with IEPs, which ranged from 8 percent to 21 percent.38
The district’s 16.1 percent special education rate is also higher than the 13.0 percent state
rate and the 13.1 percent national figure, which has decreased since 2004-05 when it was 13.8
percent.39 (See exhibit 2a.)
As discussed below, DPSCD’s relatively high incidence rate is driven in part by the lower
number of students with IEPs attending Detroit’s charter schools. Furthermore, when excluding
students with IEPs from outside of Detroit attending DPSCD schools pursuant to school choice
requirements or the Wayne RESA plan, the percentage is 15.5 percent.
35 Students with disabilities who have IEPs and receive special education services are also referred to as students
with IEPs. These data are limited to students with a disability under the IDEA and does not include students with
Section 504 plans. 36 Unless otherwise stated, all DPSCD data were provided by the district to the Council team and are for the 2017-18
school year. 37 Most data were provided by school districts that responded to a survey conducted by the Urban Special Education
Leadership Collaborative; the Council team or a member of the team obtained the remaining data during district
reviews. The rates by district are provided in Appendix A. Incidence Rates and Staffing Survey Results. 38 The data cover several years, but in most cases, ratios do not change dramatically from year to year. 39 U.S. Department of Education, National Center for Education Statistics. (2015). Digest of Education Statistics.
The rates are based on 2011-12 data based on students 3 through 21 years of age.
http://nces.ed.gov/fastfacts/display.asp?id=64.

Improving Special Education Services in the Detroit Community School District
Council of the Great City Schools Page 28
Exhibit 2a. Special Education Percentages for the District, Surveyed Districts, Nation, and State
Rates by Disability Areas for District, State and Nation
Data in exhibit 2b show the percentage of students in the district, state, and nation by the
most common disability areas. These disability areas include the autism spectrum disorder (ASD),
cognitive impairment (CI), emotional impairment (EI), other health impairment (OHI), specific
learning disability (SLD), speech/language impairment (SLI), and developmental disability (DD).
DPSCD students with IEPs are identified as having a disability at rates like those at the
state level in the areas of autism and EI. The district’s percentages significantly exceed state and
national rates in the areas of CI (18 percent, 9 percent, and 6 percent, respectively).
The nation has larger percentages than DPSCD in the areas of OHI (14 percent and 10
percent, respectively) and SLD (35 percent and 27 percent, respectively). In the area of SLI, the
state’s 25 percent figure exceeds DPSCD’s by six points.
Exhibit 2b. Percentage of Students with IEPs by District, State, and Nation40
DPSCD and Detroit Charter School Enrollment and Special Education Demographics
To compare the special education demographics of district and charter schools, it is
important to compare total enrollment data over time. The data in exhibit 2c show that between
2012-13 and 2016-17, DPS(CD)41 enrollment decreased by 20,575 students (66,132 to 45,557, or
40 National and state data are based on the U.S. Department of Education’s 2014 IDEA Part B Child Count and
Educational Environment database, retrieved from 2014-15 USDE IDEA Section 618 State Level Data Files,
retrieved at http://www2.ed.gov/programs/osepidea/618-data/state-level-data-files/index.html#bccee. Unless
otherwise stated, all DPSCD data were provided by the district to the Council’s team. 41 DPS(CD) is used to refer to the district in years that include either DPS or DPSCD.
District State Uran Districts Nation
Percentage 16.1% 13.0% 13.1% 13.1%
0%
5%
10%
15%
20%
ASD CI EI OHI SLD SLI DD Other
District 11% 18% 4% 10% 27% 19% 5% 7%
State 10% 9% 5% 13% 30% 25% 4% 5%
Nation 9% 6% 5% 14% 35% 20% 9% 2%
0%5%
10%15%20%25%30%35%40%

Improving Special Education Services in the Detroit Community School District
Council of the Great City Schools Page 29
31.10 percent), while charter school enrollment increased by 4,169 students (36,989 to 41,158, or
11.3 percent). These figures indicate that DPS(CD)’s percentage of all public-school students in
Detroit dropped from 64.1 percent to 52.5 percent, while the total school enrollment dropped from
103,121 students to 86,715 in those five years (enrollment at DPS(CD) and Charters).
Exhibit 2c. DPS(CD) and Charter School Student Enrollment Over Time
Disability Rates for District and Charter Schools Over Time
Data in exhibit 2d show changes in the numbers and percentages of students with IEPs in
DPS and DPSCD [DPS(CD)] and Detroit’s charters between 2012-13 and 2016-17. During this
period, the district’s percentage of students with IEPs increased from 18.1 percent to 19.0 percent
while the percentage in charter schools remained about the same (8.8 percent to 8.7 percent). The
special education rate gap between the district and charters grew from 9.2 percentage points to
10.3 percentage points, even though charter school enrollment increased by 4,169 students (or 11.3
percent) and the district enrollment decreased by 20,575 students (or -31.1 percent).42 Using a risk
ratio methodology, students in DPS(CD) are twice as likely as charter school students to have an
IEP.
Exhibit 2d. DPS(CD) and Charter School Number/Percent of Students with IEPs
42 Data for district and charter school comparisons here and below are based on a May 2017 document that DPSCD
provided, which is based on mischooldata.org. Charter data were not provided for 2016-17.
2012-13 2013-14 2014-15 2015-16 2016-17
DPS(CD) 66,132 49,168 48,147 46,524 45,557
Charters 36,989 38,350 40,507 41,107 41,158
0
10,000
20,000
30,000
40,000
50,000
60,000
70,000
2012-13 2013-14 2014-15 2015-16 2016-17
DPS(CD) # 11,957 8,804 8,953 8,733 8,658
Charter # 3,268 3,104 3,403 3,372 3,565
DPS(CD) % 18.1% 17.9% 18.6% 18.8% 19.0%
Charter % 8.8% 8.1% 8.4% 8.2% 8.7%
0%2%4%6%8%10%12%14%16%18%20%
0
2,000
4,000
6,000
8,000
10,000
12,000
14,000

Improving Special Education Services in the Detroit Community School District
Council of the Great City Schools Page 30
SLD and SLI Rates by DPS(CD) and Charters
In the most common disability areas of specific learning disabilities and speech/ language
impairment, charter schools have higher percentages than does DPS(CD). (See exhibit 2e.)
• SLD. In 2012-13, the area of SLD constituted 47.9 percent of charter school students with
IEPs, compared to the district’s 40.0 percent. By 2015-16, the gap grew by 14.8 percentage
points (29.1 percent to 43.9 percent, respectively). The district’s rate fell in 2016-17 to 28.3
percent.
• SLI. In 2012-13, the area of SLI constituted 21.4 percent of charter school students with
IEPs, compared to the district’s 13.6 percent. By 2015-16, the gap between charter and
district percentages narrowed to 2.9 percentage points (21.3 percent to 18.4 percent,
respectively). The district’s rate fell slightly to 18.3 percent in 2016-17.
Exhibit 2e. Percentage of Students with SLD and SLI by District and Charter Schools
ASD, CI, and EI Rates by DPS(CD) and Charter Schools
Students with autism spectrum disorder, cognitive impairment, and emotional impairment
typically have conditions that require more intensive supports and they are placed in more
restrictive and separate classes and school environments more frequently than students with SLD
and SLI. Data in exhibit 2f show that the percentages of DPS(CD) students with IEPs in any one
of these three disability areas are substantially higher than the percentages of these students in
charter schools. The following comparisons are on district data from 2012-13 to 2016-17 and
charter school data from 2012-13 to 2015-16, the last year on which DPSCD provided data.
• ASD. The district’s rate increased from 6.7 percent to 10.1 percent (838 students), while the
charter school rate increased from 0.5 percent to 1.0 percent (34 students).
• CI. The district’s rate decreased from 19.6 percent to 18.1 percent (1,589 students), while the
charter schools’ rate increased from 3.0 percent to 3.7 percent (125 students).
• EI. The district’s rate decreased from 4.2 percent to 3.8 percent (340 students), while the
charter schools’ rate increased from 0.6 percent to 1.7 percent (57 students).
2012-13 2013-14 2014-15 2015-16 2016-17
SLD DPS(CD) 40.0% 32.9% 30.9% 29.1% 28.3%
SLI DPS(CD) 13.6% 16.0% 17.8% 18.4% 18.3%
SLD Charter 47.9% 46.6% 45.4% 43.9%
SLI Charter 21.4% 21.4% 21.6% 21.3%
0%
10%
20%
30%
40%
50%
0%
10%
20%
30%
40%
50%

Improving Special Education Services in the Detroit Community School District
Council of the Great City Schools Page 31
Exhibit 2f. Percentage of Students with ASD, CI and EI by District and Charter Schools
Furthermore, DPSCD data show that the district enrolled 155 students with a severe
multiple impairment (SXI)--with almost all attending a separate center school. Data for students
with this disability were not provided on charter schools, but it is highly unlikely that these school
enroll any – or very few – students with SXI.
Disability Area Risk Ratios for DPSCD Compared to Charter Schools
A risk ratio measurement shows the likelihood that DPSCD students have a specific
disability compared to charter school students in Detroit. In the three most severe disability areas
discussed above, district students have risk ratios of 22.46 for autism, 11.51 for cognitive
impairment, and 5.37 for emotional impairment. Conversely, the two disability areas typically
requiring relatively less-intensive special education/related services show risk ratios in DPSCD
compared to charter school students with IEPs of 1.55 for specific learning disability and 2.02 for
speech/language impairment. (See exhibit 2g.) The financial implications of this disproportionate
responsibility for students with more significant special education needs are discussed in section
IV. Support for Teaching and Learning for Students with Disabilities, Fiscal issues.
Exhibit 2g. Likelihood of Specified Disability for DCPSD to Charter School Students
2012-13 2013-14 2014-15 2015-16 2016-17
ASD DPS(CD) 6.7% 8.5% 8.8% 9.6% 10.1%
CI DPS(CD) 19.6% 19.5% 18.6% 18.2% 18.1%
EI DPS(CD) 4.2% 3.9% 4.0% 3.9% 3.8%
ASD Charter 0.5% 0.6% 0.5% 1.0%
CI Charter 3.0% 3.4% 2.9% 3.7%
EI Charter 0.6% 1.9% 1.4% 1.7%
0%
5%
10%
15%
20%
0%
5%
10%
15%
20%
ASD CI EI SLD SLI
Risk Ratio 22.46 11.51 5.37 1.55 2.02
0
5
10
15
20
25

Improving Special Education Services in the Detroit Community School District
Council of the Great City Schools Page 32
DPSCD Disability Rates by Grade
The team also examined the percentage of all students with disabilities by grade. The
results showed that some 12 percent are at the early childhood level. The percentage drops to 9
percent at kindergarten, jumps to 12 percent at first grade, and gradually increases to 19 percent
and 20 percent in seventh and eighth grade, respectively. Percentages drop at the high school level,
where they fluctuate between 18 percent (twelfth grade) and 16 percent (eleventh grade). (See
exhibit 2h.)
Exhibit 2h. Percentages of DPSCD Students with IEPs by Grade
SLI, ASD, and DD Disabilities by Grade: Early Childhood and Kindergarten
Data in exhibit 2i show the percentages of students who are in early childhood (EC)
programs and kindergarten by the three most common disability areas: speech/language
impairment (SLI), autism spectrum disorder (ASD), and developmental disability (DD). These
data show that SLI is the most common disability at both grade levels (38 percent for EC and 56
percent for kindergarten). The high kindergarten SLI figure eclipses ASD and DD (15 percent and
19 percent, respectively), which are lower than the EC figures of 20 percent and 24 percent,
respectively.
Exhibit 2i. Percentages of DPSCD Students with IEPs by Grade (EC and Kindergarten)
SLD and SLI Disabilities by Grade (K through 12th)
Data in exhibit 2j show the percentages of all students with a specific learning disability
(SLD) and all students with a speech/language impairment (SLI) by grade level. These data
indicate that as the area of SLI decreases, SLD increases. SLI decreases from a high of 17 percent
in first grade to a low of 1 percent in grades 10, 11, and 12, while SLD increases from a low of 0
EC K 1 2 3 4 5 6 7 8 9 10 11 12
Percent SwD 12% 9% 12% 13% 14% 15% 17% 18% 19% 20% 17% 17% 16% 18%
0%
5%
10%
15%
20%
SLI ASD DD
EC 38% 20% 24%
Kg 56% 15% 19%
0%
10%
20%
30%
40%
50%
60%

Improving Special Education Services in the Detroit Community School District
Council of the Great City Schools Page 33
percent in kindergarten and first grade to anywhere from 12 to 14 percent in grades 9 through 12.
Both disabilities have rates of 7 percent in fifth grade.
This pattern raises a question with the team about the extent to which students with learning
issues are first identified as SLI and then later identified as SLD. With the largest percentage of
students with SLD educated in grades sixth and upward, one wonders if these students are being
identified early enough to receive the intensive interventions necessary to increase their
achievement overall.
Exhibit 2j. Percentages of Students with SLI and SLD by Grade (Kindergarten through 12th)
EI, OHI, ASD and CI Disabilities by Grade (1st through 12th)
Data in exhibit 2k show the percentages of students by grade in the areas of emotional
impairment, other health impairment, autism spectrum disorder, and cognitive impairment. These
figures show the following:
• Emotional Impairment. A very small percentage of students with EI are identified at grades
1 and 2 (1 percent). The rate increases at grade 6 (13 percent), and again at grade 9 (16
percent) when it decreases in grade 12 (8 percent).
• Other Health Impairment. Beginning with smaller percentages at grades 1 and 2 (4 percent
and 5 percent, respectively), the OHI rate increases to highs of 11 percent at grades 4, 5, 6, 8,
and 9) and decreases to 6 percent at grade 12.
• Autism Spectrum Disorder. Except in grade 12, there was less variation by grade for
students with ASD than there was in other disability area. For these grades, the rates ranged
from 9 percent (grades 1 and 2) to 6 percent (grades 8, 10, and 11). The rate spikes in grade
12 at 21 percent.
• Cognitive Impairment. Given the nature of cognitive impairment, one would expect that this
disability area would be relatively stable by grade. However, these rates vary from lows of 2
percent to 4 percent (grades 1, 2, and 8) to highs of 10 percent to 13 percent (grade 7 and
high school). This variation may reflect the identification of students with mild (and more
judgmental) impairments rather than the more significant (and less judgmental) impairments.
K 1 2 3 4 5 6 7 8 9 10 11 12
SLI 13% 17% 15% 11% 10% 7% 5% 4% 2% 2% 1% 1% 1%
SLD 0% 0% 2% 4% 6% 7% 10% 10% 10% 14% 13% 12% 12%
0%
2%
4%
5%
7%
9%
11%
13%
14%
16%
18%

Improving Special Education Services in the Detroit Community School District
Council of the Great City Schools Page 34
Exhibit 2k. Percentages of DPSCD Students with IEPs by Grade
English Learners by Grade
Data in exhibit 2l show the number of English learners (ELs) with IEPs by grade. Overall,
a very small number of ELs are provided special education at the early childhood level. The
number increases at kindergarten, nearly doubles in grade 1, and steadily decreases between grades
4 but increases again in grades 9 and 10 before dropping in grades 11 and 12. Very few students
are identified as English learners after grade 12.
Exhibit 2l. Number of DPSCD English Learners with IEPs by Grade
ELs by Disability and by Grade
Data in exhibit 2m show the number of ELs in seven disability areas by grade. More ELs
are classified as having a speech/language impairment in kindergarten through grade 1 than any
other disability area. This trend changes in grades 4 through 12 when more students are identified
with a specific learning disability. The switch from SLI to SLD for all students with disabilities
occurs later in grade 6. ELs are not identified as having a cognitive impairment until grade 4 and
the highest number is at grade 9. Furthermore, only five students were identified as having a
disability at the early childhood level and post grade 12. Although it is difficult to determine if a
student’s learning difficulties are related to the acquisition of English or to a disability, these
patterns raise questions about the district’s ‘child find’ and identification processes, and
postsecondary transition outreach to parents and students.
1 2 3 4 5 6 7 8 9 10 11 12
EI 1% 1% 3% 6% 10% 13% 11% 10% 16% 11% 11% 8%
OHI 4% 5% 7% 11% 11% 11% 8% 11% 11% 8% 7% 6%
ASD 9% 9% 8% 8% 8% 7% 7% 6% 7% 6% 6% 21%
CI 2% 3% 6% 6% 8% 9% 11% 4% 11% 11% 10% 13%
0%
5%
10%
15%
20%
25%
30%
35%
40%
45%
EC K 1 4 5 6 7 8 9 10 11 12 14
Number ELs with IEPs 5 33 60 61 56 52 51 38 53 51 39 36 2
0
10
20
30
40
50
60
70

Improving Special Education Services in the Detroit Community School District
Council of the Great City Schools Page 35
Exhibit 2m. Number of DPSCD English Learners with IEPs by Grade
DPSCD Disability Incidence by Race/Ethnicity
This subsection covers the extent to which DPSCD students from each of the most common
racial/ethnic groups are proportionate to each other. According to MDE’s latest FY 2015 State
Performance Plan/Annual Performance Report (SPP/APR), which was published on January 23,
2018, disproportionate representation is defined as –
A verified ratio greater than 2.5 for two consecutive years for any racial/ethnic
group in one of six eligibility categories was used to identify districts for focused
monitoring activities. In cases where the sum of all other students with an
individualized education program (IEP) equals fewer than ten, an alternate risk ratio
(ARR) was calculated for the race under consideration.
According to MDE’s SPP/MDR, the department’s Office of Special Education (OSE) will
conduct an on-site visit or issue a Monitoring Activities Report on districts with risk ratios greater
than 2.5 for two consecutive school years.43 According to MDE representatives with whom the
Council team spoke, more oversight responsibility is being transferred to RESAs since they
distribute IDEA funds to school districts in each of their regions.
Race/Ethnicity Percentage and Risk Ratios for All Students with IEPs
Exhibit 2n shows the percentages of students with disabilities by race/ethnicity and their
related risk ratios. These figures indicate that the percentages of students with disabilities were 17
percent of all black students, 11 percent of all Hispanic; 21 percent of all white students; and 8
percent of all other students. Using MDE’s risk ratio threshold of “2.5,” the risks for identification
are not disproportionate or unusually high or low in any of these racial/ethnic groups. Compared
to all other racial/ethnic groups, white students had the highest risk at 1.28. Other students have
the lowest risk at 0.50. Black and Hispanic students were in between.
43 Retrieved from https://osep.grads360.org/#report/apr/2015B/publicView?state=MI&ispublic=true.
EC K 1 4 5 6 7 8 9 10 11 12
Other 3 4 3 4 4 5 2 6 5 3 2
SLI 2 24 39 17 14 6 5 2 6 2 1 3
SLD 1 20 22 27 25 24 24 31 24 14
OHI 3 9 5 6 3 2 1 4 4
EI 2 1 2 1 1
DD 1 3 6
CI 4 3 5 4 5 13 6 4 7
Autism 2 3 7 8 8 4 7 3 2 1 6 5
0
10
20
30
40
50
60

Improving Special Education Services in the Detroit Community School District
Council of the Great City Schools Page 36
Exhibit 2n. By Race/Ethnicity, Percentages of All Enrolled Students and of All Students with IEPs
Race/Ethnicity Prevalence for Students with Most Common Disabilities
Exhibit 2o shows racial/ethnic risk ratios by disability area. These figures indicate risk
ratios exceeding MDE’s 2.5 threshold in the following areas: black students with cognitive
impairment (2.64) and white students with an emotional impairment (3.03). With a risk ratio of
2.49, black students with an emotional impairment were near the 2.5 threshold. In its FY 2015
state performance plan, MDE did not find DPCSD to have disproportionate representation.
Exhibit 2o. Race/Ethnicity Risk Ratios by Disability Areas
Disparities by Language Status (EL and Non-EL)
Overall, 10 percent of all students who were ELs had an IEP, compared to 17 percent of
students who are not ELs. Using a risk ratio, ELs were 0.57 times less likely than non-ELs to have
an IEP. This suggests a possible under-representation.
When examined by disability area, the most notable risk for ELs was among those with a
speech/language impairment who were 5.38 times more likely to be identified as non-ELs. (See
exhibit 2p.) Although the disproportionality of ELs to non-ELs was not included in the state
performance plan, it is an important area to address when significant disparities exist.
Black Hispanic White Other
Percent Disability of Race/Ethnicity 17% 11% 21% 8%
Risk Ratio 1.07 0.61 1.28 0.50
0
0.2
0.4
0.6
0.8
1
1.2
1.4
0%
5%
10%
15%
20%
25%
Autism CI DD EI OHI SLD SLI Other
Black 1.63 2.64 1.46 2.49 2.53 1.44 1.12 0.96
Hispanic 0.52 0.25 0.38 0.39 0.80 1.04 0.78
White 1.3 1.17 1.91 3.03 0.95 1.04 1.62 1.98
0
1
1
2
2
3
3
4

Improving Special Education Services in the Detroit Community School District
Council of the Great City Schools Page 37
Exhibit 2p. Risk Ratios for ELs Compared to Non-ELs by Disability Areas
Special Education Eligibility and Timeliness
DPSCD also provided the Council team with data showing the numbers of students who
were referred for an evaluation during the 2015-16 school year, whether they qualified for an IEP,
and results by disability area.
Evaluations Completed and Qualification for IEPs
As data in exhibit 2q show, of 484 requests for special education evaluations, parental
consents were provided for 390 students or 91 percent of requests. Reportedly, the evaluation
process generally is initiated upon a parent’s written request.
There was a perception that school personnel did not always understand that the RCT
process should be followed after a parent’s request to determine if there was a basis to suspect that
the child would qualify for special education and then to proceed with an evaluation.
For students with parental consents, 309 (79 percent) were found eligible for special
education in the following major disability areas: 50 percent for a specific learning disability; 27
percent for other health impairment, 16 percent for early childhood developmental disabilities; 3
percent for speech language impairment; and 4 percent for other disability areas.
Interestingly, these figures were considerably different from overall district rates shown in
exhibit 2c, which showed 27 percent for specific learning disability; 10 percent for other health
impairment, 5 percent for developmental disabilities; and 19 percent for speech language
impairment.
Exhibit 2q. Referrals for Initial Evaluations and Results
Autism CI DD OHI SLD SLI Other
Risk Ratio 0.54 0.28 0.26 0.13 1.22 5.38 0.57
0
1
2
3
4
5
6
Consentsfor eval
Eligible SLD OHI ECDD SLI Other
Number 390 309 154 84 50 10 11
Perecentage 81% 79% 50% 27% 16% 3% 4%
0%10%20%30%40%50%60%70%80%
050
100150200250300350400450

Improving Special Education Services in the Detroit Community School District
Council of the Great City Schools Page 38
Timeliness of Evaluations
The following information relates to various categories of disability that have time lines
set by federal and state law.
Early Intervention: Timeliness of IEPs Implemented by Third Birthday for Children
Michigan’s latest state performance plan (SPP) indicator results for DPSCD, which shows
data from 2015-16, reports the percentage of students referred from early intervention prior to age
three who were found to be eligible for special education and had an IEP developed and
implemented by their third birthdays.44 Data show that 17.4 percent of DCPSD children met this
standard. The compliance standard is 100 percent.
Timeliness of Evaluations and IEPs
According to Michigan’s 2015-16 SPP report, 99.8 percent of initial evaluations and IEPs
were completed in a timely manner by DCPSD. In addition, DCPSD had 2016-17 data from MDE
showing only three overdue initial evaluations. However, according to an excel report with
MISTAR data from February 2, 2018, some 281 annual IEPs, 57 initial IEPs, and 92 triennial IEPs
were not completed on time. A district representative explained that many of IEPs appear to be
overdue on the report because the caseload manager had not yet validated timeliness data in the
system. Reportedly, delays are due in part to staffing vacancies and the pressure the timelines put
on special education operations.
AREAS OF STRENGTH
The following are areas of strength in the district’s disability prevalence rates, evaluation
outcomes, and IEP timeliness.
• Timeliness of Initial IEPs. According to MDE’s 2015-16 SPP report, 99.8 percent of initial
evaluations and IEPs were completed in a timely manner. The district’s rate is very close to
meeting the strict 100 percent compliance requirement.
• Reliance on DPSCD for Special Education. Charter schools relied on DPSCD to educate
students with disabilities that generally required more intensive special education and related
services, such as students with autism spectrum disorder, cognitive impairments, and
emotional impairments. This reliance puts pressure on the district’s resources that are not fully
funded by the state.
There were not significant areas of disproportionality by race alone in the identification of
students for special education although there were disproportionalities by race and disability area.
OPPORTUNITIES FOR IMPROVEMENT
The following areas provide opportunities for improvement.
• Comparative Incidence Rates. Some 16.1 percent of students three through 26 years of age
have an IEP, compared to 13 percent of the national average and urban school districts on
44 Michigan Department of Education Special Education (Part B of IDEA) Public Reports, ppublished May 2017.

Improving Special Education Services in the Detroit Community School District
Council of the Great City Schools Page 39
which we have data. Excluding students with IEPs attending district schools pursuant to school
choice or the Wayne RESA plan, the percentage was 15.5 percent.
• Charters Compared to DPSCD. As the district’s percentage of students with IEPs increased,
the percentage in charter schools decreased. The gap between the two grew from 9.2 percentage
points to 10.3 percentage points. In 2016-17, DPSCD students were twice as likely to have an
IEP as charter school students. Furthermore, charter schools had higher proportions of students
with less intensive needs, i.e., speech/language impairments and specific learning disabilities,
than they had students with high intensive needs, e.g., autism spectrum disorder, cognitive
impairments, and emotional impairments. Using a risk ratio calculation, the likelihood that
DPSCD students would have one of these three disabilities compared to charter students was
22.46, 11.51, and 5.37, respectively.
• Grade Configuration. The overall percentage of students with IEPs increased steadily from
kindergarten to seventh and eighth grade. The area of specific learning disabilities and
emotional impairments reached their highest rates at ninth grade (14 percent and 16 percent,
respectively). These figures suggest that students may not be identified before they have
experienced academic failure when there would be more time for intensive interventions.
• English Learners. Almost all ELs with IEPs were classified as having a speech/language
impairment in kindergarten and grade 1, and most were identified with a specific learning
disability beginning at grade 4. Furthermore, only five students were identified as having a
disability at the early childhood level and post grade 12. Although it is difficult to determine if
a student’s learning difficulties are related to the acquisition of English or to a disability, these
patterns raised questions to the team about the district’s ‘child find’ and identification process
and the district’s postsecondary outreach to parents and students. ELs were 5.38 times more
likely than non-ELs to have a speech/language impairment.
• Racial/Ethnic Disproportionality. The following categories of students exceeded MDE’s 2.5
risk ratio threshold: black students with cognitive impairment (2.64) and white students with
an emotional impairment (3.03). Black students with emotional impairments (2.49) were near
the 2.5 threshold. In its FY 2015 state performance plan, MDE did not find generally that the
district exceeded disproportionate representation thresholds.
• Parent Evaluation Request. Generally, a special education request is initiated through a parent
request, rather than through an RCTs determination that there was a basis for suspecting a
possible disability and potential need for special education.
• Evaluation and IEP Timeliness. Based on MDE’s data for 2015-16, some 17.4 percent of
children had an IEP in place by their third birthday when they were found to be eligible for
special education. In addition, as of February 2, 2018, district data showed 281 annual IEPs,
57 initial IEPs, and 92 triennial IEPs had not been completed in a timely manner. Reportedly,
many of these actions may have been because there were delays in the caseload manager’s
validation of dates in the data system. Delays were attributed by interviewees to staffing
vacancies.
RECOMMENDATIONS
2. Demographics, Referral and Identification of Disability. Improve the overall consistency and
appropriateness of referrals, assessments, and eligibility decisions in special education.

Improving Special Education Services in the Detroit Community School District
Council of the Great City Schools Page 40
a. Data Review. With a multi-disciplinary team of staff members in and outside the special
education department, review exhibits 2a through 2q (along with MDE’s latest SPP results.
Include representatives from C/I, English learners, principal leaders, principals, etc. Have
the team develop hypotheses about patterns in the results presented in this section. For
example, when examining the district’s high percentage of students identified as needing
special education, investigate what the percentage might be if figures included all public-
school students in Detroit or what they might be without students with an IEPs from other
districts. (The Council team did not have access to these data.) Include in the data review
significantly different disability rates by school and cohort; how disability patterns change
by grade; and over and under representation of various student groups.
b. Implementation Plan. Based on these data and the staff’s hypotheses about why the
patterns look like they do, embed in the MTSS implementation plan activities relevant to
the RCTs, including problem-solving, guidance on how to determine whether a student’s
lack of progress is due to a disability or to inadequate access to appropriate core instruction,
increasingly intensive interventions, supports, and progress monitoring, etc. (Coordinate
this activity with Recommendation 1b.) Also, consider using a playgroup model to assess
young children.
c. Written Expectations. In each area identified by the multi-disciplinary team as
problematic, review district processes, including referrals, assessments, and eligibility, and
amend them to provide more specific guidance.
• Standard Operating Procedures Manual. Ensure that the district’s comprehensive
standard-operating-procedures manual for special education incorporates this
guidance. (Coordinate with Recommendation 7a.)
• RCT Practices. Require that RCTs function within an MTSS framework, and that
personnel who assess students for special education consider the extent to which
students might benefit from increasingly intensive interventions based on problem-
solving and progress monitoring.45 (Coordinate this activity with Recommendation 1a.)
• English Learners. Incorporate in the manual information relevant to ELs, such as that
included in MDE’s Guidance Handbook for Educators of English Learners with
Suspected Disabilities.46
• Lack of Progress. Provide guidance on evaluating students’ lack of progress. Have
RCTs include in their procedures appropriate referrals for Section 504 services as well
as for special education.
• Referral Practices. Make sure that written guidance and practice is included on
parental requests for a special education evaluation when there is evidence of a
suspected disability.
• Exiting Special Education. Establish guidelines for determining when and under what
circumstances a student no longer needs special education to progress educationally. A
45 This process does not include students with “obvious” disabilities, such as those with significant cognitive
disabilities, blindness, deafness, etc. 46 Retrieved from
http://www.michigan.gov/documents/mde/ELs_with_Suspected_Disabilities_Guidance_Handbook_-
_2017_558692_7.pdf.
Improving Special Education Services in the Detroit Community School District
Council of the Great City Schools Page 41
transition to services under Section 504 may be appropriate for such children.
Recommendations relevant to the timely transition of students from Part C services, and
proposals on timely IEPs are provided later in this report. (See IV. Support for Teaching
and Learning for Students with Disabilities, Accountability.)
d. Differentiated Professional Learning. Plan for and provide all relevant district
stakeholders with the professional development they need to implement the
recommendations in this report. Have personnel from the special education and English
language learner departments collaborate on the referral and assessment needs of EL
students. (Coordinate this activity with Recommendation 1e.)
e. Data Analysis and Reports. Develop and provide regular user-friendly summary reports
to district leadership showing data like those in exhibits 2a through 2m. Share data by
cohort and by school within cohorts.
f. Monitoring and Accountability. Develop a process for ongoing monitoring of expected
referrals, evaluations, and eligibility practices. Rather than using a traditional record-
review compliance model, review data with schools so that they are aware of problems,
and they are better prepared for follow-up action. Enable staff to observe best practices and
receive coaching that will improve their knowledge and skills. (Coordinate this activity
with Recommendation 1g.) Consider folding disability rates into cohort and school
accountability systems.

Improving Special Education Services in the Detroit Community School District
Council of the Great City Schools Page 42
III. Teaching and Learning for Students with Disabilities
The U.S. Department of Education has moved from a compliance-only posture in special
education to a Results-Driven Accountability (RDA) model. This change is based on data showing
that the educational outcomes of America’s children and youth with disabilities had not improved
as expected, despite significant federal efforts to close achievement gaps. The accountability
system that existed prior to this shift placed substantial emphasis on procedural compliance, but it
often did not consider how that compliance affected the learning outcomes of students.47
The Education Department’s Office of Special Education Programs’ (OSEP) vision for
RDA involved having all accountability components supporting states in improving results for
students with disabilities. This approach is consistent with IDEA, which requires that the primary
focus of the federal program be on improving educational results and functional outcomes for
students with disabilities, along with meeting IDEA requirements. RDA fulfills these requirements
by focusing on both outcomes for students with disabilities and on compliance with the law.48
According to its July 1, 2016 State Performance Plan (SPP)/Annual Performance Report
(APR), Michigan is implementing ED’s Results Driven Accountability (RDA) priorities by using
all indicators (compliance and performance) to make compliance determinations. As previously
discussed, the Michigan Department of Education’s SSIP uses a multi-tiered system of supports
(MTSS) framework to help coordinate resources and align initiatives across the department in
order to ensure improvement at all levels of the system. MDE is also establishing state targets for
the percentage of K-3 students with IEPs in participating schools who achieve benchmark status
in reading as defined by a curriculum-based measurement. In addition to disaggregating results for
students with IEPs, MDE will compute scores for K-3 students who are economically
disadvantaged, English learners; and all students. Baselines and targets will be established and
recalculated as additional data become available.49
This section of the report looks at results for students with disabilities and how DPSCD is
supporting the teaching and learning of students with IEPs, including young children ages three to
five years. This section has the following subsections:
• Education of Young Children Ages Three to Five Years
• Student Achievement on NAEP and Statewide Assessments
• Educational Settings for Students with Disabilities
• Suspension and Expulsion Rates
• Academic Instruction, Interventions, and Supports
• Instruction for Students in SDC Programs
• Professional Learning
47 April 5, 2012, RDA Summary, U.S. Department of Education at www2.ed.gov/about/offices/list/osers/osep/rda-
summary.doc. 48 Ibid. 49 Michigan Part B Phase III State Systemic Improvement Plan, April 2017.

Improving Special Education Services in the Detroit Community School District
Council of the Great City Schools Page 43
Education of Young Children Ages Three to Five Years
This subsection addresses academic outcomes for children with IEPs, their educational
settings, and feedback from focus group participants.
Achievement Outcomes for Children with IEPs (Three to Five Years of Age)
One indicator in MDE’s SPP relates to the achievement of young children with disabilities
in three areas: appropriate behavior, acquisition and use of knowledge and skills, and positive
social/emotional skills. In each of these three categories, calculations are made of the percentage
of children in two areas: (1) children who entered an early childhood program below
developmental expectation for their age, but who have substantially increased developmentally by
age six when they exit a program, and (2) children functioning within expectations by age six or
have attained those expectations by the time they exit the program. The percentages of district
children meeting standards and the state’s targets on each are shown in Exhibit 3a.50
Substantially Increased Skills
This area measures DPSCD children who entered an early childhood program below
developmental expectation for their age, but who substantially increased developmentally by age
six when they exited the program. In each of the three categories (appropriate behavior, acquisition
and use of knowledge/skills, and positive social/emotional skills), MDE’s public report for 2015-
16 showed that none of DPSCD’s children met state standards. (See exhibit 3a.) These outcomes
raise questions about the accuracy of the district’s data for FY 2015.
Functioning Within Age Expectations
For children who were functioning within expectations by six years of age or had attained
those expectations by the time they exited the program, 75 percent of children met state standards
in all three categories. These outcomes also raise concerns about the accuracy of the data since all
three categories showed identical results.
Exhibit 3a. 2014-15 Outcomes for District/State Children Three to Five Years of Age with IEPs
50 Retrieved from SpecialEducationPublicReporting-IndicatorReportSummary.pdf.
SubstantiallyIncreased
Within AgeExpectations
SubstantiallyIncreased
Within AgeExpectations
SubstantiallyIncreased
Within AgeExpectations
Appropriate Behavior Acquisition/Use of Knowledge/Skills Positive Social/Emotional Skills
District 75.0% 0.0% 75.0% 0.0% 75.0% 0.0%
State Target 86.5% 59.2% 87.50% 56.1% 86.5% 55.0%
0%
10%
20%
30%
40%
50%
60%
70%
80%
90%
100%

Improving Special Education Services in the Detroit Community School District
Council of the Great City Schools Page 44
Educational Settings of Young Children Three to Five Years of Age
Studies have shown that when children with disabilities are included in regular classroom
settings, they demonstrate higher levels of social play, are more likely to initiate activities, and
show substantial gains in key skills—cognitive skills, motor skills, and self-help skills.
Participating in activities with typically developing peers allows children with disabilities to learn
through modeling, and this learning helps them prepare for the real world. Researchers have found
that typically developing children in inclusive classrooms are also better able to accept differences,
are more likely to see their classmates achieving despite their disabilities, and they are more aware
of the needs of others.51
The importance of inclusive settings is underscored by a federal requirement that state
performance-plan indicators include the extent to which young children (three to five years of age)
receive most of their services in regular early childhood programs or in separate settings.
District Educational Setting Rates
Data in exhibit 3b show DPSCD percentages of three to five-year old children with
disabilities who were educated in various educational settings.
• Majority of Time in Early Childhood. Overall, 29.9 percent of all DPSCD children with
IEPs were educated most of the school day in a regular early childhood class. This figure is
lower than Wayne RESA’s 34.5 percent rate, the state’s 45.3 percent rate, the state’s 54.2
percent target, and the nation’s 45.2 percent rate.
• Separate Class or School. Some 38.7 percent of all district children were educated most of
the day in separate classes/schools apart from their typical peers. This figure was lower than
Wayne RESA’s 44.1 percent and the state’s 46.3 percent average. Nonetheless, DPSCD’s
percentage is larger than the state’s 18.1 percent target and the nation’s 25.2 percent average.
Exhibit 3b. 2015-16 Percentage of Young Children with IEPs (Ages 3 to 5) by Educational Setting
51 Ronnie W. Jeter, The Benefits of Inclusion in Early Childhood Programs at
http://www.turben.com/article/83/274/The-Benefits-of-Inclusion-in-Early-Childhood-Programs
Regular Preschool Setting Separate Preschool Setting
DPSCD 29.9% 38.7%
Wayne RESA 34.5% 44.1%
State 45.3% 46.3%
State Target 54.2% 18.1%
Nation 45.2% 25.2%
0%
10%
20%
30%
40%
50%
60%

Improving Special Education Services in the Detroit Community School District
Council of the Great City Schools Page 45
Student Achievement on the NAEP and Statewide Assessments for Grades 3-12
Beginning in 2015, USDE developed a determination rating based on results defined in the
accountability framework described earlier. Two matrices were used for this purpose--with 50
percent of the ratings based on results and 50 percent based on compliance. The results component
is calculated using the following indicators:
• Fourth/eighth graders participating in regular statewide assessments in reading and math;
• Fourth/eighth graders scoring at or above basic levels of proficiency in reading and math on
the National Assessment of Educational Progress (NAEP);
• Fourth/eighth graders included in NAEP testing in reading and math;
• Students exiting school by graduating with a regular high school diploma; and
• Students exiting school by dropping out.52
This subsection presents achievement data for Detroit students on NAEP, as well as
performance data for DPSCD students with disabilities on statewide assessments. In addition,
graduation and dropout rates are assessed.
NAEP Achievement Rates for Fourth, Eighth, and Twelfth Grade Students with IEPs
In partnership with the National Assessment Governing Board and the Council of the Great
City Schools, the Trial Urban District Assessment (TUDA) was created in 2002 to support
improvements in student achievement in the nation’s largest urban school districts. In 2015, 21
urban school districts voluntarily participated in TUDA and can track achievement by subgroup
on a single comparable assessment. Fortunately, DPSCD participates in TUDA, so district
achievement rates on NAEP can be compared with state and national averages among students
with disabilities and with other major city school districts.53
Data in exhibits 3c through 3f show the percentage of students with disabilities in 2015
who scored basic/above in reading and math for all large city (TUDA) districts and the nation.54
The exhibits also show the percentage point differences between 2015 and 2009 for the TUDA
districts that participated in 2009.
Reading: Grade 4
Fourth grade reading results for students with disabilities showed that some 23 percent
scored at or above basic levels in all TUDA districts, a decrease of 1 percentage point from 2009.
Nationally, some 33 percent of students with disabilities scored at this level.
52 For a full explanation of ED’s methodology, see How the Department Made Determinations under Section 616(d)
of the Individuals with Disabilities Education Act in 2015: Part B
http://www2.ed.gov/fund/data/report/idea/partbspap/2015/2015-part-b-how-determinations-made.pdf 53 The Nation's Report Card, retrieved from http://www.nationsreportcard.gov/. 54 TUDA scores include students who are Section 504 qualified. TUDA 2003-2013 results were retrieved from
http://www.advocacyinstitute.org/blog/; and 2015 results were retrieved from
http://nces.ed.gov/nationsreportcard/naepdata/.

Improving Special Education Services in the Detroit Community School District
Council of the Great City Schools Page 46
In Detroit, 7 percent of students with disabilities scored basic/above, an increase of 1
percentage point from 2009. In 2015, TUDA averages ranged from 53 percent basic or above to 7
percent. Of the large cities, the highest averages were posted by Hillsborough County (53 percent),
and Duval County (50 percent), and Miami-Dade County (47 percent). Miami-Dade County’s
average increased the most, 17 points.
Exhibit 3c. Reading Grade 4
Reading: Grade 8
Some 36 percent of eighth grade students with disabilities scored at or above basic levels
of proficiency in reading nationally in 2015 and some 30 percent scored at this level in TUDA
districts. The nation’s average fell by 1 percentage point from 2009, while TUDA districts
increased their average by 5 percentage points.
In Detroit, 8 percent of students with disabilities scored at basic levels or above, an increase
of 2 percentage points from 2009. In 2015, TUDA averages ranged from 53 percent to 8 percent.
The highest averages were posted by Miami-Dade County (53 percent) and Duval County (49
percent). Miami-Dade County and New York City’s average scores increased the most, 14
percentage points.
Exhibit 3d. Reading Grade 8
ALLCitie
sAlbu
qAtlanta
Austin
Baltim
Boston
Charl
Chgo
Cleve
Detroit
DCDuval
Fresno
Hilsb
Houst
JeffKY
LAUSD
Miami
NYCPhill
ySanD
2015 33% 23% 11% 26% 32% 17% 31% 27% 15% 9% 7% 17% 50% 11% 53% 22% 30% 12% 47% 25% 8% 17%
2009 34% 24% 21% 41% 25% 29% 43% 20% 6% 17% 21% 34% 10% 30% 30% 9% 21%
0%
10%
20%
30%
40%
50%
60%
ALLCitie
sAlbu
qAtlanta
Austin
Baltim
Boston
Charl
Chgo
Cleve
Dallas
Detroit
DCDuval
Fresno
Hilsb
Houst
JeffKY
LAUSD
Miami
NYCPhill
ySanD
2015 36% 30% 18% 25% 34% 18% 29% 33% 22% 17% 22% 8% 22% 49% 11% 45% 21% 31% 19% 53% 38% 18% 30%
2009 37% 25% 16% 38% 38% 30% 24% 19% 6% 12% 12% 30% 17% 39% 24% 17% 28%
0%
10%
20%
30%
40%
50%
60%

Improving Special Education Services in the Detroit Community School District
Council of the Great City Schools Page 47
Math: Grade 4
In fourth grade math, some 54 percent of students with disabilities scored at or above basic
levels of proficiency nationally. Some 44 percent of students with disabilities scored at this level
in TUDA districts. Students nationally decreased by 5 percentage points over the period, while
students in TUDA districts decreased by 1 percentage point.
In Detroit, 17 percent of fourth graders with disabilities scored basic/above, an increase of
12 percentage points over 2009—the most of any city. In 2015, large city averages ranged from
75 percent to 14 percent. The highest averages were posted by Duval County (75 percent),
Hillsborough County (66 percent), Austin (63 percent), and Miami-Dade County (62 percent).
Exhibit 3e. Math Grade 4
Math: Grade 8
In eighth grade math, some 32 percent of students with disabilities nationally and 24
percent in TUDA districts scored at basic levels or above. Since 2009, the nation’s rate fell by 4
percentage points, and TUDA’s rate remained the same.
In Detroit, 4 percent of students with disabilities scored basic/above, an increase of 1
percentage point over 2009. In 2015, large city averages ranged from 34 percent to 4 percent. Of
the large cities, the highest averages were posted by Boston and Duval County (34 percent) and
Miami-Dade County (33 percent). The District of Columbia increased the most, 11 percentage
points.
Exhibit 3f. Math Grade 8
ALLCitie
sAlbu
qAtlan
taAusti
nBalti
mBoston
Charl ChgoClev
eDalla
sDetroit
DCDuva
lFresno
HilsbHous
tJeffKY
LAUSD
Miami
NYCPhill
ySanD
2015 54% 44% 31% 39% 63% 22% 50% 45% 25% 29% 52% 17% 33% 75% 17% 66% 48% 45% 30% 62% 46% 14% 35%
2009 59% 45% 34% 60% 46% 57% 67% 33% 24% 5% 25% 26% 44% 46% 24% 55% 57% 29% 43%
0%
10%
20%
30%
40%
50%
60%
70%
80%
ALLCitie
sAlbu
qAtlanta
Austin
Baltim
Boston
Charl
Chgo
Cleve
Dallas
Detroit
DCDuval
Fresno
Hilsb
Houst
JeffKY
LAUSD
Miami
NYCPhill
ySanD
2015 32% 24% 15% 14% 32% 9% 34% 27% 16% 8% 17% 4% 13% 34% 6% 32% 22% 18% 12% 33% 23% 16% 22%
2009 36% 24% 16% 47% 18% 32% 29% 20% 14% 3% 2% 13% 19% 26% 13% 30% 28% 17% 32%
0%5%
10%15%20%25%30%35%40%45%50%

Improving Special Education Services in the Detroit Community School District
Council of the Great City Schools Page 48
Statewide Assessments55
MDE’s Michigan Student Test of Educational Progress, or M-STEP, is a summative
assessment and is administered to students in the following grades and subjects: English language
arts and mathematics in grades 3–8; science in grades 4, 7 and 11; and social studies in grades 5,
8 and 11. The Michigan Merit Examination (MME) is a general assessment for students in grade
11. The MME includes a free SAT with essay and M-STEP ELA and mathematics assessment; M-
STEP science and M-STEP social studies components; and ACT WorkKeys.
Statewide English Language Arts (ELA) and Math Assessments
Exhibit 3g shows the percentages of students with disabilities who scored proficient or
above on statewide ELA and math assessments from 2011-12 to 2015-16, when MDE changed its
assessment.
• English Language Arts. In 2012-13, Detroit students with IEPs increased their rate of
proficient/above scores by 7.6 percentage points from the previous year’s 33.1 percentage.
This progress stopped in 2013-14 when the percentage dropped from 40.7 percent to 38.9
percent, and then dropped again in 2014-15 to 35.2 percent. Under a new assessment in 2015-
16, the rate dropped to 18.7 percent.
• Math. Between 2011-12 and 2014-15, students with IEPs consistently increased their rate of
proficient or above from 21.4 percent to 36.2 percent. The rate dropped to 18.8 percent with
the new assessment in 2015-16.
Exhibit 3g. ELA and Math: Proficient/Above Percentages for DPSCD Students with IEPs
MDE’s Alternate Assessment
I-Access is Michigan's alternate assessment system, which consists of three assessments
designed for students who have (or function as if they have) a significant cognitive impairment.
For such students to participate in this system, the IEP team must determine that general
assessments, even with accommodations, are not appropriate. Under the Every Student Succeeds
Act, rather than placing a cap on alternate assessments at the district level, the law established a
55 Achievement data were not provided by DPSCD. Information for this section was retrieved from the CDE
website. The district’s data was retrieved from
http://ayp.cde.ca.gov/reports/Acnt2015/2015APRDstAYPReport.aspx?cYear=&allCds=3467439&cChoice=AYP14
b and state data were retrieved from http://ayp.cde.ca.gov/reports/acnt2015/2015APRStAYPReport.aspx.
2015-16 2014-15 2013-14 2012-13 2011-12
ELA 18.7% 35.2% 38.9% 40.7% 33.1%
Math 18.8% 36.2% 30.0% 28.3% 21.4%
0%
5%
10%
15%
20%
25%
30%
35%
40%
45%

Improving Special Education Services in the Detroit Community School District
Council of the Great City Schools Page 49
state cap of 1.0 percent in the number of participating students. A state may not pass on this cap to
LEAs and prohibit them from assessing more than 1.0 percent of its students using an alternate
assessment. However, LEAs exceeding this participation rate must provide justification for this
outcome, and states must publish the LEA’s justification and provide oversight to LEAs that
exceed the 1.0 rate.
Based on data MDE collected from spring 2017 assessments, the current rate of Michigan
students taking an alternate assessment is 2.4 percent in ELA, 2.4 percent in math, and 2.3 percent
in science. As allowable under ESSA, MDE asked the U.S. Department of Education to waive the
1.0 percent cap for the state’s 2018 assessments. The waiver is required to:
• Demonstrate that Michigan has tested at least 95 percent of all students and 95 percent of
students with disabilities across all summative assessments; and
• Provide assurances that LEAs contributing to the state’s exceeding the 1.0 percent cap have
adhered to MDE’s participation guidelines and address any disproportionality in any sub-group
of students taking the alternate assessment.
DPSCD Practice
MDE’s 2015-16 report for the district showed that fewer than 95 percent of students with
IEPs participated in the statewide assessment in the prior school year (92.39 percent for ELA and
90.65 percent for math).56 Furthermore, according to data MDE provided to the Council team, the
district significantly exceeded the 1.0 percent rate for students using an alternate assessment (5.8
percent in ELA, 5.7 percent in math; and 5.5 percent in science.) As a result, district IEP teams
will likely be monitored to determine their adherence to MDE’s alternate assessment participation
guidelines and the district may have to address any disproportionality by student subgroup.
Although some students may be from other districts who attend DPSCD’s specialized programs,
the number is not likely to substantially reduce the percentage of students taking an alternate
assessment.
Educational Settings for Students with Disabilities
Research has consistently shown a positive relationship between inclusive instruction and
better outcomes for students with disabilities, including higher academic performance, higher
likelihood of employment, higher participation rates in postsecondary education, and greater
integration into the community. The 10-year National Longitudinal Transition Study-2 (NLTS 2)
described the characteristics, experiences, and outcomes of a nationally representative sample of
more than 11,000 youth ages 13 through 16 who were receiving special education services in grade
seven or above when the study began in 2001. The study found that, while more time spent in
general education classrooms was associated with lower grades for students with disabilities
compared to their non-disabled peers, students who spent more time in general settings were closer
to grade level on standardized math and language tests than were students with disabilities who
spent more time in separate settings.57 Research also shows that including students with a range of
56 Retrieved from MDE Special Education Public Reporting – Indicator Report Summary. 57 Review of Special Education in the Houston Independent School District, Thomas Hehir & Associates Boston,
Massachusetts, page 25, retrieved at

Improving Special Education Services in the Detroit Community School District
Council of the Great City Schools Page 50
disabilities in general education classes did not affect the achievement of their non-disabled
peers.58
Similar results were found in a comprehensive study of school districts in Massachusetts.
There, students with disabilities who were in full-inclusion settings (80 percent or more of the
school day in general education classrooms) appeared to outperform similar students who were
not included to the same extent in general education classrooms with their non-disabled peers. On
average, these students earned higher scores on the statewide assessment (MCAS), graduated high
school at higher rates, and were more likely to remain in their local school districts longer than
students who were educated in substantially separate placements 40 percent or less of the day in a
general education classroom. These findings were consistent across elementary, middle, and high
school years, as well as across subject areas.59
MDE’s systemic improvement plan reinforces the importance of effective general
education and supports in improving educational outcomes for students with disabilities.
[S]tudents with [IEPs] need a high-quality general education environment in order
to succeed. Special education can provide effective support services; however, this
is in combination with a general education environment that successfully addresses
various needs of all learners through a differentiated response system.60
The SPP tracks students educated in one of three educational settings and sets targets for
each: (1) in general education 80 percent or more of the day, (2) in general education less than 40
percent of the day, i.e., in separate classes, and (3) separate schools. States are expected to collect
data on a fourth educational setting (in general education between 79 percent and 40 percent of the
time), but the SPP indicator does not monitor this setting.
Comparison of Rates for District, State, and Nation
Data in exhibit 3h show the composition of district students with IEPs in the four
educational settings in 2017-18. Data compare DPSCD with Wayne RESA, Michigan, and national
rates.61
• In General Education At least 80 Percent of the Time. The district’s 54 percent rate for
students in this setting is 8 percentage points lower than the state target, and lower than
http://www.houstonisd.org/cms/lib2/TX01001591/Centricity/Domain/7946/HISD__Special_Education_Report_201
1_Final.pdf. 58 See A. Kalambouka, P. Farrell, A. Dyson, & I. Kaplan. (2007, December). The impact of placing pupils with
special educational needs in mainstream schools on the achievement of their peers. Educational Research, 49(4),
365–382. 59 Thomas Hehir & Associates (2014, August) Review of Special Education in the Commonwealth of
Massachusetts: A Synthesis Report, Boston, Massachusetts, retrieved at http://www.doe.mass.edu/sped/hehir/2014-
09synthesis.pdf 60 Retrieved from apr-2013b-mi-indicator17-compiled-with-appendices-biblio-bkmrks-phasei.pdf at page 6. 61 State, Wayne RESA, and DPSCD 2016-17 rates were retrieved from MI School Data at
https://www.mischooldata.org/SpecialEducationEarlyOn2/DataPortraits/DataPortraitsSummary.aspx?Common_Loc
ations=1-
D,1078,119,0&Common_SchoolYear=18&Common_SpecEdReportCategory=EducationalSetting6to21&Common_
SpecEdTestingGroup=GenEd80. National data were retrieved from 2016-17 Part B Child Count and Educational
Environments (Nov. 1, 2017) at https://www2.ed.gov/programs/osepidea/618-data/static-tables/index.html#partb-cc.

Improving Special Education Services in the Detroit Community School District
Council of the Great City Schools Page 51
Wayne RESA, the state, and the nation (70 percent, 67 percent, and 63 percent, respectively).
• In General Education Between 40 and 79 percent of the Time. The district’s 7 percent rate
for this setting is close to Wayne RESA and lower than the state and nation (15 percent and
18 percent, respectively). There is no state target for this environment.
• In General Education Less than 40 Percent of the Time. Generally considered to be a self-
contained special education class setting, the district’s 27 percent rate is 17 percentage points
higher than the state target, Wayne RESA, the state average, and the national average (14.3
percent, 10.9 percent, and 13.4 percent, respectively). When excluding students from other
districts who attend DPCSD, DPCSD’s rate increases slightly to 28 percent.
• Separate Schools. The district’s 12 percent of students with disabilities who attended separate
schools is 8 percentage points higher than the state level, and higher than Wayne RESA, the
state, and the national average (18 percent, 13 percent, and 3 percent, respectively). Excluding
students from other districts, DPSCD’s rate decreases to 9 percent.
Exhibit 3h. Percentage of Students by Educational Setting (2016-17)
Based on 2016-17 data, MDE notified the district in a May 15, 2017 letter that the district’s
percentages of students in various educational settings did not meet state thresholds. Although the
state did not require any immediate action, the letter indicated that the district’s data for the 2017-
18 school would be reviewed. If DPSCD continues to have data that does not meet established
state targets, MDE indicated that the district may be scheduled for a monitoring visit later. State
representatives indicated that MDE was expecting RESA to become more active in executing its
oversight responsibilities in monitoring school districts receiving IDEA and state funds through
the intermediate school district.
Educational Setting Rates by Grade
Data in exhibit 3i show that the percentage of secondary grade students educated in separate
classes (in general education less than 40 percent of the time) decreases from 37 percent (grade 8)
to 21 percent (grade 12). The percentage of students in separate center schools increases from 6
percent (grade 8) to 19 percent (grade 12). A relatively small percentage of students are educated
in general education classes between 40 percent and 79 percent of the time. As shown in exhibit
3j, one would expect that a higher proportion of students would be served in the 40 to 79 percent
At Least 80% of Time 40% to 79% of TimeLess than 40% of
TimeSeparate Schols
DPSCD 54% 7% 27% 12%
Wayne RESA 70% 8% 14% 6%
State 67% 15% 11% 5%
State Target 62% 10% 4%
Nation 63% 18% 13% 3%
0%
20%
40%
60%
80%

Improving Special Education Services in the Detroit Community School District
Council of the Great City Schools Page 52
setting compared to state and national rates. No discernable pattern exists in the least restrictive
environment (general education at least 80 percent of the time), which has higher percentages at
both lower and upper grades.
• General Education At least 80 Percent of the Time. Rates begin to decrease from first grade’s
67 percent to 48 percent in grade 8. The rates then increase at the secondary grade level from
55 percent (grade 9) to 69 percent (grade 11).
• General Education Between 40 and 79 percent of the Time. Rates increase from first grade’s
2 percent to 19 percent in grade 8. At the secondary grade level, the rates decrease from 8
percent (grade 9) to 3 percent (grade 12).
• General Education Less than 40 Percent of the Time. Rates increase from 29 percent (grades
1 and 2) to 37 percent (grade 8). At the secondary grade level, the rates decrease from 25
percent (grade 9) to 21 percent (grade 12).
• Separate Schools. Rates increase through the elementary school grades, from 2 percent
(kindergarten) to 6 percent (grade 8). The rate jumps to 12 percent (grade 9) and to 19 percent
(grade 12, which includes students remaining in school for secondary transition services).
Exhibit 3i. Percentage of Students by Grade and by Educational Setting
Educational Setting Rates by Disability Areas
Data in exhibit 3j show the percentages of district students with IEPs in six major disability
areas and severe multiple impairments (SXI) by educational setting. In the area of speech/language
impairments, 99 percent of students were educated in general education classes at least 80 percent
of the time. Only two other disability areas, specific learning disabilities and other health
impairments, show more students educated inclusively in this setting (76 percent and 75 percent,
respectively). Students with autism, cognitive impairment, and severe multiple impairment are
educated outside of general education most of the school day.
• General Education At least 80 Percent of the Time. Students with a specific learning disability
and other health impairment spend the most time in this setting (76 percent and 75 percent,
1 2 3 4 5 6 7 8 9 10 11 12
Separate Schools 2% 3% 5% 4% 4% 7% 6% 6% 12% 7% 11% 19%
GenEd < 40% 29% 29% 33% 30% 35% 34% 36% 37% 25% 21% 17% 21%
GenEd 40%-79% 2% 6% 7% 10% 10% 10% 8% 10% 8% 5% 3% 3%
GenEd > 79% 67% 62% 55% 57% 50% 49% 50% 48% 55% 67% 69% 57%
0%
10%
20%
30%
40%
50%
60%
70%
80%
90%
100%

Improving Special Education Services in the Detroit Community School District
Council of the Great City Schools Page 53
respectively). They are followed by students with an emotional impairment (45 percent). Rates
for students with autism, cognitive impairments, and severe multiple impairments are 17
percent, 9 percent, and 0 percent, respectively.
• General Education Between 40 and 79 percent of the Time. Small percentages of students
spend their time in this environment, ranging from 12 percent (specific learning disability) to
0 percent (and severe multiple impairment).
• General Education Less than 40 Percent of the Time. Disability categories with the largest
rates of students with IEPs educated in separate classes are autism and cognitive impairment
(63 percent and 62 percent, respectively). Emotional impairment has the next highest rate (47
percent). Students with a specific learning disability, other health impairment, or severe
multiple impairment have the smallest rates (12 percent, 15 percent, and 3 percent,
respectively.
• Separate Schools. With a rate of 97 percent, almost all students with severe multiple
impairments are educated in separate schools or centers. Other students educated in this
restrictive setting are those with autism and cognitive impairments (6 percent and 14 percent,
respectively). Note that while some students with emotional impairments attend one of the
district’s two therapeutic day schools, district data did not include numbers for these students.
Exhibit 3j. Percentages of Students by Disability and Educational Setting
Educational Setting Rates by Race/Ethnicity
Data on the four educational settings by race/ethnicity are shown below (exhibit 3k). Risk
ratio data by race/ethnicity are shown in Exhibit 3l.
By Percentages of Students
The following summarizes the percentages of students with IEPs by race/ethnicity in each
of the three SPP-measured educational settings.
• General Education At least 80 Percent of the Time. Compared to 54 percent of all students
with IEPs, Hispanic students are educated in this setting at a higher rate (67 percent), and
Arabic students at a much lower rate (14 percent).
SLD OHI EI ASD CI SXI
Sep School 0% 0% 0% 14% 6% 97%
<40% 12% 15% 47% 63% 62% 3%
40%-79% 12% 9% 8% 5% 3% 0%
>79% 76% 75% 45% 17% 9% 0%
0%
20%
40%
60%
80%
100%

Improving Special Education Services in the Detroit Community School District
Council of the Great City Schools Page 54
• General Education Less than 40 Percent of the Time. Compared to 27 percent of all students
with IEPs, Arabic students are educated in this setting at a higher rate (34 percent), and
Hispanic students at a much lower rate (18 percent)
• Separate Schools. Compared to 12 percent for all students with IEPs, Arabic students are
educated in this setting at a much higher rate (51 percent), and Hispanic students at a much
lower rate (5 percent).
Exhibit 3k. DPSCD Educational Settings by Percentages of Students by Race/Ethnicity
By Risk Ratios
With one exception, students with IEPs from one racial/ethnic group are not more likely to
be placed in any educational settings than other students with IEPs. The exception is for Arabic
students, who are 4.43 times more likely than all others to receive instruction in a separate school.
Exhibit 3l. DPSCD Educational Settings by Risk Ratios
To determine the extent to which out-of-district Arabic students affected their
disproportionately high placement rates in special schools, we calculated district data without these
Gen Ed At Least80%
Gen Ed 40%-79% Gen Ed <80% Special School
Black 53% 6% 29% 12%
White 44% 8% 29% 19%
Hispanic 67% 10% 18% 5%
Arabic 14% 2% 34% 51%
All 54% 7% 27% 12%
0%10%20%30%40%50%60%70%
0%10%20%30%40%50%60%70%
Black White Hispanic Arabic
Gen Ed At lLeast 80% 0.88 0.81 1.27
Gen Ed 40%-79% 0.56 1.23 1.48
Gen Ed <80% 1.56 1.05 0.66 1.22
Special School 1.16 1.65 0.16 4.43
0.0
0.5
1.0
1.5
2.0
2.5
3.0
3.5
4.0
4.5

Improving Special Education Services in the Detroit Community School District
Council of the Great City Schools Page 55
students. Overall, 21 of 59 Arabic students are from other districts. Among DPSCD’s Arabic
students who reside in the district, 36 percent are educated in special schools; and they are 3.9
times more likely than other students with IEPs to be educated in this setting. Thus, although their
risk ratio was lower than the 4.43 figure that includes these students, their placement risk continued
to be high. The team understands that center-based programs attract families, so the rates may be
elevated for that reason.
Suspension and Expulsion Rates
Another critical issue that affects the achievement of students with disabilities is time out
of school due to suspensions. Indicator 4 of the state performance plan measures out-of-school
suspensions for more than 10 days, as well as suspensions of students with disabilities by
race/ethnicity. Under U.S. Department of Education’s regulation, which is supposed to go into
effect in the 2018-19 school year (but may be postponed), significant disproportionality is to be
measured (using a risk ratio and alternate risk ratio for small cell numbers) on:
• Out of school suspensions (OSS) of 1-10 days, and more than 10 days;
• In-school suspensions (ISS) of 1-10 days, and more than 10 days;
• Removals to an interim alternative education setting; and
• Removals by a hearing officer.
The information below summarizes OSSs for students with and without IEPs. The district
did not provide requested data on ISSs.
Out-of-School Suspensions
The information below for 2017-18 describes the district’s OSSs by grade and by
race/ethnicity for students with and without IEPs for periods of 1-10 days and more than 10 days.
In each category, students with IEPs were suspended at rates that were higher than students without
IEPs, and the rates increased significantly at seventh grade. Also, African American students with
IEPs had suspension rates and risks of suspension far higher than other students with IEPs. In
addition, focus group participants reported that they thought suspensions were being under-
reported because some students were being sent home “unofficially” and not recorded.
Number of OSS Days (Percentages and Disability Risk Ratios)
Data in exhibit 3m shows the percentage of students with and without IEPs who received
an OSS for 1 to 5 days, 6 to 10 days, and more than 10 days. Small percentages of both groups
received an OSS for more than five school days. Compared to students without IEPs, larger
percentages of students with IEPs have suspensions of 1 to 5 days (55 percent to 33 percent,
respectively). Using a risk ratio, students with disabilities were not any more likely than their
typical peers to receive an OSS for any number of days. The highest risk among students with
disabilities (1.67) was for OSSs (consecutive or cumulative) of less than six school days.

Improving Special Education Services in the Detroit Community School District
Council of the Great City Schools Page 56
Exhibit 3m. Percentage of OSS for Students with IEPs and without IEPs (1-10 Days)
Number of OSSs by Grade and Length
Data in exhibit 3n show the number of OSSs from 1 to 5 and over 10 school days for
students with and without IEPs. Figures for OSSs of 6 to 10 days are not shown since they are
small: 13 for students with IEPs – with more high school students (8) than elementary school
students (5); 65 students without IEPs – with more for high school students (66) than elementary
school students (23).
• OSSs of 1 to 5 Days
- IEP. OSSs increase from kindergarten to sixth grade, and then taper off through high
school.
- No IEP. OSSs increase from kindergarten through eighth grade, and then begin to taper
off in ninth grade.
• OSS of More than 10 Days. The pattern among students with and without IEPs is more
similar for OSSs of more than 10 days. Among both groups of students, suspensions increase
from kindergarten, reach their highest numbers in grade 8, and then steadily decrease through
high school.
Exhibit 3n. Number of OSSs by Grade for Students With/Without IEPs
1 - 5 Days 6 - 10 Days More than 10 Days
% of IEP Suspended 55% 0.20% 1.00%
% No IEP Suspended 33% 0.21% 0.84%
Disability Risk Ratio 1.67 0.73 1.14
0
0.5
1
1.5
2
0%
10%
20%
30%
40%
50%
60%
K 1 2 3 4 5 6 7 8 9 10 11 12
IEP 1-5 33 126 195 334 350 414 541 565 608 456 367 212 139
NO IEP 1-5 221 603 1130 1434 1319 1534 1888 1540 1482 1145 826 550 506
NO IEP >10 1 3 15 18 21 22 28 44 60 58 46 23 21
IEP >10 0 0 1 1 5 5 2 9 17 10 12 9 4
0
10
20
30
40
50
60
70
0
200
400
600
800
1,000
1,200
1,400
1,600
1,800
2,000

Improving Special Education Services in the Detroit Community School District
Council of the Great City Schools Page 57
OSSs by Race/Ethnicity Percentage and Risk Ratio
Data in exhibit 3o show OSSs among students with disabilities by length of suspension,
race/ethnicity, and risk ratios by race/ethnicity. Cells without data had very low numbers.
With 52 percent of all black students with IEPS suspended for 1 to 10 days, these students
were 2.59 times more likely than other students with IEPs to be suspended for this period. Of all
black students with IEPs, 0.9 percent were suspended for more than 10 days, and they were 1.91
times more likely than others to receive an OSS for this length of time. Among all 72 OSSs in this
time category, the breakdown was: 32 for 11-20 days; 28 for 21-to-30 days; 1 for 41-50 days; and
2 for 151-200 days.
Percentages and risk ratios for other student groups with OSSs of 1 to 10 days were:
• Hispanic Students. 45 percent suspended, with a risk ratio of 0.29
• White Students. 15 percent suspended with a risk ratio of 0.93
• Other Students. 16 percent suspended with a risk ratio of 0.32
Exhibit 3o. OSS Race/Ethnic Risk Ratios for Students with IEPs
Focus Group Participant Feedback
There were numerous concerns that school personnel do not meet all procedural
requirements for students who are removed from school or class for disciplinary reasons, e.g.
tracking removals appropriately, tracking number of days removed, convening manifestation
determination meetings, etc. Participants told the team about a promising new initiative involving
15 schools with emotional impairment programs that would support students’ social/emotional
needs. The district’s two behavior specialists were assisting with this initiative.
Academic Instruction, Intervention, and Supports
A fundamental goal of the common core state standards (CCSS) was to create a culture of
high expectations for all students. In a statement on the application of the common core to students
with disabilities, the CCSS website includes a visionary statement that reinforces this intent:
Students with disabilities … must be challenged to excel within the general
curriculum and be prepared for success in their post-school lives, including
Black Hispanic White Other
Percentage 1 - 10 Days 52% 45% 15% 16%
Percentage >10 Days 0.9%
Risk Ratio 1 - 10 Days 2.59 0.29 0.93 0.32
Risk Ratio >10 Days 1.91
00.511.522.53
0%
10%
20%
30%
40%
50%
60%
Ris
k R
atio
Per
cen
tage

Improving Special Education Services in the Detroit Community School District
Council of the Great City Schools Page 58
college and/or careers.” These common standards provide historic opportunity to
improve access to rigorous academic content standards for students with
disabilities.62
The statement underscores the supports and accommodations that students with disabilities
need to meet high academic standards and fully demonstrate their conceptual and procedural
knowledge and skills in ELA (reading, writing, speaking, and listening) and mathematics. These
expectations for students with disabilities include the following elements:
• Instruction and related services designed to meet the unique needs of students with disabilities
and enable them to access the general education curriculum.
• Teachers and specialized instructional support personnel who are prepared and qualified to
deliver high-quality, evidence-based, and individualized instruction and support.
• Instructional supports for learning that are based on the principles of universal design for
learning (UDL), which foster student engagement by presenting information in multiple ways
and allowing diverse avenues of action and expression.63
• Instructional accommodations that reflect changes in materials (e.g., assistive technology) or
procedures that do not change or dilute the standards but allow students to learn within the
CCSS framework.
The general education curriculum refers to the full range of courses, activities, lessons, and
materials routinely used by the general population of a school. Students with disabilities have
access to this curriculum when they are actively engaged in learning the content and skills that are
being taught to all students. To participate with success in the general curriculum, a student with
a disability may need additional services, such as instructional supports, accommodations,
scaffolding, assistive technology, and other services. With a universal design for learning (UDL)
approach, information is presented in varied ways, allowing multiple avenues of learning and
expression.
When special educators teach students from multiple grades in a single self-contained class,
it is difficult for them to focus on each grade’s content standards with any depth or effectiveness.
When schools are organized in an inclusive manner, on the other hand, they are better able to
support students with various disabilities and enable them to attend the school they would
otherwise attend if not disabled. This model enables more students with disabilities to attend
schools in their community, supports a more natural distribution of students with disabilities at
each school, and reduces transportation time and costs. Still, general education instruction must be
meaningful for students with disabilities, and their presence in the classroom, alone, is insufficient
to make it so.
62 Retrieved at http://www.corestandards.org/assets/application-to-students-with-disabilities.pdf. 63 UDL is defined as “a scientifically valid framework for guiding educational practice that (a) provides flexibility in
the ways information is presented, in the ways students respond or demonstrate knowledge and skills, and in the
ways students are engaged; and (b) reduces barriers in instruction, provides appropriate accommodations, supports,
and challenges, and maintains high achievement expectations for all students, including students with disabilities
and students who are limited English proficient.” by Higher Education Opportunity Act (PL 110-135). See the
National Center on Universal Design for Learning at http://www.udlcenter.org/.

Improving Special Education Services in the Detroit Community School District
Council of the Great City Schools Page 59
Instruction and Specialized Support for Students in General Education Classes
The U.S. Department of Education and the states collect data on the two educational
environments in which students are instructed in general education classes nearly half of the school
day: at least 80 percent of the time and between 79 percent and 40 percent of the time. (See exhibits
3n and 3o, respectively). Overall, a smaller percentage of students in Detroit are educated in one
of these inclusive environments than is the average across the state or nation (58.8 percent, 67.5
percent, and 82.1 percent, respectively).
General Education At Least 80% Of the Time
A higher percentage of district students are educated in this setting in two disability
categories compared to others: specific learning disability (76 percent) and other health
impairment (75 percent). 64 In addition, a higher percentage of students with an emotional
impairment are educated in this setting compared to the state and national averages (45 percent,
15 percent and 19 percent, respectively). (See exhibit 3p.)
Conversely, a lower percentage of district students who have a hearing impairment (41
percent, 70 percent, and 62 percent), autism (17 percent, 45 percent, and 40 percent, respectively),
a severe multiple impairment (0 percent, 30 percent, and 48 percent), and a cognitive impairment
(9 percent, 15 percent, and 17 percent, respectively) are educated inclusively compared to state
and national averages.
Exhibit 3p. General Education At Least 80 percent of the Time
General Education Between 79 Percent and 40 Percent of the Time
Generally, DPSCD students are instructed in general education classes between 79 percent
and 40 percent of the time at lower rates than students across the state and nation. The only
exception is among students with a hearing impairment (20 percent, 13 percent, and 16 percent,
respectively). (See exhibit 3q.)
64 Almost all students with a speech/language impairment are educated in general education classes at least 80
percent of the time.
SLD OHI EI HI ASD CI SXI
DPSCD 76% 75% 45% 41% 17% 9% 0%
State 77% 73% 15% 70% 45% 15% 30%
Nation 72% 68% 19% 62% 40% 17% 48%
0%
20%
40%
60%
80%
100%

Improving Special Education Services in the Detroit Community School District
Council of the Great City Schools Page 60
Exhibit 3q. In General Education Between 79 Percent and 40 Percent of the Time
Resource Support
Except for students receiving speech/language services only, students educated half the
time or less outside of a specialized program generally receive resource services. Data in Exhibit
3r show the number of resource classes in schools by school grade level and in application high
schools. Every school has at least one resource class and one high school has 11 classes.
• Elementary Grades. With 91 classes, these schools have from one to four resource classes
each.
• Elementary and Middle Grades. With 21 classes, these schools have either one or two classes.
• High Schools. With 82 classes, these schools have from 1 to 11 classes each.
• Application High Schools. With 14 classes, two schools each have 1 class, one school has 2
classes, and one school has 10 classes.
Exhibit 3r. Number of Resource Classes by Most Common Grade Level and School Types
HI SLD OHI EI ASD CI SXI
DPSCD 20% 12% 9% 8% 5% 3% 0%
State 13% 22% 21% 18% 18% 27% 18.0%
Nation 16% 19% 19% 17% 16% 23% 2%
0%
10%
20%
30%
Elementary El & Middle High School Application HS
Resource 91 21 82 14
0
10
20
30
40
50
60
70
80
90
100

Improving Special Education Services in the Detroit Community School District
Council of the Great City Schools Page 61
Students from Other Districts Attending DPSCD Resource Classes
Data provided by DPSCD show that 188 (42.6 percent) students from other districts receive
resource special education services in district schools. The Council team assumes that these
students attend district schools under the state’s school choice program and not because their home
districts’ have no appropriate services for them.65
Instruction for Students in Specialized Programs
School districts that operate without an MTSS framework often organize special education
by programs predicated on a theory of “specialization” that students with common characteristics
can be matched to a specific program. In reality, such programs often include students with a large
range of achievement and behavior, as well as students with characteristics that fall between
program types. Such specialization can sometimes perpetuate the myth that student needs can be
addressed fully with correct program matches based upon a prescribed set of characteristics. If a
student is failing, then it is presumed to be because he or she is simply in the wrong program, so a
new one is sought to provide a better fit. In such circumstances, there is pressure to create more
specialized and categorical programs rather than creating a broad framework for general-education
instruction and behavioral supports based on student need.
Configuration of DPSCD Specialized Programs
The district has numerous specialized programs. Programs on which the district provided
data included autism spectrum disorder (ASD), emotional impairment (EI), cognitive/emotional
impairment (EI/CI) dual diagnosis, hearing impairment (HI), mild cognitive impairment (MICI),
moderate cognitive impairment (MOCI), physical impairment or other health impairment (POHI),
physical impairment (PI), severe cognitive impairment (SCI), severe multiple impairment (SXI),
specific learning disability (SLD), visual impairment (VI), and older students work skills and
project search. In addition, DPSCD has a day treatment program, but the district did not report
data. In addition, DCPSD operates an early intervention program for children birth through two
years of age, and early childhood special education (ECSE) for children three through five years
of age.
DPSCD’s categorical program delineations are based on Michigan Administrative Rules
for Special Education (MARSE), which contain descriptions of these programs along with
requirements for the maximum number of students per special educator and paraprofessional.
Several DPSCD’s programs are operated in coordination with Wayne RESA to meet obligations
under Michigan’s Act 18. These coordinated activities include ASD, day treatment, CI/EI dual
diagnosis, HI, MOCI, POHI, SCI, SXI, VI, Early Intervention (birth to 3) and Work Skills. DPSCD
has written descriptions of each program, along with entrance and exit criteria.
Unlike other school districts that the Council team has reviewed, Detroit’s configuration
of services appears to be unduly categorical, referencing disability areas rather than common
student needs. The team was told by interviewees that students with various disabilities may be
educated in a program having a different disability name, but there is no state mandate requiring
65 The data system does not differentiate between students from other districts attending DPSCD because of choice
or pursuant to Wayne RESA’s regional plan.

Improving Special Education Services in the Detroit Community School District
Council of the Great City Schools Page 62
program labels to be categorical in nature. Any changes would require coordination with Wayne
RESA.
Impact on Transportation
Some 40 percent of students with IEPs, or 3,398 students, are provided door-to-door
transportation. This rate is affected by several factors, including the placement of specialized
programs in schools that agree to host them. Also, the district has not used a protocol or decision
tree to guide IEP transportation decisions on whether a student requires door-to-door service.
Students can be on a bus for 1.5 hours each way, and the team was told in focus groups
that it can take one to five days--and as many as 10 days--to execute a new transportation route.
There were varying reasons given for delayed transportation routes. Delays may occur because
school personnel do not exit a student in a timely manner. Delays may also occur in entering
student information into the transportation system. If parents are unable to transport their child to
a new school before the bus route is initiated, the student remains at home. Reportedly, this process
sometimes takes weeks to resolve.
Specialized Programs in Regular Schools
Data in exhibit 3s shows the percentages of students receiving instruction in general
education classes less than 40 percent of the time. DPSCD educates a higher percentage of students
in this setting compared to state and national averages in every disability category – except for
severe multiple impairment (almost entirely educated in special schools) and emotional
impairment (no data provided for day treatment programs.)
Exhibit 3s. Education in General Education Classes Less Than 40 Percent of the Time
Number of Specialized Classes by Regular School Grade Level
Data in exhibit 3t show the number of regular schools having between zero and 13
specialized classes by school type. Generally, having numerous specialized classes negatively
affects a principal’s ability to support the provision of intensive educational/related service needs,
the coordination of transportation services, and other services
ASD CI EI HI OHI SLD SXI
DPSCD 63% 62% 47% 35% 15% 12% 3%
State 27% 44% 68% 10% 7% 3% 1%
Nation 34% 50% 49% 12% 9% 5% 14%
0%
20%
40%
60%
80%

Improving Special Education Services in the Detroit Community School District
Council of the Great City Schools Page 63
• Elementary and Middle School Grades. Twenty schools have no specialized classes; 7 schools
have 1 class; 15 schools have 2 classes; 9 schools have 3 classes; 8 schools have 4 classes; and
5 schools have between 5 and 13 classes.
• High Schools. Six schools have no specialized classes; 3 have one class; 2 have two classes;
1 school has three classes; 4 schools have 4 classes; and 2 schools have 8 and 9 classes,
respectively.
Exhibit 3t. Number of Specialized Classes by Regular School Grade Level
Number of Specialized Programs by Type of Program
Data in exhibit 3u show the number of specialized programs by type. The most common
programs were MICI, ASD, and SLD with 76, 70, and 61 classes, respectively. Programs with 27
to 23 classes included SXI, MOCI, EI and Work Skills. Areas with the smallest number of classes
were SCI, PI, VI and Project Search--a total of 16 classes among them. The large proportion of
specialized program classes for SLD is among the highest of other urban districts the Council team
has reviewed.
Exhibit 3u. Number of Specialized Programs by Type of Program
0 1 2 3 4 5 6 7 8 9 13
ELementary 8 1 6 1 2
Elementary & Middle 12 6 9 8 6 5 2 1 1 1
High School 6 3 2 1 4 1 1
0
2
4
6
8
10
12
14
MICI ASD SLD SXI MOCI EIWorkSkills
HI POHI SCI PI VI
Project
Search
Total Classes 76 70 61 27 27 24 23 15 11 7 4 4 1
0
10
20
30
40
50
60
70
80

Improving Special Education Services in the Detroit Community School District
Council of the Great City Schools Page 64
Students in Specialized Programs from Other Districts
Students from outside Detroit attend DPSCD’s specialized programs for various reasons.
Some have IEPs for specialized programs that according to the Wayne RESA plan provide for
placement in DPSCD. Others have parents that choose to have their students in the district under
the state’s school-choice program. Reportedly, the district’s data system does not distinguish
between these two reasons. Data in exhibit 3v show the number of students living out-of-district
by program. These figures show that most students are educated in the following programs:
moderate cognitive impairment (24 students), mild cognitive impairment (22), autism, emotional
impairment and severely multiple impairment (19 each) and learning disabilities (17). Specialized
programs of 10 or less include early intervention, early childhood, severe cognitive impairment,
hearing impairment and physical impairment.
Exhibit 3v. Number of Students in Specialized Programs from Other Districts
Specialized Programs by School Types
Data in exhibit 3w show the number of specialized programs by school type. Overall, the
district operates some 300 specialized classes. The following are notable configurations.
• SLD. Thirty-one classes are at schools with elementary and middle school grades. Although
the Council team was told that SLD classes are phased out at the high school level, data
reported 15 classes at this level. According to district information, the SLD program is
typically for students with high incident disabilities (SLD, EI, OHI) who require direct
instruction services in all four core curricular areas.
• EI. This program is offered only at schools with elementary and middle school grades, and at
special centers, which have 10 classes. No such classes are offered in regular high schools.
• SXI, SCI, Work Skills, and Project Search. These specialized programs are offered only at
center schools. Although it is common for other school districts to house postsecondary
transition programs for older youth in developmentally appropriate environments outside of
regular high schools, it is not common that classes for severe multiple impairment and severe
cognitive impairment programs be offered only in center schools.
• PI and POHI. There are 14 classes in this category at the elementary and middle school level,
but no classes are offered at the high school level.
• Examination Schools. Only one specialized program class (ASD) is offered at the four high
schools having an examination requirement.
MOCI MICI ASD EI SMI LD EI EC SCI HI PI
Number 24 22 19 19 19 17 10 9 7 9 4
0
5
10
15
20
25

Improving Special Education Services in the Detroit Community School District
Council of the Great City Schools Page 65
Exhibit 3w. Number of Specialized Programs by School Types
Percentage of Students with IEPs by School Type
Large variations in specialized classes produce large variances in percentages by school in
students with IEPs. As data show in exhibit 3x, the percentage of students with IEPs by school
varies from 1 percent to 56 percent.
• Overall Percentage of Students with IEPs. Schools with only middle grades have the highest
percentages of students with IEPs (25 percent), followed by high schools (20 percent),
elementary/middle grades (14 percent), and elementary grades (13 percent).
• Percentage Ranges. High schools have the widest range of percentages, ranging from 3
percent to 56 percent. Schools with elementary grades and elementary/middle school grades
have comparable rates, ranging from 7 percent to 26 percent, and 5 percent to 28 percent,
respectively. The range among schools with only middle grades and examination high schools
is also wide. There are four schools with middle grades, two having rates of 3 percent and 4
percent, and two schools with rates of 25 percent and 29 percent. Similarly, two of four
examination high schools have rates of only 1 percent each, and two have rates of 12 percent
and 15 percent. As mentioned above, high disability rates have an impact on students with IEPs
and the school community at large.
Exhibit 3x. Number of Schools by Type, and by School Type: Percentage of Students with IEPs,
High Percentage and Low Percentage
ASD MICI SLD SXI MOCI EI HI POHI SCI PI VIWORKSKILLS
ProjectSearch
Elementary (N=138) 33 34 25 0 6 13 11 10 0 4 2 0 0
El & Middle (N-24) 5 11 6 0 0 1 0 1 0 0 0 0 0
High School (N-43) 8 15 15 0 2 0 2 0 0 0 1 0 0
MS & HS (N-2) 2 0 0 0 0 0 0 0 0 0 0 0 0
Examination HS (N-1) 1 0 0 0 0 0 0 0 0 0 0 0 0
Special Center (N=99) 13 1 0 27 17 10 0 0 7 0 0 23 1
05
101520253035
Nu
mb
er o
f C
lass
es
EL El-MS MS HS Examination Special
Number Schools 17 49 4 19 4 7
% IEPs 13% 14% 25% 20% 4% 100%
High % 26% 28% 29% 56% 17%
Low % 7% 5% 3% 3% 1%
0%10%20%30%40%50%60%70%80%90%100%
05
101520253035404550

Improving Special Education Services in the Detroit Community School District
Council of the Great City Schools Page 66
Percentage of Students with IEPs Enrolled in Examination and Application Schools
Examination high schools and application schools generally have disproportionately low
percentages of students with IEPs and specialized programs. This means that most students having
IEPs are placed into a specialized program and are unable to access these schools, making their
options very limited.
As previously mentioned, two examination schools (Cass Technical and Renaissance) have
only 1 percent of their students with IEPs. The two others (King and Southeastern) have rates of
17 percent and 13 percent. King has only one specialized program (ASD).
Data in exhibit 3y on the district’s 18 application schools show the percentages of students
with IEPs and the numbers of specialized programs in each school. These figures show IEP rates
that generally range from 3 percent to 16 percent. 66 Two schools have rates of 25 percent.
However, one of these schools (Ludington Magnet) has an honor’s program with only 4 percent
students with IEPs while the Ludington magnet school’s rate is 29 percent. Although all the
schools have resource services, 11 (61 percent) have no specialized programs. The remaining 7
schools have a total of 16 specialized programs (1 for SLD, 5 for ASD, 4 for MICI, 1 for MOCI,
2 for POHI, 2 for HI, and 1 for VI). One school has 1 class; three have 2 classes; and two each
have 3 and 4 classes.
Exhibit 3y. Percentage of Students with IEPs for Application Schools
Case Study
As a case study, the school with the largest percentage of students with IEPs is the Detroit
Institute of Technology at Cody, which is one of three small schools at the facility. Overall, 56
percent of the school’s students have IEPs, which includes attendance in one of five specialized
classes for students with cognitive impairments. When examining rates in grades 9, 10, 11, and
12, one sees that the figures are even more disproportionate (59 percent, 55 percent, 45 percent,
and 62 percent). Rates in the 12th grade include students participating in postsecondary transition
66 Data was not available for the number and percent of students with IEPs at Randolph High School CTC.
0
9…
7%
7…
13%
10%
3…3%
12% 11%
16%
5%9%
1…
25% 25%
14%
8%
0 0
2
0 0 0 0 0 01
2
0
2 2
3
4
0 0 0
1
2
3
4
5
0%
5%
10%
15%
20%
25%
30%
# Sp
ecia
lized
Pro
gram
s
% IE
Ps
% IEPs # Specialized Programs

Improving Special Education Services in the Detroit Community School District
Council of the Great City Schools Page 67
services and activities. By comparison, the other Cody high schools have high but somewhat
smaller rates. Cody Medicine/Community Health school’s overall rate is 29 percent, but by grade
is 19 percent, 40 percent, 29 percent, and 28 percent; the Cody Public Leadership school’s overall
rate is 26 percent, and by grade is 26 percent, 31 percent, 11 percent, and 28 percent. Focus group
feedback suggests that this inequitable enrollment of students with IEPs at Cody could be
addressed in a reasonable way.
As the only high school in the far southwest region of the district, Cody is the “default”
choice for students living in this area. Yet, the high number of specialized program classes have
led to a disproportionately high enrollment of students at the Detroit Institute of Technology. Some
relief could be achieved by considering the three schools as one for the purposes of special
education.
Focus Group Participant Feedback
Compared to other special education reviews conducted by the Council’s team, there was
less discussion in Detroit about the way special educators collaborated with and supported general
educators in supporting students served by both. Very few examples were shared of co-teaching,
structured time for collaboration and discussion, or professional development involving both
general and special educators. Many interviewees expressed the need for stronger relationships
between general and special education teachers, more support of students with IEPs in general
education classes, and clarity of personnel roles.
Other focus-group comments included the following.
• Assistive Technology. All students with IEPs are considered for assistive technology. Parents
and teachers have access to the district’s impressive assistive technology information center’s
(ATTIC) lending library. The Lending Library has thousands of pieces of assistive technology,
books, hardware, software, switch-activated toys, and more. There were concerns that students
who would benefit from these services do not have them, especially students who are
nonverbal.
• School Cultures. Some principals indicated that their schools have open and welcoming
environments for students with disabilities. Other participants indicated that some principals
resist having specialized programs at their buildings and others do not provide leadership for
inclusive practices.
• Literacy Acceleration. There are insufficient resources to accelerate literacy skills among poor
readers with disabilities. The district has begun to implement Voyager-Sopris Passport
Journeys in the SLD and the mild cognitive impairment programs. Approximately 15 buildings
are currently using the program.
• Resource Service Model. Typically, students are educated using a traditional “resource’
service model. This involves students leaving the general education class to receive education
that may or may not be relevant to or support instruction based on core curricular standards.
• Substituting for Absent Teachers. A common theme among focus-group participants was that
special educators are sometimes asked to substitute for absent general education teachers,
taking them away from their own caseloads.

Improving Special Education Services in the Detroit Community School District
Council of the Great City Schools Page 68
• Large Class Sizes. Maximum state class-size requirements are not consistently followed in the
district, which negatively affects instruction. This circumstance is exacerbated by teacher
shortages and teachers without the experience and training necessary to be effective. Large
class sizes make it difficult to educate students with IEPs in general education. This factor may
account for the relatively small percentage of students educated between 79 percent and 40
percent in general education classes. Although teachers are paid for “oversize” classes,
participants believed that class sizes need to be reasonable before increasing general education
inclusivity.
• Prep Periods. Some teachers in specialized program take advantage of their prep period only
when a general educator or other teacher “takes their students,” according to interviewees. This
is less an issue at the high school level where students have scheduled classes.
• English Learners. Once ELs are identified as needing special education, there is little support
provided to address their language acquisition needs, unless the student is in a school
specializing in bilingual education. Although special education teachers address students’
language needs, not all special educators have received training on the acquisition of a second
language. Also, there are few curricular materials for ELs, including those with disabilities.
Instruction for Students in Specialized Schools
With a maximum state performance plan target of 4 percent for students attending a
separate school, DPSCD’s rate is 12 percent. It is also higher than the 6 percent rate in Wayne
RESA, 5 percent in the state, and 3 percent nationally. Some 922 of the district’s students with
IEPs attend such schools. Together, the schools house 99 of the specialized program classes,
including 23 in Work Study and 1 in Project Search. The largest number of classes are designed
for severe multiple impairments (27), followed by autism spectrum disorder (13), moderate
cognitive impairment (17), emotional impairment (10), severe cognitive impairment (7), and mild
cognitive impairment (1). (See exhibit 3z.)
Exhibit 3z. Number of Classes Per Specialized Program
Percentage of Students by Specialized Program in Separate Schools
As data show in exhibit 3aa, DPSCD’s rates for students receiving instruction in special
centers are lower than the state and nation in the areas of cognitive impairment and emotional
impairment. However, while figures show that no students with emotional impairments are
educated in this setting, district data show there are 10 EI specialized program classes at center
schools. District rates are the same as the state for students with hearing impairments. It is also
important to note that almost all students with a severe multiple disability (97 percent) are educated
in this setting, compared to 67 percent at the state and national levels.
SXI ASD MOCI EI SCI MICI
Special Center 27 13 17 10 7 1
0
10
20
30

Improving Special Education Services in the Detroit Community School District
Council of the Great City Schools Page 69
Exhibit 3aa. Special Schools
Students from Other Districts
Of the 684 students educated in DPCSD’s special schools, 57 (8 percent) are from other
districts, because of parent choice or pursuant to the Wayne RESA regional plan and the IEP
stipulates the need for a separate facility.
Focus Group Participant Feedback
Some of the most serious concerns expressed to the Council team by interviewees
concerned the operation of the district’s day treatment program at the two schools hosting Turning
Point. Concerns included--
• Diploma Track. Reportedly, students who should be on a diploma track are issued a certificate
of completion, because teachers certified to teach credit-bearing classes based on the core
curriculum necessary for graduation are not available and because other required courses are
unavailable.
• Support for Behavior. Student’s emotional/social and behavioral issues overwhelm
instruction, and suspensions or expulsions are sometimes given in lieu of appropriate
behavioral supports.
• Procedural Issues. Numerous procedural issues lead to due process hearings and state
complaints.
• Resources. Instructional materials, including books, are insufficient and inadequate.
Additional concerns related to the district’s adherence to the Wayne RESA Plan for the
Delivery of Special Education, the Act 18 Agreement, the Act 18 Budget process, and center
program procedures. It was clear that DPCSD needs to clarify roles and responsibilities of
administrators and staff members with respect to these requirements.
Generally, interviewees reported that appropriate materials and resources are available for
students in other specialized programs. For example, it was reported that assistive technology was
available for students. However, there were serious concerns about the operation of special school
budgets, which are funded by Wayne RESA, and delays associated with schools’ timely access to
budgeted funds to purchase materials. This issue is discussed further below in subsection IV under
fiscal issues, Support for Teaching and Learning for Students with Disabilities.
SXI ASD CI HI EI
DPSCD 97% 14% 6% 4% 0%
State 67% 11% 17% 4% 10%
Nation 67% 11% 17% 8% 10%
0%
20%
40%
60%
80%
100%

Improving Special Education Services in the Detroit Community School District
Council of the Great City Schools Page 70
Placement Center
The district relies on a single centralized placement center to provide various functions for
new students with IEPs and students who are moving from one residence to another within the
district. According to its webpage, the center’s specialists assist parents/guardians in enrolling their
children in appropriate classrooms, including students with IEPs returning or coming to DPSCD
from other school districts.67 Changes in placements will usually be ready for pick-up in 24 to 48
hours depending on the number of parents who seek service. For former DPSCD students with a
current IEP, simple changes can be completed at a local school by fax. The center:
• Assists with placement of students based on their individualized education program.
• Assists with changing addresses and placements when students move.
• Monitors class sizes to ensure maintenance of compliance.
• Assists with assigning students to the appropriate teacher based on student program.
• Investigates compliance complaints and resolves them.
• Provides professional development to staff on changes in the IEP process
In the past, the placement center had two administrators, half-time placement and half-time
compliance personnel, and five clerical staff members. Currently, the center is staffed by one
administrator, three clerical staff, and four IEP compliance specialists who assist when available.
Generally, placement personnel match the student’s IEP to schools with a specialized program that
is located closest to the student’s residence. When difficulties occur because classes have students
above state numerical caps, special education supervisors are used to resolve the problem.
Placement Timeliness
According to DPSCD, as of February 2nd there were 13 students waiting for initial
placements, and 13 were waiting for changes in placements because of seat availability. A high
proportion of these students have autism spectrum disorder. Some of these students have been at
home for several months. Reportedly, homebound services are not being provided because the
service is not medically necessary. Placement difficulties are exacerbated by the categorical nature
and configuration of services for these students. As data in exhibit 3bb show, DPSCD students
with ASD receive instruction at disproportionately higher rates in more restrictive environments
compared to state and national figures.
• General Education At Least 40 Percent of Time. Only 5 percent of ASD students in the district
are educated in this setting, compared to much higher rates at the state (18 percent) and national
levels (16 percent).
• General Education Less Than 40% of Time. Some 63 percent of district students with ASD
are educated in specialized classes, compared to much lower rates at the state (27 percent) and
national levels (34 percent).
• Separate Schools. Some 14 percent of district students with ASD are educated in schools
attended solely by students with disabilities compared to 11 percent of students at the state and
67 Retrieved from http://detroitk12.org/admin/academic_affairs/special_education/placement_centers/.

Improving Special Education Services in the Detroit Community School District
Council of the Great City Schools Page 71
national levels.
Exhibit 3bb. DPSCD Percentage of Students with ASD by Environment Compared to State/Nation
Focus Group Participant Feedback
The placement center and its processes generated considerable discussion during focus
group sessions. The most notable concerns included--
• Phone Line. The use of one phone line at the center substantially restricts placement center
access.
• Reception. Parents have been seen waiting for help with no person to greet them.
• Incorrect Information. Parents are sometimes told by school personnel that the school does
not have the “correct” services for the student and to return to the placement center for another
school option.
• Transfer Notice. School personnel are frustrated when not informed about a transfer-in
student, and when the student arrives without required paperwork.
• School-based Enrollment. Various principals were open to the possibility of enrolling all new
students at the school level, with support for appropriate student placements.
• Temporary Placements. There was confusion about whether “C-placements” or temporary
placements continue to be an available option for students.
• Caseload Review. With small numbers of staff, it is difficult to complete the annual “close out
process” where lead teachers from each school meet with center personnel to review caseloads.
Overall Observation of DPSCD’s Configuration of Special Education
The district’s configuration of special education services is based on an outdated model of
categorical specialized programs and limited opportunities for education in general education
classes, leading to long transportation times and inequitable enrollment by school of students with
disabilities.
Since the 1980s, the nation’s school districts have been moving away from educating
students in separate schools, which offer weaker instructional opportunities and lesser interaction
with nondisabled peers. Under the influence of the federal Office for Civil Rights, state monitoring,
and independent actions, there are many examples in Council member districts of effective
instruction in regular schools for students who have characteristics like those in DPSCD rather
At Least 80% of Time 40% to 79% of Time Less than 40% of Time Separate Schols
DPSCD 17% 5% 63% 14%
State 45% 18% 27% 11%
Nation 40% 16% 34% 11%
0%10%20%30%40%50%60%70%

Improving Special Education Services in the Detroit Community School District
Council of the Great City Schools Page 72
than in specialized programs or center schools. Personnel in Detroit do not seem well-versed in
these models or the impact they have on students with IEPs. The team was very concerned that the
senior executive director for special education had been given the charge of establishing new
separate schools for students with autism, dyslexia, and deaf/blind for the 2019-20 school year.
Furthermore, it appears that the district is taking steps to establish alternative schools for teenage
mothers/fathers, students engaged in disruptive behavior, overage students, and chronically absent
students. It is important that district leaders consider how students with IEPs will be affected, how
they would be supported in such settings, or whether more proactive interventions in the regular
schools could be used to avoid more segregated educational structures than what the district has
already.
Furthermore, DPSCD needs to review schools with disproportionately high and low
enrollments of students with IEPs to determine alternative approaches and more equitable
placement of specialized programs, and to support effective instruction for more students in
general education.
Secondary Transition Services and Support
In Michigan, school districts are to begin transition-planning for students with IEPs when
each student is 16 years old. The planning process includes age-appropriate transition assessments,
transition services, courses of study that will reasonably enable students to meet postsecondary
goals, and annual IEP goals related to students’ transitional needs. Transition services and supports
prepare students for employment and independent living through coordinated activities that
promote movement from school to post-school activities, including postsecondary education,
vocational education, integrated employment (including supported employment), continuing and
adult education, adult services, independent living, and community participation.
The state performance plan (SPP) for special education includes four indicators on
postsecondary transitions for youth with IEPs:
Indicator 1. Percentage graduating from high school with a regular diploma
Indicator 2. Percentage of students with IEPs dropping out of high school
Indicator 13. Percentage of students with IEPs with all required transition components
Indicator 14. Percentage of youth with IEPs who were within one year of leaving high school:
• Enrolled in higher education;
• Same as above or competitively employed; and
• Same as above or in other postsecondary education or training program.
The sections below summarize DPSCD’s progress on each of these indicators and the
district’s support for postsecondary transitional activities and services, including community-
based work experiences.
Graduation Rates
Data in exhibit 3cc show five years (2011-12 to 2015-16) worth of data on the percentages
of students with IEPs who graduated from school after four and six years, and the percentage point

Improving Special Education Services in the Detroit Community School District
Council of the Great City Schools Page 73
gaps with all students.68 The data show that students with disabilities’ four-year graduation rates
increased 1 percentage point from 47 percent to 48 percent. However, the six-year rates during this
period decreased from 64 percent to 54 percent. The percentage point gaps between students with
disabilities and all students were smaller when looking at the six-year rates than the four-year rates,
although the gaps increased for both during the five-year period. Along with the performance of
students with disabilities in credit-bearing classes, these low rates may reflect the relatively low
percentage of students accessing these classes.
Exhibit 3cc. Four and Six Year Graduation Rates: Students with IEPs
Dropout Rates
Data in exhibit 3dd show five years (2011-12 to 2015-16) worth of data on the percentages
of students with IEPs who dropped out of school after four and six years, and the percentage point
gaps with all students. These figures indicate that students with disabilities’ four-year dropout rates
decreased by almost half from 14.49 percent to 7.7 percent. Similarly, five-year rates decreased by
6 percentage points from 28.6 percent to 22.5 percent. Furthermore, when looking at 4-year rates,
the percentage point gap between students with disabilities and all students fell from 4.9 points to
1.0 points. The results are even better for 6-year dropout rates, which in 2015-16 were 4.1
percentage points lower than all student rates. This progress is exemplary.
68 DPCSD indicated that MDE has not released graduation and dropout figures for 2016-17.
2015-16 2014-15 2013-14 2012-13 2011-12
4 Years - Disability 48% 48% 47% 41% 47%
6 Years - Disability 54% 50% 62% 57% 64%
4 Years - Point Gap: All Students 31 30 25 24 17
6 Years - Point Gap: All Students 24 22 11 14 14
0
5
10
15
20
25
30
35
0%
10%
20%
30%
40%
50%
60%
70%

Improving Special Education Services in the Detroit Community School District
Council of the Great City Schools Page 74
Exhibit 3dd. Percentage of District Students with/without IEPs who Dropped Out of School
IEP Compliance and Post School Experience
Two additional indicators measure postsecondary transitions. The first concerns IEP
requirements, and the second measures postsecondary activities one year after high school.
IEP Compliance
MDE data show that DPSCD’s 2015-16 rate was 85 percent69 on SPP indicator 13. The
state compliance requirement on this indicator is 100 percent. This indicator measures IEP
compliance with the:
• Percent of youth aged 16 and above with IEPs having appropriate and measurable
postsecondary goals, which are annually updated and based on an age-appropriate transition
assessment.
• Transition services, including courses of study, that will reasonably enable the student to
meet their postsecondary goals.
• Annual IEP goals related to student transition service needs. There also must be
documentation that students are invited to IEP team meetings where transition services will
be discussed; and documentation that, if appropriate, a representative of a participating
agency was invited to the IEP team meeting with prior consent of the parent or student who
has reached majority age.
Activities One Year After Leaving High School
SPP indicator 14 has targets for the percentage of students with IEPs engaged in three
activities within one year of leaving high school. Exhibit 3ee shows DPSCD performance and
targets on these activities.
• Enrolled in Higher Education. Some 28.6 percent of former district students with IEPs met
69 Source of data for IEP compliance rate and exhibit 3w: Michigan Department of Education Special Education
(Part B of IDEA) Public Reports School Year 2015-2016, Published May 2017.
2015-16
2014-15
2013-14
2012-13
2011-12
4 Years - Students with IEPs 7.7% 12.5% 15.6% 19.7% 14.49%
6 Years - Students with IEPs 22.5% 21.4% 20.0% 26.5% 28.6%
4 Years - Point Gap: All Students 1.0 -1.0 2.7 3.9 4.9
6 Years - Point Gap: All Students -4.1 2.6 3.9 -0.1 -1.5
-5-4-3-2-10123456
0%
5%
10%
15%
20%
25%
30%
35%

Improving Special Education Services in the Detroit Community School District
Council of the Great City Schools Page 75
this indicator, compared to the 33.2 percent SPP target.
• Enrolled in Higher Education or Competitively Employed. Some 57.1 percent of former
district students with IEPs met this indicator, compared to the state’s 60.0 percent SPP target.
• Enrolled in Higher Education, Competitively Employed, or Engaged in Other Postsecondary
Education or Training Program. Some 64.3 percent of former district students with IEPs met
this indicator, compared to the state’s 72.5 percent SPP target.
While district rates are not far below state targets, there is room for improvement to ensure
students are engaged in meaningful work or education after they leave high school.
Exhibit 3ee. Percent of Students Engaged in Various Activities One Year after Leaving High School
Importance of Community-Based Work Experiences for Students with Disabilities
Based on data from the National Longitudinal Transition Study-2, students with IEPs often
have poor postsecondary outcomes in employment, education, and independent living. For
instance, based on data from 2009 (the most recent available), 60 percent of survey respondents
across disability groups indicated that they were currently in a paid job and 15 percent indicated
that they were attending postsecondary education. Large numbers of students with disabilities who
are able either to work or participate in higher education do not participate in these post-school
activities.70 According to an American Institutes for Research study:
Previous studies have demonstrated that students with disabilities who have work
experiences while in high school are more likely to be employed after high
school.71 Often the work experience in which they were enrolled led directly to a
postsecondary job for a student. For these students, it is important to have
occupationally specific CTE programs, with appropriate instructional and
adaptive support services and accommodations, available in high school.72
The National Collaboration on Workforce and Disability affirmed this finding by reporting
that “[w]hile work experiences are beneficial to all youth, they are particularly valuable for youth
70 National Longitudinal Transition Study-2. Retrieved from http://www.nlts2.org/ 71 National Collaborative on Workforce and Disability for Youth, 2011. 72 Improving College and Career Readiness for Students with Disabilities American Institutes for Research http://www.ccrscenter.org/sites/default/files/Improving%20College%20and%20Career%20Readiness%20for%20St
udents%20with%20Disabilities.pdf
A. Enrolled in highereducation wtihin one year of
leaving high school
B. Same as A orcompetitvely employed
C. Same as B or in someother postsecondaryeducation or training
program
District 28.6% 57.1% 64.3%
SPP Targets 33.2% 60.0% 72.5%
0%10%20%30%40%50%60%70%80%
0%
20%
40%
60%
80%

Improving Special Education Services in the Detroit Community School District
Council of the Great City Schools Page 76
with disabilities. For youth with disabilities, one of the most important research findings shows
that work experience during high school (paid or unpaid) helps them get jobs at higher wages after
they graduate.”73 The National Collaboration research showed that quality, work-based learning
experiences have the following features:
• Experiences provide exposure to a wide range of work sites to help youth make informed
choices about career selections.
• Experiences are age and stage appropriate, ranging from site visits and tours to job shadowing,
internships (unpaid and paid), and paid work experience.
• Work-site learning is structured and links back to classroom instruction.
• A trained mentor helps structure the learning at the worksite.
• Periodic assessment and feedback is built into the training.
• Youth are fully involved in choosing and structuring their experiences.
• Outcomes are clear and measurable.
Based on focus group feedback to the team, there appeared to be limited opportunities for
students with disabilities to engage in work experiences, such as those offered at the Drew
Transition Center for students 18 years and older. Currently there is not a working relationship
between external partners and special education to support the linkage of students with disabilities
with community-based internships.
Focus Group Participants
Focus group participants provided feedback on ways in which students with disabilities
have been provided with experiences to prepare for postsecondary living.
• Transition Center. The Drew Transition Center provides students with IEPs from 18 to 26
years of age opportunities to work at community-based sites. While students are not paid, they
gain experience at such sites as: Marriott, Chili’s, TJ Max, TJ Max, etc. Several students
transitioned to competitive employment after they left secondary school.
• Career Technical Centers (CTC). The Randolph Career Technical Center offers half day
programming to prepare for various construction trades; marketing; heating, ventilation and
air conditioning; etc. Some 83 students with IEPs (27 percent) participate. In prior years the
school had three resource teachers, but now they have only one who rotates across the 7
programs. With a special grant, the school now has a teacher who focuses on integrating
reading instruction into the broader academic program. Other instructors support students who
are homeless, parenting, and limited English proficient, as well as students with disabilities.
• Support for Students. There are insufficient resources at the CTCs to support students with
disabilities in highly technical career courses.
• Areas of Study. There is a need to improve the projection of CTC areas of study so more
students make wise decisions and can succeed.
73 http://www.ncwd-youth.info/work-based-learning
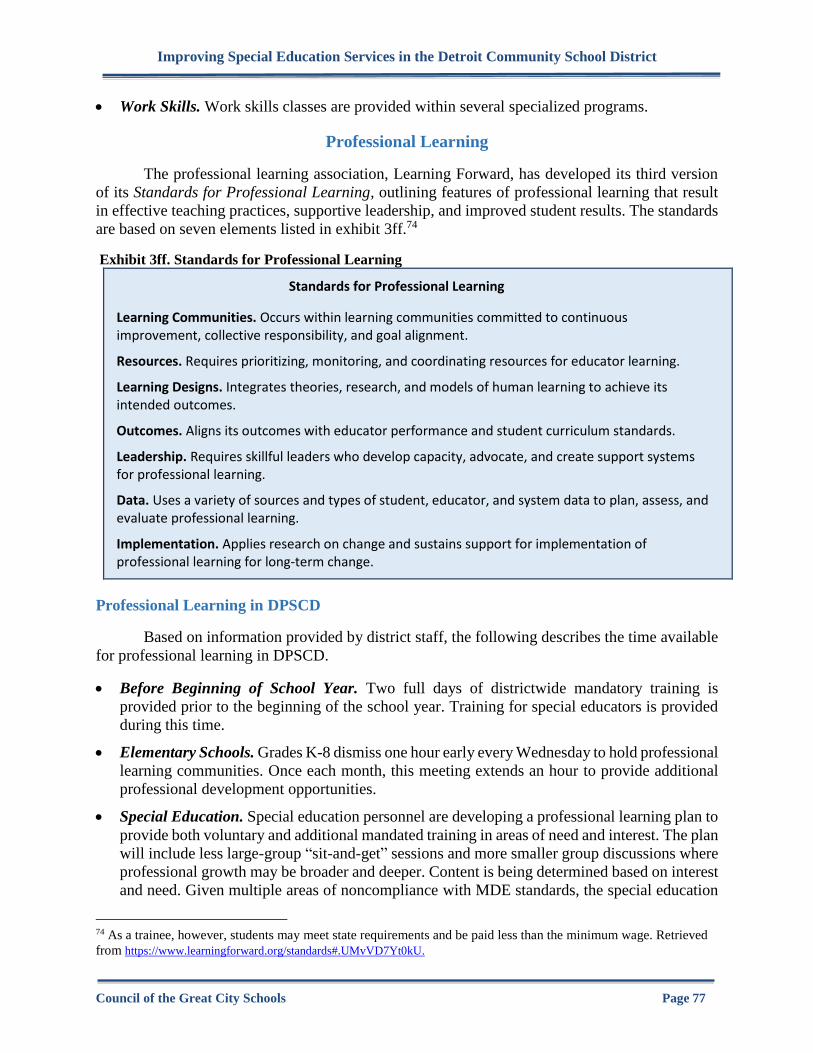
Improving Special Education Services in the Detroit Community School District
Council of the Great City Schools Page 77
• Work Skills. Work skills classes are provided within several specialized programs.
Professional Learning
The professional learning association, Learning Forward, has developed its third version
of its Standards for Professional Learning, outlining features of professional learning that result
in effective teaching practices, supportive leadership, and improved student results. The standards
are based on seven elements listed in exhibit 3ff.74
Exhibit 3ff. Standards for Professional Learning
Standards for Professional Learning
Learning Communities. Occurs within learning communities committed to continuous improvement, collective responsibility, and goal alignment.
Resources. Requires prioritizing, monitoring, and coordinating resources for educator learning.
Learning Designs. Integrates theories, research, and models of human learning to achieve its intended outcomes.
Outcomes. Aligns its outcomes with educator performance and student curriculum standards.
Leadership. Requires skillful leaders who develop capacity, advocate, and create support systems for professional learning.
Data. Uses a variety of sources and types of student, educator, and system data to plan, assess, and evaluate professional learning.
Implementation. Applies research on change and sustains support for implementation of professional learning for long-term change.
Professional Learning in DPSCD
Based on information provided by district staff, the following describes the time available
for professional learning in DPSCD.
• Before Beginning of School Year. Two full days of districtwide mandatory training is
provided prior to the beginning of the school year. Training for special educators is provided
during this time.
• Elementary Schools. Grades K-8 dismiss one hour early every Wednesday to hold professional
learning communities. Once each month, this meeting extends an hour to provide additional
professional development opportunities.
• Special Education. Special education personnel are developing a professional learning plan to
provide both voluntary and additional mandated training in areas of need and interest. The plan
will include less large-group “sit-and-get” sessions and more smaller group discussions where
professional growth may be broader and deeper. Content is being determined based on interest
and need. Given multiple areas of noncompliance with MDE standards, the special education
74 As a trainee, however, students may meet state requirements and be paid less than the minimum wage. Retrieved
from https://www.learningforward.org/standards#.UMvVD7Yt0kU.

Improving Special Education Services in the Detroit Community School District
Council of the Great City Schools Page 78
department is seeking to raise expectations, and provide content, coaching, and support to
school staff. In collaboration with Wayne RESA and various community agencies, training
opportunities will expand in a variety of venues. For example, a calendar for regional after
school training opportunities is in development.
• Ancillary Staff. Personnel meet monthly in their area of service, e.g., speech/language
pathologists, psychologists, etc.
Focus Group Participant Feedback
Across focus groups, participants indicated that more professional learning was necessary,
especially for principals and general and special educators at the school level. Interviewees also
indicated that more training was needed on providing accommodations, collaboration between
general and special educators, co-teaching, and the like. Other topics of need included IEP
development, procedural safeguards related to the removal of students from class and school,
dyslexia, and Section 504 requirements. A common theme heard by the team was the lack of time
available for training. Staff indicated that the district was exploring more on-line modular training,
but the team saw no evidence that this was available yet. Other concerns by interviewees included:
• Special educators using the Voyager program receive training from the publisher, which was
considered insufficient.
• Center schools provide their own professional development and facilitate training for their
paraeducators as well. Sometimes program supervisors help to identify training resources.
• There was a need for teachers to focus on how to prepare students to take the SAT.
• While IEP training was provided every year, quality and compliance issues persist.
Parent and Community Involvement
A large body of research demonstrates the positive effects of parent-professional
collaboration on outcomes for students with disabilities75 Effective collaboration is often grounded
in a strong staff-parent relationship and the combined expertise of parents and professionals in
helping students with disabilities meet their goals. Many parents want to fully participate in
planning for their child(ren) and supporting changes in services. Nonetheless, collaboration tends
to be more difficult when parents are new to the country, when language differences present
barriers, and when parents come from poor or low socioeconomic environments.
SPP indicator 8 measures the percentage of parents with a child receiving special education
services who report that schools facilitated parental involvement as a means of improving services
and results for children with disabilities. Data published by MDE for 2015-16 showed that 21.62
75 A.T. Henderson, & K. L. Mapp. (2002). A new wave of evidence: The impact of school, family, and community
connections on student achievement. Southwest Education Development Laboratory. Cited in Fostering Parent and
Professional Collaboration Research Brief, Technical Assistance ALLIANCE for Parent Centers, National Parent
Technical Assistance Center at
http://wsm.ezsitedesigner.com/share/scrapbook/47/472535/1.7_Fostering_Parent_and_Professional_Collaboration.p
df.

Improving Special Education Services in the Detroit Community School District
Council of the Great City Schools Page 79
percent of parents made such a report, which was somewhat below the state’s relatively low 25.6
percent target.
Focus Group Participants
During its site visit, the Council team met with a strong group of parents and community
representatives who expressed interest and desire to support DPSCD in the future. They also
expressed the desire to form a parent organization to formalize their collaboration with the district.
Moreover, the group voiced a variety of issues and concerns, which included--
• Town Hall Meeting. Parents appreciated the superintendent and his wife’s participation in a
Town Hall meeting held earlier this school year, which also included board members and some
400 people.
• Working Relationship. A positive relationship has developed between parent representatives
and the senior executive director for special education. Although a variety of parents reported
that principals are more responsive with the new special education leadership, others indicated
that there had been no movement on their concerns, such as the implementation of IEP
accommodations in advanced classes. Following our meeting, a group of parents with concerns
met with the senior executive director for special education to share issues for follow-up action.
• Respect. Some parents believed that principals act as if they do not want children to be
educated at their schools, and parents find they are being disrespected.
• Resolving Concerns. Currently, there is no structured protocol for parents to report special
education concerns.
• School-Based Knowledge and Implementation. School-based personnel need more
information about various aspects of disability and related instructional needs, Section 504,
special education procedures, medical accommodations, behavior intervention plans, etc. Also,
consistent implementation of IEP-required services was a concern.
• Removals from School. Numerous reports were heard by the team about “unofficial” student
removals from school because of disciplinary infractions, even though behavior intervention
plans were not followed, and PBIS and restorative practices were not being implemented.
AREAS OF STRENGTH
The following are areas of strength related to the district’s support for teaching and learning
for students with disabilities.
• NAEP Reading. At grade four, seven percent of students scored basic/above, an increase of
one percentage point. At grade eight, eight percent of students met this standard (an increase
of two percentage points). The national average for large cities at both grades decreased by
one percentage point. Although the district’s percentages for reading and math (below) were
quite low, the increase is a positive sign for DPSCD especially considering the nation’s decline
in scores.
• NAEP Math. At grade 4, 17 percent of students with IEPs scored basic/above, an increase of
12 percentage points while the large city rate decreased by 1 percentage point. At grade 8, 4
percent of district met this standard, an increase of 1 percentage point as large city rates

Improving Special Education Services in the Detroit Community School District
Council of the Great City Schools Page 80
remained the same.
• Dropout Rates. Between 2011-12 and 2015-16, the four-year dropout rates for students with
IEPs decreased by almost half (14.49% to 7.7 percent), and five-year rates decreased by 6
percentage points (28.6 percent to 22.5 percent). Furthermore, for 4-year rates, the percentage
point gap between students with IEPs and all students fell from 4.9 points to 1.0 points, and
the 6-year IEP dropout gap in 2015-16 was 4.1 percentage points lower than the all-student
rates. This progress is exemplary.
• Out-of-School Suspensions. Students with IEPs are not much more likely than other students
to be suspended for 1 to 5 days, 6 to 10 days, or for more than 10 school days. No students
with IEPs from any race/ethnicity group is more likely to be suspended compared to students
from other racial/ethnic groups.
• Behavior Specialist Support. The district’s two behavior specialists are supporting a new
promising initiative involving 15 schools with emotional impairment programs.
• Assistive Technology. Parents and teachers have access to the district’s assistive technology
information center’s (ATTIC) lending library. The Lending Library has thousands of pieces of
assistive technology equipment, books, hardware, software, switch-activated toys, and more,
available to borrow.
• Interventions. The district has begun to implement Voyager-Sopris Passport Journeys in the
specific learning disability and mild cognitive impairment programs. However, if the program
is being used in a balanced-literacy type setting, it may need to be augmented with additional
foundational reading materials.
• Center Program Resources. Generally, center school programs have sufficient and appropriate
material and resources, including assistive technology.
• Randolph Career Technical Center. The CTC offers half-day programming to prepare
students for various construction trades; marketing; heating, ventilation and air conditioning.
Some 83 students with IEPs (27 percent) participate.
• Drew Transition Center. The center provides students with IEPs from 18 to 26 years of age
with the opportunity to work at community-based sites. Although students are not paid, they
gain experience at such businesses as: Marriott, Chili’s, TJ Max, etc. Several students
transitioned to competitive employment after they left secondary school.
• Professional Learning. Compared to other urban districts where Council team has conducted
reviews, DPSCD has set aside more time for professional learning, including before the school
year begins, weekly opportunities for schools with elementary/middle grades, regular sessions
for center school personnel, and monthly meetings for related services personnel. Plans are
being made to improve the quality of training for special education personnel. On-line modular
training is reportedly being explored.
• Parent and Community Involvement. DPSCD has a strong group of parents and community
representatives who expressed interest, and desire to support DPSCD in the future. They would
like to form a parent organization to formalize their collaboration with the district. With the
new administration, there has been more timely responses by principals and new special
education leadership. Parents appreciated the superintendent and his wife’s participation in the

Improving Special Education Services in the Detroit Community School District
Council of the Great City Schools Page 81
town hall meeting held earlier this school year, which included board members and some 400
people. A positive relationship has developed between several parent representatives and the
senior executive director for special education.
OPPORTUNITIES FOR IMPROVEMENT
The following provide opportunities to improve teaching and learning for students with
disabilities.
Early Childhood
• Early Childhood Achievement Outcome Reporting. The district’s report on early childhood
SPP indicators showing that no students who entered the program below expectation had
substantially increased developmentally upon exiting in all three areas measured, and similar
data on children meeting age expectations by the time they exited the program raises questions
about data and reporting accuracy.
• Educational Environments. Lower percentages of district students with IEPs were educated
in regular preschool settings and higher percentages in separate settings compared to Wayne
RESA, the state, and the nation.
State Assessments for Students with IEPs
• ELA. Some 18.7 percent of students scored proficient/above in English language arts in 2015-
16, down from a high of 40.7 percent in 2012-13. The decline may be related to changes in the
assessment.
• Math. Similarly, 18.8 percent of students scored proficient/above on math in 2015-16, down
from the high of 36.2 percent in 2012-13.
• Alternate Assessment. The percentage of students with significant cognitive disabilities taking
alternate assessments was 5.8 percent in ELA, 5.7 percent in math, and 5.5 in science. This
exceeds the 1.0 percent benchmark set under ESSA, and consequently MDE will require
DPSCD to justify the high alternate assessment rates and will monitor IEP alternate assessment
decisions. The district will have to address the participation rates of students with IEPs in
statewide assessments since they are below the 95 percent threshold.
Educational Environments
• Generally. District students with IEPs receive instruction in general education environments
most of the time at much lower rates than Wayne RESA, the state, or the nation; and in more
restrictive environments (separate classrooms and center schools) at much higher rates. The
district rate remains about the same when excluding students living outside of Detroit. For
instruction in general education classes at least 80 percent of the time, rates are highest in
grades 1, 10, and 11. In separate classes, rates are highest in grades 7 and 8. Center school rates
are highest in 9th and 11th grades.
• Disability Disparities. Arabic students are 4.43 times more likely than other students with IEPs
to attend a center school. Excluding Arabic students living outside the district, the risk ratio
decreases somewhat to 3.9.

Improving Special Education Services in the Detroit Community School District
Council of the Great City Schools Page 82
Out of School Suspensions
• Informal Removals from School. Reportedly, all out-of-school suspensions are not being
recorded properly, and instead students are being sent home “unofficially.”
• Eighth Grade. The highest number of suspensions for both students with and without IEPs
is at the eighth grade.
General Support for Students
• Inclusive Instructional Support. During focus group discussions, little emphasis was given by
interviewees on co-teaching, structured time for collaboration and discussion, or joint
professional development for general and special educators to support inclusive instruction.
Participants indicated the need for stronger collaboration between general and special
education teachers, more support of students with IEPs in general education classes, and clearer
roles.
• Interventions. Relatively few intensive interventions are available to accelerate literacy.
Students in resource classes do not always receive education to support instruction based on
core curricular standards or to accelerate achievement.
• English Learners. Once ELs are identified as needing special education, there is little support
to address their language acquisition needs, unless the student is in a school specializing in
bilingual education.
• Assistive Technology. There were concerns that students who would benefit from assistive
technology sometimes do not receive it, especially among students who are nonverbal.
• Staff Shortages. Significant special education teacher shortages affect class sizes and
contribute to students having teachers without the experience and training necessary to be
effective.
Configuration and Impact of Specialized Programs
• Schools Hosting Specialized Programs. Schools vary significantly in having specialized
program classes, with 26 schools having no classes, 1 high school having 9 classes, and 1
school with elementary and middle school grades having 13 classes. Hosting large numbers of
specialized classes affects the ability of principals to support inclusive educational
opportunities, intensive interventions, and transportation services.
• Percentage of Students with IEPs by School. Discrepancies by school in the numbers of
specialized classes produce large variations in school percentages of students with IEPs. The
percentage of students with IEPs varies from 1 percent to 56 percent. One school, which is one
of three small high schools in one building, has the highest IEP percentage. Only one
specialized program class (ASD) is offered at the four high schools having an examination
requirement.
• Specialized Program Variety. DPSCD has 14 different specialized programs for school-aged
students. The programs mirror the description of specialized programs in Michigan’s
Administrative Rules for Special Education and Wayne RESA regional plan, which sets
maximum student-to-personnel class ratios. There were significant concerns that many classes
exceeded these ratios. In addition, unlike many other school districts visited by the Council’s
team, DPSCD’s configuration of services appears to be unduly categorical. The team was
Improving Special Education Services in the Detroit Community School District
Council of the Great City Schools Page 83
informed that MDE does not require use of programs with these categorical names.
• Notable Specialized Program Configurations. The following are notable specialized program
configurations—
- SLD Program. DPSCD educates 12 percent of students with SLD less than 40 percent of
the time in general education classes, compared to 3 percent in the state and 5 percent
nationally. Although most students with specific learning disabilities typically receive
instruction on core academic standards, SLD programs have 31 classes at schools with
elementary and middle grades and 15 classes at the high school level. This program is
meant for students with high incident disability areas of SLD, emotional impairment, or
other health impairment who require direct instruction in all four core curricular areas. The
proportion of specialized program classes for SLD is higher than most other districts the
Council team has visited.
The age span of students in these classes may not be more than the age span of students
without disabilities in the building, and in elementary buildings the age span may not be
more than six years--whichever is less. Considering the rigor of academic standards that
students must master, instruction can be challenging in classes with such large age
differences. The area of SLD has the third largest number of specialized classes (46) in the
district, followed by autism spectrum disorder and mild cognitive impairment (62 and 61,
respectively).
- SXI, SCI, Work Skills, and Project Search Programs. These specialized programs are
offered only at center schools. Although it is common for other school districts to house
postsecondary transition programs for older youth in developmentally appropriate
environments outside of regular high schools, it is not common that classes for severe
multiple impairment and severe cognitive impairment programs be offered only in center
schools.
- PI and POHI Programs. With 14 classes at the elementary and middle school level, no
classes were offered at the high school level.
- EI Program. No EI classes are offered in regular high schools. However, while figures
show that no students with emotional impairments are educated in separate schools (exhibit
3j), other district data show 10 EI specialized program classes at center schools (exhibit
3z).
• Transportation. Some 40 percent of students with IEPs are provided door-to-door
transportation. Contributing to this rate is the disparate placement of specialized programs in
schools based on school-by-school agreements to host such programs, the absence of a master
plan for establishing programs, and the lack of an effective protocol to guide IEP transportation
decisions. Transportation is also affected by long travel times and delays in data entry. Also,
when school personnel do not exit students, new schools cannot enroll them and initiate new
transportation routes. Students remain at home until the situation is resolved when parents are
unable to provide transportation themselves.
Center Schools
• Placement Rate. With a maximum Michigan state performance plan target of 4 percent for
students with IEPs attending a separate school, the DPSCD rate is 12 percent compared to 6

Improving Special Education Services in the Detroit Community School District
Council of the Great City Schools Page 84
percent in Wayne RESA, 5 percent for the state, and 3 percent nationally. The opening of ANY
new center schools will increase the district’s already disproportionately high rate and result
in more restrictive educational environments for students currently attending regular schools.
• Turning Point Schools. The district’s two programs for day treatment have moved from
separate buildings to regular schools, but they operate as separate schools. Reportedly, students
who should be on a diploma track are issued a certificate of completion because teachers who
are certified to teach core curriculum classes are not available and some required courses are
not offered. Also, instruction is impacted by student behavior, procedural safeguards are
reported as not consistently followed for suspensions, and instructional materials are
insufficient.
• Wayne RESA Plan. The district needs to clarity roles and responsibilities of administration
and staff members for meeting requirements on the Wayne RESA Plan for the Delivery of
Special Education, the Act 18 Agreement, the Act 18 Budget process, and center program
procedures.
Placement Center
• Centralized Placement. Students with IEPs who are new to the district or who have moved
from one residence to another are not able to (re)enroll in a new school (like students without
IEPs) and must go through the district’s centralized placement center for a new school.
• Students Waiting for Placement. Because of staff shortages and little to no space available in
some specialized programs, there are students at home awaiting placement. Homebound
services are not provided because the service is not medically necessary.
• Concerns. Focus groups expressed concerns about the placement center’s use of one phone
line; wait-times for center staff assistance; rejection of students referred by the placement
center at schools claiming they lack appropriate services; insufficient paper work provided to
serving school; insufficient staff to perform caseload “close out processes;” and confusion
about temporary placements.
Secondary Transition and Activities
• Graduation Rate. Between 2011-12 and 2015-16, the four-year graduation rates for students
with IEPs increased 1 percentage point from 47 percent to 48 percent, and the six-year rates
decreased from 64 percent to 54 percent. While a slight improvement, these rates are very low.
• IEP Goals. With a 100 percent compliance requirement, 85 percent of students had IEPs with
required transition components.
• Career Technical Centers. There are insufficient resources to support all students with IEPs
in highly technical CTC courses, and students need to be better prepared to make decisions
about what to study.
• On-Site Job Training. There are limited opportunities for students with IEPs to engage in work
experiences, such as those offered at the Drew Transition Center for students 18 years and
older. Currently there is not a strong collaboration between external partnerships and special
education to support students with disabilities and community-based internships.
• Activities One Year After Leaving High School. Among former DPSCD students with IEPs
within one year of leaving high school, rates were somewhat below state targets in their: a)

Improving Special Education Services in the Detroit Community School District
Council of the Great City Schools Page 85
enrollment in higher education (28.6 percent with 33.2 percent target); b) category “a” plus
competitively employed (57.1 percent with 60.0 percent target); and c) categories “a and b”
and other postsecondary education or training programs (64.3 percent with 72.5 percent target).
Attaining higher local targets could be achievable with focused activities.
Professional Learning
• Need. There is considerable need for joint professional development for general and special
educators at the school level, especially among principals, to support more inclusive and
effective instruction.
• Types of Training. Training is needed in areas such as general education accommodations,
collaboration between general and special educators, supplemental intensive interventions, co-
teaching, and the like. Other areas where more professional development is needed include
IEP development, procedural safeguards related to the removal of students from class and
school, dyslexia, and Section 504 requirements. There was a perception among interviewees
that there was insufficient time available for professional learning.
Parent and Community Involvement
• Concerns. Concerns raised by parents included implementation of IEP accommodations in
advanced classes and IEPs in general. Parents also raised issues around behavior intervention
plans; disrespect by some principals; lack of a structured process for parents to report concerns;
knowledge of school-based personnel; “unofficial” student removals in lieu of formal
suspensions; and implementation of PBIS and restorative practices.
RECOMMENDATIONS
3. Review of Data Related to Teaching and Learning. Assemble a multidisciplinary team and
review achievement data (exhibits 3a, 3c-g, and 3dd-ee); suspension data (3m-o); educational
environments (3g-l); special program configurations (3p-u, 3w, 3z, and 3bb), students from
other districts (3v); percentages of students with IEPs by school (3x); and other relevant data.
Develop hypotheses around the patterns of results found and set goals for improvement as the
district implements the Council team’s recommendations and other proposals. Build strategies
around each improvement goal, especially Recommendation 4 that is intended to improve
inclusive and high-quality teaching and learning. Assess the resources and supports needed to
implement each strategy.
4. Expansion of Inclusive Education and Provision of High Quality Instruction and Supports.
Begin the process of providing special education services in more inclusive educational
settings to students with disabilities to ensure more equitable access to school choice and high-
quality instruction. To build a culture and climate for this purpose, consider using an
experienced consultant who has had successful outcomes in this area to help facilitate planning
and implementation. 76
76 The suggested activities are not intended to be a blueprint or to be exclusive. They are provided for discussion
purposes and further development.

Improving Special Education Services in the Detroit Community School District
Council of the Great City Schools Page 86
a. Inclusive Education Vision. Establish a school board policy77 stating a clear and defined
vision for DPSCD on the value of inclusivity and that reinforces the district’s commitment
to improving academic achievement and social/emotional well-being for students with
disabilities.78 Highlight the importance of central office support and principal leadership
for providing students with IEPs with the differentiated and scaffolded instruction they
need to learn in general education settings. State that a student’s needs - not their disability
label - should drive the type or location of services. Expect that students will receive
rigorous core instruction that is linguistically appropriate and culturally relevant. These
expectations should be within greater reach when school personnel are provided the
resources and supports they need, and as teachers become more familiar with and base their
instruction on the principles of UDL. At the same time, the district’s vision should
underscore the importance of evidence-based academic and positive behavior
interventions/supports. Furthermore, once students are receiving special education
instruction, the intensity of interventions should be stronger than (not less than)
interventions otherwise available to students without IEPs.79
b. Implementation Plan. With the multidisciplinary team assembled pursuant to
Recommendation 3, develop a written multi-year action plan that calls for written
expectations, professional learning, data analytics, and accountability. To the extent
reasonable, embed components in the MTSS implementation plan referenced in
Recommendation 1b. Consider the data review referenced in Recommendation 3. Once the
plan is completed, establish a way for school-based teams to embed local implementation
activities into their strategic school designs and school improvement plans.
As part of this process, identify a cadre of schools that volunteer to take the lead in planning
and implementing inclusive service designs. Phase in this process over about four years to
include all schools. Also, identify general and special education personnel that schools can
contact to support their implementation efforts to better meet the needs of students with
IEPs.
Communication. When finalized, prominently post the implementation plan on the
district’s website, along with relevant links to district information and publicly available
resources. Communicate the plan widely to all internal and external stakeholders, including
parents who are English learners, and share the purpose and expected outcomes of the plan.
Consultant. Hire a consultant who has experience with and positive outcomes in reducing
the restrictiveness of educational environments of students, implementing interventions for
students with dyslexia, autism, vision/hearing impairments, and improving achievement
and positive student behavior generally. This action will expedite effective planning and
implementation and serve as a sounding board for DPSCD staff.
77 See, for example, one district’s inclusion policy and related documents, retrieved from
https://www.district65.net/Page/812 78 Language from the Common Core State Standards website may be helpful for this purpose. Retrieved at
http://www.cPorestandards.org/assets/application-to-students-with-disabilities.pdf. 79 Board policy shall EXCLUDE the creation of separate school sites for autism, hearing or vision impaired or for
dyslexia. Council team does not support any further segregation of SwD in DPSCD.

Improving Special Education Services in the Detroit Community School District
Council of the Great City Schools Page 87
Components. When developing the implementation plan, include the following
components—
• Early Childhood. Increase the number of children educated inclusively in regular
preschool classes--with no more than 50 percent and close to 30 percent of classes
composed of children with disabilities. The Council team can provide DPSCD with
names of other school districts that have done so effectively. When more children are
successful in inclusive classrooms, there will be higher expectations that these
opportunities will continue in kindergarten, enhance equitable school choices, and spur
high-quality education for students with disabilities.
• Differentiated Instruction. Provide linguistically appropriate and culturally competent
instruction aligned with core standards, differentiated for students with reading and
math performance significantly below those of their classroom peers.
• Effective Instruction Based on Core Curricular Standards. Improve instruction
aligned to core curricular standards and expand increasingly intensive interventions,
especially in literacy and math, to reinforce standards-based instruction. Consider
augmenting the commercial reading and programs with additional foundational
materials that would address alignment issues. 80 Specify interventions in English
language arts and math that are evidence-based and can fill instructional gaps for
students with IEPs who are behind academically. Provide for flexible groupings of
students when there is a need for common interventions, and adjust the groupings based
on changing student needs.
• Planned Collaboration. Expect collaboration among general and special educators,
paraprofessionals, and related-services personnel in providing instruction and
interventions for students they have in common.
• Positive Support for Behavior. Enhance the knowledge of and supports for teachers
who work with students with challenging behavior to reinforce time engaged in
teaching and learning. Plan for the expansion and identification of personnel available
for observing classrooms, modeling effective practices, and coaching in schools with
no other internal expertise. Also, undertake activities needed to support the
development of meaningful functional behavior assessments and behavior intervention
plans.
• Elimination of “Voluntary” Out-of-school Suspension. Explicitly prohibit sending
students home “voluntarily” in lieu of a formal suspension with documentation and
notice to parents.
• English Learners with IEPs. Bring together personnel from the English learner and
special education departments, along with others with instructional expertise, to
articulate necessary interventions for ELs with IEPs. Based on a review of current
models, identify best practices in the systemic implementation of special education and
language acquisition strategies.81
80 See the analysis of materials conducted by Student Achievement Partners. 81 See, for example, “Background and Resources for the English Language Learners – Students with Disabilities
Guidance,” retrieved from http://www.p12.nysed.gov/specialed/lawsregs/documents/regulations-part-200-201-oct-

Improving Special Education Services in the Detroit Community School District
Council of the Great City Schools Page 88
• Advanced Classes. Review gaps in the provision of IEP-accommodations for students
taking advanced classes to identify necessary steps to meet student needs.
• Specific Learning Disabilities Program. Review the SLD program to determine how
more students could receive core instruction in general education classes,
supplemented by evidence-based intensive interventions designed to accelerate
literacy. Address the large proportion of students with IEPs who have poor reading
skills, and the high percentage of those students likely to have dyslexia.82 School
districts with which we are familiar have established clustered programs with evidence-
based intensive interventions. They often find that centralized approaches reach some
but not every student who would benefit from such interventions. Having all such
students attend a centralized program is neither realistic nor advisable. A combined
menu of intensive interventions designed to address various reading, writing and other
needs – along with professional development for general and special education
personnel to deliver the interventions – is necessary to reach a larger number of students
with need.
• Support for Students with Vision/Hearing Impairments. Identify service gaps and
school districts that have high outcomes among students with these disabilities when
educated in regular schools. The Council can offer examples of such school districts.
• Flexible Service Delivery Models. Define effective models for supporting students in
general education classes using a flexible service model. Such models should 1)
improve teaching/learning of students in general education classes using a flexible
service delivery model; 2) expand options for students who would otherwise attend
specialized programs to receive more effective instruction in general education classes;
3) support English learners with IEPs to address their language acquisition needs as
well as their instructional needs related to their disabilities;834) schedule common
planning time for special and general educators who work with the same students; and
5) increase the proportionate share of students with IEPs at schools with low
percentages.
• Special Program Configuration. Review DPSCD’s special program configuration and
investigate with Wayne RESA other special program configurations in other RESAs
that enable schools to offer clustered instruction based on student needs rather than
categorical disability areas. Plan to modify the current program configuration to put
more emphasis on common learning needs rather than disability characteristics. Ensure
that each specialized program is available at all grade levels and that all programs,
including those for students with severe cognitive impairments and severe multiple
impairments, have classes available in regular schools.
• Master Plan. Develop a master plan for the equitable placement of specialized
programs across the district. Include facilities and transportation personnel in these
discussions.
2016.pdfhttp://education.ohio.gov/getattachment/Topics/Other-Resources/English-Learners/ELL-
Guidelines/Guidelines-for-Referral-and-identification-of-1/ELL-SWD_partIII.pdf.aspx. 82 See, for example, Statistics on Dyslexia, retrieved from https://www.dyslexiacenterofutah.org/dyslexia/statistics/. 83 Engage personnel from schools with dual language and bilingual programs, along with other central office
personnel and Wayne RESA. .

Improving Special Education Services in the Detroit Community School District
Council of the Great City Schools Page 89
• Emotional Impairment Program. Review the emotional impairment and day treatment
programs. Ensure that by next school year there are sufficient supports for students who
need high intensity interventions at the high school level in regular schools, and that
students in day-treatment programs have access to courses leading to a high school
diploma.
• Reliance on Center Schools. Determine the types of instruction, services, and physical
and material resources necessary to effectively educate in regular schools those
students who would otherwise be placed in center schools. Collaborate with Wayne
RESA on this. Include visits to other school districts in Michigan and elsewhere to
observe regular schools successfully educating these students.
• Parent Communication. Outline how information can be better shared with parents
about options for their children to be educated effectively in more inclusive settings.
Collaborate and communicate with parents more effectively.
• Disproportionate Special Education Enrollments. Review schools with enrollments
having disproportionately high and low SPED enrollments and address the proximate
causes of these disparities. Reduce the high proportion of students with IEPs at Detroit
Institute of Technology at Cody.
• Transportation Protocol. Develop a protocol for IEP teams to determine student need
for door-to-door transportation, specialized equipment, etc. Include transportation
personnel and other stakeholders in the protocol’s development.
• Postsecondary Transition Planning. Determine how IEP teams can be provided with
practice and feedback on written parameters used for state monitoring of postsecondary
transition expectations. Collaborate with Wayne RESA in this process.
• Path to Graduation. Based on data and focus group feedback, identify and act on the
most common reasons students with IEPs do not graduate with a diploma, e.g., access
to courses necessary for graduation, failing grades, absences, etc.
• Training for Careers. Identify the gap between students needing career training and
options available, the resources necessary to support their training needs at career
technical centers, and activities needed to fill gaps.
• Community-based Job Training. Expand opportunities for students who would benefit
from community-based job training, including students in regular high schools. Use the
resources and expertise of external partners to assist with planning and execution.
• Placement Center. Take steps to implement a school-based enrollment process for
schools of various types that would be inclusive of all students with IEPs, including:
- Records. Obtaining records from prior schools and school districts;
- Interim Services. Determining how interim services could be provided at local
schools if it is ascertained that the school does not have the resources currently
available to meet a student’s IEP-identified needs.
- Communication. Processes for communicating with receiving schools and with
parents.
- Immediate Concerns. Address immediate placement center concerns, e.g.,

Improving Special Education Services in the Detroit Community School District
Council of the Great City Schools Page 90
increasing the number of phone lines, reception of parents, etc.
- Time Frame. Specify the maximum time frame (not to exceed 10 days) for
identifying optional schools for students when necessary, arranging for
transportation, and facilitating student transfers.
• Immediate Instruction and Service Delivery. Eliminate the need for students to be
home waiting for placement.
• IEP Decision Making. Establish worksheets for IEP teams when they are considering–
- General Education Classes. Students’ education in general education classes and
supports needed for core instruction and evidence-based interventions.
- Special Programs. Students’ learning levels in specialized education programs.
Clarify that low grades (without an examination of appropriate instruction,
interventions, and supports provided) should not drive placement.
• Assistive Technology. Consider resource gaps with students who would benefit from
assistive technology, especially those who are nonverbal, and how to expand their
access to devices and services.
• Wayne RESA Plan. Clarify for all relevant administrators and staff members their roles
and responsibilities regarding the Wayne RESA Plan for the Delivery of Special
Education, the Act 18 Agreement, the Act 18 Budget process, and center program
procedures. Build this into the implementation plan.
• Parent Concerns. Collaborate with parents on the creation of a special education
advisory council for each cohort, and possibly a districtwide advisory council. Also,
consider structured ways that parents could voice their concerns on a regular basis,
beginning at the school level and continuing through the cohort level. Determine how
special education department personnel would support this process. Consider how
concerns will be documented and addressed within a reasonable time frame.
Feedback. Collect feedback on the draft improvement plan from stakeholders at varying
grade levels, and among special/general education administrators, principals,
general/special education teachers, related-service providers, teacher assistants, parents,
and community-based organizations. Continue this feedback loop as the plan is
implemented to identify and address concerns.
c. Written Expectations. As part of the implementation plan described in Recommendation
4b, develop written expectations on each plan component. (Coordinate with
Recommendation 2c.)
d. Differentiated Professional Learning and Parent Training. Embed in the professional
development curriculum (Recommendation 1e) content needed to carry out
Recommendation 4. Embed into current walk-through protocols indicators associated with
implementation plan components that the district expects to be in place within a specified
time-frame.
In addition, consider –
• How training will be provided using a multidisciplinary and interdepartmental
approach, so that professional learning to promote inclusive education is not viewed

Improving Special Education Services in the Detroit Community School District
Council of the Great City Schools Page 91
incorrectly as a “special education” initiative;
• How and when all personnel will be trained in each critical area;
• How key information will be communicated effectively, including the use of on-line
training for compliance issues that are more rote in nature;
• How information will be used;
• How all stakeholder groups will be included, e.g., principals, general and special
educators, clinicians, paraprofessionals, etc.
• What additional coaching and supports may be needed;
• Principal leadership training necessary to maximize and leverage inclusive and high-
quality instruction and supports, including training on flexible uses of school-based
budgets to expand inclusive education; and
• Engaging Wayne RESA and stakeholders on expanding training opportunities for
parents.
e. Data Analysis and Reports. In addition to activities proposed in Recommendation 1e,
embed in school performance and planning frameworks--
• Data Reporting. The types of data needed to better target patterns and areas of concern.
• Risk Ratios. Report disparities using a risk ratio to better understand district practices
and their effects.
f. Monitoring and Accountability. Expect all principals to be responsible for overseeing
special education in their buildings and hold them explicitly accountable for such.
Articulate how cohort principal leaders will work with their principals and how they will
exercise their responsibilities to ensure principals are serving students with disabilities.
Embed the following activities into the monitoring and accountability systems described
in Recommendation 1g. and 2f.
• Data Checks. Include information on students with disabilities in data discussions to
inform follow-up actions and track outcomes. Ensure that data includes all SPP
indicators.
• Fidelity Assessments and Walk-Throughs. Review walk-through tools used to support
instruction and interventions in general education classes, resource classes, and special
programs to see how students are being taught. Initiate technical assistance,
professional development, coaching, and mentoring to improve practices.
• Timely Communication and Feedback. Establish a process for timely feedback to the
district’s MTSS leadership team on barriers to inclusive education.
• Monitor. Monitor and follow up on –
- Informal School Removals. Students who are sent home without documenting out-
of-school suspensions.
- Placement. Extent to which students receive placements within expected time
frames.
- Waiting for placement. Students at home while waiting for placement.

Improving Special Education Services in the Detroit Community School District
Council of the Great City Schools Page 92
- Too High Caseloads. How special education teacher caseloads can be monitored
on a continuing basis using electronic data that is gathered at the school level.

Improving Special Education Services in the Detroit Community School District
Council of the Great City Schools Page 93
IV. Support for Teaching and Learning for Students with Disabilities
This section summarizes DPSCD’s supports for teaching and learning for students with
disabilities. The section covers interdepartmental collaboration, administration and operation of
special education, compliance issues, fiscal issues, and accountability.
Interdepartmental Communication and Collaboration
Given concerns about student achievement and social/emotional wellness generally, and
issues surrounding the high costs and legal implications of special education, it is essential that
central office staff and school leadership collaborate effectively to leverage their collective
management and operational resources.
The Council team heard repeated concerns from all focus groups about the lack of
communications of the district’s organizational changes, shifts in roles and responsibilities,
direction, and vision. There were similar concerns about communications with the Michigan
Department of Education. In its systemic state improvement plan for special education (SSIP),
MDE acknowledged that it has traditionally functioned as a regulatory agency with limited cross-
office collaboration. This lack of state-level alignment has resulted in a lack of coherence and
conflicting expectations, systems, and improvement activities in the state’s local districts.
According to the SSIP implementation plan, MDE is expected to improve their collaboration and
approach to district improvement in a systemic way, leveraging resources with a tiered model that
will help build capacity of local districts to improve outcomes. It appears from the Council team’s
interviews that some of DPSCD’s organizational issues mirrored challenges MDE is addressing in
its SSIP.
Interview and Focus Group Participant Feedback
Interviewees voiced the following issues and concerns about the interaction and
collaboration across various central office departments and other entities to strategize and problem
solve around common issues involving special education.
• Cabinet Meetings. The superintendent meets with his cabinet weekly.
• Special Education Director Involvement. The senior executive director (director) for special
education does not participate in cabinet meetings. In her absence, the deputy superintendent
(deputy) represents special education. The deputy also represents other areas under her
supervision, and the issues involving special education have been in existence for years, are
persistent, significantly affect schools and students, and are costly.
• Academic Leadership. A strong collaborative relationship appears to exist between the deputy
and senior executive director for curriculum and instruction (C/I) who reports directly to the
superintendent. The deputy and C/I senior executive director are jointly leading academics in
the absence of a chief academic officer. The two leaders meet weekly with each other, and
sometimes with others of their teams to discuss their respective work.
• Regular Communication. According to interviewees, regularly scheduled communications
appear not to be occurring between C/I and the deputy’s academic-related leaders, including
principal leaders, special education, English language learners, etc. As a result, information is
not being adequately shared on upcoming plans around such areas as MTSS development;

Improving Special Education Services in the Detroit Community School District
Council of the Great City Schools Page 94
curriculum framework development and adoption; organizational structures; special education
roles and responsibilities; and how various institutional components can be leveraged and
coordinated.
• Principal Leaders. Principal leaders meet with the deputy weekly. Except for the cohort five
principal leader (who reports directly to another deputy), the leaders have not been explicitly
authorized to meet with their respective principals. Currently, all principal leaders meet as a
group with the deputy. The special education senior executive director does not attend these
meetings, and the deputy addresses any special education issues. The Council team was told
that it would be helpful if the principal leaders could meet with their respective principals and
with the special education director on a regular basis to address and resolve school-based
special education issues. They also indicated that they have a general idea of C/I planning, but
more in-depth information would be helpful.
• Special Education Liaisons. Although a special education liaison is assigned to each cohort,
they have not had an opportunity to establish an ongoing working relationship with their
respective principal leaders. Not all principals and principal leaders know about the special
education liaison or have met with their respective special education liaisons.
• Collaborative Relationships. Strong individual relationships have been established between
special education office personnel and others, such as the district’s compliance lawyer, general
counsel attorneys, and staff members from English language learners and transportation
departments.
Administration and Operation of Special Education
With new DPSCD leadership beginning in May 2017 and the appointment of a new special
education director at the beginning of the school year, there have been many changes in staffing
and organization. This section addresses the special education department’s current organizational
structure and focus group issues about organizational changes.
Special Education Organizational Structure
The special education department is organized around units of individuals defined by the
five cohorts, compliance, and ancillary personnel. Each unit, however, does not have a formal
“leader” as such. Instead, at least on paper, there are some 22 supervisors, including five vacant
positions and 3 directors who report directly to the senior executive director. Informally, one
individual has assumed the lead in some units. Although staff members are striving to make this
structure work, it was not clear to the team how it could translate into supervisory accountability.
• Cohort 1. In addition to supporting schools in cohort 1, personnel in this cohort include nine
supervisors in the following programmatic areas: developmental disabilities, physical and
other health impairments, dual diagnosis (CI and EI), autism spectrum disorder, severe
multiple impairment, severe cognitive impairment, physical impairment, moderate cognitive
impairment, emotional impairment, visual impairment, work skills, Project Search, and
orientation/mobility. In addition, 20 teacher consultants and 2 specialists support various
functions.
• Cohort 2. One supervisor is assigned to cohort 2.
Improving Special Education Services in the Detroit Community School District
Council of the Great City Schools Page 95
• Cohort 3. One supervisor is assigned to cohort 3, along with a director for foster care and early
childhood special education programs.
• Cohort 4. One supervisor is assigned to cohort 4.
• Cohort 5. Two supervisors are assigned to cohort 5--one for occupational and physical therapy
and the second for postsecondary transition, who is assisted by two transition specialists.
• Compliance. With three supervisors, this unit is responsible for compliance and complaints
(assisted by five IEP specialists); placement; and Medicaid.
• Ancillary. This unit has one director, one interim deputy executive director, and eight
supervisors. Each one is responsible for psychologists and Project Find; social workers and
interns; health and physical education; speech/language pathologists; audiologists and Section
504; social workers; early intervention and limited licensed social workers; and nonpublic,
assistive technology, and limited-licensed psychologists. Eight additional staff members
support various other functions. The supervisors evaluate their respective personnel, but the
personnel are not assigned by cohort.
The team would anticipate that a special education liaison would support the schools in
each cohort under the guidance of a principal leader. This would a preferred organizational
structure to support schools, but it has not been realized because cohort personnel continue to have
supervisory responsibility in addition to many schools to support. As a result, supervisors have
little time to meet with principals or their leaders. The liaisons’ small bandwidth and large scope
of responsibilities makes the current structure untenable, and the structure is not reasonably
calculated to maximize support to schools. The combination of new personnel, uneven roles and
responsibilities, and little time to meet with principals is not an optimal organizational
arrangement.
The special education leadership team meets with the senior executive director on a weekly
basis, but the special education department has not yet met together. Staff members want to be
more collaborative and proactive than reactive, but they are not there yet.
Focus Group Feedback about Special Education Department Operation
Several themes emerged from interviews about the management and operation of special
education, including the authority of the senior executive director, the reorganization of
department personnel, and coordination with Wayne RESA.
Senior Executive Director Authority
There was a widespread perception among interviewees that the deputy superintendent for
schools has taken on the leadership role for special education and the executive director now lacks
the authority to direct, supervise, and make necessary decisions within the department. In other
words, she has not been given the standing that a typical special education leader would have to
carry out her responsibilities, including communications with principals. These circumstances, in
part, may be due to the superintendent’s and deputy’s long-standing working relationship from
their prior school district, the deputy’s experience with special education, and the significant and
complex issues that special education presents. However, a by-product of the deputy’s tight
oversight (on top of her expansive responsibilities in other areas) has been an uneven flow of

Improving Special Education Services in the Detroit Community School District
Council of the Great City Schools Page 96
information that has affected special education service delivery and operations. An example
involved the senior executive director’s not being invited to the oral debriefing on this project with
the superintendent and deputy, even though one of her responsibilities was to “complete the special
education audit with the [Council of the Great City Schools].” As this report was drafted in April
2018, the senior executive director had still not been formally debriefed by the deputy
superintendent.
Other issues impacting the management and operation of special education emerged as
well. One involved a concern that the senior executive director was “spread too thin,” which was
not surprising based on the number of her direct reports. Some interviewees believed, however,
that delays in decision-making reflected “control” or “oversight” issues rather than span of control
problems.
Reorganization of Special Education Personnel
The 2017-18 school year began with all but 3 of 22 supervisors having new positions and
roles. Upper level leadership believed that the current structure required immediate attention. And
it acted on them expeditiously. These changes, however, raised concerns among both school
personnel, parents, and other stakeholders that staff expertise and voice were not taken into
account. There was a view among some that new leadership essentially dismantled special
education. Feeding this perception were personnel cuts and a decision at the beginning of the
school year to redeploy special education department staff with teaching credentials to fill teacher
vacancies as substitutes. Reportedly, these personnel received one day’s notice before they were
to report to their assigned classes. Staff were concerned about the undefined length of time these
teachers were to be deployed and how their prior responsibilities would be covered. Not
surprisingly, personnel morale was reported to be low and willingness to voice concerns was
tentative for fear of retribution. In some respects, the team was not surprised that staff felt
disrespected on the heels of the state’s long-term “takeover” of the district when a lot of people
believed that their voices were not heard.
Personnel changes in special education have also created some confusion in the field about
who to contact on various special education issues.84 Several focus group members indicated that
now was the time for “overcommunication” among all stakeholders.
Another complicating factor is the impact of Detroit’s Organization of School
Administrators and Supervisors (OSAS). Unlike most other urban school districts, when
administrative positions in Detroit are eliminated remaining administrators may use their seniority
to bump or automatically claim open positions for which they are qualified. Interviewees, however,
frequently raised concerns about whether positions were being filled with individuals who were
truly qualified.
Coordination of Wayne RESA
Act 18 services for students with moderate to severe disabilities are funded by Wayne
RESA. These services include special education/related services in center schools and approved
individual student aides. According to Wayne RESA staff, they have developed positive
84 There is also confusion about who to call in other departments because of reorganized personnel.

Improving Special Education Services in the Detroit Community School District
Council of the Great City Schools Page 97
relationships with DPSCD special education leadership; are communicating regularly about issues
of concern; and see progress. Also, RESA reported that the director was developing a positive
presence in the community and with principals. The Council team generally saw hard working and
dedicated staff in the special education department itself. Nevertheless, staff shared outstanding
issues about the department’s organizational structure and communications. These issues have
been shared by the Council with both the deputy of schools and senior executive director.
To address outstanding issues, Wayne RESA staff have recommended that the district:
• Have the senior executive director participate in cabinet meetings;
• Assign supervisors and staff with proper credentials and approvals;
• Clarify the role of the Act 18 to supervisors and building principals;
• Develop a communication plan that is comprehensive and seamless; and
• Ensure supervisors consistently attend Coordinating Council/Region meetings.
The Council team supports these recommendations.
School-based Support for Special Education Management and Operation
The delivery of special education and related services is a shared responsibility between
building administrators and central office supervisors. Principals, lead teachers, and special
educators have important roles in this process.
Principals
Principal leadership varies by school, with some leaders who are very involved with the
operation of special education; and others who are not as engaged and exercise little oversight
authority over either special education or bilingual education. However, there was nearly universal
recognition that most principals had not received the training they needed to be effective in these
two areas or to be held accountable for effective operations and better results. Generally, principals
welcomed the opportunity to receive more training on special education compliance and on how
they could improve their ability to produce better results. This is not likely, however, unless
DPSCD gives principal training in this area higher priority. Nonetheless, one positive development
now is the regular participation of principals in school walkthroughs that include special education
classes. To be effective, however, principals need clearer protocols to guide meaningful classroom
observations.
Lead Teachers
It is expected that each school will have a lead teacher who acts as a liaison with the special
education department, but this expectation is not consistently implemented. Lead teachers are a
valuable school resource and have important coordinating roles that involve monitoring timely
special education meetings; reporting student counts and caseloads; and supporting compliant
practices.
According to interviewees, there were several concerns about the lead teacher role and their
ability to carry out their responsibilities. Some of these concerns included--

Improving Special Education Services in the Detroit Community School District
Council of the Great City Schools Page 98
• Problem-Solving. When lead teachers have a problem that they or their principals cannot
resolve, neither one is clear about who in the special education department to contact for help.
This problem is exacerbated when either the lead teacher or principal is not very
knowledgeable about specific special education procedures and requirements.
• Scope of Responsibility. Compliance is difficult to manage when a school has one lead teacher
and many programs, such as 13 in one school.
• Protocol. There is no well-known protocol to support lead teachers in carrying out their role
and responsibilities.
• Training. Lead teachers are expected to attend training sessions to learn about new special
education requirements, and in turn provide training to school-based special educators and
others. These meetings are not consistently attended by all lead teachers.
• Volunteerism. Lead teachers do not receive a stipend or have a reduced case-load. As a result,
some principals are unable to find a special educator willing to carry out this voluntary role. In
such cases, no lead teacher is available to go to training sessions, leading to more compliance
issues.
Case Management
Special education teachers carry out case management responsibilities for students on their
caseloads. In this capacity, they are required to schedule all special education-related meetings
with parents, including coordinating with and sending notices to all meeting participants. They,
along with related-service providers, are expected to monitor their due dates for reevaluations, and
annual IEP meetings. The case managers are supported by special education department-initiated
reports on upcoming due dates and coaching by IEP specialists. According to focus group
participants, it is difficult for special educators to carry out their case management responsibilities
because of their many other competing priorities (e.g., teaching), finding coverage for their classes,
getting required participants to attend meetings, and fitting meetings into their block of prep time
when the allowable time frame is too small.
Special Education Related Staffing Ratios and Information
This subsection presents data on staff-to-student ratios in special education, i.e., special
educators, paraprofessionals, speech/language pathologists, psychologists, nurses, occupational
therapists (OTs), and physical therapists (PTs). DPSCD ratios are compared to other urban school
districts on which we have data.85 (All districts did not report data in each area.) These data are
based on full time equivalent (FTE) staff members and not on the number of positions per se. Also,
the Council team presumes that FTE data included vacant positions.
The data do not give precise comparisons, so results need to be used with caution. District
data are not consistently reported (e.g., some districts include contractual personnel and others
exclude them) and data are sometimes affected by varying placement types used by school
districts. The data may count all students with IEPs, including those placed in charters, agencies,
85 Much of the data were provided by the school districts that responded to a survey conducted by the Urban Special
Education Leadership Collaborative; the Council team or members of the team collected the remaining data during
district reviews.

Improving Special Education Services in the Detroit Community School District
Council of the Great City Schools Page 99
and nonpublic schools, while other districts do not count these students. Still, these data are the
best available and are useful as a rough guide to staffing ratios. Appendix A has detailed data on
each school district.
Special Educators
The following are data on special education teacher ratios and other information provided
by the district along with focus group feedback.
Special Education Teacher Staffing Ratios
Exhibit 4a shows the district’s student-to-special-education teacher ratios, compared to 75
other urban school districts. With 535.8 full-time-equivalent (FTE) special educators, DPSCD has
an average of 16 students with IEPs (including those with speech/language impairments) for every
special educator.86 This ratio is higher than the 14.4 teacher-student average among all districts on
which we have data and ranks DPSCD as 50th among 75 reporting districts. In other words, DPSCD
has fewer such staff than the other districts.
Exhibit 4a. Average Number Students for Each Special Educator
Areas of Comparison Special Education Teachers
Number of DPSCD Staff FTE 535.8
DPSCD Student w/IEP-to-Staff Ratios 16:1
All District Average Ratios 14.4:1
Range of All District Ratios 7–37:1
DPSCD Ranking Among Districts87 50th of 75 districts
Vacant Special Education Teacher Positions
Special education teacher shortages have been an historic issue in the district. According
to district representatives, there were 37 positions being filled by long-term substitutes, 6 by TCs,
and 1 by a behavioral specialist. Another 11 positions were vacant. These shortages were a
common concern among focus group participants.
Allocation of Positions and Hiring
The following information was provided by the district on how special educator positions
were filled, allocated to schools, and supervised.
• Allocation. To determine the number of special education teachers each school requires, the
district reviews the previous school year’s special education enrollment, and staffing is
determined by various special education qualifiers.
• Hiring/Supervision. In the past, the special education department made hiring decisions for
86 Although special educators for the most part do not instruct students with a speech/language impairment only, as
SLPs are the primary providers, these students were included as students with IEPs among all surveyed districts. 87 Ranking begins with districts having a low average number of students to one staff person.

Improving Special Education Services in the Detroit Community School District
Council of the Great City Schools Page 100
special educators meeting state criteria. School principals are making these decisions now.
School-based special education teachers are supervised by principals and special education
supervisors may provide input.
Paraeducators
The following is information about paraeducator88 ratios and feedback from focus group
participants.
Paraeducators Staffing Ratios
Exhibit 4b shows the district’s student-to-paraeducator ratios, compared to 75 other urban
school districts. With 458 FTE paraeducators, DPSCD has an average of 19 students with IEPs for
every paraeducator.89 This ratio is higher than the 15.7 paraeducator-student average among all
districts on which we have data and ranks DPSCD as 60th among 75 reporting districts. In other
words, DPSCD has fewer such staff than other districts.
Exhibit 4b. Average Number Students for Each Paraeducator
Areas of Comparison Paraeducators
Number of DPSCD Staff FTE 458
DPSCD IEPs-to-Staff Ratios 19:1
All District Average Ratios 15.7:1
Range of All District Ratios 4.3–56:1
DPSCD Ranking Among Districts90 60th of 75 districts
Paraeducator Vacancies
When the team made its site visit, DPSCD had 30 vacant paraeducator positions, including
six in one school. Some vacancies were due to program growth.
Allocation of Positions, Hiring, and Supervision
The district provided the following on how paraprofessional positions were filled, allocated
to schools, and supervised.
• Allocation. Paraprofessionals are allocated to schools based on state criteria and IEP decisions
on individual students. An evaluation of student need includes standardized tests, parent input,
classroom observations, teacher input, and student classwork.
• Hiring/Supervision. Paraprofessionals meeting established criteria are hired by the district. In
the future, principals will make hiring decisions on paraprofessionals. The school principal is
responsible for monitoring paraprofessionals’ work performance.
88 The term paraeducator is used generically. 89 Although special educators for the most part do not instruct students with a speech/language impairment only, as
SLPs are the primary providers, these students were included as students with IEPs among all surveyed districts. 90 Ranking begins with districts having a low average number of students to one staff person.

Improving Special Education Services in the Detroit Community School District
Council of the Great City Schools Page 101
Related Services
Staffing ratios for related-services personnel are summarized below and shown in Exhibit
4c.
• Psychologists. With 40 FTE psychologists, there was one psychologist for every 218 students
with IEPs, compared to the district average of 178 students. DPSCD ranked 51st of 67 reporting
districts in its number of psychologists. Some 4 FTE contractual personnel are filling
psychologist positions. According to district staff, there was a desire to hire 21 more
psychologists.
• Speech/Language Pathologist (SLP). With 98 FTE speech/language pathologists (SLPs),
there was one SLP for every 89 students with IEPs in DPSCD, compared with the district
average of 127:1 students. DPSCD ranked 31st of 73 districts reporting SLP data. Some 53.5
FTE contractual personnel are filling SPL positions.
• Social Workers. With 76 FTE social workers, there was one social worker for every 115
students with IEPs in DPSCD, compared with the district average of 295:1 students. DPSCD
ranked 18th of 47 districts reporting social worker data.91 Some 12 FTE contractual personnel
are filling social work positions. According to district representatives, there was a desire to
hire 117 social workers, including those funded under Title 1.
• Nurses. With 38 FTE nurses, there was one nurse for every 230 students with IEPs in DPSCD,
compared with the district average of 163:1 students. DPSCD ranked 51st of 60 districts
reporting data on nurses.92 Some 38 FTE contractual personnel (including 18 dedicated for
students with IEPs) were filling nursing positions.
• OTs. With 31.6 FTE occupational therapists (OTs), there was one OT for every 276 students
with IEPs in DPSCD, compared with the district average of 353:1 students. DPSCD ranked
29st of 71 districts reporting OT data. Some 22 FTE contractual personnel are filling OT
positions.
• PTs. With 10 FTE occupational therapists (PTs), there was one PT for every 873 students with
IEPs in DPSCD, compared with the district average of 997 students. DPSCD ranked 38th of 71
districts reporting OT data. Some 7 FTE contractual personnel are filling PT positions.
Exhibit 4c. Average Number Students for Each Speech/Language Pathologist and Psychologist
Related-Services Areas Psychologists SLPs Social Worker Nurses OT PT
Number of DPSCD Staff FTE
40 98 76 38 31.6 10
DPSCD Students w/IEPs-to-Staff
218:1 89:1 115:1 230:1 276:1 873:1
All District Average Ratio 178:1 127:1 295:1 163:1 353:1 997:1
Range of All District Ratios
26–596:1 31–396:1 26-705:1 58-834:1 64-1685:1 128-2941:1
DPSCD Ranking 51st of 67 31st of 73 18th of 47 51st of 60 29th of 71 38th of 71
91 There are 85.5 FTE social workers dedicated to students with IEPs. All figures reflect total numbers of social
workers regardless of whether they have restrictions on service. 92 There are15 FTE nurses dedicated to students with IEPs.

Improving Special Education Services in the Detroit Community School District
Council of the Great City Schools Page 102
Allocation of Positions, Hiring, and Supervision
For service providers with maximum caseload limits, staffing is typically calculated at 80
percent of the cap with consideration given to service time required for students on each caseload.
Additionally, the type of service provided (e.g., small group or individual) to students is taken into
account. For school psychologists, administrators consider school needs, like initial evaluation
numbers, active RCT processes, and use of psychologists for interventions. Unlike other districts
in which principals supervise and evaluate related services personnel at their schools, special
education supervisors perform this function in DCPSD.
Overall School District Rankings
Exhibit 4d shows DPSCD’s rankings compared to other responding districts in each of the
personnel areas. These figures must be viewed with caution and should not be used to make
personnel decisions.
• Special Educators. Of 75 responding districts, 50 districts (67 percent) had smaller student-
to-personnel ratios.
• Paraprofessionals. Of 75 responding districts, 59 (79 percent) had smaller student-to-
personnel ratios.
• Speech/Language Pathologists. Of 73 responding districts, 30 (41 percent) had smaller
student-to-personnel ratios.
• Psychologists. Of 67 responding districts, 50 (75 percent) had smaller student-to-personnel
ratios.
• Social Workers. Of 47 responding districts, 17 (36 percent) had smaller student-to-personnel
ratios.
• Nurses. Of 60 responding districts, 51 (85 percent) had smaller student-to-personnel ratios.
• OTs. Of 71 responding districts, 28 (39 percent) had smaller student-to-personnel ratios.
• PTs. Of 71 responding districts, 37 (52 percent) had smaller student-to-personnel ratios.
Exhibit 4d. DPSCD Ranking and Number of District Survey Respondents
SpecialEducator
s
Para-educator
sSLPs
Psychol-ogists
SocialWorkers
Nurses OTs PTs
Total Districts 75 75 73 67 47 60 71 71
No. Districts with Smaller Student-to-Personnel Ratios
50 59 30 50 17 51 28 37
0
20
40
60
80
0
20
40
60
80

Improving Special Education Services in the Detroit Community School District
Council of the Great City Schools Page 103
Personnel Shortages
According to district staff, DPCSD has severe shortages of personnel in the areas of special
educators, paraprofessionals, nurses and psychologists. The shortages are affecting service
delivery, referrals, and timely evaluations. Furthermore, in some circumstances staff members are
filling positions for which they are not qualified. Although the number of vacancies has declined
since September 2017, there remained seven special education department staff members who were
not carrying out their required responsibilities because they were acting as substitutes in
classrooms without an assigned special educator. According to focus group participants, even
when principals could identify personnel to fill a vacant position, the hiring process did not take
place in a reasonable period. As a result, potential hires were lost to other districts.
Focus Group Feedback About Shortages
The following concerns were raised by focus group participants about personnel shortages.
• Psychologists. A relatively large number of psychologists are leaving DPSCD to retire or work
for other districts. Four schools had no assigned psychologist. This was impacting the RCT
process and students whose parents who may otherwise have been asked to consent to an
evaluation.
• Speech Language Pathologists. These personnel have a large turnover rate, and maintaining
current personnel is challenging because DPSCD’s salary and benefits structure is lower than
surrounding districts.
• Nurses. Reportedly, some schools were noncompliant with state requirements because two
people had not been trained to use EPI pens.
• Contractual Personnel. The district relies on numerous contractual staff due in part to
difficulty recruiting and hiring potential employees. Private agencies on which the district
relies to supplement nursing services are also having difficulty recruiting nurses. Several
principals of charter schools shared with the team that they use agencies successfully to fill
their special education staffing needs.
Recruitment & Incentives
Interviewees described several recruitment activities and incentives that the district was
discussing to reduce personnel shortages in special education, including--
• Recruitment Plan. A plan has been presented to the board of education to address recruitment
beyond Michigan, with a focus on special education.
• Hiring Events. Active recruitment from universities is ongoing with 38 events scheduled at
colleges and universities, including Gallaudet University, which educates college students who
are deaf and have hearing impairments.
• Incentives. Incentives are under review or have been initiated, including--
- Salary incentives, bonuses, salary schedule advancements, etc.;
- Support to paraprofessionals and general educators to continue their education and
become certified in special education; and

Improving Special Education Services in the Detroit Community School District
Council of the Great City Schools Page 104
- City of Detroit initiative for city employees, including school personnel, to receive loans
to rehabilitate newly purchased homes.
- The district is exploring recruitment incentives for external partners.
Compliance Issues
There is inconsistent knowledge and understanding among staff of special education
requirements and procedures mandated under state and federal special education laws. The result,
along with inconsistent implementation issues, can mean compliance problems for the district.
Other issues that affect compliance are reliable data; an effective IEP system; training; and
implementation difficulties stemming from staff shortages.
Written Guidance
DPSCF’s written guidance materials on the management and operation of special education
and Section 504 of the Rehabilitation Act are described below.
Special Education
The district’s 2011 special education operating procedures manual was updated in 2017.
The manual is currently being reviewed for accuracy and timeliness. Although the team was told
that the manual was on-line, it was not updated on the special education department webpage or
readily available to stakeholders. The manual is in pdf format and does not contain links to
additional information or other publicly available resources. It is our understanding that new
procedures are currently being written.
Section 504
DCPSD has a policy on Section 504 that addresses all areas of the law, such as employment
and students. These policies are posted on the district’s website. Reportedly, the district has a
Section 504 manual. District attorneys are working with staff members from the U.S. Department
of Education’s Office for Civil Rights (OCR), which monitors Section 504 (a well as the
Americans with Disabilities Act) to develop a comprehensive document.
Focus group participants reported that Section 504 was not well coordinated at the school
level in DCPSD, and there was little knowledge about its requirements because of the lack of
training. There was also concern about the low number (36) of students having a Section 504 plan.
The following are promising activities that staff described to the team for better coordination and
implementation: leadership of DPSCD’s attorney who has been involved with this initiative since
December 2017; training available from Wayne RESA; and district training being planned for
school staff.
Due Process
Law department attorneys meet with the senior executive director and relevant staff
members twice each month to discuss due process filings and OCR complaints. The number of
filings for due process hearings remained constant between 2015-16 and 2016-17, with six to seven
cases filed each year. As of the team’s site visit, only one matter (later withdrawn) had been filed.

Improving Special Education Services in the Detroit Community School District
Council of the Great City Schools Page 105
State Complaints
The number of complaints filed with MDE against the district held constant from 2015-16
to 2016-17 (34 and 35, respectively). Some 18 complaints had been filed during the current school
year (as of the team’s January 2018 visit). At that point, there were 13 complaints still active. Most
complaints involved the timeliness of evaluations, the timeliness of annual IEPs, child find
obligations, IEPs individualized to meet students’ unique needs, IEP implementation, and
placement decisions.
The consultant who is assisting the senior executive director is working to resolve the
district’s outstanding complaints. Once under control, she will help address issues that most
frequently trigger complaints, such as training for principals and other school personnel on
procedural safeguards required for school removals, prior written notice, IEP implementation, and
other issues.
Overdue IEPs
A major compliance issue facing the district involves the timeliness of IEP meetings. One
reason for delays has been personnel shortages. There is little guidance for principals on how to
develop IEPs and hold meetings when a certified special education teacher is not available. The
special education department’s IEP compliance specialists asked to complete IEPs sometimes lack
appropriate space to conduct meetings or paperwork necessary to support the process.
Historically, DCPSD’s IEPs are completed in the spring and by the October child count
rather than throughout the school year, which is typical in most other school districts. Another
issue is that IEP specialists have been informed that they cannot send out group emails to
principals, so more time is required to collect or provide information one-to-one. Furthermore,
principals do not consistently follow up on requested information in a timely manner.
IEP System
Focus group participants voiced numerous concerns about the district’s IEP system.
• User-friendly Reports for Schools. The system does not produce user-friendly reports, which
are color-coded to support compliance, and that are simple to read and search to address issues
in a proactive manner. School personnel must rely instead on special education department
personnel to submit reports to schools, rather than enabling them to have a menu of real-time
reports they could easily access. Other school districts with which we are familiar use such
easy-to-access IEP systems and reports.
• Data Analysis. The special education department relied on Wayne RESA to issue various data
reports for the Council’s team. These reports were reports that other school districts have been
able to produce independently. The data in them were of a type that the special education
department should be able to routinely run on its own and drive district decision-making.
• IEP System Effectiveness. There was a belief among interviewees that the current IEP system
no longer meets DPSCD’s needs, e.g. enabling teacher names and caseloads to be entered to
facilitate real-time monitoring.
• Notice of IEP System Changes & Training. IEP form changes may occur mid-year but there

Improving Special Education Services in the Detroit Community School District
Council of the Great City Schools Page 106
is no advanced notice about changes unless one attends a meeting or workshop, e.g.,
elimination of dropdown menus. In addition, more training on the IEP system is needed
because of school-based staffing changes.
Fiscal Issues
DPSCD spends a relatively large percentage of its local funds to support special education,
and charter schools can fund special education at a much higher level than the district because of
differences in student need. This information is explained in more detail below.
Proportional Funding Sources
Data in exhibit 4d show the percentages of district revenue in 2014-15 through 2016-17
that was directed to special education from state, federal and local sources. While the percentage
of federal revenue (IDEA and Medicaid) increased from 11 percent to 13 percent of the district’s
budget (some $2+ million) over this period, the percentage of state funding decreased from 59
percent to 56 percent (some $8 million). Local funding remained at about 30 percent of the budget,
even with a net decrease of some $5 million. These figures may have changed in 2017-18 with the
establishment of DPSCD. In the experience of the Council team, the district’s 30 percent local
share is disproportionately high compared to other urban school districts.
Exhibit 4d. Percentage of Special Education Funds from Local, State, and Federal Sources
Comparison of DPSCD and Charter Schools for Total Per Pupil Special Education Costs
Dollar costs for special education per FTE are shown in exhibit 4e. District staff reported
to the Council team that despite having a smaller percentage of resource-intensive pupils and a
larger percentage of resource-light pupils, charter schools incurred 52 percent more in total costs
per pupil on an FTE basis than DPSCD. This discrepancy helps explain why DPSCD would have
to allocate a higher proportion of its general education funds towards special education.
2014-15 2015-16 2016-17
Fed 11% 9% 13%
State 59% 58% 56%
Local 30% 33% 30%
0%
10%
20%
30%
40%
50%
60%
70%

Improving Special Education Services in the Detroit Community School District
Council of the Great City Schools Page 107
Exhibit 4e. Percentage of Special Education Funds from Local, State, and Federal Sources93
MDE directly funds DPSCD charters based on FTE students with IEPs, in addition to
providing federal aid. As previously shown in exhibits 2e and 2f, charter schools enroll higher
percentages of students with lower-cost disabilities such as specific learning disabilities and
speech/ language impairment compared to DPSCD, and lower percentages of students requiring
more intensive supports, such as autism spectrum disorder, cognitive impairment, and emotional
impairment.
Focus group participants voiced concerns that a disproportionate number of students who
returned to DCPSD from charter schools had IEPs, and that those IEPs had fewer than expected
services. Documenting these occurrences are steps that the district’s board of education may want
to take as they renew or terminate DPSCD-authorized charter schools.
Focus Group Participant Feedback on Fiscal Issues
Various fiscal issues were also brought up by interviewees. These included--
• Special Center Budgets. Although Wayne RESA provides funds for their Act 18 special
centers in the spring, the district’s slow processes prevent the centers from implementing
budgeted activities, e.g., hiring and purchasing, until late the following school year – if at all.
This may explain the substantial amount of funds that must be returned to Wayne RESA
because they were not used as intended.
• Vendor System. In the past, it was reported that when compensatory services required the use
of an outside evaluator, it has taken six months to a year for the evaluator to obtain a vender
number.
• Transportation. Special education pupil transportation costs in FY 2018 was budgeted at
$199,669. This cost included 40 percent of students with IEPs--or 3,398 students—with door-
to-door services. This high rate is based on several factors, including the uneven placement of
specialized programs. These placements generally depend on schools having the space and
willingness to host the program. Also, the district does not have a protocol or decision tree to
guide its IEP transportation decisions on whether a student requires door-to-door service.
• Medicaid Revenue. DPSCD receives close to $6 million in Medicaid revenue for services the
district provides for Medicaid-eligible students. Currently, the district does not track service
93 Data from school State Aid Reports, April 2017
DPSCD Charter Schools
Dollars per FTE $32,826 $49,810
$0
$10,000
$20,000
$30,000
$40,000
$50,000
$60,000Dollars per FTE

Improving Special Education Services in the Detroit Community School District
Council of the Great City Schools Page 108
delivery electronically and relies on paper documentation and submissions. Based on
experience in other school districts, potential reimbursements are likely being lost because of
the paper-based process that the district is using.
Accountability
In the fall of 2011, the Council of the Great City Schools published its report Pieces of the
Puzzle: Factors in the Improvement of Urban School Districts on the National Assessment of Educational Progress.94
The report summarized research the Council conducted with the American Institutes for Research
(AIR) on characteristics of urban school districts that made the greatest academic improvements
and had the highest overall performance on the National Assessment of Educational Progress
(NAEP). The first characteristic involved a district’s clear statement of goals and districtwide
accountability for results. These factors help create a culture of shared responsibility for student
achievement.
Other research has found similar results and has clarified barriers to effective teaching and
learning.95 School districts that effectively support school leadership often demonstrate the ability
to facilitate learning, address barriers, and govern and manage the district in ways that prioritize
good instruction. In pursuing these goals, districts showing improvement have mechanisms for
systemic planning, program implementation, evaluation, and accountability.
District staff provided several ways in which DPSCD is bolstering accountability for
student achievement.
• DPSCD’s research and assessment office has developed a data collection system, which has
enabled the district to publish data consistent with annual education report requirements.
• The frequent monitoring of the implementation of the district’s strategic plan will be conducted
through school diagnostic visits, review of benchmark assessments, use of a teacher evaluation
tool, and adherence to the pacing calendar.
• Schools are developing goals to strategically monitor student performance on the M-Step,
NWEA, and iReady.
• The district is developing new metrics to track student growth and student proficiency
benchmarks and skills.
• Students are given report cards and progress reports quarterly to demonstrate academic
progress on each specific content area as aligned to MDE graduation requirements.
Focus Group Participant Feedback
Focus group participants provided several comments around accountability.
94 Available at
http://www.cgcs.org/cms/lib/DC00001581/Centricity/Domain/4/Pieces%20of%20the%20Puzzle_FullReport.pdf 95 Toward a School District Infrastructure that More Effectively Addresses Barriers to Learning and Teaching, A
Center Policy & Practice Brief, Center for Mental Health in Schools at UCLA. November 2011, at
http://smhp.psych.ucla.edu/pdfdocs/briefs/toward%20a%20school%20district%20infrastructure.pdf.

Improving Special Education Services in the Detroit Community School District
Council of the Great City Schools Page 109
• Strategic Plan. As the district monitors implementation of the strategic plan, indicators need
to be developed specifically for students with IEPs. These indicators should take into account
evidence-based practices to drive systemic and school-based improvements.
• Student Growth. Metrics to track student growth and proficiency should address the varied
circumstances of students with disabilities.
• Protocol for Required Activities. There is no protocol or procedure in place to resolve
differences when special education department personnel provide guidance to schools on
compliance or performance and there is either disagreement or lack of follow-up.
AREAS OF STRENGTH
The following are areas of strength in the district’s support for teaching and learning for
students with disabilities.
Interdepartmental Communication and Collaboration
• Collaborative Relationships. The deputy and senior executive director for curriculum and
instruction have a strong working relationship. There is also strong collaboration between
special education department personnel and representatives from other departments.
Special Education Department Operation
• Consultant Support. Although delayed from the beginning of the school year, a highly
respected consultant has been hired to support the special education department.
• Wayne RESA. Wayne RESA staff are communicating regularly with the senior executive
director for special education and her staff about various issues of concern
• Special Education Staff. The district’s special education department has hard working and
dedicated staff.
School-based Support for Special Education Management and Operation
• Students Outside of DPSCD. DPSCD has opened its doors to students with IEPs from other
districts to receive special education services.
• Principal Leadership. Generally, principals welcome the opportunity to receive information
on program compliance and improve their ability to carry out their roles and responsibilities.
Principals participate in school walkthroughs that include special education classes.
• Hiring Decisions. School principals are making hiring decisions for special educators, and
they will be making hiring decisions in the future for paraprofessionals.
• Recruitment and Incentive. Various recruitment activities and incentives are being discussed
to reduce personnel shortages in special education, e.g., improved salary and benefit schedules,
support for continuing education, home loan arrangements, etc.
Compliance Support
• Written Operating Procedures. The 2011 special education operating procedures manual was
updated in 2017 and is being reviewed for accuracy and timeliness. District attorneys are
working with the federal Office for Civil Rights to develop a comprehensive Section 504
document. With training being planned for school staff, there appears to be a foundation for

Improving Special Education Services in the Detroit Community School District
Council of the Great City Schools Page 110
improving Section 504 activities in the future.
• Oversight of Due Process and OCR Complaints. Law department attorneys meet with the
senior executive director and relevant staff members twice each month to coordinate due
process filings and OCR complaints. Relatively few requests for due process are filed by
parents for a district this size.
• MDE Complaints. The district’s special education consultant is helping to resolve outstanding
complaints and is planning to address the most frequent triggering issues, such as training for
principals and other issues related to procedural safeguards, school removals, prior written
notice, IEP implementation, etc.
Fiscal Issues
• Medicaid Revenue. DPSCD receives close to $6 million in Medicaid revenue for services it
provides to Medicaid-eligible students.
Accountability
• Initiatives. DPSCD is moving to bolster its accountability for student achievement by
publishing data consistent with annual education report requirements; monitoring the district’s
strategic plan implementation; having school-based goals to strategically gauge student
performance; developing metrics to track student growth and proficiency on specified
benchmarks and skills; and using quarterly report cards and progress reports on content aligned
to MDE graduation requirements.
OPPORTUNITIES FOR IMPROVEMENT
The following areas provide opportunities for improvement for students with disabilities.
• Regular Communication. Regularly scheduled communications are not always occurring
between curriculum/instruction personnel and the deputy’s academic-related leaders. As a
result, information is not being sufficiently shared with respect to upcoming plans.
• Special Education Director Involvement. The senior executive director (director) for special
education does not participate in cabinet meetings. In her absence, the deputy superintendent
(deputy) represents special education. The deputy also represents other areas under her
supervision, and issues involving special education have been challenging, are persistent, have
significant impact on schools and students, and are costly—and need special attention.
• Cohort Principals and Leaders. Cohort principal leaders and principals meet as a group with
the deputy superintendent. During these meetings, the deputy also represents special education.
Except for the cohort-five principal leader who directly reports to another deputy, the leaders
have not been authorized explicitly to meet with their respective principals to address issues in
their schools.
• Special Education Liaisons. Although a special education liaison is assigned to each of the
cohorts, they have not had an opportunity to establish an ongoing working relationship with
their respective principal leaders.
Administration and Operation of Special Education
• Authority of Senior Executive Director. There is a widespread belief among staff that the

Improving Special Education Services in the Detroit Community School District
Council of the Great City Schools Page 111
deputy superintendent of schools has taken on the leadership role for special education, and,
as a result, the executive director lacks the authority to direct, supervise, and make necessary
decisions in the department. This has led some to perceive the senior executive director has
not moved quickly enough to resolve some issues or answer questions.
• Internal Department Meetings. The special education leadership team meets with the senior
executive director on a weekly basis, but at the time of our visit the special education
department had not yet met as a group.
• Overall Special Education Organization. The special education department is organized
around seven units: five for the cohorts, one for compliance, and one for ancillary personnel.
On paper, there are 22 supervisors, including five vacant positions, and 3 directors that report
directly to the senior executive director. The organizational structure is unwieldly.
• Special Education Liaisons to Cohorts. The team anticipated that a special education liaison
in each cohort would support schools aligned to each principal leader. This arrangement,
however, has not been realized because cohort personnel continue to have program supervisory
responsibility in addition to numerous schools they are assigned to. The liaisons’ small
bandwidth and large span of responsibilities makes the current structure untenable, and the
organization configuration is not reasonably calculated to provide maximum support to
schools.
• Reorganization. The 2017-18 school year began with 19 of 22 new supervisors. There is
clearly a need for immediate attention to the department’s organization, but these expedited
changes raised concerns among school personnel, parents, and other stakeholders. Along with
personnel cuts, special education department personnel were given very short notice to report
to schools to cover classes without certified teachers. It was unclear how long these teachers
will continue this deployment. The reorganization of the special education department has
become complicated by administrator seniority rights. The result has been some positions
being filled by personnel without the knowledge and background necessary to be effective.
• Wayne RESA Recommendations. During meetings with the deputy superintendent and senior
executive director, Wayne RESA made several thoughtful recommendations involving
including the senior executive director in cabinet meetings; assigning supervisors and staff
with proper credentials and approvals; clarifying the role of Act 18 supervisors and building
principals; developing a communication plan that was comprehensive and seamless; and
ensuring supervisors consistently attend Wayne RESA Coordinating Council/Region
meetings. The Council team agreed with these suggestions.
School-based Support for Special Education Management and Operation: Central Office
• Principal Leadership. Principal leadership varies by school. Some principals actively oversee
special education and interact with parents on the program, and others are not as engaged. It
was also clear that all principals have not received the training they need to be effective and
accountable. Unlike other districts having principals supervising and evaluating related-
services personnel at their schools, DPSCD special education supervisors perform this
function.
• School Walk Throughs. Principals need more explicit classroom observations protocols on
special education.

Improving Special Education Services in the Detroit Community School District
Council of the Great City Schools Page 112
• Lead Teachers. Not every school has a lead teacher acting as a liaison between the school and
special education department personnel. The absence of a stipend or reduced caseload makes
it difficult for some principals to find a special educator willing to carry on the lead teacher
role. Issues that affect the effectiveness of lead teachers include: who to call with specific
problems; coordination with different program supervisors; lack of protocols for roles and
responsibilities; and mandatory and differentiated training.
• Case Management. It is difficult for special educators to carry out their case management
responsibilities because of competing priorities (e.g., teaching). Also, prep time is sometimes
too short to complete meetings, and securing required participant attendance at meetings is
sometimes difficult.
Special Education Related Staffing Ratios and Information
• Personnel Ratios. Some staffing ratios are much higher than most other respondent school
districts; others are much lower. The personnel ratios, on their own, do not support personnel
decisions or changes, although many of the findings support the district’s own analysis of
personnel configurations.
• Personnel Shortages. There are substantial shortages of personnel in the areas of special
educators, paraprofessionals, psychologists, and nurses. These shortages affect instruction,
service delivery, timely evaluations, and compliance. Also, numerous positions are being filled
by contractual staff, and current special education personnel are leaving for other districts
because of salary and benefits. When principals identify personnel to hire for vacant positions,
delays in the employment process has sometimes resulted in potential hires taking positions in
other districts.
Compliance Issues
There is inconsistent knowledge and understanding of the requirements and procedures in
state and federal special education laws, which may be leading to both compliance and
implementation problems. Specifically, there is a lack of data availability, an effective IEP system
and IEP development processes, and inadequate training. Some of this is also due to staff shortages.
The following are additional compliance issues.
• Special Education Procedures. The special education operating manual is not readily
available to all stakeholders on the special education department webpage. Using a pdf format,
the current manual does not allow for links to more information or publicly available resources.
• Section 504 Operations. Section 504 is not well coordinated at the school level, and there is
little knowledge about its requirements. Only 36 students in the district are reported to have a
Section 504 plan.
• MDE Complaints. Over the last two years, some 35 complaints against the district were filed
with MDE. Common complaints include issues of the timeliness of evaluations and annual
IEPs, child find obligations, developing and implementing IEPs, and placement decisions.
District personnel are acting to resolve complaints to avoid corrective action.
• Timely IEP Meetings. Holding timely IEP meetings is a compliance issue in the district.
Various reasons were given for delays, including problems with the scheduling of meetings
during the spring and fall rather than throughout the school year. Also, delays were attributed

Improving Special Education Services in the Detroit Community School District
Council of the Great City Schools Page 113
to special education teacher shortages and the lack of written guidance to principals about how
to conduct IEP meetings when a certified special education teacher was unavailable. IEP
compliance specialists who are asked to help schools with IEP development have sometimes
found no appropriate space to conduct meetings or paperwork to support the process. IEP
consultants have been informed they cannot send out group emails to principals, so
communication is more time consuming.
Fiscal Issues
• Local Support for Special Education. DPSCD spends a relatively large 30 percent of its local
funds to support special education.
• Charter School Support for Special Education. Despite having a smaller percentage of
resource-intensive students (e.g., severe multiple impairment) and a larger percentage of
resource-light pupils, (e.g., severe multiple impairments), charter schools have 52 percent more
to spend per pupil than DPSCD. Reportedly, a number of students who return to DCPSD from
charter schools have IEPs, and their IEPs have fewer than expected services. Documentation
of these situations are things the board of education may want to consider as they renew or
terminate DPSCD-authorized charter schools.
• Center School Budgets. Although Wayne RESA provides center schools with their Act 18-
funded budgets in the spring, the district’s slow processes prevent personnel from spending
their funds in a timely manner. Activities like hiring personnel and purchasing material may
not occur until late in the following school year – if at all.
• Vendor System. Historically, when compensatory services require the use of an outside
evaluator, it has taken six months to a year for some to obtain a vender number.
• Transportation. High costs apply to 40 percent of students with IEPs who are transported,
including those who are provided door-to-door transportation. Factors that contribute to these
costs include the uneven placement of specialized programs because of space considerations
and principal willingness to host programs; the absence of protocols for placing programs or
to guide IEP transportation decisions.
• Medicaid Reimbursement. District personnel do not track their service delivery electronically,
relying instead on paper submissions. Potential Medicaid reimbursements may be lost because
it is more difficult to document, submit, and monitor paper-based services.
Accountability
• Strategic Plan. As the district monitors implementation of its strategic plan, indicators need to
be developed on students with IEPs. These indicators should take into consideration evidence-
based practices that would drive systemic and school-based improvements.
• Student Growth Metrics to track student growth and proficiency need to include students with
IEPs, taking into account their unique circumstances.
• Protocol for Required Activities. There is no protocol in place to help resolve differences or
require action when special education department personnel provide compliance or
programmatic guidance to schools and there is either disagreement or lack of follow-up.
Furthermore, there is little if any school-based accountability for compliance. Such
circumstances include following procedures for out-of-school suspensions; entering timely

Improving Special Education Services in the Detroit Community School District
Council of the Great City Schools Page 114
transportation data; holding timely IEP meetings; exiting students from school to facilitate a
transfer or initiate a transportation route; and implementing IEPs as written.
• Data Collection and Reporting. Various issues cited throughout this report relate to problems
with reporting student data accurately. These include providing data in a user-friendly and
easy-to-access manner. Specific issues include--
- Early Childhood SPP Indicators. The district’s report showed no students entered early
childhood below expectations and had substantially improved developmentally upon
exiting. In addition, reports showed identical rates for children meeting age expectations
by the time they exited the program. Both areas related to appropriate behavior, acquisition
and use of knowledge and skills, and positive social/emotional skills.
- Data Reports. The special education department had to rely on Wayne RESA to provide
various reports for the Council’s special education review team. For example, one report
involved students from other districts attending DPSCD schools. In general, these reports
that Wayne RESA had to provide were typical of reports that other school districts can
produce on their own. Moreover, the special education department should be able to
prepare these reports to analyze district services and drive decision-making. Also, reports
produced by the district for the Council team were not easy to analyze and required
extensive manipulation.
- IEP System. The IEP system no longer meets district needs. For example, it does not allow
the district to track special education teacher caseloads; provide notices to school personnel
when the IEP system is modified; and code Turning Point as a special school attended
solely by students with IEPs. Continual training is necessary for the constant influx of new
staff.
RECOMMENDATIONS
The following recommendations are offered to improve supports for teaching and learning
for students with disabilities.
5. Department, Cohort, and Special Education Support for Schools. Specifically charge senior
staff in all central office departments with collaborating with each other to support teaching
and learning for students with disabilities. In addition--
a. Superintendent’s Cabinet. Include the special education senior executive director in
cabinet meetings to ensure the director receives direct information about district initiatives
and can contribute to discussions.
b. Collaborative/Inclusive Discussions and Deliverables. Ensure all central office, cohort,
and school discussions affecting teaching and learning include special education personnel
and others knowledgeable about students with disabilities. Have department
representatives from special education and English language learners meet regularly to
address mutual responsibilities for English learners who have disabilities, and charge staff
with developing and implementing models of effective instruction and supports for English
learners with IEPs. (Coordinate with Recommendation 4b.)

Improving Special Education Services in the Detroit Community School District
Council of the Great City Schools Page 115
As part of this collaboration, identify personnel in other departments having interactions
with schools who can be aligned to one or more cohorts to build the capacity of principal
leaders and principals to support their schools.
b. Principal Leaders. Expect principal leaders and their respective special education cohort
leaders (see Recommendation 6a below) to meet at least biweekly to –
• Review School Data on issues delineated in this report and other areas relevant to
teaching and learning.
• Strategic Planning. Develop strategic actions based on data with principals having
common issues and individual principals having unique issues.
• Professional Learning. Develop professional learning for cohort personnel based on
Recommendation 4d and other areas of need.
• Monitoring. Establish monitoring protocols for cohorts based on Recommendation 4f.
c. Cross-Functional Training. Establish a structure for cross-training of personnel from
different departments to provide essential information for all principals, leadership teams,
and teachers. More personnel should be available to support schools and teachers. In
addition, use personnel with specialized expertise beyond what most teachers are expected
to know.
6. Special Education Department Organization. The following recommendations are designed
to enable special education department personnel to more effectively assist principal leaders,
and school personnel to support teaching and learning. The senior executive director should be
able to carry out her roles and responsibilities and should have the authority to do so. This
includes the ability to make day-to-day decisions on activities within her control. To facilitate
relationships between the senior executive director, principal leaders, and principals, she needs
to attend principal meetings and have a standing agenda item at those meetings.
a. Special Education Department Organization and Support for Schools. This
recommendation is meant to create a more streamlined and cohesive special education
organizational structure. It also includes components on major areas of work. 96 The
recommendation is based on the department’s having eight leaders, including five
supporting cohorts, reporting directly to the senior executive director. These leaders, along
with the senior executive director, would constitute the core strategic planning and high
level problem-solving team for the department. (See exhibit 4f for a graphic illustration for
this recommended organization.)
• Direct Report to Senior Executive Director. Have the following positions report
directly to the special education director:
- Expert leader
- Five cohort leaders97
96 Some activities, such as responsibility for nonpublic school placements, are judgmental in terms of organizational
placement and are not specifically addressed. These activities should be embedded in the appropriate unit as the
organization is developed. 97 Generic terms are used to provide DPSCD with the flexibility to determine the appropriate administrative level(s)
for each position.
Improving Special Education Services in the Detroit Community School District
Council of the Great City Schools Page 116
- Related services leader
• Expert Unit. Currently, 16 supervisors 98 are assigned to five cohorts in varying
numbers and each has specialized programs they oversee, e.g., ASD, EI, SCI/SXI, etc.
Under the supervision of one expert leader identify the expertise necessary for
personnel to support cohort leaders and personnel under their supervision. Collectively,
expert unit personnel should have the knowledge, experience, and skills to:
- Accelerate literacy for struggling readers, including those with dyslexia;
- Accelerate math achievement;
- Improve instruction aligned with alternate assessments and standards;
- Improve positive behavior for students with the most challenging social/emotional
and behavioral needs;
- Improve postsecondary transition activities and supports, including community-
based training
These individuals would not supervise “programs” per se. Instead, they would gather
the most current evidence- and research-based information; provide leadership on the
development of standards of practice and monitoring guidance; provide professional
development to other units and schools; and support cohort personnel when they need
additional expertise to address issues at schools. In addition to obtaining feedback from
cohort and auxiliary personnel, the experts should visit schools periodically to observe
and obtain a better understanding of teaching/learning challenges.
To free up a sufficient number of personnel for each cohort, this unit should be as small
as possible – yet have a sufficient number of personnel to carry out expectations for
their collective practice.
• Cohort Unit. With five leaders (one for each cohort), free up as many current slots as
possible and establish new administrative positions (at least two) for each cohort leader.
These personnel, with support from the expert leaders, should have the knowledge,
skills, and experience to help teachers support the academic and social/emotional needs
of their students.
The goal would to provide each cohort administrator with a reasonable number of
schools to carry out his or her expected roles and responsibilities. In collaboration with
the senior executive director, and relevant cohort and principal leaders, consider having
one staff member be responsible for compliance and the other for teaching/learning.
Have each cohort staff member and leader (with a fewer number of schools) be
responsible for collaborating with their respective principals and supporting all special
education teachers in their schools. In this way, each staff member can assist in
developing a more flexible special education delivery system, solve problems, and
support placements.
• Related Services Unit. This unit currently has one interim deputy executive director,
one director, eight supervisors, and one coordinator. Reduce the number of supervisors
98 Based on the December 6, 2017 organizational chart provided to the Council team. Several of these positions are
vacant.

Improving Special Education Services in the Detroit Community School District
Council of the Great City Schools Page 117
and assign lead personnel to support the supervisor in areas with large numbers of staff.
At a minimum, have one supervisor each for psychology, social workers, and teachers.
Provide lead personnel with a reduced caseload and stipends.
Exhibit 4f. Recommended Special Education Department Organization Graphic Illustration
b. Special Education Department Management
• Evaluation of Related Services Personnel. Consider having principals evaluate related
services personnel who work in their schools. The Council team can provide the names
of other large urban districts that operate in this manner.
• Special Education Department Meetings. With feedback from special education
department personnel, identify the most effective communication processes and
frequency with which meetings should be held.
• Clerical Staff/Administrative Assistants. To the maximum extent possible, use clerical
staff and administrative assistants to carry out activities that can be delegated to them
to free up administrators for work in areas requiring their expertise.
• Consultation with Wayne RESA. During the reorganization process, consult with
Wayne RESA to ensure that new positions are developed in the most flexible manner
while meeting state requirements. If necessary, ask Wayne RESA to consider an
amendment to its plan to provide state-approved flexibility that would be helpful but is
not currently available. Also, identify how the special education department will ensure
consistent attendance at Wayne RESA meetings and provide feedback to other
department personnel, principal leaders, principals, and school personnel.
• Feedback/Communication. Obtain the input of principal leaders, and a representative
group of principals and specialized program teachers to explain the draft organization
and obtain feedback. Once the reorganization is finalized, communicate it broadly to
stakeholders, and post on the district’s website. With parent groups, develop and
execute a communication plan for parents.
• Functional Directory. On the district’s website and through other venues distribute
broadly to stakeholders a functional directory with the new organization that clearly
describes who to call for information based on subject areas of interest or need. Base
the directory on a pyramid of support, starting at the school level, moving to the school
Senior Executive
Director
Expert Unit
Leader
Cohort Unit, 5
Leaders (1 for each
cohort)
Related Services
Unit Leader

Improving Special Education Services in the Detroit Community School District
Council of the Great City Schools Page 118
cohort administrator, cohort leader, etc.
• Language Translation for Parents. Translate the new organizational directory into the
most common languages used by parents who have limited English proficiency.
• Group Emails to Principals. When special education personnel are coordinating
information with principals and it is the same across principals, enable special
education personnel to send emails when authorized by the special education senior
executive director.
c. Lead Teachers. Expect that every school will have a lead teacher assigned to the school to
liaison with the cohort administrator. With a representative group of principals and lead
teachers, determine how lead teachers will be able to fulfill his/her roles and
responsibilities. Consider reducing caseloads, providing stipends, and other incentives.
Provide differentiated mandatory training to lead teachers.
d. Student-Staff Ratios. Have the deputy superintendent, senior special education executive
director, and finance personnel review staffing ratios summarized in this report (see
Appendix A) and other caseload data. NOTE: Relatively low or high student-to-personnel
ratios in Appendix A do not necessarily mean that an area is staffed inappropriately;
however, the ratios should prompt further review. Review caseloads to ensure that adequate
numbers of special education and related-services personnel are at each school to carry out
their expected responsibilities. Based on a full review, consider the changes needed short
and long term.
e. Vacant Positions. Create a sense of urgency around filling remaining vacant special
education and related positions, and to the extent possible replace contractual personnel
with DCPSD employees as quickly as feasible.
• Vacancy Status. Validate vacant positions with principals. Have human resources
report monthly to the deputy and the superintendent on how many positions have been
filled and the number remaining by personnel area. If current strategies are unlikely to
fill remaining positions for the beginning of the 2018-19 school year, problem-solve
new approaches that are likely to succeed. One approach would be to contact charter
school operates to identify contract agencies they use to fill vacant positions.
• Expedite Hiring. Provide the superintendent and deputy with information on the range
of days necessary to establish a start date for new personnel. If unreasonable, identify
measures for shortening the process so personnel are not lost to other districts.
7. Compliance Support, and Data and Fiscal issues. Consider the following actions to improve
compliance; address data issues; and enhance revenue.
a. Compliance Support. Special education department personnel, alone, cannot improve
special education compliance. This requires the collaboration of principal leaders,
principals, and accountability staff.
• Special Education and Section 504 Standard Operating Procedures Manuals.
Expedite completion of manuals on special education and Section 504. Supplement the
documents with written expectations proposed in Recommendations 2c and 4c.
Establish the two manuals as webpages that have links to more extensive information
and public resources. Collaborate with stakeholders, including parents, to identify

Improving Special Education Services in the Detroit Community School District
Council of the Great City Schools Page 119
useful resources and links. Ensure staff members are available to update information
regularly. Provide training to stakeholders and parents to boost their understanding of
core elements of special education and Section 504, and how to use the webpages.
Ensure training is accessible to parents with diverse linguistic needs and sensory
limitations.
• Section 504 Operations. As part of Section 504 training, include information on
students with health plans to determine whether they are eligible for Section 504
services. Also determine how current information could be used to make more
appropriate eligibility determinations. In addition, ensure that students having a health
plan are also reviewed for the need for Section 504 safeguards.
• Professional Learning. Embed in Recommendation 4b and 4d professional learning to
address compliance issues most frequently related to MDE complaints, due process,
and OCR complaints, e.g., procedural safeguards for suspended students, prior written
notices, and IEP implementation.
• Dispute Resolution. Expect that every principal and their respective principal leaders
will collaborate with the cohort administrator to resolve complaints when resolution is
within the principal’s control.
• IEP System Changes. Establish a process for notifying IEP system users of changes to
the system so they can execute them effectively.
• Timely IEP Meetings. Develop a plan for holding timely IEP team meetings,
including–
- Master Schedule. Having each school develop a master schedule for 2018-19 that
would forecast annual IEP meetings and triennial evaluations/IEP meetings held
throughout the school year rather than during only a few months. To do so, schedule
triennial and annual IEP meetings earlier than usual to ensure a less concentrated
yearly schedule.
- Vacant Special Educator Positions. Develop a protocol for principals on
developing IEPs and how to include a special educator when the position is not
filled by a certified person.
- Supporting Case Managers. Develop a protocol for case managers on facilitating
participation of IEP team members, and free up case managers to attend meetings.
b. Fiscal Issues. Pursue the following activities to enhance revenue and shift more funds to
activities that would boost high-quality education in inclusive and separate classes.
• Charter Schools. Join with other school districts to use data like that highlighted in this
report to bring attention to the legislature the inequitable funding of special education
for school districts compared to charters. As part of the district’s data collection for this
purpose, track students returning to DPSCD from charters, the reasons for their return,
and a comparison of IEP services provided by charters and those deemed appropriate
by DPSCD.
• Center School Budgets. Immediately, have DPSCD’s senior special education
executive director, relevant fiscal, human resources, purchasing personnel, and center
school principals meet (with Wayne RESA personnel if helpful) to resolve the

Improving Special Education Services in the Detroit Community School District
Council of the Great City Schools Page 120
purchasing and hiring issues center school principals face when trying to execute their
approved Wayne RESA budgets in a timely manner. Have DPSCD personnel share
with the deputy superintendent the steps that will be taken and how they will
periodically report the status of those steps.
• Vendor System. Expedite approval of vender numbers for outside providers or
evaluators when necessary to provide compensatory services.
• Transportation. Develop a protocol to guide decision-making for transportation
services. See Recommendation 4b.
• Medicaid Reimbursement. Develop an RFP for Medicaid software to enable DPSCD
personnel to easily document electronically service provision for all Medicaid-eligible
students. Cast a wide net to find the most user-friendly software that will migrate data
from and to the district’s IEP system. The Council can help identify software used in
other districts. This process should enable special education personnel to have valuable
information on all students receiving services, provide for retroactive billing for
students newly found to be Medicaid eligible, and support the submission of Medicaid
claims.
c. Data Collection and Reporting. In addition to Recommendations 1f, 2e, and 4e –
• Timely IEPs. Develop user-friendly reports by cohort, school, and case manager on the
percentage of timely IEPs each year, along with a backlog report showing students who
have not received an IEP by the due date and the number of days waiting for an IEP.
Have the report available electronically for lead principals, principals, and cohort
leaders/administrators. Sort percentages and backlogged IEPs by school, so principals
and cohort leaders can quickly identify schools in need. Have cohort leaders work with
fellow administrators to identify personnel who can be temporarily deployed to
neighboring schools to handle overdue IEPs and evaluations and those that are about
to be overdue.
• Early Childhood SPP 7 Indicator. Ensure that data are entered correctly on early
childhood SPP Indicator 7--the numbers of students entering the program below
expectation and substantially increased developmentally upon exiting, and numbers
meeting age expectations by the time they exit.
• Data Reports. Have staff who are expert in data reporting review the types of data and
charts produced in this report, how these and other relevant information can be reported
by school and cohort levels. Determine the extent to which the district’s current IEP or
other data system can provide similar data. DPSCD should be able to produce such
reports without relying on Wayne RESA.
• IEP System. Have the district review IEP systems available in the market place to
compare their current system on whether they are sufficiently advanced in terms of
usability, data reporting, ability to migrate with the student information system, and
potential migration of current data into a new system. Use this information to determine
if the benefits of a new system outweigh keeping the current system.
d. Monitoring and Accountability. In addition to Recommendations 1g, 2f, and 4f--
• Strategic Plan. Ensure that the district’s monitoring of its strategic plan includes

Improving Special Education Services in the Detroit Community School District
Council of the Great City Schools Page 121
indicators on students with IEPs, and that improvement activities take into account
evidence-based practices that could inform systemic and school-based improvements.
• Student Growth. Ensure that metrics tracking student growth address the various
circumstances of students with disabilities, especially those receiving instruction based
on alternate standards. To the extent that the district is using NWEA data to gauge
growth, have the research and assessment staff determine whether the test’s growth
norms allow students to make adequate progress on state standards.
• Accountability Protocol. Establish protocols or procedures for resolving disagreements
between school personnel and special education personnel. Components should include
but not be limited to procedures on school suspensions, the timely entry of
transportation data, exiting students, facilitating transfers and new transportation
routes, implementing IEPs, securing lead teachers, etc.
• Performance Evaluations. Embed in performance evaluations relevant indicators on
each personnel area’s role in carrying out core special education activities under their
control.
8. Internal Project Manager. Have a project manager assigned to the superintendent report
regularly on progress in implementing leadership’s plans and initiatives, including following
up recommendations in this report. Have the project manager report on relevant data, the status
of implementation, and barriers to execution that require interdepartmental collaboration, and
the need for adjustments to the plan.

Improving Special Education Services in the Detroit Community School District
Council of the Great City Schools Page 122
CHAPTER 5. SUMMARY OF RECOMMENDATIONS
This chapter summarizes the recommendations made in Chapter 3 in two ways. The first
way lists the recommendations from the previous chapter and the functional categories into which
each one falls. The categories include accountability, planning, criteria/process, training,
data/reports, and cross-references. The second way lists all recommendations, so the reader can
see them in one place.
Recommendation Matrix
The exhibit below lists the recommendations from the previous chapter in table form
corresponding to their functional categories.
Recommendations
Pla
nn
ing
Sta
nd
ard
s/P
roce
du
res
Tra
inin
g
Da
ta/R
epo
ts
Acc
ou
nta
bil
ity
Multi-tiered System of Supports
1. Systemwide MTSS Framework, Implementation Plan, and Oversight. Embed MTSS into the district’s Blueprint
2020, making explicit how the strategic plan’s provisions fit into the MTSS framework and vice versa. Make clear that
the framework includes all students, including students with disabilities, English learners, and accelerated learners.
a. District, Network and School Leadership Teams. Establish the following leadership teams at
the district, cohort, and school levels to support MTSS planning and oversee implementation
activities: District MTSS Leadership Team; Cohort MTSS Leadership Teams; School-Based
Leadership Teams; and Resource Coordinating Teams.
X
b. Implementation Plan. Develop a multi-year MTSS implementation plan that includes regular
updates for the board of education. Have the district’s leadership team evaluate the its current
methodologies and tools as it develops the district’s MTSS framework and plan, including
universal screeners, formative assessments, standard protocols for interventions/supports,
curricular materials, supplemental and intensive resources, data platforms, use of data,
professional learning, budget allocations, etc. In addition, include the following components–
framework design; universal design for learning principles; department alignment of staff and
priorities to support MTSS plan implementation; social emotional learning goals and
expectations; progress monitoring benchmark and other regular districtwide and school-based
progress-monitoring tools in the evaluation of MTSS implementation; early school enrollment
campaign; master teacher program; school walk throughs; exemplary implementation models;
and district website. When finalized, prominently post the MTSS implementation plan on the
district’s website, along with relevant links to district information and publicly available
resources. Communicate widely.
X
c. Map Resources and Analyze/Address Gaps. As part of the MTSS planning process, assess
current human resources and instructional materials provided by the district and funded by
schools to ascertain their effectiveness and return-on-investment in terms of improved student
outcomes. Compare the value of resources and materials currently in use in the district with
other evidence-based resources in the marketplace and replace low-value resources currently
being used. Establish a menu of increasingly intensive interventions and resources, which should
be vetted against current evidence on effectiveness and alignment. Ensure that the menu of
interventions differentiates levels of intensity, criteria for use, and contains strategies that are
X X
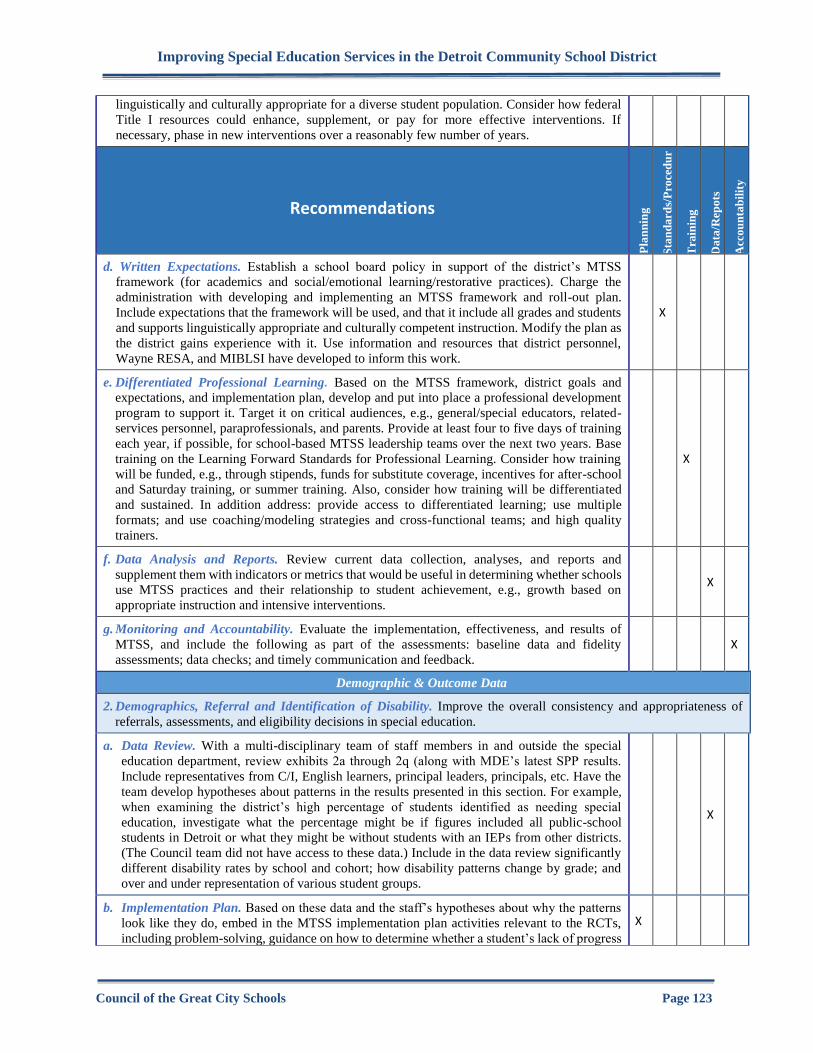
Improving Special Education Services in the Detroit Community School District
Council of the Great City Schools Page 123
linguistically and culturally appropriate for a diverse student population. Consider how federal
Title I resources could enhance, supplement, or pay for more effective interventions. If
necessary, phase in new interventions over a reasonably few number of years.
Recommendations
Pla
nn
ing
Sta
nd
ard
s/P
roce
du
r
es
Tra
inin
g
Da
ta/R
epo
ts
Acc
ou
nta
bil
ity
d. Written Expectations. Establish a school board policy in support of the district’s MTSS
framework (for academics and social/emotional learning/restorative practices). Charge the
administration with developing and implementing an MTSS framework and roll-out plan.
Include expectations that the framework will be used, and that it include all grades and students
and supports linguistically appropriate and culturally competent instruction. Modify the plan as
the district gains experience with it. Use information and resources that district personnel,
Wayne RESA, and MIBLSI have developed to inform this work.
X
e. Differentiated Professional Learning. Based on the MTSS framework, district goals and
expectations, and implementation plan, develop and put into place a professional development
program to support it. Target it on critical audiences, e.g., general/special educators, related-
services personnel, paraprofessionals, and parents. Provide at least four to five days of training
each year, if possible, for school-based MTSS leadership teams over the next two years. Base
training on the Learning Forward Standards for Professional Learning. Consider how training
will be funded, e.g., through stipends, funds for substitute coverage, incentives for after-school
and Saturday training, or summer training. Also, consider how training will be differentiated
and sustained. In addition address: provide access to differentiated learning; use multiple
formats; and use coaching/modeling strategies and cross-functional teams; and high quality
trainers.
X
f. Data Analysis and Reports. Review current data collection, analyses, and reports and
supplement them with indicators or metrics that would be useful in determining whether schools
use MTSS practices and their relationship to student achievement, e.g., growth based on
appropriate instruction and intensive interventions.
X
g. Monitoring and Accountability. Evaluate the implementation, effectiveness, and results of
MTSS, and include the following as part of the assessments: baseline data and fidelity
assessments; data checks; and timely communication and feedback.
X
Demographic & Outcome Data
2. Demographics, Referral and Identification of Disability. Improve the overall consistency and appropriateness of
referrals, assessments, and eligibility decisions in special education.
a. Data Review. With a multi-disciplinary team of staff members in and outside the special
education department, review exhibits 2a through 2q (along with MDE’s latest SPP results.
Include representatives from C/I, English learners, principal leaders, principals, etc. Have the
team develop hypotheses about patterns in the results presented in this section. For example,
when examining the district’s high percentage of students identified as needing special
education, investigate what the percentage might be if figures included all public-school
students in Detroit or what they might be without students with an IEPs from other districts.
(The Council team did not have access to these data.) Include in the data review significantly
different disability rates by school and cohort; how disability patterns change by grade; and
over and under representation of various student groups.
X
b. Implementation Plan. Based on these data and the staff’s hypotheses about why the patterns
look like they do, embed in the MTSS implementation plan activities relevant to the RCTs,
including problem-solving, guidance on how to determine whether a student’s lack of progress
X

Improving Special Education Services in the Detroit Community School District
Council of the Great City Schools Page 124
is due to a disability or to inadequate access to appropriate core instruction, increasingly
intensive interventions, supports, and progress monitoring, etc. (Coordinate this activity with
Recommendation 1b.) Also, consider using a playgroup model to assess young children.
Recommendations
Pla
nn
ing
Sta
nd
ard
s/P
roce
du
res
Tra
inin
g
Da
ta/R
epo
ts
Acc
ou
nta
bil
ity
c. Written Expectations. In each area identified by the multi-disciplinary team as problematic,
review district processes, including referrals, assessments, and eligibility, and amend them to
provide more specific guidance. Develop: Standard Operating Procedures Manual
(Coordinate with Recommendation 7a); RCT Practices (coordinate with Recommendation
1a); Incorporate relevant to ELs, such as that included in MDE’s Guidance Handbook for
Educators of English Learners with Suspected Disabilities; and guidance on evaluating
students’ lack of progress and relationship to Section 504 and special education evaluations;
establish guidelines for determining when and under what circumstances a student no longer
needs special education to progress educationally.
X
d. Differentiated Professional Learning. Plan for and provide all relevant district stakeholders
with the professional development they need to implement the recommendations in this report.
Have personnel from the special education and English language learner departments
collaborate on the referral and assessment needs of EL students. (Coordinate this activity with
Recommendation 1e.)
X
e. Data Analysis and Reports. Develop and provide regular user-friendly summary reports to
district leadership showing data like those in exhibits 2a through 2m. Share data by cohort and
by school within cohorts.
X
f. Monitoring and Accountability. Develop a process for ongoing monitoring of expected
referrals, evaluations, and eligibility practices. Rather than using a traditional record-review
compliance model, review data with schools so that they are aware of problems, and they are
better prepared for follow-up action. Enable staff to observe best practices and receive coaching
that will improve their knowledge and skills. (Coordinate this activity with Recommendation
1g.) Consider folding disability rates into cohort and school accountability systems.
X
g. Timely Evaluation and Annual Review Work Group. Convene a group of multi-disciplinary
personnel, including representatives from PEC, principals and other school staff members, X
3. Review of Data Related to Teaching and Learning. Assemble a multidisciplinary team and
review achievement data (exhibits 3a, 3c-g, and 3dd-ee); suspension data (3m-o); educational
environments (3g-l); special program configurations (3p-u, 3w, 3z, and 3bb), students from
other districts (3v); percentages of students with IEPs by school (3x); and other relevant data.
Develop hypotheses around the patterns of results found and set goals for improvement as the
district implements the Council team’s recommendations and other proposals. Build strategies
around each improvement goal, especially Recommendation 4 that is intended to improve
inclusive and high-quality teaching and learning. Assess the resources and supports needed to
implement each strategy.
X
Improving Instruction & Supports
4. Expansion of Inclusive Education and Provision of High Quality Instruction and Supports. Begin the process of
providing special education services in more inclusive educational settings to students with disabilities to ensure more
equitable access to school choice and high-quality instruction. To build a culture and climate for this purpose, consider
using an experienced consultant who has had successful outcomes in this area to help facilitate planning and
implementation.

Improving Special Education Services in the Detroit Community School District
Council of the Great City Schools Page 125
Recommendations
Pla
nn
ing
Sta
nd
ard
s/P
roce
du
res
Tra
inin
g
Da
ta/R
epo
ts
Acc
ou
nta
bil
ity
a. Inclusive Education Vision. Establish a school board policy stating a clear and defined vision
for DPSCD on the value of inclusivity and that reinforces the district’s commitment to
improving academic achievement and social/emotional well-being for students with disabilities.
X
b. Implementation Plan. With the multidisciplinary team assembled pursuant to Recommendation
3, develop a written multi-year action plan that calls for written expectations, professional
learning, data analytics, and accountability. To the extent reasonable, embed components in the
MTSS implementation plan referenced in Recommendation 1b. Consider the data review
referenced in Recommendation 3. Once the plan is completed, establish a way for school-based
teams to embed local implementation activities into their strategic school designs and school
improvement plans. As part of this process, identify a cadre of schools that volunteer to take the
lead in planning and implementing inclusive service designs. Phase in this process over about
four years to include all schools. Also, identify general and special education personnel that
schools can contact to support their implementation efforts to better meet the needs of students
with IEPs.
Communication. When finalized, prominently post the implementation plan on the district’s
website, along with relevant links to district information and publicly available resources.
Communicate the plan widely to all internal and external stakeholders, including parents who
are English learners, and share the purpose and expected outcomes of the plan.
Consultant. Hire a consultant who has experience with and positive outcomes in reducing the
restrictiveness of educational environments of students, implementing interventions for students
with dyslexia, autism, vision/hearing impairments, and improving achievement and positive
student behavior generally. This action will expedite effective planning and implementation and
serve as a sounding board for DPSCD staff.
Components. When developing the implementation plan, include the following components—
increased inclusivity of regular preschool classes; differentiated instruction; effective instruction
based on core curricular standards; planned collaboration; positive support for behavior;
elimination of “voluntary” out-of-school suspension; instruction of ELs with IEPs; support for
students with IEPs taking advanced classes; SLD program evaluation to accelerate literacy;
support for students with vision/hearing impairments; provide instruction through flexible
service delivery models; with Wayne RESA review and address special program configurations
to reduce categorical placements and increase inclusivity; develop a master plan for the equitable
placement of specialized programs across the district; ensure sufficient supports available for
emotional impairment program; review center schools to consider provision of effective services
within regular schools; review and adjust for equitable school disability enrollment and address
Detroit Institute of Technology at Cody disproportionality; develop transportation protocol for
door-to-door service; address postsecondary transition, path to graduation, community job
training, and training for career gaps; review and address placement center issues; develop IEP
team decision making worksheets; address assistive technology gaps; clarify roles and
responsibilities under Wayne RESA plan; collaborate with parents and obtain feedback from
stakeholders throughout this process.
X X
c. Written Expectations. As part of the implementation plan described in Recommendation 4b,
develop written expectations on each plan component. (Coordinate with Recommendation 2c.) X X

Improving Special Education Services in the Detroit Community School District
Council of the Great City Schools Page 126
Recommendations
Pla
nn
ing
Sta
nd
ard
s/P
roce
du
res
Tra
inin
g
Da
ta/R
epo
ts
Acc
ou
nta
bil
ity
d. Differentiated Professional Learning and Parent Training. Embed in the professional
development curriculum (Recommendation 1e) content needed to carry out Recommendation 4.
Embed into current walk-through protocols indicators associated with implementation plan
components that the district expects to be in place within a specified time-frame.
X
e. Data Analysis and Reports. In addition to activities proposed in Recommendation 1e, embed
in school performance and planning frameworks data reporting and use of risk ratio measure to
report disproportionality da
X X
f. Monitoring and Accountability. Expect all principals to be responsible for overseeing special
education in their buildings and hold them explicitly accountable for such. Articulate how
cohort principal leaders will work with their principals and how they will exercise their
responsibilities to ensure principals are serving students with disabilities. Embed the following
activities into the monitoring and accountability systems described in Recommendation 1g. and
2f. Establish data checks; fidelity assessments and walk-throughs that include special education
indicators; obtain timely feedback on inclusive education barriers; and monitor informal school
removals, timely placements, home placements, and too high caseloads.
X
Organizational Support
5. Department, Cohort, and Special Education Support for Schools. Specifically charge senior staff in all central office
departments with collaborating with each other to support teaching and learning for students with disabilities. In
addition--
a. Superintendent’s Cabinet. Include the special education senior executive director in cabinet
meetings to ensure the director receives direct information about district initiatives and can
contribute to discussions.
X XX
b. Collaborative/Inclusive Discussions and Deliverables. Ensure all central office, cohort, and
school discussions affecting teaching and learning include special education personnel and
others knowledgeable about students with disabilities. Have department representatives from
special education and English language learners meet regularly to address mutual
responsibilities for English learners who have disabilities, and charge staff with developing
and implementing models of effective instruction and supports for English learners with
IEPs. (Coordinate with Recommendation 4b.) As part of this collaboration, identify
personnel in other departments having interactions with schools who can be aligned to one
or more cohorts to build the capacity of principal leaders and principals to support their
schools.
X X
c. Principal Leaders. Expect principal leaders and their respective special education cohort
leaders (see Recommendation 6a below) to meet at least biweekly to review school data;
develop strategic actions based on data with principals having common issues and individual
principals having unique issues; develop professional learning for cohort personnel based on
Recommendation 4d and other areas of need; and establish monitoring protocols for cohorts
based on Recommendation 4f.
X X
d. Cross-Functional Training. Establish a structure for cross-training of personnel from
different departments to provide essential information for all principals, leadership teams, and
teachers. More personnel should be available to support schools and teachers. In addition, use
personnel with specialized expertise beyond what most teachers are expected to know.
X X

Improving Special Education Services in the Detroit Community School District
Council of the Great City Schools Page 127
Recommendations
Pla
nn
ing
Sta
nd
ard
s/P
roce
du
res
Tra
inin
g
Da
ta/R
epo
ts
Acc
ou
nta
bil
ity
6. Special Education Department Organization. The following recommendations are designed to enable special
education department personnel to more effectively assist principal leaders, and school personnel to support teaching
and learning. The senior executive director should be able to carry out her roles and responsibilities and should have
the authority to do so. This includes the ability to make day-to-day decisions on activities within her control. To
facilitate relationships between the senior executive director, principal leaders, and principals, she needs to attend
principal meetings and have a standing agenda item at those meetings.
a. Direct Report to Senior Executive Director. Have the following positions report directly to
the special education director:
Expert Unit. Ensure personnel collectively have the knowledge, experience, and skills to:
accelerate literacy for struggling readers, including those with dyslexia; accelerate math
achievement; improve instruction aligned with alternate assessments and standards; improve
positive behavior for students with the most challenging social/emotional and behavioral
needs; and improve postsecondary transition activities and supports, including community-
based training. Expert personnel gather the most current evidence- and research-based
information; provide leadership on the development of standards of practice and monitoring
guidance; provide professional development to other units and schools; and support cohort
personnel when they need additional expertise to address issues at schools. In addition to
obtaining feedback from cohort and auxiliary personnel, the experts should visit schools
periodically to observe and obtain a better understanding of teaching/learning challenges.
Cohort Unit. With five leaders (one for each cohort), free up as many current slots as possible
and establish new administrative positions (at least two) for each cohort leader. These
personnel, with support from the expert leaders, should have the knowledge, skills, and
experience to help teachers support the academic and social/emotional needs of their students.
Provide each cohort administrator with a reasonable number of schools to carry out his or her
expected roles and responsibilities. In collaboration with the senior executive director, and
relevant cohort and principal leaders, consider having one staff member be responsible for
compliance and the other for teaching/learning. Have each cohort staff member and leader
(with a fewer number of schools) be responsible for collaborating with their respective
principals and supporting all special education teachers in their schools. In this way, each staff
member can assist in developing a more flexible special education delivery system, solve
problems, and support placements.
Related Services Unit. Reduce the number of supervisors and assign lead personnel to support
the supervisor in areas with large numbers of staff. At a minimum, have one supervisor each
for psychology, social workers, and teachers. Provide lead personnel with a reduced caseload
and stipends.
X
b. Special Education Department Management. Address: evaluation of related services
personnel; improved special education department meetings; use of clerical staff and
administrative assistants; consultation with Wayne RESA to coordinate reorganization
process; obtain principal leaders and stakeholder feedback throughout reorganization process;
functional directory of staff support; translation of information for parents; and simplify
communication to principals through email.
X
c. Lead Teachers. Expect that every school will have a lead teacher assigned to the school to
liaison with the cohort administrator. With a representative group of principals and lead
teachers, determine how lead teachers will be able to fulfill his/her roles and responsibilities.
X X

Improving Special Education Services in the Detroit Community School District
Council of the Great City Schools Page 128
Consider reducing caseloads, providing stipends, and other incentives. Provide differentiated
mandatory training to lead teachers.
Recommendations
Pla
nn
ing
Sta
nd
ard
s/P
roce
du
res
Tra
inin
g
Da
ta/R
epo
ts
Acc
ou
nta
bil
ity
d. Student-Staff Ratios. Have the deputy superintendent, senior special education executive
director, and finance personnel review staffing ratios summarized in this report (see Appendix
A) and other caseload data. NOTE: Relatively low or high student-to-personnel ratios in
Appendix A do not necessarily mean that an area is staffed inappropriately; however, the ratios
should prompt further review. Review caseloads to ensure that adequate numbers of special
education and related-services personnel are at each school to carry out their expected
responsibilities. Based on a full review, consider the changes needed short and long term.
X X
e. Vacant Positions. Create a sense of urgency around filling remaining vacant special education
and related positions, and to the extent possible replace contractual personnel with DCPSD
employees as quickly as feasible. Validate vacant positions with principals and have human
resources report monthly vacancies to deputy and superintendent; review hiring process to and
expedite hires.
X X X
Compliance Support, Fiscal Issues & Accountability
7. Compliance Support, and Data and Fiscal issues.
a. Compliance Support. Through collaboration of principal leaders, principals, and
accountability staff: develop Special Education and Section 504 Standard Operating
Procedures Manuals; consider eligibility of students on health plans for Section 504; embed
in Recommendation 4b and 4d professional learning to address compliance issues most
frequently related to MDE complaints, due process, and OCR complaints; expect that every
principal and their respective principal leaders will collaborate with the cohort administrator
to resolve complaints when resolution is within the principal’s control; and establish process
for notifying users of IEP system changes. Develop a plan to support timely IEP meetings
and include: master schedule requirements; vacant special educator position protocol; and
support for case managers to ensure they and required IEP team participants attend meetings.
X X X X X
b. Fiscal Issues. Pursue the following activities to enhance revenue and shift more funds to
activities that would boost high-quality education in inclusive and separate classes. Address
issues related to charter schools; center school budgets; vendor system for outside
compensatory education providers; and issue an RFP for effective Medicaid software to
facilitate easy service tracking.
X X
c. Data Collection and Reporting. In addition to Recommendations 1f, 2e, and 4e – report data
for, monitor and support timely IEPs; correct data for SPP indicator 7 related to early
childhood outcomes; reproduce data provided in this report for district and school-based use
without relying on Wayne RESA; review IEP systems available in the market place to
compare their current system on whether they are sufficiently advanced in terms of usability,
data reporting, ability to migrate with the student information system, and potential migration
of current data into a new system. Use this information to determine if the benefits of a new
system outweigh keeping the current system.
X X
d. Monitoring and Accountability. In addition to Recommendations 1g, 2f, and 4f—ensure the
district’s monitoring of its strategic plan includes indicators on students with IEPs, and that
improvement activities take into account evidence-based practices that could inform systemic
and school-based improvements. Include student growth metrics, protocols or procedures for
X X

Improving Special Education Services in the Detroit Community School District
Council of the Great City Schools Page 129
resolving disagreements between school personnel and special education personnel.
Components should include but not be limited to procedures on school suspensions, the
timely entry of transportation data, exiting students, facilitating transfers and new
transportation routes, implementing IEPs, securing lead teachers, etc. Embed in performance
evaluations relevant indicators on each personnel area’s role in carrying out core special
education activities under their control.
Recommendations
Pla
nn
ing
Sta
nd
ard
s/P
roce
du
res
Tra
inin
g
Da
ta/R
epo
ts
Acc
ou
nta
bil
ity
8. Internal Project Manager. Have a project manager assigned to the superintendent report
regularly on progress in implementing leadership’s plans and initiatives, including following
up recommendations in this report. Have the project manager report on relevant data, the
status of implementation, and barriers to execution that require interdepartmental
collaboration, and the need for adjustments to the plan.
X X X

Improving Special Education Services in the Detroit Community School District
Council of the Great City Schools Page 130
List of Recommendations
1. Systemwide MTSS Framework, Implementation Plan, and Oversight. Embed MTSS into the
district’s Blueprint 2020, making explicit how the strategic plan’s provisions fit into the MTSS
framework and vice versa. Make clear that the framework includes all students, including
students with disabilities, English learners, and accelerated learners.
a. District, Network and School Leadership Teams. Establish leadership teams at the district,
cohort, and school levels to support MTSS planning and oversee implementation activities.
• District MTSS Leadership Team. Have the deputy superintendent and senior executive
director of C/I share responsibility for the development and implementation of MTSS
across the system, utilizing a team of stakeholders, e.g., cohort leaders, central office
personnel, principals, and school-based personnel. When completed, schedule a two-
day overview for staff and monthly meetings with the MTSS leadership team to ensure
use of a common language, effective implementation, and effective resource
allocations.
• Cohort MTSS Leadership Teams. Have each cohort establish an MTSS leadership
team with principals and a diverse group of school personnel who would be responsible
for implementation.
• School-Based Leadership Teams. Based on the district’s MTSS-implementation plan
(Recommendation1b below), establish school-based leadership teams (SBLT) at each
site to provide training and guidance on activities that could be incorporated into each
school’s academic achievement plan. The SBLT should lead each school’s MTSS work
to ensure a common understanding of the framework. The SBLTs should also have
defined responsibilities, such as learning/applying/modeling the problem-solving
process, providing professional development and technical assistance, monitoring
implementation and supports, and conducting school-based data days.
• Resource Coordinating Teams. Establish written parameters for RCTs, including
evidence-based guidelines and expectation that RCTs be implemented as designed at
every school. Send a common message that RCTs are designed for problem-solving
purposes, and they are not a pipeline for special education.
b. Implementation Plan. Develop a multi-year MTSS implementation plan that includes
regular updates for the board of education. Have the district’s leadership team evaluate the
its current methodologies and tools as it develops the district’s MTSS framework and plan,
including universal screeners, formative assessments, standard protocols for
interventions/supports, curricular materials, supplemental and intensive resources, data
platforms, use of data, professional learning, budget allocations, etc. In addition, include
the following components–
• Framework Design. Review information from MIBLSI, Wayne RESA, and the DPI
RtI Handbook and Tool Kit, and supplement them based on current best practices,
including information for elementary, middle, and high school grade levels.
• UDL. Embed universal design for learning (UDL) principles into the MTSS
framework, and incorporate items discussed below.

Improving Special Education Services in the Detroit Community School District
Council of the Great City Schools Page 131
• Department Alignment. Require each department to realign staff and priorities to
support the MTSS plan’s implementation. Ensure department deliverables are
collaboratively developed and do not produce competing priorities across schools.
• Social Emotional Learning. Establish goals and expectations that schools would
provide social emotional learning (SEL) as part of its MTSS work, including the use of
a SEL curriculum, community wraparound services, etc.
• Progress Monitoring. Include benchmark and other regular districtwide and school-
based progress-monitoring tools in the evaluation of MTSS implementation. Consider
whether to continue using both IReady and MIBLSI or have one set of data systemwide.
• Early School Enrollment. Consider a citywide campaign designed to educate parents
about the value of enrolling their children in early childhood programs and in
kindergarten. Communicate resources to help parents access these programs.
• Master Teacher Program. Add components to the Master Teacher Program to support
positive student social/emotional wellbeing and behavior. Ensure that participants are
knowledgeable about teaching and learning with students with disabilities, students
who are twice exceptional, English learners and those with disabilities, and gifted
students.
• School Walk Throughs. Include in current walk-through protocols any elements of
MTSS that current tools do not contain. Follow-up walkthrough results to identify
trends, strengths, and action items. Walkthroughs should be non-evaluative, but results
should be aggregated in a way that would inform central office strategies.
• Exemplary Implementation Models. Provide a forum where schools can highlight and
share best practices, lessons learned, victories, and challenges in implementing MTSS
for all student groups. Identify and encourage staff to visit exemplary schools and set
aside time for that to happen.
• District Website. Develop a highly visible, well-informed, and interactive web page
highlighting the district’s MTSS framework. Include links to other local and national
sites. Highlight schools in the district that are showing results with the approach and
share stories and data on the impact of MTSS on student outcomes.
Communication. When finalized, prominently post the MTSS implementation plan on the
district’s website, along with relevant links to district information and publicly available
resources. Communicate widely with all internal and external stakeholders, including
parents who are English learners, and share the purposes and expected outcomes of the
plan.
c. Map Resources and Analyze/Address Gaps. As part of the MTSS planning process, assess
current human resources and instructional materials provided by the district and funded by
schools to ascertain their effectiveness and return-on-investment in terms of improved
student outcomes. Compare the value of resources and materials currently in use in the
district with other evidence-based resources in the marketplace and replace low-value
resources currently being used. Establish a menu of increasingly intensive interventions
and resources, which should be vetted against current evidence on effectiveness and
alignment. Ensure that the menu of interventions differentiates levels of intensity, criteria
for use, and contains strategies that are linguistically and culturally appropriate for a

Improving Special Education Services in the Detroit Community School District
Council of the Great City Schools Page 132
diverse student population. Consider how federal Title I resources could enhance,
supplement, or pay for more effective interventions. If necessary, phase in new
interventions over a reasonably few number of years.
d. Written Expectations. Establish a school board policy in support of the district’s MTSS
framework (for academics and social/emotional learning/restorative practices). Charge the
administration with developing and implementing an MTSS framework and roll-out plan.
Include expectations that the framework will be used, and that it include all grades and
students and supports linguistically appropriate and culturally competent instruction.
Modify the plan as the district gains experience with it. Use information and resources that
district personnel, Wayne RESA, and MIBLSI have developed to inform this work.
e. Differentiated Professional Learning. Based on the MTSS framework, district goals and
expectations, and implementation plan, develop and put into place a professional
development program to support it. Target it on critical audiences, e.g., general/special
educators, related-services personnel, paraprofessionals, and parents. Provide at least four
to five days of training each year, if possible, for school-based MTSS leadership teams
over the next two years. Base training on the Learning Forward Standards for Professional
Learning. Consider how training will be funded, e.g., through stipends, funds for substitute
coverage, incentives for after-school and Saturday training, or summer training. Also,
consider how training will be differentiated and sustained. In addition –
• Access to Differentiated Learning. Ensure that professional learning is engaging and
differentiated based on individual skills, experience, and need. Have professional
learning and technical assistance continue for new personnel and those needing
additional support.
• Multiple Formats. Use multiple formats (e.g., videos, webinars, and narrative text) and
presentation approaches (e.g., school-based, small groups) to provide professional
development on MTSS.
• Coaching/Modeling. Develop a plan to provide coaching and technical assistance to
principals and school-based leadership teams on practices covered in training sessions
and materials.
• Cross-Functional Teams. Cross-train individuals from all departments working with
schools to ensure a common language and understanding of MTSS. This will help align
and support schools as they work on implementation. Provide direct support,
mentoring, coaching, and technical assistance to principals and teachers on
implementation.
• High-Quality Trainers. Identify staff members at all levels who are knowledgeable
about and experienced in the components of MTSS and deploy them as professional
developers. As necessary, supplement these staff members with experts from outside
the school district.
f. Data Analysis and Reports. Review current data collection, analyses, and reports and
supplement them with indicators or metrics that would be useful in determining whether
schools use MTSS practices and their relationship to student achievement, e.g., growth
based on appropriate instruction and intensive interventions.

Improving Special Education Services in the Detroit Community School District
Council of the Great City Schools Page 133
g. Monitoring and Accountability. Evaluate the implementation, effectiveness, and results of
MTSS, and include the following as part of the assessments–
• Baseline Data and Fidelity Assessments. Use the Self-Assessment of MTSS (SAM)
or other protocols for schools to self-assess their MTSS practices. Have network and
districtwide leadership teams periodically review these self-assessments for validity.
Incorporate SAM results into the school review process to assess fidelity to the
framework.
• Data Checks. Using data and reports proposed in Recommendation 1f, have the
superintendent, deputy superintendent, and senior executive director for C/I host
regular data conversations with departments, network leaders, and principals to discuss
results, anomalies, needed supports, follow-up activities, and outcomes.
• Timely Communication and Feedback. Assign responsibility for communicating the
MTSS work to stakeholders through multiple channels, e.g., website, television, radio,
social media, etc. Design feedback loops involving central office, school personnel,
parents, and the community to assess problems and successes on the ground. Use this
feedback to provide regular and timely feedback to the district MTSS leadership team
on where and how schools require additional assistance.
2. Demographics, Referral and Identification of Disability. Improve the overall consistency and
appropriateness of referrals, assessments, and eligibility decisions in special education.
a. Data Review. With a multi-disciplinary team of staff members in and outside the special
education department, review exhibits 2a through 2q (along with MDE’s latest SPP results.
Include representatives from C/I, English learners, principal leaders, principals, etc. Have
the team develop hypotheses about patterns in the results presented in this section. For
example, when examining the district’s high percentage of students identified as needing
special education, investigate what the percentage might be if figures included all public-
school students in Detroit or what they might be without students with an IEPs from other
districts. (The Council team did not have access to these data.) Include in the data review
significantly different disability rates by school and cohort; how disability patterns change
by grade; and over and under representation of various student groups.
b. Implementation Plan. Based on these data and the staff’s hypotheses about why the
patterns look like they do, embed in the MTSS implementation plan activities relevant to
the RCTs, including problem-solving, guidance on how to determine whether a student’s
lack of progress is due to a disability or to inadequate access to appropriate core instruction,
increasingly intensive interventions, supports, and progress monitoring, etc. (Coordinate
this activity with Recommendation 1b.) Also, consider using a playgroup model to assess
young children.
c. Written Expectations. In each area identified by the multi-disciplinary team as
problematic, review district processes, including referrals, assessments, and eligibility, and
amend them to provide more specific guidance.
• Standard Operating Procedures Manual. Ensure that the district’s comprehensive
standard-operating-procedures manual for special education incorporates this
guidance. (Coordinate with Recommendation 7a.)

Improving Special Education Services in the Detroit Community School District
Council of the Great City Schools Page 134
• RCT Practices. Require that RCTs function within an MTSS framework, and that
personnel who assess students for special education consider the extent to which
students might benefit from increasingly intensive interventions based on problem-
solving and progress monitoring. (Coordinate this activity with Recommendation 1a.)
• English Learners. Incorporate in the manual information relevant to ELs, such as that
included in MDE’s Guidance Handbook for Educators of English Learners with
Suspected Disabilities.
• Lack of Progress. Provide guidance on evaluating students’ lack of progress. Have
RCTs include in their procedures appropriate referrals for Section 504 services as well
as for special education.
• Referral Practices. Make sure that written guidance and practice is included on
parental requests for a special education evaluation when there is evidence of a
suspected disability.
• Exiting Special Education. Establish guidelines for determining when and under what
circumstances a student no longer needs special education to progress educationally. A
transition to services under Section 504 may be appropriate for such children.
Recommendations relevant to the timely transition of students from Part C services, and
proposals on timely IEPs are provided later in this report. (See IV. Support for Teaching
and Learning for Students with Disabilities, Accountability.)
d. Differentiated Professional Learning. Plan for and provide all relevant district
stakeholders with the professional development they need to implement the
recommendations in this report. Have personnel from the special education and English
language learner departments collaborate on the referral and assessment needs of EL
students. (Coordinate this activity with Recommendation 1e.)
e. Data Analysis and Reports. Develop and provide regular user-friendly summary reports
to district leadership showing data like those in exhibits 2a through 2m. Share data by
cohort and by school within cohorts.
f. Monitoring and Accountability. Develop a process for ongoing monitoring of expected
referrals, evaluations, and eligibility practices. Rather than using a traditional record-
review compliance model, review data with schools so that they are aware of problems,
and they are better prepared for follow-up action. Enable staff to observe best practices and
receive coaching that will improve their knowledge and skills. (Coordinate this activity
with Recommendation 1g.) Consider folding disability rates into cohort and school
accountability systems.
3. Review of Data Related to Teaching and Learning. Assemble a multidisciplinary team and
review achievement data (exhibits 3a, 3c-g, and 3dd-ee); suspension data (3m-o); educational
environments (3g-l); special program configurations (3p-u, 3w, 3z, and 3bb), students from
other districts (3v); percentages of students with IEPs by school (3x); and other relevant data.
Develop hypotheses around the patterns of results found and set goals for improvement as the
district implements the Council team’s recommendations and other proposals. Build strategies
around each improvement goal, especially Recommendation 4 that is intended to improve

Improving Special Education Services in the Detroit Community School District
Council of the Great City Schools Page 135
inclusive and high-quality teaching and learning. Assess the resources and supports needed to
implement each strategy.
4. Expansion of Inclusive Education and Provision of High Quality Instruction and Supports.
Begin the process of providing special education services in more inclusive educational
settings to students with disabilities to ensure more equitable access to school choice and high-
quality instruction. To build a culture and climate for this purpose, consider using an
experienced consultant who has had successful outcomes in this area to help facilitate planning
and implementation.
a. Inclusive Education Vision. Establish a school board policy stating a clear and defined
vision for DPSCD on the value of inclusivity and that reinforces the district’s commitment
to improving academic achievement and social/emotional well-being for students with
disabilities. Highlight the importance of central office support and principal leadership for
providing students with IEPs with the differentiated and scaffolded instruction they need
to learn in general education settings. State that a student’s needs - not their disability label
- should drive the type or location of services. Expect that students will receive rigorous
core instruction that is linguistically appropriate and culturally relevant. These expectations
should be within greater reach when school personnel are provided the resources and
supports they need, and as teachers become more familiar with and base their instruction
on the principles of UDL. At the same time, the district’s vision should underscore the
importance of evidence-based academic and positive behavior interventions/supports.
Furthermore, once students are receiving special education instruction, the intensity of
interventions should be stronger than (not less than) interventions otherwise available to
students without IEPs.
b. Implementation Plan. With the multidisciplinary team assembled pursuant to
Recommendation 3, develop a written multi-year action plan that calls for written
expectations, professional learning, data analytics, and accountability. To the extent
reasonable, embed components in the MTSS implementation plan referenced in
Recommendation 1b. Consider the data review referenced in Recommendation 3. Once the
plan is completed, establish a way for school-based teams to embed local implementation
activities into their strategic school designs and school improvement plans.
As part of this process, identify a cadre of schools that volunteer to take the lead in planning
and implementing inclusive service designs. Phase in this process over about four years to
include all schools. Also, identify general and special education personnel that schools can
contact to support their implementation efforts to better meet the needs of students with
IEPs.
Communication. When finalized, prominently post the implementation plan on the
district’s website, along with relevant links to district information and publicly available
resources. Communicate the plan widely to all internal and external stakeholders, including
parents who are English learners, and share the purpose and expected outcomes of the plan.
Consultant. Hire a consultant who has experience with and positive outcomes in reducing
the restrictiveness of educational environments of students, implementing interventions for
students with dyslexia, autism, vision/hearing impairments, and improving achievement

Improving Special Education Services in the Detroit Community School District
Council of the Great City Schools Page 136
and positive student behavior generally. This action will expedite effective planning and
implementation and serve as a sounding board for DPSCD staff.
Components. When developing the implementation plan, include the following
components—
• Early Childhood. Increase the number of children educated inclusively in regular
preschool classes--with no more than 50 percent and close to 30 percent of classes
composed of children with disabilities. The Council team can provide DPSCD with
names of other school districts that have done so effectively. When more children are
successful in inclusive classrooms, there will be higher expectations that these
opportunities will continue in kindergarten, enhance equitable school choices, and spur
high-quality education for students with disabilities.
• Differentiated Instruction. Provide linguistically appropriate and culturally competent
instruction aligned with core standards, differentiated for students with reading and
math performance significantly below those of their classroom peers.
• Effective Instruction Based on Core Curricular Standards. Improve instruction
aligned to core curricular standards and expand increasingly intensive interventions,
especially in literacy and math, to reinforce standards-based instruction. Consider
augmenting the commercial reading and programs with additional foundational
materials that would address alignment issues. Specify interventions in English
language arts and math that are evidence-based and can fill instructional gaps for
students with IEPs who are behind academically. Provide for flexible groupings of
students when there is a need for common interventions, and adjust the groupings based
on changing student needs.
• Planned Collaboration. Expect collaboration among general and special educators,
paraprofessionals, and related-services personnel in providing instruction and
interventions for students they have in common.
• Positive Support for Behavior. Enhance the knowledge of and supports for teachers
who work with students with challenging behavior to reinforce time engaged in
teaching and learning. Plan for the expansion and identification of personnel available
for observing classrooms, modeling effective practices, and coaching in schools with
no other internal expertise. Also, undertake activities needed to support the
development of meaningful functional behavior assessments and behavior intervention
plans.
• Elimination of “Voluntary” Out-of-school Suspension. Explicitly prohibit sending
students home “voluntarily” in lieu of a formal suspension with documentation and
notice to parents.
• English Learners with IEPs. Bring together personnel from the English learner and
special education departments, along with others with instructional expertise, to
articulate necessary interventions for ELs with IEPs. Based on a review of current
models, identify best practices in the systemic implementation of special education and
language acquisition strategies.
• Advanced Classes. Review gaps in the provision of IEP-accommodations for students
taking advanced classes to identify necessary steps to meet student needs.

Improving Special Education Services in the Detroit Community School District
Council of the Great City Schools Page 137
• Specific Learning Disabilities Program. Review the SLD program to determine how
more students could receive core instruction in general education classes,
supplemented by evidence-based intensive interventions designed to accelerate
literacy. Address the large proportion of students with IEPs who have poor reading
skills, and the high percentage of those students likely to have dyslexia. School districts
with which we are familiar have established clustered programs with evidence-based
intensive interventions. They often find that centralized approaches reach some but not
every student who would benefit from such interventions. Having all such students
attend a centralized program is neither realistic nor advisable. A combined menu of
intensive interventions designed to address various reading, writing and other needs –
along with professional development for general and special education personnel to
deliver the interventions – is necessary to reach a larger number of students with need.
• Support for Students with Vision/Hearing Impairments. Identify service gaps and
school districts that have high outcomes among students with these disabilities when
educated in regular schools. The Council can offer examples of such school districts.
• Flexible Service Delivery Models. Define effective models for supporting students in
general education classes using a flexible service model. Such models should 1)
improve teaching/learning of students in general education classes using a flexible
service delivery model; 2) expand options for students who would otherwise attend
specialized programs to receive more effective instruction in general education classes;
3) support English learners with IEPs to address their language acquisition needs as
well as their instructional needs related to their disabilities; 4) schedule common
planning time for special and general educators who work with the same students; and
5) increase the proportionate share of students with IEPs at schools with low
percentages.
• Special Program Configuration. Review DPSCD’s special program configuration and
investigate with Wayne RESA other special program configurations in other RESAs
that enable schools to offer clustered instruction based on student needs rather than
categorical disability areas. Plan to modify the current program configuration to put
more emphasis on common learning needs rather than disability characteristics. Ensure
that each specialized program is available at all grade levels and that all programs,
including those for students with severe cognitive impairments and severe multiple
impairments, have classes available in regular schools.
• Master Plan. Develop a master plan for the equitable placement of specialized
programs across the district. Include facilities and transportation personnel in these
discussions.
• Emotional Impairment Program. Review the emotional impairment and day treatment
programs. Ensure that by next school year there are sufficient supports for students who
need high intensity interventions at the high school level in regular schools, and that
students in day-treatment programs have access to courses leading to a high school
diploma.
• Reliance on Center Schools. Determine the types of instruction, services, and physical
and material resources necessary to effectively educate in regular schools those
students who would otherwise be placed in center schools. Collaborate with Wayne
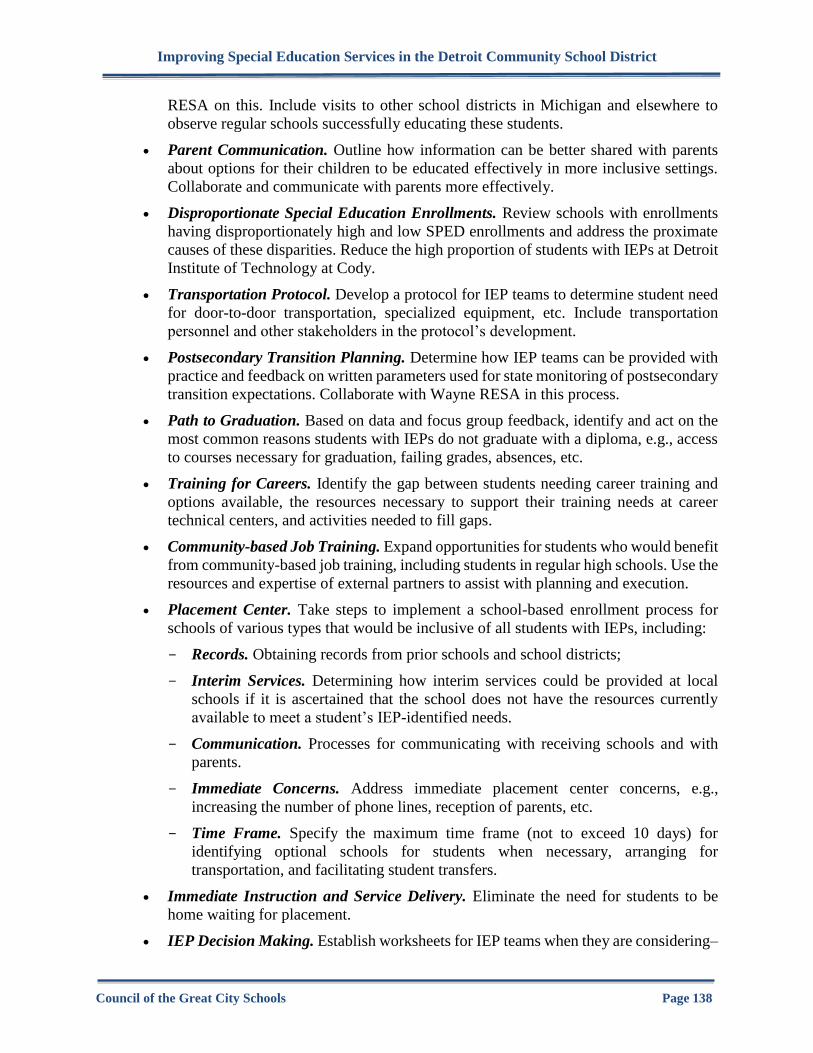
Improving Special Education Services in the Detroit Community School District
Council of the Great City Schools Page 138
RESA on this. Include visits to other school districts in Michigan and elsewhere to
observe regular schools successfully educating these students.
• Parent Communication. Outline how information can be better shared with parents
about options for their children to be educated effectively in more inclusive settings.
Collaborate and communicate with parents more effectively.
• Disproportionate Special Education Enrollments. Review schools with enrollments
having disproportionately high and low SPED enrollments and address the proximate
causes of these disparities. Reduce the high proportion of students with IEPs at Detroit
Institute of Technology at Cody.
• Transportation Protocol. Develop a protocol for IEP teams to determine student need
for door-to-door transportation, specialized equipment, etc. Include transportation
personnel and other stakeholders in the protocol’s development.
• Postsecondary Transition Planning. Determine how IEP teams can be provided with
practice and feedback on written parameters used for state monitoring of postsecondary
transition expectations. Collaborate with Wayne RESA in this process.
• Path to Graduation. Based on data and focus group feedback, identify and act on the
most common reasons students with IEPs do not graduate with a diploma, e.g., access
to courses necessary for graduation, failing grades, absences, etc.
• Training for Careers. Identify the gap between students needing career training and
options available, the resources necessary to support their training needs at career
technical centers, and activities needed to fill gaps.
• Community-based Job Training. Expand opportunities for students who would benefit
from community-based job training, including students in regular high schools. Use the
resources and expertise of external partners to assist with planning and execution.
• Placement Center. Take steps to implement a school-based enrollment process for
schools of various types that would be inclusive of all students with IEPs, including:
- Records. Obtaining records from prior schools and school districts;
- Interim Services. Determining how interim services could be provided at local
schools if it is ascertained that the school does not have the resources currently
available to meet a student’s IEP-identified needs.
- Communication. Processes for communicating with receiving schools and with
parents.
- Immediate Concerns. Address immediate placement center concerns, e.g.,
increasing the number of phone lines, reception of parents, etc.
- Time Frame. Specify the maximum time frame (not to exceed 10 days) for
identifying optional schools for students when necessary, arranging for
transportation, and facilitating student transfers.
• Immediate Instruction and Service Delivery. Eliminate the need for students to be
home waiting for placement.
• IEP Decision Making. Establish worksheets for IEP teams when they are considering–

Improving Special Education Services in the Detroit Community School District
Council of the Great City Schools Page 139
- General Education Classes. Students’ education in general education classes and
supports needed for core instruction and evidence-based interventions.
- Special Programs. Students’ learning levels in specialized education programs.
Clarify that low grades (without an examination of appropriate instruction,
interventions, and supports provided) should not drive placement.
• Assistive Technology. Consider resource gaps with students who would benefit from
assistive technology, especially those who are nonverbal, and how to expand their
access to devices and services.
• Wayne RESA Plan. Clarify for all relevant administrators and staff members their roles
and responsibilities regarding the Wayne RESA Plan for the Delivery of Special
Education, the Act 18 Agreement, the Act 18 Budget process, and center program
procedures. Build this into the implementation plan.
• Parent Concerns. Collaborate with parents on the creation of a special education
advisory council for each cohort, and possibly a districtwide advisory council. Also,
consider structured ways that parents could voice their concerns on a regular basis,
beginning at the school level and continuing through the cohort level. Determine how
special education department personnel would support this process. Consider how
concerns will be documented and addressed within a reasonable time frame.
Feedback. Collect feedback on the draft improvement plan from stakeholders at varying
grade levels, and among special/general education administrators, principals,
general/special education teachers, related-service providers, teacher assistants, parents,
and community-based organizations. Continue this feedback loop as the plan is
implemented to identify and address concerns.
c. Written Expectations. As part of the implementation plan described in Recommendation
4b, develop written expectations on each plan component. (Coordinate with
Recommendation 2c.)
d. Differentiated Professional Learning and Parent Training. Embed in the professional
development curriculum (Recommendation 1e) content needed to carry out
Recommendation 4. Embed into current walk-through protocols indicators associated with
implementation plan components that the district expects to be in place within a specified
time-frame.
In addition, consider –
• How training will be provided using a multidisciplinary and interdepartmental
approach, so that professional learning to promote inclusive education is not viewed
incorrectly as a “special education” initiative;
• How and when all personnel will be trained in each critical area;
• How key information will be communicated effectively, including the use of on-line
training for compliance issues that are more rote in nature;
• How information will be used;
• How all stakeholder groups will be included, e.g., principals, general and special
educators, clinicians, paraprofessionals, etc.

Improving Special Education Services in the Detroit Community School District
Council of the Great City Schools Page 140
• What additional coaching and supports may be needed;
• Principal leadership training necessary to maximize and leverage inclusive and high-
quality instruction and supports, including training on flexible uses of school-based
budgets to expand inclusive education; and
• Engaging Wayne RESA and stakeholders on expanding training opportunities for
parents.
e. Data Analysis and Reports. In addition to activities proposed in Recommendation 1e,
embed in school performance and planning frameworks--
• Data Reporting. The types of data needed to better target patterns and areas of concern.
• Risk Ratios. Report disparities using a risk ratio to better understand district practices
and their effects.
f. Monitoring and Accountability. Expect all principals to be responsible for overseeing
special education in their buildings and hold them explicitly accountable for such.
Articulate how cohort principal leaders will work with their principals and how they will
exercise their responsibilities to ensure principals are serving students with disabilities.
Embed the following activities into the monitoring and accountability systems described
in Recommendation 1g. and 2f.
• Data Checks. Include information on students with disabilities in data discussions to
inform follow-up actions and track outcomes. Ensure that data includes all SPP
indicators.
• Fidelity Assessments and Walk-Throughs. Review walk-through tools used to support
instruction and interventions in general education classes, resource classes, and special
programs to see how students are being taught. Initiate technical assistance,
professional development, coaching, and mentoring to improve practices.
• Timely Communication and Feedback. Establish a process for timely feedback to the
district’s MTSS leadership team on barriers to inclusive education.
• Monitor. Monitor and follow up on –
- Informal School Removals. Students who are sent home without documenting out-
of-school suspensions.
- Placement. Extent to which students receive placements within expected time
frames.
- Waiting for placement. Students at home while waiting for placement.
- Too High Caseloads. How special education teacher caseloads can be monitored
on a continuing basis using electronic data that is gathered at the school level.
5. Department, Cohort, and Special Education Support for Schools. Specifically charge senior
staff in all central office departments with collaborating with each other to support teaching
and learning for students with disabilities. In addition--

Improving Special Education Services in the Detroit Community School District
Council of the Great City Schools Page 141
a. Superintendent’s Cabinet. Include the special education senior executive director in
cabinet meetings to ensure the director receives direct information about district initiatives
and can contribute to discussions.
b. Collaborative/Inclusive Discussions and Deliverables. Ensure all central office, cohort,
and school discussions affecting teaching and learning include special education personnel
and others knowledgeable about students with disabilities. Have department
representatives from special education and English language learners meet regularly to
address mutual responsibilities for English learners who have disabilities, and charge staff
with developing and implementing models of effective instruction and supports for English
learners with IEPs. (Coordinate with Recommendation 4b.)
As part of this collaboration, identify personnel in other departments having interactions
with schools who can be aligned to one or more cohorts to build the capacity of principal
leaders and principals to support their schools.
c. Principal Leaders. Expect principal leaders and their respective special education cohort
leaders (see Recommendation 6a below) to meet at least biweekly to –
• Review School Data on issues delineated in this report and other areas relevant to
teaching and learning.
• Strategic Planning. Develop strategic actions based on data with principals having
common issues and individual principals having unique issues.
• Professional Learning. Develop professional learning for cohort personnel based on
Recommendation 4d and other areas of need.
• Monitoring. Establish monitoring protocols for cohorts based on Recommendation 4f.
d. Cross-Functional Training. Establish a structure for cross-training of personnel from
different departments to provide essential information for all principals, leadership teams,
and teachers. More personnel should be available to support schools and teachers. In
addition, use personnel with specialized expertise beyond what most teachers are expected
to know.
6. Special Education Department Organization. The following recommendations are designed
to enable special education department personnel to more effectively assist principal leaders,
and school personnel to support teaching and learning. The senior executive director should be
able to carry out her roles and responsibilities and should have the authority to do so. This
includes the ability to make day-to-day decisions on activities within her control. To facilitate
relationships between the senior executive director, principal leaders, and principals, she needs
to attend principal meetings and have a standing agenda item at those meetings. (See exhibit 1
for a graphic illustration for this recommended organization.)
a. Direct Report to Senior Executive Director. Have the following positions report directly
to the special education director:
- Expert leader

Improving Special Education Services in the Detroit Community School District
Council of the Great City Schools Page 142
- Five cohort leaders99
- Related services leader
• Expert Unit. Currently, 16 supervisors 100 are assigned to five cohorts in varying
numbers and each has specialized programs they oversee, e.g., ASD, EI, SCI/SXI, etc.
Under the supervision of one expert leader identify the expertise necessary for
personnel to support cohort leaders and personnel under their supervision. Collectively,
expert unit personnel should have the knowledge, experience, and skills to:
- Accelerate literacy for struggling readers, including those with dyslexia;
- Accelerate math achievement;
- Improve instruction aligned with alternate assessments and standards;
- Improve positive behavior for students with the most challenging social/emotional
and behavioral needs;
- Improve postsecondary transition activities and supports, including community-
based training
These individuals would not supervise “programs” per se. Instead, they would gather
the most current evidence- and research-based information; provide leadership on the
development of standards of practice and monitoring guidance; provide professional
development to other units and schools; and support cohort personnel when they need
additional expertise to address issues at schools. In addition to obtaining feedback from
cohort and auxiliary personnel, the experts should visit schools periodically to observe
and obtain a better understanding of teaching/learning challenges.
To free up a sufficient number of personnel for each cohort, this unit should be as small
as possible – yet have a sufficient number of personnel to carry out expectations for
their collective practice.
• Cohort Unit. With five leaders (one for each cohort), free up as many current slots as
possible and establish new administrative positions (at least two) for each cohort leader.
These personnel, with support from the expert leaders, should have the knowledge,
skills, and experience to help teachers support the academic and social/emotional needs
of their students.
The goal would to provide each cohort administrator with a reasonable number of
schools to carry out his or her expected roles and responsibilities. In collaboration with
the senior executive director, and relevant cohort and principal leaders, consider having
one staff member be responsible for compliance and the other for teaching/learning.
Have each cohort staff member and leader (with a fewer number of schools) be
responsible for collaborating with their respective principals and supporting all special
education teachers in their schools. In this way, each staff member can assist in
developing a more flexible special education delivery system, solve problems, and
99 Generic terms are used to provide DPSCD with the flexibility to determine the appropriate administrative level(s)
for each position. 100 Based on the December 6, 2017 organizational chart provided to the Council team. Several of these positions are
vacant.

Improving Special Education Services in the Detroit Community School District
Council of the Great City Schools Page 143
support placements.
• Related Services Unit. This unit currently has one interim deputy executive director,
one director, eight supervisors, and one coordinator. Reduce the number of supervisors
and assign lead personnel to support the supervisor in areas with large numbers of staff.
At a minimum, have one supervisor each for psychology, social workers, and teachers.
Provide lead personnel with a reduced caseload and stipends.
Exhibit 1. Recommended Special Education Department Organization Graphic Illustration
b. Special Education Department Management
• Evaluation of Related Services Personnel. Consider having principals evaluate related
services personnel who work in their schools. The Council team can provide the names
of other large urban districts that operate in this manner.
• Special Education Department Meetings. With feedback from special education
department personnel, identify the most effective communication processes and
frequency with which meetings should be held.
• Clerical Staff/Administrative Assistants. To the maximum extent possible, use clerical
staff and administrative assistants to carry out activities that can be delegated to them
to free up administrators for work in areas requiring their expertise.
• Consultation with Wayne RESA. During the reorganization process, consult with
Wayne RESA to ensure that new positions are developed in the most flexible manner
while meeting state requirements. If necessary, ask Wayne RESA to consider an
amendment to its plan to provide state-approved flexibility that would be helpful but is
not currently available. Also, identify how the special education department will ensure
consistent attendance at Wayne RESA meetings and provide feedback to other
department personnel, principal leaders, principals, and school personnel.
• Feedback/Communication. Obtain the input of principal leaders, and a representative
group of principals and specialized program teachers to explain the draft organization
and obtain feedback. Once the reorganization is finalized, communicate it broadly to
stakeholders, and post on the district’s website. With parent groups, develop and
execute a communication plan for parents.
• Functional Directory. On the district’s website and through other venues distribute
Senior Executive
Director
Expert Unit
Leader
Cohort Unit, 5
Leaders (1 for each
cohort)
Related Services
Unit Leader

Improving Special Education Services in the Detroit Community School District
Council of the Great City Schools Page 144
broadly to stakeholders a functional directory with the new organization that clearly
describes who to call for information based on subject areas of interest or need. Base
the directory on a pyramid of support, starting at the school level, moving to the school
cohort administrator, cohort leader, etc.
• Language Translation for Parents. Translate the new organizational directory into the
most common languages used by parents who have limited English proficiency.
• Group Emails to Principals. When special education personnel are coordinating
information with principals and it is the same across principals, enable special
education personnel to send emails when authorized by the special education senior
executive director.
c. Lead Teachers. Expect that every school will have a lead teacher assigned to the school to
liaison with the cohort administrator. With a representative group of principals and lead
teachers, determine how lead teachers will be able to fulfill his/her roles and
responsibilities. Consider reducing caseloads, providing stipends, and other incentives.
Provide differentiated mandatory training to lead teachers.
d. Student-Staff Ratios. Have the deputy superintendent, senior special education executive
director, and finance personnel review staffing ratios summarized in this report (see
Appendix A) and other caseload data. NOTE: Relatively low or high student-to-personnel
ratios in Appendix A do not necessarily mean that an area is staffed inappropriately;
however, the ratios should prompt further review. Review caseloads to ensure that adequate
numbers of special education and related-services personnel are at each school to carry out
their expected responsibilities. Based on a full review, consider the changes needed short
and long term.
e. Vacant Positions. Create a sense of urgency around filling remaining vacant special
education and related positions, and to the extent possible replace contractual personnel
with DCPSD employees as quickly as feasible.
• Vacancy Status. Validate vacant positions with principals. Have human resources
report monthly to the deputy and the superintendent on how many positions have been
filled and the number remaining by personnel area. If current strategies are unlikely to
fill remaining positions for the beginning of the 2018-19 school year, problem-solve
new approaches that are likely to succeed. One approach would be to contact charter
school operates to identify contract agencies they use to fill vacant positions.
• Expedite Hiring. Provide the superintendent and deputy with information on the range
of days necessary to establish a start date for new personnel. If unreasonable, identify
measures for shortening the process so personnel are not lost to other districts.
7. Compliance Support, and Data and Fiscal issues. Consider the following actions to improve
compliance; address data issues; and enhance revenue.
a. Compliance Support. Special education department personnel, alone, cannot improve
special education compliance. This requires the collaboration of principal leaders,
principals, and accountability staff.
• Special Education and Section 504 Standard Operating Procedures Manuals.
Expedite completion of manuals on special education and Section 504. Supplement the

Improving Special Education Services in the Detroit Community School District
Council of the Great City Schools Page 145
documents with written expectations proposed in Recommendations 2c and 4c.
Establish the two manuals as webpages that have links to more extensive information
and public resources. Collaborate with stakeholders, including parents, to identify
useful resources and links. Ensure staff members are available to update information
regularly. Provide training to stakeholders and parents to boost their understanding of
core elements of special education and Section 504, and how to use the webpages.
Ensure training is accessible to parents with diverse linguistic needs and sensory
limitations.
• Section 504 Operations. As part of Section 504 training, include information on
students with health plans to determine whether they are eligible for Section 504
services. Also determine how current information could be used to make more
appropriate eligibility determinations. In addition, ensure that students having a health
plan are also reviewed for the need for Section 504 safeguards.
• Professional Learning. Embed in Recommendation 4b and 4d professional learning to
address compliance issues most frequently related to MDE complaints, due process,
and OCR complaints, e.g., procedural safeguards for suspended students, prior written
notices, and IEP implementation.
• Dispute Resolution. Expect that every principal and their respective principal leaders
will collaborate with the cohort administrator to resolve complaints when resolution is
within the principal’s control.
• IEP System Changes. Establish a process for notifying IEP system users of changes to
the system so they can execute them effectively.
• Timely IEP Meetings. Develop a plan for holding timely IEP team meetings,
including–
- Master Schedule. Having each school develop a master schedule for 2018-19 that
would forecast annual IEP meetings and triennial evaluations/IEP meetings held
throughout the school year rather than during only a few months. To do so, schedule
triennial and annual IEP meetings earlier than usual to ensure a less concentrated
yearly schedule.
- Vacant Special Educator Positions. Develop a protocol for principals on
developing IEPs and how to include a special educator when the position is not
filled by a certified person.
- Supporting Case Managers. Develop a protocol for case managers on facilitating
participation of IEP team members, and free up case managers to attend meetings.
b. Fiscal Issues. Pursue the following activities to enhance revenue and shift more funds to
activities that would boost high-quality education in inclusive and separate classes.
• Charter Schools. Join with other school districts to use data like that highlighted in this
report to bring attention to the legislature the inequitable funding of special education
for school districts compared to charters. As part of the district’s data collection for this
purpose, track students returning to DPSCD from charters, the reasons for their return,
and a comparison of IEP services provided by charters and those deemed appropriate
by DPSCD.

Improving Special Education Services in the Detroit Community School District
Council of the Great City Schools Page 146
• Center School Budgets. Immediately, have DPSCD’s senior special education
executive director, relevant fiscal, human resources, purchasing personnel, and center
school principals meet (with Wayne RESA personnel if helpful) to resolve the
purchasing and hiring issues center school principals face when trying to execute their
approved Wayne RESA budgets in a timely manner. Have DPSCD personnel share
with the deputy superintendent the steps that will be taken and how they will
periodically report the status of those steps.
• Vendor System. Expedite approval of vender numbers for outside providers or
evaluators when necessary to provide compensatory services.
• Transportation. Develop a protocol to guide decision-making for transportation
services. See Recommendation 4b.
• Medicaid Reimbursement. Develop an RFP for Medicaid software to enable DPSCD
personnel to easily document electronically service provision for all Medicaid-eligible
students. Cast a wide net to find the most user-friendly software that will migrate data
from and to the district’s IEP system. The Council can help identify software used in
other districts. This process should enable special education personnel to have valuable
information on all students receiving services, provide for retroactive billing for
students newly found to be Medicaid eligible, and support the submission of Medicaid
claims.
c. Data Collection and Reporting. In addition to Recommendations 1f, 2e, and 4e –
• Timely IEPs. Develop user-friendly reports by cohort, school, and case manager on the
percentage of timely IEPs each year, along with a backlog report showing students who
have not received an IEP by the due date and the number of days waiting for an IEP.
Have the report available electronically for lead principals, principals, and cohort
leaders/administrators. Sort percentages and backlogged IEPs by school, so principals
and cohort leaders can quickly identify schools in need. Have cohort leaders work with
fellow administrators to identify personnel who can be temporarily deployed to
neighboring schools to handle overdue IEPs and evaluations and those that are about
to be overdue.
• Early Childhood SPP 7 Indicator. Ensure that data are entered correctly on early
childhood SPP Indicator 7--the numbers of students entering the program below
expectation and substantially increased developmentally upon exiting, and numbers
meeting age expectations by the time they exit.
• Data Reports. Have staff who are expert in data reporting review the types of data and
charts produced in this report, how these and other relevant information can be reported
by school and cohort levels. Determine the extent to which the district’s current IEP or
other data system can provide similar data. DPSCD should be able to produce such
reports without relying on Wayne RESA.
• IEP System. Have the district review IEP systems available in the market place to
compare their current system on whether they are sufficiently advanced in terms of
usability, data reporting, ability to migrate with the student information system, and
potential migration of current data into a new system. Use this information to determine
if the benefits of a new system outweigh keeping the current system.

Improving Special Education Services in the Detroit Community School District
Council of the Great City Schools Page 147
d. Monitoring and Accountability. In addition to Recommendations 1g, 2f, and 4f--
• Strategic Plan. Ensure that the district’s monitoring of its strategic plan includes
indicators on students with IEPs, and that improvement activities take into account
evidence-based practices that could inform systemic and school-based improvements.
• Student Growth. Ensure that metrics tracking student growth address the various
circumstances of students with disabilities, especially those receiving instruction based
on alternate standards. To the extent that the district is using NWEA data to gauge
growth, have the research and assessment staff determine whether the test’s growth
norms allow students to make adequate progress on state standards.
• Accountability Protocol. Establish protocols or procedures for resolving disagreements
between school personnel and special education personnel. Components should include
but not be limited to procedures on school suspensions, the timely entry of
transportation data, exiting students, facilitating transfers and new transportation
routes, implementing IEPs, securing lead teachers, etc.
• Performance Evaluations. Embed in performance evaluations relevant indicators on
each personnel area’s role in carrying out core special education activities under their
control.
8. Internal Project Manager. Have a project manager assigned to the superintendent report
regularly on progress in implementing leadership’s plans and initiatives, including following
up recommendations in this report. Have the project manager report on relevant data, the status
of implementation, and barriers to execution that require interdepartmental collaboration, and
the need for adjustments to the plan.

Improving Special Education Services in the Detroit Community School District
Council of the Great City Schools Page 148
APPENDICES

Improving Special Education Services in the Detroit Community School District
Council of the Great City Schools Page 149
Appendix A. Incidence Rate and Staffing Ratios
The Urban Special Education Leadership Collaborative and the Council of the Great City
Schools, including its team members who have conducted special education reviews, collected the
data reported in these tables. The data do not give precise comparisons, so the results need to be
used with caution. District data are not consistently reported (e.g., some districts include
contractual personnel and others may exclude them) and the numbers are sometimes affected by
varying placement types used by a school district. The data may count all students with IEPs,
including those placed in charters, agencies, and nonpublic schools. Still, these data are the best
available and are useful as a rough guide to staffing ratios.
Incidence of Students with IEPS and Personnel Staffing Ratios (May 2017)*
To
tal
Enro
llme
nt Incidence Sp Educator Paraeducator Speech/Lang Psychologist
% S
pEd
SpEd
En
r
Nu
mb
er
Ratio To:
Nu
mb
er
Ratio To:
Nu
mb
er
Ratio To:
Nu
mb
er
Ratio To:
Sp
Ed
All
Sp
Ed
All
Sp
Ed
All
Sp
Ed
All
Agawam Public Schools 4,347 15% 656 39 17 112 100 7 44 15 44 290 3 219 1449 Atlanta Public Schools 43,443 11% 4,950 431 11 101 224 22 194 65 76 688 22 225 1975 Anchorage School Dist 48,154 14.1% 6,779 716.8 9.5 67.2 786.4 8.6 61.2 65 104 741 44.7 151 1010 Arlington VA Pub Sch 21231 13.9% 2952 343 8.6 62 262 11 81 38 77 574 22 134 923 Austin Pub S D 84676 10% 8,062 772.5 10.4 110 824 9.7 103 70.5 114 1201 34.6 233 2447 Baltimore City Publ Sch 82,824 16% 12,866 1,121 12 74 620 21 134 92 140 901 NA NA NA Baltimore County P Sch 107,033 11.4% 12,127 1025.4 11.8 104 2305* 5.26 46 187.5 65 571 85.3 142 1254
Boston Public Schools 54,966 21% 11,534 1200 10 47 800 14 70 147 78 383 48 240 1173
Bellevue, WA SD 18,883 10.3% 1,947 82.7 23.5 228 118.6 16.4 159 17.4 112 1085 17.3 112.5 1092
Bridgeport, CT 20,300 14.3% 2,618 204 13 100 254 10 80 25 105 812 33 79 615 Buffalo Public Schools 46,583 16.6% 7744 753 10.3 61.9 439 17.6 106 109 71 427 62 125 751 Cambridge Publ Schools 6,000 20% 1,200 176 7 35 103 12 59 20 60 300 22 55 273 Carpentersville, IL 19,844 15.8% 3,139 227 13.8 87 380 8.3 52 43 73 461 28 112 708 Chicago Public Schools 397,092 13.7% 54,376 4,649 11.7 85.4 4,228 12.9 94 390 139 1018 261 208 1521
Cincinnati Pub Schools 51,431 17.4% 8,928 457 19.5 112.5 801 11.1 64 62 144 830 57.7 155 891
Clark Cty School Dist 309,476 10% 32,167 2,247 15 138 1,346 24 230 299 108 1036 180 179 1720 Cleve Hts-UnivHtsCty 6,000 18% 1,100 83 14 73 58 19 104 7 158 858 8 NA NA Cleveland Metropolitan 7,7775 20.5% 37,890 853 9.1 44.4 469 16.6 81 81.8 95 463 75 104 505 Compton CA Unified SD 26,703 11.2% 2981 126 28 256 118 25 226 5 596 5341 14 213 1907 DeKalb 428, IL 6,249 14.1% 879 58 15.2 108 205 4.3 30 9 98 694 7.5 117 833 DesMoines Public Schls 31,654 15.3% 4,854 493* 9.8 64 358.5** 13.5 88 37.3 130 849 11.5 422 2753 D.C. Public Schools 48,991 18% 8,603 669 13 74 653 14 76 90 96 545 78 111 629 Davenport Comm Sch 15,302 12% 1,857 188 10 82 287 7 54 NA NA NA NA NA NA
Deer Valley Unified SD 36,086 9% 3,289 190 18 190 229 15 158 49 68 737 108 31 335
Denver Public Schools 78,352 12% 9,142 592 16 133 528 18 149 94 98 834 98 94 800
Detroit Public Schools 54,378 16.1% 8,731 535.8 16 101 458 19 119 98 89 555 40 218 1359
ESD 112 13,764 14% 1,987 55 37 251 158 13 88 20 100 689 12 166 1147
Elgin U-46, IL 40,525 13.1% 5,304 252.8 21 160 288.5 18 140 71.9 74 564 20 265 2026
Everett Pub Schools, WA 6,100 17% 1,049 74 15 83 51 21 178 4 263 1525 5 210 1220 Fort Worth 79,885 8% 6,144 520 12 154 450 14 178 73 85 1095 31 199 2577 Greenville County, SC 70,282 14% 9,894 463 21 152 376 26 187 93 106 756 25 396 2111 Houston Indepen SD 200,568 9% 17,489 1,625 11 124 1,145 16 176 158 111 1270 NA NA NA Kalamazoo Pub Schools 12,100 14% 1,667 70 24 173 79 22 154 15 112 807 NA NA NA Kent, WA Pub Schools 27,196 11.3% 3,069 148.7 20.6 183 318 9.7 85.5 32.3 95 842 25 123 1088 Lake Washington, WA 26,864 11.7% 3,145 155.1 20.3 111.2 241.5 13.0 111.2 32.6 96.5 824 24.7 127.3 1087.6 Kyrene School District 17,910 9% 1,544 141 11 128 124 13 145 27 58 664 14 111 1280
Lakota Local 18,500 10% 1,800 126 15 147 120 15 155 39 47 475 18 100 1021
Los Angeles Unified SD 521,880101 12.69% 66,236 5307.4 12.5 98 8277.9 8.0 63 . 496.4 133 1051 513.5 129 1016
Lincoln 1,060 12% 128 21 7 51 21 7 51 5 26 212 2 64 530 Madison, WI Pub Schls 27,185 14.0% 3,808 347 10.9 78 448 8.5 61 86 44 316 49 77.7 555 Marlborough Pub Sch 4,835 25% 1,198 141 9 35 115 11 43 7 172 691 4 300 1209
101 Data does not include charter schools.

Improving Special Education Services in the Detroit Community School District
Council of the Great City Schools Page 150
Incidence of Students with IEPS and Personnel Staffing Ratios (May 2017)*
To
tal
Enro
llme
nt Incidence Sp Educator Paraeducator Speech/Lang Psychologist
% S
pEd
SpEd
En
r
Nu
mb
er
Ratio To:
Nu
mb
er
Ratio To:
Nu
mb
er
Ratio To:
Nu
mb
er
Ratio To:
Sp
Ed
All
Sp
Ed
All
Sp
Ed
All
Sp
Ed
All
Memphis City 110,863 15% 16,637 912 19 122 655 26 170 53 314 2092 58 287 1912 Miami-Dade 376,264 11% 40,012 2,500 17 151 1,226 33 307 209 192 1801 206 195 1827 Milwaukee 78,533 20.9% 16,406 1281 13 61 988 16.6 79 169 80 465 136 121 577 Montgomery Cty Sch 146,812 12% 17,226 1,588 11 93 1,398 13 106 293 59 502 97 178 1514 Naperville IL 203 18,031 11% 1978 150 13 120 237 8 76 33 59 549 22 90 824 Nashville 82,260 12.3% 10,141 680.5 14.9 121 594 17.1 138 109 93 755 65.5 155 1256 New Bedford 12,692 21% 2,655 204 14 63 205 13 62 26 103 489 9 295 1411 Oak Park Sch Dist 97 5,400 16% 875 78 12 70 90 10 60 14 63 386 8 110 675 N. Chicago, IL (in Dist.) 3803 16% 614 39 15.7 92 27 22.7 141 8 76.8 475.4 5 122.8 760.6 Oakland Unified SD 33312 15.4% 5401 404 13.4 82.5 175 31 190 47 115 709 43.5 125 766 Pittsburgh Pub Schools 23,276 18.1% 4,210 308 13.7 76 263 16 89 31 136 751 16 263 1455 Portland Public Schools 46,596 14% 6,513 355 19 132 535 13 88 92 71 507 56 117 833 Providence, RI 23,695 18.8% 4460 340 13 70 339 13 70 40 111 592 28 159 846
Renton, WA 14,343 14.7% 2,108 129 16.3 111 294 7 48 20 105 717 15 140 956
Rochester, NY 27,552 20% 5,472 559.2 9.8 49 428 12.8 64 148 37 186 64 85.5 430.5 Rockford IL Pub S 28,973 14% 4,065 336 12 86 334 12 87 49 83 591 24 169 1207 Round Rock 43,000 8% 3,313 369 9 117 171 20 252 41 81 1049 29 115 1483 Sacramento 46,843 13.9% 6,519 288.1 22.6 162 246.2 26.5 190 33 128 922 50.8 197.5 1419 San Diego Unified SD 132,500 12% 16,300 1,100 15 121 1,300 13 102 196 84 677 129 126 1027 Saugus, MA 3,012 15% 462 28 17 108 29 16 104 6 77 502 NA NA NA Sch Dist of Philadelphia 168,181 20% 33,686 1,535 22 110 610 56 276 99 341 1699 100 337 1682 Scottsdale, AZ 26,544 10.9% 2,891 246 11.8 108 230 12.6 115 39.4 73 674 28.4 102 935 Shelby County (Memphis) 114760 12.7% 14556 852 17.1 135 768 19.0 149 55 265 2087 60 243 1913 St. Paul, MN 38,086 18.8% 7,152 523 13.7 73 536 13.3 71 97 74 392 19 376 2004 Sun Prairie Area S Dist 6,656 10% 697 62 12 108 93 8 72 14 50 476 7 100 951 Tacoma Pub Schl WA 32,412 12% 3,894 172.5 23 188 223 17 145 33.6 116 965 27 144 1200 Tucson Unified SD 56,000 14% 8,092 409 20 137 419 20 134 61 133 919 54 150 1038 Washoe County Dist, NV 63,310 14% 8,551 472 19 135 325 27 195 77 112 823 37 232 1712 Williamson Cty Schl 31,292 9% 2,824 213 13 147 400 7 78 34 121 911 23 178 1346 West Aurora, IL SD 12,725 13% 1688 120 14 106 101 17 126 21 80 606 13 130 979 Worcester, MA 24,825 21% 5,172 254 21 98 366 15 68 38 137 654 NA NA NA
Averages 13.7% 14.4 105 15.7 115 127 926 178 1301

Improving Special Education Services in the Detroit Community School District
Council of the Great City Schools Page 151
Ratios for Social Workers, Nurses, OTs &
PTs
Tota
l Stu
de
nt
Enro
llme
nt
To
tal S
pe
cial
Ed
Social Worker
Nursing (School/RN, etc.)
Occupa- tional
Therapy
Physical Therapy
Nu
mb
er Ratio To:
Nu
mb
er Ratio To:
Nu
mb
er Ratio
Nu
mb
er Ratio
Sp
ed
All
SpEd
All
Sp
Ed
Sp
Ed
Agawam Pub Schools 4,347 656 NA NA NA 8 82 544 3 219 3 219
Anchorage School Dist. 43,443 4,950 NA NA NA 112.8 60 426 21.9 309 7.8 869 Atlanta Public Schools 48,154 6,779 30 165 1448 58 85 511 12 413 3 1650 Arlington Pub Schools 21231 2952 15 197 1415 *30 98 708 20 147 6 492
Austin Pub S D 84676 8,062 21 384 4032 68 119 1245 19 424 13 620 Baltimore City Public 82,824 12,866 193 67 430 78 165 1062 20 644 5 2574
Baltimore County Pub Sc 107,033 12,127 48.7 249 1701 179.8 67 595 65.2 186 27 449 Bellevue, WA SD 54,966 11,534 4 487 4721 13.2 148 1431 5.3 367 5.3 367 Boston Public Schools 18,883 1,947 NA NA NA 100 115 563 67 172 17 680 Bridgeport, CT 20,300 2,618 38 69 534 28 94 82 7 374 2 1309 Buffalo Public Schools 46,583 7744 48.5 160 960 NA NA NA 75 103 29 267 Cambridge Pub School 6,000 1,200 16 75 375 0 NA NA 16 75 7 172 Carpentersville 19,844 3,139 36.5 86 544 27.5 114 722 22 142 6 523 Chicago Pub Schools 397,092 54,376 355.7 142 1136 334 151 1210 115 440 35 1445 Cincinnati Pub Sch 51,431 8,928 NA NA NA NA NA NA 19 470 5 1786 Clark Cty School Dist 309,476 32,167 NA NA NA 173 186 1789 68 474 29 1100
Cleve Hts-UnivHtsCty 6,000 1,100 7 158 858 5 220 1200 2 550 1 1100
Cleveland Metropolitan 7,7775 37,890 NA NA NA 69 113 549 36 216 9 864
Compton CA Unified SD 26,703 2981 1 2981 NA 1 2981 NA 1.5 1987 .5 5962
DeKalb 428, IL 6,249 879 8 110 781 7 126 893 3.4 256 1.3 204
DesMoines Public Schls 31,654 4,854 25.8 188 1227 58.4 83 542 7 693 4.8 1011 D.C. Public Schools 48,991 8,603 90 96 545 127 68 386 48 180 16 538 Davenport CommSch 15,302 1,857 NA NA NA 7 266 2186 NA NA NA NA Deer Valley Unified SD 36,086 3,289 NA NA NA 37 89 976 19 174 4 823
Denver Public Schools 78,352 9,142 74 124 1059 77 119 1018 25 366 12 762
Detroit Public Schools 54,378 8,731 76 115 716 38 230 1431 31.6 276 10 873 Elgin U-46, IL 13,764 1,987 56 95 724 59.5 89 681 25.2 210 4 1326 ESD 112 40,525 5,304 NA NA NA 5 398 2753 6 332 3 663 Everett Public Schools 6,100 1,049 2 525 3050 11 96 555 2 525 3 350 Fort Worth 79,885 6,144 NA NA NA 106 58 754 16 384 10 615 Greenville County, SC 70,282 9,894 20 495 3514 132 75 532 14 707 4 2574 Houston Indepen SD 200,568 17,489 26 673 7715 25 700 8020 17 1029 8 2187 Kalamazoo Pub 12,100 1,667 5 334 2420 2 834 6050 4 417 3 556 Kent, WA Pub Schools 27,196 3,069 2.2 NA NA NA NA NA 12.8 240 4.8 639 Kyrene School District 26,864 3,145 NA NA NA 4 386 4478 2 772 2 772 Lake Washington SD 17,910 1,544 NA NA NA 23.6 133 1138 19.3 163 3.3 953
Lakota Local 18,500 1,800 6 300 3084 14 129 1322 8 225 2 900
Los Angeles Unified SD 521,880102 66,236 93.9 705 5558 465 142 1122 265 265 44.5 1488 Lincoln 1,060 128 5 26 212 2 64 530 2 64 1 128 Madison, WI Public Schls 27,185 3,808 68 56 399 38 100 715 34 112 13 293 Marlborough Public 4,835 1,198 9 134 538 10 120 484 4 300 2 599 Memphis City 110,863 16,637 55 303 2016 68 245 1641 11 1513 9 1849 Miami-Dade 376,264 40,012 NA NA NA 206 195 1827 65 616 23 1740 Montgomery CtySch 78,533 16,406 NA NA NA NA NA NA 112 154 61 283 Milwaukee 146,812 17,226 140 117 560 101 162 778 30 547 13 1262 Naperville, IL 203 18,031 1978 27 73 671 29 68 625 4 494 3 659 Nashville 82,260 10,141 NA NA NA 57 178 1443 29.5 344 6 1690 New Bedford 12,692 2,655 67 40 190 30 89 424 11 242 3 885 North Chicago, IL 5,400 875 10 61.4 380.3 NA NA NA 3.6 170.5 1.6 383.8
Oak Park Sch Dist 97 3803 614 12 73 450 8 110 675 7 1125 1 875
Pittsburgh Pub Sch 33312 5401 40 105 582 40.6 104 573 7 601 8 526 Oakland Unified SD 23,276 4,210 19 284 1753 30.8 175 1082 12 450 2 2701 Portland Pub Schools 46,596 6,513 10 652 4660 NA NA NA 20 326 9 724 Providence 23,695 4460 35 127 677 NA NA NA 11.5 388 4.5 991
102 Data does not include charter schools.

Improving Special Education Services in the Detroit Community School District
Council of the Great City Schools Page 152
Ratios for Social Workers, Nurses, OTs &
PTs
Tota
l Stu
de
nt
Enro
llme
nt
To
tal S
pe
cial
Ed
Social Worker
Nursing (School/RN, etc.)
Occupa- tional
Therapy
Physical Therapy
Nu
mb
er Ratio To:
Nu
mb
er Ratio To:
Nu
mb
er Ratio
Nu
mb
er Ratio
Sp
ed
All
SpEd
All
Sp
Ed
Sp
Ed
Renton, WA 14,343 2,108 0 NA NA 17 124 844 15 141 3 703 Rockford IL Pub S 27,552 5,472 26 135 1114 32 127 905 12.5 325 4.5 903 Rochester, NY 28,973 4,065 89 61.5 30.6 55.5 98.6 496 29.2 187.4 11 497.5 Round Rock 43,000 3,313 NA NA NA 1 NA NA 10 332 3 1105 Sacramento 46,843 6,519 8 NA NA 5* NA NA 2 NA 0 NA San Diego Unified SD 132,500 16,300 NA NA NA 129 127 1028 40 408 10 1630 Saugus, MA 3,012 462 4 116 753 5 93 603 2 231 1 462 Schl Dist of Philadelphia 168,181 33,686 NA NA NA 280 121 601 20 1685 20 1685 Scottsdale 26,544 2,891 NA NA NA 31 93 856 13.8 210 3.8 761 Shelby County (Memphis) 114760 14556 66 221 1739 79 184 1453 29.22 498 12.84 1134 St. Paul Pub Schools 38,086 7,152 92 78 414 33 217 1154 36 199 12 596 Sun Prairie Area S Dist 6,656 697 8 88 832 1 NA NA 5 140 2 349 Tacoma Pub Sch (WA) 32,412 3,894 NA NA NA 1.2 NA NA 19 205 11 354 Tucson Unified SD 56,000 8,092 26 312 2154 53 153 1057 10 810 4 2023 Washoe Cty Sc Dist 63,310 8,551 NA NA NA 35 248 1836 12 713 7 1222 West Aurora SD, IL 31,292 2,824 19 89 670 7 241 1818 11 154 7 241
Williamson Cty Schl 12,725 1688 NA NA NA 37 111 837 22 187 5 819
Worcester 24,825 5,172 NA NA NA NA NA NA 12 431 5 1035
Averages 295 2155 163 1188 353 997

Improving Special Education Services in the Detroit Community School District
Council of the Great City Schools Page 153
Percent Students with IEPs of Total Enrollment & Students with IEPs to Staff Ratio in Ascending Order
Rank % IEPs Special
Educators Paraeducators
Speech/Lang Pathologists
Psychologists Social
Workers Nurses
Occupational Therapists
Physical Therapists
1 8% 7 4.3 26 31 26 58 64 128
2 8% 7 5.26 37 55 40 60 75 172
3 9% 8.6 6.3 44 64 56 62 103 219
4 9% 9 7 44 77.7 61 64 112 241
5 9% 9 7 47 85.5 67 67 140 283
6 9% 9.1 7 50 79 69 68 141 293
7 10% 9.5 7 58 90 73 75 142 349
8 10% 9.8 7 59 94 73 82 147 350
9 10% 9.8 8 59 100 75 83 154 354
10 10% 10 8 60 100 78 85 154 367
11 10.3% 10 8 63 102 82 89 163 384
12 11% 10 8.3 65 104 86 89 171 449
13 11% 10.3 8.5 68 110 88 89 172 462
14 11% 10.9 8.6 71 110 89 93 174 492
15 11% 11 9.7 71 111 95 93 180 498
16 11.2% 11 9.7 73 111 96 94 186 523
17 11.3% 11 10 73 112 105 96 187 526
18 11.4% 11 10 74 113 115 98 18 538
19 12% 11.4 10 74 115 116 98.6 199 556
20 12% 11.7 11 76 117 124 100 205 596
21 12% 12 11 77 121 126 104 210 599
22 12% 12 11.1 78 123 127 110 211 615
23 12% 12 12 79 124 134 111 216 620
24 12% 12 12 80 125 135 113 219 639
25 12% 12 12.6 80 127 140 114 225 659
26 12.3% 12 12.8 80 128 142 115 231 663
27 12.69% 12.5 12.9 81 129 153 119 240 676
28 12.7% 13 13 83 130 158 119 242 680
29 13% 13 13 84 134 160 120 276 703
30 13% 13 13 85 138 165 121 265 724
31 13.1% 13 13 89.1 140 188 124 285 761
32 13.7% 13 13 93 142 197 126 300 762
33 13.9% 13 13 95 144 221 127 309 772
34 14% 13.4 13 95 150 249 127 325 819
35 14% 13.7 13 96 151 284 129 326 823
36 14% 14 13 96.5 154 300 133 332 864
37 14% 14 13.5 98 155 300 142 332 869
38 14% 14 14 100 155 303 144 344 873
39 14% 14 14 103 159 312 148 366 875
40 14% 14 14 104 166 334 153 367 885
41 14% 14 15 105 169 384 155 374 900
42 14% 14 15 105 178 487 162 384 903
43 14% 14.9 15 106 178 495 163 388 953
44 14.1% 15 15 108 179 525 165 408 991
45 14.1% 15 16 111 195 652 175 413 1011
46 14.7% 15 16 111 198 673 178 417 1079
47 15% 15 16 112 199 705 184 424 1035
48 15% 15.2 16.4 112 208 186 431 1100
49 15% 15.7 16.6 112 210 195 450 1100
50 15.3% 16.0 16.6 114 213 217 470 1105
51 15.4% 16.3 17 115 218 230 473 1134
52 16% 16.3 17 116 219 220 474 1222
53 16% 17 17.1 117 223 241 477 1262
54 16% 17 17.6 121 225 245 494 1309
55 16.1% 17 18 127 232 248 498 1326
56 16.2% 17.1 18 128.3 233 266 518 1488
57 17% 18 18.4 130 240 386 525 1532
58 17.4% 19 19 133 243 398 547 1553
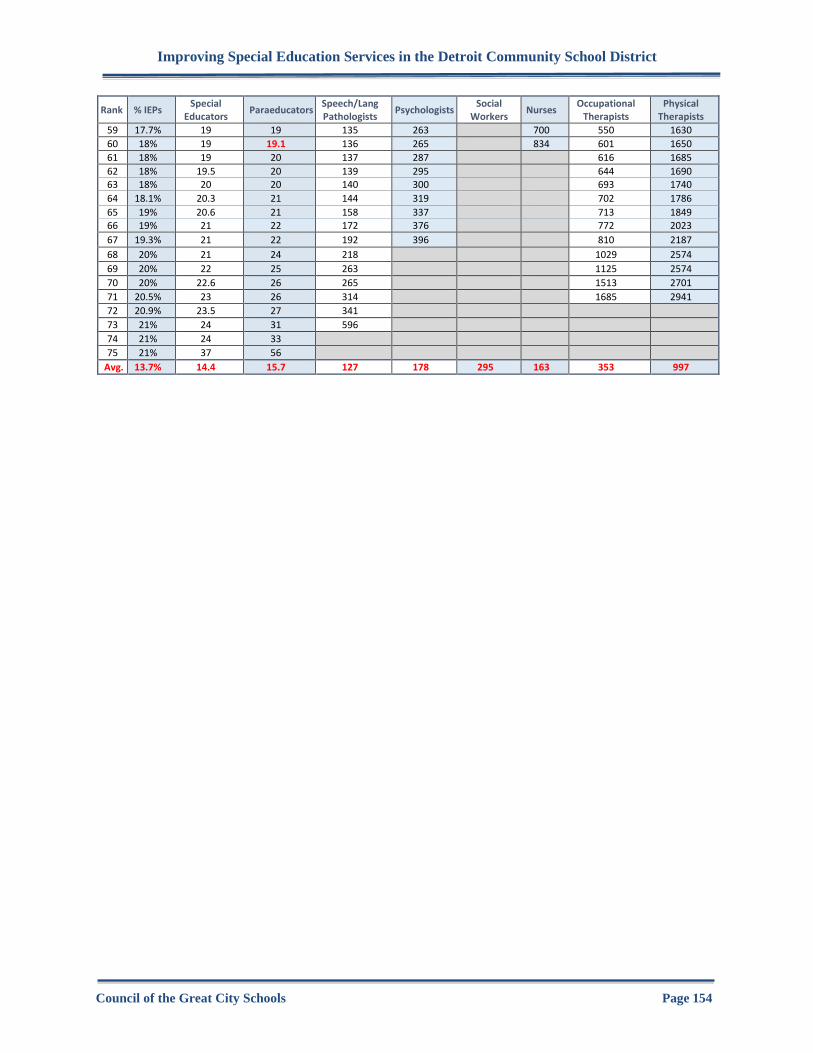
Improving Special Education Services in the Detroit Community School District
Council of the Great City Schools Page 154
Rank % IEPs Special
Educators Paraeducators
Speech/Lang Pathologists
Psychologists Social
Workers Nurses
Occupational Therapists
Physical Therapists
59 17.7% 19 19 135 263 700 550 1630
60 18% 19 19.1 136 265 834 601 1650
61 18% 19 20 137 287 616 1685
62 18% 19.5 20 139 295 644 1690 63 18% 20 20 140 300 693 1740
64 18.1% 20.3 21 144 319 702 1786
65 19% 20.6 21 158 337 713 1849 66 19% 21 22 172 376 772 2023
67 19.3% 21 22 192 396 810 2187
68 20% 21 24 218 1029 2574
69 20% 22 25 263 1125 2574
70 20% 22.6 26 265 1513 2701
71 20.5% 23 26 314 1685 2941
72 20.9% 23.5 27 341
73 21% 24 31 596
74 21% 24 33
75 21% 37 56
Avg. 13.7% 14.4 15.7 127 178 295 163 353 997

Improving Special Education Services in the Detroit Community School District
Council of the Great City Schools Page 155
Appendix B. Data and Documents Reviewed
• CGCS Data Request
• ASD Center Program Procedures
• Catamaran Data Report Due Dates 2017-2018
• Copy of AUDIT Q#13 SE Configuration of Services
• DD Program Procedures June 2014
• Detroit Public Schools Community Schools District (B-Reports 2017)
• DPSCD Complaint Log
• Discussion Document Special Education Detail
• DPSCD - Special Education (FY 2013-2018B1)[3].
• DPSCD Center Students not at DPSCD
• DPSCD Part B 2017 Strand Report
• DPS RTI Toolkit
• DPS Special Education Handbook
• DPSCD Initiatives
• Dropout rates 2016
• DT Program Procedures June 2014
• Early Intervention Center Program Procedures June 2014
• Graduation rates 2016
• Hearing Impairment Program Procedures June 2014
MoCI Program Procedures
• Indicator B-5 Educational Environment State Department of Michigan
• Michigan Department of Education (MDE) Annual Performance Report (2015-16)
• MDE IDEA Determination Letter (May 2017 and May 2018)
• MDE Warning Letter for LRE (May 2017 and May 2018)
• MDE Webpage: MTSS
• Monitoring Activities Report May 2017
• NAEP data (2003-15)
• Organization Chart for District
• Organization Chart for Special Education
• Parent Organizations (List of Parent Organizations and Contacts)
• Parent Training Example (Sample Autism Family Night)
• Part B Determination History Report
• POHI Program Procedures June 2014
• Principal Reports-Support (2017-18 School Organization Structure)
• Program Descriptors - Resource - LD
• RTI Handbook
• SCI Program Procedures June 2014
• Section 504 Handbook
• Special Education Budget Memo
• Special Education Placement Procedures
• State Performance Plan for DPS (2015-16)
• SXI (Severe Multiple Impairment) Center Program Procedures June 2014

Improving Special Education Services in the Detroit Community School District
Council of the Great City Schools Page 156
• Transition Services Supporting Documentation
• VI (Visual Impairment) Center Program Procedures June 2014
• Workskills Center Program Procedures June 2014

Improving Special Education Services in the Detroit Community School District
Council of the Great City Schools Page 157
Appendix C. Draft Working Agenda103
January 7, 2018
Dinner: Council Team and Iranetta Wright, Deputy Superintendent
January 8, 2018
8:00 a.m.-9:00 a.m. Michelle DeJaeger, Senior Executive Director of Office of Specialized
Student Services
9:00 a.m.-10:00 a.m. Superintendent (rescheduled )
10:00 a.m.-10:30 a.m. Senior Administrators
Luis Solano- Chief Operating Officer (HR/Talent)
Alycia Meriweather, Deputy Superintendent External Partnerships,
Enrollment & Innovation
Jeremy Vidito, Chief Financial Officer
Sharlonda Buckman- Senior Executive Director Family & Community Engagement
10:30a.m.-11:15 a.m. Curriculum Executive Directors
April Imperio, Deputy Executive Director, Literacy
Ellen Gilchrist, Deputy Executive Director, Social Studies
Kristie Ford, Deputy Executive Director, Science
Tony Hawk, Deputy Executive Director, Mathematics
11:15a.m.-12:15 p.m. Principal Leaders
Nidia Ashby, Cohort 1
Leenet Campbell-Williams, Cohort 2
Ricky Fountain, Cohort 3
Rebeca Luna, Cohort 4
Brenda Belcher, Career & Technical Centers
12:45 p.m.-1:30 p.m. Special Education Instruction, Compliance, and Behavior
Gina Alexander, Compliance (oversee specialist)
Tammora Green, IEP Specialist
Anne Gendregske, IEP Specialist
Alecia Hill-Williams, IEP Specialist
Tanya McClue-Clark, IEP Specialist
Kristen Howard, Compliance
1:30 p.m.-2:30 p.m. Related Services/Program Managers K-12/Cohort Liaison
Marsha Irvin, Psychological Services
Pamela Joy, Health and Physical Education
Donna Payne, Speech & Language
Gregory Jacoby, Audiologists & 504 Coordinator
Shealah Treece, School Social Workers
Justine Travick, EI Programs
Richard Gregory, Act 18 POHI
Tyra Butler, Supervisor
Ninetta Jordan, Early Intervention
Marlene Hunter-Armstrong- Occupational Therapy & Physical Therapy Supervisor
Sally Denoyer, School Psychologist
103 Draft agenda, participants, and times changed during the review process. This agenda is the working document
that the team used at the beginning of the process, but not all sessions were held at the times scheduled and some
individuals on the agenda were not able to attend.

Improving Special Education Services in the Detroit Community School District
Council of the Great City Schools Page 158
Trina Mason, School Social Worker
Michelle Johnson, Occupational Therapist
Dan’elle Nelson, Speech Therapist/Assistive Technology Training Information
Center (ATTIC)
Chris Skoglund & Derrick Graves, Assistive Technology Training Information
Center (ATTIC)
2:30 p.m.-3:15 p.m. Intervention Specialist, Homeless and Climate and Culture, Title IX
Tonya Nelson, Williams, Behavior Specialist
Dwight Jones, Executive Director, School Climate and Culture
Thomas Mason, Attendance Agent
Faith Groves, Attendance Agent
Stephen, Bland, Attendance Agent
3:30 p.m.-4:30p.m. General Education Teachers
Alycia Jenrette - Breithaupt
Dorian Roberts, Bagley Elem
George Reece - EEVPA
Gregory Edwards, Golightly
Janeen Montgomery, Noble
Lauren Bayles, CMA HS
Lorna Skocelas, Bennett
Mark Ragis, Clippert
Marla Williams, Burns
Penelope Johnson, Hutchinson
Quan Neloms - FDA
Rosheen Travis, Edison Elem
Sandy Carothers, Mackenzie
Simona Pentecost, Greenfield Union
Sylvia Johnson, Bow
Syndeara Jackson, Schulze Elementary
Tammy Porter, Blackwell
Tiffany Anderson, Neinas
4:30 p.m.-5:30p.m. Special Education Teachers
Avvonne Manning, Munger
Caroline Anyanetu, Carstens
Carrie Igwe, Moses Field
Deborah Perry, Cody Inst. Technology
Dee Savage, Henderson
Diamond Johnson, Detroit International Academy
Doreen Odem, Priest
Evelyn Madu, DCP
Felicia Whitted, Diann Banks
Jeanette Pettaway, Cass Tech
Josephine Mejai, Keidan
Julie Julien, Bunche
Karla Jackson, Munger
Melanie Hughes, East English Village
Valerie Sanders, Fisher Lower
5:30 p.m.-6:30p.m. Parents, Advocates and Community Partners
Joann Goree, Wayne County Parent Advisory Committee, RESA
Daryl Williams

Improving Special Education Services in the Detroit Community School District
Council of the Great City Schools Page 159
Tatiana Clayton
Cornella Johnson
Desiree Foster
Latoya Williams
Shantonia Neal
Kristy Murphy
6:30- 8:00 p.m. Meeting and dinner with Superintendent Vitti
January 9, 2018
7:45a.m.-8:30a.m Office of Charter Schools (District approved charters)
Dr. Jendayi Gardner, Senior Deputy Executive Director of Charter Schools
Sean Townsin, Principal, Escuela Avancemos Academy
Lindsie Boykin, Principal, MacDowell Prep Academy
Cha-Ronda Edgerson, Principal, Timbuktu Academy
8:30 a.m.-9:00 a.m. Michigan Department of Education or (RESA)
Patti Silveri, Special Education Administrator
Chris McEvoy, Special Education Administrator
Karen Howey, Executive Director, Special Education & Early Intervention Services
9:00 a.m.-9:45 a.m. Bilingual Education
Juan Patiño, Parent Engagement
Tina Villareal-Hernández, Translation Coordinator
Joseph Schwartz, Data Analyst/WIDA
9:45 a.m.-10:45 a.m. Transportation, Finance, Talent
Aaron Walter, Executive Director
Cassandra Washington, Executive Director, Division of Human Resources
Nicole Erb, Talent Program Supervisor
Brianna Watson, Talent Manager
Jeremy Vidito, Chief Financial Officer
Michael Romanowski, Program Director, SPED Finance
Charles Bruce, Director, Office of Title I & Section 31a
Aaron Walter, Assistant Director (Transportation)
Felicia Venable, Senior Executive Director (Facilities)
10:45 a.m.-11:15 a.m. Enrollment Debbie Louis-Ake, Placement Supervisor
11:15 a.m.-NOON Union
Ivy Bailey, DFT, President
Terrence Martin, DFT, Executive Vice President
Marcus Walton, DFT, Executive Board Member
Debbie Louis-Ake, OSAS, President
12:30 p.m.-1 p.m. Legal
Jenice Mitchell Ford, Lead Counsel
Phyllis Hurks-Hill-Senior Legal Counsel
Marquita Sylvia
Rebecca Shaw Hicks
1:00 p.m.-1:45 p.m. Eleanor Harris, Former SPED Director for Michigan Department of Education
1:45 p.m.-2:15 p.m. Preschool Leaders
Anita Totty, Director of Foundation for Early Learners
Ninetta Jordan, Early Intervention
Paulette White, Preschool, SPED
2:30 p.m.-3:30 p.m.
Center School Principals
Robert Avedisian, Charles R. Drew Transition Center

Improving Special Education Services in the Detroit Community School District
Council of the Great City Schools Page 160
Krista McKinney, Randolph Career Tech Center
Letanya Dandridge, Moses Field
Roslyn Fluker, Diann Banks-Williamson Educational Center
Renee Kraus, Turning point Academy at Fleming
3:45p.m.–4:45p.m. K-8 Principals
Nicholas Brown, Academy of the Americas
Alisanda Woods, Bethune Elementary
Darhonda Evans, Bow
Laura Jawor, Charles Wright Academy of Arts and Science
Wendy Shirley, Chrysler Elementary
Melissa Scott, Coleman A. Young
Kurtis Brown, Dossin Elementary/Middle School
Latoyia Webb-Harris, Durfee Elementary/Middle School
Donnell Burroughs, Munger Elementary/Middle School
Desheil Echols, Pulaski Elementary/Middle School
Maria Hernandez-Martinez, Roberto Clemente
4:45p.m.-5:45p.m. High School Principals
Charles Todd, Benjamin Carson High School/Crockett CTC
Johnathon Matthews, Cody Academy of Public Leadership
Neal Morrison, Davis Aerospace/Golightly CTC
Tanisha Manningham, Denby High School
Pamela Askew, Detroit international Academy for Young Women
Delois Spryszak, Detroit School of Arts
Michael Mokdad, Henry Ford High School
Pashawn Johnson, Osborn High School
Shirley Brown, Pershing High School
Krista McKinney, Randolph Career Tech Center
Anita Williams, Renaissance High School
Latoya Hall-King, Cody DIT
January 10, 2018
12:45p.m.-2:15p.m. Debriefing with Superintendent/Deputy of Schools
January 16, 2017 Paraprofessional teleconference: Drew: LC Bulger; Sandra Lewis;
Deborah Oates; Linzell Rice; Tonya Rice Early Intervention Diagnostic
Center: Yvette Ayer. Chrysler (Elementary): Brittany Wilborn Westside
Academy (High School): Betty Ross

Improving Special Education Services in the Detroit Community School District
Council of the Great City Schools Page 161
Appendix D. Focus Group Participants104
• Iranetta Wright
• Michelle DeJaeger
• Jeremy Vidito
• Alycia Meriweather
• Luis Solano
• Beth Gonzalez
• April Imperio
• Ellen Gilchrist
• Kristie Ford
• Tony Hawk
• Nidia Ashby
• Leenet Campbell-Williams
• Ricky Fountain
• Rebeca Luna
• Brenda Belcher
• Gina Alexander
• Tammora Green
• Anne Gendregske
• Alecia Hill-Willims
• Tanya McClue-Clark
• Kristen Howard
• Marsha Irvin
• Anita Totty
• Ninetta Jordan
• Paulette White
• Pamela Joy
• Donna Payne
• Gregory Jacoby
• Shealah Treece
• Justine Travick
• Richard Gregory
• Tyra Butler
• Marlene Hunter-Armstrong
• Sally Denoyer
• Trina Mason
• Michelle Johnson
• Dan’elle Nelson
• Chris Skoglund
104 This list was developed from sign-in sheets at each interview session. Not all signatures were legible and the
result may be names that are misspelled on this list.

Improving Special Education Services in the Detroit Community School District
Council of the Great City Schools Page 162
• Derrick Graves
• George Eason
• Tonya Nelson
• Thomas Mason
• Faith Groves
• Stephen Bland
• Alycia Jenrette
• Dorian Roberts
• George Reece
• Gregory Edwards
• Janeen Montgomery
• Lauren Bayles
• Lorna Skocelas,
• Mark Ragis
• Marla Williams
• Penelope Johnson
• Rosheena Travis
• Sandy Carothers
• Simona Pentecost,
• Sylvia Johnson
• Syndeara Jackson
• Tammy Porter
• Tiffany Anderson
• Avvonne Manning
• Caroline Anyanetu
• Carrie Igwe
• Deborah Perry
• Dee Savage
• Diamond Johnson
• Doreen Odem
• Evelyn Madu,
• Felicia Whitted
• Jeanette Pettaway
• Josephine Mejai
• Julie Julien
• Karla Jackson
• Melanie Hughes
• Valerie Sanders
• Daryl Williams
• Tatiana Clayton
• Dorothea Nicholson
• Greg Harris
• Latoya Williams
• Shantonia Neal

Improving Special Education Services in the Detroit Community School District
Council of the Great City Schools Page 163
• Kristy Murphy
• Superintendent Nikolai Vitti
• Dr. Jendayi Gardner
• Sean Townsin
• Lindsie Boykin
• Cha-Ronda Edgerson
• Patti Silveri
• Chris McEvoy
• Karen Howey
• Juan Patiño
• Tina Villareal-Hernández
• Joseph Schwartz
• Aaron Walter
• Cassandra Washington
• Nicole Erb
• Brianna Watson
• Jeremy Vidito
• Michael Romanowski
• Charles Bruce
• Aaron Walter
• Felicia Venable
• Debbie Louis-Ake
• Ivy Bailey
• Terrence Martin
• Marcus Walton
• Deborah Louis-Ake
• Jenice Mitchell Ford
• Phyllis Hurks-Hill
• Marquita Sylvia
• Rebecca Shaw Hicks
• Eleanor Harris
• Roquesha O’Neal
• Shroniqus Kemp
• Tia Ervin
• T. Larkins
• Nealmetria Lopez
• Justin Payne
• Charldine Q. Bowens
• Joann Goree
• Aulga Caudle
• D.R.
• Verna Brocks
• Paulette White
• Robert Avedisian

Improving Special Education Services in the Detroit Community School District
Council of the Great City Schools Page 164
• Krista McKinney-King
• Letanya Dandridge
• Roslyn Fluker
• Renee Kraus
• Jerry L. White
• Gary Daylor
• L. Young
• L. Cary
• Darhonda Evans
• Alisanda Woods
• Laura Jawor
• Wendy Shirley
• Melissa Scott
• Kurtis Brown
• Latoyia Webb-Harris
• Donnell Burroughs
• Desheil Echols
• Maria Hernandez-Martinez
• Nicholas Brown
• Neal Morrison
• Charles Todd
• Johnathon Matthews
• Neal Morrison
• Tanisha Manningham
• Pamela Askew
• Delois Spryszak
• Michael Mokdad
• Pashawn Johnson
• Shirley Brown
• Latoya Hall-King
• Krista McKinney
• Anita Williams
• Drew: LC Bulger
• Sandra Lewis
• Deborah Oates
• Linzell Rice
• Tonya Rice
• Yvette Ayer

Improving Special Education Services in the Detroit Community School District
Council of the Great City Schools Page 165
Appendix E. Strategic Support Team
The following were members of the Council’s Strategic Support Team on special
education who conducted this project for the Sacramento Unified School District.
Sue Gamm, Esq.
Sue Gamm, Esq., is a special educator and attorney who has spent more than 40 years
specializing in the study and understanding of evidence-based practices, policies, and procedures
that support a systemic and effective education of students with disabilities and those with
academic and social/emotional challenges. Ms. Gamm has blended her unique legal and special
education programmatic expertise with her experiences as the chief specialized services officer for
the Chicago Public Schools, attorney and division director for the Office for Civil Rights (US
Department of Education) and special educator to become a highly regarded national expert as an
author, consultant, presenter, and evaluator. Since her retirement from the Chicago Public Schools
in 2003, has been engaged in 30 states and the District of Columbia with more than 50 school
districts and five state educational agencies working to improve the instruction and support
provided to students with disabilities. Twenty-one of these reviews were conducted through the
auspices of the Council of the Great City Schools. Ms. Gamm has written standard operating
procedure manuals for special education practices and multi-tiered systems of support (MTSS) for
more than 10 school districts, and has shared her knowledge of the IDEA, Section 504 of the
Rehabilitation Act, the Americans with Disabilities Act and related issues at more than 70 national,
state and local conferences. Ms. Gamm has authored/co-authored numerous periodicals and
publications, including those focused on MTSS, disproportionality for special education,
responding to OCR investigations, and assessment. She also testified before Congressional and
Illinois legislative committees. Ms. Gamm has served as a consulting attorney on several of the
Council’s amicus briefs focusing on special education that were submitted to the U.S. Supreme
Court. Further, she consults with the Public Consulting Group and numerous school districts and
state educational agencies and provides training at national, state, and local conferences on special
education matters, particularly in the area of special education disproportionality. Ms. Gamm has
also been recognized for her legal expertise in the area of special education through her
engagement as an expert witness or consultant involving nine special education federal class action
or systemic cases. She is admitted to practice before the Illinois Bar, the Federal Bar, and the U.S.
Supreme Court Bar.
Julie Wright Halbert, Esq.
Julie Halbert has been legislative counsel for the Council of the Great City Schools for over
22 years. In that capacity, she has served as a national education legal and policy specialist, with
emphasis on special education. She worked extensively on the reauthorizations of the Individuals
with Disabilities Education Act (IDEA) in 1997 and 2004. Ms. Halbert is responsible for drafting
numerous technical provisions to the IDEA and providing technical assistance to Congress and the
U. S. Department of Education. In 1997 and again in 2005, she testified before the U.S. Department
of Education on its proposed regulations on IDEA 2004. Ms. Halbert has directed each of the
Council’s special education strategic review teams, including special education reviews in the
Anchorage, Austin, Boston, Chicago, Charleston, Cincinnati, Des Moines, District of Columbia,
Guilford County (NC), Memphis, New York City, Richmond, Philadelphia, Pittsburgh,
Providence and St. Louis. Working with national experts Sue Gamm and Judy Elliott, she has

Improving Special Education Services in the Detroit Community School District
Council of the Great City Schools Page 166
published a Council national white paper on the implementation and development of MTSS, Multi-
Tiered Systems of Supports for our nation’s urban school districts. Ms. Halbert most recently,
January 2017, took the lead working with our cities in the development of the Council’s amicus
brief to the Supreme Court of the United States in Endrews v. Douglas County School District, on
determining the educational benefit standard due by our districts to students with disabilities when
implementing their IEPS. This case is certain to be one of the most important cases since Rowley
decided over thirty years ago. She was also the counsel of record for the Council of the Great City
Schools’ amicus briefs in the Supreme Court of the United States in (a) Board of Education of the
City School District of the City of New York v. Tom F., On Behalf of Gilbert F., A Minor Child
(2007); (b) Jacob Winkelman, a Minor By and Through His Parents and Legal Guardians, Jeff
and Sander Winkelman, et al., v. Parma City School District (2007); (c) Brian Schaffer v. Jerry
Weast, Superintendent of Montgomery County Public Schools, et al., (2005); (d) Parents Involved
in Community Schools v. Seattle School District, and Meredith v. Jefferson County Board of
Education (2007) and Forest Grove School District v. T.A, (2009). Ms. Halbert graduated with
honors from the University of Maryland and the University of Miami School of Law. She is
admitted to practice in the Federal Bar, the U.S. Supreme Court Bar, and the Florida and
Pennsylvania Bars. Additionally, for the past year, together with Husch Blackwell partner John
Borkowski, Ms. Halbert is assisting to develop and implement national legal webinars for urban
district’s counsel and key staff on emerging legal issues for the Council’s districts. They include,
Civil Rights Priorities at the End of One Administration and Beginning of Another, Hate Speech,
Micro-aggressions and Student First Amendment Rights,
Judy Elliot, Ph.D.
Judy Elliott is formerly the Chief Academic Officer of the Los Angeles Unified School District
where she was responsible for curriculum and instruction Early Childhood through adult,
professional development, innovation, accountability, assessment afterschool programs, state and
federal programs, health and human services, magnet program, language acquisition for both
English and Standard English learners, parent outreach, and intervention programs for all
students. Before that she was the Chief of Teaching and Learning in the Portland Oregon Public
Schools and prior to that an Assistant Superintendent of Long Beach Unified School District in
CA. Judy also was a Senior Researcher at the National Center on Educational Outcomes at the
University of Minnesota. She started her career as a classroom teacher and then school
psychologist. Judy continues to assist districts, national organizations, state and federal
departments of education in their efforts to update and realign curriculum frameworks,
instruction, and assessment, and accountability that include all students. Most recently she was
appointed by the Education Commissioner of New York State to be the Distinguished Educator
for the Buffalo City School District. Her research interests focus on systems change and reform,
effective instruction for all students, and data-based decision making for accountability and
accelerated student achievement. She has trained thousands of staff, teachers, and administrators
in the U.S. and abroad in areas of integrated service delivery systems, leadership, effective use of
data, inclusive schooling that include linking assessment to classroom intervention, strategies
and tactics for effective instruction, curriculum adaptation, collaborative teaching and behavior
management. She has published over 51 articles, book chapters, technical/research reports and
books. She sits on editorial boards for professional journals and is active in many professional
organizations. She is nationally known for her work in Response to Instruction and Intervention
and has led many successful initiatives and projects around that effort.

Improving Special Education Services in the Detroit Community School District
Council of the Great City Schools Page 167
Gregory Roberson, Ed.D
Upon graduation from high school, Dr. Gregory Roberson enlisted in the United States Air
Force where he served for 22 years before retiring in 2003 as a Senior Master Sergeant. He spent
11 years overseas while serving his country, and his last deployment was in September 2001 after
the attacks of 9/11 as a member of Central Air Forces Combat Operations team for Operation
Enduring Freedom. In preparation for retirement and transition into the civilian world, he utilized
the troops to teachers program to earn his special education teaching credentials at Xavier
University in Cincinnati, Ohio. Dr. Roberson was an intervention specialist before leaving the
classroom at his superintendent’s request to become an administrator. He rose through the ranks
from special education coordinator, director, and then a student services executive director. Dr.
Roberson has experience in all areas of special education, gifted, ELL, and related services. His
work in reducing expulsion rates while serving as the district’s expulsion officer is especially
noteworthy. Dr. Roberson is currently the exceptional children chief officer Dayton Public Schools
where he oversees one of the largest departments in the district and a $40 million budget. His
research interests are in the areas of co-teaching, creating inclusive schools, and social emotional
supports for students with severe behavioral disorders.

Improving Special Education Services in the Detroit Community School District
Council of the Great City Schools Page 168
Appendix F. About the Council and History of Strategic Support Teams
The Council of the Great City Schools is a coalition of 70 of the nation’s largest urban
public-school systems. 105 The organization’s Board of Directors is composed of the
superintendent, CEO, or chancellor of schools and one school board member from each member
city. An executive committee of 24 individuals, equally divided in number between
superintendents and school board members, provides regular oversight of the 501(c)(3)
organization. The composition of the organization makes it the only independent national group
representing the governing and administrative leadership of urban education and the only
association whose sole purpose revolves around urban schooling.
The mission of the Council is to advocate for urban public education and to assist its
members in to improve and reform. The Council provides services to its members in the areas of
legislation, research, communications, curriculum and instruction, and management. The group
also convenes two major conferences each year; conducts studies of urban school conditions and
trends; and operates ongoing networks of senior school district managers with responsibilities for
areas such as federal programs, operations, finance, personnel, communications, instruction,
research, and technology. Finally, the organization informs the nation’s policymakers, the media,
and the public of the successes and challenges of schools in the nation’s Great Cities. Urban school
leaders from across the country use the organization as a source of information and an umbrella
for their joint activities and concerns.
The Council was founded in 1956 and incorporated in 1961 and has its headquarters in
Washington, DC. Since the organization’s founding, geographic, ethnic, language, and cultural
diversity has typified the Council’s membership and staff.
105 Albuquerque, Anchorage, Atlanta, Austin, Baltimore, Birmingham, Boston, Broward County (Ft. Lauderdale),
Buffalo, Caddo Parish (Shreveport), Charleston County, Charlotte-Mecklenburg, Chicago, Buffalo, Clark County
(Las Vegas), Cleveland, Columbus, Dallas, Dayton, Denver, Des Moines, Detroit, Duval County (Jacksonville),
East Baton Rouge, Fort Worth, Fresno, Guilford County (Greensboro, N.C.), Hillsborough County (Tampa),
Houston, Indianapolis, Jackson, Jefferson County (Louisville), Kansas City, Little Rock School District, Long
Beach, Los Angeles, Memphis, Miami-Dade County, Milwaukee, Minneapolis, Nashville, Newark, New Orleans,
New York City, Norfolk, Sacramento, Oklahoma City, Omaha, Orange County (Orlando), Palm Beach County,
Philadelphia, Pittsburgh, Portland, Providence, Richmond, Rochester, Sacramento, Salt Lake City, San Diego, San
Francisco, Seattle, St. Louis, St. Paul, Toledo, Washington, D.C., and Wichita
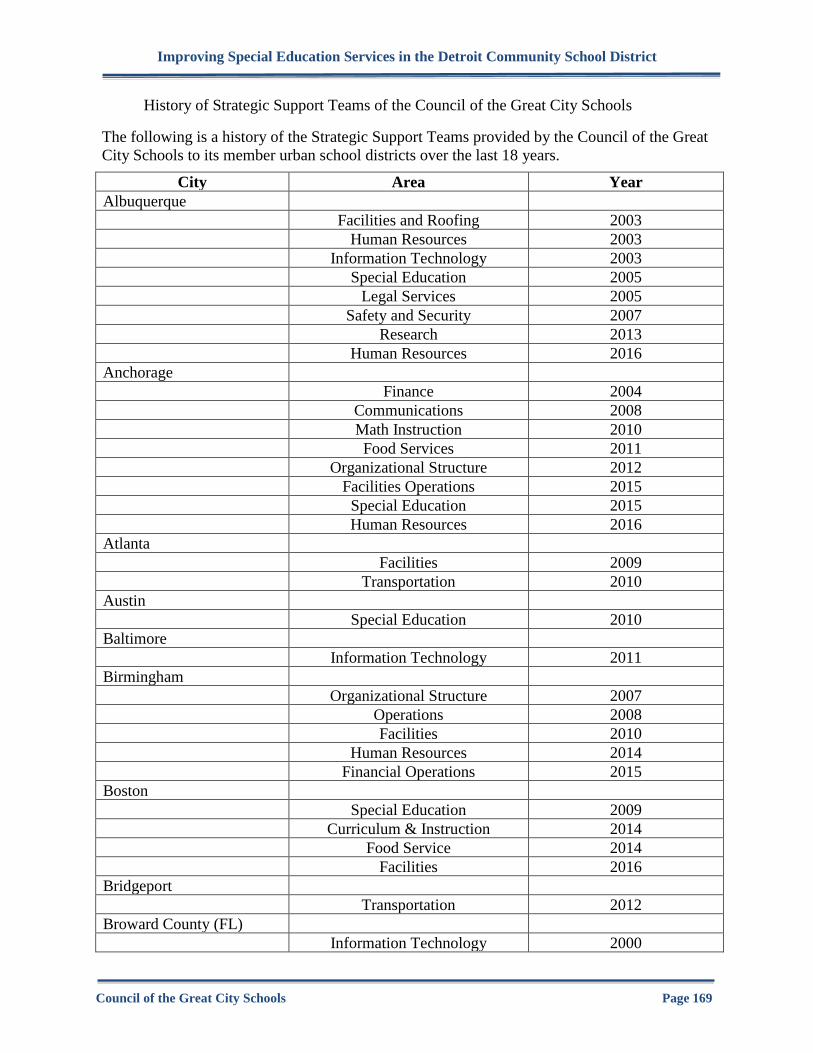
Improving Special Education Services in the Detroit Community School District
Council of the Great City Schools Page 169
History of Strategic Support Teams of the Council of the Great City Schools
The following is a history of the Strategic Support Teams provided by the Council of the Great
City Schools to its member urban school districts over the last 18 years.
City Area Year
Albuquerque
Facilities and Roofing 2003
Human Resources 2003
Information Technology 2003
Special Education 2005
Legal Services 2005
Safety and Security 2007
Research 2013
Human Resources 2016
Anchorage
Finance 2004
Communications 2008
Math Instruction 2010
Food Services 2011
Organizational Structure 2012
Facilities Operations 2015
Special Education 2015
Human Resources 2016
Atlanta
Facilities 2009
Transportation 2010
Austin
Special Education 2010
Baltimore
Information Technology 2011
Birmingham
Organizational Structure 2007
Operations 2008
Facilities 2010
Human Resources 2014
Financial Operations 2015
Boston
Special Education 2009
Curriculum & Instruction 2014
Food Service 2014
Facilities 2016
Bridgeport
Transportation 2012
Broward County (FL)
Information Technology 2000
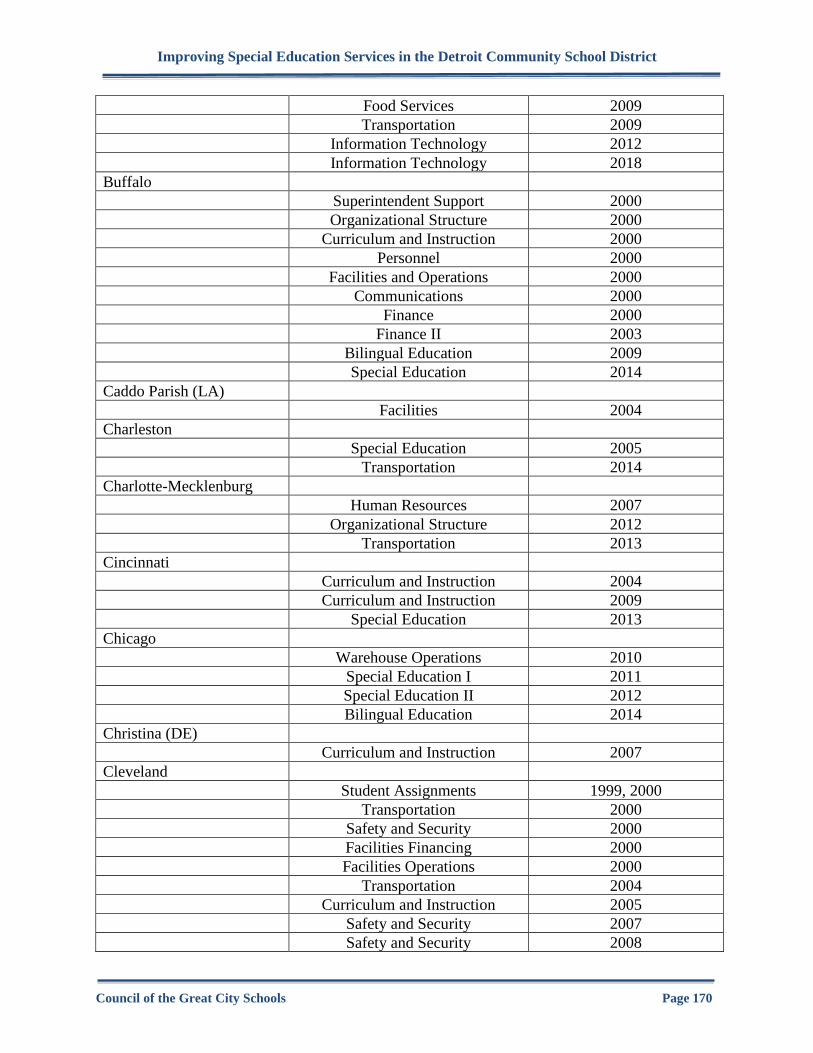
Improving Special Education Services in the Detroit Community School District
Council of the Great City Schools Page 170
Food Services 2009
Transportation 2009
Information Technology 2012
Information Technology 2018
Buffalo
Superintendent Support 2000
Organizational Structure 2000
Curriculum and Instruction 2000
Personnel 2000
Facilities and Operations 2000
Communications 2000
Finance 2000
Finance II 2003
Bilingual Education 2009
Special Education 2014
Caddo Parish (LA)
Facilities 2004
Charleston
Special Education 2005
Transportation 2014
Charlotte-Mecklenburg
Human Resources 2007
Organizational Structure 2012
Transportation 2013
Cincinnati
Curriculum and Instruction 2004
Curriculum and Instruction 2009
Special Education 2013
Chicago
Warehouse Operations 2010
Special Education I 2011
Special Education II 2012
Bilingual Education 2014
Christina (DE)
Curriculum and Instruction 2007
Cleveland
Student Assignments 1999, 2000
Transportation 2000
Safety and Security 2000
Facilities Financing 2000
Facilities Operations 2000
Transportation 2004
Curriculum and Instruction 2005
Safety and Security 2007
Safety and Security 2008

Improving Special Education Services in the Detroit Community School District
Council of the Great City Schools Page 171
Theme Schools 2009
Special Education 2017
Columbus
Superintendent Support 2001
Human Resources 2001
Facilities Financing 2002
Finance and Treasury 2003
Budget 2003
Curriculum and Instruction 2005
Information Technology 2007
Food Services 2007
Transportation 2009
Dallas
Procurement 2007
Staffing Levels 2009
Staffing Levels 2016
Dayton
Superintendent Support 2001
Curriculum and Instruction 2001
Finance 2001
Communications 2002
Curriculum and Instruction 2005
Budget 2005
Curriculum and Instruction 2008
Organizational Structure 2017
Denver
Superintendent Support 2001
Personnel 2001
Curriculum and Instruction 2005
Bilingual Education 2006
Curriculum and Instruction 2008
Common Core Implementation 2014
Des Moines
Budget and Finance 2003
Staffing Levels 2012
Human Resources 2012
Special Education 2015
Bilingual Education 2015
Detroit
Curriculum and Instruction 2002
Assessment 2002
Communications 2002
Curriculum and Assessment 2003
Communications 2003
Textbook Procurement 2004

Improving Special Education Services in the Detroit Community School District
Council of the Great City Schools Page 172
Food Services 2007
Curriculum and Instruction 2008
Facilities 2008
Finance and Budget 2008
Information Technology 2008
Stimulus planning 2009
Human Resources 2009
Special Education 2018
Fresno
Curriculum and Instruction 2012
Special Education 2018
Guilford County
Bilingual Education 2002
Information Technology 2003
Special Education 2003
Facilities 2004
Human Resources 2007
Transportation 2017
Hillsborough County
Transportation 2005
Procurement 2005
Special Education 2012
Transportation 2015
Houston
Facilities Operations 2010
Capitol Program 2010
Information Technology 2011
Procurement 2011
Indianapolis
Transportation 2007
Information Technology 2010
Finance and Budget 2013
Jackson (MS)
Bond Referendum 2006
Communications 2009
Curriculum and Instruction 2017
Jacksonville
Organization and Management 2002
Operations 2002
Human Resources 2002
Finance 2002
Information Technology 2002
Finance 2006
Facilities operations 2015
Budget and finance 2015

Improving Special Education Services in the Detroit Community School District
Council of the Great City Schools Page 173
Kansas City
Human Resources 2005
Information Technology 2005
Finance 2005
Operations 2005
Purchasing 2006
Curriculum and Instruction 2006
Program Implementation 2007
Stimulus Planning 2009
Human Resources 2016
Transportation 2016
Finance 2016
Facilities 2016
Curriculum and Instruction 2016
Little Rock
Curriculum and Instruction 2010
Los Angeles
Budget and Finance 2002
Organizational Structure 2005
Finance 2005
Information Technology 2005
Human Resources 2005
Business Services 2005
Louisville
Management Information 2005
Staffing Levels 2009
Organizational Structure 2018
Memphis
Information Technology 2007
Special Education 2015
Food Services 2016
Procurement 2016
Miami-Dade County
Construction Management 2003
Food Services 2009
Transportation 2009
Maintenance & Operations 2009
Capital Projects 2009
Information Technology 2013
Milwaukee
Research and Testing 1999
Safety and Security 2000
School Board Support 1999
Curriculum and Instruction 2006
Alternative Education 2007

Improving Special Education Services in the Detroit Community School District
Council of the Great City Schools Page 174
Human Resources 2009
Human Resources 2013
Information Technology 2013
Minneapolis
Curriculum and Instruction 2004
Finance 2004
Federal Programs 2004
Transportation 2016
Organizational Structure 2016
Nashville
Food Service 2010
Bilingual Education 2014
Curriculum and Instruction 2016
Newark
Curriculum and Instruction 2007
Food Service 2008
New Orleans
Personnel 2001
Transportation 2002
Information Technology 2003
Hurricane Damage Assessment 2005
Curriculum and Instruction 2006
New York City
Special Education 2008
Norfolk
Testing and Assessment 2003
Curriculum and Instruction 2012
Transportation 2018
Finance 2018
Facilities Operations 2018
Omaha
Buildings and Grounds Operations 2015
Transportation 2016
Orange County
Information Technology 2010
Palm Beach County
Transportation 2015
Safety & Security 2018
Philadelphia
Curriculum and Instruction 2003
Federal Programs 2003
Food Service 2003
Facilities 2003
Transportation 2003
Human Resources 2004

Improving Special Education Services in the Detroit Community School District
Council of the Great City Schools Page 175
Budget 2008
Human Resource 2009
Special Education 2009
Transportation 2014
Pittsburgh
Curriculum and Instruction 2005
Technology 2006
Finance 2006
Special Education 2009
Organizational Structure 2016
Business Services and Finance 2016
Curriculum and Instruction 2016
Research 2016
Human Resources 2018
Information Technology 2018
Facilities Operations 2018
Portland
Finance and Budget 2010
Procurement 2010
Operations 2010
Prince George’s County
Transportation 2012
Providence
Business Operations 2001
MIS and Technology 2001
Personnel 2001
Human Resources 2007
Special Education 2011
Bilingual Education 2011
Puerto Rico
Hurricane Damage Assessment 2017
Reno
Facilities Management 2013
Food Services 2013
Purchasing 2013
School Police 2013
Transportation 2013
Information Technology 2013
Richmond
Transportation 2003
Curriculum and Instruction 2003
Federal Programs 2003
Special Education 2003
Human Resources 2014
Financial Operations 2018

Improving Special Education Services in the Detroit Community School District
Council of the Great City Schools Page 176
Rochester
Finance and Technology 2003
Transportation 2004
Food Services 2004
Special Education 2008
Sacramento
Special Education 2016
San Antonio
Facilities Operations 2017
IT Operations 2017
Transportation 2017
Food Services 2017
Human Resource 2018
San Diego
Finance 2006
Food Service 2006
Transportation 2007
Procurement 2007
San Francisco
Technology 2001
St. Louis
Special Education 2003
Curriculum and Instruction 2004
Federal Programs 2004
Textbook Procurement 2004
Human Resources 2005
St. Paul
Special Education 2011
Transportation 2011
Organizational Structure 2017
Seattle
Human Resources 2008
Budget and Finance 2008
Information Technology 2008
Bilingual Education 2008
Transportation 2008
Capital Projects 2008
Maintenance and Operations 2008
Procurement 2008
Food Services 2008
Capital Projects 2013
Toledo
Curriculum and Instruction 2005
Washington, D.C.
Finance and Procurement 1998

Improving Special Education Services in the Detroit Community School District
Council of the Great City Schools Page 177
Personnel 1998
Communications 1998
Transportation 1998
Facilities Management 1998
Special Education 1998
Legal and General Counsel 1998
MIS and Technology 1998
Curriculum and Instruction 2003
Budget and Finance 2005
Transportation 2005
Curriculum and Instruction 2007
Common Core Implementation 2011
Wichita
Transportation 2009
Information Technology 2017