Embed Size (px)
Citation preview

Improving Societal Outcomesin the Organ Donation Value Chain
Priyank Arora Ravi SubramanianScheller College of Business, Georgia Institute of Technology, Atlanta, GA 30308,
[email protected], [email protected]
In the context of the mismatch between demand and supply of organs, a statistic worth noting is that across
the donor service areas in the US, the average (median) percentage of eligible potential donors from whom
no organs are recovered is 26.6% (28%). The significant socioeconomic costs arising from the suboptimal
quantity and/or quality of recovered organs form the context of our study, which takes the perspective of the
social planner that has an overall quality-adjusted-life-year (QALY) improvement objective. We model the
operational decisions of the two key supply-side entities in a cadaver ODVC, namely, the organ procurement
organization (OPO) and hospital (trauma center). Specifically, we consider the OPO’s effort level in seeking
authorization for organ donation, the hospital’s effort level in identifying and referring potential donors,
and the hospital’s priority scheme for scheduling organ recovery and other surgeries in its operating room
(OR). The main contributions of our work are two-fold: First, we develop an analytical model to study
the effects of contextual parameters and decisions of the OPO and the hospital on their respective payoffs
and on societal outcomes. This model interrelates key components, including donor heterogeneity, organ
recovery reimbursement rates for the hospital, cost to the hospital from the wait times experienced by its
other patients, shared OR capacity between organ recovery and other procedures, and QALY increments
for organ recipients and the hospital’s other patients. Our analysis identifies current misalignments in the
objectives of the OPO, the hospital, and the social planner, that lead to socially suboptimal fractions of
organs recovered from different types of potential donors. Second, we recommend an administratively feasible
and Pareto-improving contract that the social planner can use to help the ODVC achieve socially-optimal
performance.
Key words : healthcare operations; organ donation; organ recovery; contracts
History : This version: June 2017
1. Introduction
The mismatch between demand and supply of organs for transplantation is significant: as of
December 2016, approximately 120,000 individuals in the US were registered on the waitlist to
receive an organ. This number is substantially large compared to supply-side figures: in the year
1

Arora and Subramanian: Improving Societal Outcomes in the ODVC2 Georgia Tech Scheller College of Business Working Paper
2016, there were 15,948 donors who accounted for 33,611 transplants (HRSA 2016). Despite the
creation of donor registries, the use of organs from expanded-criteria donors, and improvements
in surgical techniques, organ preservation, and immunosuppressant drugs, there is still a sig-
nificant gap between demand and supply of organs, which results in significant socioeconomic
costs. For instance, according to the US Renal Data System’s report (USRDS 2013), the cost
to an end-stage renal disease patient for dialysis is $89,000/year as compared to approximately
$32,000 for renal transplant surgery and $25,000/year for post-surgery care. The US Medicare’s
budget absorbs about 80% of dialysis costs and about 53% of renal transplantation surgery and
post-surgery care costs.
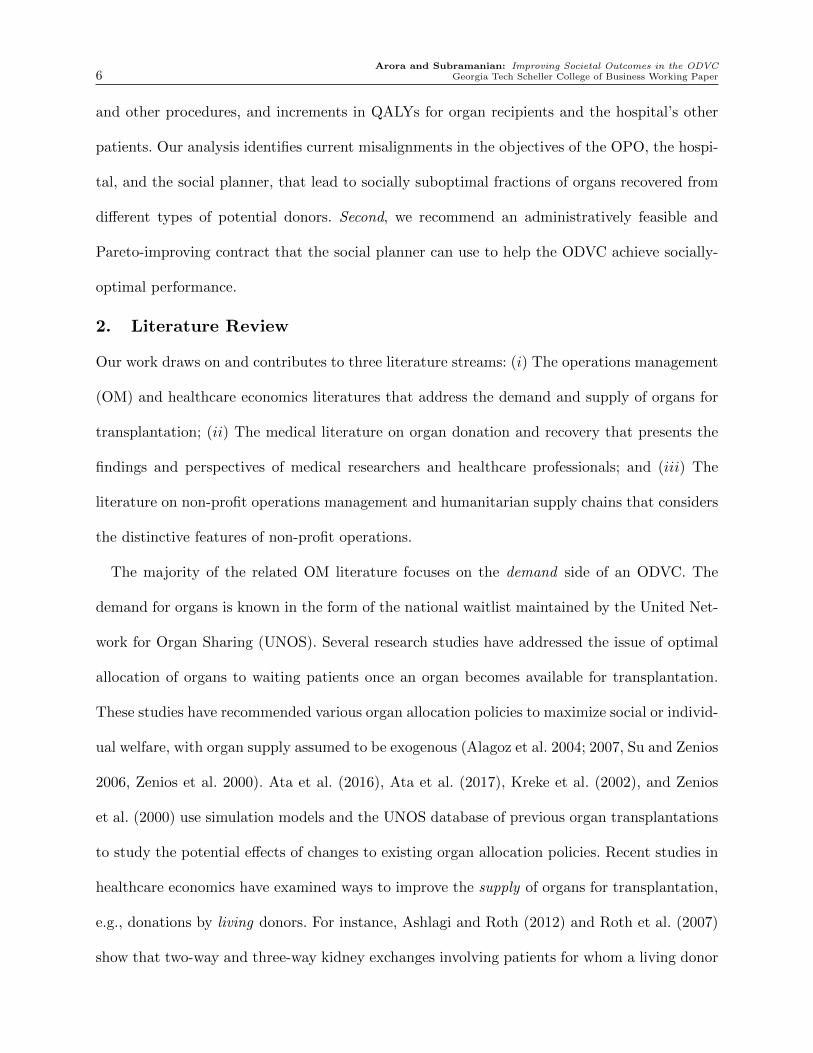
In the context of the mismatch between demand and supply of organs, a statistic worth noting
is that across the donor service areas1 (DSAs) in the US, the average (median) percentage of
eligible2 potential donors from whom no organs are recovered is 26.6% (28%). Figure 1 highlights
the significant gaps in the numbers of donors from whom at least one organ is recovered and the
numbers of eligible deaths (i.e., deceased individuals who meet the criteria for organ donation),
across the 58 DSAs in the US.
While the healthcare operations management literature has largely addressed the issue of
optimal allocation of organs to waiting patients once an organ becomes available for transplan-
tation (Alagoz et al. 2004; 2007, Ata et al. 2016, Kreke et al. 2002, Su and Zenios 2006, Zenios
et al. 2000, Zenios 2002), our work addresses the significant supply-side gap between the num-
bers of eligible potential donors and eventual donors. We model the operational decisions of the
1 The Centers for Medicare and Medicaid Services has divided the US into 11 regions, which are further divided into
58 donor service areas for planning and managing organ recovery and allocation efforts.
2 According to Federal regulations, an eligible potential donor is an individual 75 years or younger whose death meets
American Academy of Neurology Practice’s (AANP’s) neurological criteria for determining brain death, and who
does not exhibit one or more active infections that are contraindications for organ donation such as tuberculosis,
rabies, meningitis, malaria, etc. (OPTN 2017; p. 4–5).

Arora and Subramanian: Improving Societal Outcomes in the ODVCGeorgia Tech Scheller College of Business Working Paper 3
Note: This figure shows, for each of the 58 DSAs in the US, the number of eligible potential donors from whom noorgan is recovered as a percentage of the number of eligible deaths at hospitals in the DSA. The plots are based ondata for the year 2016 published by the US Scientific Registry of Transplant Recipients (SRTR 2016). The first twoletters in the horizontal axis marker indicate the State to which the DSA belongs.
Figure 1 Eligible potential donors from whom no organ is recovered as a percentage of the number of eligible
deaths at hospitals, by donor service area
two key supply-side entities in a cadaver organ donation value chain (ODVC) within a DSA –
namely, the organ procurement organization (OPO) and hospital (typically the main trauma
center within the DSA) – that determine organ recovery outcomes. The OPO is a non-profit
entity designated by the Centers for Medicare and Medicaid Services (CMS) to carry out the
following main tasks in an ODVC: collaborate with hospitals in its DSA, educate hospital staff
on standard procedures for organ donation, review medical records of identified potential organ
donors, request family authorization for organ donation, and coordinate recovery, matching,
and transportation of recovered organs. From the standpoint of the hospital, one of the key
provisions of the revised Medicare conditions for organ donation (Federal Ruling 42 CFR 482
on June 22, 1998), also termed as the “donation rule,” is that the hospital is required to contact
its affiliated OPO in a timely manner about individuals whose death is imminent or who have

Arora and Subramanian: Improving Societal Outcomes in the ODVC4 Georgia Tech Scheller College of Business Working Paper
died while in the hospital’s care. Traino et al. (2012) underscore the importance of coordinat-
ing the operational actions of these two supply-side entities. Their study emphasizes the need
for strong OPO–hospital relationships in the form of effective channels of communication and
frequent contact in order to ensure timely identification and referral of potential donors by
hospitals to OPOs.
However, several studies lament the lack of coordination between hospitals and OPOs as
one of the main reasons for suboptimal levels of organ recovery from eligible deceased donors
(Brown 2000, Graham et al. 2009). Shafer et al. (2003; 2004) point out that OPOs are resource-
constrained organizations with limited budgets and have to be selective in the number and
type of staff on their payroll, which has implications for organ recovery outcomes. For example,
Shafer et al. (2004) show that although it requires a considerable investment of OPO resources,
having a full-time OPO staff member present at the donor hospital can significantly improve
organ recovery outcomes.
Further, studies also show that suboptimal organ recovery outcomes result from hospitals’
priority to providing care to living patients as compared to deceased donors, health care pro-
fessionals’ (HCPs’) lack of knowledge regarding the concept of brain death (BD), and delays
by hospital staff in referring potential donors to the OPO (Opdam and Silvester 2004, Sheehy
et al. 2003, Walters 2009). Doyle et al. (2014) and Walker (1998) highlight that deceased donors
often receive lower priority for care than other patients in the hospital, resulting in delays in
access to the operating room (OR) for surgical recovery of organs. Jendrisak et al. (2002, p.
1), Jensen (2011, p. 165–166), Moazami et al. (2007), and Zaroff et al. (2002) point out that,
of the logistical issues involved in the organ recovery process, timely access to the hospital’s
OR for surgical recovery of organs can be one of the most problematic. From a socioeconomic
standpoint, delays in the organ recovery process negatively influence the quality of the recov-
ered organ and, hence, graft survival and quality of life of the recipient post-transplantation
(Cantin et al. 2003, Schnitzler et al. 2003).

Arora and Subramanian: Improving Societal Outcomes in the ODVCGeorgia Tech Scheller College of Business Working Paper 5
The significant socioeconomic costs arising from the suboptimal quantity and/or quality of
recovered organs form the context of our study, which focuses on the following operational
actions for organ recovery by the OPO and the hospital: the OPO’s effort level in seeking
authorization for organ donation, the hospital’s effort level in identifying and referring potential
donors, and the hospital’s priority scheme for scheduling organ recovery and other surgeries in
its OR. In our analysis, we take the perspective of the social planner (Department of Health
and Human Services,3 DHHS), that uses quality-adjusted life years (QALYs) as a measure of
health outcomes. Introduced by Klarman and Rosenthal (1968), QALY was developed as a way
to combine length and quality of life into a single measure. The US Panel on Cost-Effectiveness
in Health and Medicine recommends that QALY be used as the principal measure of health
outcomes (Siegel et al. 1996). This measure has also been used in the operations management
literature that focuses on the demand side of the ODVC to examine trade-offs involved in organ
allocation policies (e.g., Ahn and Hornberger 1996, Bertsimas et al. 2013, Dai et al. 2017, Zenios
et al. 2000, Zenios 2002).
We aim to answer the following research questions: (i) How do the operational actions of the
supply-side ODVC players impact their individual payoffs and societal outcomes? (ii) What
mechanisms can be implemented by the social planner to improve societal outcomes in the
ODVC as well as ensure that no player is worse-off? The main contributions of our work are
two-fold. First, we develop a model that enables us to study the effects of the operational
decisions of the supply-side players (OPO and hospital) in an ODVC, on their respective pay-
offs and on societal outcomes. The model reflects key contextual components, including donor
heterogeneity, organ recovery reimbursement rates for the hospital, cost to the hospital from
the wait times experienced by its other patients, shared OR capacity between organ recovery
3 The Department of Health and Human Services is a federal agency tasked with protecting the health of all US
nationals and providing essential human services.
Arora and Subramanian: Improving Societal Outcomes in the ODVC6 Georgia Tech Scheller College of Business Working Paper
and other procedures, and increments in QALYs for organ recipients and the hospital’s other
patients. Our analysis identifies current misalignments in the objectives of the OPO, the hospi-
tal, and the social planner, that lead to socially suboptimal fractions of organs recovered from
different types of potential donors. Second, we recommend an administratively feasible and
Pareto-improving contract that the social planner can use to help the ODVC achieve socially-
optimal performance.
2. Literature Review
Our work draws on and contributes to three literature streams: (i) The operations management
(OM) and healthcare economics literatures that address the demand and supply of organs for
transplantation; (ii) The medical literature on organ donation and recovery that presents the
findings and perspectives of medical researchers and healthcare professionals; and (iii) The
literature on non-profit operations management and humanitarian supply chains that considers
the distinctive features of non-profit operations.
The majority of the related OM literature focuses on the demand side of an ODVC. The
demand for organs is known in the form of the national waitlist maintained by the United Net-
work for Organ Sharing (UNOS). Several research studies have addressed the issue of optimal
allocation of organs to waiting patients once an organ becomes available for transplantation.
These studies have recommended various organ allocation policies to maximize social or individ-
ual welfare, with organ supply assumed to be exogenous (Alagoz et al. 2004; 2007, Su and Zenios
2006, Zenios et al. 2000). Ata et al. (2016), Ata et al. (2017), Kreke et al. (2002), and Zenios
et al. (2000) use simulation models and the UNOS database of previous organ transplantations
to study the potential effects of changes to existing organ allocation policies. Recent studies in
healthcare economics have examined ways to improve the supply of organs for transplantation,
e.g., donations by living donors. For instance, Ashlagi and Roth (2012) and Roth et al. (2007)
show that two-way and three-way kidney exchanges involving patients for whom a living donor

Arora and Subramanian: Improving Societal Outcomes in the ODVCGeorgia Tech Scheller College of Business Working Paper 7
is willing to donate an organ but is incompatible (e.g., blood- or tissue-type incompatibility
between the patient and the living donor) could lead to a substantial increase in the number of
transplants.
To our knowledge, the paper by Arikan et al. (2017) is the only other paper in the OM
literature that discusses the supply side of organ transplantation from cadaveric donors. They
perform an empirical study to understand drivers of geographical differences in organ procure-
ment rates and propose that low-quality organs should immediately be made available more
widely rather than sticking to geographical constraints that currently apply to all organ quality
types. Our work complements this paper by studying the operational actions of the supply-side
players (OPO and hospital) in a cadaver ODVC.
We also draw on the medical literature to consider the findings and views of the medical
community on ways to alleviate the wide gap between the demand and supply of organs for
transplantation. Traino et al. (2012) implemented a national test of the Rapid Assessment of
hospital Procurement barriers in Donation (a tool for identifying barriers to donor identification,
donor referral, and requesting families for authorization) and found that the hospital–OPO
relationship has inherent tensions. This is because the HCPs caring for potential donors and
trying to keep them alive are the same professionals on whom the system relies for referrals.
Our work builds on their major recommendation – as also reiterated by other researchers (see
Goodman et al. 2003) – that special efforts, such as interventions to improve donor identification
and periodic meetings among ODVC members, are needed to ensure that OPOs and hospitals
coordinate their efforts to ensure the successful conduct of organ recovery activities.
Ranjan et al. (2006) conducted a retrospective financial analysis of the management of poten-
tial donors showed that organ recovery for Medicare-approved transplant hospitals can in fact
be financially attractive for those hospitals. OPOs typically reimburse hospitals in a timely
manner and at Medicare-prevailing rates, which are typically higher than third-party insurance

Arora and Subramanian: Improving Societal Outcomes in the ODVC8 Georgia Tech Scheller College of Business Working Paper
rates. Thus, the financially attractive and timely reimbursements are at odds with the obser-
vation of low or insufficient priority for organ recovery by hospitals (Jensen 2011; p. 165–166).
However, in their analysis, Ranjan et al. (2006) only include the direct costs of maintaining
a potential donor and do not take into account indirect costs (e.g., disutility associated with
dealing with the subject of organ donation or the effect of organ recovery activities on delays
experienced by the hospital’s other patients). Domingos et al. (2012) emphasize that organ
recovery outcomes must be considered as a component in the measure of the quality of care
provided by hospitals in order to drive improvements in organ recovery outcomes. They pro-
pose that not only OPOs but also intensive care units at hospitals should be evaluated on the
conversion rate of potential to actual donors (i.e., donors from whom organs are eventually
recovered). Through our analytical model, we attempt to explore the possibility of introducing
contractual levers in order to better align the objectives of the OPO and the hospital with the
societal objective of the social planner.
There is an emerging stream of literature in OM that recognizes the unique challenges asso-
ciated with non-profit operations within supply chains because of the distinct sets of objectives
targeted by the for-profit versus the non-profit organizations (Feng and Shanthikumar 2016,
Tomasini and Van Wassenhove 2009). Bhattacharya et al. (2014) and Holguin-Veras et al.
(2012) discuss the differences between humanitarian supply chains and traditional supply chains,
including supply chain design requirements and coordination mechanisms. Berenguer et al.
(2014) highlight the lack of inter-organization collaboration as a recurring challenge in non-
profit operations, which is true of our context as well; the divergence between individual and
societal objectives in an ODVC leads to unique interrelationships and coordination challenges.
Ergun et al. (2014) utilize a cooperative game theoretic model to explore improvements in
humanitarian operations through collaboration among the different parties involved, including
governmental, private, and non-governmental organizations. Similar to their work, we utilize a

Arora and Subramanian: Improving Societal Outcomes in the ODVCGeorgia Tech Scheller College of Business Working Paper 9
game theoretic model to analyze the interrelationships between the operational decisions and
the payoffs of the supply-side players in an ODVC.
The preceding review of the related literature underscores the importance of coordinating
the operational actions of the supply-side ODVC players in the form of relevant efforts, timely
referrals, and timely organ recovery; yet interactions among contextual parameters and the
decisions of these players have not been well-studied. We address this important literature gap
with our analysis that takes the perspective of the social planner and considers the privately-
and socially-optimal operational actions of the OPO and the hospital operating within an
ODVC.
3. Model (Current Scenario)
The study by Sheehy et al. (2003) shows that larger hospitals (which are typically trauma
centers as well) have significantly greater numbers of potential and actual donors – specifically,
19% of hospitals account for 80% of the donations. We therefore focus our analysis on a large
hospital in the OPO’s DSA. Based on the organ recovery process and the sequence of multiple
interactions between the OPO and the hospital, we develop an analytical model to represent
the current scenario for a focal organ and then, through our analysis, propose a contractual
mechanism to improve the societal outcome of the ODVC. Table 1 lists the abbreviations that
we use and Table 2 summarizes our notation.
Several research studies (e.g., Schold et al. 2005, Swanson et al. 2002) highlight that a com-
bination of factors, such as age and medical history of the potential donor, leads to variation
in the quality of organs that can be recovered from potential donors. Ojo (2005) reports that
graft survival for “expanded-criteria” or marginal-quality cadaveric donor kidneys is 8% lower
at 1-year, and 15-20% lower at 3-5 years post-transplantation compared to non-marginal kid-
neys (an expanded-criteria-donor for kidneys is any donor above the age of 60 years, or a donor
above the age of 50 years with two of the following: history of high blood pressure, creatinine

Arora and Subramanian: Improving Societal Outcomes in the ODVC10 Georgia Tech Scheller College of Business Working Paper
level greater than or equal to 1.5 milligrams per deciliter, or death resulting from a stroke).
Therefore, since organ quality determines graft survival as well as the quality of life of the
recipient post-transplantation (Cantin et al. 2003, Schnitzler et al. 2003), the quality of the
recovered organ is an important consideration for the social planner (DHHS).
To allow for this heterogeneity, we consider the arrival of two types of medically suitable
potential donors who meet the criteria for imminent BD – type 1, from whom the focal organ
recovered would be of higher quality (known a priori based on health history and tests early
in the process), and type 2, from whom the organ recovered would be of lower quality. We
assume that the arrival rates of potential donors of each type are independent. Let λp1 and λp2
denote the (Poisson) arrival rates of type 1 and type 2 potential donors, respectively, such that
λp1 +λp2 = λp.
However, current federal regulations and donor referral and donor management practices do
not require the hospital or the OPO to differentiate their operational actions based on donor
heterogeneity. For instance, the reporting by the OPO to CMS of numbers of eligible deaths
and eventual donors (the data that is presented in Figure 1), does not reflect the heterogeneity
in the quality of organs that can be recovered from potential donors or in the quality of organs
that are recovered from authorized donors. Further, OPOs provide hospital staff with criteria or
“triggers” pertaining to the health condition of the patient which, when met, indicate that the
patient may be a potential organ donor and that the OPO should be contacted (see Appendix
A for an example of a “trigger card” provided by an OPO to HCPs). Neither the donation
rule (discussed in Section 1) nor do the descriptions of triggers reflect the heterogeneity in the
quality of organs that can be recovered from potential donors. Because OPOs and hospitals
currently make their operational decisions without explicitly taking into account the quality
of organs that can be recovered, for the model that captures the current scenario, incoming
potential donors are regarded as a single pool with overall arrival rate λp.

Arora and Subramanian: Improving Societal Outcomes in the ODVCGeorgia Tech Scheller College of Business Working Paper 11
3.1. OPO and Hospital Actions
We model the interaction between the OPO and the hospital within an ODVC as a Stackelberg
game. The hospital, because of its say in the referral of potential donors to the OPO and in OR
scheduling, is the Stackelberg leader. The hospital makes two operational decisions – the level
of effort to commit to organ recovery activities, and the OR priority assigned to organ recovery
as compared to other procedures. The OPO’s decision is the level of effort to commit towards
interacting with potential donors’ families and seeking authorization for organ donation. We
discuss these decisions further in Sections 3.2, 3.3, and 3.4.
3.2. Hospital’s Effort Level
The hospital decides its level of effort (ξh) to commit to organ recovery activities – specifically,
personnel training, time, and effort involved in identifying and referring potential donors. Based
on an audit of 5,551 deaths in 12 hospitals, Opdam and Silvester (2004) report that hospitals
withdrew medical support for 38% of potential donors who met eligibility criteria for organ
donation. Using data on 3,329 potential heart-beating donors across 284 hospitals, Walters
(2009) reports that 23% of these donors did not have BD tests carried out. Several studies
reveal that HCPs find it difficult to broach and discuss the subject of organ donation with the
families of potential donors (Chernenko et al. 2005, Regehr et al. 2004). In particular, Chernenko
et al. (2005) estimated that 77% of registered nurses and 44% of doctors found it difficult
to communicate and explain the concept of brain death to families. Training-related reasons
for HCPs not referring potential donors include lack of knowledge regarding: the concept of
brain death; the process of referring potential organ donors to the OPO; and the life-changing
outcomes for organ recipients (Molzahn et al. 2003). Also, participating in the process of organ
donation is only one aspect of their complex jobs.
We normalize the hospital’s effort level such that ξh ∈ [0,1] translates into the fraction (fh) of
potential donors who end up as “referred” donors. Missed referral opportunities by the hospital
or referrals made after pronouncement of BD are collectively termed as “missed” referrals
(Federal Ruling 42 CFR 482 on June 22, 1998).
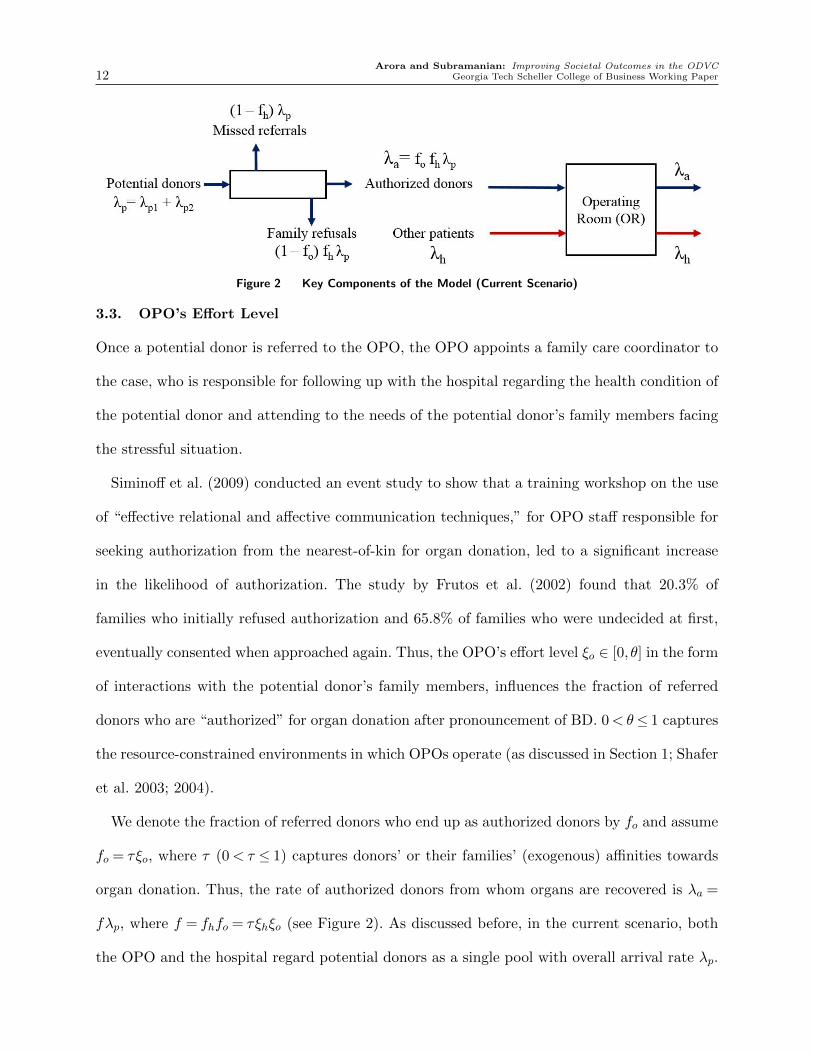
Arora and Subramanian: Improving Societal Outcomes in the ODVC12 Georgia Tech Scheller College of Business Working Paper
Figure 2 Key Components of the Model (Current Scenario)
3.3. OPO’s Effort Level
Once a potential donor is referred to the OPO, the OPO appoints a family care coordinator to
the case, who is responsible for following up with the hospital regarding the health condition of
the potential donor and attending to the needs of the potential donor’s family members facing
the stressful situation.
Siminoff et al. (2009) conducted an event study to show that a training workshop on the use
of “effective relational and affective communication techniques,” for OPO staff responsible for
seeking authorization from the nearest-of-kin for organ donation, led to a significant increase
in the likelihood of authorization. The study by Frutos et al. (2002) found that 20.3% of
families who initially refused authorization and 65.8% of families who were undecided at first,
eventually consented when approached again. Thus, the OPO’s effort level ξo ∈ [0, θ] in the form
of interactions with the potential donor’s family members, influences the fraction of referred
donors who are “authorized” for organ donation after pronouncement of BD. 0<θ≤ 1 captures
the resource-constrained environments in which OPOs operate (as discussed in Section 1; Shafer
et al. 2003; 2004).
We denote the fraction of referred donors who end up as authorized donors by fo and assume
fo = τξo, where τ (0< τ ≤ 1) captures donors’ or their families’ (exogenous) affinities towards
organ donation. Thus, the rate of authorized donors from whom organs are recovered is λa =
fλp, where f = fhfo = τξhξo (see Figure 2). As discussed before, in the current scenario, both
the OPO and the hospital regard potential donors as a single pool with overall arrival rate λp.

Arora and Subramanian: Improving Societal Outcomes in the ODVCGeorgia Tech Scheller College of Business Working Paper 13
Accordingly, in the current scenario, the fractions of referred donors who end up as authorized
donors are the same for both donor types. We assume that the flows in Figure 2 are such that we
can use the Partition Theorem for Poisson Processes (see Cramer and Leadbetter 1967). Also,
for simplicity, we assume that the organ recipient is identified from the waitlist immediately
after the potential donor becomes an authorized donor, or, that authorized donors can proceed
immediately to organ recovery surgery once the hospital’s OR becomes available.
3.4. Hospital’s OR Scheduling Policy
The OR is often a hospital’s most constrained resource because of the expensive medical equip-
ment and specially trained staff that are required (Cardoen et al. 2010, Van Houdenhoven
et al. 2007). Within the context of ODVCs, Walters (2009) states that a hospital’s resource
constraints, including limited OR capacity, may result in suboptimal organ recovery decisions.
Jendrisak et al. (2002), Jensen (2011), Moazami et al. (2007), and Zaroff et al. (2002) point
out that of the logistical issues involved in the organ recovery process, timely access to the
hospital’s OR for surgical recovery of organs can be one of the most problematic. Based on our
conversations with ODVC members and reviews of the medical literature, potential reasons for
organ recovery surgeries not being accorded requisite OR priority are: (i) Hospitals (implicitly
or explicitly) favor living patients over deceased donors in decisions involving allocation or pri-
oritization of use of hospital resources (Doyle et al. 2014, Walker 1998), and (ii) The transplant
team members tasked with organ recovery are typically unknown to the hospital’s OR staff as
those members come from the transplant hospital, rather than the donor hospital (Regehr et al.
2004).
We model the hospital’s OR as an M/G/1/[2] queueing system. The two classes of patients
competing for OR access are: authorized donors (a), and other hospital patients (h) who need
OR care, with respective Poisson arrival rates λa = fλp and λh (see Figure 2). Patients in each
class require a random amount of time in OR care, with mean 1µx
and second moment νx, where

Arora and Subramanian: Improving Societal Outcomes in the ODVC14 Georgia Tech Scheller College of Business Working Paper
x ∈ {a, h}. Denote ρx = λxµx
. Let A be the set of possible OR scheduling policies. For a chosen
policy χ ∈ A , let wa and wh denote the resulting average wait times in queue for the patients of
each class. We assume ρa+ρh< 1, non-preemptive priority (i.e., the patient under consideration
is processed completely before the next patient) and first-come first-serve policy within each of
the two classes of patients. Based on our interviews with ODVC members, including a hospital
trauma care manager, we make the realistic assumption that the mean service time for the
organ recovery surgery in the OR is relatively low compared to the mean interarrival time of
potential donors to the process.
Assumption A1. The mean service time for organ recovery surgery in the OR is low compared
to the mean interarrival time of potential donors, i.e., 1µa� 1
λp.
3.5. OPO and Hospital Objectives
The OPO has to meet the volume-based standard (specifically, conversion rate of potential
donors to actual donors) set by CMS in order to maintain its Medicare certification. Also, a
review of the mission statements of various OPOs, including Carolina Donor Services, Lifelink
of Georgia, Living Legacy Foundation of Maryland, Gift of Life Michigan, and Nevada Donor
Network, among others, indicates that OPOs aim to maximize the volume of authorized donors
in their respective DSAs. Thus, the OPO currently maximizes πopo = λa = fλp, the rate of
authorized donors. We denote the OPO’s effort level that maximizes πopo as ξ∗o .
For its services related to caring for authorized donors, the hospital receives a reimbursement
from the OPO, irrespective of organ recovery surgery outcomes (e.g., if the organ is deemed to be
unviable by the recipient’s transplant surgeon during organ recovery surgery; CMS Ruling CMS-
1543-R, p. 6–8). This reimbursement consists of two components: a fixed reimbursement rate per
authorized donor (Raf ) that includes charges for laboratory tests, medical equipment use, and
anesthesiology consultation, among others, and a variable reimbursement rate per authorized
donor per unit care time (Rav), which depends on the wait time (wa) of the authorized donors

Arora and Subramanian: Improving Societal Outcomes in the ODVCGeorgia Tech Scheller College of Business Working Paper 15
in the intensive care unit before organ recovery surgery in the OR. The emotional stresses
and discomfort for the hospital staff involved in organ recovery efforts (Chernenko et al. 2005,
Regehr et al. 2004) results in a non-linear cost Ce to the hospital; we assume Ce = ce2 ξ
2h.
We denote the average per-patient reimbursement rate associated with the hospital’s other
patients by Rh. Let Ch denote the net cost to the hospital in the form of customer dissatisfaction
and reputation loss arising from the wait times experienced by the hospital’s other patients
(Guinet and Chaabane 2003, Hall 2006). For exposition, we assume that Ch > 0 subsumes
the variable reimbursement rate (per patient per unit time) applicable to the care time of the
hospital’s other patients. As in Green et al. (2006) and Guinet and Chaabane (2003), we assume
Ch to be linear in the wait time wh, i.e., Ch = chwh. Thus, the hospital’s payoff rate is:
πh = fλpRaf + fλpRavwa +λhRh−Ch−Ce. (1)
Friedman and Pauly (1983) find that even not-for-profit hospitals exhibit a profit-maximizing
response to reimbursement terms. Within the context of ODVCs, Rios-Diaz et al. (2017) find
that the hospital’s ownership-type (for-profit versus not-for-profit) is not associated with signif-
icantly different conversion rates of potential donors to actual donors. Furthermore, studies also
find that for-profit and not-for-profit hospitals behave in a similar manner when responding to
policy changes (Deneffe and Masson 2002, Duggan 2000). Therefore, in the ODVC context, the
hospital’s payoff function is likely to be structurally similar if it were not for-profit. However,
in Section 6, we reflect on the implications for our results if the hospital’s objective function
had a volume-of-care component.
3.6. Social Planner’s Objective
We represent the social planner’s objective in terms of the quality-adjusted life years (QALYs)
added to patients post-care. Introduced by Klarman and Rosenthal (1968), QALY was devel-
oped as a way to combine length and quality of life into a single measure. QALY calculations

Arora and Subramanian: Improving Societal Outcomes in the ODVC16 Georgia Tech Scheller College of Business Working Paper
are based on the idea that individuals transition through health states over time and that each
health state has a utility attached to it (in terms of life-years weighted by their qualities). The
utility of a health state is measured on a cardinal scale of 0–1, where 0 indicates death and
1 indicates full health. Standardized survey instruments (such as the EQ-5D survey) are used
to estimate transition probabilities for the population. Responses to the surveys are elicited
either from samples of the general population or from groups of patients. Finally, to obtain
the QALYs added, the discounted utilities of health states over time are summed (for a more
detailed explanation, see Weinstein et al. 2009). The US Panel on Cost-Effectiveness in Health
and Medicine recommends that QALY be used as the principal measure of health outcomes
(Siegel et al. 1996).
From a socioeconomic standpoint, delays in the organ recovery process negatively influence
the quality of the recovered organ and, hence, graft survival and quality of life of the recipient
post-transplantation (Cantin et al. 2003, Schnitzler et al. 2003). Jendrisak et al. (2005) tested
the outcomes of a novel program whereby authorized donors were transported from the donor
hospital to an independent facility housing a dedicated OR for organ recovery surgery. The
results of their study demonstrated the benefits of timely OR access for organ recovery surgery,
including improved viability of recovered organs. Prolonged waiting for the OR after declaration
of BD can lead to an increased likelihood of rejection of the transplanted organ by the recipient’s
body or failure of the organ post-transplantation (Blasco et al. 2007, Kunzendorf et al. 2002,
Van Der Hoeven et al. 2003).
In addition to delays in the organ recovery process, the variation in organ quality stemming
from donor heterogeneity too has a bearing on graft survival as well as quality of life of the
recipient post-transplantation. For instance, Ojo (2005) reports that graft survival for expanded-
criteria or marginal-quality cadaveric donor kidneys is 8% lower at 1-year, and 15-20% lower at
3-5 years post-transplantation compared to non-marginal kidneys (an expanded-criteria-donor

Arora and Subramanian: Improving Societal Outcomes in the ODVCGeorgia Tech Scheller College of Business Working Paper 17
for kidneys is any donor above the age of 60 years, or a donor above the age of 50 years with
two of the following: history of high blood pressure, creatinine level greater than or equal to 1.5
milligrams per deciliter, or death resulting from a stroke). Thus, unlike the current objectives
of the OPO and the hospital, the social planner’s payoff does depend on the respective fractions
of the different types of potential donors who end up as authorized donors. Let fi denote the
fraction of type i ∈ {1,2} potential donors who end up as authorized donors, and wai denote
the average wait time experienced by type i ∈ {1,2} authorized donors while waiting for the
OR to become available.
We assume the QALYs added for a recipient of the focal organ recovered from a type i
potential donor to be of the form Qai(1− qawai), whereby the value is a decreasing function of
the delay (wai) experienced by the donor in the OR queue (i.e., post-BD), with an upper limit
on the delay(
1qa
)beyond which there is no QALY addition (Blasco et al. 2007). The parameter
qa captures the sensitivity of the QALYs added to the delay experienced by the donor while
waiting for the OR to become available.
Further, empirical studies find that delays experienced by the hospital’s other patients while
waiting for the OR to become available, lead to increases in postoperative complications and
mortality rates (Moran et al. 2005, Shiga et al. 2008). Therefore, we similarly assume the QALYs
added for the hospital’s other patients who access the OR to be of the form Qh(1−qhwh), where
wh is the average delay experienced by these patients in the OR queue, and qh is the sensitivity
of QALYs added for the hospital’s other patients to the delay experienced by them. Thus, the
social planner’s payoff rate is:
πS = λhQh(1− qhwh) + f1λp1Qa1(1− qawa1) + f2λp2Qa2(1− qawa2) (2)
Note that Qa1 > Qa2; for example, transplants of expanded-criteria or marginal-quality kidneys
add about 15% fewer QALYs in contrast to non-expanded-criteria kidneys (Ojo 2005).

Arora and Subramanian: Improving Societal Outcomes in the ODVC18 Georgia Tech Scheller College of Business Working Paper
4. Analysis
We first present the equilibrium operational decisions of the OPO and the hospital in the current
scenario and discuss their divergence from socially-optimal decisions. We then supplement the
analytical results with a numerical illustration that is grounded in practice. Thereafter, in
Section 5, we discuss the design of contracts that yield socially-optimal outcomes. We restrict
our analysis to parameter settings where all constraints on the model’s variables and decisions
are met.
4.1. Current (Uncoordinated) Scenario: OPO and Hospital Equilibrium Decisions
OPO: Recall that the OPO is the Stackelberg follower, with the objective of maximizing the
volume of care. It is therefore intuitive that the OPO will exert its highest effort level in order
to maximize the rate of authorized donors. Hence, ξ∗o = θ.
Hospital: As discussed earlier, the hospital’s chosen OR scheduling policy χ ∈ A will impact
its payoff through the resulting average wait times in the OR queue for authorized donors
and the hospital’s other patients. We transform the control problem of the hospital’s choice of
OR scheduling policy into an optimization problem of choosing the vector of resulting average
wait times {wa, wh} in the corresponding achievable region for work-conserving scheduling
policies. In order to obtain wa and wh, we use the results from Gelenbe and Mitrani (1980) that
characterize the average wait times in queue achievable in a multiclass queueing system.
wx ≥λaνa +λhνh
2(1− ρx), x∈ {a,h} (3)
ρawa + ρhwh = (ρa + ρh)λaνa +λhνh
2(1− ρa− ρh)(4)
We denote the work-conserving scheduling policy that gives absolute priority to authorized
donors by I and the policy that gives absolute priority to the hospital’s other patients by II.
The constraint given by (3) is held at equality when x = a for χ = I, and when x = h for χ
= II. Under Assumption A1, for both χ= I and χ= II, wa and wh are linear increasing in

Arora and Subramanian: Improving Societal Outcomes in the ODVCGeorgia Tech Scheller College of Business Working Paper 19
the fraction (f) of potential donors who end up as authorized donors. Because f increases in
ξh and in ξo, a consequence of increased effort by either the hospital or the OPO is greater OR
congestion, leading to longer wait times for both authorized donors as well as the hospital’s
other patients.
In maximizing the hospital’s payoff under the constraints given by (3) and (4), we obtain
that it is optimal for the hospital to always prioritize other patients for service over authorized
donors, i.e., χ∗h = II. This is because a higher priority for authorized donors results in: (i)
Longer wait times for the hospital’s other patients, resulting in a higher net cost to the hospital
Ch, (ii) Shorter wait times for authorized donors, leading to a lower revenue from the variable
component Rav in the hospital’s payoff in (1). In terms of practice, the report by Cantin et al.
(2003) reflects that hospitals typically delay organ recovery surgeries until other procedures
have been completed. Furthermore, our interviews with OPO officials consistently revealed
that organ recovery is currently not accorded sufficient priority by hospitals in OR scheduling.
Proposition 1 characterizes the hospital’s equilibrium effort level ξ∗h in the current scenario (all
proofs are included in Appendix B).
Proposition 1. ∃ ce > 0, ch > 0, and ¯ch(ce) > ch > 0, such that the following four cases
characterize the hospital’s equilibrium effort level ξ∗h:
(i) ce> ce, ch ≥ ch: πh is decreasing in ξh, i.e., ξ∗h = 0;
(ii) ce> ce, ch< ch: πh is concave in ξh and either:
(a) unimodal, or (b) increasing; i.e., 0< ξ∗h ≤ 1;
(iii) ce< ce, ch< ch: πh is increasing in ξh, i.e., ξ∗h = 1;
(iv) ce< ce, ch ≥ ch: πh is convex in ξh, and:
(a) ξ∗h = 1 if ch ≤ ch< ¯ch(ce), or (b) ξ∗h = 0 if ch ≥ ¯ch(ce).
Denote π∗h = πh(ξ∗h,χ
∗h). Recall that ce is the coefficient in the cost to the hospital for its efforts
towards organ recovery activities, and ch is the coefficient in the cost to the hospital from the

Arora and Subramanian: Improving Societal Outcomes in the ODVC20 Georgia Tech Scheller College of Business Working Paper
wait times experienced by the hospital’s other patients. Intuitively, when both ce and ch are
sufficiently low (cases (iii) and (iv)a of Proposition 1), it is optimal for the hospital to exert
its highest effort level (i.e., ξ∗h = 1). On the other hand, when ce and/or ch are sufficiently high
(cases (i) and (iv)b of Proposition 1), it is optimal for the hospital to not exert any effort (i.e.,
ξ∗h = 0). However, when ce is sufficiently high and ch is sufficiently low (case (ii) of Proposition
1), the hospital’s payoff is concave in its effort level and the optimal level of effort for the
hospital could be an interior value (i.e., 0< ξ∗h ≤ 1).
So that the OPO’s objective of volume of care is maximized, it is in the OPO’s private interest
for the hospital to exert the highest effort level. However, Proposition 1 points out several
instances where the private incentives of the OPO and the hospital are misaligned. Restricting
our focus to the nontrivial cases where ξ∗h > 0, let Θ1 denote the set of parameter conditions
such that ξ∗h = 1, and let Θ2 denote the set of parameter conditions such that 0 < ξ∗h < 1.
Also, let f denote the equilibrium overall fraction of potential donors who end up as authorized
donors in the current scenario, i.e. f = τξ∗hξ∗o . Thus, f is either equal to τθ (under Θ1) or
strictly less than τθ (under Θ2). Note that in the current scenario, the equilibrium fractions of
both types of potential donors who end up as authorized donors, are the same; i.e., f1 = f2 =
f (= τξ∗hξ∗o). Next, we characterize our proposed centralized scenario wherein we examine the
social planner’s objective and its implications for socially-optimal actions by the hospital and
the OPO.
4.2. Proposed Centralized Scenario: Socially-Optimal Actions
The operational actions of the OPO and the hospital: their respective effort levels and the OR
scheduling policy chosen by the hospital, affect the delays experienced by authorized donors
and the hospital’s other patients while waiting for the OR to become available and, thus, the
social planner’s payoff πS. Note that, for a given OR scheduling policy χ, the social planner’s
payoff depends only on the effective fraction (fi) of type i ∈ {1,2} potential donors who end up

Arora and Subramanian: Improving Societal Outcomes in the ODVCGeorgia Tech Scheller College of Business Working Paper 21
as authorized donors, and not the individual values of fh and fo (recall that fh is the fraction of
potential donors who end up as referred donors and fo is the fraction of referred donors who end
up as authorized donors). The social planner’s payoff in (2) can be rewritten as: πS(f1, f2,χ) =
λhQh[1− qhwh(f1, f2,χ)] + f1λp1Qa1[1− qawa1(f1, f2,χ)] + f2λp2Qa2[1− qawa2(f1, f2,χ)].
Under the proposed centralized scenario, the hospital will be required to prioritize among
three classes of patients competing for OR access, namely, type 1 authorized donors (a1), type 2
authorized donors (a2), and the hospital’s other patients (h). Let AS denote the set of possible
OR scheduling policies for these three classes of patients. The vector {wa1, wa2, wh} of average
wait times experienced by the three classes of patients are characterized by Equations (5) and
(6) (Gelenbe and Mitrani 1980). We reasonably assume that the mean ( 1µa
), and second moment
(νa) of the service time in the OR is same for both classes (a1 and a2) of authorized donors
(e.g., Brockmann et al. 2006). Denote ρai =fiλpiµa
, where i ∈ {1,2}.
wy ≥f1λp1νa + f2λp2νa +λhνh
2(1− ρy), y ∈ {a1, a2, h} (5)
ρa1wa1 + ρa2wa2 + ρhwh = (ρa1 + ρa2 + ρh)f1λp1νa + f2λp2νa +λhνh
2(1− ρa1− ρa2− ρh)(6)
Under the proposed centralized scenario, χ = I denotes that the hospital gives priority to class
a1 and a2 patients over class h patients. Under Assumption A1, given the hospital’s choice
of OR priority between authorized donors and the hospital’s other patients, it turns out that
the relative priority between the two classes of authorized donors has a negligible impact on
their wait times in the OR queue because wa1(f1, f2,χ) ∼= wa2(f1, f2,χ). Furthermore, since
wai(f1, f2,χ) > wai(f1, f2, I) ∀ χ ∈ AS \{I}, i∈ {1,2}, the social planner’s payoff is higher if the
hospital prioritizes authorized donors over its other patients. In other words, the socially-optimal
OR scheduling policy (denoted by χS) is I, which is at odds with the hospital’s privately-optimal
OR scheduling policy (χ∗h = II; see Section 4.1).
The social planner is faced with a quantity–quality trade-off. A larger fraction of either type
of potential donors converted to authorized donors (i.e., higher quantity) also leads to greater

Arora and Subramanian: Improving Societal Outcomes in the ODVC22 Georgia Tech Scheller College of Business Working Paper
OR congestion, which results in longer wait times in the OR queue for both types of authorized
donors as well as the hospital’s other patients. The longer wait times faced by authorized donors
in the OR queue adversely impact QALY outcomes (i.e., lower quality). Thus, from the social
planner’s perspective, it is valuable to understand how efforts should be allocated between
the two types of potential donors. Proposition 2 characterizes the socially-optimal fractions of
type 1 and type 2 potential donors who should end up as authorized donors, based on the
characteristic qa of the focal organ. Recall that qa is the sensitivity of QALYs added for the
organ recipient, to the delay experienced by the organ donor while waiting in the OR queue.
Proposition 2. With a higher OR priority for authorized donors over the hospital’s other
patients, ∃ qa > 0 and ¯qa > 0, such that the following three cases characterize the socially-
optimal fractions, fS1 and fS2 , respectively, of type 1 and type 2 potential donors who should end
up as authorized donors:
(i) qa < qa: fS1 = τθ, fS2 = τθ;
(ii) qa ≤ qa < ¯qa: fS1 = τθ, fS2 = max{
(1−ρh)[Qa1(2−qaλhνh−qaτθλp1νa)−Qa2qaτθλp1νa]−Qhqhλhνa2Qa1(1−ρh)qaλp2νa
, 0}
;
(iii) qa ≥ ¯qa: fS1 = min{
(1−ρh)Qa1(2−qaλhνh)−Qhqhλhνa2Qa1(1−ρh)qaλp1νa
, τθ}
, fS2 = 0.
Denote πSS = πS(fS1 , fS2 ,χ
S). From Proposition 2, we observe that it is always optimal for the
social planner to first allocate ODVC resources to convert type 1 potential donors to authorized
donors, and then to allocate any remaining resources to convert type 2 potential donors to
authorized donors. This result is intuitive given that the focal organ recovered from a type
1 potential donor adds more QALYs for the organ recipient as compared to the focal organ
recovered from a type 2 potential donor.
Note that the upper limit on the OPO’s effort level, in essence, places an upper limit (= τθλp)
on the overall rate of authorized donors that can be achieved by the ODVC. Proposition 2
points out cases where it is not socially optimal to exhaust the available resources of the supply-
side ODVC players; i.e., under certain conditions, fS1 λp1 + fS2 λp2 is strictly less than τθλp.

Arora and Subramanian: Improving Societal Outcomes in the ODVCGeorgia Tech Scheller College of Business Working Paper 23
For instance, when the QALYs added to the organ recipient is highly sensitive to the delay
experienced by the organ donor in the OR queue (i.e., qa is higher), it is socially optimal for all
type 1 potential donors to end up as authorized donors; however, it is not socially optimal to
exhaust the remaining resources to convert all possible type 2 potential donors to authorized
donors (i.e., cases (ii) and (iii) in Proposition 2). This is because a larger fraction of type 2
authorized donors increases OR congestion and, hence, adversely affects the QALYs added for
the recipients of organs from both types of potential donors – including the recipients of type
1 organs. This observation is pertinent because, despite the scarcity of organs, 10% of livers
and similarly high percentages of other types of organs are turned down by transplant surgeons
during or after organ recovery surgery in the OR because of concerns regarding organ quality
(Colpart et al. 1999). In other words, there exists opportunity for improvement in the allocation
of scarce resources based on potential-donor types.
Proposition 2 points out several instances where fS1 ≶ f1 or fS2 ≶ f2, i.e., that the equilibrium
fractions that result in the current scenario are not socially optimal. Consider the following two
cases: (i) fi > fSi ∀ i ∈ {1,2}. For example, a sufficiently large qa would lead to this relationship.
In this case, it is socially optimal for the hospital or the OPO to exert a lower effort level
than in the current scenario due to the adverse effect on OR congestion and, hence, on QALY
outcomes. However, this would conflict with the OPO’s volume-of-care objective, and, possibly,
the hospital’s objective. (ii) fi < fSi ∀ i ∈ {1,2}. For example, a sufficiently small qa would lead
to this relationship. Since the OPO always exerts its maximum effort level (i.e., ξ∗o = θ), in this
case, it is socially optimal for the hospital to exert greater effort than in the current scenario in
order to increase the rate of authorized donors, although this would not be privately optimal
for the hospital.
The problem at hand can be viewed as a principal-agent problem, wherein a contract needs
to be designed if the social planner (principal) intends for the hospital and the OPO (agents) to

Arora and Subramanian: Improving Societal Outcomes in the ODVC24 Georgia Tech Scheller College of Business Working Paper
make operational decisions that would lead to the socially-optimal fractions of type 1 and type
2 potential donors being converted to authorized donors. Contracts can be designed that either:
(i) directly specify the OPO’s level of effort, and the hospital’s level of effort and OR scheduling
policy, or (ii) alter the objectives of the OPO and the hospital to induce the desired operational
actions and, thus, organ recovery outcomes. We focus on the latter because OPOs operate
under a federal mandate that requires them to collect data on missed referrals by hospitals and
time stamps related to key organ recovery milestones (e.g., administration of various medical
tests and drugs, intra-hospital transfers, etc.). Before discussing the design of socially-optimal
contracts, we present a numerical illustration that is grounded in practice, in order to reinforce
the context of our analysis thus far.
4.3. Numerical Illustration
Using numerical values that are grounded in practice, we illustrate current misalignments in the
objectives of the social planner, the OPO, and the hospital. We use the following representative
values for our model parameters based on the medical literature and interviews with OPO staff:
(i) λh = 400 patients per month (based on the number of OR procedures at a large donor
hospital in the OPO’s DSA; AHD 2016), and ρh = 0.8 (based on estimates reported in the set
of studies reviewed by Cardoen et al. 2010, p. 924).4
(ii) According to the medical literature, kidney transplants add about 4.7 QALYs for recip-
ients, as compared to about 0.8 QALYs added by hip arthroplasty and 0.66 QALYs added
by bypass surgery (CEAR 2017, Held et al. 2016). Accordingly, we use Qa1
Qh= 6. Also, since
transplants of expanded-criteria or marginal-quality kidneys add about 15% fewer QALYs in
contrast to non-expanded-criteria kidneys (Ojo 2005), we use Qa2
Qa1= 0.85.
(iii) Based on data provided by OPO staff for kidneys, λp = 12 per month, Raf = 200,000
USD per donor, and Rav = 2,000 USD per donor per day. Also, we use λp2 = 4 per month (on
4 We present another numerical illustration in Appendix C with a lower ρh, and show that our findings are qualitatively
similar.

Arora and Subramanian: Improving Societal Outcomes in the ODVCGeorgia Tech Scheller College of Business Working Paper 25
(a) Under conditions Θ1 (b) Under conditions Θ2
Note: This figure includes plots of the equilibrium fraction (f1 = f2 = f) of potential donors who currently end upas authorized donors and the socially-optimal fractions (fS
1 and fS2 ) who should end up as authorized donors, with
respect to the sensitivity (qa) of QALYs added for the organ recipient to the delay experienced by the organ donorwhile waiting in the OR queue.
Figure 3 Numerical Illustration
average, marginal donors constitute approximately 30-34% of all kidney donors; Klein et al.
2010), and 1µa
= 4 hours (LifeSource 2016).
We assume that θ = 1 and τ = 0.8, and choose appropriate values for the remaining model
parameters (ch, ce, νa, and νh) in order to examine the conditions discussed in Section 4.1: (a)
Conditions Θ1: A sufficiently low ce and a sufficiently low ch lead to ξ∗h = 1, in which case, f1
= f2 = f = τξ∗hξ∗o = 0.8; and (b) Conditions Θ2: A sufficiently high ce and a sufficiently low
ch lead to 0< ξ∗h< 1. Here, we choose parameter values such that ξ∗h = 0.80, in order to match
the resulting value of fh with the average referral rate reported in Sheehy et al. (2003). Thus,
in this case, f1 = f2 = f = τξ∗hξ∗o = 0.64.
The socially optimal fractions of type 1 and type 2 potential donors who should end up as
authorized donors, or fS1 and fS2 , take values according to Proposition 2 in Section 4.2. Based
on the model parameters outlined above, we obtain 1qa∼= 25.4 hours and 1
¯qa∼= 16.9 hours. These
values are in reasonable agreement with the medical literature that recommends recovery of
kidneys from cadaver donors within about 24 hours of declaration of BD (e.g., Blasco et al.

Arora and Subramanian: Improving Societal Outcomes in the ODVC26 Georgia Tech Scheller College of Business Working Paper
2007). Figure 3 includes plots of the equilibrium fractions (f1 = f2 = f) of potential donors
who currently end up as authorized donors and the socially-optimal fractions (fS1 and fS2 ) who
should end up as authorized donors, with respect to the sensitivity (qa) of QALYs added for
the organ recipient to the delay experienced by the organ donor while waiting in the OR queue.
The plots in Figure 3 show that, under both sets of conditions (Θ1 and Θ2), there exist
regions wherein the equilibrium fractions in the current scenario are not socially optimal. Under
Θ1, fS1 < f1 for qa > ¯qa and fS2 < f2 for qa > qa (see Figure 3(a)); and under Θ2, fS1 > f1 for
qa < ¯qa and fS2 > f2 for qa < qa (see Figure 3(b)). Thus, the numerical illustration highlights
the realistic possibility of the incentive misalignments discussed in Section 4.2.
5. Socially Optimal Contracts
We propose a multiparameter contract to address the misalignments between the social plan-
ner’s objective, and the OPO’s and hospital’s objectives. With regard to the OPO, the social
planner needs to incentivize the OPO to also take into account donor heterogeneity and the
adverse impact of OR congestion on the hospital’s other patients. Accordingly, we recommend
that the social planner revise the OPO’s objective function (πopo) to be based on composite
criteria. Specifically, the OPO’s revised objective function in (7) below comprises: (i) QALY-
weighted volume components corresponding to each type of potential donors, and (ii) a suitably-
weighted (α > 0) volume-based component that addresses the adverse impact on QALYs added
for the hospital’s other patients.
πopo = f1λp1Qa1(1− qawa1) + f2λp2Qa2(1− qawa2)−α (f1λp1 + f2λp2) (7)
With the revised objective function, the OPO would be required to differentiate its operational
actions based on donor heterogeneity; therefore, fi = τξhξoi, where ξoi ∈ [0, θi] and 0< θi ≤ 1;
i ∈ {1,2}. Per CMS Ruling 45 CFR §164.512(h), once a referral call is made to the OPO, the
assigned OPO personnel can access medical records (e.g., health history and test results) of

Arora and Subramanian: Improving Societal Outcomes in the ODVCGeorgia Tech Scheller College of Business Working Paper 27
the potential donor. Based on this information, the OPO can a priori determine the potential
donor’s type. Let ξ∗oi denote the OPO’s effort level for type i potential donors referred by the
hospital, that maximizes πopo.
Next, we suggest that the social planner levy the following two penalties on the hospital: (i)
a penalty (at rate pm) on the hospital for each missed referral, and (ii) a penalty (at rate pd
per unit wait time) on the hospital for the average wait time experienced by type 1 authorized
donors in excess of the average wait time for them under the proposed centralized scenario (see
Section 4.2). With these penalties, the hospital’s revised payoff is:
πh = λaRaf +(f1λp1wa1 +f2λp2wa2)Rav+λhRh−chwh−ce2ξ2h−λp(1−fh)pm−(wa1−wSa1)pd (8)
Where, λa = τξh(ξo1λp1 + ξo2λp2) and wSa1 :=wa1(fS1 , fS2 ,χ
S). We denote the hospital’s optimal
effort level and OR scheduling policy under the contract by ξ∗h and χ∗h, respectively. Denote π∗
h
= πh(ξ∗h, χ∗h).
In practice, hospitals do not bear any financial penalties for adverse ODVC performance out-
comes, except maybe for annotations in accreditation reports prepared by federal agencies such
as the Joint Commission on Accreditation of Healthcare Organizations, for choosing suboptimal
organ recovery effort levels that lead to missed referrals (see the DHHS report by Inspector
General Brown 2000; p. 19–20). This DHHS report recommends that some kind of mechanism
(incentive or disincentive) be implemented based on data that is already being collected, in
order to improve hospitals’ compliance with the donation rule. However, no such mechanism
exists in practice. OPOs already audit patient records of hospitals in their respective DSAs at
regular intervals (monthly or quarterly) to collect data on missed referrals and time stamps
related to key organ recovery milestones, so there would be limited additional administration
costs for implementing these penalties based on missed referrals and wait times experienced by
type 1 authorized donors. There are other examples of penalties that have been introduced to

Arora and Subramanian: Improving Societal Outcomes in the ODVC28 Georgia Tech Scheller College of Business Working Paper
influence the operational actions of hospitals and improve societal outcomes. One example is
the Readmission Penalty that was introduced by CMS in 2012 to curb the loss in quality of
care and substantial costs incurred due to avoidable re-hospitalizations of Medicare beneficia-
ries (Berenson et al. 2012, CMS 2012). A few recent studies have analyzed the effects of this
penalty on hospitals’ operational actions such as readmission-reduction efforts (Andritsos and
Tang 2015, Zhang et al. 2016). Another example is the Hospital-Acquired Condition (HAC)
Reduction Program introduced by CMS in 2014, that penalizes hospitals that perform poorly
on HAC quality measures (CMS 2014).
The set of contractual levers {α, pm, pd} outlined above can help the ODVC attain the socially
optimal payoff πSS (see Section 4.2) and, when appropriately specified, can even ensure that both
the OPO and the hospital are strictly better-off with the implementation of the contract. For
the hospital, strictly better-off implies that its equilibrium payoff under the contract attains a
larger value compared to the current (uncoordinated) scenario. For the OPO, strictly better-off
means that its total equilibrium effort under the contract (= ξ∗o1 + ξ∗o2) is less than 2ξ∗o , where
ξ∗o is the OPO’s equilibrium effort for each type of potential donors under the current scenario
(see Section 4.1). Note that the factor of 2 in the aforementioned comparison arises because,
under the current scenario we have f1 = f2 = τξhξo, and under the contract we have f1 = τξhξo1
and f2 = τξhξo2.
We focus on Pareto-improving contracts for their promise of acceptability. In our context,
Pareto improvement implies that none of the three entities, namely, the OPO, the hospital, or
the social planner is worse-off, and at least one of them is strictly better-off with the implemen-
tation of the contract. The suggested contractual levers in Proposition 3 not only influence the
operational actions of the hospital and the OPO to help the ODVC achieve socially-optimal
performance, but also achieve strict Pareto improvement for the OPO and the hospital.

Arora and Subramanian: Improving Societal Outcomes in the ODVCGeorgia Tech Scheller College of Business Working Paper 29
Proposition 3. ∃ pm > 0 and pd > 0 s.t. ∀ pm > pm, pd > pd, and α = Qhqhλhνa2(1−ρh) , the set of
contractual levers {α, pm, pd} ensures: (i) Social optimality, i.e., πS(α, pm, pd) = πSS and, (ii)
Strict Pareto improvement for the hospital and the OPO, i.e., π∗h > π∗
h and ξ∗o1 + ξ∗o2 < 2ξ∗o .
As stated in Section 4.2 (proposed centralized scenario), the OR scheduling policies that are
respectively optimal for the social planner and the hospital, are divergent (χSS = I and χ∗h = II).
Under the revised objective function for the hospital, choosing pd > pd ensures that the hospital
accords absolute priority to authorized donors over its other patients, i.e., χ∗h = I (see Proof of
Proposition 3). Recall that the OPO is the Stackelberg follower. An appropriately-chosen weight
α in the OPO’s revised objective function ensures that the OPO adjusts its effort levels for
both types of referred donors in response to the hospital’s chosen effort level, thereby balancing
QALY outcomes across organ recipients and the hospital’s other patients. The social planner
can always choose a value of pm such that ξ∗o1 + ξ∗o2 < 2ξ∗o , so that the OPO is strictly better-off
under the contractual mechanism in Proposition 3 as compared to the current scenario.
Setting α and pd as in Proposition 3, effectively fixes the overall fraction (f) of potential
donors who end up as authorized donors because λa = fS1 λp1 + fS2 λp2, which implies that f =
fS1 λp1+fS2 λp2λp1+λp2
. If the penalty for missed referrals (pm) were zero, the hospital’s payoff would be
decreasing in ξh, implying that the equilibrium effort level of the hospital under the contract
would be zero. By levying a penalty (pm > 0) on the hospital for missed referrals, the social
planner induces an interesting dynamic between the OPO and the hospital. In the presence of
a non-zero penalty for missed referrals, it becomes costly for the hospital to not exert effort
towards organ recovery activities. However, because of the presence of the QALY-based compo-
nents in the OPO’s revised objective, the OPO (Stackelberg follower) responds to an increased
effort level by the hospital by substantially reducing its own effort levels for type 1 and/or type
2 potential donors referred by the hospital. The resulting equilibrium decisions of the OPO
and the hospital end up being beneficial for the hospital because of decreased OR congestion

Arora and Subramanian: Improving Societal Outcomes in the ODVC30 Georgia Tech Scheller College of Business Working Paper
and, hence, lower wait times experienced by the hospital’s other patients. The reduced OR con-
gestion also favorably impacts QALY outcomes and helps the ODVC achieve socially-optimal
performance.
6. Conclusion
While the majority of the healthcare operations management literature focuses on the demand
side of the ODVC, we develop an analytical model to study the effects of contextual parameters
and operational actions of the supply-side entities (OPO and hospital) on their respective payoffs
and on societal outcomes. Our analysis of the current (uncoordinated) and proposed centralized
scenarios reveals several key findings. First, we show that higher effort levels towards organ
recovery activities chosen by either the OPO or the hospital have counteracting effects on the
societal outcome (assessed based on quality-adjusted life years, or QALYs). Although higher
effort levels lead to larger fractions of conversions of potential donors to authorized donors,
another resulting effect is greater congestion at the OR. Consequently, authorized donors as
well as the hospital’s other patients experience longer wait times in the OR queue, resulting in
adverse impacts on QALY outcomes.
Second, in contrast to current ODVC policies and practices that do not require the hospital
or the OPO to differentiate their operational actions based on the quality of organs that can
be recovered from potential donors, our analysis shows that the social planner’s objective may
be non-monotonic in the respective fractions of the different types of potential donors who
end up as authorized donors. Using a numerical illustration that is grounded in practice, we
demonstrate the realistic possibility of incentive misalignments between the social planner, and
the OPO and hospital. These misalignments lead to socially suboptimal fractions of organs
recovered from the different types of potential donors.
Third, we recommend a multiparameter contract to address the misalignments between the
social planner’s objective, and the OPO’s and hospital’s objectives. We show that by: (i)

Arora and Subramanian: Improving Societal Outcomes in the ODVCGeorgia Tech Scheller College of Business Working Paper 31
including QALY-based components corresponding to each type of potential donors and an
appropriately-weighted volume-based component in the OPO objective (i.e., revising the OPO’s
objective to reflect composite criteria); and (ii) levying appropriately-chosen penalties on the
hospital for missed referrals and for socially suboptimal delays experienced by authorized donors
while waiting for the OR to become available; the social planner can help the ODVC achieve
not only socially-optimal performance, but also strict Pareto improvement for the OPO and the
hospital. This contractual mechanism is administratively feasible since OPOs already collect
data on missed referrals by hospitals and time stamps related to key organ recovery milestones,
and it also has the promise of acceptability since no player would be worse-off.
Under our recommended contractual mechanism, it may be possible for the resource-
constrained OPO to increase the allocation of its efforts towards accomplishing other important
tasks, such as fundraising, public awareness campaigns, and community engagement. Also, the
OPO may be able to allocate more effort towards assisting hospital staff in lowering their dis-
comfort associated with organ donation activities (e.g., through training programs on cultural
sensitivities towards organ donation, psychological support skills to enhance end-of-life care,
etc.; DOT Grant Program Report 2005). As an example, New England Organ Bank, the OPO
for the six New England states, has instituted educational programs for HCPs on psychological
support skills in discussions surrounding death and dying, that have led to a significant increase
in the number of referrals of potential donors by hospitals in its DSA.
Consistent with studies that consider principal-agent problems in the non-profit and health-
care contexts (e.g., Devalkar et al. 2016, Gupta and Mehrotra 2015), we consider that the social
planner (the principal), strives to optimize the benefit delivered to organ recipients and the
hospital’s other patients. Thus, in our setting, the social planner’s payoff is different from the
sum of the payoffs of the individual players. However, our results remain structurally similar if
we add the hospital’s and OPO’s objectives within the social planner’s payoff. Also, in our work,

Arora and Subramanian: Improving Societal Outcomes in the ODVC32 Georgia Tech Scheller College of Business Working Paper
we consider the hospital to be a profit-maximizing entity. Although empirical studies (Deneffe
and Masson 2002, Duggan 2000) find that not-for-profit hospitals behave in a similar manner
as profit-maximizing entities, including in the context of ODVCs (Rios-Diaz et al. 2017), if the
hospital too had a volume-of-care component in its objective, the incentive misalignments would
be less severe and the interventions from the social planner for both the OPO and the hospital
would be in the form of composite criteria (i.e., QALY-based components added to the existing
objective). Apart from contractual levers, our model points to other potentially viable opera-
tional interventions for improving organ recovery outcomes: expanding OR capacity (increasing
µ), improving the waiting experience in the OR queue (decreasing ch), and emphasizing HCP
training to reduce the discomfort associated with organ recovery activities (decreasing ce).
With regard to limitations of our work and avenues for future research, we note that our
model focuses on one focal organ whereas multiple organs can potentially be recovered from
a cadaveric donor. It will be interesting to study the privately- and socially-optimal levels of
efforts by the OPO and the hospital, as well as the OR priorities accorded by the hospital
in the presence of heterogeneity in organ yields across potential donors or heterogeneity in
the characteristics of organs (e.g., sensitivities of different organs to delays experienced by the
donors). Also, as discussed earlier, the existing OM literature focuses on the demand side of
the ODVC whereas our paper adds to the sparse literature on the supply side. We believe that
there will be value in capturing the interplay between demand- and supply-side actions in order
to further improve societal outcomes. For instance, it will be valuable to study the interplay
between the operational actions in the organ recovery process and the trade-offs involved in the
allocation of organs to patients on the waitlist.
Acknowledgments
The authors gratefully acknowledge Dr. Shri Bharadwaj (Lifelink of Georgia), Dr. Sundaresan Jayaraman
(Georgia Tech) and Dr. Ram Subramanian (Emory University) for their collaboration on a National Institute
of Health (NIH) proposal submitted in 2012 along with the second author. The proposal underscored the
need to design and develop a framework for improving the performance of the ODVC for kidneys.

Arora and Subramanian: Improving Societal Outcomes in the ODVCGeorgia Tech Scheller College of Business Working Paper 33
References
AHD (2016). American hospital directory: Hospital statistics by state, http://www.ahd.com, last accessed
on June 16, 2017.
Ahn, J.-H. and Hornberger, J. C. (1996). Involving patients in the cadaveric kidney transplant allocation
process: A decision-theoretic perspective, Management Science 42(5): 629–641.
Alagoz, O., Maillart, L. M., Schaefer, A. J. and Roberts, M. S. (2004). The optimal timing of living-donor
liver transplantation, Management Science 50(10): 1420–1430.
Alagoz, O., Maillart, L., Schaefer, A. and Roberts, M. (2007). Determining the acceptance of cadaveric livers
using an implicit model of the waiting list, Operations Research 55(1): 24–36.
Andritsos, D. and Tang, C. S. (2015). Incentive programs for reducing readmissions when patient care is
co-produced, HEC Paris Research Paper No. MOSI-2015-1110 .
Arikan, M., Ata, B., Friedewald, J. J. and Parker, R. P. (2017). Enhancing kidney supply through geographic
sharing in the United States, University of Kansas Working Paper .
Ashlagi, I. and Roth, A. E. (2012). New challenges in multihospital kidney exchange, The American Economic
Review 102(3): 354–359.
Ata, B., Skaro, A. and Tayur, S. (2016). Organjet: Overcoming geographical disparities in access to deceased
donor kidneys in the United States, Forthcoming in Management Science .
Ata, B., Yichuan, D. and Zenios, S. (2017). KDPI-dependent ranking policies: Shaping the allocation of
deceased-donor kidneys in the new era, University of Chicago Working Paper .
Berenguer, F. G., Amber, R. and Z.J.M., S. (2014). Challenges and strategies in managing nonprofit opera-
tions: An operations management perspective, Purdue University Working Paper .
Berenson, R. A., Paulus, R. A. and Kalman, N. S. (2012). Medicare’s readmissions-reduction program – a
positive alternative, New England Journal of Medicine 366(15): 1364–1366.
Bertsimas, D., Farias, V. F. and Trichakis, N. (2013). Fairness, efficiency, and flexibility in organ allocation
for kidney transplantation, Operations Research 61(1): 73–87.
Bhattacharya, S., Hasija, S. and Van Wassenhove, L. N. (2014). Designing efficient infrastructural investment
and asset transfer mechanisms in humanitarian supply chains, Production and Operations Management
23(9): 1511–1521.

Arora and Subramanian: Improving Societal Outcomes in the ODVC34 Georgia Tech Scheller College of Business Working Paper
Blasco, V., Leone, M., Bouvenot, J., Geissler, A. and Martin, C. (2007). Impact of intensive care on renal
function before graft harvest: results of a monocentric study, Critical Care 11(5): R103.
Brockmann, J. G., Vaidya, A., Reddy, S. and Friend, P. J. (2006). Retrieval of abdominal organs for
transplantation, British Journal of Surgery 93(2): 133–146.
Brown, J. G. (2000). Medicare conditions of participation for organ donation: An early assessment of the
new donation rule, US Department of Health Human Services .
Cantin, B., W K Kwok, B., Chan, M. C. Y., Valantine, H. A., Oyer, P. E., Robbins, R. C. and Hunt, S. A.
(2003). The impact of brain death on survival after heart transplantation: Time is of the essence,
Transplantation 76(9): 1275–9.
Cardoen, B., Demeulemeester, E. and Belien, J. (2010). Operating room planning and scheduling: A literature
review, European journal of operational research 201(3): 921–932.
CEAR (2017). https://research.tufts-nemc.org/cear4/, last accessed on May 10, 2017.
Chernenko, S., Jensen, L., Newburn-Cook, C. and Bigam, D. (2005). Organ donation and transplantation:
a survey of critical care health professionals in nontransplant hospitals, Progress in Transplantation
15(1): 69–77.
CMS (2012). Readmission penalty program, http://www.cms.gov/medicare/medicare-fee-for-service-
payment/acuteinpatientpps/readmissions-reduction-program.html, last accessed on June 14, 2017.
CMS (2014). Hospital-acquired condition reduction program, http://www.cms.gov/medicare/medicare-fee-
for-service-payment/acuteinpatientpps/hac-reduction-program.html, last accessed on June 14, 2017.
Colpart, J. J., Cohen, S. and Marion, A. (1999). Procurement and allocation of solid organs for transplan-
tation from cadaver donors aged 60 and over organs and tissues, Organs and Tissues 2: 179–182.
Cramer, H. and Leadbetter, M. R. (1967). Stationary and Related Stochastic Processes, John Wiley and
Sons, New York.
Dai, T., Zheng, R. and Sycara, K. (2017). Jumping the line, charitably: Analysis and remedy of donor-priority
rule, Johns Hopkins Carey Business School Working Paper .
Deneffe, D. and Masson, R. T. (2002). What do not-for-profit hospitals maximize?, International Journal of
Industrial Organization 20(4): 461–492.
Devalkar, S. K., Sohoni, M. G. and Sharma, N. (2016). Payment for results: Funding non-profit operations,
Indian School of Business Research Paper Series .

Arora and Subramanian: Improving Societal Outcomes in the ODVCGeorgia Tech Scheller College of Business Working Paper 35
Domingos, M., Gouveia, M., Nolasco, F. and Pereira, J. (2012). Can kidney deceased donation systems
be optimized? a retrospective assessment of a country performance, The European Journal of Public
Health 22(2): 290–294.
DOT Grant Program Report (2005). Report on the Division of Transplantations grant program 1999-2004:
Social and behavioral interventions to increase organ donation, The Institute for Campaign Research
and Evaluation .
Doyle, M., Vachharajani, N., Wellen, J., Lowell, J., Shenoy, S., Ridolfi, G., Jendrisak, M., Coleman, J.,
Maher, M., Brockmeier, D. et al. (2014). A novel organ donor facility: A decade of experience with
liver donors, American Journal of Transplantation 14(3): 615–620.
Duggan, M. (2000). Hospital ownership and public medical spending, The Quarterly Journal of Economics
115(4): 1343–1373.
Ergun, O., Gui, L., Heier Stamm, J. L., Keskinocak, P. and Swann, J. (2014). Improving humanitarian oper-
ations through technology-enabled collaboration, Production and Operations Management 23(6): 1002–
1014.
Feng, Q. and Shanthikumar, J. G. (2016). Not-for-profit operations management, Chapter 29, Routledge
Companion for Production and Operations Management (Edited by Sushil Gupta and Martin Starr) .
Friedman, B. and Pauly, M. V. (1983). A new approach to hospital cost functions and some issues in revenue
regulation, Health care financing review 4(3): 105–114.
Frutos, M. A., Ruiz, P., Requena, M. V. and Daga, D. (2002). Family refusal in organ donation: analysis of
three patterns, Transplantation Proceedings 34(7): 2513–2514.
Gelenbe, E. and Mitrani, I. (1980). Analysis and Synthesis of Computer Systems, Academy Press, London.
Goodman, C., Worrall, C., Chong, U., Kallinis, S. and Rockwood, M. (2003). The organ donation break-
through collaborative: Best practices final report, US Department of Health Human Services .
Graham, J. M., Sabeta, M. E., Cooke, J. T., Berg, E. R. and Osten, W. M. (2009). A system’s approach to
improve organ donation, Progress in Transplantation 19(3): 216–220.
Green, L. V., Savin, S. and Wang, B. (2006). Managing patient service in a diagnostic medical facility,
Operations Research 54(1): 11–25.
Guinet, A. and Chaabane, S. (2003). Operating theatre planning, International Journal of Production
Economics 85(1): 69–81.

Arora and Subramanian: Improving Societal Outcomes in the ODVC36 Georgia Tech Scheller College of Business Working Paper
Gupta, D. and Mehrotra, M. (2015). Bundled payments for healthcare services: Proposer selection and
information sharing, Operations Research 63(4): 772–788.
Hall, R. (2006). Patient Flow: Reducing Delay in Healthcare Delivery: Reducing Delay in Healthcare Delivery,
Vol. 91, Springer.
Held, P., McCormick, F., Ojo, A. and Roberts, J. (2016). A cost-benefit analysis of government compensation
of kidney donors, American Journal of Transplantation 16(3): 877–885.
Holguin-Veras, J., Jaller, M., Wassenhove, L. N. V., Prez, N. and Wachtendorf, T. (2012). On the unique
features of post-disaster humanitarian logistics, Journal of Operations Management 30(78): 494 – 506.
HRSA (2016). http://optn.transplant.hrsa.gov/, last accessed on May 17, 2017.
Jendrisak, M. D., Hruska, K., Wagner, J., Chandler, D. and Kappel, D. (2002). Cadaveric-donor organ
recovery at a hospital-independent facility, Transplantation 74(7): 978–982.
Jendrisak, M. D., Hruska, K., Wagner, J., Chandler, D. and Kappel, D. (2005). Hospital-independent
organ recovery from deceased donors: A two-year experience, American Journal of Transplantation
5(5): 1105–1110.
Jensen, A. (2011). Orchestrating an Exceptional Death: Donor Family Experiences and Organ Donation in
Denmark, PhD thesis. No. 69.
Klarman, H. E. and Rosenthal, G. D. (1968). Cost effectiveness analysis applied to the treatment of chronic
renal disease, Medical care 6(1): 48–54.
Klein, A. S., Messersmith, E. E., Ratner, L. E., Kochik, R., Baliga, P. K. and Ojo, A. O. (2010).
Organ donation and utilization in the United States, 1999–2008, American Journal of Transplantation
10(4p2): 973–986.
Kreke, J., Schaefer, A. J., Angus, D. C., Bryce, C. L. and Roberts, M. S. (2002). Methods for special appli-
cations: incorporating biology into discrete event simulation models of organ allocation, Proceedings of
the 34th conference on Winter simulation WSC ’02: 532–536.
Kunzendorf, U., Hohenstein, B., Oberbarnscheid, M., Mller, E., Renders, L., Schott, G. E. and Offermann,
G. (2002). Duration of donor brain death and its influence on kidney graft function, American Journal
of Transplantation 2(3): 292–294.
LifeSource (2016). Organ recovery process, http://www.life-source.org/partners/hospital-
professionals/donation-resource-center/operating-room-resources, last accessed on April 16, 2016.

Arora and Subramanian: Improving Societal Outcomes in the ODVCGeorgia Tech Scheller College of Business Working Paper 37
Moazami, N., Javadi, O. H., Kappel, D. F., Wagner, J. and Jendrisak, M. D. (2007). The feasibility of organ
procurement at a hospital-independent facility: a working model of efficiency, The Journal of Thoracic
and Cardiovascular Surgery 133(5): 1389–1390.
Molzahn, A. E., Starzomski, R. and McCormick, J. (2003). The supply of organs for transplantation: Issues
and challenges, Nephrology Nursing Journal 30(1): 17.
Moran, C. G., Wenn, R. T., Sikand, M. and Taylor, A. M. (2005). Early mortality after hip fracture: is delay
before surgery important?, The Journal of Bone and Joint Surgery 87(3): 483–489.
Ojo, A. O. (2005). Expanded criteria donors: process and outcomes, Seminars in Dialysis, Vol. 18, Wiley
Online Library, pp. 463–468.
Opdam, H. and Silvester, W. (2004). Identifying the potential organ donor: an audit of hospital deaths,
Intensive Care Medicine 30(7): 1390–1397.
OPTN (2017). http://optn.transplant.hrsa.gov/media/1200/optn_policies.pdf, last accessed on
June 13, 2017.
Ranjan, D., Schmonsky, K., Johnston, T., Jeon, H., Bouneva, I. and Erway, E. (2006). Financial analy-
sis of potential donor management at a medicare-approved transplant hospital, American Journal of
Transplantation 6(1): 199–204.
Regehr, C., Kjerulf, M., Popova, S. R. and Baker, A. J. (2004). Trauma and tribulation: the experiences and
attitudes of operating room nurses working with organ donors, Journal of Clinical Nursing 13(4): 430–
437.
Rios-Diaz, A. J., Olufajo, O. A., Stinebring, J., Endicott, S., McKown, B. T., Metcalfe, D., Zogg, C. K.
and Salim, A. (2017). Hospital characteristics associated with increased conversion rates among organ
donors in new england, Forthcoming in The American Journal of Surgery .
Roth, A. E., Snmez, T. and nver, M. U. (2007). Efficient kidney exchange: Coincidence of wants in markets
with compatibility-based preferences, The American Economic Review 97(3): 828–851.
Schnitzler, M. A., Whiting, J. F., Brennan, D. C., Lin, G., Chapman, W., Lowell, J., Boxerman, S., Hardinger,
K. L. and Kalo, Z. (2003). The expanded criterial donor dilemma in cadaveric renal transplantation,
Transplantation 75(12): 1940–1945.
Schold, J. D., Kaplan, B., Baliga, R. S. and Meier-Kriesche, H.-U. (2005). The broad spectrum of quality in
deceased donor kidneys, American Journal of Transplantation 5(4): 757–765.

Arora and Subramanian: Improving Societal Outcomes in the ODVC38 Georgia Tech Scheller College of Business Working Paper
Shafer, T. J., Davis, K. D., Holtzman, S. M., Van Buren, C. T., Crafts, N. J. and Durand, R. (2003).
Location of in-house organ procurement organization staff in level I trauma centers increases conversion
of potential donors to actual donors, Transplantation 75(8): 1330–1335.
Shafer, T. J., Ehrle, R. N., Davis, K. D., Durand, R. E., Holtzman, S. M., Van Buren, C. T., Crafts, N. J. and
Decker, P. J. (2004). Increasing organ recovery from level i trauma centers: the in-house coordinator
intervention, Progress in Transplantation 14(3): 250–263.
Sheehy, E., Conrad, S. L., Brigham, L. E., Luskin, R., Weber, P., Eakin, M., Schkade, L. and Hunsicker, L.
(2003). Estimating the number of potential organ donors in the united states, New England Journal
of Medicine 349(7): 667–674.
Shiga, T., Wajima, Z. and Ohe, Y. (2008). Is operative delay associated with increased mortality of hip frac-
ture patients? systematic review, meta-analysis, and meta-regression, Canadian Journal of Anesthesia
55(3): 146.
Siegel, J. E., Weinstein, M. C., Russell, L. B. and Gold, M. R. (1996). Recommendations for reporting
cost-effectiveness analyses, Journal of the American Medical Association 276(16): 1339–1341.
Siminoff, L., Marshall, H., Dumenci, L., Bowen, G., Swaminathan, A. and Gordon, N. (2009). Communicating
effectively about donation: an educational intervention to increase consent to donation, Progress in
Transplantation 19(1): 35–43.
SRTR (2016). http://www.srtr.org/reports-tools/opo-specific-reports/, last accessed on June 16,
2017.
Su, X. and Zenios, S. A. (2006). Recipient choice can address the efficiency-equity trade-off in kidney
transplantation: A mechanism design model, Management Science 52(11): 1647–1660.
Swanson, S. J., Hypolite, I. O., Agodoa, L. Y., Batty Jr, D. S., Hshieh, P. B., Cruess, D., Kirk, A. D., Peters,
T. G. and Abbott, K. C. (2002). Effect of donor factors on early graft survival in adult cadaveric renal
transplantation, American Journal of Transplantation 2(1): 68–75.
Tomasini, R. M. and Van Wassenhove, L. N. (2009). From preparedness to partnerships: case study research
on humanitarian logistics, International Transactions in Operational Research 16(5): 549–559.
Traino, H. M., Alolod, G. P., Shafer, T. and Siminoff, L. A. (2012). Interim results of a national test
of the rapid assessment of hospital procurement barriers in donation (RAPiD), American Journal of
Transplantation 12(11): 3094–3103.

Arora and Subramanian: Improving Societal Outcomes in the ODVCGeorgia Tech Scheller College of Business Working Paper 39
USRDS (2013). US Renal Data System, USRDS 2013 annual data report: Atlas of chronic kidney disease
and end-stage renal disease in the United States, National Institutes of Health, National Institute of
Diabetes and Digestive and Kidney Diseases, Bethesda, MD, 2013 .
Van Der Hoeven, J. A. B., Molema, G., Ter Horst, G. J., Freund, R. L., Wiersema, J., Van Schilfgaarde,
R., Leuvenink, H. G. D. and Ploeg, R. J. (2003). Relationship between duration of brain death and
hemodynamic (in)stability on progressive dysfunction and increased immunologic activation of donor
kidneys, Kidney International 64(5): 1874–1882.
Van Houdenhoven, M., Hans, E. W., Klein, J., Wullink, G. and Kazemier, G. (2007). A norm utilisation
for scarce hospital resources: evidence from operating rooms in a Dutch university hospital, Journal of
Medical Systems 31(4): 231–236.
Walker, S. G. V. D. (1998). Standardizing donation education for nursing students: one organ procurement
organization’s approach, Journal of Transplant Coordination 8(2): 93–96.
Walters, T. (2009). Are front line health professionals responsible for the organ crisis, Journal of the Intensive
Care Society (JICS) 10(3): 201–206.
Weinstein, M. C., Torrance, G. and McGuire, A. (2009). Qalys: the basics, Value in health 12(s1): S5–S9.
Zaroff, J. G., Rosengard, B. R., Armstrong, W. F., Babcock, W. D., DAlessandro, A., Dec, G. W., Edwards,
N. M., Higgins, R. S., Jeevanandum, V., Kauffman, M., Kirklin, J. K., Large, S. R., Marelli, D.,
Peterson, T. S., Ring, W. S., Robbins, R. C., Russell, S. D., Taylor, D. O., Van Bakel, A., Wallwork,
J. and Young, J. B. (2002). Consensus conference report: Maximizing use of organs recovered from the
cadaver donor: Cardiac recommendations: Crystal City, VA, Circulation 106(7): 836–841.
Zenios, S. (2002). Optimal control of paired-kidney exchange program, Management Science 48(3): 328–342.
Zenios, S. A., Chertow, G. M. and Wein, L. M. (2000). Dynamic allocation of kidneys to candidates on the
transplant waiting list, Operations Research 48(4): 549–569.
Zhang, D. J., Gurvich, I., Van Mieghem, J. A., Park, E., Young, R. S. and Williams, M. V. (2016). Hos-
pital readmissions reduction program: An economic and operational analysis, Management Science
62(11): 3351–3371.

Arora and Subramanian: Improving Societal Outcomes in the ODVC40 Georgia Tech Scheller College of Business Working Paper
Appendix A: Example of a Trigger Card issued by an OPO
Appendix B: Proofs
Let wχx denote the average wait time in OR queue for each patient class, where: x∈ {a,h} and
priority χ ∈ A in the current scenario; x ∈ {a1, a2, h} and priority χ ∈ AS in the proposed
centralized scenario.
PROOF OF PROPOSITION 1. From the discussion following (3) and (4), we have:
wIa = (λaνa+λhνh)2(1−ρa) , wIh = (λaνa+λhνh)
2(1−ρa)(1−ρa−ρh) , wIIa = (λaνa+λhνh)2(1−ρh)(1−ρa−ρh) , and wIIh = (λaνa+λhνh)
2(1−ρh) . Under
Assumption A1, wχh∼= (λaνa+λhνh)
2(1−ρh) ∀ χ ∈ A . Substituting this expression in (3) and (4), we
obtain the following relationship: wa(f,χ= I) < wa(f, χ) < wa(f,χ= II) ∀ χ ∈ A \ {I, II}.
Since πh is increasing in wa, we obtain χ∗h = II. Substituting the expression for wIIa in place of
wa, and substituting f = τξ∗oξh = τθξh in (1), we obtain:
∂πh∂ξh
=
(Raf +Rav
λhνh2(1− ρh)
− chνa
2(1− ρh)
)τθλp + ξh
(Rav
λ2pνa(τθ)
2
1− ρh− ce
)=:B+ ξhA
where A = Ravλ2pνa(τθ)2
1−ρh − ce, and B =(Raf +Rav
λhνh2(1−ρh) − ch
νa2(1−ρh)
)τθλp. Denote ce :=
Ravλ2pνa(τθ)2
1−ρh , and ch :=Raf2(1−ρh)
νa+Rav
λhνhνa
. Note that ce≶ ce ⇔ A≷ 0, and ch≶ ch ⇔ B ≷ 0.
When A < 0 (or ce > ce), πh is concave in ξh, otherwise it is convex (because ∂2πh∂ξ2h
= A).
Therefore, the hospital’s objective and optimal effort level (ξ∗h) can be characterized by the
following four exhaustive cases:

Arora and Subramanian: Improving Societal Outcomes in the ODVCGeorgia Tech Scheller College of Business Working Paper 41
(i) ce> ce and ch ≥ ch, or A< 0 and B ≤ 0 ⇒ ∂πh∂ξh
< 0 ⇒ ξ∗h = 0.
(ii) ce > ce and ch < ch, or A< 0<B: (a) B−A < 1 ⇒ πh is concave (unimodal) and ξ∗h = B
−A
< 1. (b) B−A > 1 ⇒ ∂πh
∂ξh≥ 0 ⇒ πh is concave increasing and ξ∗h = 1.
(iii) ce< ce and ch< ch, or A> 0 and B > 0 ⇒ ∂πh∂ξh
> 0 ⇒ ξ∗h = 1.
(iv) ce < ce and ch ≥ ch, or B ≤ 0<A: A> 0 implies that πh is convex in ξh. The following
two sub-cases arise from comparing πh|ξh=1 and πh|ξh=0: Denote ¯ch(ce) = ch+(ce−ce)(
1−ρhλpτθνa
);
Case (aaa): For ch ≤ ch < ¯ch(ce), πh|ξh=1 − πh|ξh=0 = A2 +B ≥ 0 ⇒ ξ∗h = 1; and, Case (bbb): For
ch ≥ ¯ch(ce), πh|ξh=1 − πh|ξh=0 = A2 + B ≤ 0 ⇒ ξ∗h = 0. Note that if B = −A
2 , the hospital is
indifferent between ξ∗h = 1 and ξ∗h = 0. �
PROOF OF PROPOSITION 2. We first show that χS = I. Note that, since wχa1∼= wχa2 ∀ χ
∈ AS, we drop 1 or 2 from the subscript such that wχa denotes the average wait time experienced
by authorized donors of either class. Under Assumption A1, wχh∼= (λaνa+λhνh)
2(1−ρh) ∀ χ ∈ A . Since
πS decreases in wa, and wa(f1, f2,χ= II) > wa(f1, f2, χ) > wa(f1, f2,χ= I) ∀ χ ∈ AS \{I, II},
we have χS = I.
From the discussion following (5) and (6), we obtain wIa∼= f1λp1νa+f2λp2νa+λhνh
2 . Substituting
the expression for wIa in place of wa1 and wa2 in (2), we get:
∂πS∂f1
= λp1
(Qa1−Qa1f1qaλp1νa− (Qa1 +Qa2)f2qa
λp2νa2−Qa1qa
λhνh2−Qhqh
λhνa2(1− ρh)
)(B1)
∂πS∂f2
= λp2
(Qa1−Qa1f2qaλp2νa− (Qa1 +Qa2)f1qa
λp1νa2−Qa1qa
λhνh2−Qhqh
λhνa2(1− ρh)
)(B2)
Denoting λp := min{λp1, λp2} and λp := max{λp1, λp2}, we consider the three cases in the state-
ment of Proposition 2:
(i) qa < qa := 2Qa1(1−ρh)−Qhqhλhνa
(1−ρh)[Qa1(λhνh+τθλpνa+2τθλpνa)+Qa2τθλpνa]⇒ ∂πS
∂f1> 0 and ∂πS
∂f2> 0 ∀ f1 ∈ [0, τθ]
and f2 ∈ [0, τθ], i.e., πS is maximized when fS1 = τθ and fS2 = τθ.
(ii) qa ≤ qa < ¯qa := 2Qa1(1−ρh)−Qhqhλhνa
(1−ρh)[Qa1(λhνh+τθλpνa+2τθλpνa)+Qa2τθλpνa]⇒ ∂πS
∂f1> 0 ∀ f1 ∈ [0, τθ] and
f2 ∈ [0, τθ] ⇒ fS1 = τθ. Also, ∂πS∂f2
∣∣∣f1=τθ
decreases linearly in f2 such that ∂πS∂f2
∣∣∣f1=τθ,f2=0
> 0
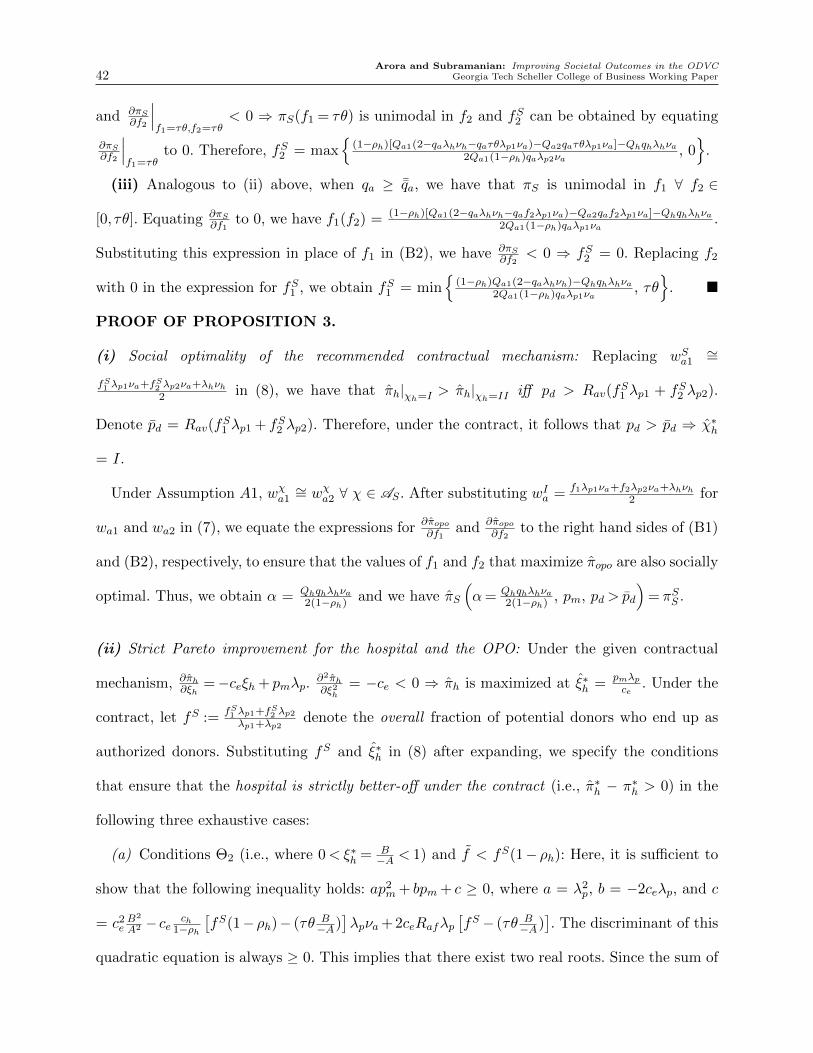
Arora and Subramanian: Improving Societal Outcomes in the ODVC42 Georgia Tech Scheller College of Business Working Paper
and ∂πS∂f2
∣∣∣f1=τθ,f2=τθ
< 0 ⇒ πS(f1 = τθ) is unimodal in f2 and fS2 can be obtained by equating
∂πS∂f2
∣∣∣f1=τθ
to 0. Therefore, fS2 = max{
(1−ρh)[Qa1(2−qaλhνh−qaτθλp1νa)−Qa2qaτθλp1νa]−Qhqhλhνa2Qa1(1−ρh)qaλp2νa
, 0}
.
(iii) Analogous to (ii) above, when qa ≥ ¯qa, we have that πS is unimodal in f1 ∀ f2 ∈
[0, τθ]. Equating ∂πS∂f1
to 0, we have f1(f2) = (1−ρh)[Qa1(2−qaλhνh−qaf2λp1νa)−Qa2qaf2λp1νa]−Qhqhλhνa2Qa1(1−ρh)qaλp1νa
.
Substituting this expression in place of f1 in (B2), we have ∂πS∂f2
< 0 ⇒ fS2 = 0. Replacing f2
with 0 in the expression for fS1 , we obtain fS1 = min{
(1−ρh)Qa1(2−qaλhνh)−Qhqhλhνa2Qa1(1−ρh)qaλp1νa
, τθ}
. �
PROOF OF PROPOSITION 3.
(i) Social optimality of the recommended contractual mechanism: Replacing wSa1∼=
fS1 λp1νa+fS2 λp2νa+λhνh2 in (8), we have that πh|χh=I > πh|χh=II iff pd > Rav(fS1 λp1 + fS2 λp2).
Denote pd = Rav(fS1 λp1 + fS2 λp2). Therefore, under the contract, it follows that pd > pd ⇒ χ∗h
= I.
Under Assumption A1, wχa1∼= wχa2 ∀ χ ∈ AS. After substituting wIa = f1λp1νa+f2λp2νa+λhνh
2 for
wa1 and wa2 in (7), we equate the expressions for ∂πopo∂f1
and ∂πopo∂f2
to the right hand sides of (B1)
and (B2), respectively, to ensure that the values of f1 and f2 that maximize πopo are also socially
optimal. Thus, we obtain α = Qhqhλhνa2(1−ρh) and we have πS
(α= Qhqhλhνa
2(1−ρh) , pm, pd> pd
)= πSS .
(ii) Strict Pareto improvement for the hospital and the OPO: Under the given contractual
mechanism, ∂πh∂ξh
=−ceξh + pmλp.∂2πh∂ξ2h
= −ce < 0 ⇒ πh is maximized at ξ∗h = pmλpce
. Under the
contract, let fS :=fS1 λp1+fS2 λp2λp1+λp2
denote the overall fraction of potential donors who end up as
authorized donors. Substituting fS and ξ∗h in (8) after expanding, we specify the conditions
that ensure that the hospital is strictly better-off under the contract (i.e., π∗h − π∗
h > 0) in the
following three exhaustive cases:
(a) Conditions Θ2 (i.e., where 0< ξ∗h = B−A < 1) and f < fS(1− ρh): Here, it is sufficient to
show that the following inequality holds: ap2m + bpm + c ≥ 0, where a = λ2
p, b = −2ceλp, and c
= c2eB2
A2 − ce ch1−ρh
[fS(1− ρh)− (τθ B
−A)]λpνa+ 2ceRafλp
[fS − (τθ B
−A)]. The discriminant of this
quadratic equation is always ≥ 0. This implies that there exist two real roots. Since the sum of

Arora and Subramanian: Improving Societal Outcomes in the ODVCGeorgia Tech Scheller College of Business Working Paper 43
the two roots = −ba = 2ce
λp> 0, it follows that there exists at least one root (say, p1) that is >
0 ⇒ ap2m + bpm + c≥ 0 ∀ pm > p1.
(b) Conditions Θ2 and f > fS(1 − ρh): In this case, the condition that ensures
π∗h − π∗
h > 0 can be written as qp2m + rpm + s > 0, where q = λ2
p, r
= −2ceλp, s = −c2e B2
A2 − ceR + cech
1−ρh
(τθ B
−A − fS)λpνa, and R = Raf
(τθ B
−A − fS)
+
Ravλp
1−ρh
[(τ2θ2B2
A2 − (fS)2(1− ρh)
)λpνa +
(τθ B
−A − fS(1− ρh)
)λhνh
]. By following the same
line of reasoning as in case (a) above, we can show that there exists at least one root (say, p2)
that is > 0 ⇒ qp2m + rpm + s > 0 ∀ pm > p2.
(c) Conditions Θ1 (i.e., where ξ∗h = 1) and f > fS(1− ρh): Note that conditions Θ1 imply f
> fS(1−ρh). The proof of case (c) is similar to that of case (b) above, by replacing B−A with 1.
For case (c), let p3 denote the threshold such that π∗h−π∗
h> 0 ∀pm>p3.
Rearranging the terms in the relationships fS1 = τ ξ∗hξ∗o1 and fS2 = τ ξ∗hξ
∗o2, we have ξ∗o1 =
fS1τ ξ∗h
and ξ∗o2 =fS2τ ξ∗h
. For each of the cases in Proposition 2, it is straightforward to find the
corresponding values of the penalty (say, p4) such that ξ∗o1 + ξ∗o2 < 2ξ∗o = 2θ, or that the OPO
is strictly better-off under the contract ∀ pm > p4. Strict Pareto improvement for the hospital
and the OPO follows by setting pm = max{p1, p2, p3, p4}. �
Appendix C: Numerical Illustration (with a lower ρh)
In this section, we present a numerical illustration that considers a lower value of ρh than in
Section 4.3 (specifically, a higher µh for a given λh). Using the same representative values for
our model parameters as in Section 4.3, and changing ρh from 0.8 to 0.6, we obtain plots of
the equilibrium fractions (f1 = f2 = f) of potential donors who currently end up as authorized
donors and the socially-optimal fractions (fS1 and fS2 ), with respect to the sensitivity (qa) of
QALYs added for the organ recipient to the delay experienced by the organ donor while waiting
in the OR queue (see Figure C1). With these parameter choices, the obtained threshold values
(qa and ¯qa) are higher than those in Section 4.3, implying that cases (i) and (ii) of Proposition

Arora and Subramanian: Improving Societal Outcomes in the ODVC44 Georgia Tech Scheller College of Business Working Paper
(a) Under conditions Θ1 (b) Under conditions Θ2
Note: This figure includes plots of the equilibrium fraction (f1 = f2 = f) of potential donors who currently end upas authorized donors, and the socially-optimal fractions (fS
1 and fS2 ) who should end up as authorized donors, with
respect to the sensitivity (qa) of QALYs added for the organ recipient to the delay experienced by the organ donorwhile waiting in the OR queue.
Figure C1 Numerical Illustration (with a lower ρh)
2 are more likely (or, that it would more likely be socially optimal for the OPO and the hospital
to exert greater effort levels when ρh is lower).
Similar to the plots in Section 4.3, the plots in Figure C1 show that, under both sets of
conditions (Θ1 and Θ2), there exist regions where the equilibrium fractions in the current
scenario are not socially optimal. For instance, as seen in Figure 3(b), under Θ2, fS1 > f1 when
qa < ¯qa and fS2 > f2 when qa < qa.

Arora and Subramanian: Improving Societal Outcomes in the ODVCGeorgia Tech Scheller College of Business Working Paper 45
Table 1: Abbreviations
BD Brain Death
CMS Centers for Medicare and Medicaid Services
DHHS Department of Health and Human Services
DSA Donor Service Area
HCP Health Care Professional
ODVC Organ Donation Value Chain
OPO Organ Procurement Organization
OR Operating Room
QALY Quality-Adjusted Life Year
Table 2: Notation
α Weight of the volume-based component in the OPO’s revised objective
Ce Cost of hospital’s efforts towards organ recovery activities
ce Coefficient in the cost to the hospital for its efforts towards organ recovery activities (Ce)
Ch Cost to the hospital from the wait times experienced by the hospital’s other patients
ch Coefficient in the cost to the hospital from the wait times experienced by the hospital’s other
patients (Ch)
χ Hospital’s OR scheduling policy
f Overall fraction of potential donors who end up as authorized donors in the current scenario
fh Fraction of potential donors who end up as referred donors
fi Fraction of type i potential donors who end up as authorized donors
fo Fraction of referred donors who end up as authorized donors
fSi Socially-optimal fraction of type i potential donors who should end up as authorized donors
f Equilibrium fraction of potential donors who end up as authorized donors (current scenario)
fi Equilibrium fraction of type i potential donors who end up as authorized donors (current scenario)
λx Arrival rate of class x patients
µy Service rate (in the OR) for class y patients
νy Second moment of the service time required in the OR for class y patients
pd Penalty rate levied by the social planner on the hospital per unit wait time for type 1 authorized
donors in excess of their average wait time under the proposed centralized scenario
pm Penalty rate levied by the social planner on the hospital for each missed referral
Continued on next page

Arora and Subramanian: Improving Societal Outcomes in the ODVC46 Georgia Tech Scheller College of Business Working Paper
Notation – Continued from previous page
Qai Average QALYs added to a recipient of the focal organ recovered from type i potential donor
qa Sensitivity of QALYs (Qai) added to the delay experienced by the donor while waiting in the OR
queue
Qh Average QALYs added to the hospital’s other patients who access the OR
qh Sensitivity of QALYs (Qh) added to the delay experienced by the hospital’s other patients while
waiting in the OR queue
Raf Average fixed reimbursement rate per authorized donor
Rav Average variable reimbursement rate per authorized donor per unit care time
Rh Average fixed reimbursement rate (per-patient) associated with the hospital’s other patients
τ Donors’ or their families’ (exogenous) affinities towards organ donation
θ Upper limit on the OPO’s effort level
wy Average wait time in the OR queue for patients of class y
ξh Hospital’s effort level towards organ recovery activities
ξo OPO’s effort level in the current (uncoordinated) scenario
ξoi OPO’s effort level for type i potential donors under the contract
Note: Different classes of patients are: authorized donors converted from the overall pool of potential donors (a);type i authorized donors (ai), i ∈ {1,2}; the hospital’s other patients (h); the overall pool of potential donors (p);and type i potential donors (pi), i ∈ {1,2}. Also, x ∈ {a,h, p, p1, p2}; y ∈ {a,a1, a2, h}.


![[PPT]PowerPoint Presentation - MOHAN Foundation - Organ ... · Web viewOrgan Donation Presentation Organ Donation What is Organ donation Organ donation is the process of removing](https://img.pdfslide.us/doc/110x75/5adac0627f8b9a6d7e8d1ad7/pptpowerpoint-presentation-mohan-foundation-organ-vieworgan-donation-presentation.jpg)