Embed Size (px)
Citation preview
OECD EMPLOYER
BRAND
Playbook
11
Stockholm
4 May 2015
Improving Schools
in Sweden
Andreas Schleicher
OECD Directorate for
Education and Skills
AustraliaAustria
Belgium Canada
Chile
Czech Rep.
Denmark
Estonia
Finland
France
Germany
Greece
Hungary
IcelandIreland
Israel
Italy
Japan
Korea
Luxembourg
Mexico
Netherlands
New Zealand
Norway
Poland
Portugal
Slovak Rep.
Slovenia
Spain Sweden
Switzerland
Turkey
UK
US
Australia
Austria
Belgium
Canada
Chile
Czech Rep.
Denmark
Estonia
Finland
France
Germany
Greece
Hungary
Iceland
Ireland
Israel
Italy
Japan
Korea
Luxembourg
Mexico
Netherlands
New Zealand
Norway
Poland
Portugal
Slovak Rep.
Slovenia
Spain
Sweden
Switzerland
Turkey
UK
US
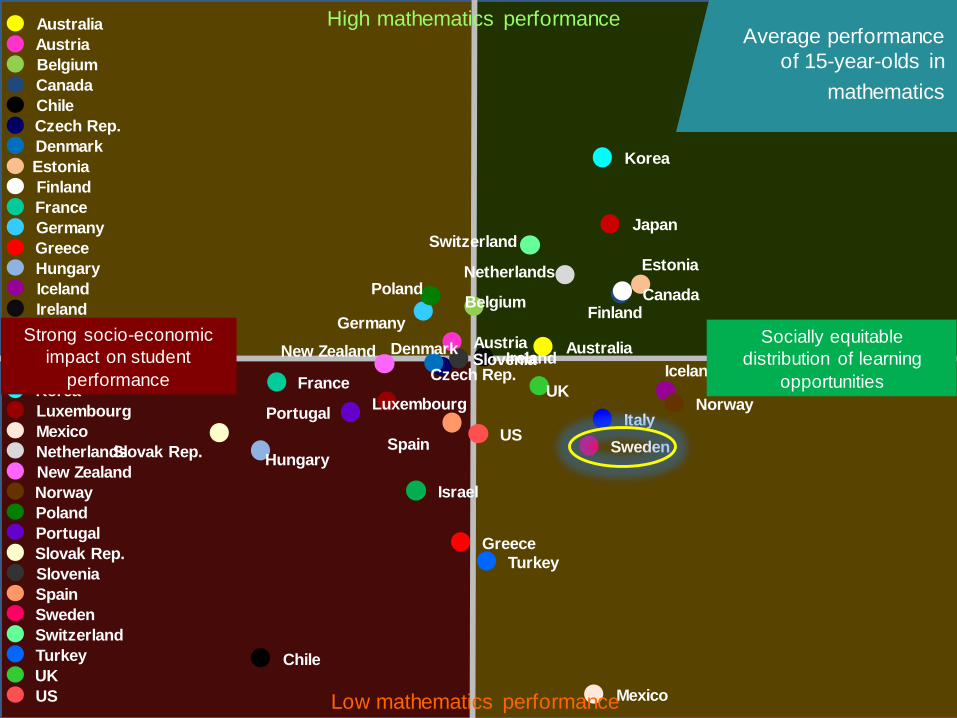
Socially equitable
distribution of learning
opportunities
Strong socio-economic
impact on student
performance
High mathematics performance
Low mathematics performance
Average performance
of 15-year-olds in
mathematics
AustraliaAustria
Belgium Canada
Chile
Czech Rep.
Denmark
Estonia
Finland
France
Germany
Greece
Hungary
IcelandIreland
Israel
Italy
Japan
Korea
Luxembourg
Mexico
Netherlands
New Zealand
Norway
Poland
Portugal
Slovak Rep.
Slovenia
Spain Sweden
Switzerland
Turkey
UK
US
Australia
Austria
Belgium
Canada
Chile
Czech Rep.
Denmark
Estonia
Finland
France
Germany
Greece
Hungary
Iceland
Ireland
Israel
Italy
Japan
Korea
Luxembourg
Mexico
Netherlands
New Zealand
Norway
Poland
Portugal
Slovak Rep.
Slovenia
Spain
Sweden
Switzerland
Turkey
UK
US
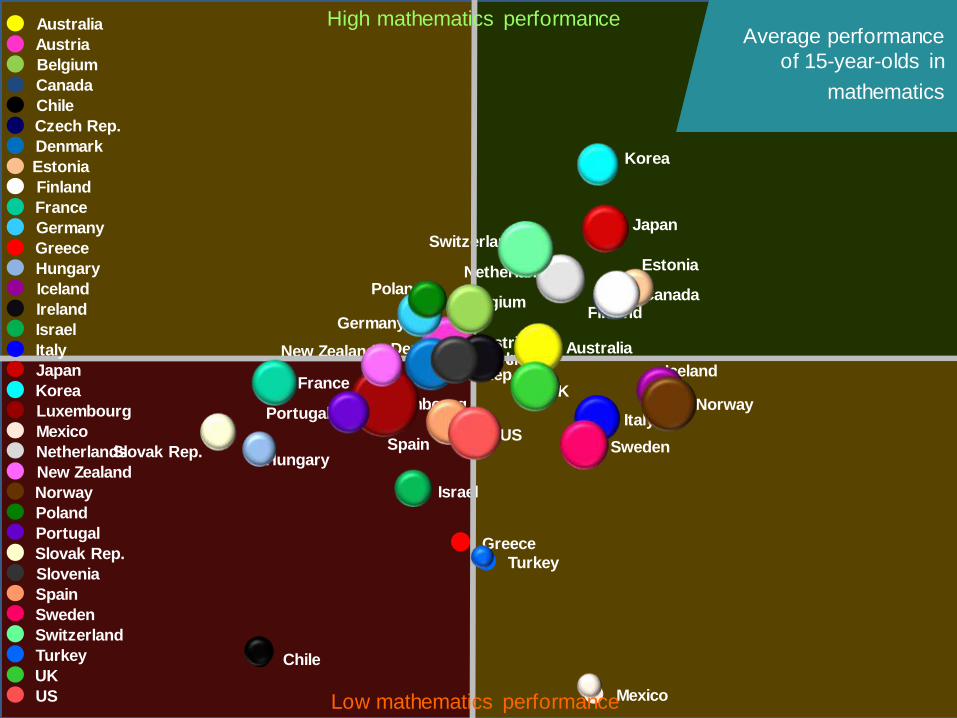
High mathematics performance
Low mathematics performance
Average performance
of 15-year-olds in
mathematics
-10
-5
0
5
10
15
Port
ugal
Spa
in
Sw
itze
rlan
d
Bel
gium
Kor
ea
Lux
emb
ourg
Ger
man
y
Gre
ece
Jap
an
Aus
tral
ia
Uni
ted
Kin
gdom
New
Zea
land
Fra
nce
Net
herl
ands
Den
mar
k
Ital
y
Aus
tria
Cze
ch R
epub
lic
Hun
gary
Nor
way
Icel
and
Irel
and
Mex
ico
Fin
land
Sw
eden
Uni
ted
Sta
tes
Pola
nd
Slo
vak
Repu
blic
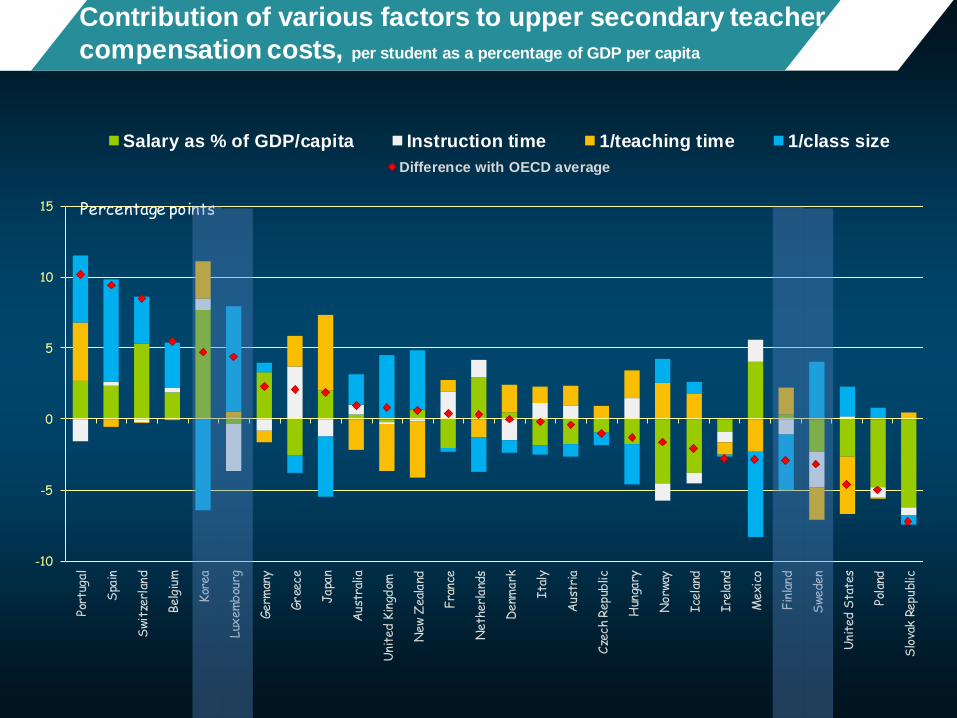
Salary as % of GDP/capita Instruction time 1/teaching time 1/class size
Contribution of various factors to upper secondary teacher
compensation costs, per student as a percentage of GDP per capita
Percentage points
Difference with OECD average
AustraliaAustria
Belgium Canada
Chile
Czech Rep.
Denmark
Estonia
Finland
France
Germany
Greece
Hungary
IcelandIreland
Israel
Italy
Japan
Korea
Luxembourg
Mexico
Netherlands
New Zealand
Norway
Poland
Portugal
Slovak Rep.
Slovenia
Spain Sweden
Switzerland
Turkey
UK
US
Australia
Austria
Belgium
Canada
Chile
Czech Rep.
Denmark
Estonia
Finland
France
Germany
Greece
Hungary
Iceland
Ireland
Israel
Italy
Japan
Korea
Luxembourg
Mexico
Netherlands
New Zealand
Norway
Poland
Portugal
Slovak Rep.
Slovenia
Spain
Sweden
Switzerland
Turkey
UK
US
Singapore
Shanghai
Singapore
2003 - 2012
Chile 2003
Turkey 2003
Mean mathematics performance, by school location,
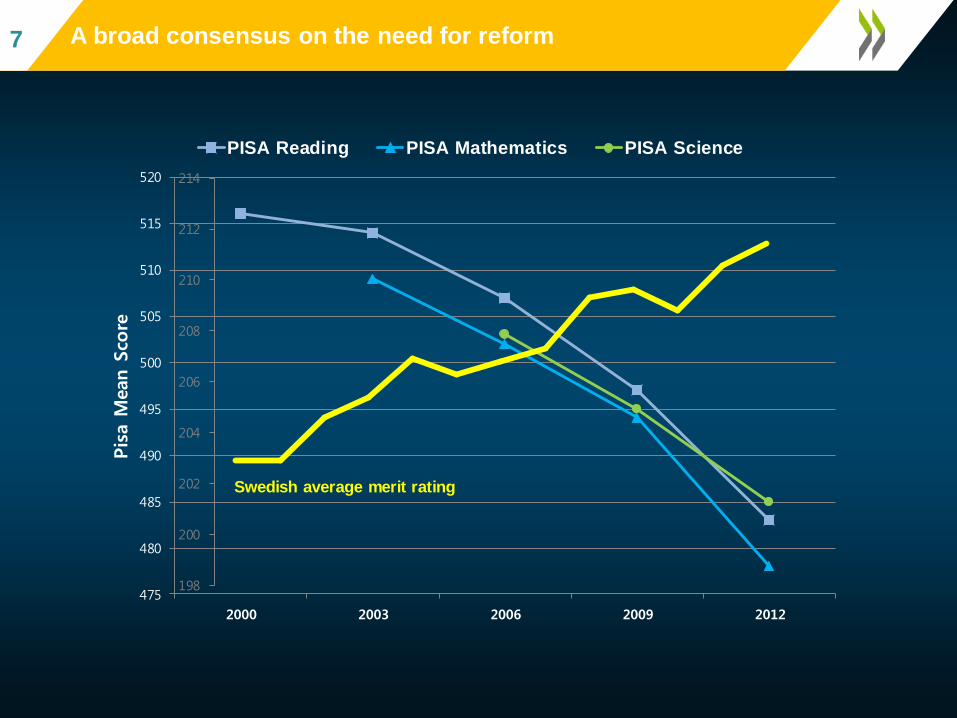
after accounting for socio-economic statusFig II.3.37 A broad consensus on the need for reform7
475
480
485
490
495
500
505
510
515
520
2000 2003 2006 2009 2012
Pis
a M
ean S
core
PISA Reading PISA Mathematics PISA Science
198
200
202
204
206
208
210
212
214
Swedish average merit rating
0
10
20
30
40
Ho
ng
Ko
ng
-Ch
ina
Ko
rea
+Li
ech
ten
ste
inM
aca
o-C
hin
a +
Jap
an
Swit
zerl
an
dB
elg
ium
-N
eth
erl
an
ds
-G
erm
an
yP
ola
nd
+C
an
ad
a -
Fin
lan
d -
Ne
w Z
eal
an
d -
Au
stra
lia
-A
ust
ria
OE
CD
ave
rage
20
03
-Fr
ance
Cze
ch R
ep
ub
lic -
Luxe
mb
ou
rgIc
ela
nd
-Sl
ov
ak R
ep
ub
lic
Ire
lan
dP
ort
uga
l +
De
nm
ark
-It
aly
+N
orw
ay -
Hu
nga
ryU
nit
ed S
tate
sSw
ede
n -
Spai
nLa
tvia
Ru
ssia
n F
ed
era
tio
nT
urk
ey
Gre
ece
Th
aila
nd
Uru
guay
-T
un
isia
Bra
zil
Me
xico
Ind
on
esi
a
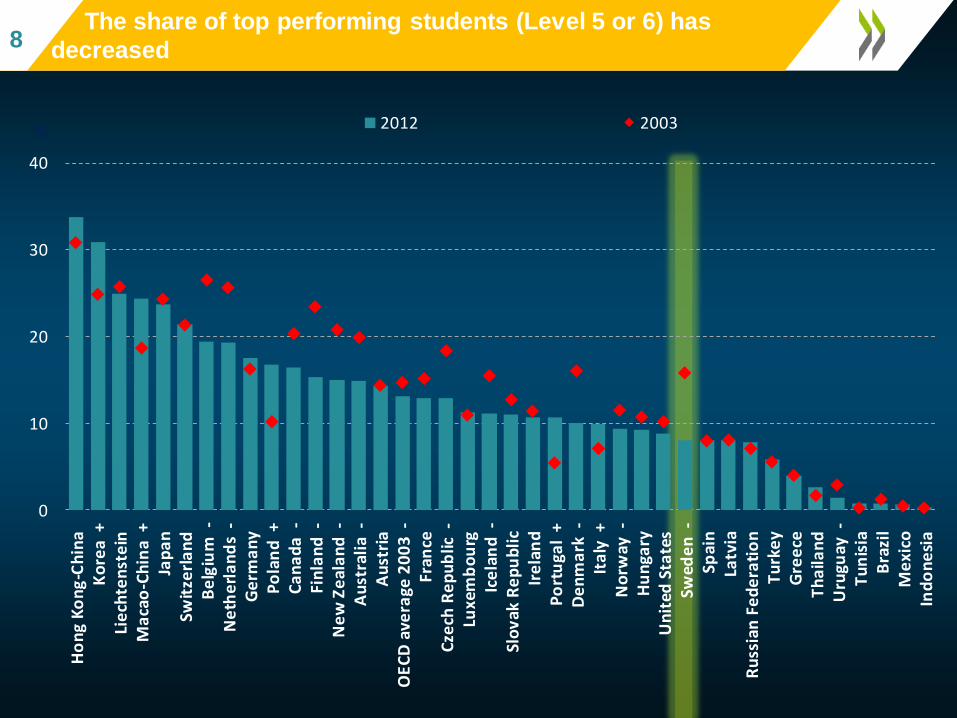
% 2012 2003
Mean mathematics performance, by school location,
after accounting for socio-economic statusFig II.3.38
The share of top performing students (Level 5 or 6) has
decreased8
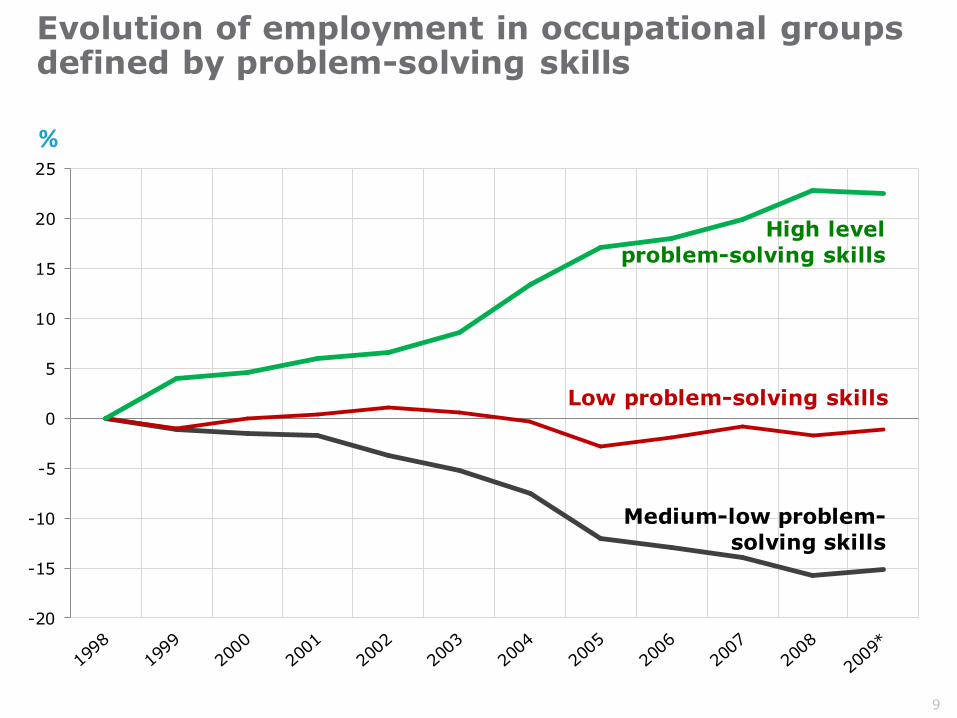
Evolution of employment in occupational groups defined by problem-solving skills
9
-20
-15
-10
-5
0
5
10
15
20
25
%
Medium-low problem-
solving skills
Low problem-solving skills
High level
problem-solving skills

Mean mathematics performance, by school location,
after accounting for socio-economic statusFig II.3.310 Sweden: A system in urgent need of change10
Challenges
1) Student performance has deteriorated and learning environments are not always conducive
to learning.
2) Conditions to nurture an excellent teaching profession are not adequate and pedagogical leadership is insufficiently prioritised.
3) Local autonomy is not matched with adequate capacity and accountability.
4) Assessment and evaluation arrangements remain underdeveloped.
5) There is a lack of clarity on education priorities and lack of a strong strategy.
Strengths
1) A broad consensus on the need for change and support for school reforms.
2) A comprehensive school system that emphasises inclusion
3) High student motivation for learning and positive student-teacher relationships.
4) A long-standing tradition in investing in and supporting disadvantaged students.

Mean mathematics performance, by school location,
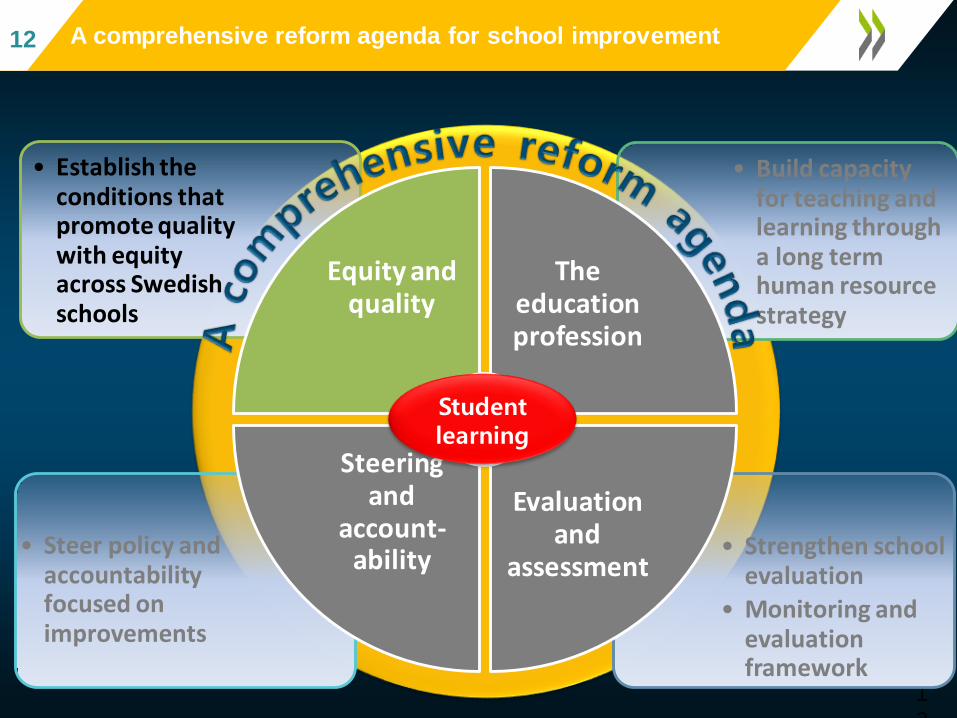
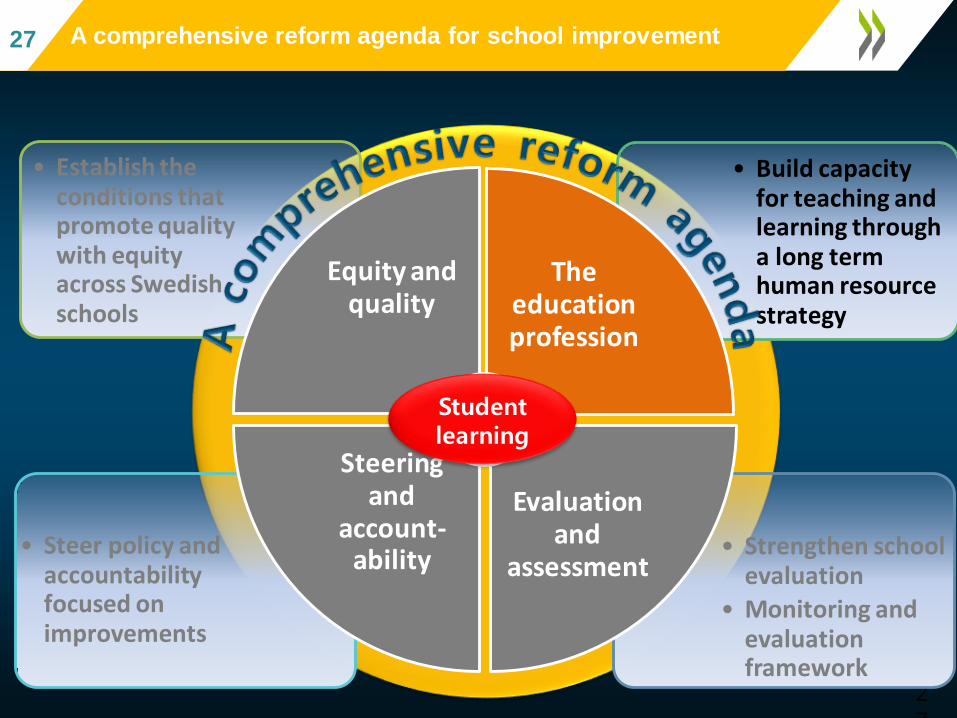
after accounting for socio-economic statusFig II.3.311 A comprehensive reform agenda for school improvement11
11
• Strengthen school evaluation
• Monitoring and evaluation framework
• Steer policy and accountability focused on improvements
• Build capacity for teaching and learning through a long term human resource strategy
• Establish the conditions that promote quality with equity across Swedish schools
Equity and quality
The education profession
Evaluation and
assessment
Steering and
account-ability
Student learning
Mean mathematics performance, by school location,
after accounting for socio-economic statusFig II.3.312 A comprehensive reform agenda for school improvement12
12
• Strengthen school evaluation
• Monitoring and evaluation framework
• Steer policy and accountability focused on improvements
• Build capacity for teaching and learning through a long term human resource strategy
• Establish the conditions that promote quality with equity across Swedish schools
Equity and quality
The education profession
Evaluation and
assessment
Steering and
account-ability
Student learning
Mean mathematics performance, by school location,
after accounting for socio-economic statusFig II.3.313
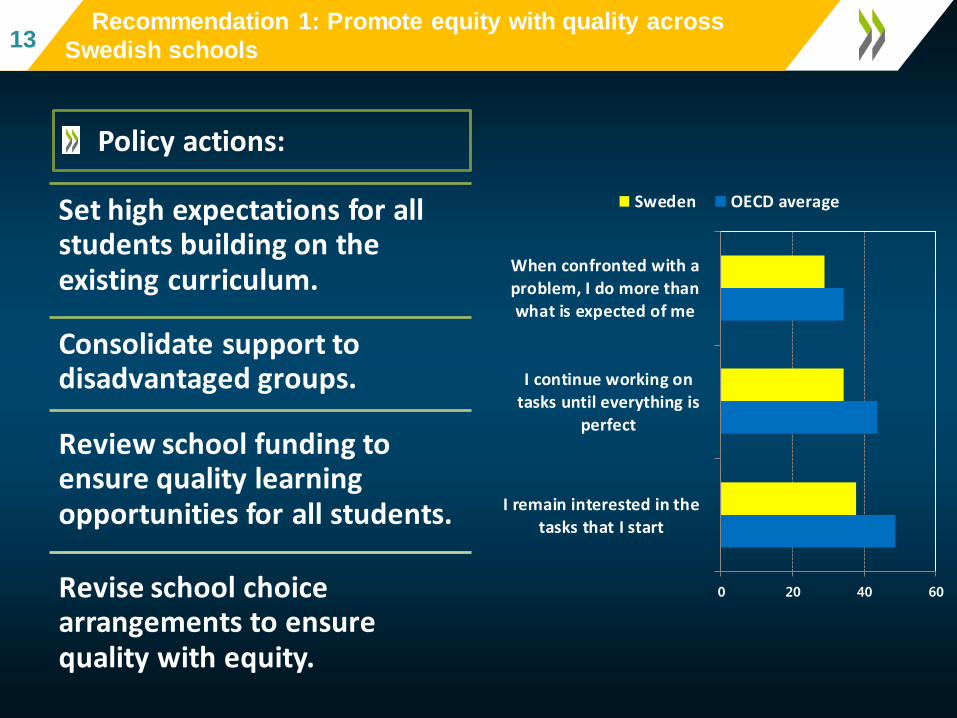
Recommendation 1: Promote equity with quality across
Swedish schools13
Set high expectations for all students building on the existing curriculum.
Consolidate support to disadvantaged groups.
Review school funding to ensure quality learning opportunities for all students.
Revise school choice arrangements to ensure quality with equity.
0 20 40 60
I remain interested in thetasks that I start
I continue working ontasks until everything is
perfect
When confronted with aproblem, I do more than
what is expected of me
Sweden OECD average
Policy actions:

United States
Poland
Hong Kong-China
Brazil
New Zealand
Greece
Uruguay
United Kingdom
EstoniaFinland
Albania
Croatia
Latvia
Slovak RepublicLuxembourg
Germany
Lithuania
Austria
Czech Republic
Chinese Taipei
France
Thailand
Japan
Turkey Sweden
HungaryAustralia
Israel
Canada
IrelandBulgaria
Jordan
Chile
Macao-China
U.A.E.
Belgium
Netherlands
Spain
Argentina
Indonesia
Denmark
Kazakhstan
Peru
Costa Rica
Switzerland
Montenegro
Tunisia
Iceland
Slovenia
Qatar
Singapore
Portugal
Norway
Colombia
Malaysia
Mexico
Liechtenstein
Korea
Serbia
Russian Fed.
Romania
Viet Nam
Italy
Shanghai-China
R² = 0.36
300
350
400
450
500
550
600
650
-0.60 -0.40 -0.20 0.00 0.20 0.40 0.60 0.80 1.00 1.20
Mean
math
em
ati
cs p
erf
orm
an
ce
Mean index of mathematics self-efficacy
OE
CD
avera
ge
Countries where students have stronger beliefs
in their abilities perform better in mathematics14 Fig III.4.5
Sweden

Motivation to learn mathematics
Percentage of students who reported "agree" or "strongly agree" with the following statements:
0 10 20 30 40 50 60 70
I enjoy reading about mathematics
I look forward to my mathematicslessons
I do mathematics because I enjoy it
I am interested in the things I learnin mathematics
%
Sweden Shanghai-China OECD average
Fig III.3.915
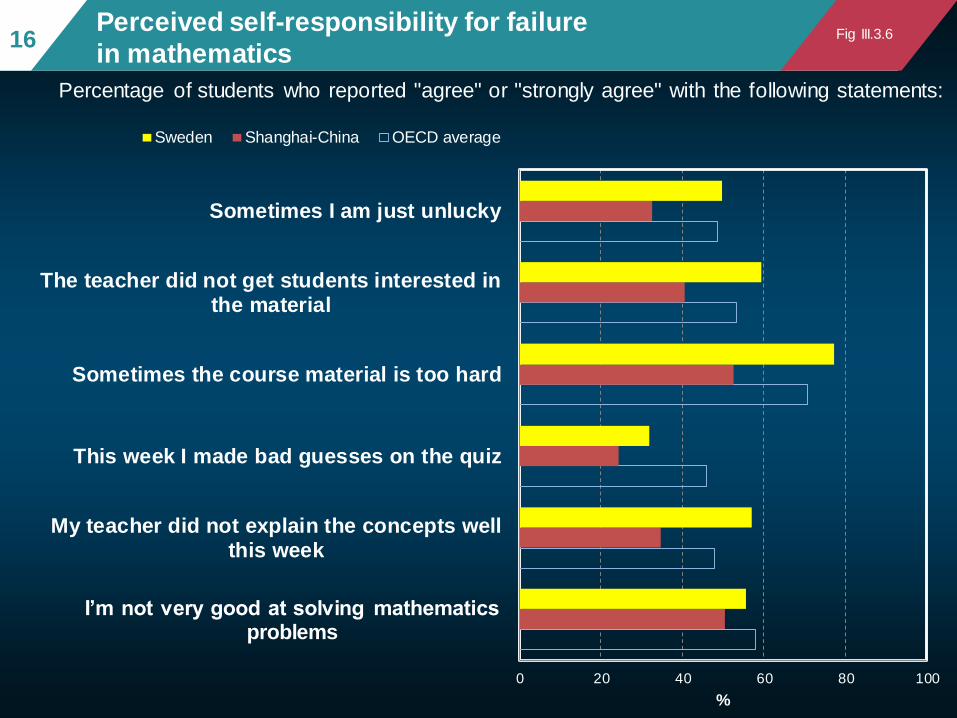
Perceived self-responsibility for failure
in mathematics
Percentage of students who reported "agree" or "strongly agree" with the following statements:
0 20 40 60 80 100
I’m not very good at solving mathematics problems
My teacher did not explain the concepts wellthis week
This week I made bad guesses on the quiz
Sometimes the course material is too hard
The teacher did not get students interested inthe material
Sometimes I am just unlucky
%
Sweden Shanghai-China OECD average
Fig III.3.616
0.00
0.50
1.00
1.50
2.00
2.50V
iet N
am
Maca
o-C
hin
aS
ha
ngha
i-C
hin
aT
urk
ey
Uru
gua
yG
reece
Hon
g K
ong-C
hin
aC
hin
ese T
aip
ei
Port
ugal
Bra
zil
Serb
iaB
ulg
aria
Sin
ga
pore
Neth
erl
and
sJa
pan
Arg
entina
Costa
Ric
aLithuan
iaT
un
isia
New
Zea
land
Cze
ch R
epu
blic
Isra
el
Kore
aLa
tvia
Qata
rIta
lyU
nited S
tate
sE
sto
nia
Irela
nd
Austr
alia
Mexic
oU
nited A
rab E
mirate
sN
orw
ay
Mala
ysia
Kazakh
sta
nU
nited K
ingdo
mR
om
an
iaO
EC
D a
ve
rag
eA
lban
iaC
olo
mbia
Indon
esia
Sw
ed
en
Belg
ium
Peru
Tha
ilan
dD
en
ma
rkR
ussia
n F
ed
era
tion
Can
ada
Slo
va
k R
epu
blic
Hun
gary
Germ
any
Cro
atia
Lu
xem
bo
urg
Monte
negro
Chile
Pola
nd
Fin
land
Austr
iaS
love
nia
Fra
nce
Sw
itzerla
nd
Jo
rda
nLie
chte
nste
inS
pa
inIc
ela
nd
Ind
ex o
f exp
osu
re t
o w
ord
pro
ble
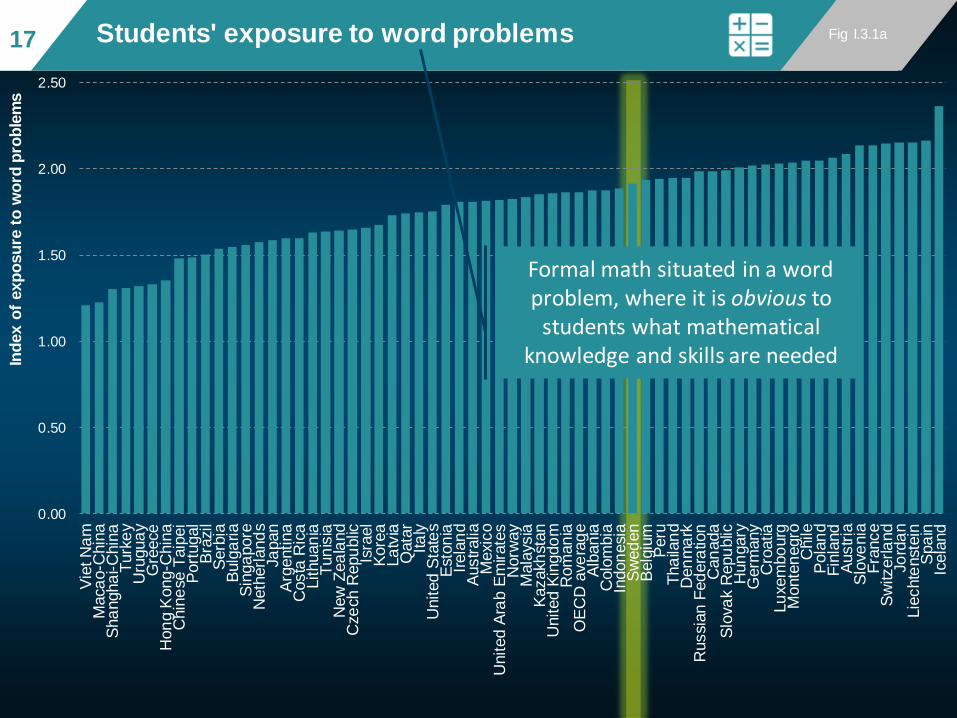
ms
Students' exposure to word problems Fig I.3.1a17
Formal math situated in a word problem, where it is obvious to
students what mathematical knowledge and skills are needed

0.00
0.50
1.00
1.50
2.00
2.50S
wed
en
Icela
nd
Tun
isia
Arg
entina
Sw
itzerla
nd
Bra
zil
Lu
xem
bo
urg
Irela
nd
Neth
erl
and
sN
ew
Zea
land
Costa
Ric
aA
ustr
iaLie
chte
nste
inM
ala
ysia
Indon
esia
Den
ma
rkU
nited K
ingdo
mU
rugua
yLithuan
iaG
erm
any
Austr
alia
Chile
OE
CD
ave
rag
eS
lova
k R
epu
blic
Tha
ilan
dQ
ata
rF
inla
nd
Port
ugal
Colo
mbia
Mexic
oP
eru
Cze
ch R
epu
blic
Isra
el
Ita
lyB
elg
ium
Hon
g K
ong-C
hin
aP
ola
nd
Fra
nce
Spa
inM
onte
negro
Gre
ece
Turk
ey
Slo
ve
nia
Vie
t N
am
Hun
gary
Bulg
aria
Kazakh
sta
nC
hin
ese T
aip
ei
Can
ada
United S
tate
sE
sto
nia
Rom
an
iaLa
tvia
Serb
iaJa
pan
Kore
aC
roatia
Alb
an
iaR
ussia
n F
ed
era
tion
United A
rab E
mirate
sJo
rda
nM
aca
o-C
hin
aS
inga
pore
Sha
ngha
i-C
hin
a
Ind
ex o
f exp
osu
re t
o f
orm
al
math
em
ati
cs
Students' exposure to conceptual understanding Fig I.3.1b 18
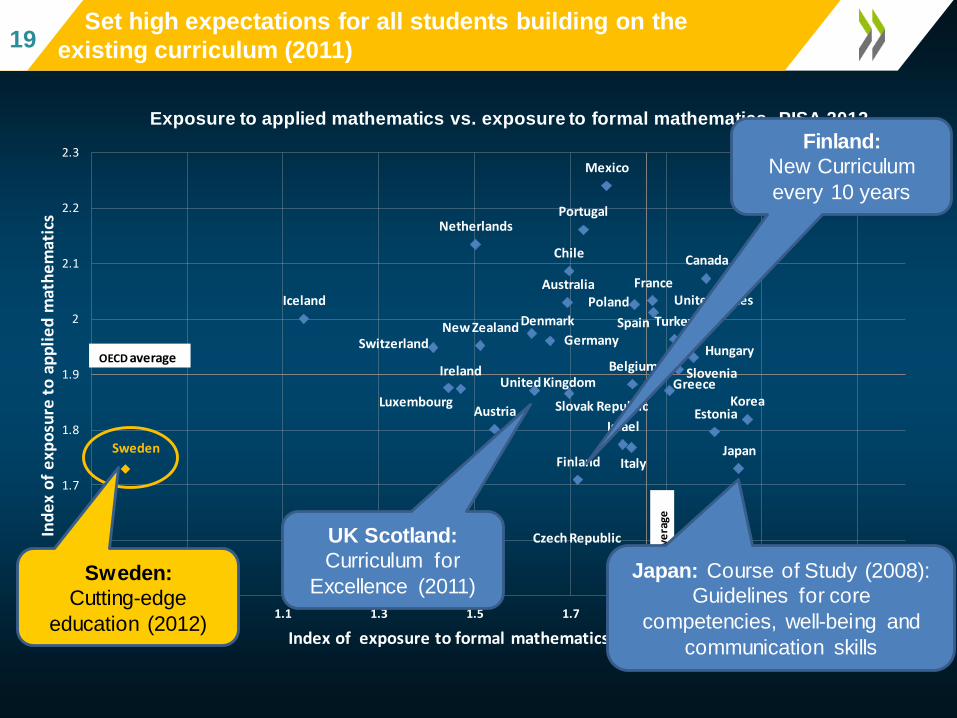
Exposure to applied mathematics vs. exposure to formal mathematics, PISA 2012
Mean mathematics performance, by school location,
after accounting for socio-economic statusFig II.3.319
Set high expectations for all students building on the
existing curriculum (2011)19
%
Australia
Austria
Belgium
CanadaChile
Czech Republic
Denmark
Estonia
Finland
France
Germany
Greece
Hungary
Iceland
Ireland
Israel
ItalyJapan
KoreaLuxembourg
Mexico
Netherlands
New Zealand
Poland
Portugal
Slovak Republic
Slovenia
Spain
Sweden
Switzerland
Turkey
United Kingdom
United States
1.5
1.6
1.7
1.8
1.9
2
2.1
2.2
2.3
0.7 0.9 1.1 1.3 1.5 1.7 1.9 2.1 2.3
Ind
ex
of
exp
osu
re t
o a
pp
lie
d m
ath
em
atic
s
Index of exposure to formal mathematics
OEC
D a
vera
ge
OECD average
Sweden:
Cutting-edge
education (2012)
UK Scotland:
Curriculum for
Excellence (2011)Japan: Course of Study (2008):
Guidelines for core
competencies, well-being and
communication skills
Finland:
New Curriculum
every 10 years

Mean mathematics performance, by school location,
after accounting for socio-economic statusFig II.3.32020
0.0
0.5
1.0
1.5
2.0
2.5
3.0
3.5
Est
on
iaIc
elan
dK
ore
aTu
rke
yN
orw
ayC
an
ad
aM
exi
coU
nit
ed
Kin
gd
om
Fin
lan
dIt
aly
Swe
de
nJa
pan
Net
herl
and
sU
nit
ed
Sta
tes
Slo
ven
iaG
reec
eSw
itze
rlan
dIr
ela
nd
Au
stra
liaO
EC
D a
vera
ge
Po
lan
dSp
ain
Cze
ch R
ep
ub
licP
ort
uga
lA
ust
ria
Den
mar
kC
hile
Lux
em
bo
urg
Ge
rma
ny
Be
lgiu
mIs
rae
lFr
ance
Ne
w Z
eal
an
dH
un
gary
Slo
vak
Re
pu
blic
Ratio
Increased likelihood of students in the bottom quarter of the ESCS index scoring in the bottom quarter of the mathematicsperformance distribution
Increased likelihood of immigrant students scoring in the bottom quarter of the mathematics performance distribution
Students from disadvantaged or diverse backgrounds face higher risk of low performance (PISA)
Source: OECD, PISA 2012 Database, Table II.2.4a and Table II.3.4a.
Finland: National Core
Curriculum for Instruction Preparing Immigrants for Basic
Education (2009)
France/Portugal:
Education Priority Zones
Chile: Law on Preferential
Subsidies (2008)
Germany:
National Action Plan on Integration (2011)
UK England:
Pupil premium
2121 Align the resources with the challenges
Hong Kong-China
Brazil
Uruguay
Croatia
Latvia
Chinese Taipei
Thailand
Bulgaria
Jordan
Macao-China
UAE
Argentina
Indonesia
Kazakhstan
Peru
Costa RicaMontenegro
Tunisia
Qatar
Singapore
Colombia
MalaysiaSerbia
Romania
Viet Nam
Shanghai-China
USA
Poland
New Zealand
Greece
UK
Estonia
Finland
Slovak Rep.
Luxembourg
Germany
AustriaFrance
Japan
TurkeySweden Hungary
AustraliaIsrael
Canada
Ireland
Chile
Belgium
SpainDenmark
Switzerland
Iceland
Slovenia
PortugalNorway
Mexico
Korea
Italy
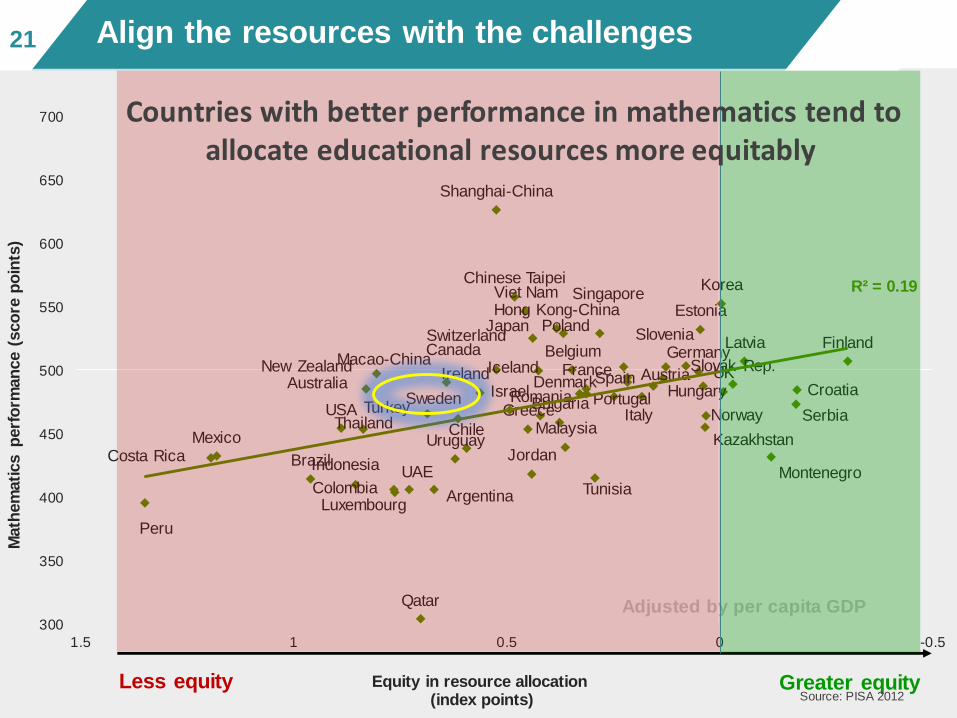
R² = 0.19
300
350
400
450
500
550
600
650
700
-0.500.511.5
Math
em
ati
cs p
erf
orm
an
ce (
sco
re p
oin
ts)
Equity in resource allocation(index points)
Greater equityLess equity
Adjusted by per capita GDP
Countries with better performance in mathematics tend to allocate educational resources more equitably
Source: PISA 2012
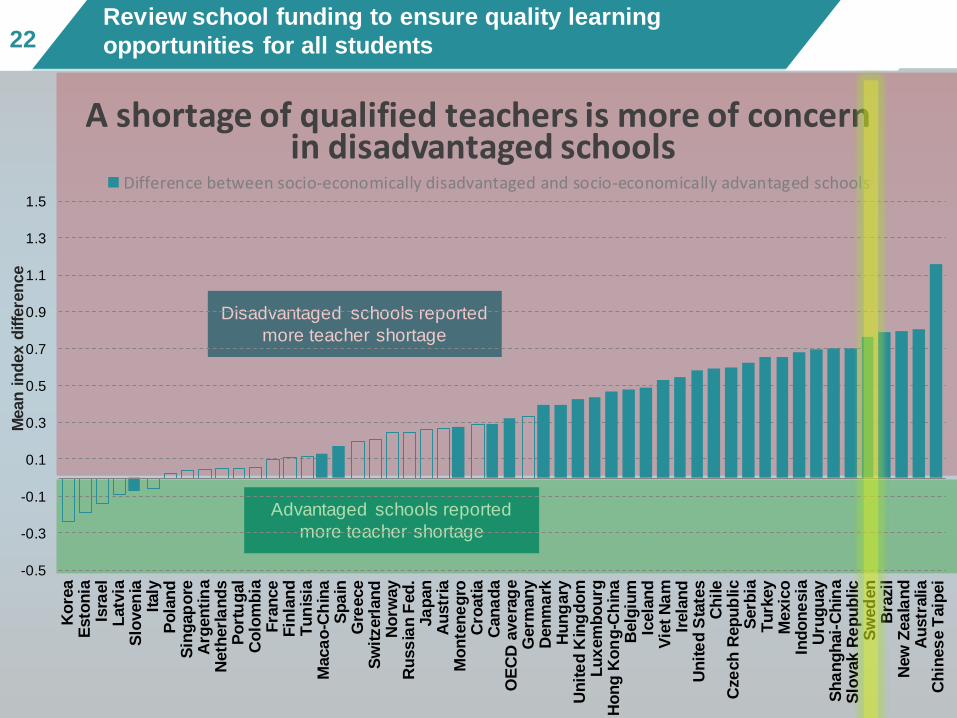
2222Review school funding to ensure quality learning
opportunities for all students
Disadvantaged schools reported
more teacher shortage
Advantaged schools reported
more teacher shortage
-0.5
-0.3
-0.1
0.1
0.3
0.5
0.7
0.9
1.1
1.3
1.5
Ko
rea
Esto
nia
Isra
el
Latv
iaS
loven
iaIt
aly
Po
lan
dS
ing
ap
ore
Arg
en
tin
aN
eth
erl
an
ds
Po
rtu
gal
Co
lom
bia
Fra
nce
Fin
lan
dT
un
isia
Maca
o-C
hin
aS
pa
inG
reece
Sw
itzerl
an
dN
orw
ay
Ru
ss
ian
Fed
.Ja
pan
Au
str
iaM
on
ten
eg
roC
roati
aC
an
ad
aO
EC
D a
ve
rag
eG
erm
an
yD
en
ma
rkH
un
gary
Un
ite
d K
ing
do
mL
ux
em
bo
urg
Ho
ng
Ko
ng
-Ch
ina
Belg
ium
Icela
nd
Vie
t N
am
Irela
nd
Un
ite
d S
tate
sC
hile
Cze
ch
Rep
ub
lic
Serb
iaT
urk
ey
Mexic
oIn
do
ne
sia
Uru
gu
ay
Sh
an
gh
ai-
Ch
ina
Slo
vak
Re
pu
blic
Sw
ed
en
Bra
zil
New
Zea
lan
dA
ustr
alia
Ch
ines
e T
aip
ei
Mean
in
dex d
iffe
ren
ce
Difference between socio-economically disadvantaged and socio-economically advantaged schools
A shortage of qualified teachers is more of concernin disadvantaged schools

Mean mathematics performance, by school location,
after accounting for socio-economic statusFig II.3.323 Revise school choice arrangements to ensure quality with equity23
Australia
Austria
Belgium
Canada
Chile
Czech Rep.
Denmark
Estonia
Finland
GermanyGreece
Hungary
Iceland
Ireland
Israel
ItalyJapanKorea
Luxembourg
Mexico
Netherlands
New Zealand
Norway
Poland
Portugal
Slovak Rep.
SloveniaSpain
Sweden
Switzerland
Turkey
UK
USA
R² = 0.1735
30 40 50 60 70 80 90 100
School competition
Low levels of competition among schools, high levels of social inclusion
Mo
re
soci
al
incl
usi
on
Less
soci
al
incl
usi
on
%
School competition and social inclusion, PISA 2012
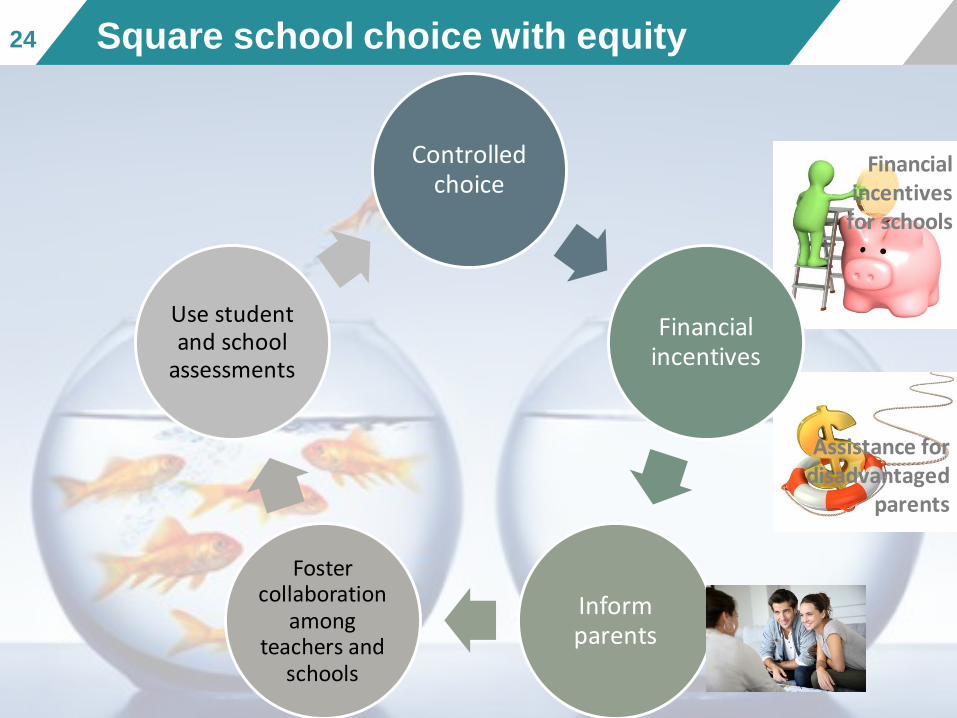
24
24
24 Square school choice with equity
Financial incentives
for schools
Assistance for disadvantaged
parents
Controlled choice
Financial incentives
Inform parents
Foster collaboration
among teachers and
schools
Use student and school
assessments

2525Poverty isn’t destinyPISA performance by decile of social background
300
325
350
375
400
425
450
475
500
525
550
575
600
625
650
675
Mexic
oChile
Gre
ece
Norw
ay
Sw
eden
Icela
nd
Isra
el
Italy
United S
tate
sSpain
Denm
ark
Luxem
bourg
Aust
ralia
Irela
nd
United K
ingdom
Hungary
Canada
Fin
land
Aust
ria
Turk
ey
Lie
chte
nst
ein
Cze
ch R
epublic
Est
onia
Port
ugal
Slo
venia
Slo
vak R
epublic
New
Zeala
nd
Germ
any
Neth
erlands
Fra
nce
Sw
itze
rland
Pola
nd
Belg
ium
Japan
Maca
o-C
hin
aH
ong K
ong-C
hin
aKore
aSin
gapore
Chin
ese
Taip
ei
Shanghai-Chin
a
Source: PISA 2012
Mean mathematics performance, by school location,
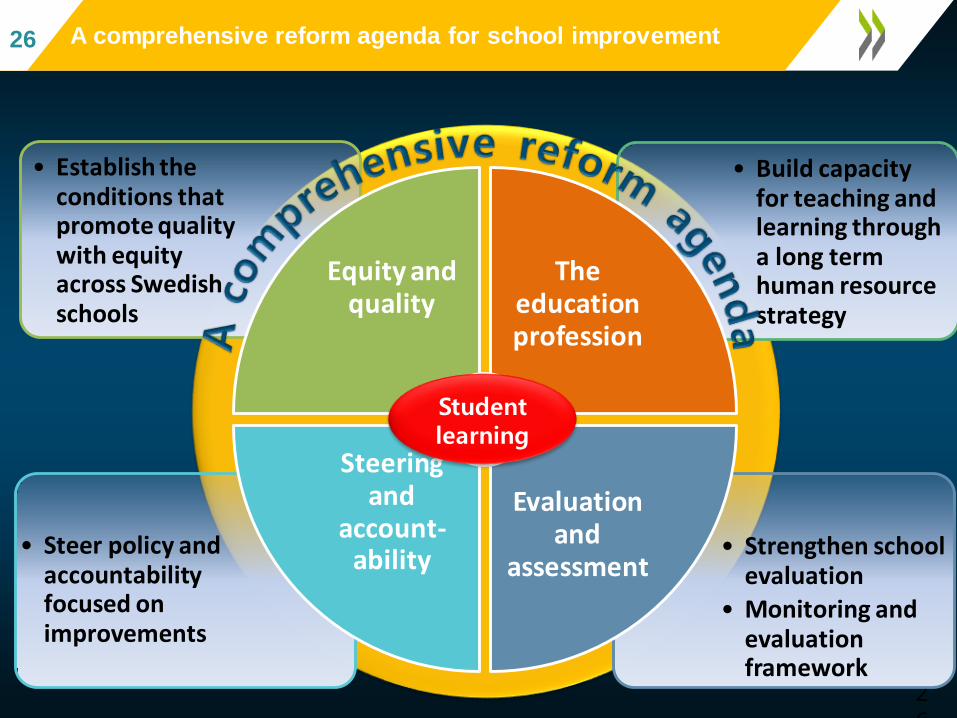
after accounting for socio-economic statusFig II.3.326 A comprehensive reform agenda for school improvement26
26
• Strengthen school evaluation
• Monitoring and evaluation framework
• Steer policy and accountability focused on improvements
• Build capacity for teaching and learning through a long term human resource strategy
• Establish the conditions that promote quality with equity across Swedish schools
Equity and quality
The education profession
Evaluation and
assessment
Steering and
account-ability
Student learning
Mean mathematics performance, by school location,
after accounting for socio-economic statusFig II.3.327 A comprehensive reform agenda for school improvement27
27
• Strengthen school evaluation
• Monitoring and evaluation framework
• Steer policy and accountability focused on improvements
• Build capacity for teaching and learning through a long term human resource strategy
• Establish the conditions that promote quality with equity across Swedish schools
Equity and quality
The education profession
Evaluation and
assessment
Steering and
account-ability
Student learning
Mean mathematics performance, by school location,
after accounting for socio-economic statusFig II.3.328
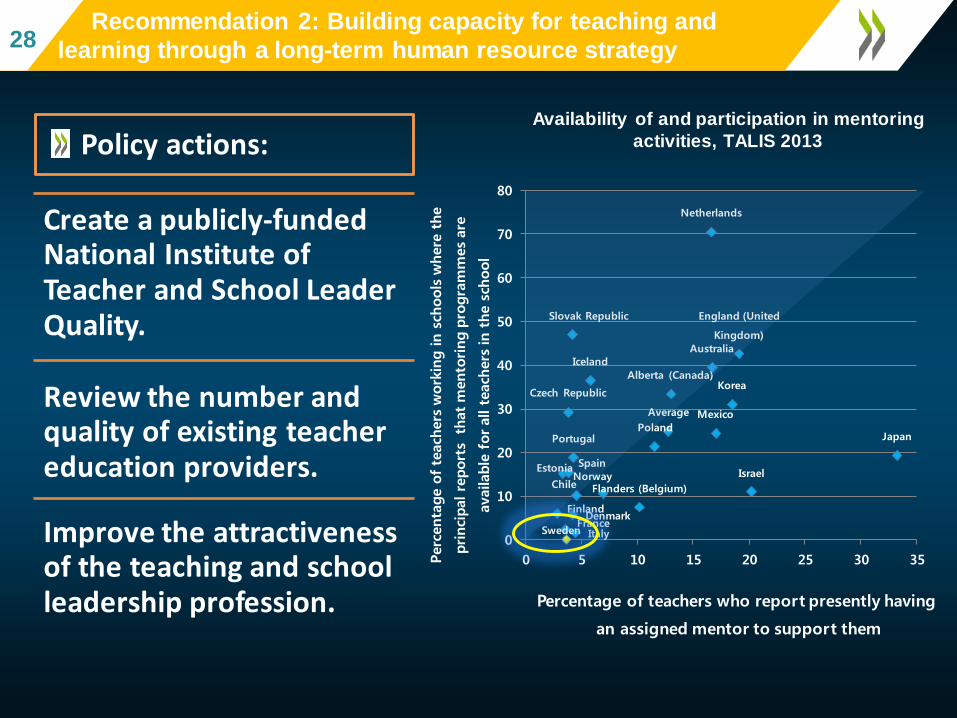
Recommendation 2: Building capacity for teaching and
learning through a long-term human resource strategy28
Create a publicly-funded National Institute of Teacher and School Leader Quality.
Review the number and quality of existing teacher education providers.
Improve the attractiveness of the teaching and school leadership profession.
Netherlands
Slovak Republic
Iceland
Czech Republic
England (United
Kingdom)
Australia
Alberta (Canada)
Portugal
Korea
Average
Estonia Spain
Poland
Mexico
ChileNorway
FinlandDenmark
France
Flanders (Belgium)
ItalySweden
Israel
Japan
0
10
20
30
40
50
60
70
80
0 5 10 15 20 25 30 35Perc
enta
ge o
f te
ach
ers
work
ing in s
chools
where
the
princi
pal re
port
s t
hat m
ento
ring p
rogra
mm
es
are
available
for all t
each
ers
in t
he s
chool
Percentage of teachers who report presently having
an assigned mentor to support them
Policy actions:Availability of and participation in mentoring
activities, TALIS 2013
Mean mathematics performance, by school location,
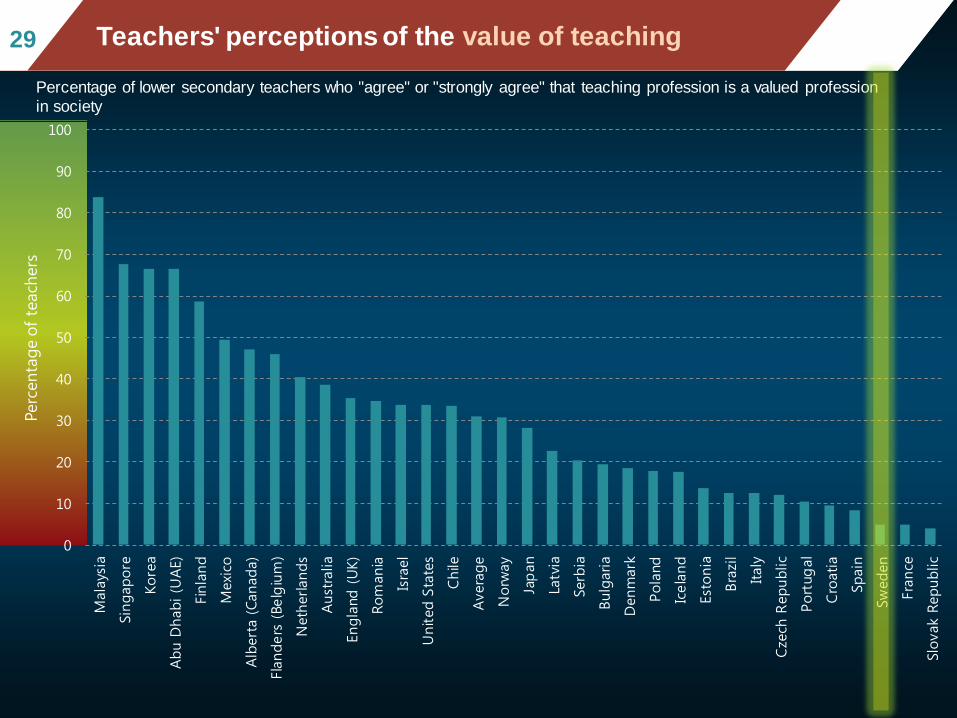
after accounting for socio-economic statusFig II.3.32929 Teachers' perceptions of the value of teaching
Percentage of lower secondary teachers who "agree" or "strongly agree" that teaching profession is a valued profession
in society
0
10
20
30
40
50
60
70
80
90
100
Mala
ysia
Sin
gapore
Kore
a
Abu D
habi (U
AE)
Fin
land
Mexi
co
Alb
ert
a (Canada)
Fla
nders
(Belg
ium
)
Neth
erlands
Aust
ralia
Engla
nd (UK)
Rom
ania
Isra
el
United S
tate
s
Chile
Avera
ge
Norw
ay
Japan
Latv
ia
Serb
ia
Bulg
aria
Denm
ark
Pola
nd
Icela
nd
Est
onia
Bra
zil
Italy
Cze
ch R
epublic
Port
ugal
Cro
atia
Spain
Sw
eden
Fra
nce
Slo
vak
Republic
Perc
enta
ge o
f te
ach
ers
Mean mathematics performance, by school location,
after accounting for socio-economic statusFig II.3.33030
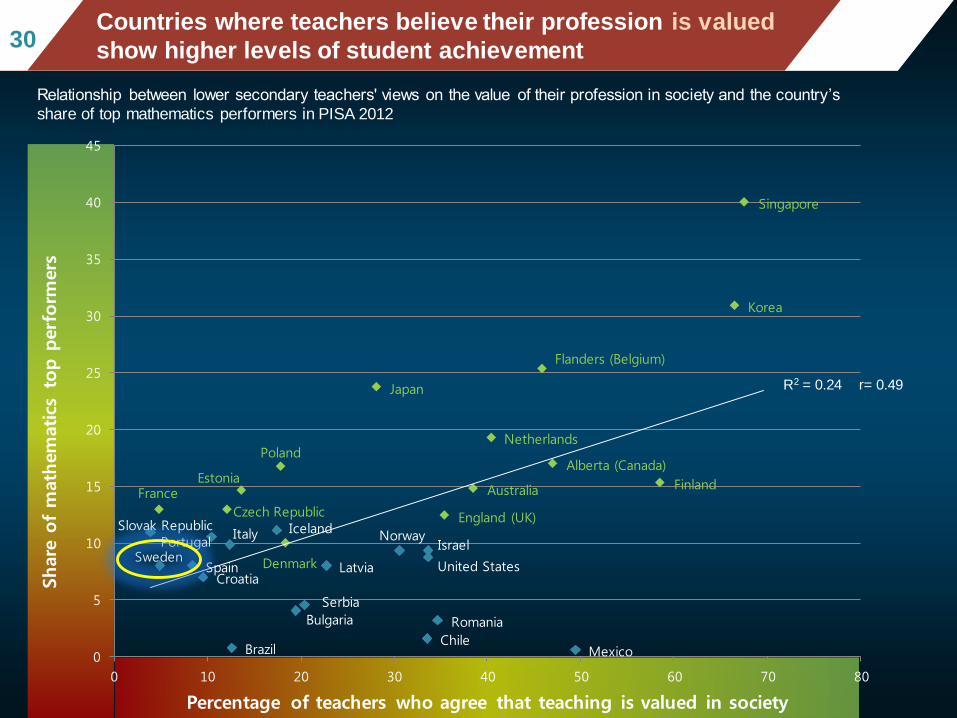
Countries where teachers believe their profession is valued
show higher levels of student achievement
Relationship between lower secondary teachers' views on the value of their profession in society and the country’s
share of top mathematics performers in PISA 2012
Australia
Brazil
Bulgaria
Chile
Croatia
Czech Republic
Denmark
Estonia FinlandFrance
IcelandIsrael
Italy
Japan
Korea
Latvia
Mexico
Netherlands
Norway
Poland
Portugal
Romania
Serbia
Singapore
Slovak Republic
SpainSweden
Alberta (Canada)
England (UK)
Flanders (Belgium)
United States
0
5
10
15
20
25
30
35
40
45
0 10 20 30 40 50 60 70 80
Share
of
math
em
atics
to
p p
erf
orm
ers
Percentage of teachers who agree that teaching is valued in society
R2 = 0.24 r= 0.49

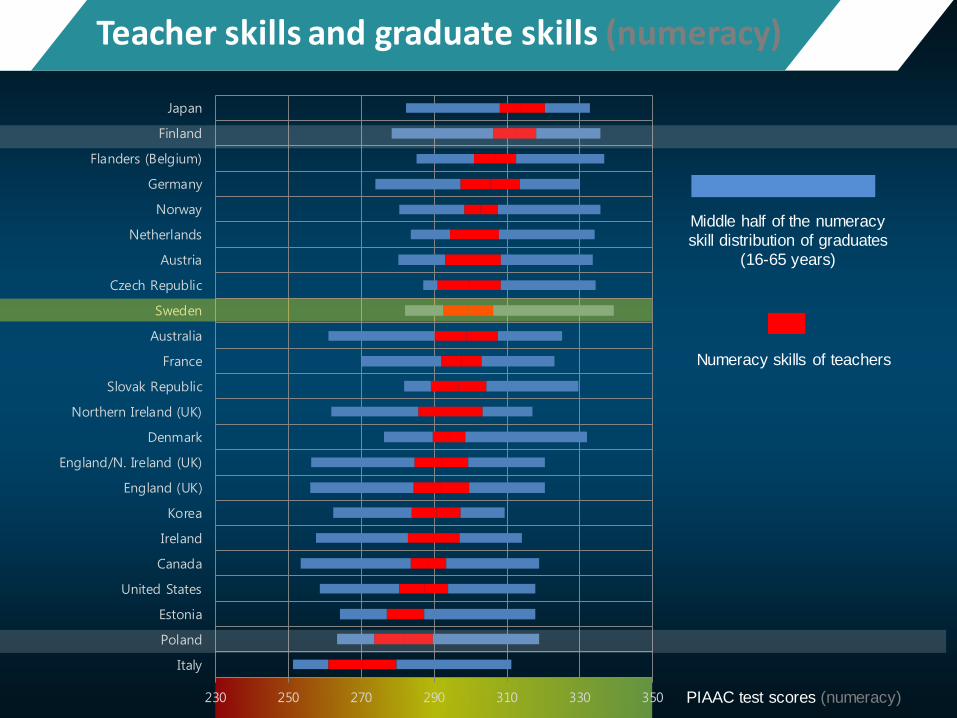
Teacher skills and graduate skills (numeracy)
230 250 270 290 310 330 350
Italy
Poland
Estonia
United States
Canada
Ireland
Korea
England (UK)
England/N. Ireland (UK)
Denmark
Northern Ireland (UK)
Slovak Republic
France
Australia
Sweden
Czech Republic
Austria
Netherlands
Norway
Germany
Flanders (Belgium)
Finland
Japan
Middle half of the numeracy
skill distribution of graduates
(16-65 years)
PIAAC test scores (numeracy)
Teacher skills and graduate skills (numeracy)
230 250 270 290 310 330 350
Italy
Poland
Estonia
United States
Canada
Ireland
Korea
England (UK)
England/N. Ireland (UK)
Denmark
Northern Ireland (UK)
Slovak Republic
France
Australia
Sweden
Czech Republic
Austria
Netherlands
Norway
Germany
Flanders (Belgium)
Finland
Japan
Middle half of the numeracy
skill distribution of graduates
(16-65 years)
Numeracy skills of teachers
PIAAC test scores (numeracy)
0
10
20
30
40
50
60
70
80
90
100D
iscuss
indiv
idual
students
Share
reso
urc
es
Team
confe
rence
s
Colla
bora
te f
or
com
mon
standard
s
Team
teac
hin
g
Colla
bora
tive
PD
Join
t act
ivitie
s
Cla
ssro
om
obse
rvations
Perc
enta
ge o
f te
ach
ers
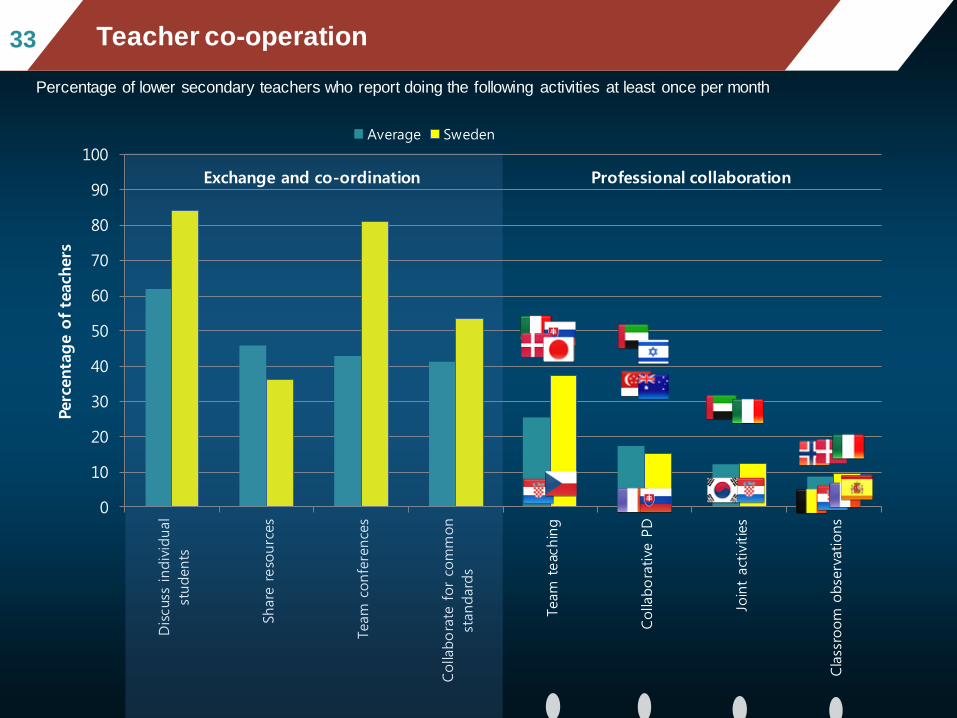
Average Sweden
Professional collaboration
Percentage of lower secondary teachers who report doing the following activities at least once per month
Teacher co-operation33
Exchange and co-ordination
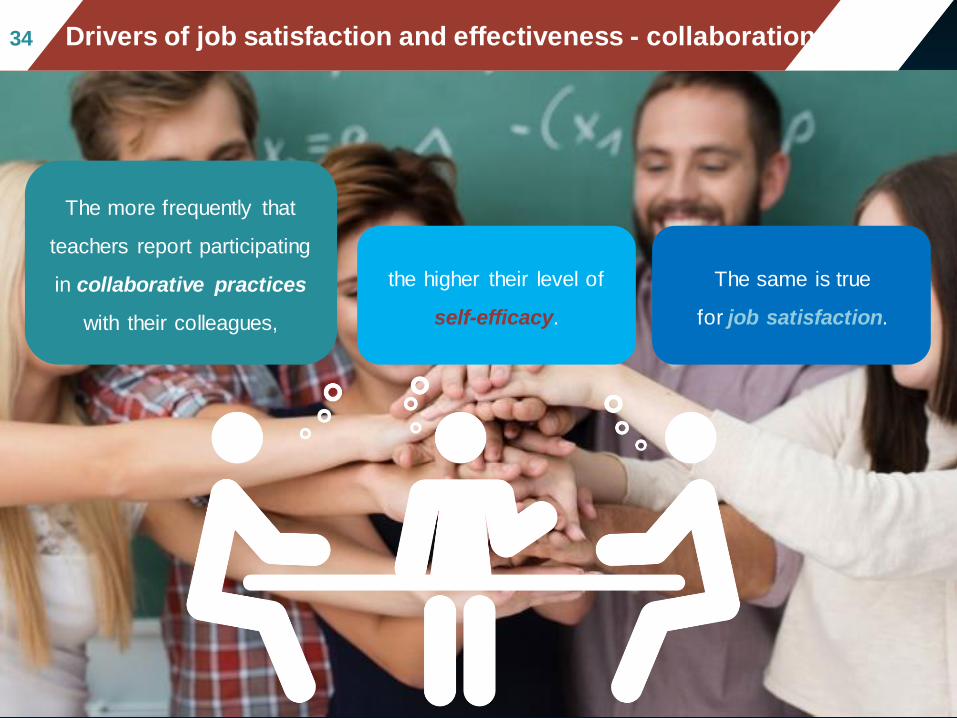
The more frequently that
teachers report participating
in collaborative practices
with their colleagues,
the higher their level of
self-efficacy.
The same is true
for job satisfaction.
Mean mathematics performance, by school location, after acc
ounting for socio-economic statusFig II.3.33434 Drivers of job satisfaction and effectiveness - collaboration

Mean mathematics performance, by school location,
after accounting for socio-economic statusFig II.3.33535 Teachers Self-Efficacy and Professional Collaboration
11.40
11.60
11.80
12.00
12.20
12.40
12.60
12.80
13.00
13.20
13.40
Never
Once a
year
or
less
2-4
tim
es
a y
ear
5-1
0 t
imes
a y
ear
1-3
tim
es
a m
onth
Once a
week o
r m
ore
Teach
er
self-e
ffic
acy
(le
vel)
Teach jointly as a
team in the same
class
Observe other
teachers’ classes and
provide feedback
Engage in joint
activities across
different classes
Take part in
collaborative
professional learning
Less frequently
Morefrequently
Mean mathematics performance, by school location,
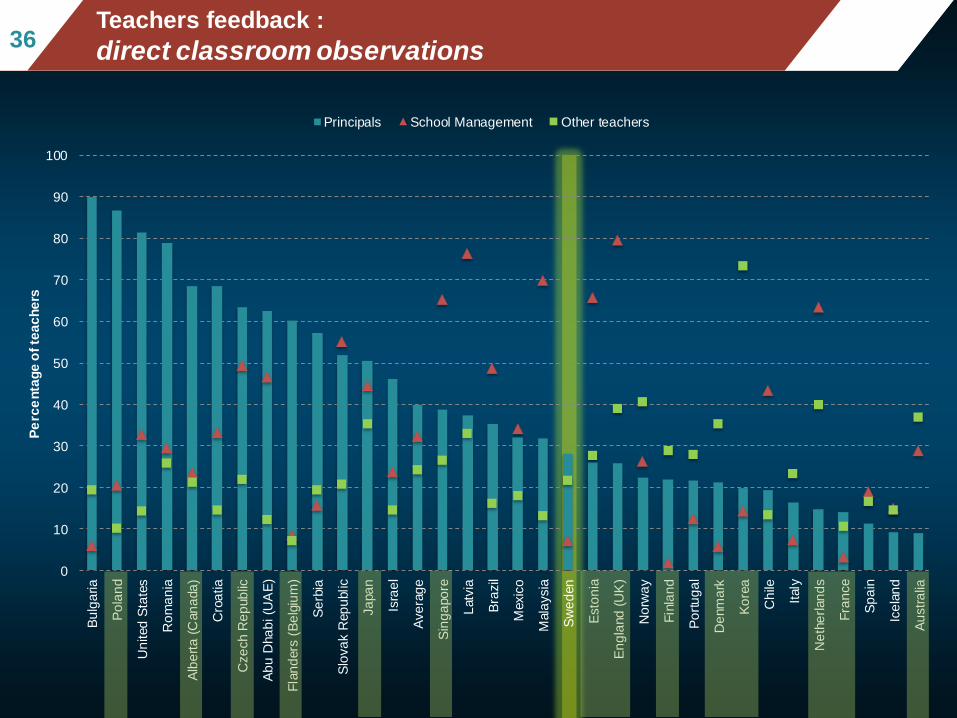
after accounting for socio-economic statusFig II.3.33636
Teachers feedback :
direct classroom observations
0
10
20
30
40
50
60
70
80
90
100
Bu
lga
ria
Po
lan
d
Un
ited
Sta
tes
Ro
ma
nia
Alb
ert
a (
Can
ada
)
Cro
atia
Cze
ch R
ep
ub
lic
Ab
u D
ha
bi (U
AE
)
Fla
nd
ers
(B
elg
ium
)
Se
rbia
Slo
va
k R
ep
ublic
Ja
pa
n
Isra
el
Ave
rag
e
Sin
ga
po
re
Latv
ia
Bra
zil
Mexic
o
Mala
ysia
Sw
ed
en
Esto
nia
En
gla
nd
(U
K)
No
rwa
y
Fin
lan
d
Po
rtu
ga
l
De
nm
ark
Ko
rea
Ch
ile
Italy
Ne
the
rlan
ds
Fra
nce
Sp
ain
Ice
lan
d
Au
str
alia
Pe
rce
nta
ge
of
tea
ch
ers
Principals School Management Other teachers
Mean mathematics performance, by school location, after acc
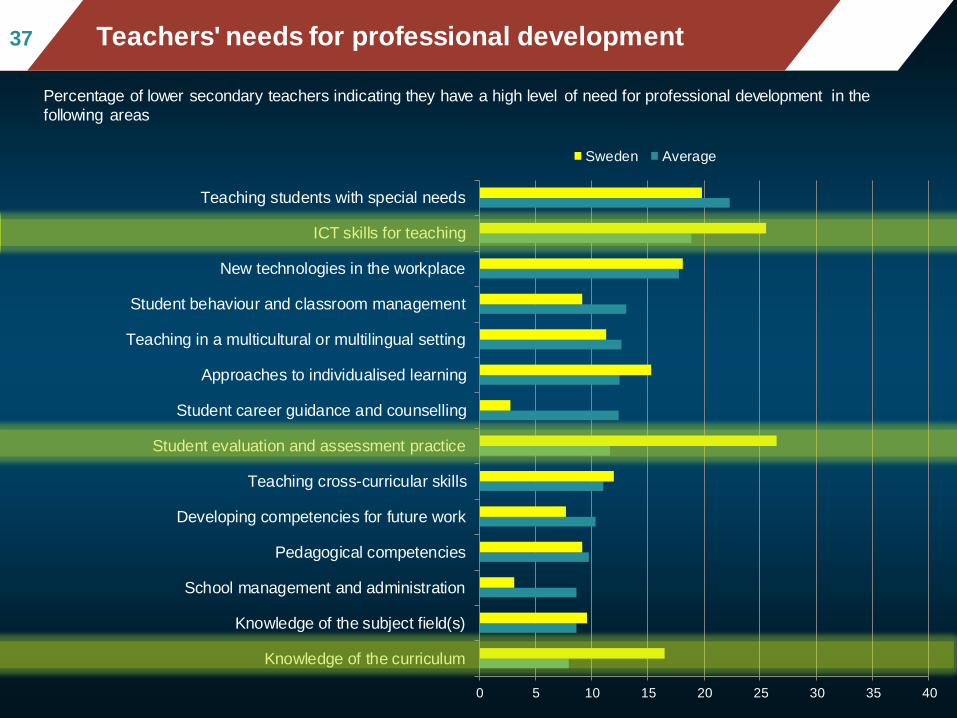
ounting for socio-economic statusFig II.3.33737 Teachers' needs for professional development
Percentage of lower secondary teachers indicating they have a high level of need for professional development in the
following areas
0 5 10 15 20 25 30 35 40
Knowledge of the curriculum
Knowledge of the subject field(s)
School management and administration
Pedagogical competencies
Developing competencies for future work
Teaching cross-curricular skills
Student evaluation and assessment practice
Student career guidance and counselling
Approaches to individualised learning
Teaching in a multicultural or multilingual setting
Student behaviour and classroom management
New technologies in the workplace
ICT skills for teaching
Teaching students with special needs
Sweden Average
Mean mathematics performance, by school location, after acc
ounting for socio-economic statusFig II.3.33838 Impact of professional development
…the professional development
in which they have participated
has had a positive impact on
their teaching.
·
Regardless of the
content, over 3/4 of
teachers report that…
Mean mathematics performance, by school location,
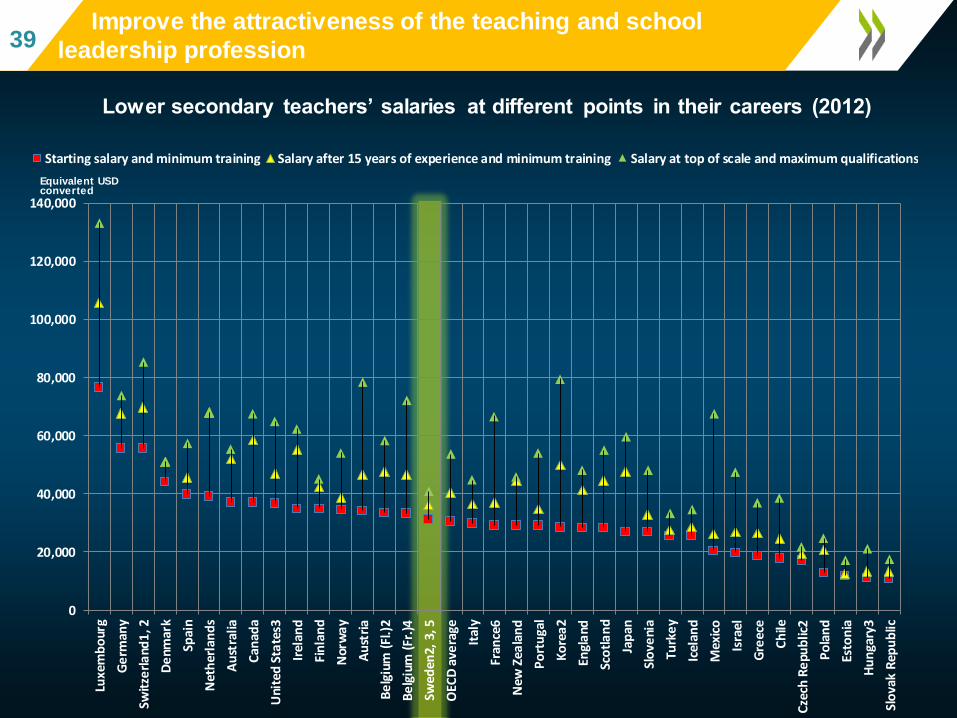
after accounting for socio-economic statusFig II.3.339
Improve the attractiveness of the teaching and school
leadership profession39
0
20,000
40,000
60,000
80,000
100,000
120,000
140,000
Luxe
mb
our
g
Ge
rman
y
Swit
zerl
and
1, 2
De
nmar
k
Spai
n
Net
her
lan
ds
Au
stra
lia
Can
ada
Uni
ted
Sta
tes3
Irel
and
Fin
lan
d
Nor
wa
y
Au
stri
a
Be
lgiu
m (
Fl.)
2
Be
lgiu
m (
Fr.)
4
Swed
en2,
3, 5
OEC
D a
vera
ge
Ital
y
Fran
ce6
New
Zea
lan
d
Po
rtu
gal
Ko
rea
2
Engl
and
Sco
tla
nd
Jap
an
Slo
veni
a
Turk
ey
Icel
and
Mex
ico
Isra
el
Gre
ece
Ch
ile
Cze
ch R
epu
blic
2
Po
lan
d
Esto
nia
Hu
nga
ry3
Slo
vak
Rep
ub
lic
Starting salary and minimum training Salary after 15 years of experience and minimum training Salary at top of scale and maximum qualifications
Equivalent USD converted
Lower secondary teachers’ salaries at different points in their careers (2012)
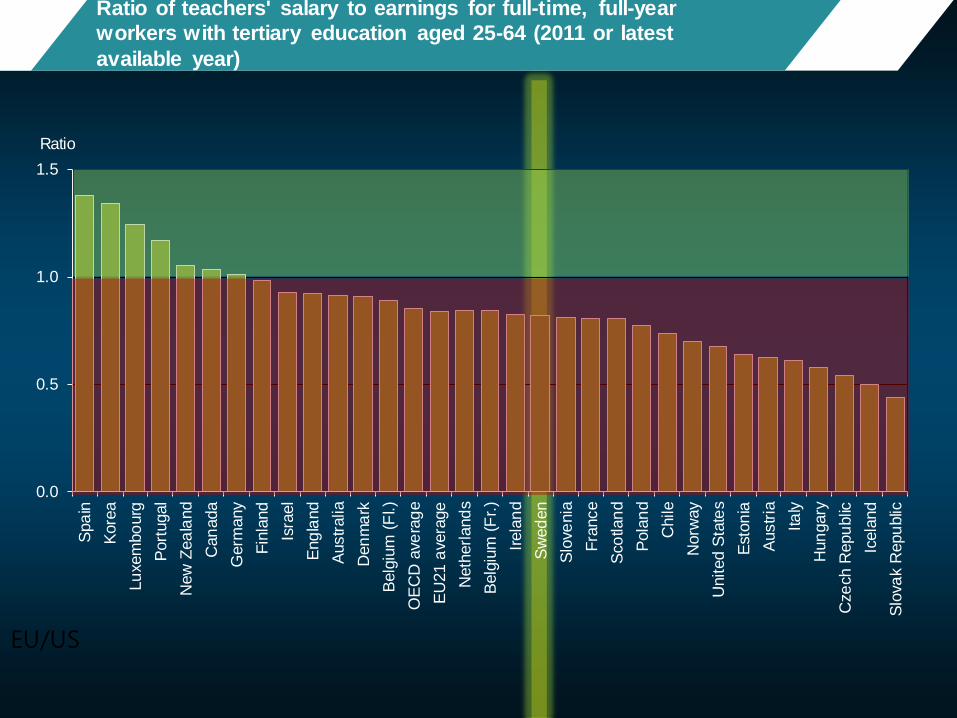
Ratio of teachers' salary to earnings for full-time, full-year
workers with tertiary education aged 25-64 (2011 or latest
available year)
0.0
0.5
1.0
1.5
Spa
in
Kore
a
Lu
xem
bo
urg
Port
ugal
New
Zea
land
Can
ada
Germ
any
Fin
land
Isra
el
Eng
land
Austr
alia
Den
ma
rk
Belg
ium
(F
l.)
OE
CD
ave
rag
e
EU
21
avera
ge
Neth
erl
and
s
Belg
ium
(F
r.)
Irela
nd
Sw
ed
en
Slo
ve
nia
Fra
nce
Sco
tlan
d
Pola
nd
Chile
Norw
ay
United S
tate
s
Esto
nia
Austr
ia
Ita
ly
Hun
gary
Cze
ch R
epu
blic
Icela
nd
Slo
va
k R
epu
blic
Ratio
EU/US
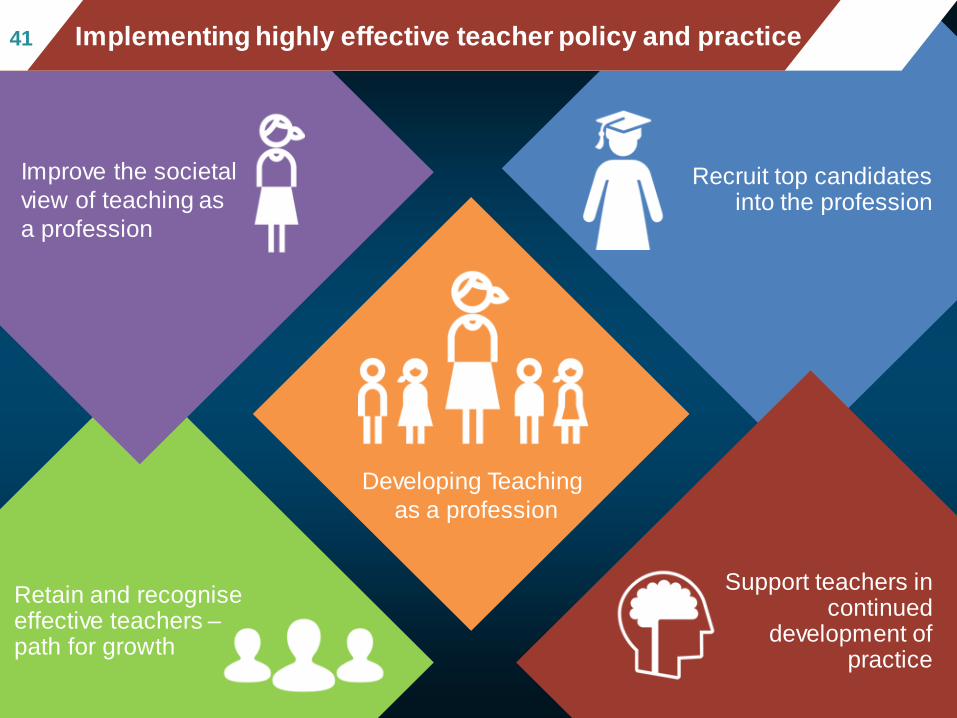
Developing Teaching
as a profession
Recruit top candidates into the profession
Support teachers in continued
development of practice
Retain and recognise effective teachers –path for growth
Improve the societal
view of teaching as
a profession
Mean mathematics performance, by school location, after acc
ounting for socio-economic status4141 Implementing highly effective teacher policy and practice

Mean mathematics performance, by school location,
after accounting for socio-economic statusFig II.3.342 A comprehensive reform agenda for school improvement42
42
• Strengthen school evaluation
• Monitoring and evaluation framework
• Steer policy and accountability focused on improvements
• Build capacity for teaching and learning through a long term human resource strategy
• Establish the conditions that promote quality with equity across Swedish schools
Equity and quality
The education profession
Evaluation and
assessment
Steering and
account-ability
Student learning

Mean mathematics performance, by school location,
after accounting for socio-economic statusFig II.3.343 A comprehensive reform agenda for school improvement43
43
• Strengthen school evaluation
• Monitoring and evaluation framework
• Steer policy and accountability focused on improvements
• Build capacity for teaching and learning through a long term human resource strategy
• Establish the conditions that promote quality with equity across Swedish schools
Equity and quality
The education profession
Evaluation and
assessment
Steering and
Account-ability
Student learning
Mean mathematics performance, by school location,
after accounting for socio-economic statusFig II.3.344
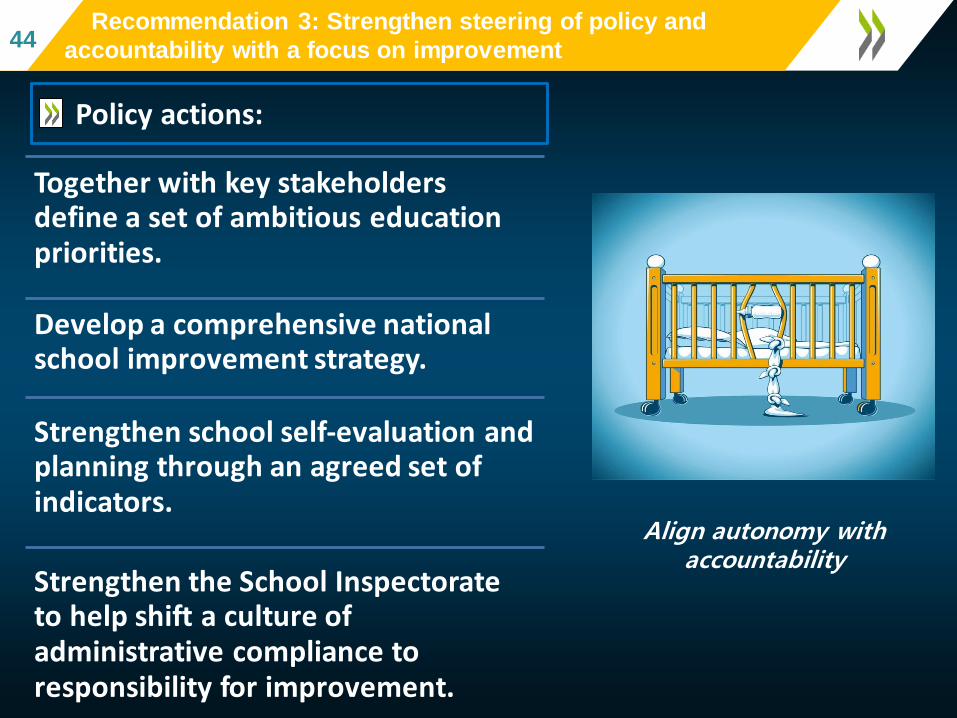
Recommendation 3: Strengthen steering of policy and
accountability with a focus on improvement44
Together with key stakeholders define a set of ambitious education priorities.
Develop a comprehensive national school improvement strategy.
Strengthen school self-evaluation and planning through an agreed set of indicators.
Strengthen the School Inspectorate to help shift a culture of administrative compliance to responsibility for improvement.
Align autonomy with accountability
Policy actions:

4545Lessons f
rom
hig
h p
erf
orm
ers
45
45 Align autonomy with accountability
The question is not how many charter schools you have but how you enable every teacher to assume charter-like autonomy
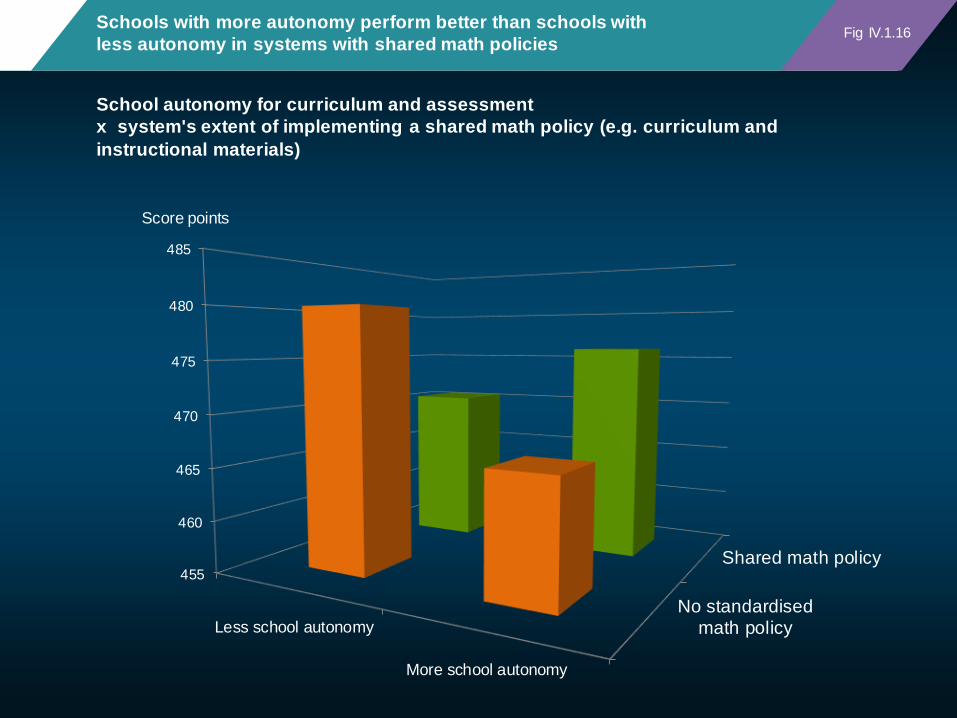
No standardised
math policy
Shared math policy455
460
465
470
475
480
485
Less school autonomy
More school autonomy
Schools with more autonomy perform better than schools with
less autonomy in systems with shared math policies
Score points
School autonomy for curriculum and assessment
x system's extent of implementing a shared math policy (e.g. curriculum and
instructional materials)
Fig IV.1.16
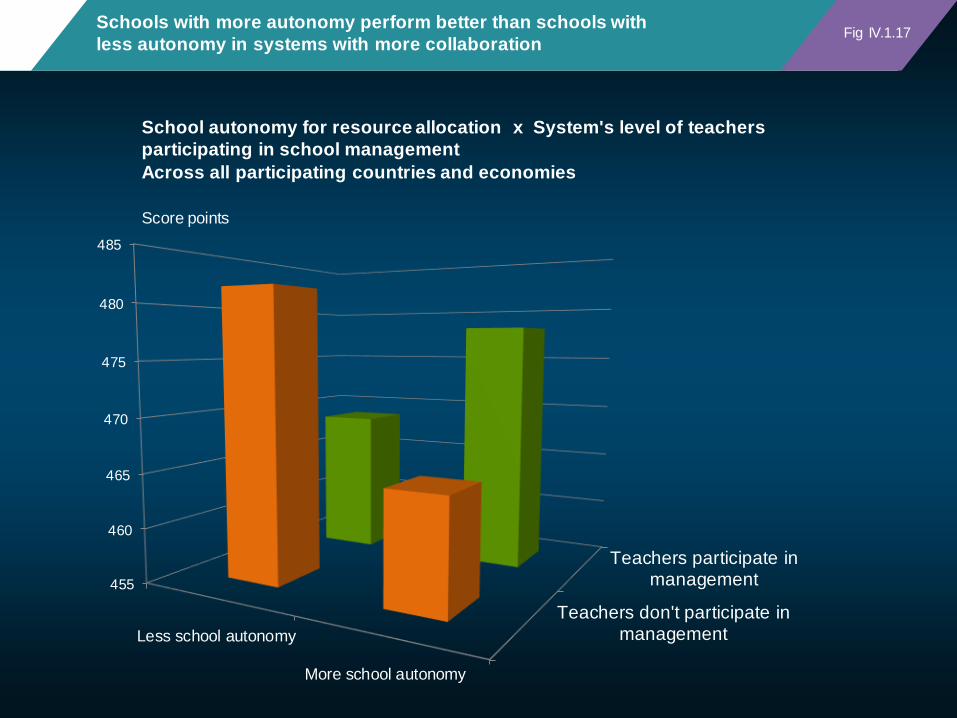
Schools with more autonomy perform better than schools with
less autonomy in systems with more collaboration
Teachers don't participate in
management
Teachers participate in
management455
460
465
470
475
480
485
Less school autonomy
More school autonomy
Score points
School autonomy for resource allocation x System's level of teachers
participating in school management
Across all participating countries and economies
Fig IV.1.17
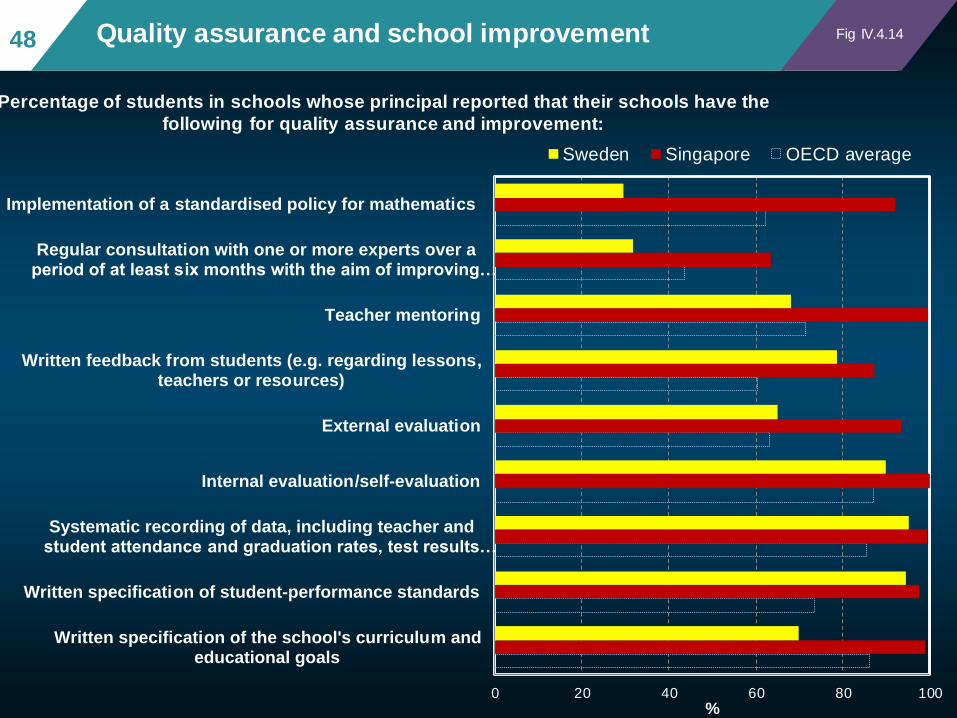
0 20 40 60 80 100
Written specification of the school's curriculum andeducational goals
Written specification of student-performance standards
Systematic recording of data, including teacher andstudent attendance and graduation rates, test results…
Internal evaluation/self-evaluation
External evaluation
Written feedback from students (e.g. regarding lessons,teachers or resources)
Teacher mentoring
Regular consultation with one or more experts over aperiod of at least six months with the aim of improving…
Implementation of a standardised policy for mathematics
%
Percentage of students in schools whose principal reported that their schools have the
following for quality assurance and improvement:
Sweden Singapore OECD average
Quality assurance and school improvement Fig IV.4.1448

0
10
20
30
40
50
60
70
80
90
100
OEC
D
Gre
ece
10
0
Por
tuga
l 10
0
Net
herl
and
s 9
9
Pol
and
99
Fran
ce 9
7
Bel
giu
m 9
7
Ger
man
y 9
6
Can
ada
10
0
Spai
n 9
9
Aus
tria
96
Luxe
mbo
urg
95
Slo
vak
Rep
ub
lic…
Fin
lan
d 9
9
Slo
ven
ia 9
8
Me
xico
99
Jap
an 9
9
Ch
ile 1
00
Ital
y 9
9
Swit
zerl
and
94
Esto
nia
99
Isra
el 1
00
Cze
ch R
epu
blic
93
New
Zea
land
10
0
OEC
D a
vera
ge 9
8
Hu
nga
ry
94
Uni
ted
Kin
gdom
…
Aus
tral
ia
10
0
Irel
and
1
00
Uni
ted
Sta
tes
9
9
Kor
ea
95
Turk
ey
9
7
Swed
en
94
Ice
lan
d
10
0
De
nmar
k
99
No
rway
9
8
%
To make decisions about students’ retention or promotion %To monitor the school’s progress from year to yearTo identify aspects of instruction or the curriculum that could be improved
→
Source: OECD, PISA 2012 Database, Table IV.5.5. OECD, PISA 2012 Database, Table IV.5.6.
Most common uses of student assessments according to school principals (2012)
Mean mathematics performance, by school location,
after accounting for socio-economic statusFig II.3.34949
Enhancing evaluation and assessment to improve student outcomes
Australia: NAPLAN Student assessment,
My School, My Skills and
My University
Chile: National Quality of Education Agency
National Standardised Assessments: Austria; Czech Republic; Denmark; Ireland;
Italy, Spain, Sweden, UK (Wales)
Norway: Assessment for Learning (2010)

0
10
20
30
40
50
60
70
80
90
100
Neth
erl
and
sC
roatia
Hon
g K
ong-C
hin
aJa
pan
Tha
ilan
dS
erb
iaV
iet N
am
Hun
gary
Sin
ga
pore
Bulg
aria
Lie
chte
nste
inM
aca
o-C
hin
aS
witz
erla
nd
Lu
xem
bo
urg
Austr
iaU
.A.E
.K
ore
aIn
don
esia
Ita
lyG
erm
any
Alb
an
iaM
onte
negro
New
Zea
land
Cze
ch R
epu
blic
Isra
el
Mala
ysia
Slo
va
k R
epu
blic
Sha
ngha
i-C
hin
aC
osta
Ric
aM
exic
oT
un
isia
Qata
rC
hin
ese T
aip
ei
Kazakh
sta
nA
ustr
alia
OE
CD
ave
rag
eT
urk
ey
Colo
mbia
Can
ada
Chile
Esto
nia
Port
ugal
Jo
rda
nU
nited S
tate
sR
om
an
iaF
rance
Peru
Slo
ve
nia
La
tvia
United K
ingdo
mU
rugua
yB
elg
ium
Irela
nd
Russia
n F
ed
.Ic
ela
nd
Bra
zil
Lithuan
iaP
ola
nd
Arg
entina
Den
ma
rkS
wed
en
Gre
ece
Norw
ay
Spa
inF
inla
nd
%
Students in schools whose principals reported that "students' records of academic
performance" or "recommendations of feeder schools" is always considered for admission
Most schools look at students’ past academic performance when
considering admissionFig IV.1.6
B
Mean mathematics performance, by school location,
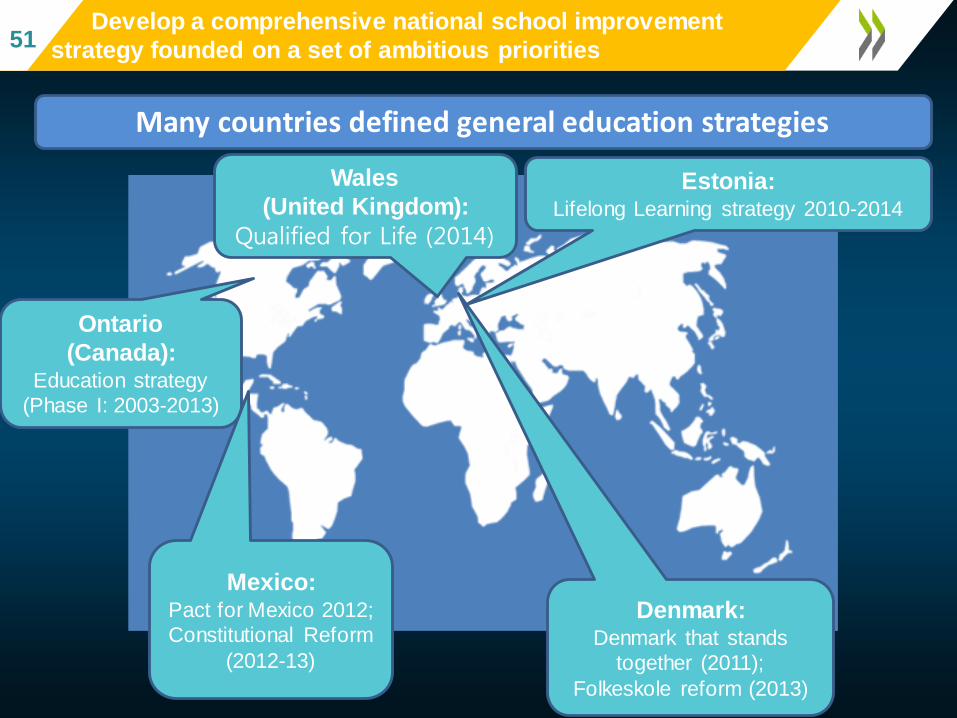
after accounting for socio-economic statusFig II.3.351
Develop a comprehensive national school improvement
strategy founded on a set of ambitious priorities51
Increasingly complex policy-making environmentsMany countries defined general education strategies
Ontario
(Canada):Education strategy
(Phase I: 2003-2013)
Estonia:Lifelong Learning strategy 2010-2014
Denmark:Denmark that stands
together (2011);
Folkeskole reform (2013)
Mexico:Pact for Mexico 2012;
Constitutional Reform
(2012-13)
Wales
(United Kingdom):
Qualified for Life (2014)

Mean mathematics performance, by school location,
after accounting for socio-economic statusFig II.3.352 A comprehensive reform agenda for school improvement52
52
• Strengthen school evaluation
• Monitoring and evaluation framework
• Steer policy and accountability focused on improvements
• Build capacity for teaching and learning through a long term human resource strategy
• Establish the conditions that promote quality with equity across Swedish schools
Equity and quality
The education profession
Evaluation and
assessment
Steering and
account-ability
Student learning
Reforms that bypass
the classroom
Insufficient
investment in capacity
Insufficient attention
to context
53 Reform challenges
Focus on the
instructional core
Focus on leadership
and teacher capacity
Policy alignmentUnderstanding and
engaging stakeholders
54 Elements of success

5555Lessons f
rom
hig
h p
erf
orm
ers Some students learn at high levels All students need to learn at high levels
Student inclusion
Routine cognitive skills, rote learning Learning to learn, complex ways of thinking, ways of working
Curriculum, instruction and assessment
Few years more than secondary High-level professional knowledge workers
Teacher quality
‘Tayloristic’, hierarchical Flat, collegial
Work organisation
Primarily to authorities Primarily to peers and stakeholders
Accountability
What it all means
Average education systems High performers