Embed Size (px)
Citation preview
Improving reservoir geometry by integrating continuous wavelet transform seismic attributes Marcilio Castro de Matos, Sismo Research&Consulting and AASPI/OU, www.matos.eng.br , and
Oswaldo Davogustto*, Carlos Cabarcas and Kurt Marfurt, The University of Oklahoma, geology.ou.edu/aaspi
Summary
Seismic interpretation is highly dependent of the seismic
resolution. Sequence stratigraphy, fractures detection, faults
interpretation and channels delineation can be improved by
using better resolution seismic data. Considering spectral
decomposition a way increase seismic traces details, we
used complex continuous wavelet transform (CWT) ridges
to create a higher resolution traces and the CWT phase
interferences, or residues, to detect subtle seismic
discontinuities. By integrating these seismic attributes we
showed how to improve the understanding of reservoir
geometry. The technique was applied to real data and using
calibration wells we confirmed the effectiveness of the
proposed methodology.
Introduction
Signal spectrum has been used since the primordium of the
seismic acquisition for different purposes. Random and
coherent noise filtering, spectral balancing and seismic
wavelet shaping for deconvolution purposes are for
instance among Fourier frequency analysis applications.
By using a small time window around the target area,
Partyka et al. (1999) showed how spectral decomposition
can be used to detect thickness changes and proved to be an
important seismic interpretation tool. By using a running
window spectral analysis, also called Short-time Fourier
transform (STFT), we can extend the spectral analysis to
the whole cube, by adding a 4th dimension, frequency, to
the 3D seismic cube (Chopra and Marfurt, 2007). Actually,
instead of STFT, we can use any other time-frequency
decomposition, that converts seismic traces into 2D matrix
that expresses how signals vary jointly along time and
frequency. This redundant representation carries a lot of
information and it is very dependent on the technique
chosen. In this work, we use complex Continuous Wavelet
Transform (CWT). Using the CWT advantage to detect
transients, we used CWT spectral ridges to create a higher
time (depth) resolution seismic trace and the CWT phase
spectra to detect interferences between layers.
We begin our proposition by reviewing complex CWT
attributes theory. Then we show how we can improve
seismic interpretation by using the proposed methodology
to both synthetic and real seismic data.
The methodology
The CWT is defined as the cross-correlation between the
seismic trace and dilated versions of a basic wavelet
(Grossman and Morlet, 1984). If the basic wavelet is
symmetric the CWT can be construed by convolving the
seismic trace with the time-reversed scaled version of the
basic wavelet. Knowing convolution in time domain is
equivalent to a product in the frequency domain
(Oppenheim et al., 1999), CWT can also be interpreted as a
band pass filtering or spectral decomposition process.
Therefore, after the CWT computation, each seismic trace
is represented by a time (depth) versus scale (frequency
band) complex matrix. This represents how well the
seismic trace correlates to each dilated wavelet at each
instant of time (Matos and Marfurt, 2011).
Mallat and Zhong (1992) showed that the CWT ridges
along the scales are associated with signal inflection points
and can be used to characterize them. They also showed we
can reconstruct a non unique but very good approximation
of the seismic trace by using only the CWT ridges, which
they called Wavelet Transform Modulus Maxima Line
Amplitudes (WTMML). Tu and Hwang (2005) later proved
that the same concept can be applied using complex basic
wavelets. As originally showed by Grossman and Morlet
(1984), the complex CWT magnitude represents the
average of the dilated wavelets at each instant of time.
Consequently, the maximum averages, or the ridges, along
the scales (WTMMLA) show the existence of consistent
signal transitions.
Borrowing CWT spectral ridges (WTMMLA) ideas from
Mallat and Zhong (1984), and Tu and Hwang (2005),
geoscientists showed how CWT spectral ridges can be
associated with reflectivity series (Hermann and Stark,
2000; Matos et al, 2007; Li and Liner, 2008, Devi and
Schwab, 2009).
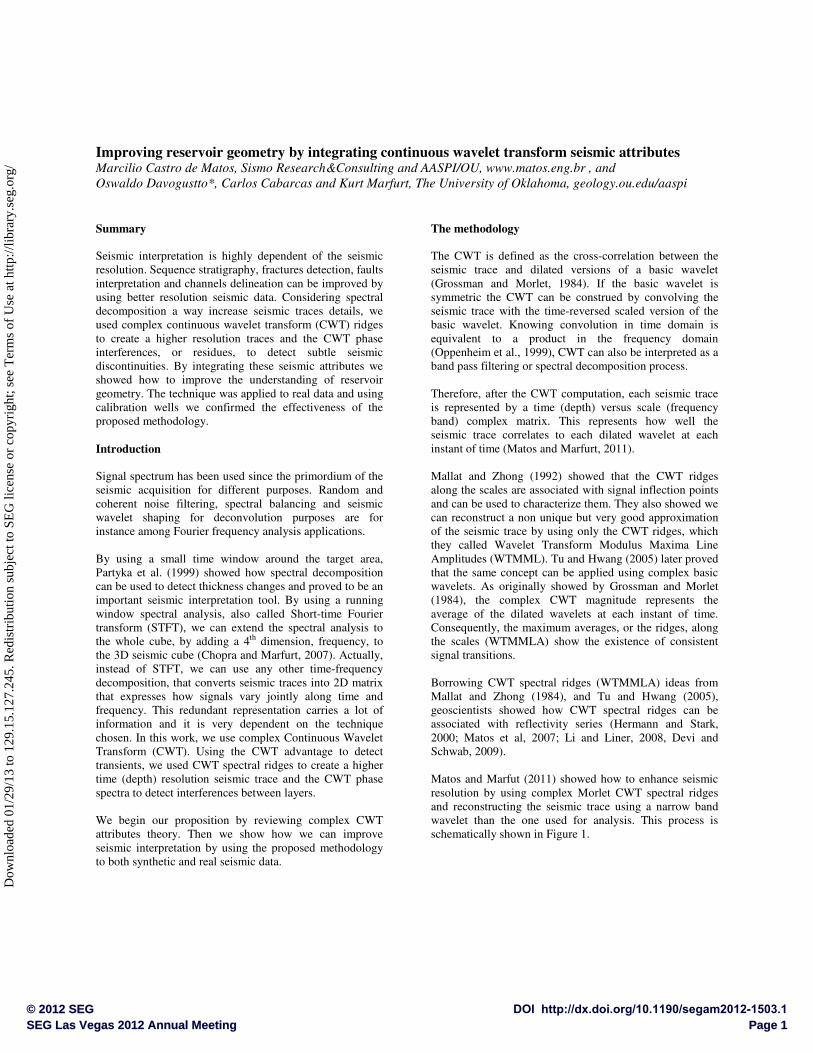
Matos and Marfut (2011) showed how to enhance seismic
resolution by using complex Morlet CWT spectral ridges
and reconstructing the seismic trace using a narrow band
wavelet than the one used for analysis. This process is
schematically shown in Figure 1.
© 2012 SEG DOI http://dx.doi.org/10.1190/segam2012-1503.1SEG Las Vegas 2012 Annual Meeting Page 1
Dow
nloa
ded
01/2
9/13
to 1
29.1
5.12
7.24
5. R
edis
trib
utio
n su
bjec
t to
SEG
lice
nse
or c
opyr
ight
; see
Ter
ms
of U
se a
t http
://lib
rary
.seg
.org
/
CWT seismic attributes
Figure 1:Schematically shows how to compute CWT enhanced
resolution seismic trace.
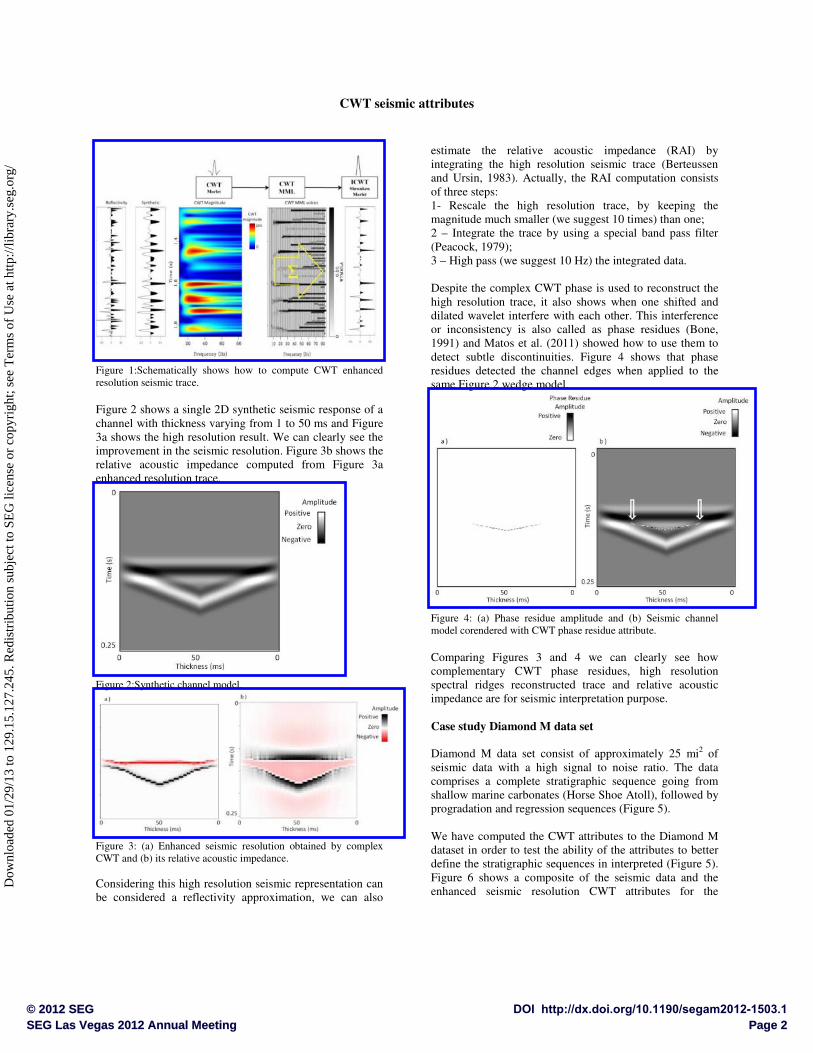
Figure 2 shows a single 2D synthetic seismic response of a
channel with thickness varying from 1 to 50 ms and Figure
3a shows the high resolution result. We can clearly see the
improvement in the seismic resolution. Figure 3b shows the
relative acoustic impedance computed from Figure 3a
enhanced resolution trace.
Figure 2:Synthetic channel model.
Figure 3: (a) Enhanced seismic resolution obtained by complex
CWT and (b) its relative acoustic impedance.
Considering this high resolution seismic representation can
be considered a reflectivity approximation, we can also
estimate the relative acoustic impedance (RAI) by
integrating the high resolution seismic trace (Berteussen
and Ursin, 1983). Actually, the RAI computation consists
of three steps:
1- Rescale the high resolution trace, by keeping the
magnitude much smaller (we suggest 10 times) than one;
2 – Integrate the trace by using a special band pass filter
(Peacock, 1979);
3 – High pass (we suggest 10 Hz) the integrated data.
Despite the complex CWT phase is used to reconstruct the
high resolution trace, it also shows when one shifted and
dilated wavelet interfere with each other. This interference
or inconsistency is also called as phase residues (Bone,
1991) and Matos et al. (2011) showed how to use them to
detect subtle discontinuities. Figure 4 shows that phase
residues detected the channel edges when applied to the
same Figure 2 wedge model.
Figure 4: (a) Phase residue amplitude and (b) Seismic channel
model corendered with CWT phase residue attribute.
Comparing Figures 3 and 4 we can clearly see how
complementary CWT phase residues, high resolution
spectral ridges reconstructed trace and relative acoustic
impedance are for seismic interpretation purpose.
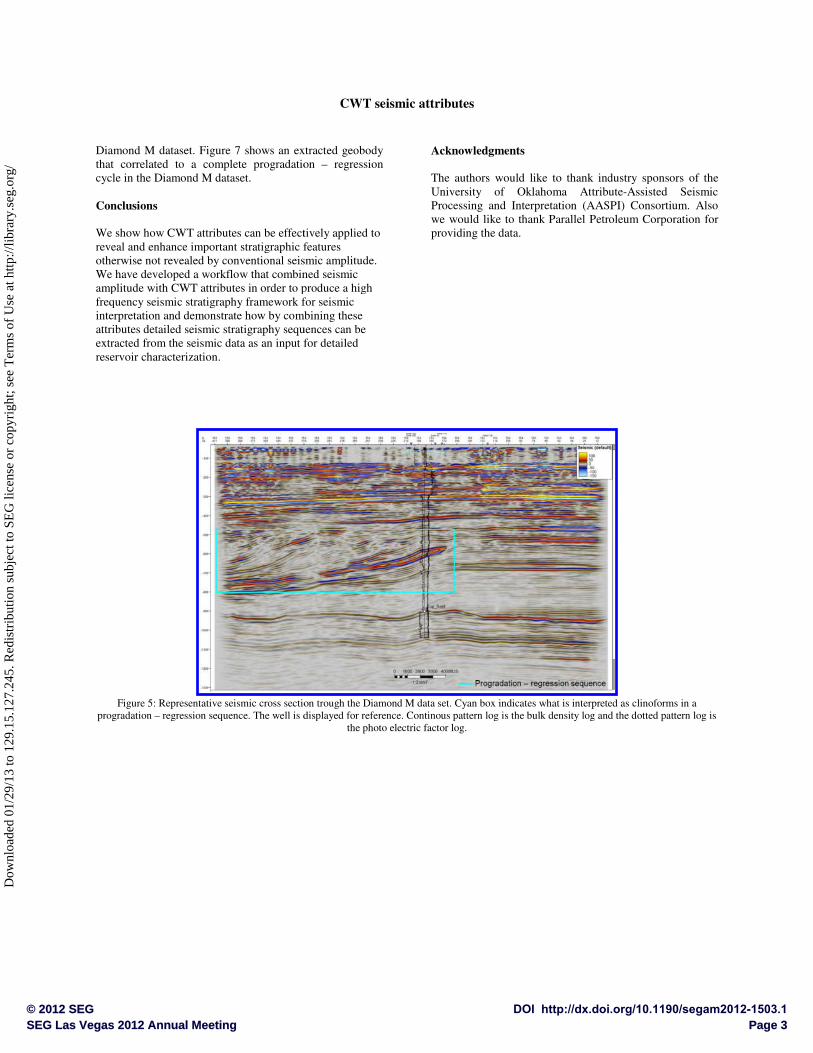
Case study Diamond M data set
Diamond M data set consist of approximately 25 mi2 of
seismic data with a high signal to noise ratio. The data
comprises a complete stratigraphic sequence going from
shallow marine carbonates (Horse Shoe Atoll), followed by
progradation and regression sequences (Figure 5).
We have computed the CWT attributes to the Diamond M
dataset in order to test the ability of the attributes to better
define the stratigraphic sequences in interpreted (Figure 5).
Figure 6 shows a composite of the seismic data and the
enhanced seismic resolution CWT attributes for the
© 2012 SEG DOI http://dx.doi.org/10.1190/segam2012-1503.1SEG Las Vegas 2012 Annual Meeting Page 2
Dow
nloa
ded
01/2
9/13
to 1
29.1
5.12
7.24
5. R
edis
trib
utio
n su
bjec
t to
SEG
lice
nse
or c
opyr
ight
; see
Ter
ms
of U
se a
t http
://lib
rary
.seg
.org
/
Diamond M dataset. Figure 7 shows an extracted geobody
that correlated to a complete progradation
cycle in the Diamond M dataset.
Conclusions
We show how CWT attributes can be effectively
reveal and enhance important stratigraphic features
otherwise not revealed by conventional seismic amplitude.
We have developed a workflow that combined seismic
amplitude with CWT attributes in order to produce a high
frequency seismic stratigraphy framework for seismic
interpretation and demonstrate how by combining these
attributes detailed seismic stratigraphy sequences can be
extracted from the seismic data as an input for detailed
reservoir characterization.
Figure 5: Representative seismic cross section trough the Diamond M data set. Cyan box indicates what is interpreted as clinoforms in
progradation – regression sequence. The well is displayed for reference. Continous pattern log is the bulk density log and the d
CWT seismic attributes
Diamond M dataset. Figure 7 shows an extracted geobody
that correlated to a complete progradation – regression
We show how CWT attributes can be effectively applied to
reveal and enhance important stratigraphic features
otherwise not revealed by conventional seismic amplitude.
combined seismic
amplitude with CWT attributes in order to produce a high
frequency seismic stratigraphy framework for seismic
interpretation and demonstrate how by combining these
attributes detailed seismic stratigraphy sequences can be
e seismic data as an input for detailed
Acknowledgments
The authors would like to thank industry sponsors of the
University of Oklahoma Attribute
Processing and Interpretation (AASPI) Consortium.
we would like to thank Parallel Petroleum Corporation for
providing the data.
: Representative seismic cross section trough the Diamond M data set. Cyan box indicates what is interpreted as clinoforms in
regression sequence. The well is displayed for reference. Continous pattern log is the bulk density log and the d
the photo electric factor log.
The authors would like to thank industry sponsors of the
ma Attribute-Assisted Seismic
Processing and Interpretation (AASPI) Consortium. Also
Parallel Petroleum Corporation for
: Representative seismic cross section trough the Diamond M data set. Cyan box indicates what is interpreted as clinoforms in a
regression sequence. The well is displayed for reference. Continous pattern log is the bulk density log and the dotted pattern log is
© 2012 SEG DOI http://dx.doi.org/10.1190/segam2012-1503.1SEG Las Vegas 2012 Annual Meeting Page 3
Dow
nloa
ded
01/2
9/13
to 1
29.1
5.12
7.24
5. R
edis
trib
utio
n su
bjec
t to
SEG
lice
nse
or c
opyr
ight
; see
Ter
ms
of U
se a
t http
://lib
rary
.seg
.org
/
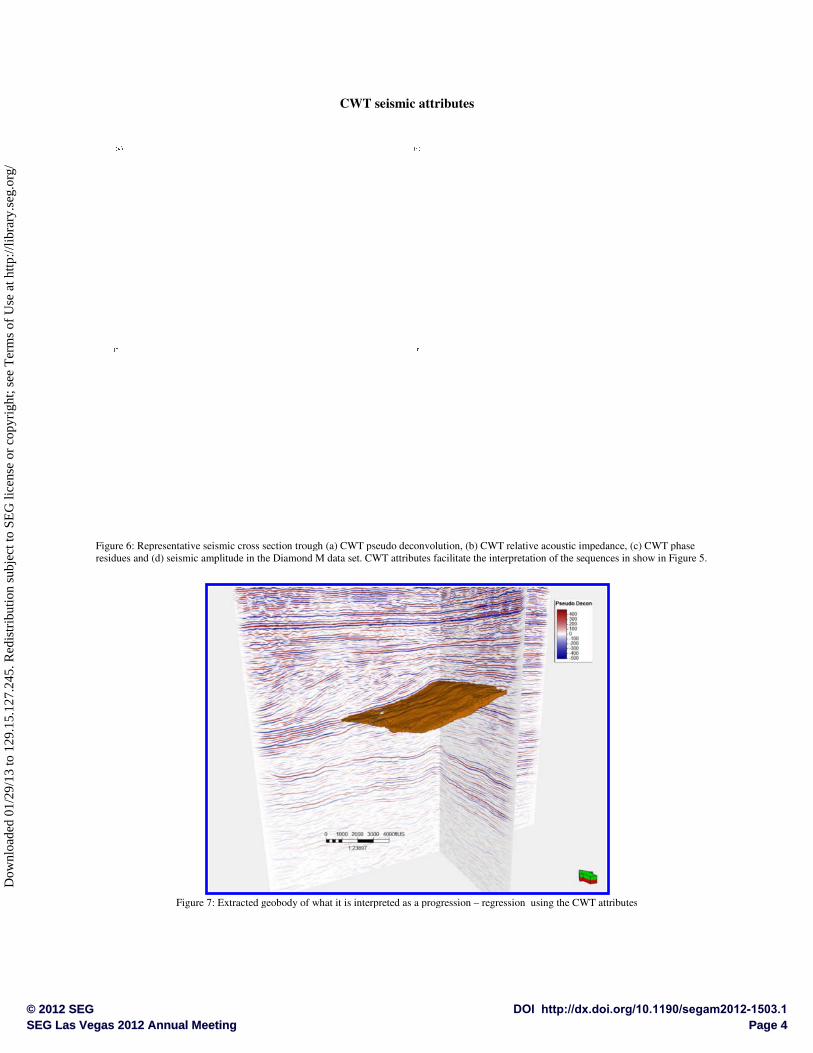
Figure 6: Representative seismic cross section trough (a) CWT pseudo deconvolution, (b) CWT relative acoustic impedance, (c) CWT phas
residues and (d) seismic amplitude in the Diamond M data set. CWT attributes facilitate the interpretation of the sequences in show in Figure 5.
Figure 7: Extracted geobody of what it is interpreted as a progression
CWT seismic attributes
: Representative seismic cross section trough (a) CWT pseudo deconvolution, (b) CWT relative acoustic impedance, (c) CWT phas
the Diamond M data set. CWT attributes facilitate the interpretation of the sequences in show in Figure 5.
: Extracted geobody of what it is interpreted as a progression – regression using the CWT attributes
: Representative seismic cross section trough (a) CWT pseudo deconvolution, (b) CWT relative acoustic impedance, (c) CWT phase
the Diamond M data set. CWT attributes facilitate the interpretation of the sequences in show in Figure 5.
the CWT attributes
© 2012 SEG DOI http://dx.doi.org/10.1190/segam2012-1503.1SEG Las Vegas 2012 Annual Meeting Page 4
Dow
nloa
ded
01/2
9/13
to 1
29.1
5.12
7.24
5. R
edis
trib
utio
n su
bjec
t to
SEG
lice
nse
or c
opyr
ight
; see
Ter
ms
of U
se a
t http
://lib
rary
.seg
.org
/
http://dx.doi.org/10.1190/segam2012-1503.1 EDITED REFERENCES Note: This reference list is a copy-edited version of the reference list submitted by the author. Reference lists for the 2012 SEG Technical Program Expanded Abstracts have been copy edited so that references provided with the online metadata for each paper will achieve a high degree of linking to cited sources that appear on the Web. REFERENCES
Berteussen, K. A., and B. Ursin, 1983, Approximate computation of the acoustic impedance from seismic data: Geophysics, 48, 1351–1358.
Bone, D. J., 1991, Fourier fringe analysis: the two-dimensional phase unwrapping problem: Applied Optics, 30, no. 25, 3627–3632, doi:10.1364/AO.30.003627.
Chopra, S., and K. J. Marfurt, 2007, Seismic attributes for prospect identification and reservoir characterization: SEG.
Devi, K.R.S., and H. Schwab, 2009, High-resolution seismic signals from band-limited data using scaling laws of wavelet transforms: Geophysics, 74, no. 2, WA143–WA152, doi:10.1190/1.3077622.
Grossmann, A., and J. Morlet, 1984, Decomposition of Hardy functions into square integrable wavelets of constant shape: SIAM Journal on Mathematical Analysis, 15, 723–736, doi:10.1137/0515056.
Herrmann, F., and C. Stark, 2000, A scale attribute for texture in well and seismic data: 70th Annual International Meeting, SEG, Expanded Abstracts, 2063–2066, doi:10.1190/1.1815849.
Li, C., and C. Liner, 2008, Wavelet-based detection of singularities in acoustic impedances from surface seismic reflection data: Geophysics, 73, no. 1, V1–V9, doi: 10.1190/1.2795396.
Lines, L. R., and T. J. Ulrych, 1977, The old and the new in seismic deconvolution and wavelet estimation: Geophysical Prospecting, 25, 512–540, doi:10.1111/j.1365-2478.1977.tb01185.x.
Mallat, S., and S. Zhong, 1992, Characterization of signals from multiscale edges: IEEE Transactions on Pattern Analysis and Machine Intelligence, 14, 710–732, doi:10.1109/34.142909.
Matos, M. C., O. Davogustto, K. Zhang, and K. J. Marfurt, 2011, Detecting stratigraphic discontinuities using time-frequency seismic phase residues: Geophysics, 76, no. 2, P1–P10, doi:10.1190/1.3528758.
Matos, M. C., and K. J. Marfurt, 2011, Inverse continuous wavelet transform “deconvolution”: 81st Annual International Meeting, SEG, Expanded Abstracts, 1861–1865, doi:10.1190/1.3627569.
Matos, M. C., P. L. M. Osorio, and P. R. S. Johann, 2007, Unsupervised seismic facies analysis using wavelet transform and self-organizing maps: Geophysics, 72, no. 1, P9–P21, doi:10.1190/1.2392789.
Partyka, G., J. Gridley, and J. Lopez, 1999, Interpretational applications of spectral decomposition in reservoir characterization: The Leading Edge, 18, 353–360.
Peacock, K. L., 1979, An optimum filter design for discrete integration: Geophysics, 44, 722–729.
Tu, C. L., and W. L. Hwang, 2005, Analysis of singularities from modulus maxima of complex wavelets: IEEE Transactions on Information Theory, 51, 1049–1062, doi: 10.1109/TIT.2004.842706.
© 2012 SEG DOI http://dx.doi.org/10.1190/segam2012-1503.1SEG Las Vegas 2012 Annual Meeting Page 5
Dow
nloa
ded
01/2
9/13
to 1
29.1
5.12
7.24
5. R
edis
trib
utio
n su
bjec
t to
SEG
lice
nse
or c
opyr
ight
; see
Ter
ms
of U
se a
t http
://lib
rary
.seg
.org
/