Embed Size (px)
Citation preview
Improving Recall In Text RetrievalUsing Rank Fusion
RODGER BENHAM
SID: s3378695
Supervisor: Dr. Shane Culpepper
This thesis is submitted in partial fulfillment ofthe requirements for the degree of
Bachelor of Computer Science (Honours)
School of ScienceRMIT University
Australia
5 June 2018

Abstract
Rank-fusion, where the output of more than one retrieval system is fused into a final coalesced
result set to be inspected by the user, is a classic approach used in information retrieval to improve
system effectiveness. The key idea is to use different sources of information to find a set of documents
that are most likely to be relevant. Combining query variations and fusing them has been shown to be
a highly effective in improving effectiveness aggregate scores. However, it is unclear whether fusion
is equitably improving the retrieval effectiveness across all topics compared to a single-shot baseline.
In this work, we explore the use of rank fusion techniques to improve both recall and risk-reward
pay-offs, and explore the tension between these two objectives. Through our experimental study, we
show that combining rank-fusion, query variations, and system variations into the same fusion pool
can dramatically increase the end-to-end effectiveness of recall-sensitive evaluation metrics and also
provide the least risk out of all other fusion combinations studied.
iii

Publications Derived From This Thesis
[1] R. Benham and J. S. Culpepper 2017. Risk-reward Trade-offs in Rank Fusion. 2017. In: Proc. ADCS.
Accepted 26 Oct 2017.
[2] R. Benham, L. Gallagher, J. Mackenzie, T. T. Damessie, R-C. Chen, F. Scholer, A. Moffat and J. S.
Culpepper. RMIT at the TREC CORE Track. 2017. In: Proc. TREC. Submitted 25 Oct 2017.
[3] L. Gallagher, J. Mackenzie, R. Benham, R-C. Chen, F. Scholer and J. S. Culpepper. RMIT at the
NTCIR-13 We Want Web Task. 2017. In: Proc. NTCIR-13.
v

Acknowledgements
I’d like to acknowledge the patience and time my supervisor Shane provided throughout the year in
the development of this work, and in the development of my research skills and potential. He went
above and beyond the regular call of duty for research supervision, and his exceptional guidance is
greatly appreciated. Thanks to Joel Mackenzie, Luke Gallagher and Dr. Ruey-Cheng Chen for being
excellent mentors and imparting their wisdom for completing academic work on this scale. Further
thanks is extended to the TIGER group at RMIT for hosting interesting talks in Information Retrieval
and providing insight as to how academic work should be communicated. A number of these members
contributed to a user query-variation collection we had developed for the submission of a fused TREC
CORE 2017 run, which has been central to the completion of this this work: Thanks to Asc. Prof Falk
Scholer, Prof. Alistair Moffat, Shane, Tadele T. Damessie, Joel, Luke, Ruey for assisting in this task.
Thanks to Prof. Mark Sanderson for providing financial assistance in the development of this work.
Further thanks to my employer’s Glenn Schmidt and Ian Priddle at Codeacious for allowing a flexible
working schedule which also supported the development of this work.
Further thanks is extended to fellow members of the Research Methods course for their contributions
and interactions in class discussions. Prof. Zahir Tari and Dr. Hai Dong provided exceptional assistance
in providing feedback to the development of a research proposal, which was the final deliverable of the
Research Methods course. Tragically, a classmate Brodie Furber passed away throughout the year. I
will cherish his polite and well articulated interactions, presentations and contributions to the class
discussions on learning to be a better researcher. My deepest sympathy goes out to Brodie’s family.
A big thanks to my parents Craig and Dolly for their love and nurture. Thank you to my brother Sean
for your assistance over the years in building my first computers. To my loving girlfriend Olivia, thank
you for your support and nurture throughout this endeavour, and the Keegan family for your great
company over the past two years. Hopefully there are many more to come! This thesis honours the
memory of Karl Lark, an ex-colleague, fellow Software Developer and great friend.
Finally, thanks is extended to all reviewers for taking the time to read this thesis and their suggestions
for improvements.
vii

CONTENTS
Abstract iii
Publications Derived From This Thesis v
Acknowledgements vii
List of Figures xi
List of Tables xiii
Chapter 1 Introduction 1
1.1 Research Questions . . . . . . . . . . . . . . . . . . . . . . . . . . . . . . . . . . . . . . . . . . . . . . . . . . . . . . . . . . . . . . . . . . . . . . . 2
Chapter 2 Background 5
2.1 Information Retrieval . . . . . . . . . . . . . . . . . . . . . . . . . . . . . . . . . . . . . . . . . . . . . . . . . . . . . . . . . . . . . . . . . . . . . 5
2.2 Retrieval Algorithms . . . . . . . . . . . . . . . . . . . . . . . . . . . . . . . . . . . . . . . . . . . . . . . . . . . . . . . . . . . . . . . . . . . . . . 7
2.3 Evaluation . . . . . . . . . . . . . . . . . . . . . . . . . . . . . . . . . . . . . . . . . . . . . . . . . . . . . . . . . . . . . . . . . . . . . . . . . . . . . . . . 13
2.4 Query Variations . . . . . . . . . . . . . . . . . . . . . . . . . . . . . . . . . . . . . . . . . . . . . . . . . . . . . . . . . . . . . . . . . . . . . . . . . . 23
2.5 Query Expansion . . . . . . . . . . . . . . . . . . . . . . . . . . . . . . . . . . . . . . . . . . . . . . . . . . . . . . . . . . . . . . . . . . . . . . . . . 25
2.6 Unsupervised Rank Fusion . . . . . . . . . . . . . . . . . . . . . . . . . . . . . . . . . . . . . . . . . . . . . . . . . . . . . . . . . . . . . . . . 26
Chapter 3 TREC CORE 2017 User Query Variations 31
3.1 User Study . . . . . . . . . . . . . . . . . . . . . . . . . . . . . . . . . . . . . . . . . . . . . . . . . . . . . . . . . . . . . . . . . . . . . . . . . . . . . . . . 32
3.2 Approach . . . . . . . . . . . . . . . . . . . . . . . . . . . . . . . . . . . . . . . . . . . . . . . . . . . . . . . . . . . . . . . . . . . . . . . . . . . . . . . . . 35
3.3 Results . . . . . . . . . . . . . . . . . . . . . . . . . . . . . . . . . . . . . . . . . . . . . . . . . . . . . . . . . . . . . . . . . . . . . . . . . . . . . . . . . . . . 39
3.4 Conclusion. . . . . . . . . . . . . . . . . . . . . . . . . . . . . . . . . . . . . . . . . . . . . . . . . . . . . . . . . . . . . . . . . . . . . . . . . . . . . . . . 42
Chapter 4 Risk-Reward Trade-offs in Rank Fusion 43
4.1 Background and Related Work . . . . . . . . . . . . . . . . . . . . . . . . . . . . . . . . . . . . . . . . . . . . . . . . . . . . . . . . . . . . 44
4.2 Experimental Setup . . . . . . . . . . . . . . . . . . . . . . . . . . . . . . . . . . . . . . . . . . . . . . . . . . . . . . . . . . . . . . . . . . . . . . . 44
4.3 Fusion Performance Degradation. . . . . . . . . . . . . . . . . . . . . . . . . . . . . . . . . . . . . . . . . . . . . . . . . . . . . . . . . . 46
4.4 Reducing Query Fusion Risk with Retrieval Models . . . . . . . . . . . . . . . . . . . . . . . . . . . . . . . . . . . . . . . 53
4.5 Failure Analysis . . . . . . . . . . . . . . . . . . . . . . . . . . . . . . . . . . . . . . . . . . . . . . . . . . . . . . . . . . . . . . . . . . . . . . . . . . . 54
ix
x CONTENTS
4.6 Conclusion. . . . . . . . . . . . . . . . . . . . . . . . . . . . . . . . . . . . . . . . . . . . . . . . . . . . . . . . . . . . . . . . . . . . . . . . . . . . . . . . 56
Chapter 5 Conclusions and Future Work 57
5.1 Increasing Recall with Fusion . . . . . . . . . . . . . . . . . . . . . . . . . . . . . . . . . . . . . . . . . . . . . . . . . . . . . . . . . . . . . 57
5.2 Risk-sensitivity Of Each Fusion Scenario . . . . . . . . . . . . . . . . . . . . . . . . . . . . . . . . . . . . . . . . . . . . . . . . . . 57
5.3 Future Work . . . . . . . . . . . . . . . . . . . . . . . . . . . . . . . . . . . . . . . . . . . . . . . . . . . . . . . . . . . . . . . . . . . . . . . . . . . . . . 57
Bibliography 59
Appendix A Appendix 65
List of Figures
1.1 System fusion example. 2
1.2 Query fusion example. 3
1.3 Double fusion example. 3
2.1 Inverted Index diagram. 6
2.2 Qrels file example. 14
2.3 A high-level overview of pseudo-relevance feedback. 26
3.1 The query variation submission interface. 33
3.2 Average precision score distributions for all topics in CORE UQVs on Robust04 Corpus. 36
3.3 NDCG@10 score distributions for all topics in UQV100 on ClueWeb12B Corpus. 36
3.4 FDM+QE vs. AP on Robust04 title-only queries vs. Query Variants 37
3.5 A comparison of effectiveness by AP, for all runs to be submitted on the Robust04 collection. 38
3.6 Robust04 vs. NYT CORE run results. 39
3.7 The distribution of uniquely relevant documents found across all NIST assessed topics. 40
4.1 Effectiveness of query fusion over different fusion algorithms. 47
4.2 Different retrieval systems can exhibit significant harm over for some topics. 50
4.3 TRisk over all fusion scenarios considered using RRF. 52
4.4 Risk-reward payoff when fusing queries by number of duplicates. 55
4.5 Effectiveness vs. Risk-Reward payoff over all fusion methods, for all fusion scenarios. 56
xi

List of Tables
2.1 A brief description of TREC test collections used in the first eight TRECs. 16
2.2 A hypothetical retrieval output (or run), considering the judgments of a relevance assessor. 18
3.1 Number of query variations submitted by each author. 34
3.2 A brief description of the TREC CORE RMIT runs. 35
3.3 The per-topic effectiveness of our TREC CORE submission. 41
4.1 A survey of rank fusion methods implemented and observed in our study. 44
4.2 Summary statistics of the document collections studied. 45
4.3 Summary statistics of the query variation collections studied. 46
4.4 Effectiveness comparisions for all fusion methods. 48
4.5 Risk-reward comparisons for all fusion methods. 49
4.6 List of topics over system comparisons with stat. sig. TRisk differences. 50
4.7 Effectiveness comparisons for all retrieval models on Robust04. 53
4.8 Effectiveness comparisons for all retrieval models on ClueWeb12B. 53
4.9 Failure analysis of TRisk compared to effectiveness aggregate. 55
A.1 Effectiveness of varying the number of query variations fused by duplicate order. 65
xiii

CHAPTER 1
Introduction
We exist in a sea of exponential growth in the information we have at our fingertips. This information
overload has strong implications on the society we live in, as digitizing resources becomes increasingly
important. Information Retrieval (IR), which once belonged to the field of library sciences, has revo-
lutionized the way humanity learns about the world in which we live. The most familiar IR use case
for users is web search, where they express their information need as a keyword-based query and sub-
mit it to their favorite search engine, in order to receive a list of ranked websites— generally showing
10 results per page. Given the growing number of Internet users and the impact that web search has
on daily life, it is unsurprising that most research efforts are focused on improving early precision—
optimising systems to ensure the most relevant documents are densely populated at the head of the
result list. However, there are also IR use cases in which the user requires all pertinent documents to
resolve an information need. Examples of these situations are: finding all relevant documents for civil
litigation, research papers for citations, or for policy-makers to make informed decisions. To resolve
these kinds of information needs, we explore techniques in this thesis that aim to maximise recall in
IR systems. It lays the foundations for future work aiming to apply multi-stage retrieval— a cascade
of steps into which a pool of candidate documents are input into a learning-to-rank stage, to yield the
high-precision result lists expected from a search engine.
Techniques that have been shown to improve the effectiveness of the retrieved result lists against other
methods have been shown to exhibit a risk-reward payoff. Pseudo-relevance feedback and Markov
random fields are prime examples of this phenomenon where most topics see strong improvement,
however, a minority of topics are harmed. In general, IR researchers when evaluating their retrieval
systems use an evaluation metric, observe whether the aggregate score across all topics is higher than
the baseline, and finally conduct a paired t-test to check whether assertions can be made about a sta-
tistically significant difference. This aggregate-based approach to evaluating system improvement can
hide or obscure the losses incurred relative to the baseline. In this thesis, we use recent risk-sensitive
evaluation techniques to investigate whether different fusion approaches are not only improving effec-
tiveness but if they are also reducing the risk of harming a baseline. Risk-sensitive evaluation is of great
1
2 1 INTRODUCTION
interest to us because it is difficult to assert that you are improving recall if you are diminishing the
effectiveness of some topics.
The body of work in this thesis can be viewed as an extension of the very recent SIGIR paper by Bailey
et al. [3], which shows that incredible retrieval performance can be attained by rank fusing query varia-
tions together. Building on this result, the authors used “double fusion”— fusion of runs built by query
variations over different systems, and found that retrieval effectiveness improved. This thesis con-
tributes an offline query variation collection similar to UQV100 that can be used on the Robust04 and
the new New York Times corpora. It also establishes that query fusion does exhibit a risk-reward payoff
while improving recall and that double fusion reduces risk while maintaining or improving effective-
ness across different metrics. Incidentally, we report discoveries about whether a “best” query exists
across document collections of similar composition, and observe the spread of retrieval effectiveness of
offline query variation collections for the first time.
1.1 Research Questions
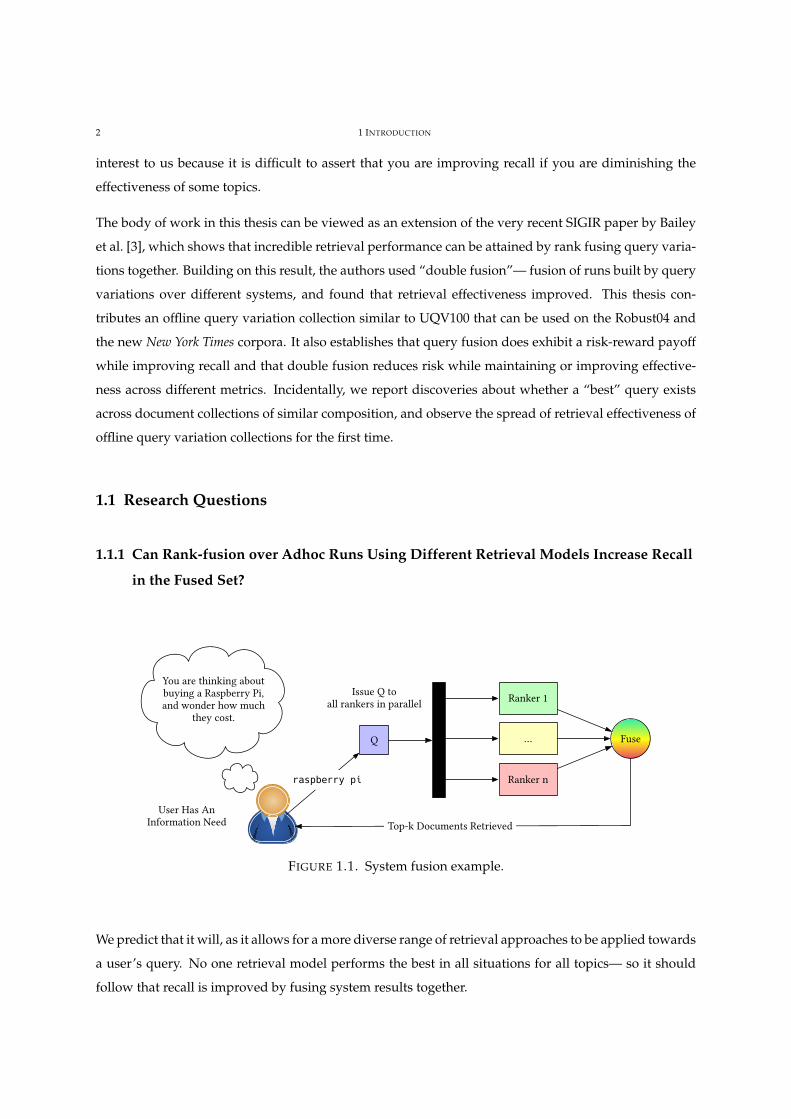
1.1.1 Can Rank-fusion over Adhoc Runs Using Different Retrieval Models Increase Recall
in the Fused Set?
User Has AnInformation Need
You are thinking about buying a Raspberry Pi, and wonder how much
they cost.
raspberry pi
Ranker 1
…
Ranker n
Q Fuse
Top-k Documents Retrieved
Issue Q to all rankers in parallel
FIGURE 1.1. System fusion example.
We predict that it will, as it allows for a more diverse range of retrieval approaches to be applied towards
a user’s query. No one retrieval model performs the best in all situations for all topics— so it should
follow that recall is improved by fusing system results together.
1.1 RESEARCH QUESTIONS 3
raspberry pi
RankerQ Fuse
Top-k Documents Retrieved
!ery Variation Database
cost of raspberry pi
best deal raspberry pi computer
. . .
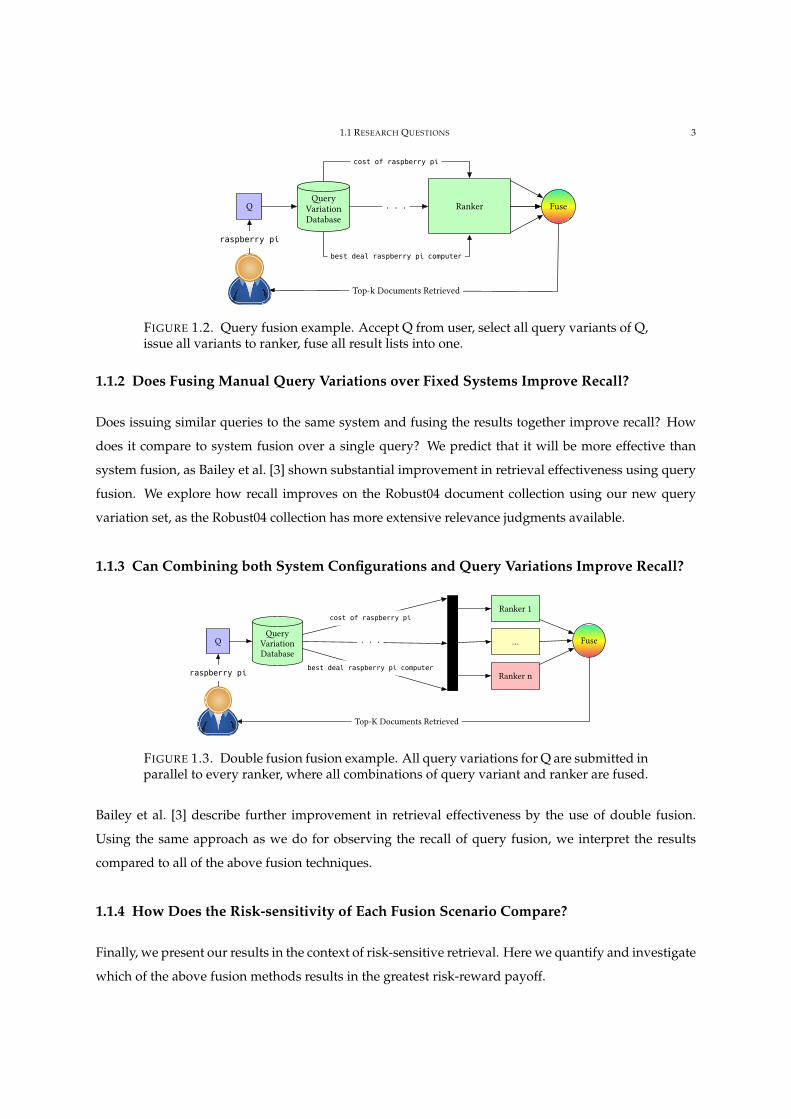
FIGURE 1.2. Query fusion example. Accept Q from user, select all query variants of Q,issue all variants to ranker, fuse all result lists into one.
1.1.2 Does Fusing Manual Query Variations over Fixed Systems Improve Recall?
Does issuing similar queries to the same system and fusing the results together improve recall? How
does it compare to system fusion over a single query? We predict that it will be more effective than
system fusion, as Bailey et al. [3] shown substantial improvement in retrieval effectiveness using query
fusion. We explore how recall improves on the Robust04 document collection using our new query
variation set, as the Robust04 collection has more extensive relevance judgments available.
1.1.3 Can Combining both System Configurations and Query Variations Improve Recall?
raspberry pi
Q Fuse
Top-K Documents Retrieved
!ery Variation Database
. . .
Ranker 1
…
Ranker n
cost of raspberry pi
best deal raspberry pi computer
FIGURE 1.3. Double fusion fusion example. All query variations for Q are submitted inparallel to every ranker, where all combinations of query variant and ranker are fused.
Bailey et al. [3] describe further improvement in retrieval effectiveness by the use of double fusion.
Using the same approach as we do for observing the recall of query fusion, we interpret the results
compared to all of the above fusion techniques.
1.1.4 How Does the Risk-sensitivity of Each Fusion Scenario Compare?
Finally, we present our results in the context of risk-sensitive retrieval. Here we quantify and investigate
which of the above fusion methods results in the greatest risk-reward payoff.

CHAPTER 2
Background
2.1 Information Retrieval
Information Retrieval (IR) is a research area concerned with finding answers to questions from collec-
tions of unstructured data. Unstructured data can exist in many different forms— text, sound, images,
and videos. Although these resources inherently contain structure, automatically extracting features of
the datasets that are helpful for retrieval purposes require careful review of over 60 years of literature.
Before the World-Wide Web allowed massive amounts of information to be accessible to anyone with
an Internet connection, libraries were the most popular IR resource, where information needs were re-
solved by physically traversing books categorized by topic. Using classification systems, such as the
Dewey Decimal Classification system, library users are able to reduce the search-space of a cataloged
item. Eventually, the library user will converge on the most useful book by manually searching to re-
solve their information need. This system works when there is enough physical space to fit the library
catalog, however in 2008 Google ran algorithms “over twenty petabytes of data per day” [24]. This
suggests that a printed repository for online information would yield intractable search times, and an
overwhelmingly large building would be required to store the documents. Sanderson and Croft [70]
provide a more expansive discussion on the history of IR research, including the pre-computing devel-
opment of electromechanical machines using microfilm as an index to search a library collection.
2.1.1 Indexing Text Collections
Indexing text collections are useful for allowing the efficient search of unstructured text. A brute force
search over gigabytes of data would yield intractable wait times for a user issuing a query. Indexing
is the process of performing this high effort scan across all documents once, to extract all terms in a
document and store them in a data structure designed for fast lookup. Typically, the inverted index is
the data structure of choice for most retrieval scenarios [82].
5
6 2 BACKGROUND
CRANFIELD-0001
CRANFIELD-0002
CRANFIELD-0003
CRANFIELD-0004
CRANFIELD-0005
…
1
2
3
4
5
…
FLOW
NUMBER
MACH
PRESSURE
RESULTS
…
0
48
88
112
144
…
Mapping Table Lexicon Table
In-Memory Data Structures On-Disk Data Structures
Inverted Index
5 1 2 3 4 5
4 2 3 4 5
2 1 4
4 1 2 3 5
3 3 4 5
… … … … … …
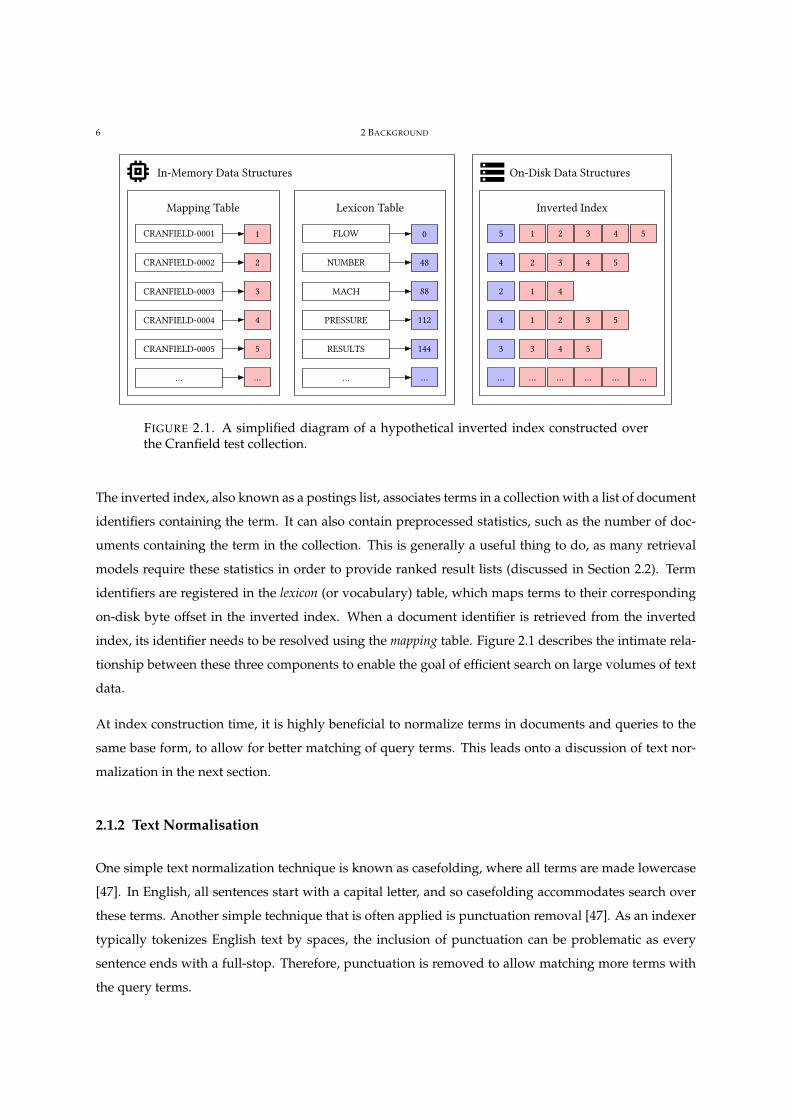
FIGURE 2.1. A simplified diagram of a hypothetical inverted index constructed overthe Cranfield test collection.
The inverted index, also known as a postings list, associates terms in a collection with a list of document
identifiers containing the term. It can also contain preprocessed statistics, such as the number of doc-
uments containing the term in the collection. This is generally a useful thing to do, as many retrieval
models require these statistics in order to provide ranked result lists (discussed in Section 2.2). Term
identifiers are registered in the lexicon (or vocabulary) table, which maps terms to their corresponding
on-disk byte offset in the inverted index. When a document identifier is retrieved from the inverted
index, its identifier needs to be resolved using the mapping table. Figure 2.1 describes the intimate rela-
tionship between these three components to enable the goal of efficient search on large volumes of text
data.
At index construction time, it is highly beneficial to normalize terms in documents and queries to the
same base form, to allow for better matching of query terms. This leads onto a discussion of text nor-
malization in the next section.
2.1.2 Text Normalisation
One simple text normalization technique is known as casefolding, where all terms are made lowercase
[47]. In English, all sentences start with a capital letter, and so casefolding accommodates search over
these terms. Another simple technique that is often applied is punctuation removal [47]. As an indexer
typically tokenizes English text by spaces, the inclusion of punctuation can be problematic as every
sentence ends with a full-stop. Therefore, punctuation is removed to allow matching more terms with
the query terms.
2.2 RETRIEVAL ALGORITHMS 7
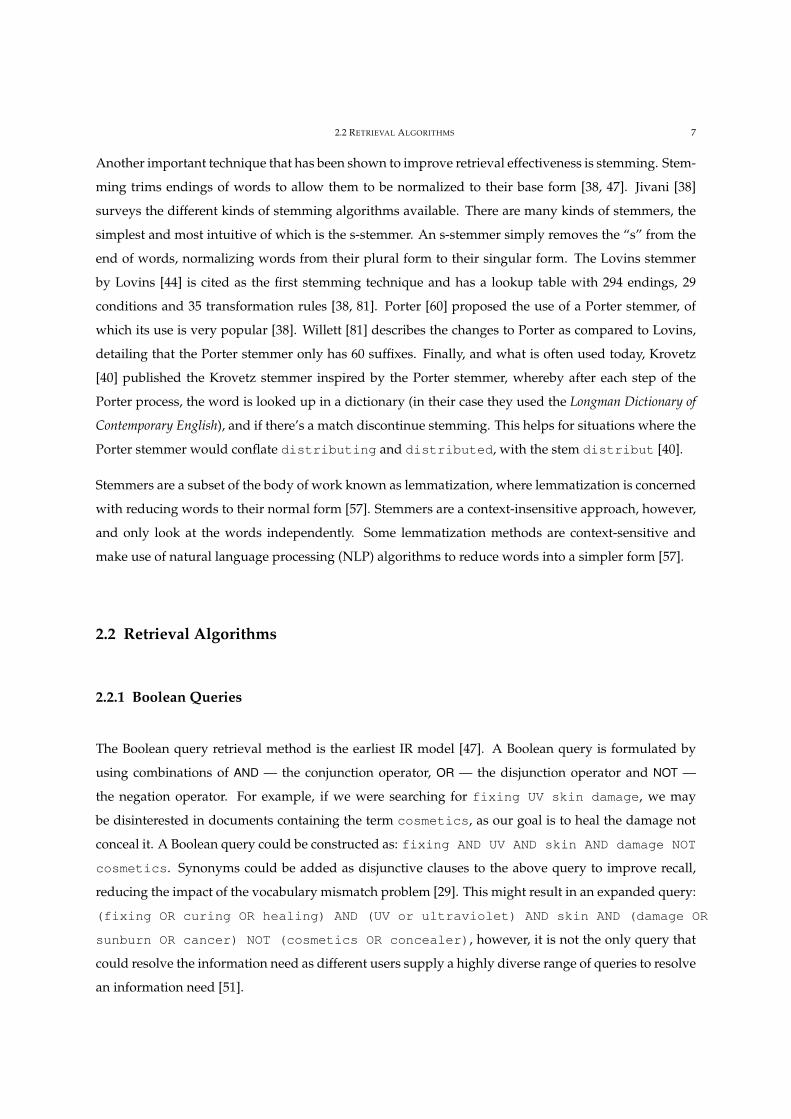
Another important technique that has been shown to improve retrieval effectiveness is stemming. Stem-
ming trims endings of words to allow them to be normalized to their base form [38, 47]. Jivani [38]
surveys the different kinds of stemming algorithms available. There are many kinds of stemmers, the
simplest and most intuitive of which is the s-stemmer. An s-stemmer simply removes the “s” from the
end of words, normalizing words from their plural form to their singular form. The Lovins stemmer
by Lovins [44] is cited as the first stemming technique and has a lookup table with 294 endings, 29
conditions and 35 transformation rules [38, 81]. Porter [60] proposed the use of a Porter stemmer, of
which its use is very popular [38]. Willett [81] describes the changes to Porter as compared to Lovins,
detailing that the Porter stemmer only has 60 suffixes. Finally, and what is often used today, Krovetz
[40] published the Krovetz stemmer inspired by the Porter stemmer, whereby after each step of the
Porter process, the word is looked up in a dictionary (in their case they used the Longman Dictionary of
Contemporary English), and if there’s a match discontinue stemming. This helps for situations where the
Porter stemmer would conflate distributing and distributed, with the stem distribut [40].
Stemmers are a subset of the body of work known as lemmatization, where lemmatization is concerned
with reducing words to their normal form [57]. Stemmers are a context-insensitive approach, however,
and only look at the words independently. Some lemmatization methods are context-sensitive and
make use of natural language processing (NLP) algorithms to reduce words into a simpler form [57].
2.2 Retrieval Algorithms
2.2.1 Boolean Queries
The Boolean query retrieval method is the earliest IR model [47]. A Boolean query is formulated by
using combinations of AND — the conjunction operator, OR — the disjunction operator and NOT —
the negation operator. For example, if we were searching for fixing UV skin damage, we may
be disinterested in documents containing the term cosmetics, as our goal is to heal the damage not
conceal it. A Boolean query could be constructed as: fixing AND UV AND skin AND damage NOT
cosmetics. Synonyms could be added as disjunctive clauses to the above query to improve recall,
reducing the impact of the vocabulary mismatch problem [29]. This might result in an expanded query:
(fixing OR curing OR healing) AND (UV or ultraviolet) AND skin AND (damage OR
sunburn OR cancer) NOT (cosmetics OR concealer), however, it is not the only query that
could resolve the information need as different users supply a highly diverse range of queries to resolve
an information need [51].
8 2 BACKGROUND
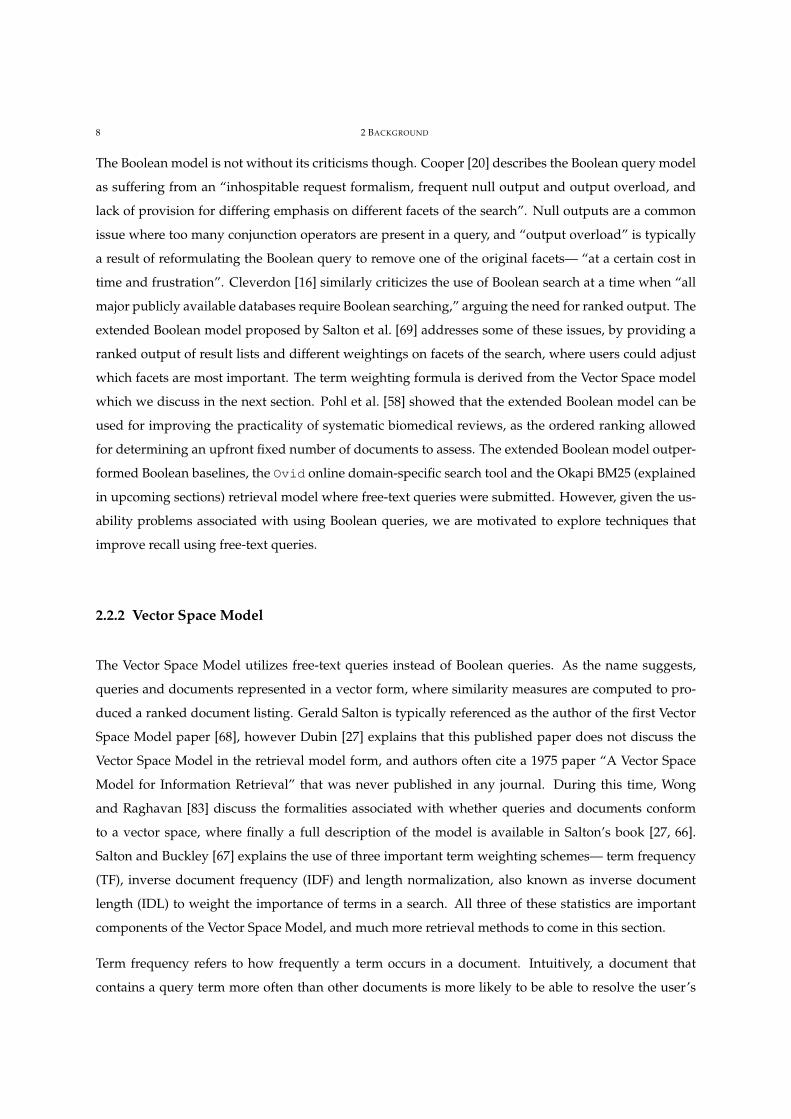
The Boolean model is not without its criticisms though. Cooper [20] describes the Boolean query model
as suffering from an “inhospitable request formalism, frequent null output and output overload, and
lack of provision for differing emphasis on different facets of the search”. Null outputs are a common
issue where too many conjunction operators are present in a query, and “output overload” is typically
a result of reformulating the Boolean query to remove one of the original facets— “at a certain cost in
time and frustration”. Cleverdon [16] similarly criticizes the use of Boolean search at a time when “all
major publicly available databases require Boolean searching,” arguing the need for ranked output. The
extended Boolean model proposed by Salton et al. [69] addresses some of these issues, by providing a
ranked output of result lists and different weightings on facets of the search, where users could adjust
which facets are most important. The term weighting formula is derived from the Vector Space model
which we discuss in the next section. Pohl et al. [58] showed that the extended Boolean model can be
used for improving the practicality of systematic biomedical reviews, as the ordered ranking allowed
for determining an upfront fixed number of documents to assess. The extended Boolean model outper-
formed Boolean baselines, the Ovid online domain-specific search tool and the Okapi BM25 (explained
in upcoming sections) retrieval model where free-text queries were submitted. However, given the us-
ability problems associated with using Boolean queries, we are motivated to explore techniques that
improve recall using free-text queries.
2.2.2 Vector Space Model
The Vector Space Model utilizes free-text queries instead of Boolean queries. As the name suggests,
queries and documents represented in a vector form, where similarity measures are computed to pro-
duced a ranked document listing. Gerald Salton is typically referenced as the author of the first Vector
Space Model paper [68], however Dubin [27] explains that this published paper does not discuss the
Vector Space Model in the retrieval model form, and authors often cite a 1975 paper “A Vector Space
Model for Information Retrieval” that was never published in any journal. During this time, Wong
and Raghavan [83] discuss the formalities associated with whether queries and documents conform
to a vector space, where finally a full description of the model is available in Salton’s book [27, 66].
Salton and Buckley [67] explains the use of three important term weighting schemes— term frequency
(TF), inverse document frequency (IDF) and length normalization, also known as inverse document
length (IDL) to weight the importance of terms in a search. All three of these statistics are important
components of the Vector Space Model, and much more retrieval methods to come in this section.
Term frequency refers to how frequently a term occurs in a document. Intuitively, a document that
contains a query term more often than other documents is more likely to be able to resolve the user’s
2.2 RETRIEVAL ALGORITHMS 9
information need. Document frequency refers to the number of times a term occurs across other doc-
uments in the collection. Inverse document frequency reduces the impact of terms that are common
across many documents, such as the word “the”. Therefore rarer terms are more discriminative of the
user’s information need and weighted more highly than other more common terms. Finally, document
length normalization can be applied to reduce the impact of larger documents dominating the docu-
ment rankings. Larger documents have a greater chance of having a larger term frequency than shorter
documents which can bias the search results. Thus, the average document length is computed over
the collection at index construction time and inverse document length is computed for each document,
where the metadata is stored in the mappings table for efficiently searching the collection.
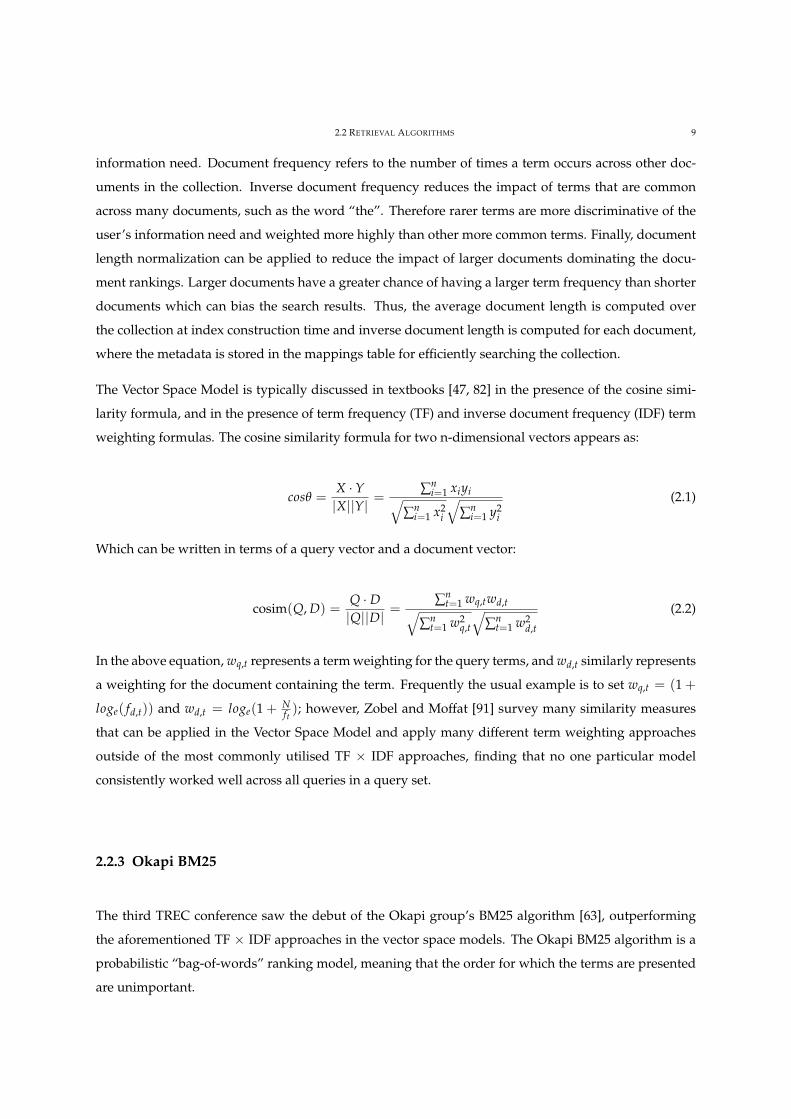
The Vector Space Model is typically discussed in textbooks [47, 82] in the presence of the cosine simi-
larity formula, and in the presence of term frequency (TF) and inverse document frequency (IDF) term
weighting formulas. The cosine similarity formula for two n-dimensional vectors appears as:
cosθ =X ·Y|X||Y| =
∑ni=1 xiyi√
∑ni=1 x2
i
√∑n
i=1 y2i
(2.1)
Which can be written in terms of a query vector and a document vector:
cosim(Q, D) =Q · D|Q||D| =
∑nt=1 wq,twd,t√
∑nt=1 w2
q,t
√∑n
t=1 w2d,t
(2.2)
In the above equation, wq,t represents a term weighting for the query terms, and wd,t similarly represents
a weighting for the document containing the term. Frequently the usual example is to set wq,t = (1 +
loge( fd,t)) and wd,t = loge(1 + Nft); however, Zobel and Moffat [91] survey many similarity measures
that can be applied in the Vector Space Model and apply many different term weighting approaches
outside of the most commonly utilised TF × IDF approaches, finding that no one particular model
consistently worked well across all queries in a query set.
2.2.3 Okapi BM25
The third TREC conference saw the debut of the Okapi group’s BM25 algorithm [63], outperforming
the aforementioned TF × IDF approaches in the vector space models. The Okapi BM25 algorithm is a
probabilistic “bag-of-words” ranking model, meaning that the order for which the terms are presented
are unimportant.
10 2 BACKGROUND
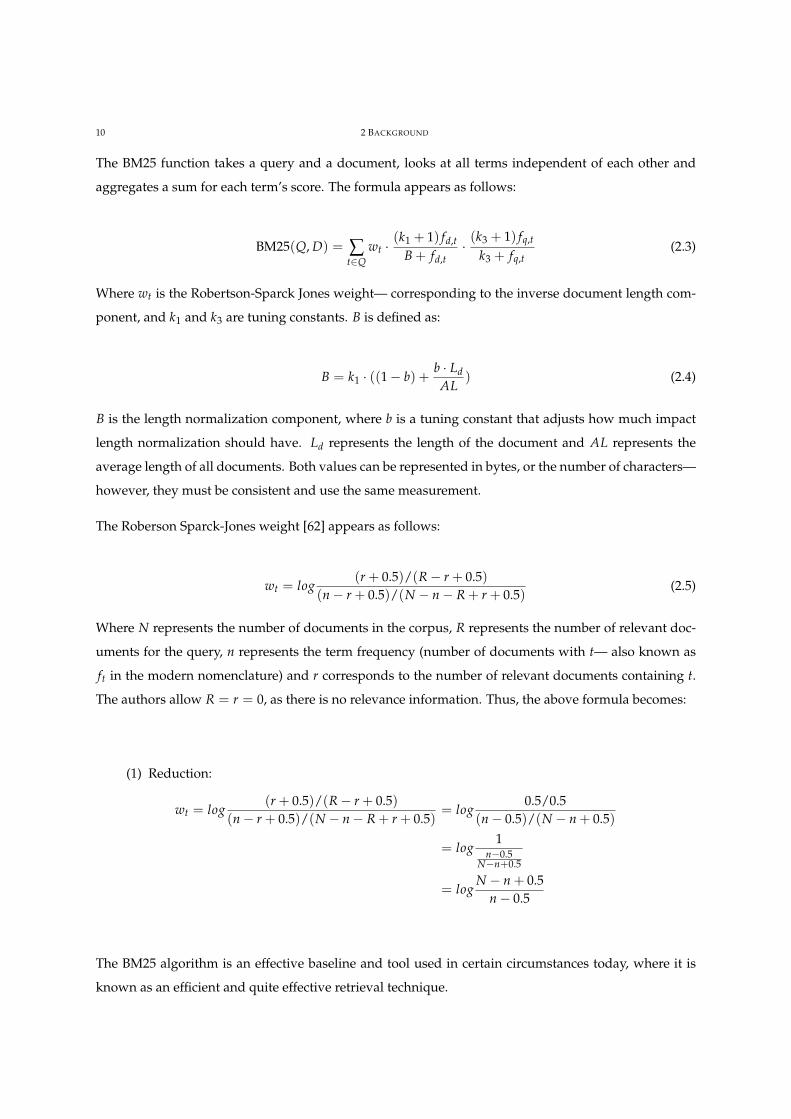
The BM25 function takes a query and a document, looks at all terms independent of each other and
aggregates a sum for each term’s score. The formula appears as follows:
BM25(Q, D) = ∑t∈Q
wt ·(k1 + 1) fd,t
B + fd,t·(k3 + 1) fq,t
k3 + fq,t(2.3)
Where wt is the Robertson-Sparck Jones weight— corresponding to the inverse document length com-
ponent, and k1 and k3 are tuning constants. B is defined as:
B = k1 · ((1− b) +b · LdAL
) (2.4)
B is the length normalization component, where b is a tuning constant that adjusts how much impact
length normalization should have. Ld represents the length of the document and AL represents the
average length of all documents. Both values can be represented in bytes, or the number of characters—
however, they must be consistent and use the same measurement.
The Roberson Sparck-Jones weight [62] appears as follows:
wt = log(r + 0.5)/(R− r + 0.5)
(n− r + 0.5)/(N − n− R + r + 0.5)(2.5)
Where N represents the number of documents in the corpus, R represents the number of relevant doc-
uments for the query, n represents the term frequency (number of documents with t— also known as
ft in the modern nomenclature) and r corresponds to the number of relevant documents containing t.
The authors allow R = r = 0, as there is no relevance information. Thus, the above formula becomes:
(1) Reduction:
wt = log(r + 0.5)/(R− r + 0.5)
(n− r + 0.5)/(N − n− R + r + 0.5)= log
0.5/0.5(n− 0.5)/(N − n + 0.5)
= log1
n−0.5N−n+0.5
= logN − n + 0.5
n− 0.5
The BM25 algorithm is an effective baseline and tool used in certain circumstances today, where it is
known as an efficient and quite effective retrieval technique.
2.2 RETRIEVAL ALGORITHMS 11
2.2.4 Language Model
Ponte and Croft [59] introduce in seminal work a formal argument for the use of a language modeling
retrieval model (LM) in information retrieval. A language model uses conditional probability to identify
words in a sequence, depending on the presence of previous words or on collection-wide term statistics.
A bigram language model appears as such:
P(s) =l
∏i=1
P(ti|ti−1) (2.6)
Where s represents a sentence, and l represents the length of the sentence.
A more general n−gram model appears as:
P(s) =l
∏i=1
P(ti|ti−(n−1), ..., ti−1) (2.7)
Where n is selected depending on the application purposes. Hence, n = 2 for a bigram model, n = 3 for
a trigram model, and so on. A unigram model (n = 1) is also possible, where only P(ti) is considered—
i.e. the probability of the term occuring in the document.
The process of smoothing the language model function is of vital importance, as it allows for tuning
the maximum-likelihood estimator to improve retrieval performance [86]. The smoothing method also
ensures that unseen words are not assigned a value of zero. Zhai and Lafferty [86] survey different LM
smoothing options, and find that some smoothing methods work better for long queries than keyword
queries, and vice versa. The authors also find that parameter selection with these models is of high
importance, relating to term selection formula for traditional retrieval methods.
The LM method has also been applied in topic segmentation domains, that allow for partitioning sec-
tions of text into topical categorization [6].
2.2.5 Markov Random Fields
Metzler and Croft [49] introduce the use of Markov random fields to be used in conjunction with the
aforementioned language model framework. It enables searching over single terms, phrase queries,
bigrams and unordered windows of arbitrary sizes in the same framework. Generally, window sizes of
8 are considered.
12 2 BACKGROUND
For the query catalonia independence movement, the sequential dependency model (SDM) In-
dri query language code is represented as:
# weight (
α #combine ( c a t a l o n i a independence movement )
β1 #combine ( # 1 ( independence movement ) #1( c a t a l o n i a independence ) )
β2 #combine (#uw8( independence movement ) #uw8( c a t a l o n i a independence ) )
)
The α parameter adjusts the weighting of searching over the original query and β adjusts the weightings
for the different SDM components of phrase search and unordered window search. Similarly, the full
dependency model (FDM) is represented as:
# weight (
α #combine ( c a t a l o n i a independence movement )
β1 #combine (
#1( independence movement ) #1( c a t a l o n i a independence )
#1( c a t a l o n i a independence movement )
)
β2 #combine (#uw8( independence movement ) #uw8( c a t a l o n i a movement )
#uw8( c a t a l o n i a independence )
#uw12 ( c a t a l o n i a independence movement )
)
)
Observe that the full dependency model considers more than just the adjacent terms— where a phrase
search of the whole query is issued and catalonia movement is considered in an unordered window.
This can improve the recall of documents related to the query, as a sentence containing catalonia
movement is likely to be relevant to the information need.
Using the SDM model over different fields has also been shown to be effective. Some document col-
lections contain metadata, such as page titles or link-text, which can be utilized to improve retrieval
effectiveness. For the query high court australia over the sequential dependency model using
fields, the Indri fields-based query language representation appears as follows:
# weight (
α1 #combine ( high . t i t l e court . t i t l e a u s t r a l i a . t i t l e )
2.3 EVALUATION 13
α2 #combine ( high . i n l i n k court . i n l i n k a u s t r a l i a . i n l i n k )
α3 #combine ( high . body court . body a u s t r a l i a . body )
β1 #combine ( # 1 ( high . body court . body )
#1( court . body a u s t r a l i a . body ) )
β2 #combine (#uw8( high . body court . body )
#uw8( court . body a u s t r a l i a . body ) )
)
Both of the components high court and court australia are observed as phrase queries using the
sequential dependency model, observing title text, link text, and body text— and are also searched for in
unordered window sizes of eight terms. A drawback to modeling term dependencies is the expensive
computation involved as the number of combinations of terms increase in a query. Bendersky and
Croft [9] show through the use of Markov random fields that shorter queries can be more effective than
verbose queries, by using machine learning techniques to discover and extract key concepts.
2.3 Evaluation
IR test collections, sometimes described as offline evaluation in modern nomenclature, have a long
history dating back to the Cranfield Experiments in the 1960s— describing the need for topics, relevance
assessments and document collections in order to evaluate IR systems [17]. Hofmann et al. [35] provide
a rich discussion on online evaluation methods— where systems are constantly being evaluated based
on signals from users in real-time, where the reader is directed for further information about the topic.
2.3.1 Information Needs
An information need is a description of what a user is attempting to find an answer to, through the
use of an IR system. An information need is typically synonymous with “user request” or topics [33].
Topics to undergo evaluation purposes for test collections must be selected with an intuition that the
collection will be able to resolve that information need somehow. Topics are different from queries, in
that queries are the data structure that is sent to the system to resolve the information need, whereas a
topic describes the information need in different facets. For example, the Robust04 track in TREC for
each topic was supplied a title, a description and a narrative with relevance criteria.
The highly influential paper by Broder [12] describes the tendency for information needs to fall under
three distinct categories, and suggests that search engines should be able to resolve all of them:
14 2 BACKGROUND
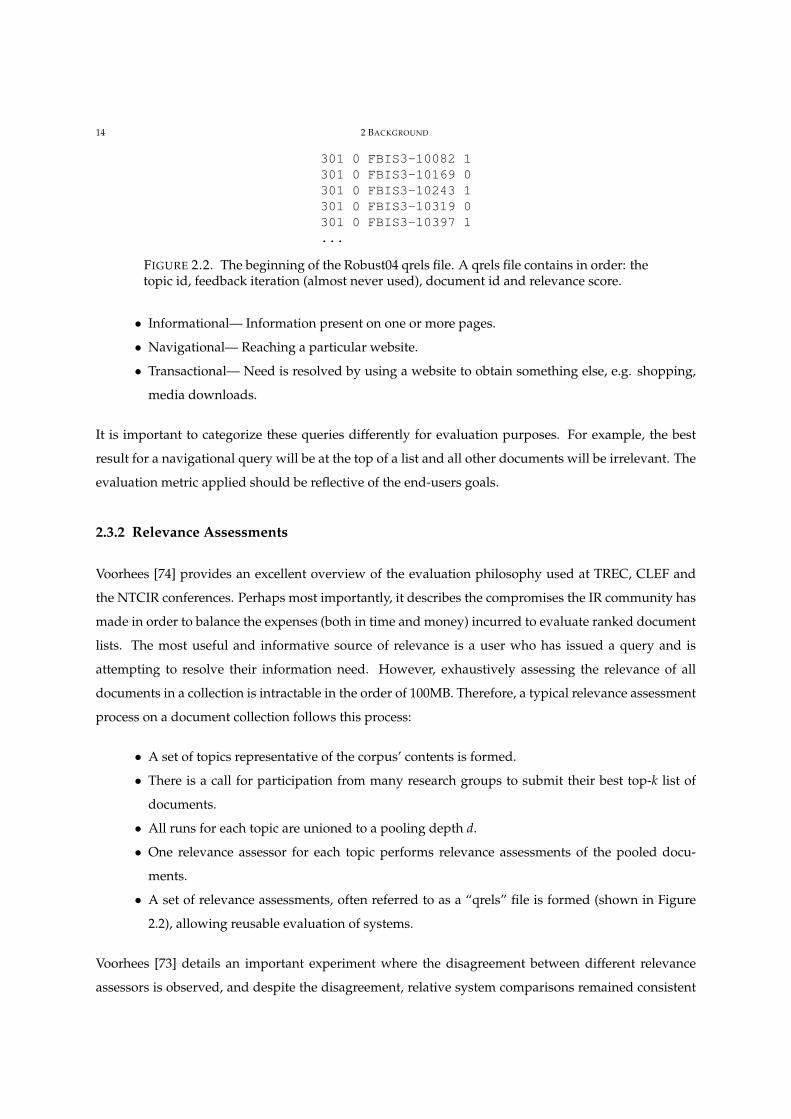
301 0 FBIS3-10082 1301 0 FBIS3-10169 0301 0 FBIS3-10243 1301 0 FBIS3-10319 0301 0 FBIS3-10397 1...
FIGURE 2.2. The beginning of the Robust04 qrels file. A qrels file contains in order: thetopic id, feedback iteration (almost never used), document id and relevance score.
• Informational— Information present on one or more pages.
• Navigational— Reaching a particular website.
• Transactional— Need is resolved by using a website to obtain something else, e.g. shopping,
media downloads.
It is important to categorize these queries differently for evaluation purposes. For example, the best
result for a navigational query will be at the top of a list and all other documents will be irrelevant. The
evaluation metric applied should be reflective of the end-users goals.
2.3.2 Relevance Assessments
Voorhees [74] provides an excellent overview of the evaluation philosophy used at TREC, CLEF and
the NTCIR conferences. Perhaps most importantly, it describes the compromises the IR community has
made in order to balance the expenses (both in time and money) incurred to evaluate ranked document
lists. The most useful and informative source of relevance is a user who has issued a query and is
attempting to resolve their information need. However, exhaustively assessing the relevance of all
documents in a collection is intractable in the order of 100MB. Therefore, a typical relevance assessment
process on a document collection follows this process:
• A set of topics representative of the corpus’ contents is formed.
• There is a call for participation from many research groups to submit their best top-k list of
documents.
• All runs for each topic are unioned to a pooling depth d.
• One relevance assessor for each topic performs relevance assessments of the pooled docu-
ments.
• A set of relevance assessments, often referred to as a “qrels” file is formed (shown in Figure
2.2), allowing reusable evaluation of systems.
Voorhees [73] details an important experiment where the disagreement between different relevance
assessors is observed, and despite the disagreement, relative system comparisons remained consistent
2.3 EVALUATION 15
and conclusive (e.g. System A is better than B over X measure). This paper validates the use of a
single assessor when building test collections, acknowledging aspects of how variable and dynamic
notions of relevance can be [71]. Further work has been conducted recently to gauge the quality of
relevance assessments of crowdsourced workers by observing inter-assessor agreements, to attempt to
make relevance assessments cheaper and similar in quality to the TREC NIST assessed judgments [22].
2.3.3 Document Collections
Voorhees [74] shows throughout the history of TREC experimentation, that the size of document collec-
tions matters— where a technique that works well on small corpora might not necessarily work well
on larger corpora.
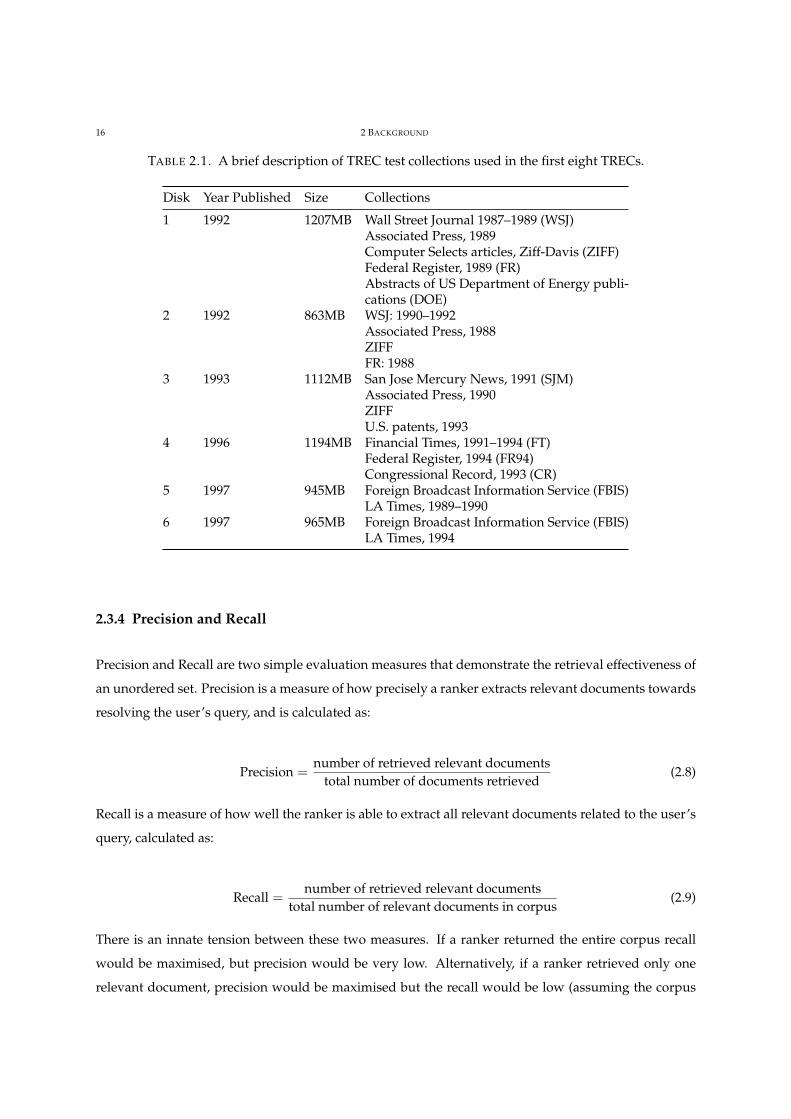
Newswire. Newswire document collections led the TREC framework to the success it has enjoyed.
Harman [33] details the list of text collections used in the first eight TREC experiments, and explains
how they were procured. Table 2.1 provides a brief summary of each of these collections to illustrate
their size and composition. Of note, is the differences between the Federal Register and Department
of Energy document collections, compared to the LA Times collections. These anomalous collections
were intentionally added to the TREC-7 and TREC-8 ad hoc tasks as “noise” sources rather than likely
sources of relevant documents. Harman [34] explains which disks/datasets were used for each TREC
ad hoc retrieval experiment.
Web Data. Harman [34] also details the history of the inclusion of very large datasets in TREC. David
Hawking formed a large newswire collection to explore the efficiency effectiveness effects in larger
collections. The first collection was called VLC1 (very large collection), consisting of 20GB of data in
TREC-6. The second large text collection VLC2 built for TREC-7 is 100GB and contains a combination
of newswire and web data. However, it was deemed an incomplete test collection due to the shallow
judgement pool sizes of 20 documents instead of 100 [34]. The 2GB WT2g collection was formed in
TREC-8, built using a representative sample of the VLC2 collection and shared the same TREC-8 top-
ics as the ad hoc newswire test collection. The TREC 2009 Web Track was the first track to use the
ClueWeb09 collection [15], consisting of over a billion web pages in 10 languages 1. TREC 2013 saw the
inclusion of the ClueWeb12 corpus [18], succeeding the ClueWeb09 corpus. The ClueWeb12 corpus has
733,019,372 pages, however they are all in English 2.
1The ClueWeb09 Dataset https://lemurproject.org/clueweb09/2The ClueWeb12 Dataset https://lemurproject.org/clueweb12/
16 2 BACKGROUND
TABLE 2.1. A brief description of TREC test collections used in the first eight TRECs.
Disk Year Published Size Collections
1 1992 1207MB Wall Street Journal 1987–1989 (WSJ)Associated Press, 1989Computer Selects articles, Ziff-Davis (ZIFF)Federal Register, 1989 (FR)Abstracts of US Department of Energy publi-cations (DOE)
2 1992 863MB WSJ: 1990–1992Associated Press, 1988ZIFFFR: 1988
3 1993 1112MB San Jose Mercury News, 1991 (SJM)Associated Press, 1990ZIFFU.S. patents, 1993
4 1996 1194MB Financial Times, 1991–1994 (FT)Federal Register, 1994 (FR94)Congressional Record, 1993 (CR)
5 1997 945MB Foreign Broadcast Information Service (FBIS)LA Times, 1989–1990
6 1997 965MB Foreign Broadcast Information Service (FBIS)LA Times, 1994
2.3.4 Precision and Recall
Precision and Recall are two simple evaluation measures that demonstrate the retrieval effectiveness of
an unordered set. Precision is a measure of how precisely a ranker extracts relevant documents towards
resolving the user’s query, and is calculated as:
Precision =number of retrieved relevant documents
total number of documents retrieved(2.8)
Recall is a measure of how well the ranker is able to extract all relevant documents related to the user’s
query, calculated as:
Recall =number of retrieved relevant documents
total number of relevant documents in corpus(2.9)
There is an innate tension between these two measures. If a ranker returned the entire corpus recall
would be maximised, but precision would be very low. Alternatively, if a ranker retrieved only one
relevant document, precision would be maximised but the recall would be low (assuming the corpus
2.3 EVALUATION 17
has more than one relevant document). In an ideal scenario, retrieval systems would only return all
relevant documents— thus maximising recall and precision.
Observing the quantitative value of recall in large text collections is problematic, due to the intractability
of exhaustively assessing the relevance of all documents in large collections. Zobel et al. [92] state that
“Measurement of recall is neither feasible nor meaningful in web search,” where they argue that there
is no link between user experience and recall as it is not possible for the user to know how many
relevant documents there are in a collection anyhow. The authors instead take the position that utility-
based evaluation measures observing precision are the only useful measure for large text collections.
We accept this assessment of the situation and the inability to properly measure recall quantitatively.
However, this does not diminish the value and importance of improving recall aspirationally. Although
the user doesn’t know if the recall is high, a user will become more persistent and be trusting of a
system that retrieves many relevant documents if that is their goal, while also maintaining a high level
of precision. Cognizant of these issues, improvement of recall remains an area of high impact, in the
2016 and 2017 TREC high-recall tracks [31, 65], and seven years of running the TREC Legal track 3.
2.3.5 Text REtrieval Conference
The Text REtrieval Conference (TREC) is a venue that started in 1992 funded by the National Insti-
tute of Standards and Technology (NIST) to foster industry collaboration with researchers in improving
IR effectiveness. Prior to this conference, there was little consistency in the evaluation metrics that re-
searchers evaluated their systems with, making knowledge transfer difficult and IR improvements hard
to substantiate. The TIPSTER corpus to be released for IR experimentation in TREC was approximately
a hundred times larger than test collections available in the public domain [77].
Voorhees and Harman [77] states that the four main goals of TREC are to:
• Encourage research in text retrieval based on large test collections
• Increase communication among industry, academia and government by creating an open fo-
rum for the exchange of research ideas
• Speed the transfer of technology from research labs into commercial products by demonstrat-
ing substantial improvements in retrieval technologies on real-world problems
• Increase the availability of appropriate evaluation techniques for use by industry and academia,
including the development of new evaluation techniques more applicable to current systems
3A federated list of all TREC Legal Tracks and their result papers https://trec-legal.umiacs.umd.edu/
18 2 BACKGROUND
The proceedings of TREC have greatly benefited the IR research area by providing many large text col-
lections and doubling retrieval effectiveness in the first eight years of running [78]. The TREC confer-
ence proved the viability of pooled relevance judgments over large-text collections, allowing tractable
measurement of improvement [90].
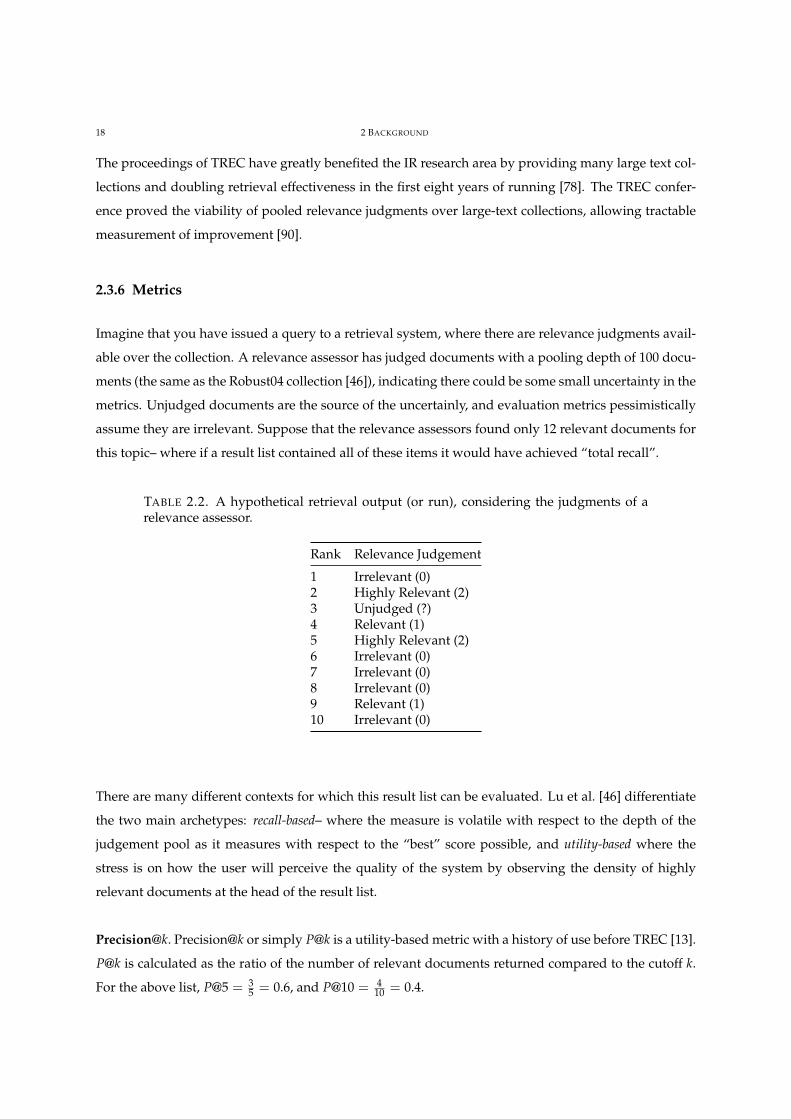
2.3.6 Metrics
Imagine that you have issued a query to a retrieval system, where there are relevance judgments avail-
able over the collection. A relevance assessor has judged documents with a pooling depth of 100 docu-
ments (the same as the Robust04 collection [46]), indicating there could be some small uncertainty in the
metrics. Unjudged documents are the source of the uncertainly, and evaluation metrics pessimistically
assume they are irrelevant. Suppose that the relevance assessors found only 12 relevant documents for
this topic– where if a result list contained all of these items it would have achieved “total recall”.
TABLE 2.2. A hypothetical retrieval output (or run), considering the judgments of arelevance assessor.
Rank Relevance Judgement
1 Irrelevant (0)2 Highly Relevant (2)3 Unjudged (?)4 Relevant (1)5 Highly Relevant (2)6 Irrelevant (0)7 Irrelevant (0)8 Irrelevant (0)9 Relevant (1)10 Irrelevant (0)
There are many different contexts for which this result list can be evaluated. Lu et al. [46] differentiate
the two main archetypes: recall-based– where the measure is volatile with respect to the depth of the
judgement pool as it measures with respect to the “best” score possible, and utility-based where the
stress is on how the user will perceive the quality of the system by observing the density of highly
relevant documents at the head of the result list.
Precision@k. Precision@k or simply P@k is a utility-based metric with a history of use before TREC [13].
P@k is calculated as the ratio of the number of relevant documents returned compared to the cutoff k.
For the above list, P@5 = 35 = 0.6, and P@10 = 4
10 = 0.4.
2.3 EVALUATION 19
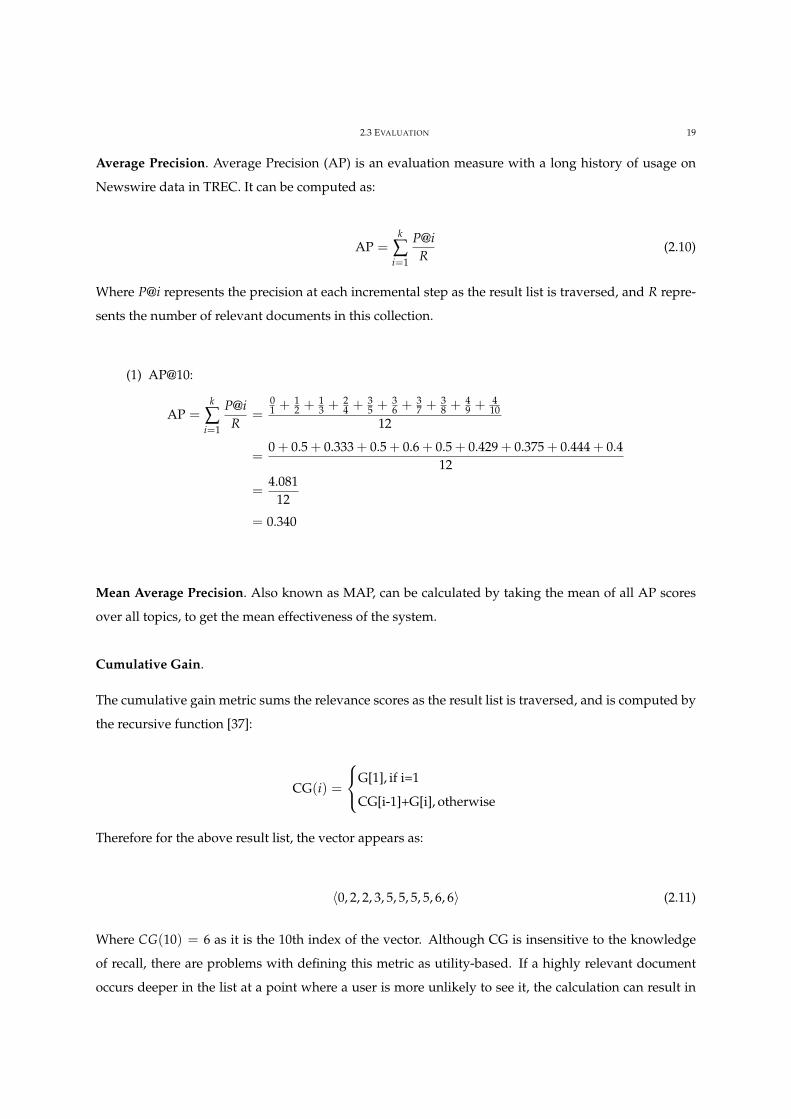
Average Precision. Average Precision (AP) is an evaluation measure with a long history of usage on
Newswire data in TREC. It can be computed as:
AP =k
∑i=1
P@iR
(2.10)
Where P@i represents the precision at each incremental step as the result list is traversed, and R repre-
sents the number of relevant documents in this collection.
(1) AP@10:
AP =k
∑i=1
P@iR
=01 + 1
2 + 13 + 2
4 + 35 + 3
6 + 37 + 3
8 + 49 + 4
1012
=0 + 0.5 + 0.333 + 0.5 + 0.6 + 0.5 + 0.429 + 0.375 + 0.444 + 0.4
12
=4.081
12
= 0.340
Mean Average Precision. Also known as MAP, can be calculated by taking the mean of all AP scores
over all topics, to get the mean effectiveness of the system.
Cumulative Gain.
The cumulative gain metric sums the relevance scores as the result list is traversed, and is computed by
the recursive function [37]:
CG(i) =
G[1], if i=1
CG[i-1]+G[i], otherwise
Therefore for the above result list, the vector appears as:
〈0, 2, 2, 3, 5, 5, 5, 5, 6, 6〉 (2.11)
Where CG(10) = 6 as it is the 10th index of the vector. Although CG is insensitive to the knowledge
of recall, there are problems with defining this metric as utility-based. If a highly relevant document
occurs deeper in the list at a point where a user is more unlikely to see it, the calculation can result in
20 2 BACKGROUND
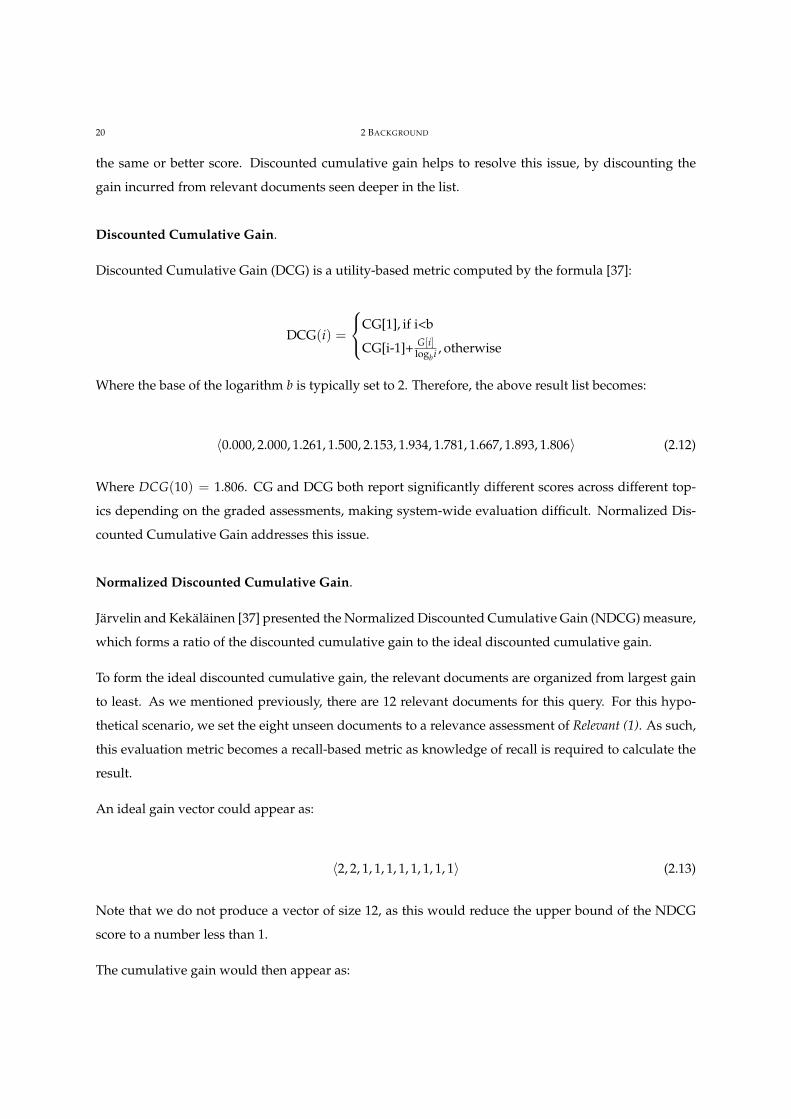
the same or better score. Discounted cumulative gain helps to resolve this issue, by discounting the
gain incurred from relevant documents seen deeper in the list.
Discounted Cumulative Gain.
Discounted Cumulative Gain (DCG) is a utility-based metric computed by the formula [37]:
DCG(i) =
CG[1], if i<b
CG[i-1]+ G[i]logbi , otherwise
Where the base of the logarithm b is typically set to 2. Therefore, the above result list becomes:
〈0.000, 2.000, 1.261, 1.500, 2.153, 1.934, 1.781, 1.667, 1.893, 1.806〉 (2.12)
Where DCG(10) = 1.806. CG and DCG both report significantly different scores across different top-
ics depending on the graded assessments, making system-wide evaluation difficult. Normalized Dis-
counted Cumulative Gain addresses this issue.
Normalized Discounted Cumulative Gain.
Järvelin and Kekäläinen [37] presented the Normalized Discounted Cumulative Gain (NDCG) measure,
which forms a ratio of the discounted cumulative gain to the ideal discounted cumulative gain.
To form the ideal discounted cumulative gain, the relevant documents are organized from largest gain
to least. As we mentioned previously, there are 12 relevant documents for this query. For this hypo-
thetical scenario, we set the eight unseen documents to a relevance assessment of Relevant (1). As such,
this evaluation metric becomes a recall-based metric as knowledge of recall is required to calculate the
result.
An ideal gain vector could appear as:
〈2, 2, 1, 1, 1, 1, 1, 1, 1, 1〉 (2.13)
Note that we do not produce a vector of size 12, as this would reduce the upper bound of the NDCG
score to a number less than 1.
The cumulative gain would then appear as:
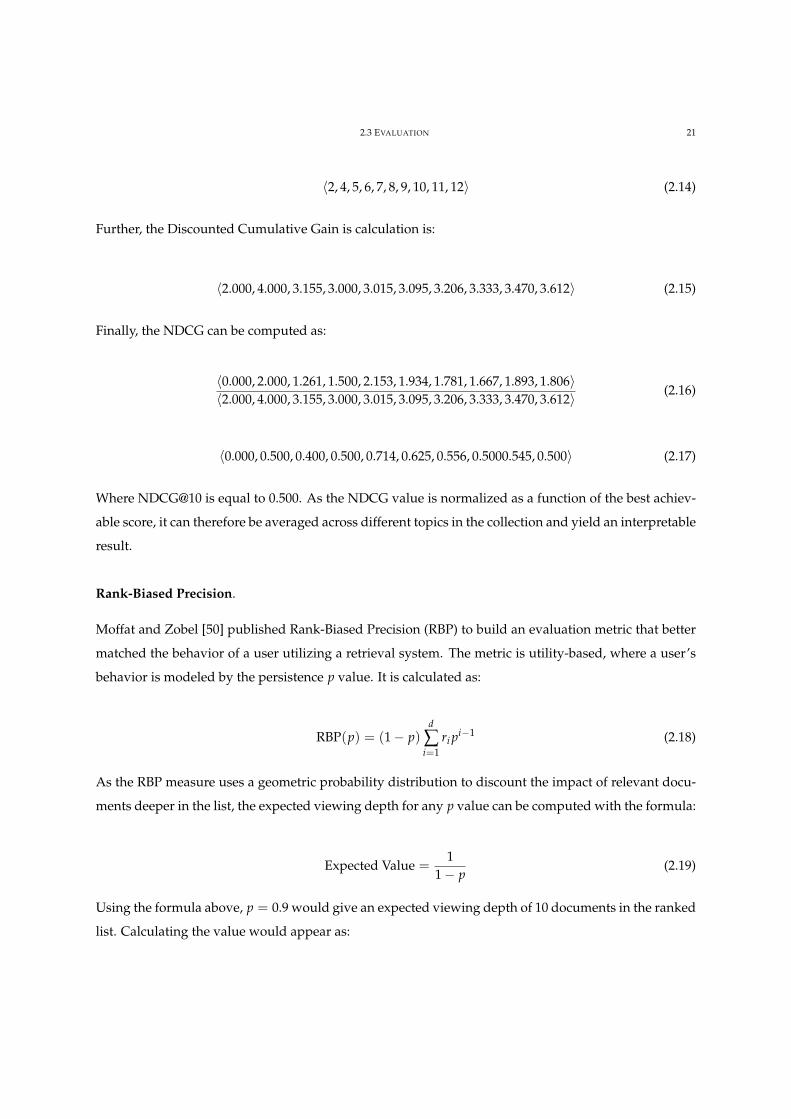
2.3 EVALUATION 21
〈2, 4, 5, 6, 7, 8, 9, 10, 11, 12〉 (2.14)
Further, the Discounted Cumulative Gain is calculation is:
〈2.000, 4.000, 3.155, 3.000, 3.015, 3.095, 3.206, 3.333, 3.470, 3.612〉 (2.15)
Finally, the NDCG can be computed as:
〈0.000, 2.000, 1.261, 1.500, 2.153, 1.934, 1.781, 1.667, 1.893, 1.806〉〈2.000, 4.000, 3.155, 3.000, 3.015, 3.095, 3.206, 3.333, 3.470, 3.612〉 (2.16)
〈0.000, 0.500, 0.400, 0.500, 0.714, 0.625, 0.556, 0.5000.545, 0.500〉 (2.17)
Where NDCG@10 is equal to 0.500. As the NDCG value is normalized as a function of the best achiev-
able score, it can therefore be averaged across different topics in the collection and yield an interpretable
result.
Rank-Biased Precision.
Moffat and Zobel [50] published Rank-Biased Precision (RBP) to build an evaluation metric that better
matched the behavior of a user utilizing a retrieval system. The metric is utility-based, where a user’s
behavior is modeled by the persistence p value. It is calculated as:
RBP(p) = (1− p)d
∑i=1
ri pi−1 (2.18)
As the RBP measure uses a geometric probability distribution to discount the impact of relevant docu-
ments deeper in the list, the expected viewing depth for any p value can be computed with the formula:
Expected Value =1
1− p(2.19)
Using the formula above, p = 0.9 would give an expected viewing depth of 10 documents in the ranked
list. Calculating the value would appear as:
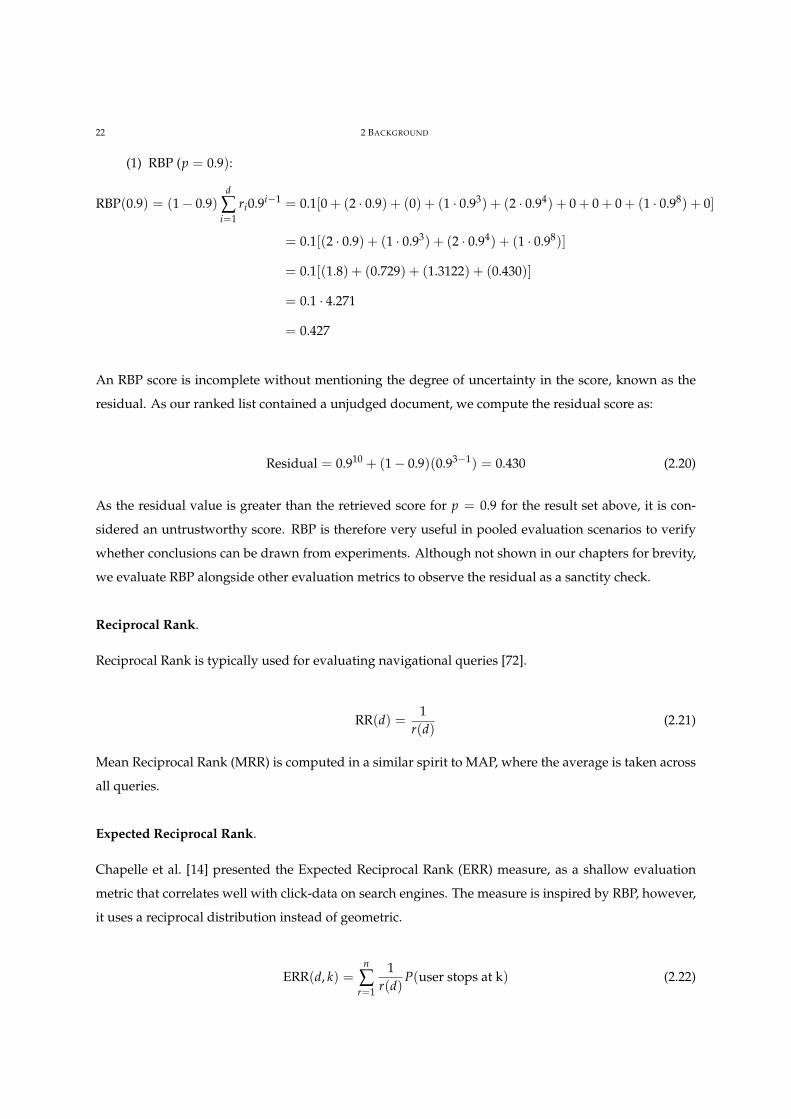
22 2 BACKGROUND
(1) RBP (p = 0.9):
RBP(0.9) = (1− 0.9)d
∑i=1
ri0.9i−1 = 0.1[0 + (2 · 0.9) + (0) + (1 · 0.93) + (2 · 0.94) + 0 + 0 + 0 + (1 · 0.98) + 0]
= 0.1[(2 · 0.9) + (1 · 0.93) + (2 · 0.94) + (1 · 0.98)]
= 0.1[(1.8) + (0.729) + (1.3122) + (0.430)]
= 0.1 · 4.271
= 0.427
An RBP score is incomplete without mentioning the degree of uncertainty in the score, known as the
residual. As our ranked list contained a unjudged document, we compute the residual score as:
Residual = 0.910 + (1− 0.9)(0.93−1) = 0.430 (2.20)
As the residual value is greater than the retrieved score for p = 0.9 for the result set above, it is con-
sidered an untrustworthy score. RBP is therefore very useful in pooled evaluation scenarios to verify
whether conclusions can be drawn from experiments. Although not shown in our chapters for brevity,
we evaluate RBP alongside other evaluation metrics to observe the residual as a sanctity check.
Reciprocal Rank.
Reciprocal Rank is typically used for evaluating navigational queries [72].
RR(d) =1
r(d)(2.21)
Mean Reciprocal Rank (MRR) is computed in a similar spirit to MAP, where the average is taken across
all queries.
Expected Reciprocal Rank.
Chapelle et al. [14] presented the Expected Reciprocal Rank (ERR) measure, as a shallow evaluation
metric that correlates well with click-data on search engines. The measure is inspired by RBP, however,
it uses a reciprocal distribution instead of geometric.
ERR(d, k) =n
∑r=1
1r(d)
P(user stops at k) (2.22)
2.4 QUERY VARIATIONS 23
The probability function used to calculate ERR is defined as:
P(user stops at k) =k−1
∏i=1
(1− Ri)Rk (2.23)
Where Ri represents the probability of being satisfied at the ith document, correlating with the proba-
bility of a click.
2.3.7 Risk-Sensitive Retrieval
The canonical risk-sensitive evaluation measure is URisk for risk-sensitive retrieval, which was used for
risk-sensitive evaluation in the TREC Web tracks in 2013-14 [18, 19]. URisk takes the sum of the wins
minus the sum of losses, where a α value linearly scales the size of the losses to entertain different
scenarios, e.g. α = 1 the losses will be increased twofold, α = 5, sixfold, etc. However, a drawback of
the URisk model is that the scores it returns may obfuscate the risk, and it is not clear how to interpret
them. URisk scores are simple to compute:
URiskα =1|Q|
[∑ Win− (1 + α) ·∑ Loss
](2.24)
URisk is a tool that can be used for descriptive risk-analysis. In conjunction with this method of com-
municating risk, Dinçer et al. [26] recently proposed a new risk-sensitive retrieval evaluation measure
called TRisk, that generalizes the URisk measure to allow for inferential risk analysis. This works by
transforming URisk scores for a selected α value to follow a Student t-distribution. Any given TRisk
score is then provided as a function of the URisk score and the sample error, where values reported
above 2 represent no risk (with statistical significance) compared to a baseline, and conversely, a value
below −2 indicates a statistically significant risk. In more recent work, Dinçer et al. [25] have proposed
several other risk-sensitive measures such as ZRisk, which allows multiple systems to be compared
simultaneously, and GeoRisk which is similar in spirit to GMAP [61] in that it attempts to reward im-
provements on hard topics more than easy ones. However, neither of these are inferential, and so we
limit our exploration to TRisk.
2.4 Query Variations
Noreault et al. [55] had the incidental discovery when evaluating different systems, that when differ-
ent users created queries to resolve the same information need, the amount of overlapping documents
24 2 BACKGROUND
for each user’s result sets were very low. In his study, it was only 9%, and when only relevant docu-
ments are considered it was 22%. Belkin et al. [7] exploit this in an exploration of combining Boolean
queries together to improve retrieval effectiveness. Ten skilled searchers provided a Boolean query
variation, where their queries were combined in five different groups and executed against the retrieval
system. The paper found that in general combining more queries together improves retrieval effective-
ness. Bailey et al. [2] recently provides a collection of free-text queries, pooling a diverse range of query
variations from 263 individuals over 100 topics.
2.4.1 Query Logs
A decade before the release of the UQV100 dataset by Bailey et al. [2], the AOL query logs were con-
troversially released by Pass et al. [56]. The queries were collected from the AOL website, a conduit for
Google search, between the dates of 01 March, 2006 and 31 May, 2006— consisting of 10,154,742 unique
query variations from 657,426 unique users. Data that was originally only available to researchers
working in industry was now publicly available. Having access to the AOL query logs has been of
great benefit for session detection methods in query logs, enabling capture and analysis of query refor-
mulations for example [30].
However, a significant problem with the AOL query logs is that they also supply unique user identifiers
that allow grouping queries by user. Thelma Arnold, a 62-year-old widow’s identity was exposed from
the logs, with personal queries such as numb fingers, 60 single men and dog that urinates
on everything exposed to the public domain [5]. Although Gayo-Avello [30] is aware of how con-
tentious use of the AOL logs is, Gayo-Avello [30] claims that “The main conclusion one can achieves
from such consultations is that any research not aiming the identification of actual people could be
judged as ethically acceptable.” Hafner [32] ran an article in the New York Times entitled “Researchers
yearn to use AOL logs, but they hesitate”, where Professor Kleinberg from Cornell states “The num-
ber of things it reveals about individual people seems much too much. In general, you don’t want to
do research on tainted data.” Bar-Ilan [4] published a paper regarding the troubled state of affairs for
using the AOL query log data with the opinion “Their hesitation is understandable, even though I am
confident that these researchers would not be looking for embarrassing personal data, and only use the
logs for pure research purposes.”
Despite the privacy concerns, it is difficult to suggest that use of the AOL query logs is all bad. West-
erlund et al. [80] use the logs to understand the information seeking behaviors of vulnerable suicidal
Internet users. From a utilitarian perspective, this may lead to a greater good where suicides are avoided
by diverting searchers to help services. Zimmer [88] reviews the privacy concerns of Google using their
2.5 QUERY EXPANSION 25
own search log data internally to improve their search engine, claiming the use of the data is akin to
engaging in a Faustian bargain: Faust, in the legend, traded his soul to the devil in exchange for knowledge.
To “strike a Faustian bargain” is to be willing to sacrifice anything to satisfy a limitless desire for knowledge or
power. Zimmer [89] published an article about Facebook researchers publishing data about its users
in a dataset, where Facebook took the position that the data was already public and therefore unprob-
lematic to use. There’s a similar duality between this mindset and using the AOL query logs, where
just because it’s there and it’s available, it doesn’t mean it’s yours to use. The UQV100 collection and
approaches similar to it are not encumbered by the ethical problems listed above, as participants are
able to opt-in and privacy safeguards can be established in the experimental design.
2.5 Query Expansion
2.5.1 Rocchio-Relevance Feedback
Rocchio [64] presented a human-in-the-loop relevance feedback approach called Rocchio-Relevance
Feedback (also known as explicit, or manual relevance feedback). It works by interactively selecting
documents throughout the search process to shift the user’s original query towards the intended rele-
vant documents, by adding terms to the original query.
Q′ = αQ +β
|R| ∑Dd∈R
Dd −γ
|R| ∑Dd∈R
Dd (2.25)
α, β and γ weight different components of the computation, where α controls how much weight is given
to the original query, β weights the impact of relevantly marked instances, and γ weights how strongly
irrelevant instances are avoided.
2.5.2 Pseudo-Relevance Feedback
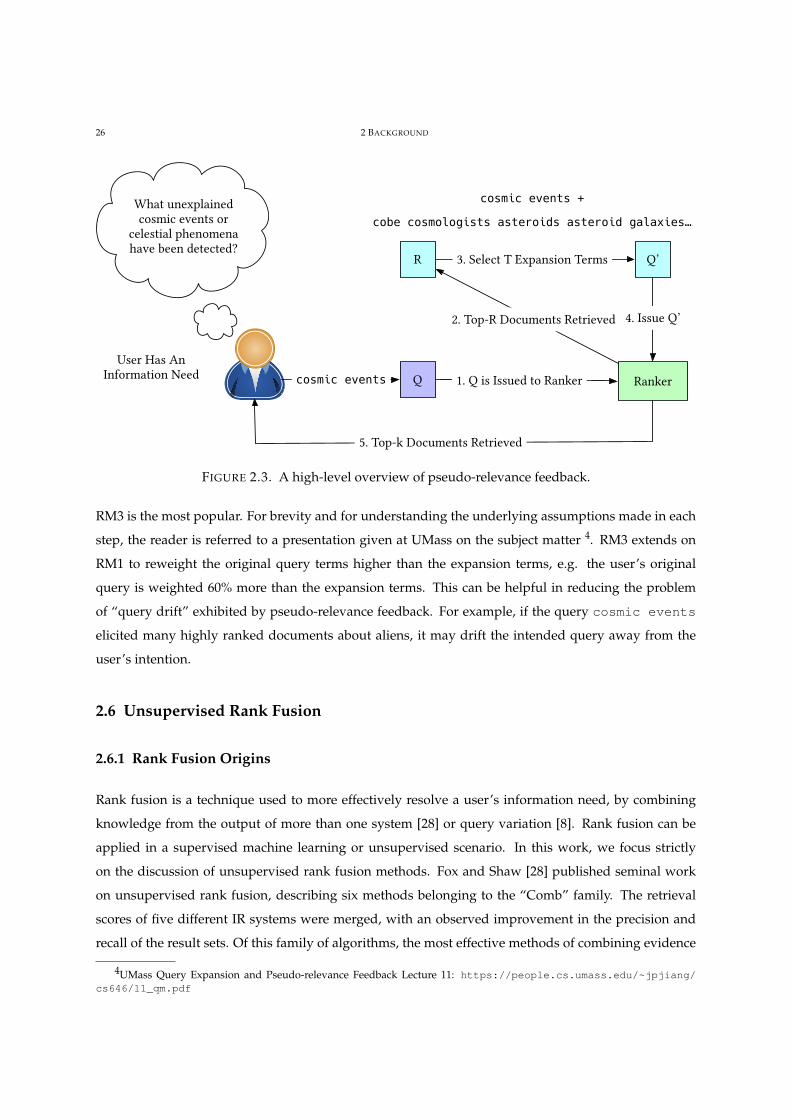
Pseudo-relevance feedback is also sometimes referred to as automatic query expansion. As shown in
Figure 2.3, a user issues a query Q to a system, where it adds expansion terms to the original Q forming
Q′, where the results are then returned to the user. It is denoted at “pseudo” relevance, as the top R
documents are assumed to be relevant sources of information to retrieve the top T expansion terms to be
included in Q′. Billerbeck and Zobel [11] explain that using fixed R and T parameters are questionable
across experiments with different collections, as they are highly sensitive to the document collection.
Lavrenko and Croft [41] introduced the first use of language models over pseudo-relevance feedback,
known as a relevance-based language model. There are four different RM variants, however, in practice
26 2 BACKGROUND
User Has AnInformation Need
What unexplained cosmic events or
celestial phenomena have been detected?
Qcosmic events
Q’
Ranker
R
1. Q is Issued to Ranker
2. Top-R Documents Retrieved
3. Select T Expansion Terms
cobe cosmologists asteroids asteroid galaxies…
4. Issue Q’
5. Top-k Documents Retrieved
cosmic events +
FIGURE 2.3. A high-level overview of pseudo-relevance feedback.
RM3 is the most popular. For brevity and for understanding the underlying assumptions made in each
step, the reader is referred to a presentation given at UMass on the subject matter 4. RM3 extends on
RM1 to reweight the original query terms higher than the expansion terms, e.g. the user’s original
query is weighted 60% more than the expansion terms. This can be helpful in reducing the problem
of “query drift” exhibited by pseudo-relevance feedback. For example, if the query cosmic events
elicited many highly ranked documents about aliens, it may drift the intended query away from the
user’s intention.
2.6 Unsupervised Rank Fusion
2.6.1 Rank Fusion Origins
Rank fusion is a technique used to more effectively resolve a user’s information need, by combining
knowledge from the output of more than one system [28] or query variation [8]. Rank fusion can be
applied in a supervised machine learning or unsupervised scenario. In this work, we focus strictly
on the discussion of unsupervised rank fusion methods. Fox and Shaw [28] published seminal work
on unsupervised rank fusion, describing six methods belonging to the “Comb” family. The retrieval
scores of five different IR systems were merged, with an observed improvement in the precision and
recall of the result sets. Of this family of algorithms, the most effective methods of combining evidence
4UMass Query Expansion and Pseudo-relevance Feedback Lecture 11: https://people.cs.umass.edu/~jpjiang/cs646/11_qm.pdf
2.6 UNSUPERVISED RANK FUSION 27
from the different systems used were CombSUM and CombMNZ. CombSUM, shown in Equation 2.26,
simply aggregates the retrieval score for each document and presents the highest scoring results sorted
in descending order. d in the equations below represents a single document and D refers to the universe
of documents to undergo fusion.
CombSUMScore(d, D) = ∑d∈D
Score(d) (2.26)
CombMNZ shown in Equation 2.27, is similar to CombSUM’s aggregation of retrieval score across dif-
ferent lists, however, this score is further multiplied by the number of times the document has appeared
in all lists. Note that bars in Equation 2.27, and all other equations in this section refer to the cardinality
of the set.
CombMNZScore(d, D) = |d ∈ D| · combSUMScore(d, D) (2.27)
Ng and Kantor [54] performed a regression analysis to determine if improved performance by utilizing
CombSUM could be predicted observing output dissimilarity between lists and a pairwise measure of
the performance between systems [53], with a success rate of 70% over the test set. Wu and McClean
[84] improved on this work, primarily by observing the number of overlapping documents present in
each list as a feature to accurately predict improved performance using CombSUM and CombMNZ
with over 90% accuracy.
Rank fusion algorithms can broadly be classified into two categories [36]. Score-based rank fusion
algorithms such as CombSUM and CombMNZ depend on information learned from the retrieval score
column in a result list. Rank-based fusion algorithms simply rely on the order of documents in each
observed result list. In a rank-based scenario, voting algorithms used for establishing democratically
elected candidates have been abstracted to re-rank documents. The Borda count method developed to
determine the winner of elections in 1784 has been used with success in an IR context (analogous to
Borda-fuse) [23, 85]. A Borda count over a set of lists, observes the rank of each candidate, and sums
the difference in rank position from the total number of candidates in each list. Finally, each candidate
is presented to the user in descending order of this calculation. Condorcet voting was developed a
year later in response to the Borda count method, offering an alternative method of preferential voting
that biases candidates ranking highly across all lists [85]. It was Condorcet’s view that the candidate
with the highest pairwise ranking among all votes (the “Condorcet winner”) would reflect the view of
society’s best candidate. To generalize Condorcet voting to a rank-fusion scenario, an ordered result list
can be formed by iteratively finding and removing the “Condorcet winner” and appending it to the tail
28 2 BACKGROUND
of the final result list to be supplied to the user. Unfortunately, fusion using Condorcet’s voting scheme
is computationally expensive, with the best performing implementation having a time complexity of
O(nklog2n), where n represents the number of lists, and k represents the number of documents [52].
2.6.2 Recent Developments
Cormack et al. [21] found that fusion by summing and sorting the reciprocal rank, for a document over
each list, outperforms Condorcet fusion in effectiveness; naming the method Reciprocal Rank Fusion
(RRF). Equation 2.28 describes the scoring formula, where k = 60 is a constant known to produce
effective results under the test collections evaluated against, and r(d) in this equation, and all further
equations in this section represents the rank position of the document.
RRFScore(d, D, k) = ∑d∈D
1k + r(d)
(2.28)
This unsupervised fusion method has been regarded as a strong baseline in recent work against a su-
pervised rank-fusion method [42]. RRF has been extended by Maurao et al. [48], where the authors
increased the growth rate of the denominator in the reciprocal rank summation to behave quadrati-
cally; named Inverse Square Rank (ISR, Equation 2.29).
ISRScore(d, D) = |d ∈ D| · ∑d∈D
1r(d)2 (2.29)
That is, the weighting of observed ranked documents now follows a hyperbola with a faster growth
rate. The authors experimented with multiplying the summation by the logarithm of the document
frequency in a method similar to CombMNZ, naming the method logISR (Equation 2.30).
logISRScore(d, D) = log(|d ∈ D|) · ∑d∈D
1r(d)2 (2.30)
The conclusion reached in this experimentation is that ISR appears to outperform RRF in the Image-
CLEF medical case retrieval collection, however, RRF outperforms ISR on the ImageCLEF medical im-
age retrieval collection.
Bailey et al. [3] draw inspiration from the Borda-fuse method, altering the approach to aggressively
discount documents ranked deeper in runs by means of a user-model, named Rank Biased Centroid
(RBC, Equation 2.31).
2.6 UNSUPERVISED RANK FUSION 29
RBCScore(d, D, φ) = ∑d∈D
(1− φ)φr(d)−1 (2.31)
This geometric distribution based model is also utilized in the rank-biased precision (RBP) evaluation
metric proposed by Moffat and Zobel [50]. This is a powerful feature of the fusion algorithm, as the
gain function can be tuned to reflect the intrinsic distribution of relevant documents over the document
collection, retrieval function, query quality and type, and judgement pool depth. The authors show that
RBC produces results that are competitive with CombMNZ and Borda count, using the UQV100 test
collection on the ClueWeb12-B corpus [2], and that strong results can be achieved using query fusion.

CHAPTER 3
TREC CORE 2017 User Query Variations
The Text REtrieval Conference (TREC) annually provides a set of research areas named “tracks” which
can differ annually, where each track is a competition to perform a specified IR task in the most effective
manner. Last year, TREC celebrated 25 years of encouraging research in IR over large text collections.
The “Common CORE” 1 track made its debut this year and has the goal of attracting a diverse pool
of high-quality IR search result lists— discussed as “runs” from hereon, to investigate new methods
for creating IR test collections. This is often referred to as an ad hoc retrieval task [78]. For large text
collections, exhaustively judging all documents against a set of queries in a collection is infeasible [39].
TREC makes use of pooled relevance evaluation on large text collections, where a subset of the top-k
documents from each submitted run are unioned to a pooling depth d, and judged on a graded relevance
scale. These judgements and test collections can be used thereafter for evaluating new retrieval systems
as evidence of improved retrieval effectiveness [1].
Participation in CORE is of interest to our goal of improving recall in text retrieval using rank fusion—
where we attempted to develop a recall-oriented approach that exploits user query variations and rank
fusion. We venture that the ability to retrieve a large number of relevant documents that other systems
fail to find is indicative of a high-recall system. As the TREC conference typically attracts runs of a
high effectiveness caliber from research groups worldwide (as was the case for the Robust04 track [76]),
we assert that this is an opportune track to test our approach. The previous TREC newswire ad hoc
task was the “Robust” 2004 track, where the emphasis was on improving the effectiveness of poorly
performing topics in previous tracks. The Robust collection has been one of the most popularly studied
corpora to assert effectiveness claims in a decade of IR research [1]. The TREC CORE 2017 track reuses
the same topic set as Robust04, for the development of relevance judgements over a new New York Times
corpus— composed of newswire articles published between January 1, 1987 and June 19, 2007 2. To our
knowledge, there has never been a call for participation in an ad hoc retrieval task that has existing
relevance judgements available on another corpus of similar textual composition. This allows for the
1TREC 2017 CORE Track: http://trec-core.github.io/2017/2The New York Times Annotated Corpus https://catalog.ldc.upenn.edu/ldc2008t19
31
32 3 TREC CORE 2017 USER QUERY VARIATIONS
first time, evaluation of a transfer learning approach from another collection’s relevance assessments in
the presence of a new collection with a similar composition.
A byproduct of this research is the ability to compare query variation phenomena across corpora in a
consistent and reproducible manner. The UQV100 test collection contains one hundred single-faceted
topics with over five thousand unique query variations [2], however with the limitation they can only be
used on ClueWeb12B. The new query variation collection produced for participation in the CORE track,
while smaller in scope than the UQV100 collection, enables comparisons of query variations to be made
across different document representations and editorial quality. Observing the relative effectiveness
across ClueWeb12-B and Robust04, one composed of websites and another composed of journalistic
content, is of interest to the overall goal of the thesis, as it demonstrates how transferable our approach
is to different corpora, and the rank fusion mechanisms based on those query variations.
Research Goals. In order to achieve these goals, we focus on the related research questions:
Sub-Research Question (S-RQ1): Can tuned parameterized query fusion be used to improve the number of
unique relevant documents found relative to other participants?
Sub-Research Question (S-RQ2): Do query variations that are good in one collection also perform well in
another collection?
Sub-Research Question (S-RQ3): Are the score ranges caused by user query variations consistent across
different test collections?
In the first section, we described the user study conducted to collect query variations for use in this
work. In the second section we discuss our submissions with more detail, and place our query vari-
ations into context with the existing UQV100 test collection. Finally, we list the results of each of our
submitted runs using the NIST assessed fifty queries. As of writing, croudsourced relevance assess-
ments of two hundred topics remains unreleased, reducing the depth of our exploration.
3.1 User Study
In order to collect query variations that could be used in many experimental settings, such as query
fusion and query rewriting over three distinct document collections, a tool to collect variations was
developed. All authors of the published workshop paper Benham et al. [10] contributed up to ten
queries that they thought would be useful to resolve an information need expressed in the 250 topics
to undergo relevance evaluation. They were the only participants in this user study. The information
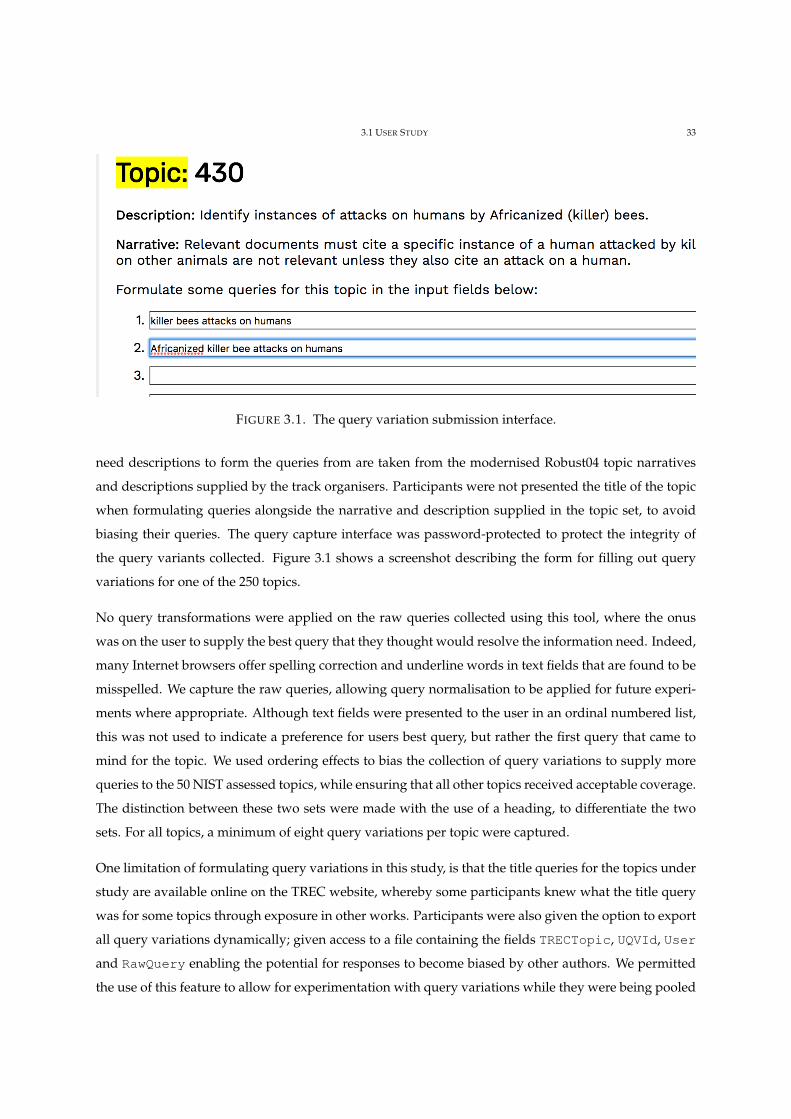
3.1 USER STUDY 33
FIGURE 3.1. The query variation submission interface.
need descriptions to form the queries from are taken from the modernised Robust04 topic narratives
and descriptions supplied by the track organisers. Participants were not presented the title of the topic
when formulating queries alongside the narrative and description supplied in the topic set, to avoid
biasing their queries. The query capture interface was password-protected to protect the integrity of
the query variants collected. Figure 3.1 shows a screenshot describing the form for filling out query
variations for one of the 250 topics.
No query transformations were applied on the raw queries collected using this tool, where the onus
was on the user to supply the best query that they thought would resolve the information need. Indeed,
many Internet browsers offer spelling correction and underline words in text fields that are found to be
misspelled. We capture the raw queries, allowing query normalisation to be applied for future experi-
ments where appropriate. Although text fields were presented to the user in an ordinal numbered list,
this was not used to indicate a preference for users best query, but rather the first query that came to
mind for the topic. We used ordering effects to bias the collection of query variations to supply more
queries to the 50 NIST assessed topics, while ensuring that all other topics received acceptable coverage.
The distinction between these two sets were made with the use of a heading, to differentiate the two
sets. For all topics, a minimum of eight query variations per topic were captured.
One limitation of formulating query variations in this study, is that the title queries for the topics under
study are available online on the TREC website, whereby some participants knew what the title query
was for some topics through exposure in other works. Participants were also given the option to export
all query variations dynamically; given access to a file containing the fields TRECTopic, UQVId, User
and RawQuery enabling the potential for responses to become biased by other authors. We permitted
the use of this feature to allow for experimentation with query variations while they were being pooled
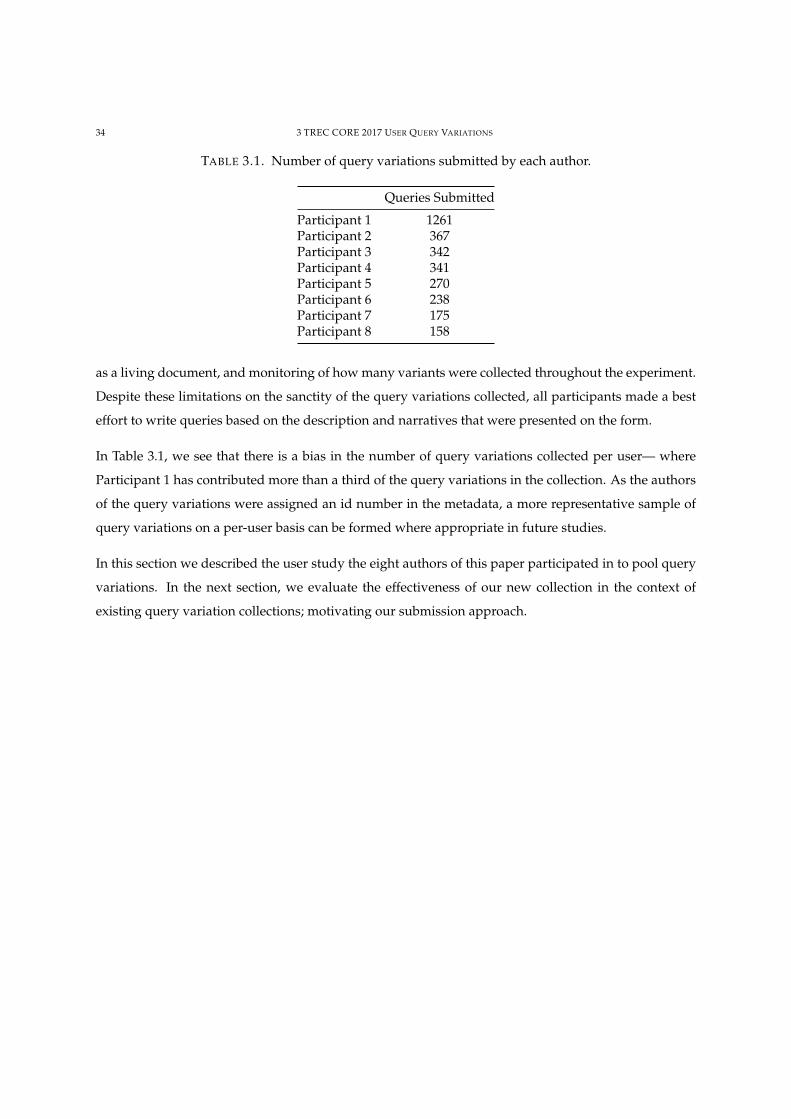
34 3 TREC CORE 2017 USER QUERY VARIATIONS
TABLE 3.1. Number of query variations submitted by each author.
Queries Submitted
Participant 1 1261Participant 2 367Participant 3 342Participant 4 341Participant 5 270Participant 6 238Participant 7 175Participant 8 158
as a living document, and monitoring of how many variants were collected throughout the experiment.
Despite these limitations on the sanctity of the query variations collected, all participants made a best
effort to write queries based on the description and narratives that were presented on the form.
In Table 3.1, we see that there is a bias in the number of query variations collected per user— where
Participant 1 has contributed more than a third of the query variations in the collection. As the authors
of the query variations were assigned an id number in the metadata, a more representative sample of
query variations on a per-user basis can be formed where appropriate in future studies.
In this section we described the user study the eight authors of this paper participated in to pool query
variations. In the next section, we evaluate the effectiveness of our new collection in the context of
existing query variation collections; motivating our submission approach.
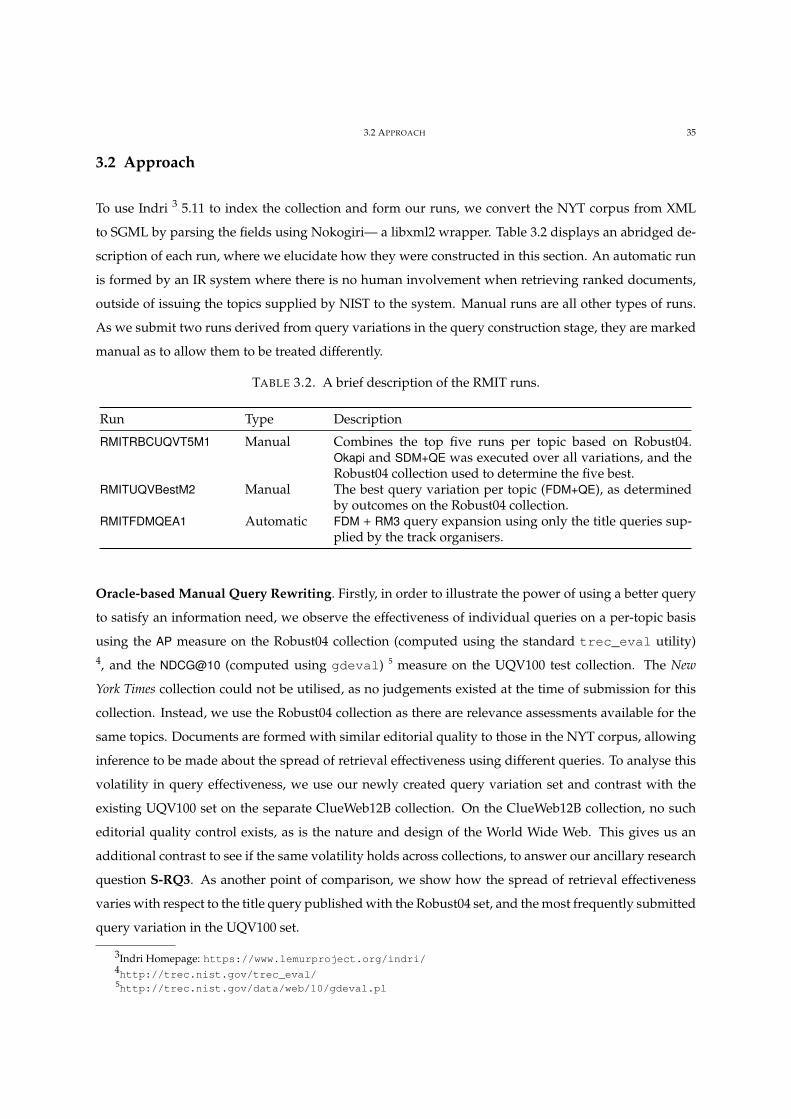
3.2 APPROACH 35
3.2 Approach
To use Indri 3 5.11 to index the collection and form our runs, we convert the NYT corpus from XML
to SGML by parsing the fields using Nokogiri— a libxml2 wrapper. Table 3.2 displays an abridged de-
scription of each run, where we elucidate how they were constructed in this section. An automatic run
is formed by an IR system where there is no human involvement when retrieving ranked documents,
outside of issuing the topics supplied by NIST to the system. Manual runs are all other types of runs.
As we submit two runs derived from query variations in the query construction stage, they are marked
manual as to allow them to be treated differently.
TABLE 3.2. A brief description of the RMIT runs.
Run Type Description
RMITRBCUQVT5M1 Manual Combines the top five runs per topic based on Robust04.Okapi and SDM+QE was executed over all variations, and theRobust04 collection used to determine the five best.
RMITUQVBestM2 Manual The best query variation per topic (FDM+QE), as determinedby outcomes on the Robust04 collection.
RMITFDMQEA1 Automatic FDM + RM3 query expansion using only the title queries sup-plied by the track organisers.
Oracle-based Manual Query Rewriting. Firstly, in order to illustrate the power of using a better query
to satisfy an information need, we observe the effectiveness of individual queries on a per-topic basis
using the AP measure on the Robust04 collection (computed using the standard trec_eval utility)4, and the NDCG@10 (computed using gdeval) 5 measure on the UQV100 test collection. The New
York Times collection could not be utilised, as no judgements existed at the time of submission for this
collection. Instead, we use the Robust04 collection as there are relevance assessments available for the
same topics. Documents are formed with similar editorial quality to those in the NYT corpus, allowing
inference to be made about the spread of retrieval effectiveness using different queries. To analyse this
volatility in query effectiveness, we use our newly created query variation set and contrast with the
existing UQV100 set on the separate ClueWeb12B collection. On the ClueWeb12B collection, no such
editorial quality control exists, as is the nature and design of the World Wide Web. This gives us an
additional contrast to see if the same volatility holds across collections, to answer our ancillary research
question S-RQ3. As another point of comparison, we show how the spread of retrieval effectiveness
varies with respect to the title query published with the Robust04 set, and the most frequently submitted
query variation in the UQV100 set.
3Indri Homepage: https://www.lemurproject.org/indri/4http://trec.nist.gov/trec_eval/5http://trec.nist.gov/data/web/10/gdeval.pl
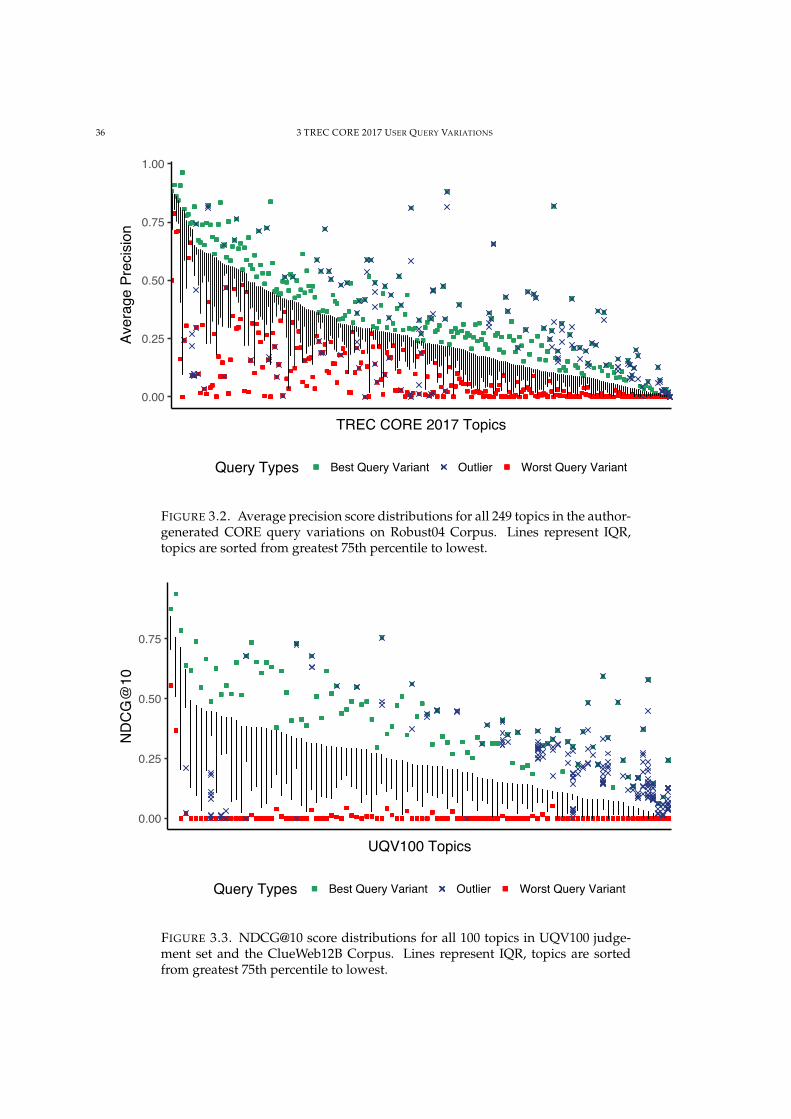
36 3 TREC CORE 2017 USER QUERY VARIATIONS
0.00
0.25
0.50
0.75
1.00
TREC CORE 2017 Topics
Ave
rag
e P
recis
ion
Query Types Best Query Variant Outlier Worst Query Variant
FIGURE 3.2. Average precision score distributions for all 249 topics in the author-generated CORE query variations on Robust04 Corpus. Lines represent IQR,topics are sorted from greatest 75th percentile to lowest.
0.00
0.25
0.50
0.75
UQV100 Topics
ND
CG
@1
0
Query Types Best Query Variant Outlier Worst Query Variant
FIGURE 3.3. NDCG@10 score distributions for all 100 topics in UQV100 judge-ment set and the ClueWeb12B Corpus. Lines represent IQR, topics are sortedfrom greatest 75th percentile to lowest.
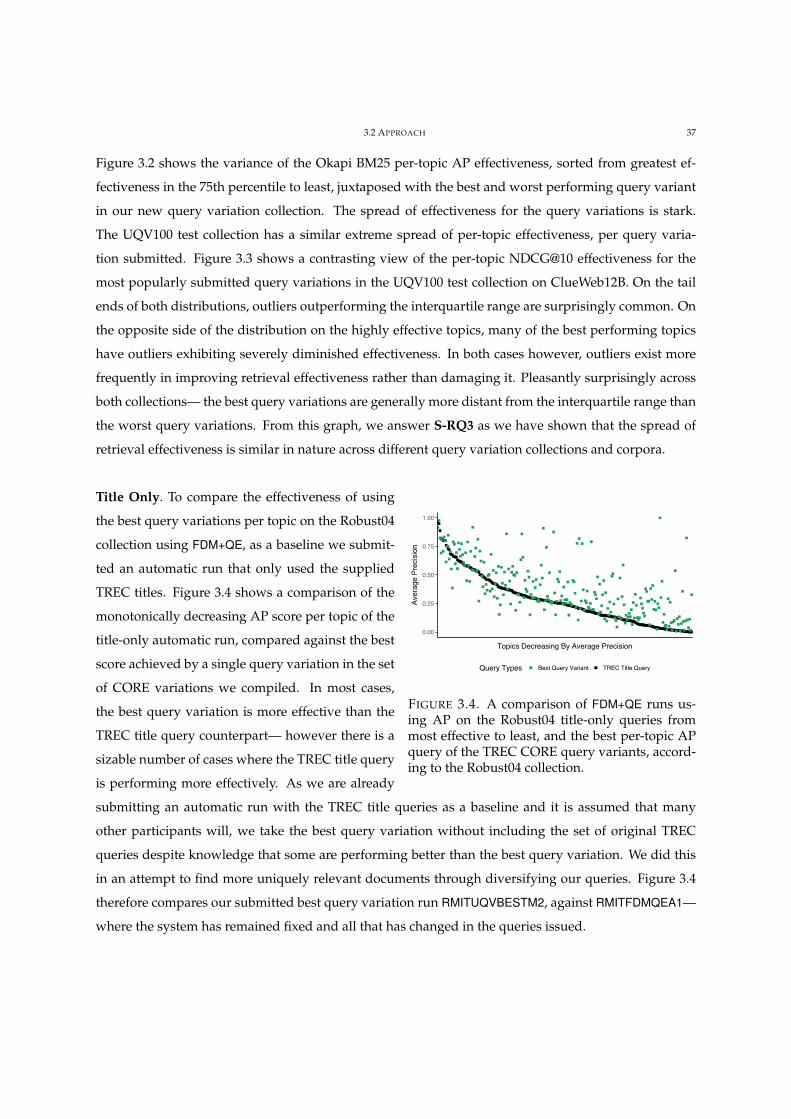
3.2 APPROACH 37
Figure 3.2 shows the variance of the Okapi BM25 per-topic AP effectiveness, sorted from greatest ef-
fectiveness in the 75th percentile to least, juxtaposed with the best and worst performing query variant
in our new query variation collection. The spread of effectiveness for the query variations is stark.
The UQV100 test collection has a similar extreme spread of per-topic effectiveness, per query varia-
tion submitted. Figure 3.3 shows a contrasting view of the per-topic NDCG@10 effectiveness for the
most popularly submitted query variations in the UQV100 test collection on ClueWeb12B. On the tail
ends of both distributions, outliers outperforming the interquartile range are surprisingly common. On
the opposite side of the distribution on the highly effective topics, many of the best performing topics
have outliers exhibiting severely diminished effectiveness. In both cases however, outliers exist more
frequently in improving retrieval effectiveness rather than damaging it. Pleasantly surprisingly across
both collections— the best query variations are generally more distant from the interquartile range than
the worst query variations. From this graph, we answer S-RQ3 as we have shown that the spread of
retrieval effectiveness is similar in nature across different query variation collections and corpora.
0.00
0.25
0.50
0.75
1.00
Topics Decreasing By Average Precision
Ave
rag
e P
recis
ion
Query Types Best Query Variant TREC Title Query
FIGURE 3.4. A comparison of FDM+QE runs us-ing AP on the Robust04 title-only queries frommost effective to least, and the best per-topic APquery of the TREC CORE query variants, accord-ing to the Robust04 collection.
Title Only. To compare the effectiveness of using
the best query variations per topic on the Robust04
collection using FDM+QE, as a baseline we submit-
ted an automatic run that only used the supplied
TREC titles. Figure 3.4 shows a comparison of the
monotonically decreasing AP score per topic of the
title-only automatic run, compared against the best
score achieved by a single query variation in the set
of CORE variations we compiled. In most cases,
the best query variation is more effective than the
TREC title query counterpart— however there is a
sizable number of cases where the TREC title query
is performing more effectively. As we are already
submitting an automatic run with the TREC title queries as a baseline and it is assumed that many
other participants will, we take the best query variation without including the set of original TREC
queries despite knowledge that some are performing better than the best query variation. We did this
in an attempt to find more uniquely relevant documents through diversifying our queries. Figure 3.4
therefore compares our submitted best query variation run RMITUQVBESTM2, against RMITFDMQEA1—
where the system has remained fixed and all that has changed in the queries issued.
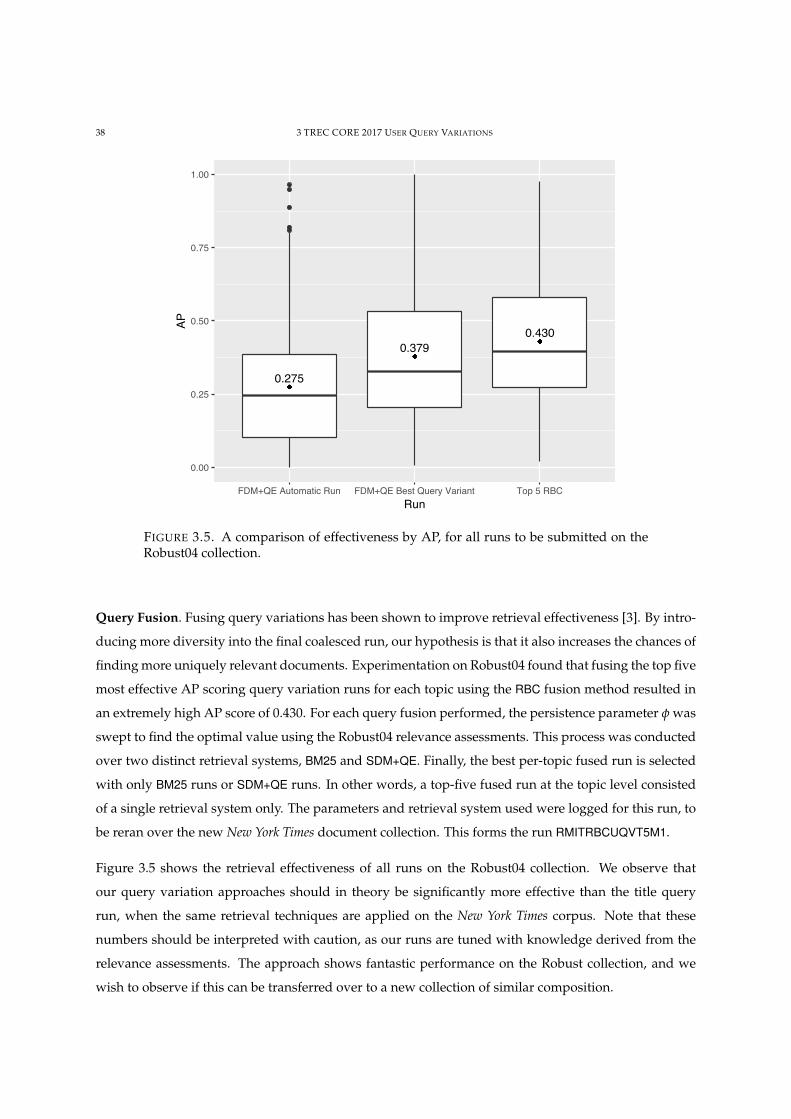
38 3 TREC CORE 2017 USER QUERY VARIATIONS
0.275
0.379
0.430
0.00
0.25
0.50
0.75
1.00
FDM+QE Automatic Run FDM+QE Best Query Variant Top 5 RBC
Run
AP
FIGURE 3.5. A comparison of effectiveness by AP, for all runs to be submitted on theRobust04 collection.
Query Fusion. Fusing query variations has been shown to improve retrieval effectiveness [3]. By intro-
ducing more diversity into the final coalesced run, our hypothesis is that it also increases the chances of
finding more uniquely relevant documents. Experimentation on Robust04 found that fusing the top five
most effective AP scoring query variation runs for each topic using the RBC fusion method resulted in
an extremely high AP score of 0.430. For each query fusion performed, the persistence parameter φ was
swept to find the optimal value using the Robust04 relevance assessments. This process was conducted
over two distinct retrieval systems, BM25 and SDM+QE. Finally, the best per-topic fused run is selected
with only BM25 runs or SDM+QE runs. In other words, a top-five fused run at the topic level consisted
of a single retrieval system only. The parameters and retrieval system used were logged for this run, to
be reran over the new New York Times document collection. This forms the run RMITRBCUQVT5M1.
Figure 3.5 shows the retrieval effectiveness of all runs on the Robust04 collection. We observe that
our query variation approaches should in theory be significantly more effective than the title query
run, when the same retrieval techniques are applied on the New York Times corpus. Note that these
numbers should be interpreted with caution, as our runs are tuned with knowledge derived from the
relevance assessments. The approach shows fantastic performance on the Robust collection, and we
wish to observe if this can be transferred over to a new collection of similar composition.
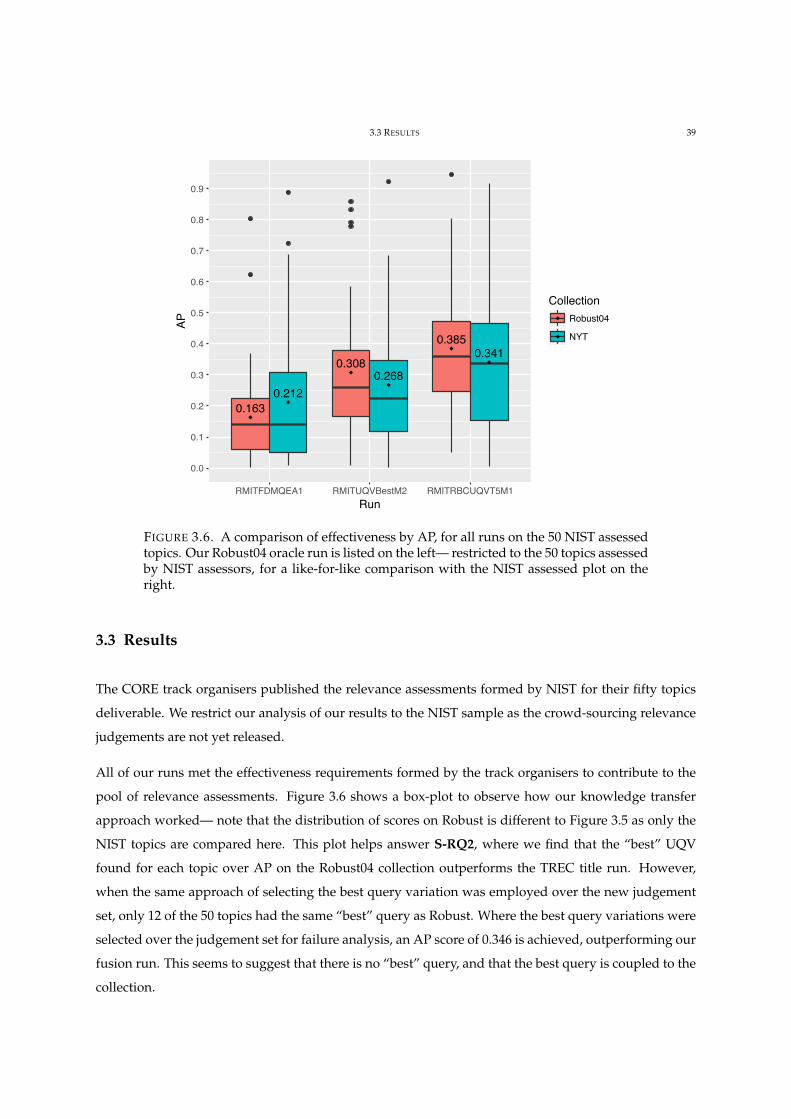
3.3 RESULTS 39
0.163
0.212
0.3080.268
0.3850.341
0.0
0.1
0.2
0.3
0.4
0.5
0.6
0.7
0.8
0.9
RMITFDMQEA1 RMITUQVBestM2 RMITRBCUQVT5M1
Run
AP
Collection
Robust04
NYT
FIGURE 3.6. A comparison of effectiveness by AP, for all runs on the 50 NIST assessedtopics. Our Robust04 oracle run is listed on the left— restricted to the 50 topics assessedby NIST assessors, for a like-for-like comparison with the NIST assessed plot on theright.
3.3 Results
The CORE track organisers published the relevance assessments formed by NIST for their fifty topics
deliverable. We restrict our analysis of our results to the NIST sample as the crowd-sourcing relevance
judgements are not yet released.
All of our runs met the effectiveness requirements formed by the track organisers to contribute to the
pool of relevance assessments. Figure 3.6 shows a box-plot to observe how our knowledge transfer
approach worked— note that the distribution of scores on Robust is different to Figure 3.5 as only the
NIST topics are compared here. This plot helps answer S-RQ2, where we find that the “best” UQV
found for each topic over AP on the Robust04 collection outperforms the TREC title run. However,
when the same approach of selecting the best query variation was employed over the new judgement
set, only 12 of the 50 topics had the same “best” query as Robust. Where the best query variations were
selected over the judgement set for failure analysis, an AP score of 0.346 is achieved, outperforming our
fusion run. This seems to suggest that there is no “best” query, and that the best query is coupled to the
collection.
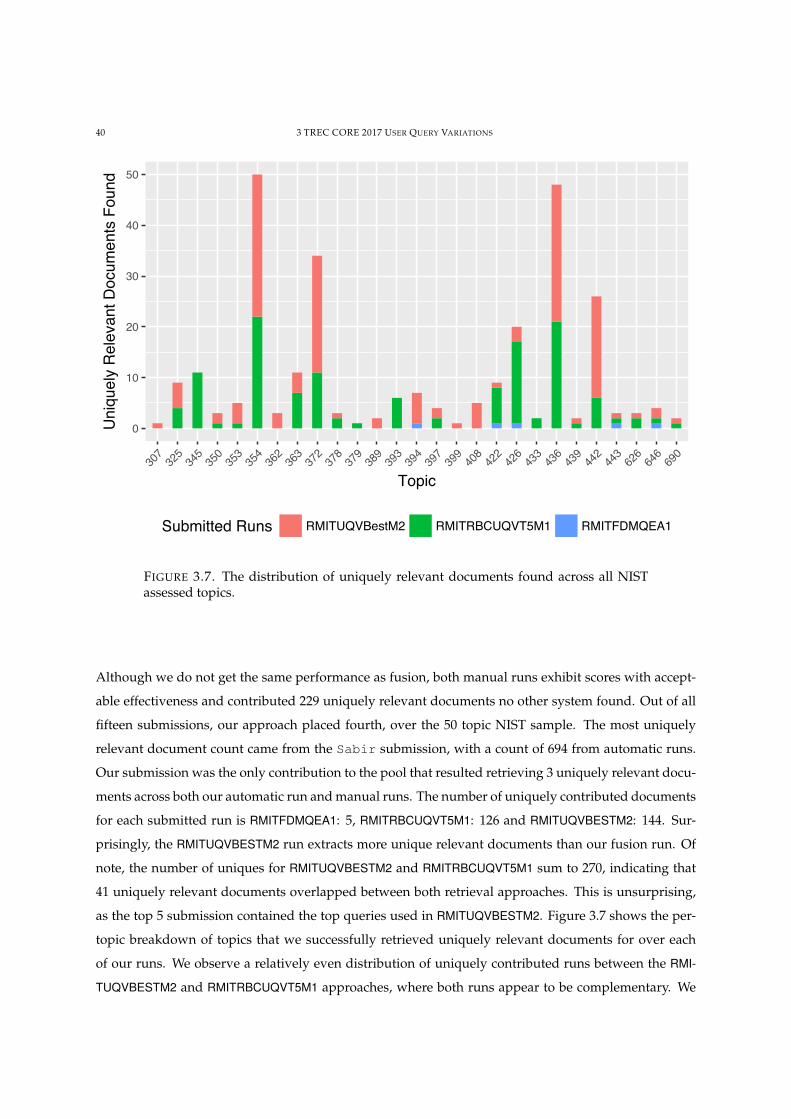
40 3 TREC CORE 2017 USER QUERY VARIATIONS
0
10
20
30
40
50
307
325
345
350
353
354
362
363
372
378
379
389
393
394
397
399
408
422
426
433
436
439
442
443
626
646
690
Topic
Un
iqu
ely
Re
leva
nt
Do
cu
me
nts
Fo
un
d
Submitted Runs RMITUQVBestM2 RMITRBCUQVT5M1 RMITFDMQEA1
FIGURE 3.7. The distribution of uniquely relevant documents found across all NISTassessed topics.
Although we do not get the same performance as fusion, both manual runs exhibit scores with accept-
able effectiveness and contributed 229 uniquely relevant documents no other system found. Out of all
fifteen submissions, our approach placed fourth, over the 50 topic NIST sample. The most uniquely
relevant document count came from the Sabir submission, with a count of 694 from automatic runs.
Our submission was the only contribution to the pool that resulted retrieving 3 uniquely relevant docu-
ments across both our automatic run and manual runs. The number of uniquely contributed documents
for each submitted run is RMITFDMQEA1: 5, RMITRBCUQVT5M1: 126 and RMITUQVBESTM2: 144. Sur-
prisingly, the RMITUQVBESTM2 run extracts more unique relevant documents than our fusion run. Of
note, the number of uniques for RMITUQVBESTM2 and RMITRBCUQVT5M1 sum to 270, indicating that
41 uniquely relevant documents overlapped between both retrieval approaches. This is unsurprising,
as the top 5 submission contained the top queries used in RMITUQVBESTM2. Figure 3.7 shows the per-
topic breakdown of topics that we successfully retrieved uniquely relevant documents for over each
of our runs. We observe a relatively even distribution of uniquely contributed runs between the RMI-
TUQVBESTM2 and RMITRBCUQVT5M1 approaches, where both runs appear to be complementary. We
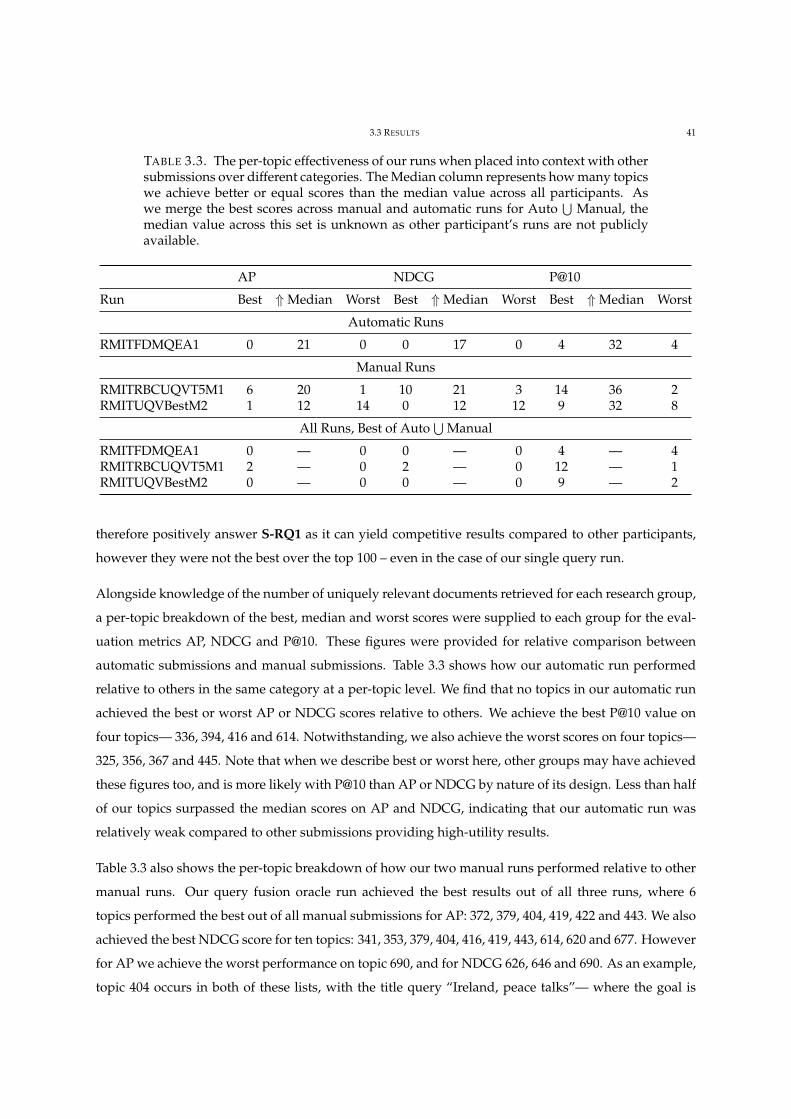
3.3 RESULTS 41
TABLE 3.3. The per-topic effectiveness of our runs when placed into context with othersubmissions over different categories. The Median column represents how many topicswe achieve better or equal scores than the median value across all participants. Aswe merge the best scores across manual and automatic runs for Auto
⋃Manual, the
median value across this set is unknown as other participant’s runs are not publiclyavailable.
AP NDCG P@10
Run Best ⇑Median Worst Best ⇑Median Worst Best ⇑Median Worst
Automatic Runs
RMITFDMQEA1 0 21 0 0 17 0 4 32 4
Manual Runs
RMITRBCUQVT5M1 6 20 1 10 21 3 14 36 2RMITUQVBestM2 1 12 14 0 12 12 9 32 8
All Runs, Best of Auto⋃
Manual
RMITFDMQEA1 0 — 0 0 — 0 4 — 4RMITRBCUQVT5M1 2 — 0 2 — 0 12 — 1RMITUQVBestM2 0 — 0 0 — 0 9 — 2
therefore positively answer S-RQ1 as it can yield competitive results compared to other participants,
however they were not the best over the top 100 – even in the case of our single query run.
Alongside knowledge of the number of uniquely relevant documents retrieved for each research group,
a per-topic breakdown of the best, median and worst scores were supplied to each group for the eval-
uation metrics AP, NDCG and P@10. These figures were provided for relative comparison between
automatic submissions and manual submissions. Table 3.3 shows how our automatic run performed
relative to others in the same category at a per-topic level. We find that no topics in our automatic run
achieved the best or worst AP or NDCG scores relative to others. We achieve the best P@10 value on
four topics— 336, 394, 416 and 614. Notwithstanding, we also achieve the worst scores on four topics—
325, 356, 367 and 445. Note that when we describe best or worst here, other groups may have achieved
these figures too, and is more likely with P@10 than AP or NDCG by nature of its design. Less than half
of our topics surpassed the median scores on AP and NDCG, indicating that our automatic run was
relatively weak compared to other submissions providing high-utility results.
Table 3.3 also shows the per-topic breakdown of how our two manual runs performed relative to other
manual runs. Our query fusion oracle run achieved the best results out of all three runs, where 6
topics performed the best out of all manual submissions for AP: 372, 379, 404, 419, 422 and 443. We also
achieved the best NDCG score for ten topics: 341, 353, 379, 404, 416, 419, 443, 614, 620 and 677. However
for AP we achieve the worst performance on topic 690, and for NDCG 626, 646 and 690. As an example,
topic 404 occurs in both of these lists, with the title query “Ireland, peace talks”— where the goal is
42 3 TREC CORE 2017 USER QUERY VARIATIONS
to extract documents that discuss “How often were the peace talks in Ireland delayed or disrupted as
a result of acts of violence?”. The most effective query fusion configuration found on the Robust04
set, were the query variations (in order): “ireland peace talk delay violence bombing”, “ireland peace
talks disruption roken off violence attack threat fighter IRA republican army british ulster”, “peace
talks delayed Ireland violence”, “Ireland peace talk delay disrupt violence” and “North Ireland peace
process delayed violence”. All of these query variations were fused using RBC φ = 0.99, where it was
found that BM25 gave more effective results than SDM+QE for this query on the Robust04 collection. Our
best query variation run RMITUQVBestM2 achieved the best AP score for topic 435 “curbing population
growth”, with the query “population growth control”.
Finally, in Table 3.3, we merge the best and worst scores across automatic and manual submissions to see
how we compared globally against all participants. RMITRBCUQVT5M1 achieves the best AP scores on a
per-topic level for topics 372; “Native American casino” with AP score 0.691 and 379; “mainstreaming”
with score 0.374. The median scores for both of these queries were 0.423 and 0.199 respectively. For
NDCG, 379 reappears with the NDCG score of 0.781 where the median is 0.549, and 416; “Three Gorges
Project” appears with the NDCG score 0.912 where the median is 0.855.
3.4 Conclusion
All three of our runs met the track organisers quality criteria for inclusion into the judgement pool.
RMITRBCUQVT5M1 was our most effective run for AP achieving an AP score of 0.341, however RMI-
TUQVBestM2 attracted more unique and relevant documents than the former to cutoff 100. We were
met with some fierce competition in the track, where we were outperformed in uniquely contributed
documents by the Sabir run produced by Chris Buckley, and two submissions from the University of
Waterloo— placing us fourth out of fifteen participants in this respect. Our automatic run did not ap-
pear to perform well compared to other automatic submissions, however we did not anticipate it to
do so as it was used as a baseline for comparison with our manual query fusion approaches. Query
fusion was able to produce a highly effective result list with a sub-par retrieval model in comparison
to other participants. This confirms previous observations that query fusion is an highly effective tech-
nique in maximising recall, and we look to pursue further experimentation with it in future work using
stronger systems— indeed learning from the notebook papers submitted from other participants. We
are pleased with our results and very much look forward to reading about the approaches other partic-
ipants utilised, and to participate in future ad hoc retrieval tracks.
CHAPTER 4
Risk-Reward Trade-offs in Rank Fusion
Unsupervised rank fusion, the process of combining knowledge from many Information Retrieval out-
puts into one coalesced set, is a classic approach used in Information Retrieval to improve the utility
of results displayed to users. This can be accomplished by combining the outputs from multiple sys-
tems [28] or multiple expressions of a single information need (query variation) [8]. The generation of
this set can be varied by the fusion method(s) utilized, systems used, the topics used, or all of the above.
These techniques have been a mainstay in IR research, but have fallen out of favour in recent years as
search engines move to more complex Learning-to-Rank (LtR) Models. However, as search engines
become more reliant on stage-wise retrieval, combining rank fusion and LtR models in interesting new
ways is likely to reap additional improvements in overall system performance.
In the previous chapter, we observed the effectiveness score ranges caused by user query variations,
and how query fusion can be used to improve retrieval effectiveness. In this chapter, we revisit rank
fusion in the context of risk-sensitive evaluation. Risk occurs when a new system under-performs when
compared to a simpler baseline model for a given query. Users are very sensitive to significant failures
in a search session, which can even result in a user mistrusting a system and even stop using it [75].
This issue is often ignored in IR evaluation exercises as measuring system performance using aggregate
scores does not penalise a new system for significant failures on a topic. Many IR techniques have been
shown to exhibit a risk-reward trade-off, such as query expansion and FDM.
In this chapter we explore the central aim of improving recall in text retrieval using rank fusion. We start
by interpreting and understanding the risks associated with using rank fusion to improve retrieval ef-
fectiveness, and then proceed to investigate methods of minimising risk and maximising effectiveness,
by combining systems and queries together in a fusion. We focus on two related research questions to
achieve these goals:
Sub-Research Question (S-RQ1): How susceptible are system-based and query-based rank fusion methods to
query performance degradation?
43
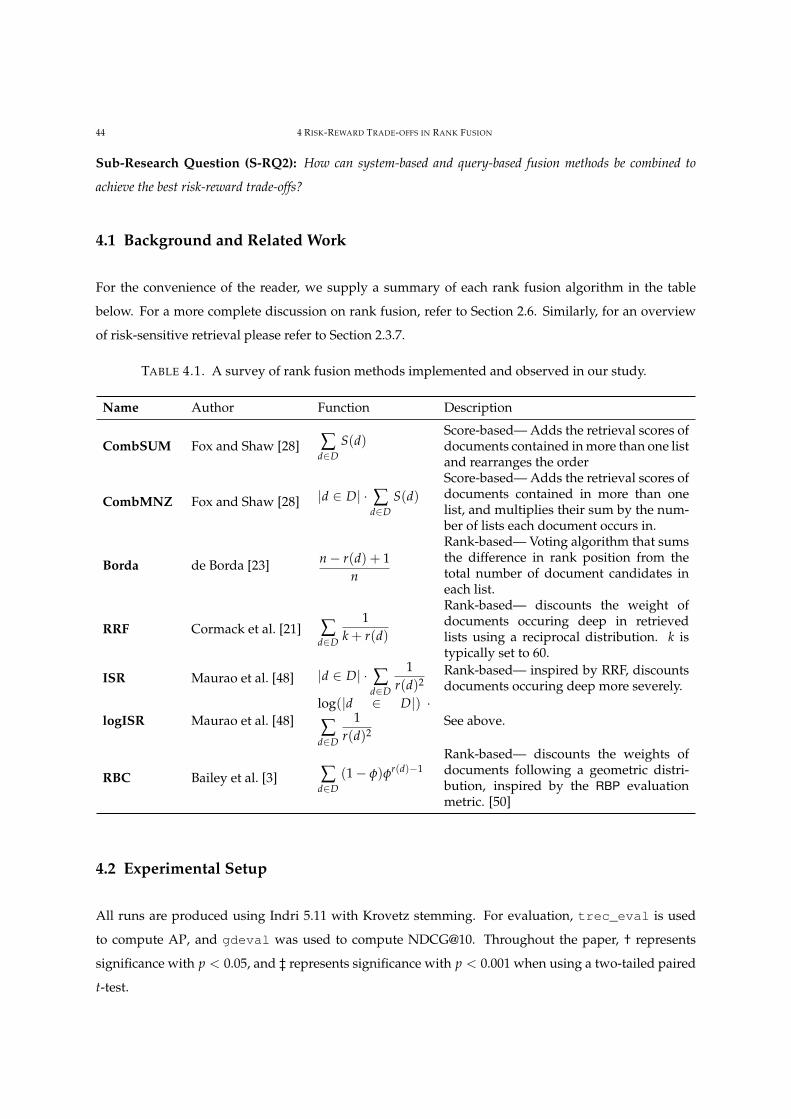
44 4 RISK-REWARD TRADE-OFFS IN RANK FUSION
Sub-Research Question (S-RQ2): How can system-based and query-based fusion methods be combined to
achieve the best risk-reward trade-offs?
4.1 Background and Related Work
For the convenience of the reader, we supply a summary of each rank fusion algorithm in the table
below. For a more complete discussion on rank fusion, refer to Section 2.6. Similarly, for an overview
of risk-sensitive retrieval please refer to Section 2.3.7.
TABLE 4.1. A survey of rank fusion methods implemented and observed in our study.
Name Author Function Description
CombSUM Fox and Shaw [28] ∑d∈D
S(d)Score-based— Adds the retrieval scores ofdocuments contained in more than one listand rearranges the order
CombMNZ Fox and Shaw [28] |d ∈ D| · ∑d∈D
S(d)Score-based— Adds the retrieval scores ofdocuments contained in more than onelist, and multiplies their sum by the num-ber of lists each document occurs in.
Borda de Borda [23] n− r(d) + 1n
Rank-based— Voting algorithm that sumsthe difference in rank position from thetotal number of document candidates ineach list.
RRF Cormack et al. [21] ∑d∈D
1k + r(d)
Rank-based— discounts the weight ofdocuments occuring deep in retrievedlists using a reciprocal distribution. k istypically set to 60.
ISR Maurao et al. [48] |d ∈ D| · ∑d∈D
1r(d)2
Rank-based— inspired by RRF, discountsdocuments occuring deep more severely.
logISR Maurao et al. [48]log(|d ∈ D|) ·
∑d∈D
1r(d)2
See above.
RBC Bailey et al. [3] ∑d∈D
(1− φ)φr(d)−1Rank-based— discounts the weights ofdocuments following a geometric distri-bution, inspired by the RBP evaluationmetric. [50]
4.2 Experimental Setup
All runs are produced using Indri 5.11 with Krovetz stemming. For evaluation, trec_eval is used
to compute AP, and gdeval was used to compute NDCG@10. Throughout the paper, † represents
significance with p < 0.05, and ‡ represents significance with p < 0.001 when using a two-tailed paired
t-test.
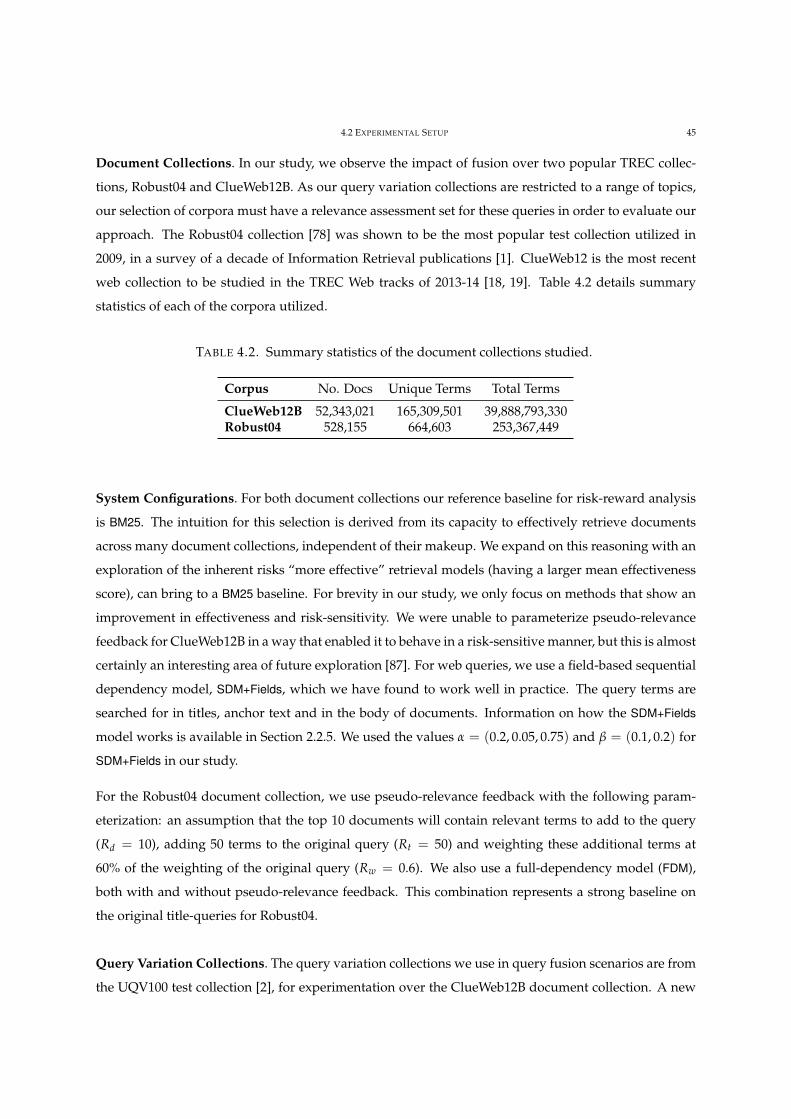
4.2 EXPERIMENTAL SETUP 45
Document Collections. In our study, we observe the impact of fusion over two popular TREC collec-
tions, Robust04 and ClueWeb12B. As our query variation collections are restricted to a range of topics,
our selection of corpora must have a relevance assessment set for these queries in order to evaluate our
approach. The Robust04 collection [78] was shown to be the most popular test collection utilized in
2009, in a survey of a decade of Information Retrieval publications [1]. ClueWeb12 is the most recent
web collection to be studied in the TREC Web tracks of 2013-14 [18, 19]. Table 4.2 details summary
statistics of each of the corpora utilized.
TABLE 4.2. Summary statistics of the document collections studied.
Corpus No. Docs Unique Terms Total Terms
ClueWeb12B 52,343,021 165,309,501 39,888,793,330Robust04 528,155 664,603 253,367,449
System Configurations. For both document collections our reference baseline for risk-reward analysis
is BM25. The intuition for this selection is derived from its capacity to effectively retrieve documents
across many document collections, independent of their makeup. We expand on this reasoning with an
exploration of the inherent risks “more effective” retrieval models (having a larger mean effectiveness
score), can bring to a BM25 baseline. For brevity in our study, we only focus on methods that show an
improvement in effectiveness and risk-sensitivity. We were unable to parameterize pseudo-relevance
feedback for ClueWeb12B in a way that enabled it to behave in a risk-sensitive manner, but this is almost
certainly an interesting area of future exploration [87]. For web queries, we use a field-based sequential
dependency model, SDM+Fields, which we have found to work well in practice. The query terms are
searched for in titles, anchor text and in the body of documents. Information on how the SDM+Fields
model works is available in Section 2.2.5. We used the values α = (0.2, 0.05, 0.75) and β = (0.1, 0.2) for
SDM+Fields in our study.
For the Robust04 document collection, we use pseudo-relevance feedback with the following param-
eterization: an assumption that the top 10 documents will contain relevant terms to add to the query
(Rd = 10), adding 50 terms to the original query (Rt = 50) and weighting these additional terms at
60% of the weighting of the original query (Rw = 0.6). We also use a full-dependency model (FDM),
both with and without pseudo-relevance feedback. This combination represents a strong baseline on
the original title-queries for Robust04.
Query Variation Collections. The query variation collections we use in query fusion scenarios are from
the UQV100 test collection [2], for experimentation over the ClueWeb12B document collection. A new
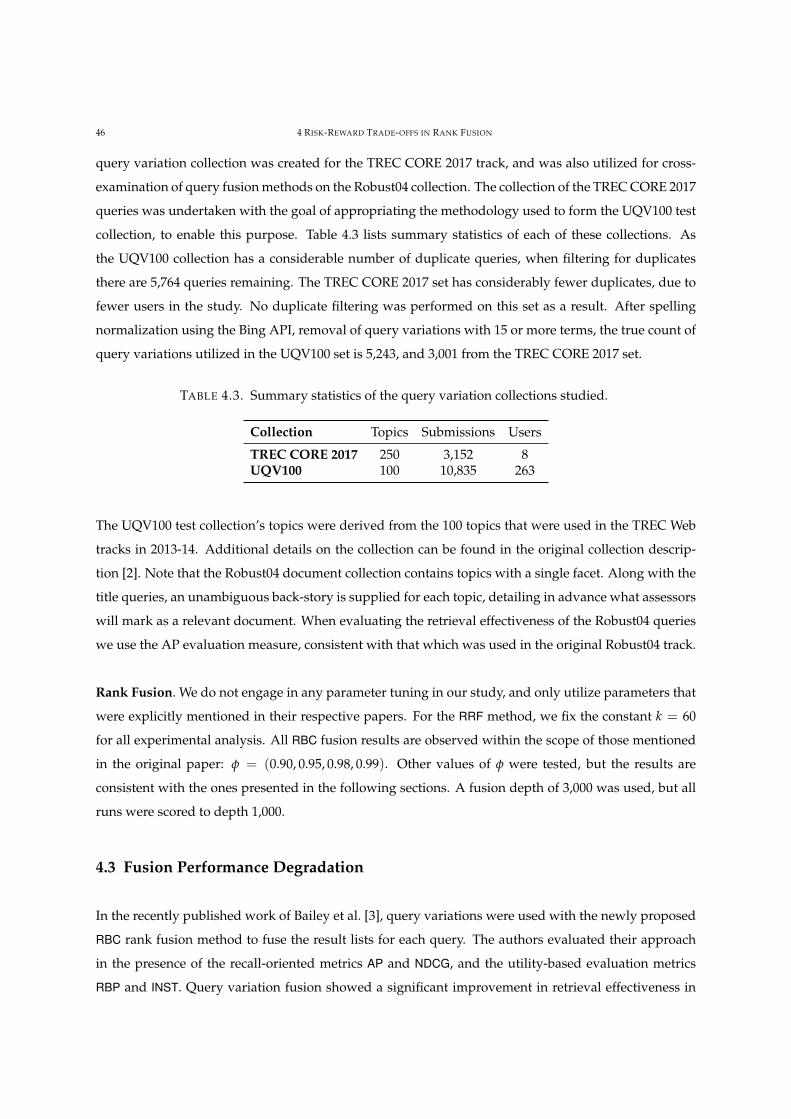
46 4 RISK-REWARD TRADE-OFFS IN RANK FUSION
query variation collection was created for the TREC CORE 2017 track, and was also utilized for cross-
examination of query fusion methods on the Robust04 collection. The collection of the TREC CORE 2017
queries was undertaken with the goal of appropriating the methodology used to form the UQV100 test
collection, to enable this purpose. Table 4.3 lists summary statistics of each of these collections. As
the UQV100 collection has a considerable number of duplicate queries, when filtering for duplicates
there are 5,764 queries remaining. The TREC CORE 2017 set has considerably fewer duplicates, due to
fewer users in the study. No duplicate filtering was performed on this set as a result. After spelling
normalization using the Bing API, removal of query variations with 15 or more terms, the true count of
query variations utilized in the UQV100 set is 5,243, and 3,001 from the TREC CORE 2017 set.
TABLE 4.3. Summary statistics of the query variation collections studied.
Collection Topics Submissions Users
TREC CORE 2017 250 3,152 8UQV100 100 10,835 263
The UQV100 test collection’s topics were derived from the 100 topics that were used in the TREC Web
tracks in 2013-14. Additional details on the collection can be found in the original collection descrip-
tion [2]. Note that the Robust04 document collection contains topics with a single facet. Along with the
title queries, an unambiguous back-story is supplied for each topic, detailing in advance what assessors
will mark as a relevant document. When evaluating the retrieval effectiveness of the Robust04 queries
we use the AP evaluation measure, consistent with that which was used in the original Robust04 track.
Rank Fusion. We do not engage in any parameter tuning in our study, and only utilize parameters that
were explicitly mentioned in their respective papers. For the RRF method, we fix the constant k = 60
for all experimental analysis. All RBC fusion results are observed within the scope of those mentioned
in the original paper: φ = (0.90, 0.95, 0.98, 0.99). Other values of φ were tested, but the results are
consistent with the ones presented in the following sections. A fusion depth of 3,000 was used, but all
runs were scored to depth 1,000.
4.3 Fusion Performance Degradation
In the recently published work of Bailey et al. [3], query variations were used with the newly proposed
RBC rank fusion method to fuse the result lists for each query. The authors evaluated their approach
in the presence of the recall-oriented metrics AP and NDCG, and the utility-based evaluation metrics
RBP and INST. Query variation fusion showed a significant improvement in retrieval effectiveness in
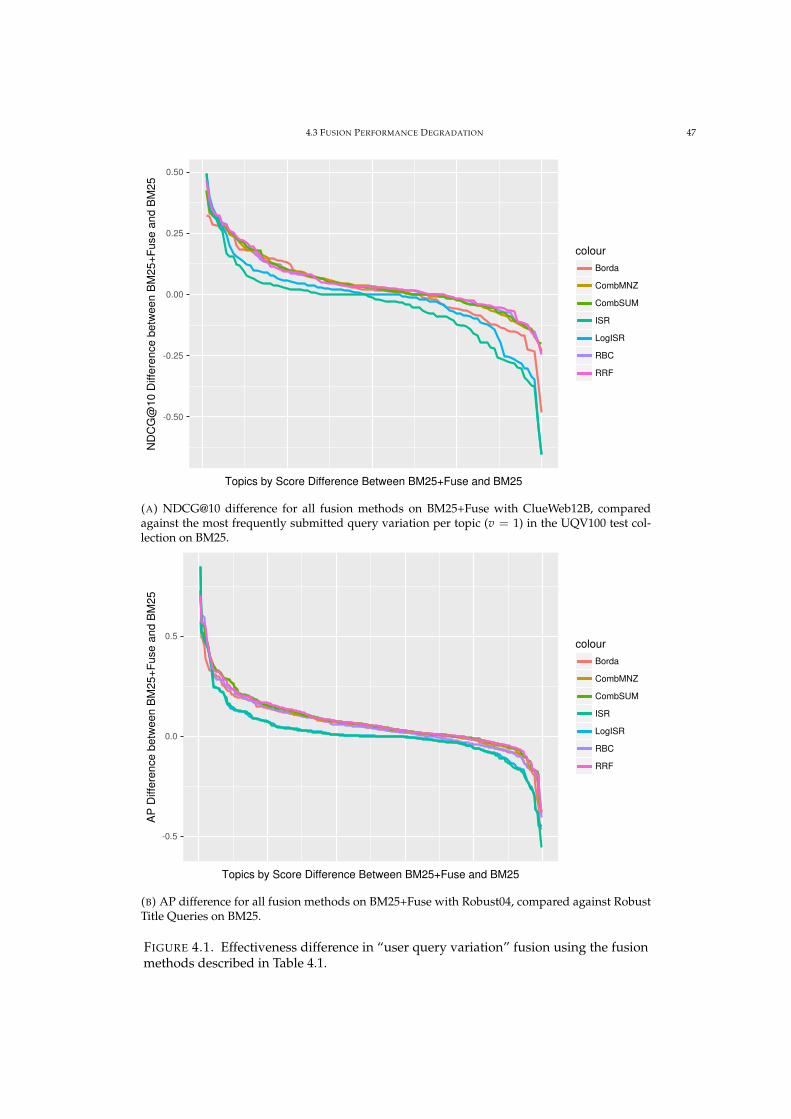
4.3 FUSION PERFORMANCE DEGRADATION 47
-0.50
-0.25
0.00
0.25
0.50
Topics by Score Difference Between BM25+Fuse and BM25
ND
CG
@10
Diff
eren
ce b
etw
een
BM
25+F
use
and
BM
25
colourBorda
CombMNZ
CombSUM
ISR
LogISR
RBC
RRF
(A) NDCG@10 difference for all fusion methods on BM25+Fuse with ClueWeb12B, comparedagainst the most frequently submitted query variation per topic (v = 1) in the UQV100 test col-lection on BM25.
-0.5
0.0
0.5
Topics by Score Difference Between BM25+Fuse and BM25
AP
Diff
eren
ce b
etw
een
BM
25+F
use
and
BM
25
colourBorda
CombMNZ
CombSUM
ISR
LogISR
RBC
RRF
(B) AP difference for all fusion methods on BM25+Fuse with Robust04, compared against RobustTitle Queries on BM25.
FIGURE 4.1. Effectiveness difference in “user query variation” fusion using the fusionmethods described in Table 4.1.
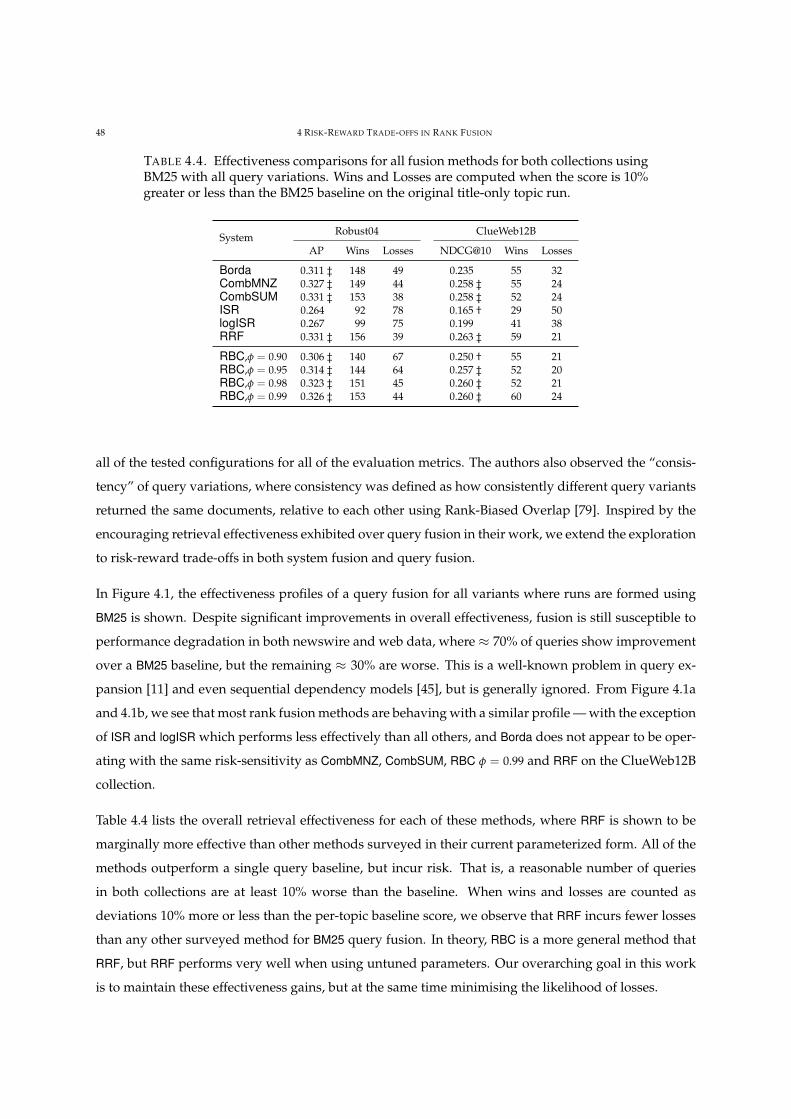
48 4 RISK-REWARD TRADE-OFFS IN RANK FUSION
TABLE 4.4. Effectiveness comparisons for all fusion methods for both collections usingBM25 with all query variations. Wins and Losses are computed when the score is 10%greater or less than the BM25 baseline on the original title-only topic run.
SystemRobust04 ClueWeb12B
AP Wins Losses NDCG@10 Wins Losses
Borda 0.311 ‡ 148 49 0.235 55 32CombMNZ 0.327 ‡ 149 44 0.258 ‡ 55 24CombSUM 0.331 ‡ 153 38 0.258 ‡ 52 24ISR 0.264 92 78 0.165 † 29 50logISR 0.267 99 75 0.199 41 38RRF 0.331 ‡ 156 39 0.263 ‡ 59 21
RBC,φ = 0.90 0.306 ‡ 140 67 0.250 † 55 21RBC,φ = 0.95 0.314 ‡ 144 64 0.257 ‡ 52 20RBC,φ = 0.98 0.323 ‡ 151 45 0.260 ‡ 52 21RBC,φ = 0.99 0.326 ‡ 153 44 0.260 ‡ 60 24
all of the tested configurations for all of the evaluation metrics. The authors also observed the “consis-
tency” of query variations, where consistency was defined as how consistently different query variants
returned the same documents, relative to each other using Rank-Biased Overlap [79]. Inspired by the
encouraging retrieval effectiveness exhibited over query fusion in their work, we extend the exploration
to risk-reward trade-offs in both system fusion and query fusion.
In Figure 4.1, the effectiveness profiles of a query fusion for all variants where runs are formed using
BM25 is shown. Despite significant improvements in overall effectiveness, fusion is still susceptible to
performance degradation in both newswire and web data, where ≈ 70% of queries show improvement
over a BM25 baseline, but the remaining ≈ 30% are worse. This is a well-known problem in query ex-
pansion [11] and even sequential dependency models [45], but is generally ignored. From Figure 4.1a
and 4.1b, we see that most rank fusion methods are behaving with a similar profile — with the exception
of ISR and logISR which performs less effectively than all others, and Borda does not appear to be oper-
ating with the same risk-sensitivity as CombMNZ, CombSUM, RBC φ = 0.99 and RRF on the ClueWeb12B
collection.
Table 4.4 lists the overall retrieval effectiveness for each of these methods, where RRF is shown to be
marginally more effective than other methods surveyed in their current parameterized form. All of the
methods outperform a single query baseline, but incur risk. That is, a reasonable number of queries
in both collections are at least 10% worse than the baseline. When wins and losses are counted as
deviations 10% more or less than the per-topic baseline score, we observe that RRF incurs fewer losses
than any other surveyed method for BM25 query fusion. In theory, RBC is a more general method that
RRF, but RRF performs very well when using untuned parameters. Our overarching goal in this work
is to maintain these effectiveness gains, but at the same time minimising the likelihood of losses.
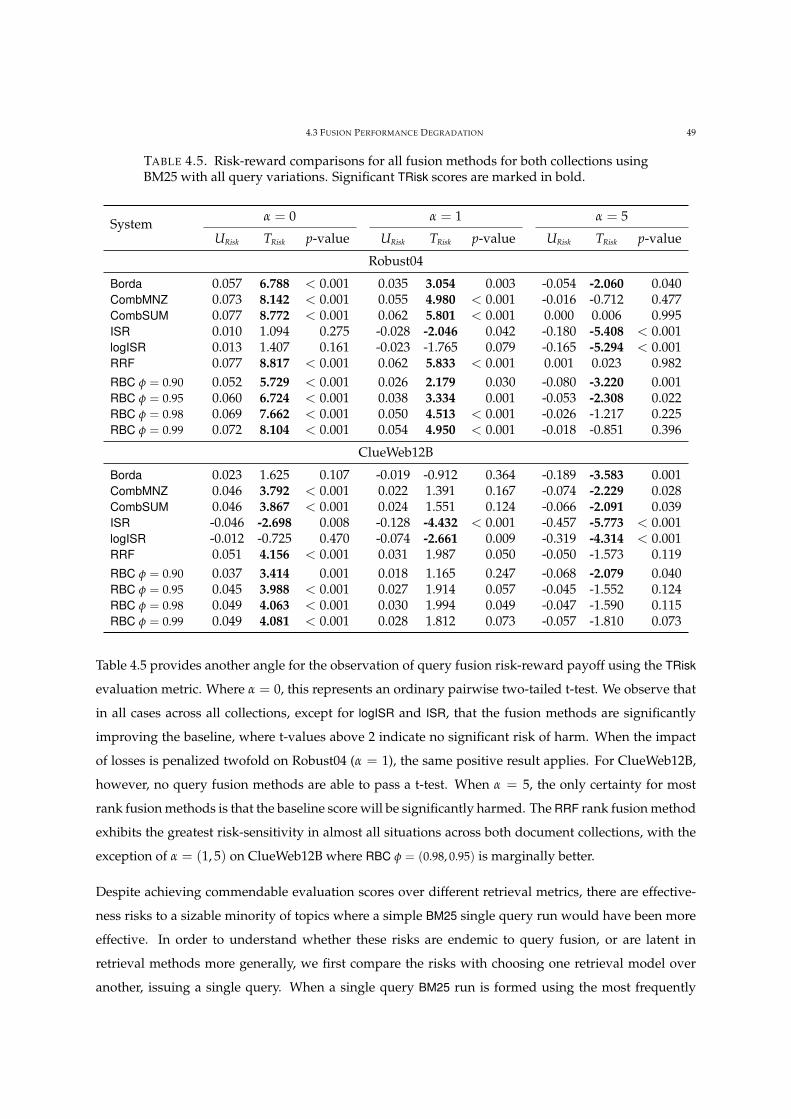
4.3 FUSION PERFORMANCE DEGRADATION 49
TABLE 4.5. Risk-reward comparisons for all fusion methods for both collections usingBM25 with all query variations. Significant TRisk scores are marked in bold.
System α = 0 α = 1 α = 5
URisk TRisk p-value URisk TRisk p-value URisk TRisk p-value
Robust04
Borda 0.057 6.788 < 0.001 0.035 3.054 0.003 -0.054 -2.060 0.040CombMNZ 0.073 8.142 < 0.001 0.055 4.980 < 0.001 -0.016 -0.712 0.477CombSUM 0.077 8.772 < 0.001 0.062 5.801 < 0.001 0.000 0.006 0.995ISR 0.010 1.094 0.275 -0.028 -2.046 0.042 -0.180 -5.408 < 0.001logISR 0.013 1.407 0.161 -0.023 -1.765 0.079 -0.165 -5.294 < 0.001RRF 0.077 8.817 < 0.001 0.062 5.833 < 0.001 0.001 0.023 0.982RBC φ = 0.90 0.052 5.729 < 0.001 0.026 2.179 0.030 -0.080 -3.220 0.001RBC φ = 0.95 0.060 6.724 < 0.001 0.038 3.334 0.001 -0.053 -2.308 0.022RBC φ = 0.98 0.069 7.662 < 0.001 0.050 4.513 < 0.001 -0.026 -1.217 0.225RBC φ = 0.99 0.072 8.104 < 0.001 0.054 4.950 < 0.001 -0.018 -0.851 0.396
ClueWeb12B
Borda 0.023 1.625 0.107 -0.019 -0.912 0.364 -0.189 -3.583 0.001CombMNZ 0.046 3.792 < 0.001 0.022 1.391 0.167 -0.074 -2.229 0.028CombSUM 0.046 3.867 < 0.001 0.024 1.551 0.124 -0.066 -2.091 0.039ISR -0.046 -2.698 0.008 -0.128 -4.432 < 0.001 -0.457 -5.773 < 0.001logISR -0.012 -0.725 0.470 -0.074 -2.661 0.009 -0.319 -4.314 < 0.001RRF 0.051 4.156 < 0.001 0.031 1.987 0.050 -0.050 -1.573 0.119RBC φ = 0.90 0.037 3.414 0.001 0.018 1.165 0.247 -0.068 -2.079 0.040RBC φ = 0.95 0.045 3.988 < 0.001 0.027 1.914 0.057 -0.045 -1.552 0.124RBC φ = 0.98 0.049 4.063 < 0.001 0.030 1.994 0.049 -0.047 -1.590 0.115RBC φ = 0.99 0.049 4.081 < 0.001 0.028 1.812 0.073 -0.057 -1.810 0.073
Table 4.5 provides another angle for the observation of query fusion risk-reward payoff using the TRisk
evaluation metric. Where α = 0, this represents an ordinary pairwise two-tailed t-test. We observe that
in all cases across all collections, except for logISR and ISR, that the fusion methods are significantly
improving the baseline, where t-values above 2 indicate no significant risk of harm. When the impact
of losses is penalized twofold on Robust04 (α = 1), the same positive result applies. For ClueWeb12B,
however, no query fusion methods are able to pass a t-test. When α = 5, the only certainty for most
rank fusion methods is that the baseline score will be significantly harmed. The RRF rank fusion method
exhibits the greatest risk-sensitivity in almost all situations across both document collections, with the
exception of α = (1, 5) on ClueWeb12B where RBC φ = (0.98, 0.95) is marginally better.
Despite achieving commendable evaluation scores over different retrieval metrics, there are effective-
ness risks to a sizable minority of topics where a simple BM25 single query run would have been more
effective. In order to understand whether these risks are endemic to query fusion, or are latent in
retrieval methods more generally, we first compare the risks with choosing one retrieval model over
another, issuing a single query. When a single query BM25 run is formed using the most frequently
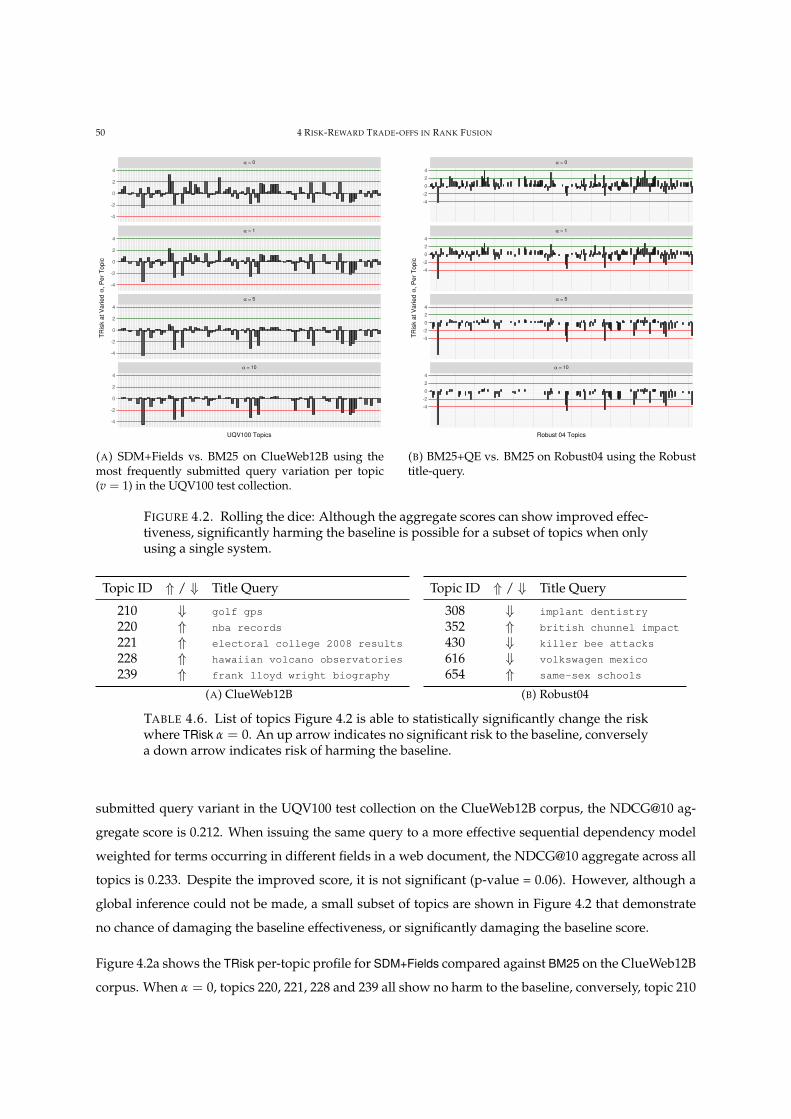
50 4 RISK-REWARD TRADE-OFFS IN RANK FUSION
α = 10
α = 5
α = 1
α = 0
-4
-2
0
2
4
-4
-2
0
2
4
-4
-2
0
2
4
-4
-2
0
2
4
UQV100 Topics
TRis
k at
Var
ied
α , P
er T
opic
(A) SDM+Fields vs. BM25 on ClueWeb12B using themost frequently submitted query variation per topic(v = 1) in the UQV100 test collection.
α = 10
α = 5
α = 1
α = 0
-4
-2
0
2
4
-4
-2
0
2
4
-4
-2
0
2
4
-4
-2
0
2
4
Robust 04 Topics
TRis
k at
Var
ied
α , P
er T
opic
(B) BM25+QE vs. BM25 on Robust04 using the Robusttitle-query.
FIGURE 4.2. Rolling the dice: Although the aggregate scores can show improved effec-tiveness, significantly harming the baseline is possible for a subset of topics when onlyusing a single system.
Topic ID ⇑ / ⇓ Title Query
210 ⇓ golf gps
220 ⇑ nba records
221 ⇑ electoral college 2008 results
228 ⇑ hawaiian volcano observatories
239 ⇑ frank lloyd wright biography
(A) ClueWeb12B
Topic ID ⇑ / ⇓ Title Query
308 ⇓ implant dentistry
352 ⇑ british chunnel impact
430 ⇓ killer bee attacks
616 ⇓ volkswagen mexico
654 ⇑ same-sex schools
(B) Robust04
TABLE 4.6. List of topics Figure 4.2 is able to statistically significantly change the riskwhere TRisk α = 0. An up arrow indicates no significant risk to the baseline, converselya down arrow indicates risk of harming the baseline.
submitted query variant in the UQV100 test collection on the ClueWeb12B corpus, the NDCG@10 ag-
gregate score is 0.212. When issuing the same query to a more effective sequential dependency model
weighted for terms occurring in different fields in a web document, the NDCG@10 aggregate across all
topics is 0.233. Despite the improved score, it is not significant (p-value = 0.06). However, although a
global inference could not be made, a small subset of topics are shown in Figure 4.2 that demonstrate
no chance of damaging the baseline effectiveness, or significantly damaging the baseline score.
Figure 4.2a shows the TRisk per-topic profile for SDM+Fields compared against BM25 on the ClueWeb12B
corpus. When α = 0, topics 220, 221, 228 and 239 all show no harm to the baseline, conversely, topic 210
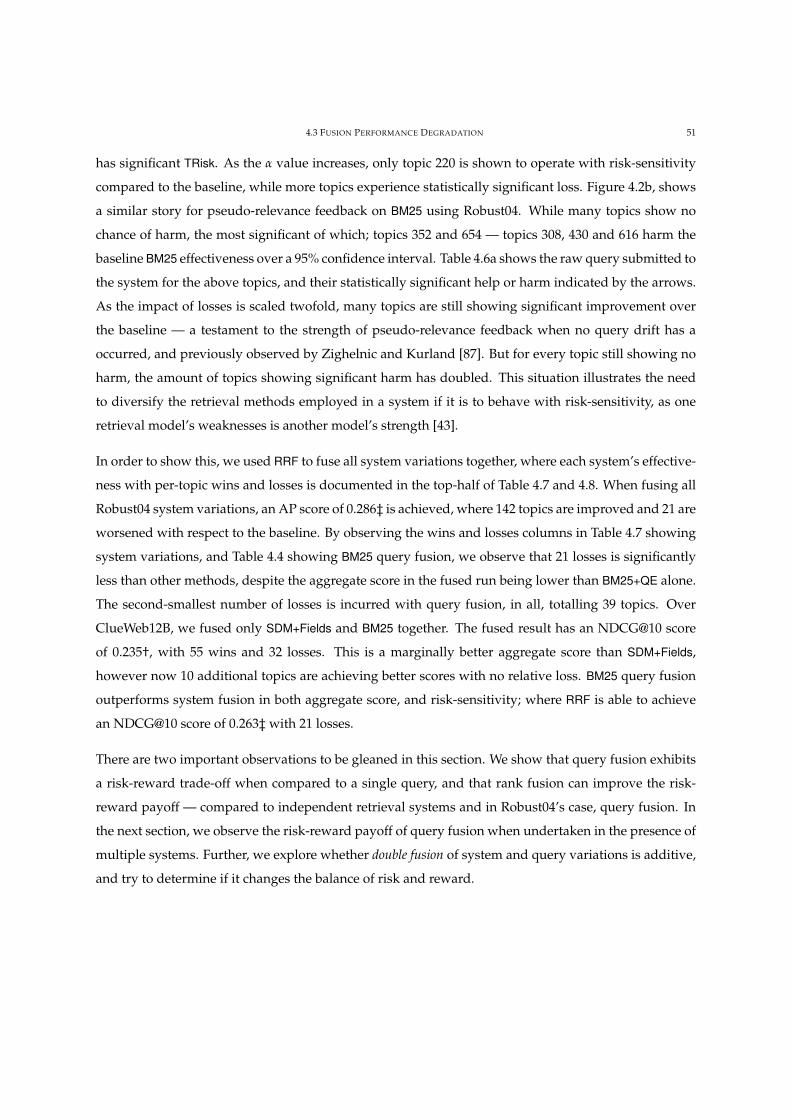
4.3 FUSION PERFORMANCE DEGRADATION 51
has significant TRisk. As the α value increases, only topic 220 is shown to operate with risk-sensitivity
compared to the baseline, while more topics experience statistically significant loss. Figure 4.2b, shows
a similar story for pseudo-relevance feedback on BM25 using Robust04. While many topics show no
chance of harm, the most significant of which; topics 352 and 654 — topics 308, 430 and 616 harm the
baseline BM25 effectiveness over a 95% confidence interval. Table 4.6a shows the raw query submitted to
the system for the above topics, and their statistically significant help or harm indicated by the arrows.
As the impact of losses is scaled twofold, many topics are still showing significant improvement over
the baseline — a testament to the strength of pseudo-relevance feedback when no query drift has a
occurred, and previously observed by Zighelnic and Kurland [87]. But for every topic still showing no
harm, the amount of topics showing significant harm has doubled. This situation illustrates the need
to diversify the retrieval methods employed in a system if it is to behave with risk-sensitivity, as one
retrieval model’s weaknesses is another model’s strength [43].
In order to show this, we used RRF to fuse all system variations together, where each system’s effective-
ness with per-topic wins and losses is documented in the top-half of Table 4.7 and 4.8. When fusing all
Robust04 system variations, an AP score of 0.286‡ is achieved, where 142 topics are improved and 21 are
worsened with respect to the baseline. By observing the wins and losses columns in Table 4.7 showing
system variations, and Table 4.4 showing BM25 query fusion, we observe that 21 losses is significantly
less than other methods, despite the aggregate score in the fused run being lower than BM25+QE alone.
The second-smallest number of losses is incurred with query fusion, in all, totalling 39 topics. Over
ClueWeb12B, we fused only SDM+Fields and BM25 together. The fused result has an NDCG@10 score
of 0.235†, with 55 wins and 32 losses. This is a marginally better aggregate score than SDM+Fields,
however now 10 additional topics are achieving better scores with no relative loss. BM25 query fusion
outperforms system fusion in both aggregate score, and risk-sensitivity; where RRF is able to achieve
an NDCG@10 score of 0.263‡ with 21 losses.
There are two important observations to be gleaned in this section. We show that query fusion exhibits
a risk-reward trade-off when compared to a single query, and that rank fusion can improve the risk-
reward payoff — compared to independent retrieval systems and in Robust04’s case, query fusion. In
the next section, we observe the risk-reward payoff of query fusion when undertaken in the presence of
multiple systems. Further, we explore whether double fusion of system and query variations is additive,
and try to determine if it changes the balance of risk and reward.
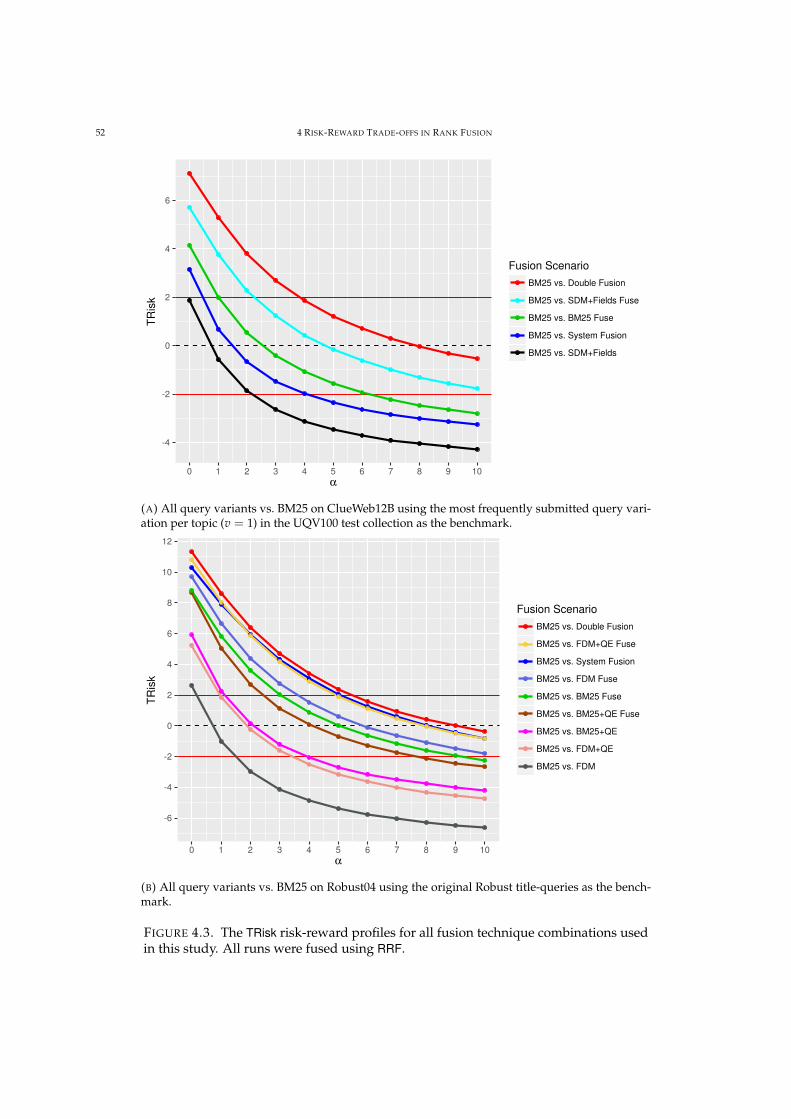
52 4 RISK-REWARD TRADE-OFFS IN RANK FUSION
-4
-2
0
2
4
6
0 1 2 3 4 5 6 7 8 9 10α
TRis
k
Fusion ScenarioBM25 vs. Double Fusion
BM25 vs. SDM+Fields Fuse
BM25 vs. BM25 Fuse
BM25 vs. System Fusion
BM25 vs. SDM+Fields
(A) All query variants vs. BM25 on ClueWeb12B using the most frequently submitted query vari-ation per topic (v = 1) in the UQV100 test collection as the benchmark.
-6
-4
-2
0
2
4
6
8
10
12
0 1 2 3 4 5 6 7 8 9 10α
TRis
k
Fusion ScenarioBM25 vs. Double Fusion
BM25 vs. FDM+QE Fuse
BM25 vs. System Fusion
BM25 vs. FDM Fuse
BM25 vs. BM25 Fuse
BM25 vs. BM25+QE Fuse
BM25 vs. BM25+QE
BM25 vs. FDM+QE
BM25 vs. FDM
(B) All query variants vs. BM25 on Robust04 using the original Robust title-queries as the bench-mark.
FIGURE 4.3. The TRisk risk-reward profiles for all fusion technique combinations usedin this study. All runs were fused using RRF.
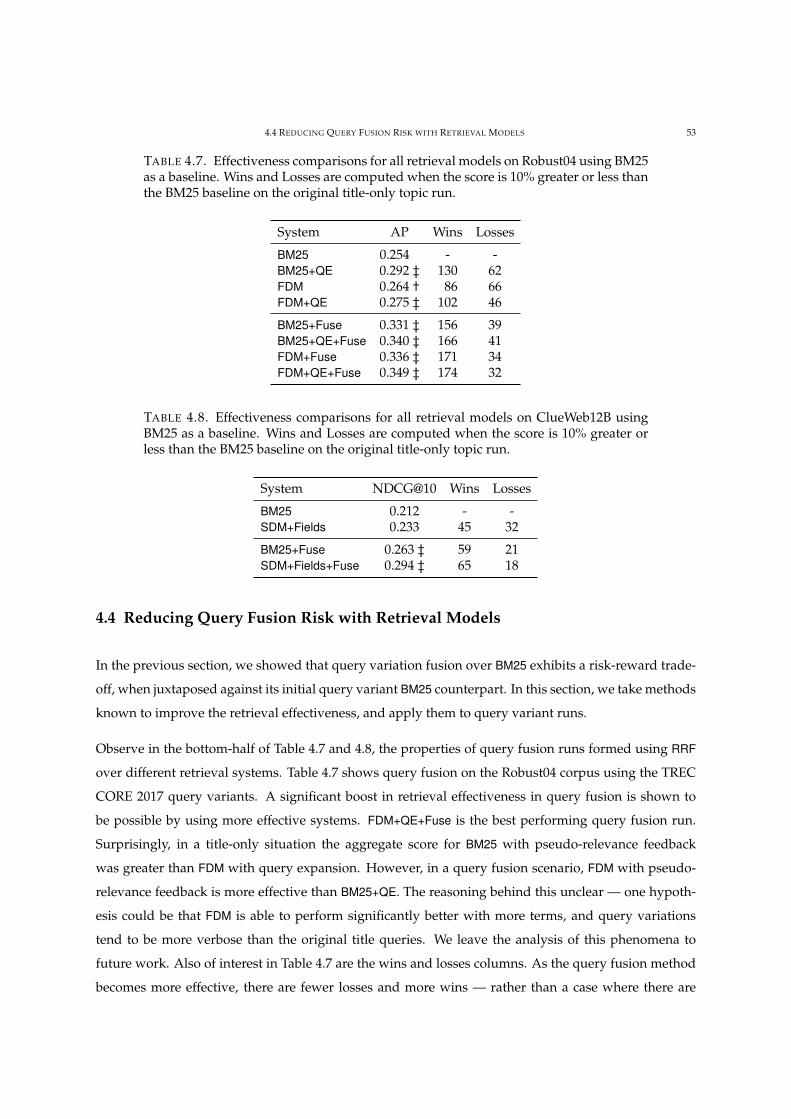
4.4 REDUCING QUERY FUSION RISK WITH RETRIEVAL MODELS 53
TABLE 4.7. Effectiveness comparisons for all retrieval models on Robust04 using BM25as a baseline. Wins and Losses are computed when the score is 10% greater or less thanthe BM25 baseline on the original title-only topic run.
System AP Wins Losses
BM25 0.254 - -BM25+QE 0.292 ‡ 130 62FDM 0.264 † 86 66FDM+QE 0.275 ‡ 102 46
BM25+Fuse 0.331 ‡ 156 39BM25+QE+Fuse 0.340 ‡ 166 41FDM+Fuse 0.336 ‡ 171 34FDM+QE+Fuse 0.349 ‡ 174 32
TABLE 4.8. Effectiveness comparisons for all retrieval models on ClueWeb12B usingBM25 as a baseline. Wins and Losses are computed when the score is 10% greater orless than the BM25 baseline on the original title-only topic run.
System NDCG@10 Wins Losses
BM25 0.212 - -SDM+Fields 0.233 45 32
BM25+Fuse 0.263 ‡ 59 21SDM+Fields+Fuse 0.294 ‡ 65 18
4.4 Reducing Query Fusion Risk with Retrieval Models
In the previous section, we showed that query variation fusion over BM25 exhibits a risk-reward trade-
off, when juxtaposed against its initial query variant BM25 counterpart. In this section, we take methods
known to improve the retrieval effectiveness, and apply them to query variant runs.
Observe in the bottom-half of Table 4.7 and 4.8, the properties of query fusion runs formed using RRF
over different retrieval systems. Table 4.7 shows query fusion on the Robust04 corpus using the TREC
CORE 2017 query variants. A significant boost in retrieval effectiveness in query fusion is shown to
be possible by using more effective systems. FDM+QE+Fuse is the best performing query fusion run.
Surprisingly, in a title-only situation the aggregate score for BM25 with pseudo-relevance feedback
was greater than FDM with query expansion. However, in a query fusion scenario, FDM with pseudo-
relevance feedback is more effective than BM25+QE. The reasoning behind this unclear — one hypoth-
esis could be that FDM is able to perform significantly better with more terms, and query variations
tend to be more verbose than the original title queries. We leave the analysis of this phenomena to
future work. Also of interest in Table 4.7 are the wins and losses columns. As the query fusion method
becomes more effective, there are fewer losses and more wins — rather than a case where there are
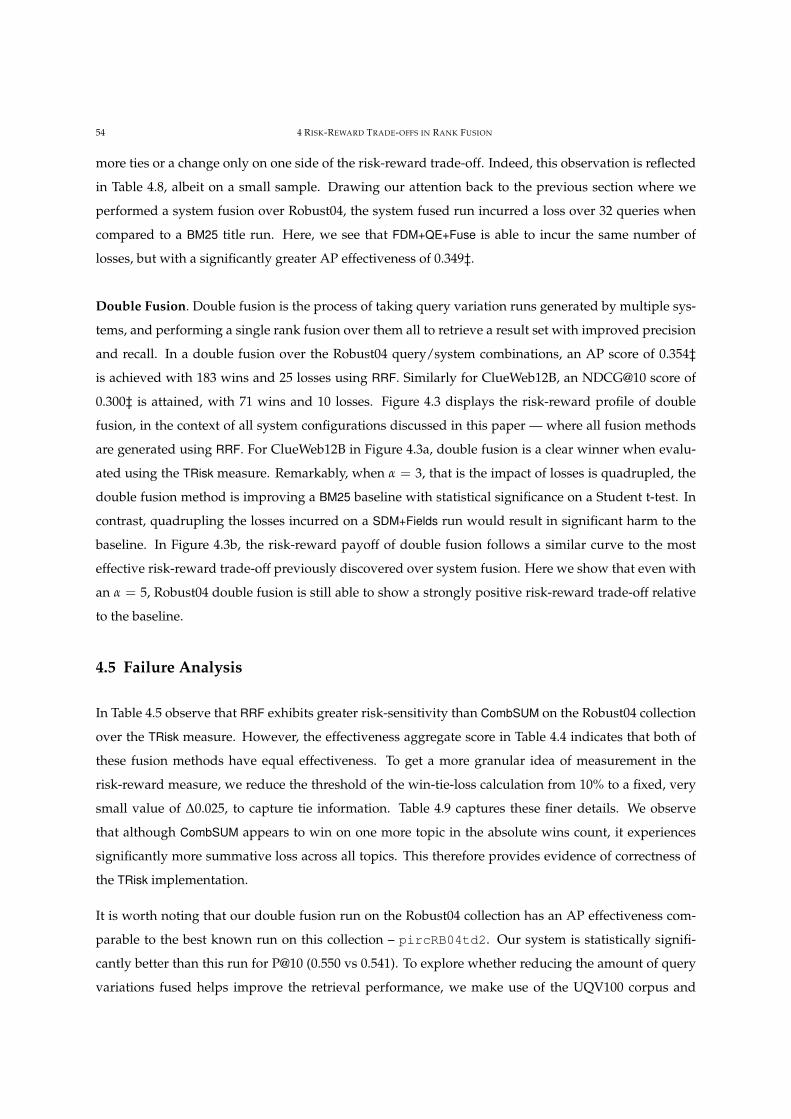
54 4 RISK-REWARD TRADE-OFFS IN RANK FUSION
more ties or a change only on one side of the risk-reward trade-off. Indeed, this observation is reflected
in Table 4.8, albeit on a small sample. Drawing our attention back to the previous section where we
performed a system fusion over Robust04, the system fused run incurred a loss over 32 queries when
compared to a BM25 title run. Here, we see that FDM+QE+Fuse is able to incur the same number of
losses, but with a significantly greater AP effectiveness of 0.349‡.
Double Fusion. Double fusion is the process of taking query variation runs generated by multiple sys-
tems, and performing a single rank fusion over them all to retrieve a result set with improved precision
and recall. In a double fusion over the Robust04 query/system combinations, an AP score of 0.354‡
is achieved with 183 wins and 25 losses using RRF. Similarly for ClueWeb12B, an NDCG@10 score of
0.300‡ is attained, with 71 wins and 10 losses. Figure 4.3 displays the risk-reward profile of double
fusion, in the context of all system configurations discussed in this paper — where all fusion methods
are generated using RRF. For ClueWeb12B in Figure 4.3a, double fusion is a clear winner when evalu-
ated using the TRisk measure. Remarkably, when α = 3, that is the impact of losses is quadrupled, the
double fusion method is improving a BM25 baseline with statistical significance on a Student t-test. In
contrast, quadrupling the losses incurred on a SDM+Fields run would result in significant harm to the
baseline. In Figure 4.3b, the risk-reward payoff of double fusion follows a similar curve to the most
effective risk-reward trade-off previously discovered over system fusion. Here we show that even with
an α = 5, Robust04 double fusion is still able to show a strongly positive risk-reward trade-off relative
to the baseline.
4.5 Failure Analysis
In Table 4.5 observe that RRF exhibits greater risk-sensitivity than CombSUM on the Robust04 collection
over the TRisk measure. However, the effectiveness aggregate score in Table 4.4 indicates that both of
these fusion methods have equal effectiveness. To get a more granular idea of measurement in the
risk-reward measure, we reduce the threshold of the win-tie-loss calculation from 10% to a fixed, very
small value of ∆0.025, to capture tie information. Table 4.9 captures these finer details. We observe
that although CombSUM appears to win on one more topic in the absolute wins count, it experiences
significantly more summative loss across all topics. This therefore provides evidence of correctness of
the TRisk implementation.
It is worth noting that our double fusion run on the Robust04 collection has an AP effectiveness com-
parable to the best known run on this collection – pircRB04td2. Our system is statistically signifi-
cantly better than this run for P@10 (0.550 vs 0.541). To explore whether reducing the amount of query
variations fused helps improve the retrieval performance, we make use of the UQV100 corpus and
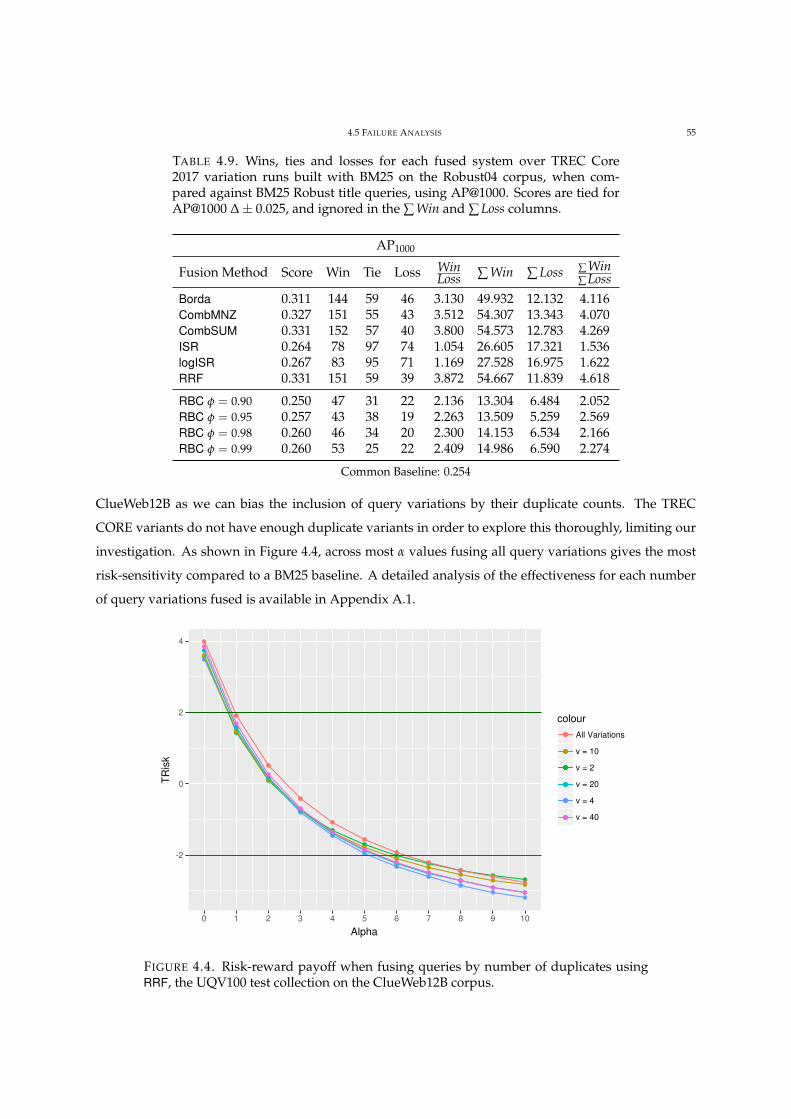
4.5 FAILURE ANALYSIS 55
TABLE 4.9. Wins, ties and losses for each fused system over TREC Core2017 variation runs built with BM25 on the Robust04 corpus, when com-pared against BM25 Robust title queries, using AP@1000. Scores are tied forAP@1000 ∆± 0.025, and ignored in the ∑ Win and ∑ Loss columns.
AP1000
Fusion Method Score Win Tie Loss WinLoss ∑ Win ∑ Loss ∑ Win
∑ LossBorda 0.311 144 59 46 3.130 49.932 12.132 4.116CombMNZ 0.327 151 55 43 3.512 54.307 13.343 4.070CombSUM 0.331 152 57 40 3.800 54.573 12.783 4.269ISR 0.264 78 97 74 1.054 26.605 17.321 1.536logISR 0.267 83 95 71 1.169 27.528 16.975 1.622RRF 0.331 151 59 39 3.872 54.667 11.839 4.618
RBC φ = 0.90 0.250 47 31 22 2.136 13.304 6.484 2.052RBC φ = 0.95 0.257 43 38 19 2.263 13.509 5.259 2.569RBC φ = 0.98 0.260 46 34 20 2.300 14.153 6.534 2.166RBC φ = 0.99 0.260 53 25 22 2.409 14.986 6.590 2.274
Common Baseline: 0.254
ClueWeb12B as we can bias the inclusion of query variations by their duplicate counts. The TREC
CORE variants do not have enough duplicate variants in order to explore this thoroughly, limiting our
investigation. As shown in Figure 4.4, across most α values fusing all query variations gives the most
risk-sensitivity compared to a BM25 baseline. A detailed analysis of the effectiveness for each number
of query variations fused is available in Appendix A.1.
-2
0
2
4
0 1 2 3 4 5 6 7 8 9 10
Alpha
TRis
k
colourAll Variations
v = 10
v = 2
v = 20
v = 4
v = 40
FIGURE 4.4. Risk-reward payoff when fusing queries by number of duplicates usingRRF, the UQV100 test collection on the ClueWeb12B corpus.
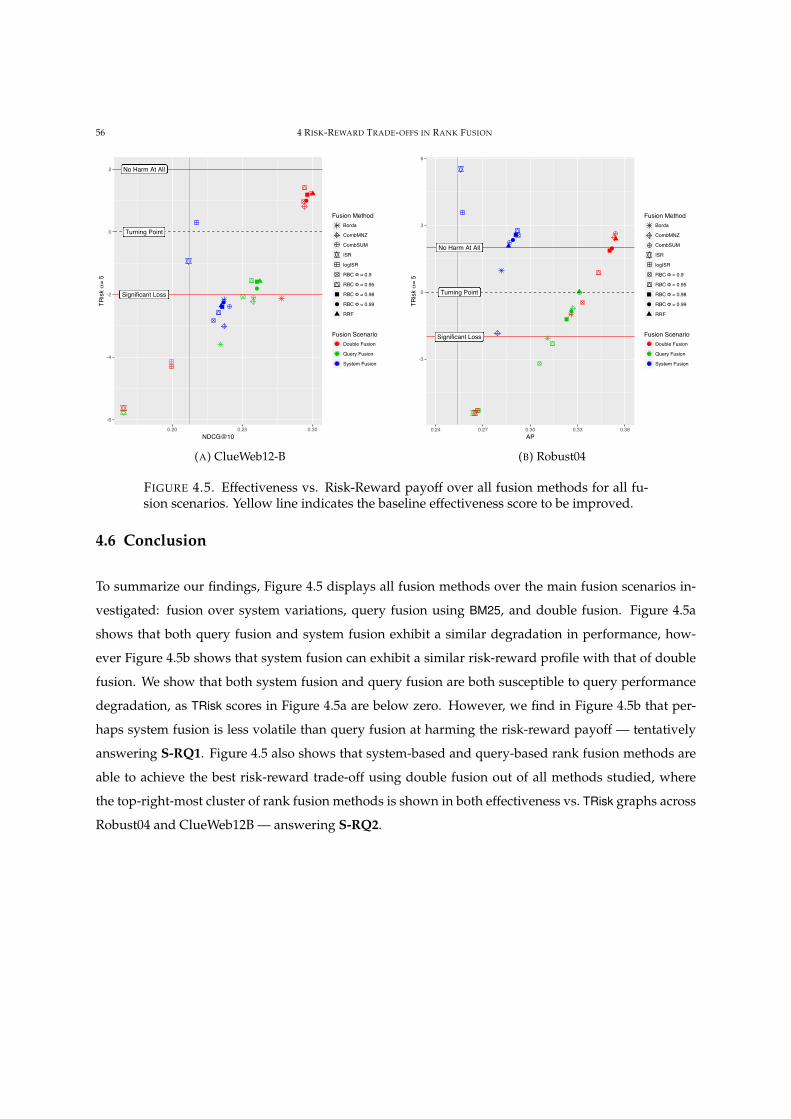
56 4 RISK-REWARD TRADE-OFFS IN RANK FUSION
Significant LossSignificant LossSignificant LossSignificant LossSignificant LossSignificant LossSignificant LossSignificant LossSignificant LossSignificant LossSignificant LossSignificant LossSignificant LossSignificant LossSignificant LossSignificant LossSignificant LossSignificant LossSignificant LossSignificant LossSignificant LossSignificant LossSignificant LossSignificant LossSignificant LossSignificant LossSignificant LossSignificant LossSignificant LossSignificant Loss
Turning PointTurning PointTurning PointTurning PointTurning PointTurning PointTurning PointTurning PointTurning PointTurning PointTurning PointTurning PointTurning PointTurning PointTurning PointTurning PointTurning PointTurning PointTurning PointTurning PointTurning PointTurning PointTurning PointTurning PointTurning PointTurning PointTurning PointTurning PointTurning PointTurning Point
No Harm At AllNo Harm At AllNo Harm At AllNo Harm At AllNo Harm At AllNo Harm At AllNo Harm At AllNo Harm At AllNo Harm At AllNo Harm At AllNo Harm At AllNo Harm At AllNo Harm At AllNo Harm At AllNo Harm At AllNo Harm At AllNo Harm At AllNo Harm At AllNo Harm At AllNo Harm At AllNo Harm At AllNo Harm At AllNo Harm At AllNo Harm At AllNo Harm At AllNo Harm At AllNo Harm At AllNo Harm At AllNo Harm At AllNo Harm At All
-6
-4
-2
0
2
0.20 0.25 0.30
NDCG@10
TR
isk α
= 5
Fusion Method
Borda
CombMNZ
CombSUM
ISR
logISR
RBC Φ = 0.9
RBC Φ = 0.95
RBC Φ = 0.98
RBC Φ = 0.99
RRF
Fusion Scenario
Double Fusion
Query Fusion
System Fusion
(A) ClueWeb12-B
Significant LossSignificant LossSignificant LossSignificant LossSignificant LossSignificant LossSignificant LossSignificant LossSignificant LossSignificant LossSignificant LossSignificant LossSignificant LossSignificant LossSignificant LossSignificant LossSignificant LossSignificant LossSignificant LossSignificant LossSignificant LossSignificant LossSignificant LossSignificant LossSignificant LossSignificant LossSignificant LossSignificant LossSignificant LossSignificant Loss
Turning PointTurning PointTurning PointTurning PointTurning PointTurning PointTurning PointTurning PointTurning PointTurning PointTurning PointTurning PointTurning PointTurning PointTurning PointTurning PointTurning PointTurning PointTurning PointTurning PointTurning PointTurning PointTurning PointTurning PointTurning PointTurning PointTurning PointTurning PointTurning PointTurning Point
No Harm At AllNo Harm At AllNo Harm At AllNo Harm At AllNo Harm At AllNo Harm At AllNo Harm At AllNo Harm At AllNo Harm At AllNo Harm At AllNo Harm At AllNo Harm At AllNo Harm At AllNo Harm At AllNo Harm At AllNo Harm At AllNo Harm At AllNo Harm At AllNo Harm At AllNo Harm At AllNo Harm At AllNo Harm At AllNo Harm At AllNo Harm At AllNo Harm At AllNo Harm At AllNo Harm At AllNo Harm At AllNo Harm At AllNo Harm At All
-3
0
3
6
0.24 0.27 0.30 0.33 0.36
AP
TR
isk α
= 5
Fusion Method
Borda
CombMNZ
CombSUM
ISR
logISR
RBC Φ = 0.9
RBC Φ = 0.95
RBC Φ = 0.98
RBC Φ = 0.99
RRF
Fusion Scenario
Double Fusion
Query Fusion
System Fusion
(B) Robust04
FIGURE 4.5. Effectiveness vs. Risk-Reward payoff over all fusion methods for all fu-sion scenarios. Yellow line indicates the baseline effectiveness score to be improved.
4.6 Conclusion
To summarize our findings, Figure 4.5 displays all fusion methods over the main fusion scenarios in-
vestigated: fusion over system variations, query fusion using BM25, and double fusion. Figure 4.5a
shows that both query fusion and system fusion exhibit a similar degradation in performance, how-
ever Figure 4.5b shows that system fusion can exhibit a similar risk-reward profile with that of double
fusion. We show that both system fusion and query fusion are both susceptible to query performance
degradation, as TRisk scores in Figure 4.5a are below zero. However, we find in Figure 4.5b that per-
haps system fusion is less volatile than query fusion at harming the risk-reward payoff — tentatively
answering S-RQ1. Figure 4.5 also shows that system-based and query-based rank fusion methods are
able to achieve the best risk-reward trade-off using double fusion out of all methods studied, where
the top-right-most cluster of rank fusion methods is shown in both effectiveness vs. TRisk graphs across
Robust04 and ClueWeb12B — answering S-RQ2.
CHAPTER 5
Conclusions and Future Work
5.1 Increasing Recall with Fusion
We coalesce the results of observing fusion over different retrieval models, query variants on the same
system, and “double fusion” over both— finding that in all cases recall is improved. We measure the
improvement of recall through the strong participation of our TREC fusion run against our automatic
baseline without fusion— showing a marked improvement in the number of uniquely relevant docu-
ments extracted. Another source of evidence is the significantly higher AP measures of the fused runs
against our single-shot “best” title queries submitted to the TREC track, where AP has been shown to be
a recall-sensitive evaluation measure. From our results, system fusion offered the least improvement,
where query fusion markedly improves recall and double fusion performs best overall.
5.2 Risk-sensitivity Of Each Fusion Scenario
Our results show that double fusion exhibits the most risk-sensitivity. For ClueWeb12B, when the im-
pact of losses is increased fourfold on double fusion it still passes a paired t-test indicating the harm is
statistically insignificant. When compared to a system fusion without any query fusion, there’s a statis-
tically significant chance of harm. A similar result is exhibited on the Robust04 collection. This result
provides confident use of double fusion, as prior to having conducted this research it was unclear if it
was making some topics perform very well at the expense of many others.
5.3 Future Work
In future work, we aim to apply query fusion and double fusion to a candidate generation stage in
a Multi-stage retrieval system— and answer the question should fusion occur before a learning-to-
rank stage, or after? However, many questions remain unanswered from our approach. In the CORE
submission, we were able to find a method for selecting the top 5 query variations using the relevance
assessments, however, this is impractical in a real system. Using post-retrieval features like Clarity may
57
58 5 CONCLUSIONS AND FUTURE WORK
enable us to more robustly understand how many queries we should be fusing rather than selecting a
top 5 or naively fusing all queries, and under which per-topic conditions should we do so.
An anonymous reviewer of Chapter 4 questions the applicability of double fusion, stating that a single
and better query could potentially be built using the query variation set without using rank fusion. This
is an excellent recommendation for exploration of future work, alongside understanding the efficiency
considerations involved in issuing queries to multiple systems vs. a large one-shot query. Indeed, for
the full-dependency retrieval model when the number of keywords in a query is greater than 15 in
our experience, it becomes an intractable search. An efficiency-effectiveness exploration in this domain
would, therefore, be of significant benefit in justifying the use of query fusion, and double fusion by
extension.
Bibliography
[1] T. G. Armstrong, A. Moffat, W. Webber, and J. Zobel. Improvements that don’t add up: Ad-hocretrieval results since 1998. In Proc. CIKM, pages 601–610, 2009.
[2] P. Bailey, A. Moffat, F. Scholer, and P. Thomas. UQV100: A test collection with query variability. InProc. SIGIR, pages 725–728, 2016.
[3] P. Bailey, A. Moffat, F. Scholer, and P. Thomas. Retrieval consistency in the presence of queryvariations. In Proc. SIGIR, pages 395–404, 2017.
[4] J. Bar-Ilan. Position paper: Access to query logs-an academic researcher’s point of view. In Proc.WWW, 2007.
[5] M. Barbaro, T. Zeller, and S. Hansell. A face is exposed for AOL searcher no. 4417749. New YorkTimes, 2006.
[6] D. Beeferman, A. Berger, and J. Lafferty. Statistical models for text segmentation. J. ML, pages177–210, 1999.
[7] N. J. Belkin, C. Cool, W. B. Croft, and J. P. Callan. The effect multiple query representations oninformation retrieval system performance. In Proc. SIGIR, pages 339–346, 1993.
[8] N. J. Belkin, P. B. Kantor, E. A. Fox, and J. A. Shaw. Combining the evidence of multiple queryrepresentations for information retrieval. pages 431–448, 1995.
[9] M. Bendersky and W. B. Croft. Discovering key concepts in verbose queries. In Proc. SIGIR, pages491–498, 2008.
[10] R. Benham, L. Gallagher, J. Mackenzie, T. T. Damessie, R-C. Chen, F. Scholer, A. Moffat, and J. S.Culpepper. RMIT at the 2017 TREC CORE track. In Proc. TREC, 2017.
[11] B. Billerbeck and J. Zobel. Questioning query expansion: An examination of behaviour and pa-rameters. In Proc. ADC, pages 69–76, 2004.
[12] A. Broder. A taxonomy of web search. In Proc. SIGIR, pages 3–10, 2002.[13] C. Buckley and E. M. Voorhees. Retrieval system evaluation. TREC: Experiment and evaluation in
information retrieval, 2005.[14] O. Chapelle, D. Metlzer, Y. Zhang, and P. Grinspan. Expected reciprocal rank for graded relevance.
In Proc. CIKM, pages 621–630. ACM, 2009.[15] C. L. Clarke, N. Craswell, and I. Soboroff. Overview of the TREC 2009 web track. Technical report,
2009.[16] C. W. Cleverdon. The significance of the Cranfield tests on index languages. In Proc. SIGIR, pages
3–12, 1991.[17] C. W. Cleverdon, J. Mills, and M. Keen. Factors determining the performance of indexing systems.
1966.
59
60 BIBLIOGRAPHY
[18] K. Collins-Thompson, C. Macdonald, P. Bennett, F. Diaz, and E. M. Voorhees. TREC 2013 web trackoverview. In Proc. TREC, 2014.
[19] K. Collins-Thompson, C. Macdonald, P. Bennett, F. Diaz, and E. M. Voorhees. TREC 2014 web trackoverview. In Proc. TREC, 2015.
[20] W. S. Cooper. Getting beyond Boole. Inf. Proc. & Man., pages 243–248, 1988.[21] G. V. Cormack, C. L. A. Clarke, and S. Buettcher. Reciprocal rank fusion outperforms Condorcet
and individual rank learning methods. In Proc. SIGIR, pages 758–759, 2009.[22] T. T. Damessie, F. Scholer, and J. S. Culpepper. Gauging the quality of relevance assessments using
inter-rater agreement. 2017.[23] JC. de Borda. Mémoire sur les élections au scrutin. 1784.[24] J. Dean and S. Ghemawat. MapReduce: Simplified data processing on large clusters. ACM Comms.,
pages 107–113, 2008.[25] B. T. Dinçer, C. Macdonald, and I. Ounis. Risk-sensitive evaluation and learning to rank using
multiple baselines. In Proc. SIGIR, pages 483–492, 2016.[26] B. T. Dinçer, C. Macdonald, and I. Ounis. Hypothesis testing for the risk-sensitive evaluation of
retrieval systems. In Proc. SIGIR, pages 23–32, 2014.[27] D. Dubin. The most influential paper Gerard Salton never wrote. 2004.[28] E. A. Fox and J. A. Shaw. Combination of multiple searches. pages 243–252, 1994.[29] G. W. Furnas, T. K. Landauer, L. M. Gomez, and S. T. Dumais. The vocabulary problem in human-
system communication. ACM Comms., pages 964–971, 1987.[30] D. Gayo-Avello. A survey on session detection methods in query logs and a proposal for future
evaluation. J. Inf. Sci., pages 1822–1843, 2009.[31] M. Grossman, G. V. Cormack, and A. Roegiest. TREC 2016 total recall track overview. Proc. TREC,
2016.[32] K. Hafner. Researchers yearn to use aol logs, but they hesitate. New York Times, 2006.[33] D. K. Harman. The TREC test collections. TREC: Experiment and evaluation in information retrieval,
2005.[34] D. K. Harman. The TREC ad hoc experiments. TREC: Experiment and evaluation in information
retrieval, 2005.[35] K. Hofmann, L. Li, and F. Radlinski. Online evaluation for information retrieval. Found. Trends in
Inf. Ret., pages 1–117, 2016.[36] D. F. Hsu and I. Taksa. Comparing rank and score combination methods for data fusion in infor-
mation retrieval. pages 449–480, 2005.[37] K. Järvelin and J. Kekäläinen. Cumulated gain-based evaluation of IR techniques. ACM Trans.
Information Systems, pages 422–446, 2002.[38] A. G. Jivani. A comparative study of stemming algorithms. Int. J. Comp. Tech. Appl, pages 1930–
1938, 2011.[39] K. Sparck Jones and C. J. Van Rijsbergen. Information retrieval test collections. J. Doc, pages 59–75,
1976.[40] R. Krovetz. Viewing morphology as an inference process. In Proc. SIGIR, pages 191–202, 1993.[41] V. Lavrenko and W. B. Croft. Relevance based language models. In Proc. SIGIR, pages 120–127,
2001.
BIBLIOGRAPHY 61
[42] C. Lee, Q. Ai, W. B. Croft, and D. Sheldon. An optimization framework for merging multiple resultlists. In Proc. SIGIR, pages 303–312, 2015.
[43] S. Liang, Z. Ren, and M. de Rijke. Fusion helps diversification. In Proc. SIGIR, pages 303–312, 2014.[44] J. B. Lovins. Development of a stemming algorithm. Mech. Translat. & Comp. Linguistics, pages
22–31, 1968.[45] X. Lu, A. Moffat, and J. S. Culpepper. How effective are proximity scores in term dependency
models? In Proc. ADCS, pages 89–92, 2014.[46] X. Lu, A. Moffat, and J. S. Culpepper. The effect of pooling and evaluation depth on ir metrics.
pages 416–445, 2016.[47] C. D. Manning, P. Raghaven, and H. Schütze. Introduction to information retrieval. 2008.[48] A. Maurao, F. Martins, and J. Magalhaes. Inverse square rank fusion for multimodal search. In
Proc. CMBI, pages 1–6, 2014.[49] D. Metzler and W. B. Croft. A markov random field model for term dependencies. In Proc. SIGIR,
pages 472–479, 2005.[50] A. Moffat and J. Zobel. Rank-biased precision for measurement of retrieval effectiveness. pages
2.1–2.27, 2008.[51] A. Moffat, F. Scholer, P. Thomas, and P. Bailey. Pooled evaluation over query variations: Users are
as diverse as systems. In Proc. SIGIR, pages 1759–1762, 2015.[52] M. Montague and J. A. Aslam. Condorcet fusion for improved retrieval. In Inf. Proc. & Man., pages
538–548, 2002.[53] K. B. Ng and P. B. Kantor. An investigation of the preconditions for effective data fusion in infor-
mation retrieval: A pilot study. 1998.[54] K. B. Ng and P. B. Kantor. Predicting the effectiveness of naive data fusion on the basis of system
characteristics. pages 1177–1189, 2000.[55] T. Noreault, M. McGill, and M. B. Koll. A performance evaluation of similarity measures, docu-
ment term weighting schemes and representations in a boolean environment. In Proc. SIGIR, pages57–76, 1981.
[56] G. Pass, A. Chowdhury, and C. Torgeson. A picture of search. 2006.[57] J. Plisson, N. Lavrac, and D. Mladenic. A rule based approach to word lemmatization. 2004.[58] S. Pohl, J. Zobel, and A. Moffat. Extended boolean retrieval for systematic biomedical reviews. In
Proc. ACSC, pages 117–126, 2010.[59] J. M. Ponte and W. B. Croft. A language modeling approach to information retrieval. In Proc.
SIGIR, pages 275–281, 1998.[60] M. F. Porter. An algorithm for suffix stripping. J. P. Elec. Lib. IS., pages 130–137, 1980.[61] S. E. Robertson. On GMAP: and other transformations. In Proc. CIKM, pages 78–83, 2006.[62] S. E. Robertson and K. Sparck Jones. Relevance weighting of search terms. J. Am. Soc. for Inf. Sci.,
pages 129–147, 1976.[63] S. E. Robertson, S. Walker, S. Jones, M. M. Hancock-Beaulieu, and M. Gatford et. al. Okapi at
TREC-3. Proc. TREC, 1995.[64] J. J. Rocchio. Relevance feedback in information retrieval. The SMART Retrieval System-Experiments
in Automatic Document Processing, 1971.
62 BIBLIOGRAPHY
[65] A. Roegiest, G. V. Cormack, M. Grossman, and C. Clarke. TREC 2015 total recall track overview.Proc. TREC, 2015.
[66] G. Salton. Automatic text processing: The transformation, analysis, and retrieval of informationby computer. 1989.
[67] G. Salton and C. Buckley. Term-weighting approaches in automatic text retrieval. Inf. Proc. & Man.,pages 513 – 523, 1988.
[68] G. Salton, A. Wong, and C. S. Yang. A vector space model for automatic indexing. pages 613–620,1975.
[69] G. Salton, E. A. Fox, and H. Wu. Extended boolean information retrieval. pages 1022–1036, 1983.[70] M. Sanderson and W. B. Croft. The history of information retrieval research. pages 1444–1451,
2012.[71] L. Schamber, M. B. Eisenberg, and M. S. Nilan. A re-examination of relevance: Toward a dynamic,
situational definition. Inf. Proc. & Man., pages 755–776, 1990.[72] E. M Voorhees. The TREC-8 question answering track report. In Proc. TREC, pages 77–82, 1999.[73] E. M. Voorhees. Variations in relevance judgments and the measurement of retrieval effectiveness.
Inf. Proc. & Man., pages 697–716, 2000.[74] E. M. Voorhees. The philosophy of information retrieval evaluation. In Proc. CLEF, pages 355–370,
2001.[75] E. M. Voorhees. Overview of TREC 2003. In Proc. TREC, pages 1–13, 2003.[76] E. M. Voorhees. Overview of the TREC 2004 robust retrieval track. In Proc. TREC, 2005.[77] E. M. Voorhees and D. K. Harman. The Text REtrieval Conference. TREC: Experiment and evaluation
in information retrieval, 2005.[78] E. M. Voorhees and D. K. Harman. TREC: Experiment and evaluation in information retrieval. 2005.[79] W. Webber, A. Moffat, and J. Zobel. A similarity measure for indefinite rankings. ACM Trans.
Information Systems, 28(4):20, 2010.[80] M. Westerlund, P. W. Wong, K.-W. Fu, R. S.-P. Yau, H. H.-M. Ma, Y.-W. Law, S.-S. Chang, and P. S.-F.
Yip. Accessing suicide-related information on the internet: A retrospective observational study ofsearch behavior. J. Med. Internet Res, 2013.
[81] P. Willett. The Porter stemming algorithm: Then and now. J. P. Elec. Lib. IS., pages 219–223, 2006.[82] I. H. Witten, A. Moffat, and T. C. Bell. Managing gigabytes: Compressing and indexing documents and
images. Morgan Kaufmann, 1999.[83] S. K. M. Wong and V. V. Raghavan. Vector space model of information retrieval: A re-evaluation.
In Proc. SIGIR, pages 167–185, 1984.[84] S. Wu and S. McClean. Performance prediction of data fusion for information retrieval. pages
899–915, 2006.[85] H. P. Young. Condorcet’s theory of voting. pages 1231–1244, 1988.[86] C. Zhai and J. Lafferty. A study of smoothing methods for language models applied to ad hoc
information retrieval. In Proc. SIGIR, pages 334–342, 2001.[87] L. Zighelnic and O. Kurland. Query-drift prevention for robust query expansion. In Proc. SIGIR,
pages 825–826, 2008.[88] M. Zimmer. Privacy on planet Google: Using the theory of contextual integrity to clarify the
privacy threats of Google’s quest for the perfect search engine. J. Bus. & Tech. L., page 109.

BIBLIOGRAPHY 63
[89] M. Zimmer. "But the data is already public": On the ethics of research in Facebook. J. Ethics InfTechnol., pages 313–325, 2010.
[90] J. Zobel. How reliable are the results of large-scale information retrieval experiments? In Proc.SIGIR, pages 307–314, 1998.
[91] J. Zobel and A. Moffat. Exploring the similarity space. Proc. SIGIR, pages 18–34, 1998.[92] J. Zobel, A. Moffat, and L. AF. Park. Against recall: Is it persistence, cardinality, density, coverage,
or totality? In Proc. SIGIR, pages 3–8, 2009.

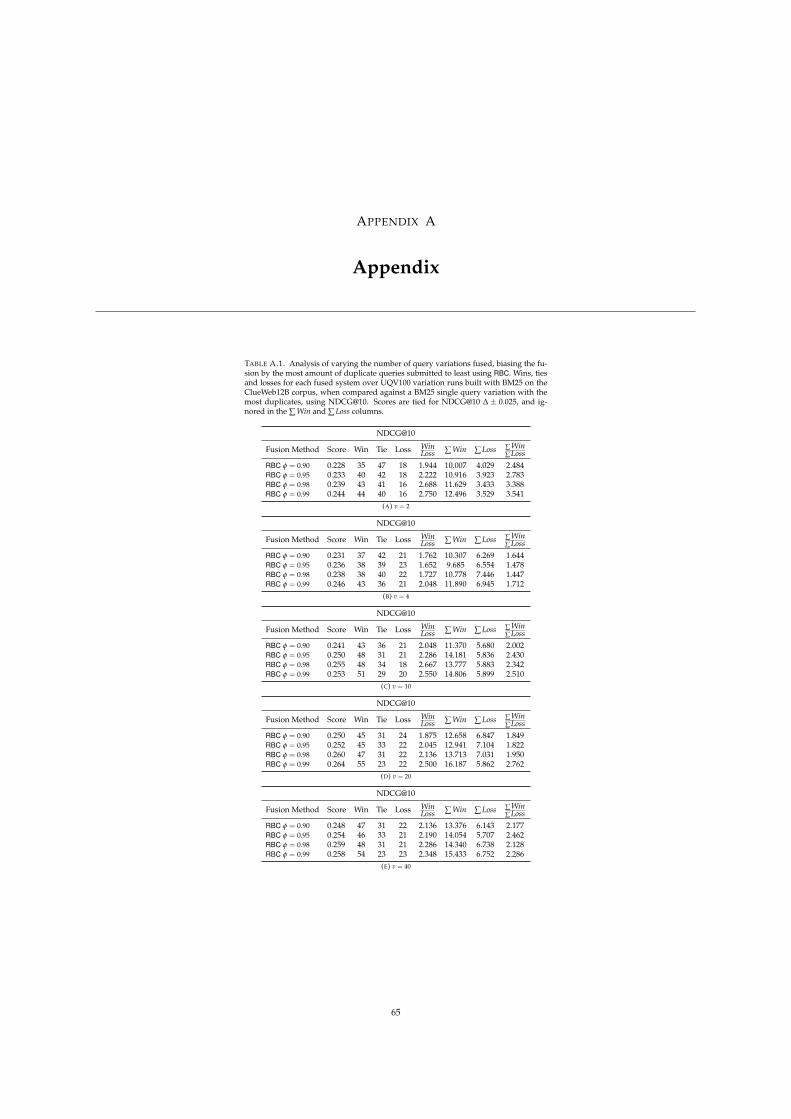
APPENDIX A
Appendix
TABLE A.1. Analysis of varying the number of query variations fused, biasing the fu-sion by the most amount of duplicate queries submitted to least using RBC. Wins, tiesand losses for each fused system over UQV100 variation runs built with BM25 on theClueWeb12B corpus, when compared against a BM25 single query variation with themost duplicates, using NDCG@10. Scores are tied for NDCG@10 ∆ ± 0.025, and ig-nored in the ∑ Win and ∑ Loss columns.
NDCG@10
Fusion Method Score Win Tie Loss WinLoss ∑ Win ∑ Loss ∑ Win
∑ LossRBC φ = 0.90 0.228 35 47 18 1.944 10.007 4.029 2.484RBC φ = 0.95 0.233 40 42 18 2.222 10.916 3.923 2.783RBC φ = 0.98 0.239 43 41 16 2.688 11.629 3.433 3.388RBC φ = 0.99 0.244 44 40 16 2.750 12.496 3.529 3.541
(A) v = 2
NDCG@10
Fusion Method Score Win Tie Loss WinLoss ∑ Win ∑ Loss ∑ Win
∑ LossRBC φ = 0.90 0.231 37 42 21 1.762 10.307 6.269 1.644RBC φ = 0.95 0.236 38 39 23 1.652 9.685 6.554 1.478RBC φ = 0.98 0.238 38 40 22 1.727 10.778 7.446 1.447RBC φ = 0.99 0.246 43 36 21 2.048 11.890 6.945 1.712
(B) v = 4
NDCG@10
Fusion Method Score Win Tie Loss WinLoss ∑ Win ∑ Loss ∑ Win
∑ LossRBC φ = 0.90 0.241 43 36 21 2.048 11.370 5.680 2.002RBC φ = 0.95 0.250 48 31 21 2.286 14.181 5.836 2.430RBC φ = 0.98 0.255 48 34 18 2.667 13.777 5.883 2.342RBC φ = 0.99 0.253 51 29 20 2.550 14.806 5.899 2.510
(C) v = 10
NDCG@10
Fusion Method Score Win Tie Loss WinLoss ∑ Win ∑ Loss ∑ Win
∑ LossRBC φ = 0.90 0.250 45 31 24 1.875 12.658 6.847 1.849RBC φ = 0.95 0.252 45 33 22 2.045 12.941 7.104 1.822RBC φ = 0.98 0.260 47 31 22 2.136 13.713 7.031 1.950RBC φ = 0.99 0.264 55 23 22 2.500 16.187 5.862 2.762
(D) v = 20
NDCG@10
Fusion Method Score Win Tie Loss WinLoss ∑ Win ∑ Loss ∑ Win
∑ LossRBC φ = 0.90 0.248 47 31 22 2.136 13.376 6.143 2.177RBC φ = 0.95 0.254 46 33 21 2.190 14.054 5.707 2.462RBC φ = 0.98 0.259 48 31 21 2.286 14.340 6.738 2.128RBC φ = 0.99 0.258 54 23 23 2.348 15.433 6.752 2.286
(E) v = 40
65