Embed Size (px)
Citation preview
DI
SC
US
SI
ON
P
AP
ER
S
ER
IE
S
Forschungsinstitut zur Zukunft der ArbeitInstitute for the Study of Labor
Improving Reading Skills by Encouraging Children to Read: A Randomized Evaluation of the Sa Aklat Sisikat Reading Program in the Philippines
IZA DP No. 5812
June 2011
Ama Baafra AbebereseTodd J. KumlerLeigh L. Linden
Improving Reading Skills by Encouraging
Children to Read: A Randomized Evaluation of the Sa Aklat Sisikat
Reading Program in the Philippines
Ama Baafra Abeberese Columbia University
Todd J. Kumler
Columbia University
Leigh L. Linden University of Texas at Austin
and IZA
Discussion Paper No. 5812 June 2011
IZA
P.O. Box 7240 53072 Bonn
Germany
Phone: +49-228-3894-0 Fax: +49-228-3894-180
E-mail: [email protected]
Any opinions expressed here are those of the author(s) and not those of IZA. Research published in this series may include views on policy, but the institute itself takes no institutional policy positions. The Institute for the Study of Labor (IZA) in Bonn is a local and virtual international research center and a place of communication between science, politics and business. IZA is an independent nonprofit organization supported by Deutsche Post Foundation. The center is associated with the University of Bonn and offers a stimulating research environment through its international network, workshops and conferences, data service, project support, research visits and doctoral program. IZA engages in (i) original and internationally competitive research in all fields of labor economics, (ii) development of policy concepts, and (iii) dissemination of research results and concepts to the interested public. IZA Discussion Papers often represent preliminary work and are circulated to encourage discussion. Citation of such a paper should account for its provisional character. A revised version may be available directly from the author.
IZA Discussion Paper No. 5812 June 2011
ABSTRACT
Improving Reading Skills by Encouraging Children to Read: A Randomized Evaluation of the Sa Aklat Sisikat Reading
Program in the Philippines* We evaluate a program that aims to improve children’s reading skills by providing classes with age-appropriate reading material and incentivizing children to read through a 31 day read-a-thon. During the read-a-thon, the program significantly increases the propensity of children to read, causing 20 percent more children to have read a book in the last week at school and increasing the number of books read by 2.3 in the last week and 7.2 in the last month. These increases extend both after the end of the program and outside of school, although at lower rates. The program also increased students’ scores on a reading assessment, causing students’ scores to improve by 0.13 standard deviations immediately after the program. The effect persisted even after the program ended with an effect of 0.06 standard deviations three months later. JEL Classification: I21, I28, O15 Keywords: education, reading, development Corresponding author: Leigh L. Linden Department of Economics Columbia University Mail Code 3308 420 West 118th Street New York, NY 10027 USA E-mail: [email protected]
* We are indebted to many individuals who were significantly involved with the execution of this experiment. We wish to thank Catherine S. Alcaraz, Marie Angeles, Coly Los Baños, Clarissa Isabelle Delgado, Margarita L Delgado, Norlyn Gregorio, Elizabeth E. Zobel and all of the other staff members of the Sa Aklat Siskat Foundation for their support and assistance during the evaluation. All surveys were conducted by TNS Philippines. Finally, we are grateful to an anonymous donor for generously agreeing to fund this research effort. Without his or her help, this project would not have been possible.
- 1 -
I. Introduction
Universal primary education is receiving increased attention due in part to the
Millennium Development Goals and Education for All campaigns. However, the average quality
of primary schools in many developing countries is notoriously poor. While many countries
have succeeded at increasing enrollment rates, many children attend schools that may not be
suited to their educational needs (see, for example, Glewwe and Kremer, 2006). Hanushek and
Wossmann (2007), for example, document a clear difference in both educational attainment
and the quality of education in developed and developing countries. Understanding the nature
of education production and identifying viable strategies for increasing educational quality in
resource-constrained settings are therefore crucial. Furthermore, effective improvements in
reading instruction may be particularly important because existing research suggests reading at
an early age lays a necessary foundation for subsequent skill development (Scarborough, 2001).
We assess the potential of a Philippine program that seeks to improve children’s reading
skills by encouraging reading amongst fourth grade students. Using a randomized controlled
trial set in Tarlac province of the Philippines, we analyze the impact of an educational
intervention that provides schools with age-appropriate reading material and then incentivizes
reading through a 31-day reading marathon. The reading marathon encourages students to
read as many books as possible through daily, in-school reading activities such as storytelling
sessions, reading games, and posters that display each class’s progress.
The RCT sample consisted of all 5,510 fourth-grade students from 100 schools in Tarlac,
a province near the capital. Following a baseline assessment of students’ reading skills at the
start of the academic year, these schools were randomly assigned equally to a treatment and
- 2 -
control group. The effects of the program were estimated using two follow-up surveys
conducted just after the completion of the reading marathon (and four months after the
baseline), and then again seven months after the baseline at the end of the academic year. This
provides an assessment of the effect of the program immediately following the intervention as
well as an assessment of the intervention’s effects several months after the NGO has stopped
working with the schools. In addition, we test both students’ reading skills as well as their
knowledge of other subjects to assess the possibility of spillovers.
Overall, the results suggest that encouraging an increased use of age-appropriate
reading materials by students is a viable strategy for improving student’s reading skills.
Immediately after the treatment, students report that the number of books they read at school
in the last week increased from 1.9 to 4.2 and the number of books they read at school in the
last month increased from 2.3 to 9.5. At the same time, their reading scores increased by 0.13
standard deviations. Three months after the end of the program, treatment students were still
reading 3.1 books more in the last month than the control group. The treatment effect on
reading scores also persisted with an effect of 0.06 standard deviations three months later. The
program also seems to increase the number of books read outside of school and after the
program ended. However, the observed effect is smaller. The effects at the second survey, for
example, were an additional 0.34 books read in the last week and 0.89 books read in the last
month in school. Breaking down the effect on test scores by subject, the program seems to
have its largest and most persistent effect on word recognition, although it has generally
positive effects on most of the evaluated elements of the reading exam.
- 3 -
This study relates to two main strands of the economics of education and education
literature. The first involves interventions targeted at improving the reading abilities of young
children. A large number of programs in the United States have focused on providing children
with one-on-one or small group tutoring in reading, specifically those children identified as
requiring remedial attention2
Within this strand of literature, attention has also been given to the use of computers,
the differences between in- or out-of-school classes, and the involvement of parents and
. Overall, there is some evidence from randomized evaluations
that such programs can be effective in improving students’ reading skills. Vellutino and Scanlon
(2001) randomly assign poor readers to early one-on-one tutoring. The intervention proved
effective, and while one-on-one tutoring of all children may prove too costly, the results
demonstrate that reading interventions can be effective.
Several programs have evaluated reading programs in the developing context. In India,
Banerjee et al. (2007) find that low-cost remedial programs using young women from local
communities to teach basic literacy skills to young children substantially improves their
performance on a language test. In addition, He, Linden, and MacLeod (2009) find that an
Indian program designed to improve the teaching of reading to kindergarten and first grade
students can be effective in a number of settings including public schools. Borkum, He and
Linden (2009) evaluate a program that provides schools in Bangalore with libraries and find no
measurable effects on students’ language skills.
2 Wassik and Slavin (1993) provide a review of several studies of programs that use trained professionals to conduct various reading and literacy related activities with these children. One particular program that has been extensively evaluated is the Reading Recovery program: see for example Center et al. (1995) and Shanahan and Barr (1995). Wassik (1998) reviews similar studies on programs that use adult volunteers instead, while Baker, Gersten and Keating (2000) conduct a more recent randomized evaluation of such a volunteer tutoring program.
- 4 -
teachers. Rouse and Kruger’s (2004) evaluation of a set of instructional computer games known
as Fast Forward in the United States finds that these costly interventions (in terms of licenses
and equipment) have little impact on general reading ability although they do lead to improved
phonetic skills. Machin and McNally (2008) evaluate an in-class literacy program in English
primary schools in which one hour per day is set aside for literacy-related activities such as
group reading. The authors show that the program had a significant effect on reading and
English scores, and that the literacy program even had a lasting impact on students’ English
scores once they reach secondary school. Finally, Kim (2007) evaluates a program in the United
States in which randomly selected children in grades 1-5 received story books over the summer
vacation. While self-reported reading activity and participation in literacy-related activities
(such as visiting the library) were higher in the treatment group, there were no improvements
in reading test scores. Kim suggests a need for more explicit involvement by teachers and
parents that goes beyond the mere provision of reading materials.
The second strand of literature to which this study relates seeks to understand more
generally the effects of school resources on student learning. Hanushek (1995, 2006) reviews a
wide range of studies that view resources as inputs in a school production function and test
scores as the output. “Resources” in this context are defined broadly and include expenditure
per pupil, class size, teacher level of education, material inputs, etc. Hanushek concludes that
the evidence that resources matter is weak for both the United States and for developing
countries, and he suggests that increasing resources in inefficient school systems is unlikely to
improve student outcomes. However, he also suggests that additional resources can make a
difference in developing countries where the initial level of resources is particularly low.
- 5 -
Glewwe and Kremer’s (2006) review of education in developing countries provides a
detailed assessment of several retrospective studies on developing countries. They conclude
that the impact of school and teacher characteristics on student test scores is mostly
insignificant. Overall, the more convincing estimates from these evaluations imply that the
success of any particular input-based educational intervention in developing countries largely
depends on the characteristics of the program itself, and its ability to operate effectively in
spite of the problems inherent in the education systems of these countries. For example,
Glewwe, Kremer and Moulin’s (2007) study of textbooks and Glewwe et al.’s (2004) study of flip
charts, both in Kenya, find these resources have little overall impact on test scores. Programs
that both provide resources and make a substantive change to the existing pedagogy (e.g.
Banerjee et al, 2007, and He, Linden, and MacLeod, 2009), however, do seem to have
significant effects.
The remainder of the paper is organized as follows. Section II provides an overview of
the intervention. We describe the research design in Section III. Section IV documents the
internal validity of the study, and in Section V, we estimate the effects of the treatment.
Finally, we conclude in Section VI.

- 6 -
II. The Sa Aklat Sisikat Read-A-Thon
The reading program evaluated in this study is a core program of Sa Aklat Sisikat3 (SAS),
a non-profit organization located in Metro Manila with the stated goal of building a nation of
readers. Since the inception of the organization in 1999, SAS has implemented its reading
program in over 750 public schools in every province in the Philippines, reaching nearly 150,000
students. The main focus of the SAS program is to encourage children to read by making it
engaging. The program has two main components – providing schools with a set of age-
appropriate books and training teachers to carry out a 31 day “read-a-thon” in which students
are encourage to read a large number of the books. The program is targeted at fourth grade
students because this is the point at which the Philippine school system expects students to
have developed sufficient reading fluency to enjoy reading independently.4
Because most public schools lack age-appropriate literature,
5 SAS donates 60 Filipino
storybooks to every fourth-grade classroom at participating schools. The books are specifically
selected for literary value as well as their potential appeal to students. Books are provided in
both of the country’s official languages, English and Filipino, so that teachers can use books that
match their chosen language of instruction.6
3 Sa Aklat Sisikat is loosely translated as “Books Make You Cool.” 4 Reading fluency is the point at which beginning readers rely less on the phonemic decoding to recognize individual words and begin to recognize whole words, allowing for an increase in reading speed and comprehension. Meyer and Felton (1999), for example, define fluency as “the ability to read connected text rapidly, smoothly, effortlessly, and automatically with little conscious attention to the mechanics of reading, such as decoding.” 5 For example, during our visits to local schools, we observed a few schools with libraries. However, most of the books were donated from developed countries. The subjects and writing styles were not age appropriate. It was thus not a surprise that teachers used them infrequently. 6 For this reason, all evaluations in this study were conducted in Filipino. The Philippines has two official languages, Filipino and English, and under an existing executive order, schools are allowed to instruct students in either language. Books are provided in both languages, although in the sample, students were instructed mainly in Filipino.
- 7 -
Prior to receiving the materials, fourth-grade teachers from each school attend a two-
day SAS training session in which they are taught to implement the read-a-thon. Reading
specialists at the training workshop also provide the teachers with ideas for various reading
lessons that are both interactive and engaging for students. For 31 days after the teachers finish
the training, they implement the program. During this period, the students and teachers use
the donated storybooks in hour-long daily reading activities including dramatic storytelling,
literary games, and individual silent reading. Students are encouraged to read as many of the 60
story books as possible, and each student keeps track of the number of books she reads using
an SAS supplied wall chart. Students also write their thoughts about the stories in reading
notebooks. Finally, SAS also supports teachers by providing monitors who visit the schools to
check that the program is being implemented correctly and to answer any questions that
teachers may have.
While the read-a-thon itself only lasts 31 days, the partner schools keep the 60
storybooks following the completion of the program. The books are left for the school to use at
their discretion, but the expectation is that the experiences created by the intensive read-a-
thon will encourage teachers to continue using the books in their classes and students to
continue reading.
- 8 -
III. Methodology
In order to isolate the causal impact of the reading program, we randomly assigned
participation in the program to a subset of public schools. This random assignment of schools
into treatment and control groups ensures that receipt of the reading program is statistically
uncorrelated with school or student characteristics that may be correlated with students’
reading ability. Thus, any differences in reading outcomes across schools following the
treatment can be directly attributed to the reading program.
A. Research Design
The research sample consists of all fourth-grade classrooms at 100 elementary schools
in Tarlac province in the Philippines. Prior to the experiment, Sa Aklat Sisikat had never
conducted its reading program in the province7
A baseline survey was conducted in all 100 schools in July 2009. Following the survey,
schools were assigned to the treatment and control groups using a matched-pair stratified
randomization. Schools were divided into pairs within each district using the school level
. In conjunction with the province
superintendent, SAS selected nine geographically proximate districts in the province
representing a broad range of academic performance levels. From these districts, 100 schools
were chosen for the experiment; for most districts, all schools in the district were included in
the study.
7 In addition to the fact that SAS itself had never implemented its reading program in schools in Tarlac province, relatively few other reading interventions had been conducted in the province. Due to a concern that schools in Tarlac City, the largest urban area in Tarlac province, have been previous recipients of other reading programs, schools in Tarlac City were excluded from the sample.
- 9 -
average baseline reading scores.8 Within each pair, one school was assigned to the treatment
group and the other the control group, resulting in an equal probability of assignment to either
group. The read-a-thon was then conducted between the months of September and
November.9
Each survey round contained an assessment of children’s reading skills. These exams
were based in part on a national reading examination created and administered annually by the
Philippine Department of Education.
Two follow-up surveys were conducted to assess the effects of the intervention.
The first was conducted immediately after the implementation of the read-a-thon in late
November and early December 2009 to measure the immediate effects of the intervention. and
the second was conducted in late February 2010 to determine whether the effects persisted
after SAS ceased interacting with the treatment schools.
B. Data
10
8 We have also estimated the primary specifications including fixed effects for the original groupings for the randomization. The results are consistent with those presented below. These results are available upon request. 9 During the implementation of the read-a-thon, Tarlac experienced severe flooding that led to the cancellation of several days of school in many of the school districts. In addition, all-school events such as science fairs, town holidays, and standardized testing caused schools to take days off from the read-a-thon. However, all treatment schools completed the 31 day read-a-thon prior to the first follow-up examination. 10 We chose to use sections of the national exam in order to ensure that both treatment and control groups were assessed using an instrument with which both groups were equally familiar. We wanted to avoid, for example, choosing an exam that might be geared towards the particular intervention being tested, and thus might favor the treatment students simply due to familiarity. The letter, sound, and word recognition sections were added to assess more basic competencies than typically tested on the official exam.
The examination consisted of a silent reading
component and an oral reading component. In the first part of the test, students are asked to
silently read a written passage and answer questions relating to the passage. Following the
silent reading, students were given a one-on-one oral reading test consisting of letter
recognition, sound recognition, word recognition, and an oral reading passage. For each
- 10 -
section, we created a standardized score by normalizing relative to the control distribution.
Because the values for each section are not measured using the same units, we create a
composite normalized reading score by averaging the normalized scores from each section and
then normalizing the average, again relative to the distribution of the control group.
A local survey firm proctored and graded all of the examinations independently of the
teachers to guarantee the validity of the test scores. In addition, teachers were not informed in
advance of the content of the exam to prevent them from preparing students for the test. In
order to ensure that a high percentage of students in the sample were tested, the survey team
returned multiple times to many of the schools to test absent students.
Each survey also contained data unique to the individual round. In the baseline survey,
we collected children’s age, gender, height, weight, number of siblings, religion, and the dialect
spoken at home. In the follow-up surveys, we collected information on children’s reading
habits as well as tested students in other subjects to investigate possible spillovers from the
intervention. The reading survey asked students about the number of books they read in the
last week and the last month both in and out of school. In addition, we asked students to name
the title and to describe the plot of the last book they read to assess the validity of their
responses. For the alternate subject tests, we tested a different subject each round. In the first
follow-up survey, we tested children’s math skills, and in the second one, we tested children’s
knowledge of social studies, the most reading intensive alternate subject.
- 11 -
C. Statistical Models
In order to analyze the effect of the reading program, we utilize three basic models.
First, we employ a simple difference specification to directly compare the treatment and
control groups:
Yis = α + β1Ts + εis (1)
where Yis is the outcome of interest for child i in school s; and Ts is an indicator variable for
whether the school received the reading program. Hence, the estimate of the coefficient β1
indicates the differences between treatment and control schools. We utilize this model to
compare baseline differences in socio-demographic characteristics and test scores and to
estimate the effect of the reading program on follow-up test scores and reading habits.
Since the reading program is randomly assigned to schools and therefore independent
of baseline characteristics, inclusion of observable baseline characteristics and baseline test
scores as control variables in equation (1) improves the precision of the estimated treatment
effect. We also run the following specification:
Yis = α + β1Ts + β2Xis + ωd + εis (2)
where Yis and Ts are defined as in equation (1), and where Xis is a vector of baseline student
characteristics including composite baseline reading test score, gender, age, religion dummies,
dialect dummies, and body mass index (BMI). Since randomization was stratified within district,
we also include district fixed effects, ωd, in equation (2).
Finally, we test the validity of the experiment by comparing the effect of the treatment
on the relative characteristics of the children who attrite from the sample between the baseline
survey and the two follow-up surveys. We run the following difference in differences model:
- 12 -
Yis = α + β1Ts + β2Attritis + β3Ts*Attriteis + εis (3)
The variables Yis and Ts are defined as before, and Attriteis is an indicator variable equal to one if
a student i enrolled in school s is not present in the follow-up data. The estimate of β2 then
provides the average differences between attritors and non-attritors, and the estimate of β3
captures the difference between attritors and non-attritors in the treatment group relative to
the same difference in the control group.
Because outcomes may be correlated within school, failure to correct the standard
errors could result in an overestimate of the precision of the treatment effects (Bertrand, Duflo,
Mullainathan, 2004). We therefore cluster the standard errors at the school level (the level of
randomization) in all of the above models.
IV. Internal Validity
Randomly assigning schools to the intervention ensures that assignment is orthogonal
to student characteristics that may be correlated with the outcomes of interest. If this holds,
then any differences in outcomes between the two groups post-intervention can be causally
attributed to the intervention. To check that student characteristics were indeed similar
between the two groups, we run regressions of student characteristics from the baseline survey
on treatment status, and then verify that changes in the sample due to attrition are also
uncorrelated with treatment status.
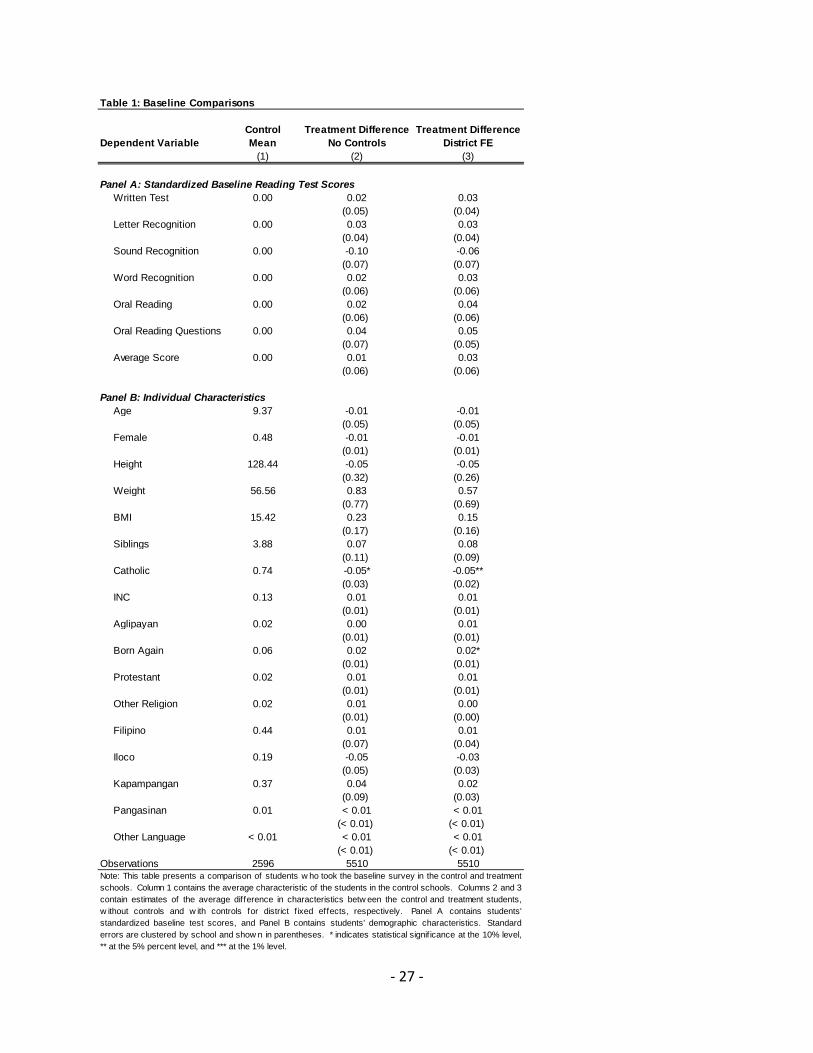
We present the comparison of students at baseline in Table 1. Column 1 contains the
average characteristics for the control group. Columns 2 and 3 present the estimated
differences between the treatment and control groups. The results in column 2 do not include
- 13 -
any controls, while those in column 3 control for district fixed effects. Panels A and B contain
standardized reading test scores and demographic characteristics, respectively.
The differences in average characteristics between the control and treatment groups
are all practically small and mostly statistically insignificant. In Panel A, none of the differences
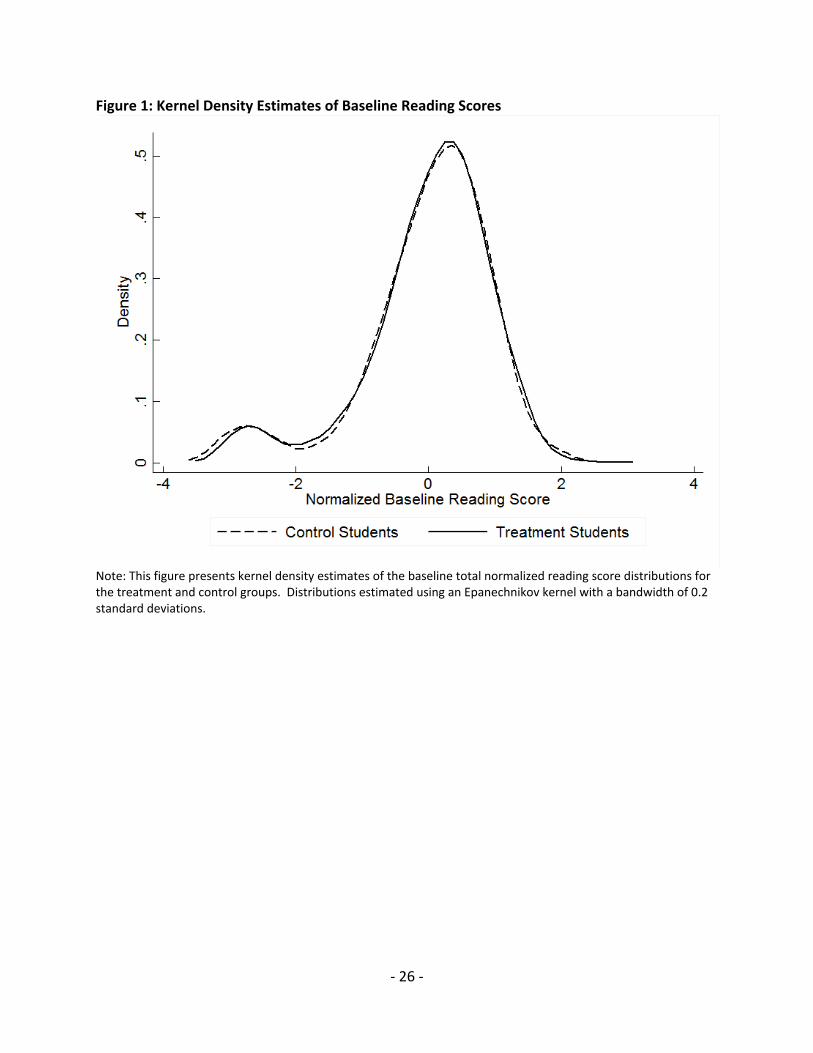
in test scores are statistically significant. Figure 1 shows a plot of the distribution of the
standardized overall reading test score for the treatment group (dotted line) and the control
group (solid line). These distributions almost overlap, further corroborating the comparability
of the treatment and control groups. In Panel B, the only demographic variables with
statistically significant differences are those related to religion, but these differences are small
in magnitude. For instance, 74 percent of students in the control group are Catholics compared
to 69 percent in the treatment group, yielding a minimal difference of 5 percentage points.
Thus, overall, the randomization appears to have been successful in creating comparable
treatment and control groups.
Although the baseline comparisons presented in Table 1 and Figure 1 show that the
treatment and control groups were similar at baseline, it is possible that non-random attrition
from the two groups between the baseline and follow-up surveys may have rendered the two
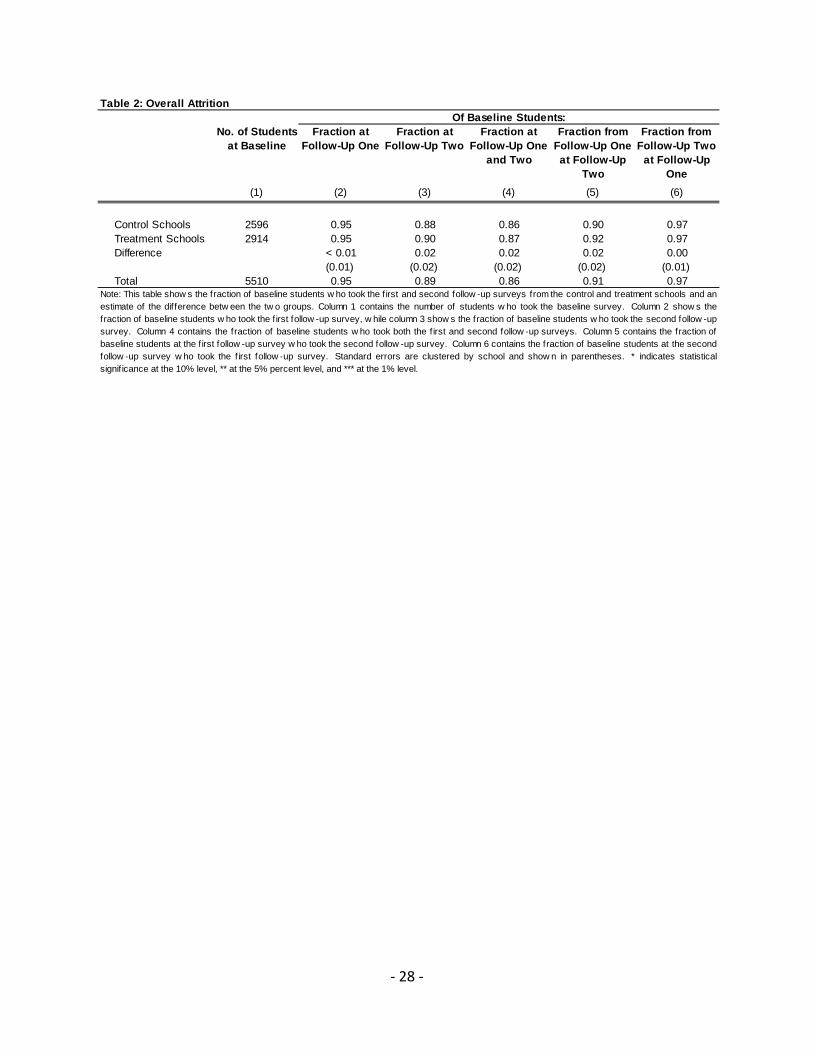
groups incomparable. Table 2 shows the attrition rates for both groups and the differences
between the two. There are no statistically significant differences between the attrition rates
for the control and treatment groups. For both groups, approximately 5 percent of the
students who were tested during the baseline survey were absent during the first follow-up
survey, and 11 percent were absent during the second survey. Comparing the rates across
- 14 -
research groups, the rates are the same in the first follow-up and differ by only 2 percentage
points in the second (10 percentage points in the treatment schools and 12 in the control).
Columns 4 through 6 provide estimates of the attrition rates between follow-up surveys.
Overall, 86 percent of the students were present at both follow-up surveys (column 4), and the
difference in the rates between research groups is small. Similarly, 91 percent of students who
were present at follow-up one were also present at the second follow-up, and of those present
at the second, 97 percent were present at the first.
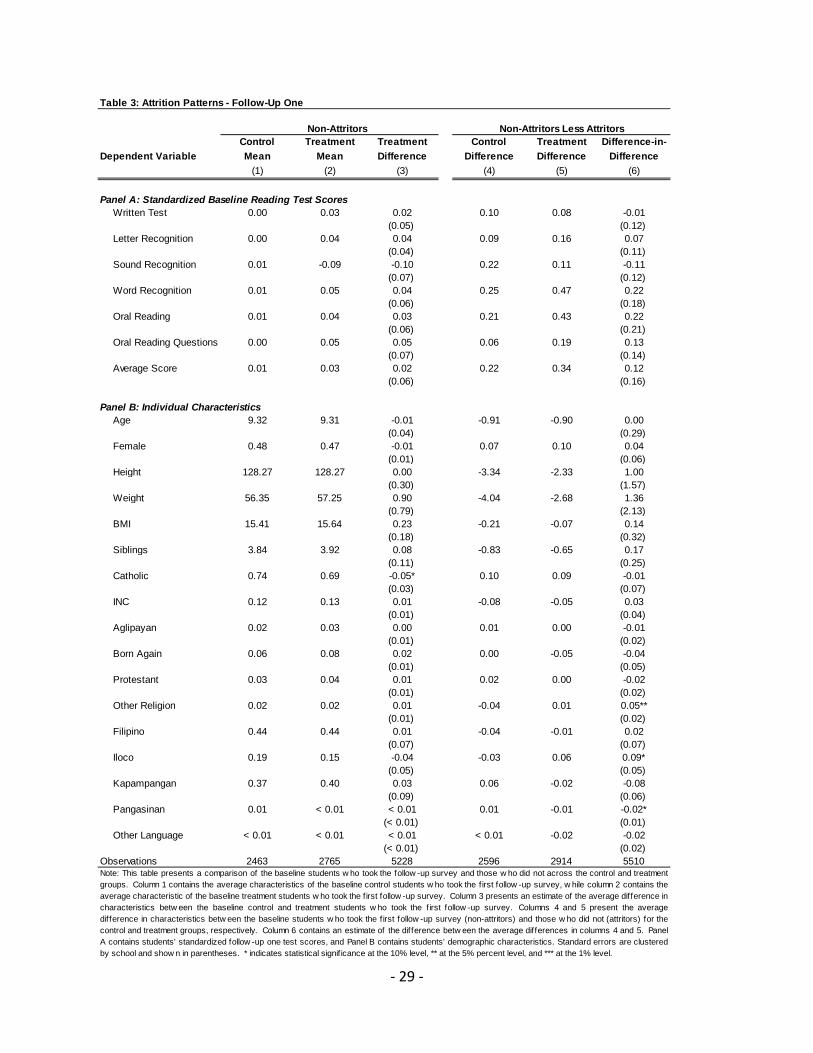
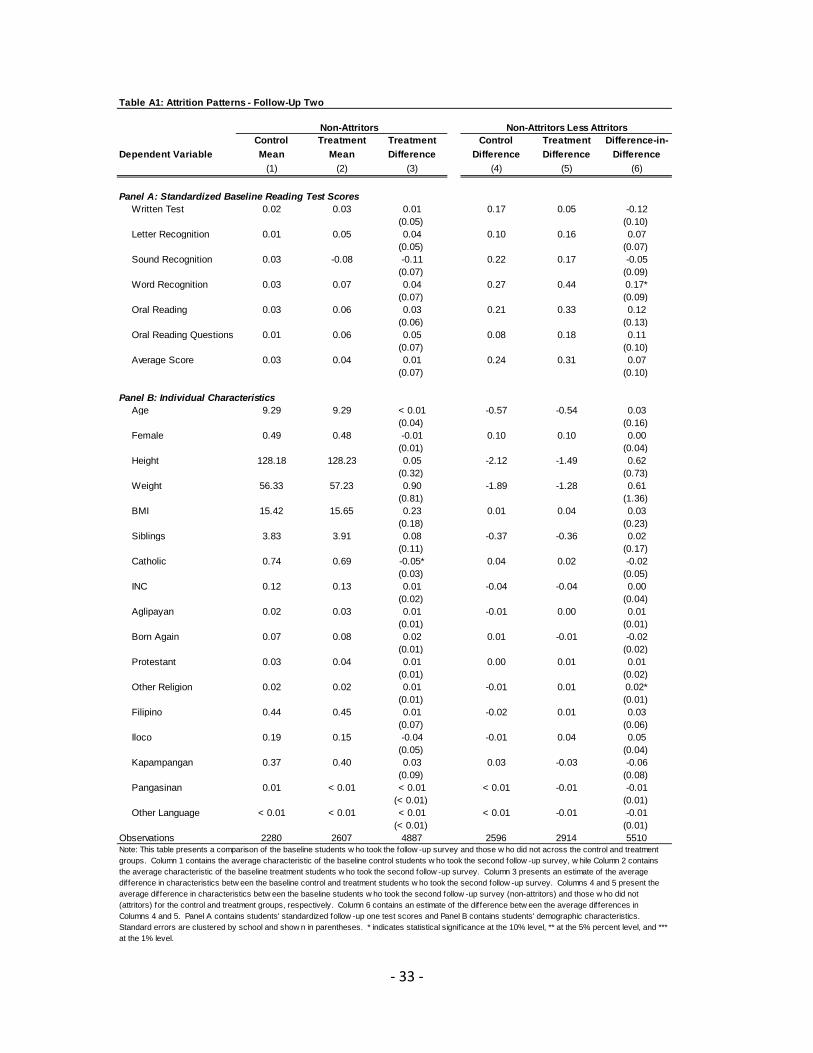
Even though the attrition rates were similar for both groups, the characteristics of the
attritors and non-attritors could have still differed between the two groups. We check this
possibility in Table 3 for the first follow-up survey. The results for the second follow-up survey
are similar and presented in the Appendix (Table A1). Panel A focuses on test scores while
Panel B focuses on demographic characteristics. Columns 1 and 2 contain the average
characteristic for non-attritors in the control and treatment groups, respectively, while column
3 contains the difference between these averages estimated using equation (1). All of the
differences are statistically insignificant with the exception of the proportion of non-attritors
who are Catholic. However, this difference is small in magnitude (5 percentage points) and is
identical to the difference found for the entire sample during the baseline survey.
The last three columns of Table 3 show that the differences between the characteristics
of the non-attritors and attritors are similar across the two groups. Column 4 presents the
difference in average characteristic between the non-attritors and the attritors in the control
group. Column 5 presents this same statistic for the treatment group, and column 6 presents
the difference between the two statistics using equation (3). These differences are mostly
- 15 -
statistically insignificant, and all of them are small in magnitude. We therefore conclude that
the comparability of the control and treatment groups was sustained throughout the follow-up
surveys.
V. Results
Given that the research groups are comparable, we can attribute any differences in
outcomes observed in the follow-up surveys to the intervention. SAS aims to promote the
habit of reading in students and, thereby, improve their reading ability. We therefore proceed
with our analysis of the outcomes as follows. We first investigate whether the intervention was
successful in promoting the habit of reading in students by comparing the frequency of reading
between the control and treatment groups. We then determine whether the observed positive
effect of the intervention on reading habits translated into improvements in students’ reading
ability by comparing students’ test scores.
A. Effect on Reading Habits
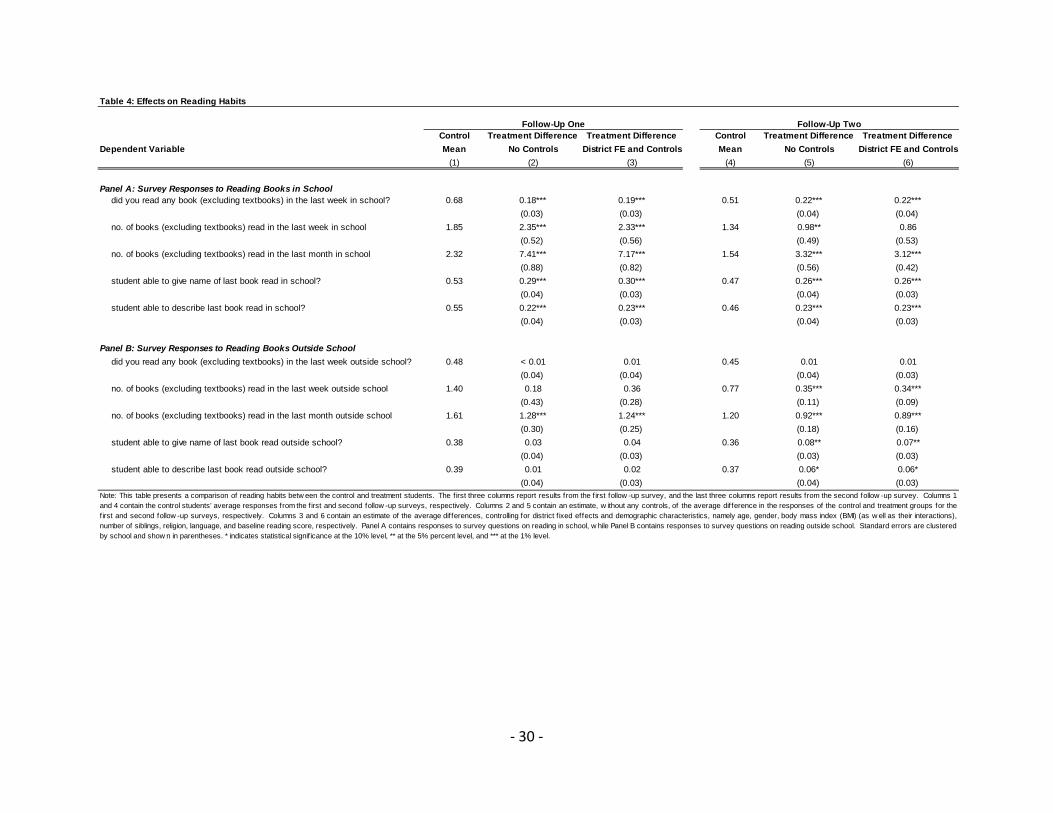
Table 4 compares reading rates across the two groups based on survey responses during
the first and second follow-up surveys. Variables included in the table are students’ responses
to questions on whether or not they had read a book and the number of books read in different
timeframes. To check that students who claim to have read a book actually did so, students
were also asked to give the name of and describe the last book they had read. The responses
to these questions are also included in Table 4.
- 16 -
The first three columns report results from the first follow-up survey, while the last
three columns report results from the second follow-up survey. Panel A contains responses to
survey questions on reading in school, and Panel B contains responses to survey questions on
reading outside school. The first column for each of the follow-up surveys provides the average
responses for the control group, while the second column provides estimates of the differences
between the average responses of the control and treatment groups (equation (1)). The third
column for each of the follow-up surveys reports estimates of these differences that control for
district fixed effects and demographic characteristics (equation (2)).
The program had large and statistically significant impacts on the reading habits of
students. The results in columns 1 and 3 of Table 4 show that during the first follow-up survey
68 percent of the students in the control group reported reading a book in school in the past
week, and the program increased this by 19 percentage points. The students in the control
group reported reading an average of 1.9 books in school in the past week and the program
increases this by 2.3 books. In the past month, the program increased the number of books
read by 7.2 books.
Further corroborating these results,11
11 One of the concerns with these self-reported numbers was that, knowing that they are generally expected to read, students might lie to surveyors about having read a book recently. The additional questions about the books provide one check. Also interesting in this respect, is the stability of the estimates for the fraction of children having reported reading a book (and being able to provide title and description) across the various surveys. For the control students, for example, the largest differences in rates is for the fraction of students reporting reading a book and being able to describe the book in Panel A at 9 percentage points. The next largest difference is 6 percentage points (being able to give the title and reporting having read a book in Panel A). The other five differences between the surveys are all in the range of 2-3 percentage points.
we find significant differences in the propensity to
read if we only consider a child as having read a book if he or she can provide specific
information about the last book read. If we consider children to have read a book only if they
- 17 -
claim to have read a book and can provide the title, 53 percent of students in the control group
read a book in the last week and the increase due to the program was 30 percentage points. If
the condition is to describe the plot, the program caused 23 percentage points more children to
have read a book. All of these results are statistically significant at the one percent level and
are basically the same for the different specifications presented in columns 2 and 3.
The results for reading habits in school from the second follow-up survey are presented
in the last three columns of Table 4. They show that while the propensity to read seems to
remain stable, the intensity of reading behavior, while still increased due to the program, is
smaller after the 31-day intensive program. When asked if they had read any book in the last
week, the program caused 22 percentage points more children to respond affirmatively.
However, when we focus on the actual number of books read, the effects are smaller. The
effect for the last week is 0.9 additional books in our preferred specification which controls for
demographic characteristics and district fixed effects (and not statistically significant at
conventional levels) while the effect in the last month is 3.1 books and statistically significant at
the 1 percent level. This suggests that the students introduced to books through the program
are still more likely to read at school, but the number of books they read understandably
declines when the incentives present in the read-a-thon are removed.
If the program interests children in reading, we might also expect them to read more
outside of school.12
12 Teachers tend to value the books provided by SAS highly. As a result, almost no teachers allow children to take the books home to read for fear that the children might lose them. Thus, for children to read at home, they must have accessed books independently of the intervention.
The results for reading outside school are presented in Panel B of Table 4.
Overall, the program does increase the propensity to read, even outside of school. However, it
- 18 -
does so at a lower rate than in school. For the propensity to read at all, the effects of the
program are small. For children claiming to have read a book in the last week, there is no
difference between the treatment and control groups (row 1). However, when we condition on
children being able to provide additional information on the last book read outside of school
(rows 4 and 5), we find that the program seems to have had a small effect of 2 to 7 percentage
points – differences that are significant in the second follow-up but not the first.
The effect outside of school seems to operate by increasing moderately the number of
books read by children who read outside of school. The number of books read in the last
month increases by 1.2 books in the first survey and 0.9 in the second – both statistically
significant at the one percent level. In the last week, the effect is the same in both periods (0.4
in the first follow-up and 0.3 in the second), but only statistically significant in the second
period at the one percent level.
B. Effect on Reading Ability
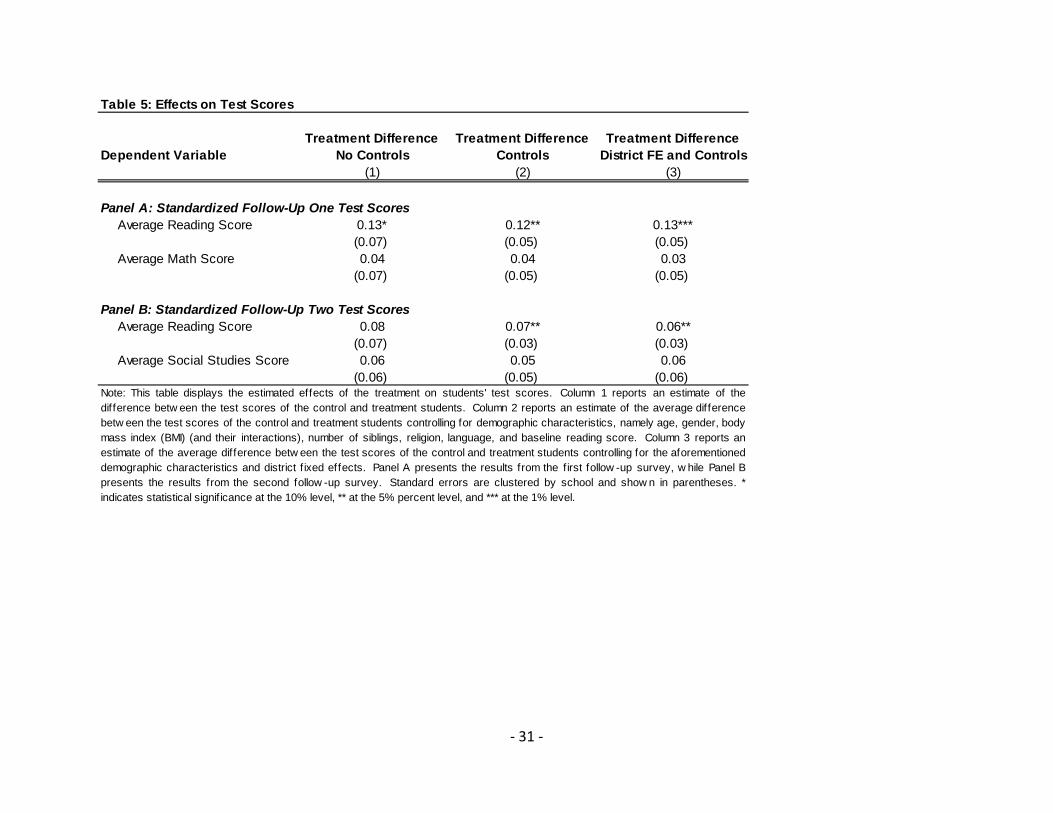
We now explore the extent to which the changes in reading habits affected students’
reading ability. Table 5 presents estimates of the differences between the standardized
average test scores of the control and treatment groups. The estimates in column 1 do not
control for any variables and are estimated using equation (1). The estimates in column 2
control for demographic characteristics while those in column 3 control for these demographic
characteristics in addition to district fixed effects using equation (2).
Starting with the results from the first follow-up survey in Panel A, the data show that
the program had a distinct immediate effect on students’ reading skills of 0.13 standard
- 19 -
deviations. The results are consistent across the various specifications, highlighting the
comparability of the treatment and control groups. And, in our preferred specification, the
results are statistically significant at the one percent level. We also tested students’ math skills
to assess possible spillovers from the program – either negative due to the read-a-thon
crowding out instructional time for other subjects or positive due to students’ increased ability
to read the text books. However, while the observed treatment effects on math scores are
positive, they are small and statistically insignificant.
At 0.13 standard deviations, the direct effect of the program is consistent with the
effects of many programs on native language skills.13 Machin and McNally (2008), Muralidharan
and Sundararaman (2011), Muralidharan and Sundararaman (2010), and Das et al. (2010) find
effects in this range, for example. This is, however, smaller than the effects observed for others.
Banerjee et al. (2007)14
One can also take into account the costs of the program. However, it is important to
keep two caveats in mind. First, this program only affects reading skills while many of the other
programs are designed to affect directly multiple subjects. Second, the number of studies
reporting treatment effects for native language skills as well as information on program costs is
rather small. With these caveats in mind, the SAS reading program seems to fall in the mid-
range of programs adjusting for cost. The cost per tenth of a standard deviation gain per child is
find a total effect of 0.187 standard deviations immediately after two
years of implementation and He, Linden, and MacLeod (2009) find a one year effect of 0.695
standard deviations for the pre-school program after a year of implementation.
13 Typically, the effects of such programs are much lower than the effects observed in other subjects, such as math and foreign languages (see Banerjee et al. (2007) for example). 14 Banerjee et al. (2007) evaluate two programs, a computer assisted learning program focused on math and a remedial education program focused on all subjects. Here we refer only to the remedial education program.
- 20 -
8.52 USD.15 This is higher than the interventions considered by Banerjee et al (2007),
Muralidharan and Sundararaman (2011), Muralidharan and Sundararaman (2010), and Das et
al. (2011), all of which cost between 1.53 USD and 3.11 USD per tenth a standard deviation per
child for native language skills in India. It is, however, much lower than Machin and McNally
(2009) whose UK-based program costs $46.42 USD per tenth of a standard deviation per child.16
The results from the second follow-up survey demonstrate the improvements in reading
skills persist beyond the program implementation period, but at a smaller level. In Panel B of
Table 5, the estimates of the difference between the average reading score of the treatment
and control groups range from 0.06 to 0.08 standard deviations with an effect of 0.06 in our
preferred specification (significant at the five percent level). On the second survey, we tested
children’s knowledge of social studies rather than math, but still cannot detect statistically
significant positive or negative spillovers. In this case, however, the treatment effect is of the
same magnitude as for the reading test, but measured less precisely.
17
We also investigate differences in the observed treatment effects for a number of
subsets of our sample defined through the baseline survey. In results not presented in this
manuscript,
18
15 All cost information has been adjusted to 2010 USD using the US Consumer Price Index for All Urban Consumers including all available items. 16 India, Philippines, and the UK are, of course, very different countries, making it difficult to rank programs based solely on this measure of cost-effectiveness. However, since there are so few examples of successful reading programs that report such cost information, we present those that we have found. 17 This may be due to the fact that the social studies test was much less comprehensive than the reading test. 18 Results are available upon request.
we test for differences in treatment effects by gender, age, language spoken at
home, and baseline reading score. We find almost no evidence of systematically different
treatment effects for different types of students for either follow-up period. The one exception
is that we find that, for the first follow-up period, the treatment effect increases with students’
- 21 -
baseline test score. In a regression interacting treatment effect with baseline score, we find
that students experience a 0.12 standard deviation increase independent of their baseline
scores (statistically significant at the one percent level) and then experience an increased effect
of 0.09 standard deviations for each additional standard deviation they scored at baseline
(significant at the ten percent level). While both coefficients are still positive at the second
follow-up the magnitudes are much smaller (0.06 for the direct effect and 0.04 for the
interaction effect) and only the direct effect remains statistically significant at conventional
levels (five percent level).
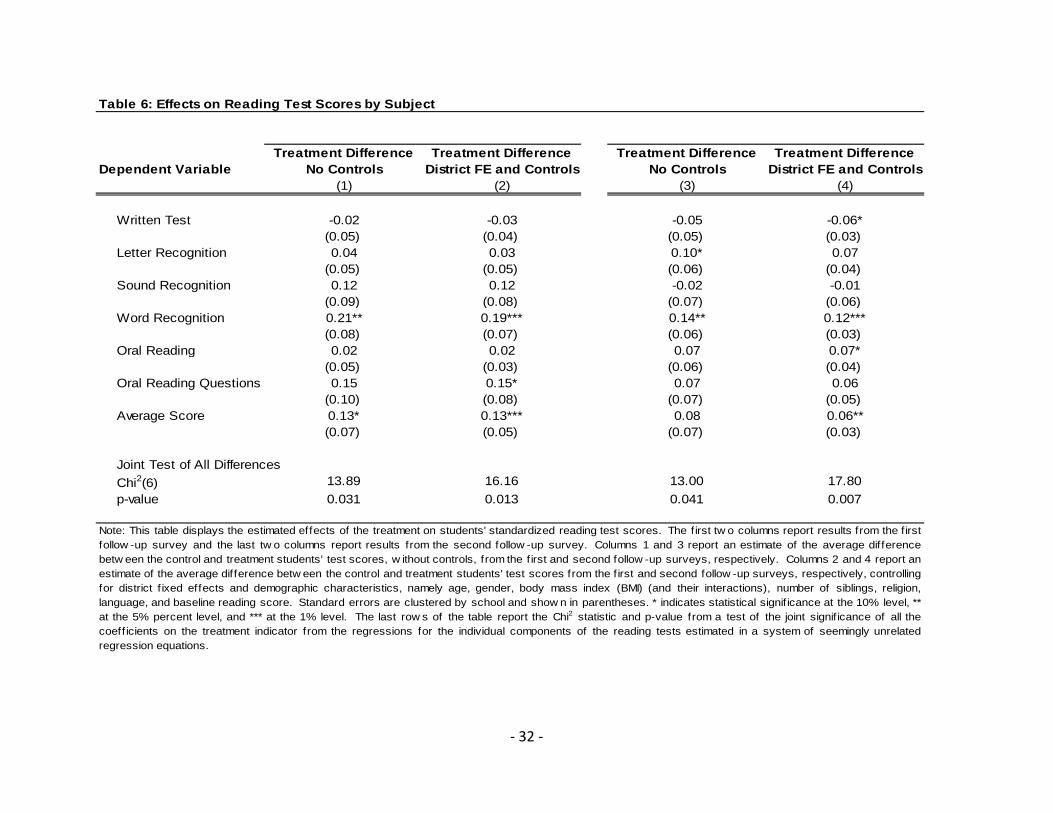
C. Effects by Test Component
Disaggregating the results, Table 6 provides the results for each component of the
reading test in addition to the overall average reading test score. The first two columns report
the results from the first follow-up survey, while the last two columns report the results from
the second follow-up survey. The first column for each of the follow-up surveys provides the
differences between the average test scores of the control and treatment groups using
equation (1). The second column provides the estimates with the full set of controls using
equation (2). Finally, the last two rows of Table 6 report the chi-squared statistic and p-value
from a test of the joint significance of the coefficients on the treatment indicator from the
regressions for the individual components of the reading test. These coefficients are estimated
in a system of seemingly unrelated regression equations.
From the results in Table 6, it appears that in both the first and second follow-up
surveys, the program had a generally positive effect on most of the components on the test
- 22 -
(the written part being the one exception). In the first follow-up survey, there are sizable
treatment effects on sound recognition, word recognition, and the ability to answer questions
from the oral reading passage. Of these, the effects on word recognition and oral questions are
individually statistically significant at the one and ten percent levels respectively, and the effect
on sound recognition is not statistically significant at conventional levels. The joint test of an
effect on all skills shows that the results for the different components are jointly statistically
significant with a p-value of 0.013.
In the second follow-up, the results are generally the same, but as with the overall
average, diminished in magnitude. In this round, word recognition and oral reading effects are
individually statistically significant with word recognition remaining the strongest effect of the
program. But again, all components show positive treatment effects except the written test
and sound recognition. Overall, the joint hypothesis of the significance of the effects on each
component is still statistically significant at the one percent level.
- 23 -
VI. Conclusion
The results of this paper demonstrate that a short-term reading program that
encourages students to read age-appropriate material can have a significant effect on the
reading ability of primary school children. We show that providing fourth-grade students with
age-appropriate books and training teachers to encourage reading for 31 days through the use
of daily reading activities succeeded in improving students’ reading habits and skills. Reading
test scores of students increased by 0.13 of a standard deviation immediately following the
intervention. These gains in reading ability were still evident, albeit smaller at about 0.06
standard deviations, three months after the end of the intervention. Implementing such short-
term programs that promote reading can therefore be an effective way of cultivating good
sustainable reading habits in children and improving their reading ability.
- 24 -
VII. Bibliography Baker, S., Gersten, R. and Keating, T. (2000) “When Less May Be More: A 2-Year Longitudinal
Evaluation of a Volunteer Tutoring Program Requiring Minimal Training,” Reading Research Quarterly. 35(4): 494-519.
Banerjee, A., Cole, S., Duflo, E. and Linden, L. (2007) “Remedying Education: Evidence from Two
Randomized Experiments in India,” Quarterly Journal of Economics. 122(3): 1235-1264. Bertrand, M., Duflo, E. and Mullainathan, S. (2004) “How Much Should We Trust Difference-in-
Differences Estimates?,” Quarterly Journal of Economics. 119(1): 249–275. Borkum, E., He, F. and Linden, L. (2009). “School Libraries and Language Skills in Indian Primary
Schools: A Randomized Evaluation of the Akshara Library Program,” Working paper. Department of Economics. The University of Texas at Austin.
Center, Y., Wheldall, K., Freeman, L., Outhred, L. and McNaught, M. (1995) “An Evaluation of
Reading Recovery,” Reading Research Quarterly. 30(2): 240-263. Das, Jishnu et. Al (2011) "School Inputs, Household Substitution, and Test Scores," Working
Paper. Department of Economics. The University of California at San Diego. Glewwe, P. and Kremer, M. (2006) “Schools, Teachers and Education Outcomes in Developing
Countries,” in Hanushek, A. and Welch, F. (eds.): Handbook of the Economics of Education (vol. 2). Amsterdam: Elsevier.
Glewwe, P., Kremer, M., Moulin, S. and Zitzewitz, E. (2004) “Retrospective vs. Prospective
Analyses of School Inputs: The Case of Flip Charts in Kenya,” Journal of Development Economics. 74:251-286.
Glewwe, P., Kremer, M. and Moulin, S. (2009) “Many Children Left Behind? Textbooks and Test
Scores in Kenya,” American Economic Journal: Applied Economics. 1(1): 112-135. Hanushek, E. (1995) “Interpreting Recent Research on Schooling in Developing Countries,”
World Bank Research Observer. 10(2): 227-246. Hanushek, E. (2006) “School Resources," in Hanushek, A. and Welch, F. (eds.): Handbook of the
Economics of Education (vol. 2) Amsterdam: Elsevier. Hanushek, E. and Wossman, L. (2007) The Role of Education Quality for Economic Growth.
Washington, DC: World Bank. He, F., Linden, L. and MacLeod, M. (2008) “Teaching What Teachers Don’t Know: An
Assessment of the Pratham English Language Program,” Working Paper. Department of Economics. The University of Texas at Austin.
- 25 -
He, F., Linden, L. and MacLeod, M. (2009) “Teaching Pre-Schoolers to Read: A Randomized
Evaluation of the Pratham Shishuvachan Program,” Working Paper. Department of Economics. The University of Texas at Austin.
Kim, B.S. (2007) “The Effects of a Voluntary Summer Reading Intervention on Reading Activities
and Reading Achievement,” Journal of Educational Psychology. 99(3): 505–515. Machin, S. and McNally, S. (2009) “The Literacy Hour,” Journal of Public Economics. 92:1441-62. Meyer, Marianne S. and Rebecca H Felton. (1999) “Repeating Reading to Enhance Fluency: Old
Approaches and New Directions,” Annals of Dyslexia. 49:283-306. Muralidharan, Karthik and Venkatesh Sundararaman (2010) "Contract Teachers: Experimental
Evidence from India," Working Paper. Department of Economics. The University of California at San Diego.
Muralidharan, Karthik and Venkatesh Sundararaman (2011) "Teacher Performance Pay:
Experimental Evidence from India," Journal of Political Economy, 119(1): 39-77 Rouse, C.E. and Krueger, A.B. (2004) “Putting Computerized Instruction To The Test: A
Randomized Evaluation of a `Scientifically-Based’ Reading Program,” Economics of Education Review. 23(4): 323-338; 2004.
Scarborough, H.S. (2001) “Connecting Early Language and Literacy to Later Reading
(Dis)Abilities: Evidence, Theory, and Practice,” In S.B. Neuman and D.K. Dickinson (Eds.), Handbook of Early Literacy Research (Volume 1) (pp. 97-110). New York, NY: Guilford Press.
Shanahan, T. and Barr, R. (1995) “Reading Recovery: An Independent Evaluation of the Effects
of an Early Instructional Intervention for At-Risk Learners,” Reading Research Quarterly. 30(4): 958-996.
Vellutino, F.R. and Scanlon, D.M. (2001) “Emergent literacy skills, early instruction, and
individual differences as determinants of difficulties in learning to read: The case for early intervention,” In S.B. Neuman and D.K. Dickinson (Eds.), Handbook of Early Literacy Research (Volume 1) (pp. 295-321). New York, NY: Guilford Press.
Wasik, B.A. (1998) “Volunteer Tutoring Programs in Reading: A Review,” Reading Research
Quarterly. 33(3): 266-291. Wasik, B.A. and Slavin, E. (1993) “Preventing Early Reading Failure with One-to-One Tutoring: A
Review of Five Programs,” Reading Research Quarterly. 28(2): 178-200.
- 26 -
Figure 1: Kernel Density Estimates of Baseline Reading Scores
Note: This figure presents kernel density estimates of the baseline total normalized reading score distributions for the treatment and control groups. Distributions estimated using an Epanechnikov kernel with a bandwidth of 0.2 standard deviations.
- 27 -
Table 1: Baseline Comparisons
Control Treatment Difference Treatment DifferenceDependent Variable Mean No Controls District FE
(1) (2) (3)
Panel A: Standardized Baseline Reading Test ScoresWritten Test 0.00 0.02 0.03
(0.05) (0.04) Letter Recognition 0.00 0.03 0.03
(0.04) (0.04) Sound Recognition 0.00 -0.10 -0.06
(0.07) (0.07) Word Recognition 0.00 0.02 0.03
(0.06) (0.06) Oral Reading 0.00 0.02 0.04
(0.06) (0.06) Oral Reading Questions 0.00 0.04 0.05
(0.07) (0.05) Average Score 0.00 0.01 0.03
(0.06) (0.06)
Panel B: Individual CharacteristicsAge 9.37 -0.01 -0.01
(0.05) (0.05) Female 0.48 -0.01 -0.01
(0.01) (0.01) Height 128.44 -0.05 -0.05
(0.32) (0.26) Weight 56.56 0.83 0.57
(0.77) (0.69) BMI 15.42 0.23 0.15
(0.17) (0.16) Siblings 3.88 0.07 0.08
(0.11) (0.09) Catholic 0.74 -0.05* -0.05**
(0.03) (0.02) INC 0.13 0.01 0.01
(0.01) (0.01) Aglipayan 0.02 0.00 0.01
(0.01) (0.01) Born Again 0.06 0.02 0.02*
(0.01) (0.01) Protestant 0.02 0.01 0.01
(0.01) (0.01) Other Religion 0.02 0.01 0.00
(0.01) (0.00) Filipino 0.44 0.01 0.01
(0.07) (0.04) Iloco 0.19 -0.05 -0.03
(0.05) (0.03) Kapampangan 0.37 0.04 0.02
(0.09) (0.03) Pangasinan 0.01 < 0.01 < 0.01
(< 0.01) (< 0.01) Other Language < 0.01 < 0.01 < 0.01
(< 0.01) (< 0.01) Observations 2596 5510 5510Note: This table presents a comparison of students w ho took the baseline survey in the control and treatmentschools. Column 1 contains the average characteristic of the students in the control schools. Columns 2 and 3contain estimates of the average difference in characteristics betw een the control and treatment students,w ithout controls and w ith controls for district f ixed effects, respectively. Panel A contains students'standardized baseline test scores, and Panel B contains students' demographic characteristics. Standarderrors are clustered by school and show n in parentheses. * indicates statistical signif icance at the 10% level,** at the 5% percent level, and *** at the 1% level.
- 28 -
Table 2: Overall AttritionOf Baseline Students:
No. of Students at Baseline
Fraction at Follow-Up One
Fraction at Follow-Up Two
Fraction at Follow-Up One
and Two
Fraction from Follow-Up One at Follow-Up
Two
Fraction from Follow-Up Two
at Follow-Up One
(1) (2) (3) (4) (5) (6)
Control Schools 2596 0.95 0.88 0.86 0.90 0.97Treatment Schools 2914 0.95 0.90 0.87 0.92 0.97Difference < 0.01 0.02 0.02 0.02 0.00
(0.01) (0.02) (0.02) (0.02) (0.01) Total 5510 0.95 0.89 0.86 0.91 0.97
Note: This table show s the fraction of baseline students w ho took the first and second follow -up surveys from the control and treatment schools and anestimate of the difference betw een the tw o groups. Column 1 contains the number of students w ho took the baseline survey. Column 2 show s thefraction of baseline students w ho took the first follow -up survey, w hile column 3 show s the fraction of baseline students w ho took the second follow -upsurvey. Column 4 contains the fraction of baseline students w ho took both the first and second follow -up surveys. Column 5 contains the fraction ofbaseline students at the first follow -up survey w ho took the second follow -up survey. Column 6 contains the fraction of baseline students at the secondfollow -up survey w ho took the first follow -up survey. Standard errors are clustered by school and show n in parentheses. * indicates statisticalsignif icance at the 10% level, ** at the 5% percent level, and *** at the 1% level.
- 29 -
Table 3: Attrition Patterns - Follow-Up One
Non-Attritors Non-Attritors Less AttritorsControl Treatment Treatment Control Treatment Difference-in-
Dependent Variable Mean Mean Difference Difference Difference Difference(1) (2) (3) (4) (5) (6)
Panel A: Standardized Baseline Reading Test ScoresWritten Test 0.00 0.03 0.02 0.10 0.08 -0.01
(0.05) (0.12) Letter Recognition 0.00 0.04 0.04 0.09 0.16 0.07
(0.04) (0.11) Sound Recognition 0.01 -0.09 -0.10 0.22 0.11 -0.11
(0.07) (0.12) Word Recognition 0.01 0.05 0.04 0.25 0.47 0.22
(0.06) (0.18) Oral Reading 0.01 0.04 0.03 0.21 0.43 0.22
(0.06) (0.21) Oral Reading Questions 0.00 0.05 0.05 0.06 0.19 0.13
(0.07) (0.14) Average Score 0.01 0.03 0.02 0.22 0.34 0.12
(0.06) (0.16)
Panel B: Individual CharacteristicsAge 9.32 9.31 -0.01 -0.91 -0.90 0.00
(0.04) (0.29) Female 0.48 0.47 -0.01 0.07 0.10 0.04
(0.01) (0.06) Height 128.27 128.27 0.00 -3.34 -2.33 1.00
(0.30) (1.57) Weight 56.35 57.25 0.90 -4.04 -2.68 1.36
(0.79) (2.13) BMI 15.41 15.64 0.23 -0.21 -0.07 0.14
(0.18) (0.32) Siblings 3.84 3.92 0.08 -0.83 -0.65 0.17
(0.11) (0.25) Catholic 0.74 0.69 -0.05* 0.10 0.09 -0.01
(0.03) (0.07) INC 0.12 0.13 0.01 -0.08 -0.05 0.03
(0.01) (0.04) Aglipayan 0.02 0.03 0.00 0.01 0.00 -0.01
(0.01) (0.02) Born Again 0.06 0.08 0.02 0.00 -0.05 -0.04
(0.01) (0.05) Protestant 0.03 0.04 0.01 0.02 0.00 -0.02
(0.01) (0.02) Other Religion 0.02 0.02 0.01 -0.04 0.01 0.05**
(0.01) (0.02) Filipino 0.44 0.44 0.01 -0.04 -0.01 0.02
(0.07) (0.07) Iloco 0.19 0.15 -0.04 -0.03 0.06 0.09*
(0.05) (0.05) Kapampangan 0.37 0.40 0.03 0.06 -0.02 -0.08
(0.09) (0.06) Pangasinan 0.01 < 0.01 < 0.01 0.01 -0.01 -0.02*
(< 0.01) (0.01) Other Language < 0.01 < 0.01 < 0.01 < 0.01 -0.02 -0.02
(< 0.01) (0.02) Observations 2463 2765 5228 2596 2914 5510Note: This table presents a comparison of the baseline students w ho took the follow -up survey and those w ho did not across the control and treatmentgroups. Column 1 contains the average characteristics of the baseline control students w ho took the first follow -up survey, w hile column 2 contains theaverage characteristic of the baseline treatment students w ho took the f irst follow -up survey. Column 3 presents an estimate of the average difference in characteristics betw een the baseline control and treatment students w ho took the first follow -up survey. Columns 4 and 5 present the averagedifference in characteristics betw een the baseline students w ho took the first follow -up survey (non-attritors) and those w ho did not (attritors) for thecontrol and treatment groups, respectively. Column 6 contains an estimate of the difference betw een the average differences in columns 4 and 5. PanelA contains students' standardized follow -up one test scores, and Panel B contains students' demographic characteristics. Standard errors are clusteredby school and show n in parentheses. * indicates statistical signif icance at the 10% level, ** at the 5% percent level, and *** at the 1% level.
- 30 -
Table 4: Effects on Reading Habits
Follow-Up One Follow-Up TwoControl Treatment Difference Treatment Difference Control Treatment Difference Treatment Difference
Dependent Variable Mean No Controls District FE and Controls Mean No Controls District FE and Controls(1) (2) (3) (4) (5) (6)
Panel A: Survey Responses to Reading Books in Schooldid you read any book (excluding textbooks) in the last week in school? 0.68 0.18*** 0.19*** 0.51 0.22*** 0.22***
(0.03) (0.03) (0.04) (0.04) no. of books (excluding textbooks) read in the last week in school 1.85 2.35*** 2.33*** 1.34 0.98** 0.86
(0.52) (0.56) (0.49) (0.53) no. of books (excluding textbooks) read in the last month in school 2.32 7.41*** 7.17*** 1.54 3.32*** 3.12***
(0.88) (0.82) (0.56) (0.42) student able to give name of last book read in school? 0.53 0.29*** 0.30*** 0.47 0.26*** 0.26***
(0.04) (0.03) (0.04) (0.03) student able to describe last book read in school? 0.55 0.22*** 0.23*** 0.46 0.23*** 0.23***
(0.04) (0.03) (0.04) (0.03)
Panel B: Survey Responses to Reading Books Outside Schooldid you read any book (excluding textbooks) in the last week outside school? 0.48 < 0.01 0.01 0.45 0.01 0.01
(0.04) (0.04) (0.04) (0.03) no. of books (excluding textbooks) read in the last week outside school 1.40 0.18 0.36 0.77 0.35*** 0.34***
(0.43) (0.28) (0.11) (0.09) no. of books (excluding textbooks) read in the last month outside school 1.61 1.28*** 1.24*** 1.20 0.92*** 0.89***
(0.30) (0.25) (0.18) (0.16) student able to give name of last book read outside school? 0.38 0.03 0.04 0.36 0.08** 0.07**
(0.04) (0.03) (0.03) (0.03) student able to describe last book read outside school? 0.39 0.01 0.02 0.37 0.06* 0.06*
(0.04) (0.03) (0.04) (0.03) Note: This table presents a comparison of reading habits betw een the control and treatment students. The first three columns report results from the first follow -up survey, and the last three columns report results from the second follow -up survey. Columns 1and 4 contain the control students' average responses from the first and second follow -up surveys, respectively. Columns 2 and 5 contain an estimate, w ithout any controls, of the average difference in the responses of the control and treatment groups for thefirst and second follow -up surveys, respectively. Columns 3 and 6 contain an estimate of the average differences, controlling for district f ixed effects and demographic characteristics, namely age, gender, body mass index (BMI) (as w ell as their interactions),number of siblings, religion, language, and baseline reading score, respectively. Panel A contains responses to survey questions on reading in school, w hile Panel B contains responses to survey questions on reading outside school. Standard errors are clustered by school and show n in parentheses. * indicates statistical signif icance at the 10% level, ** at the 5% percent level, and *** at the 1% level.
- 31 -
Table 5: Effects on Test Scores
Treatment Difference Treatment Difference Treatment DifferenceDependent Variable No Controls Controls District FE and Controls
(1) (2) (3)
Panel A: Standardized Follow-Up One Test ScoresAverage Reading Score 0.13* 0.12** 0.13***
(0.07) (0.05) (0.05) Average Math Score 0.04 0.04 0.03
(0.07) (0.05) (0.05)
Panel B: Standardized Follow-Up Two Test ScoresAverage Reading Score 0.08 0.07** 0.06**
(0.07) (0.03) (0.03) Average Social Studies Score 0.06 0.05 0.06
(0.06) (0.05) (0.06) Note: This table displays the estimated effects of the treatment on students' test scores. Column 1 reports an estimate of thedifference betw een the test scores of the control and treatment students. Column 2 reports an estimate of the average differencebetw een the test scores of the control and treatment students controlling for demographic characteristics, namely age, gender, bodymass index (BMI) (and their interactions), number of siblings, religion, language, and baseline reading score. Column 3 reports anestimate of the average difference betw een the test scores of the control and treatment students controlling for the aforementioneddemographic characteristics and district f ixed effects. Panel A presents the results from the first follow -up survey, w hile Panel Bpresents the results from the second follow -up survey. Standard errors are clustered by school and show n in parentheses. *indicates statistical signif icance at the 10% level, ** at the 5% percent level, and *** at the 1% level.
- 32 -
Table 6: Effects on Reading Test Scores by Subject
Treatment Difference Treatment Difference Treatment Difference Treatment DifferenceDependent Variable No Controls District FE and Controls No Controls District FE and Controls
(1) (2) (3) (4)
Written Test -0.02 -0.03 -0.05 -0.06*(0.05) (0.04) (0.05) (0.03)
Letter Recognition 0.04 0.03 0.10* 0.07(0.05) (0.05) (0.06) (0.04)
Sound Recognition 0.12 0.12 -0.02 -0.01(0.09) (0.08) (0.07) (0.06)
Word Recognition 0.21** 0.19*** 0.14** 0.12***(0.08) (0.07) (0.06) (0.03)
Oral Reading 0.02 0.02 0.07 0.07*(0.05) (0.03) (0.06) (0.04)
Oral Reading Questions 0.15 0.15* 0.07 0.06(0.10) (0.08) (0.07) (0.05)
Average Score 0.13* 0.13*** 0.08 0.06**(0.07) (0.05) (0.07) (0.03)
Joint Test of All DifferencesChi2(6) 13.89 16.16 13.00 17.80p-value 0.031 0.013 0.041 0.007
Note: This table displays the estimated effects of the treatment on students' standardized reading test scores. The first tw o columns report results from the firstfollow -up survey and the last tw o columns report results from the second follow -up survey. Columns 1 and 3 report an estimate of the average differencebetw een the control and treatment students' test scores, w ithout controls, from the first and second follow -up surveys, respectively. Columns 2 and 4 report anestimate of the average difference betw een the control and treatment students' test scores from the first and second follow -up surveys, respectively, controllingfor district f ixed effects and demographic characteristics, namely age, gender, body mass index (BMI) (and their interactions), number of siblings, religion,language, and baseline reading score. Standard errors are clustered by school and show n in parentheses. * indicates statistical signif icance at the 10% level, **at the 5% percent level, and *** at the 1% level. The last row s of the table report the Chi2 statistic and p-value from a test of the joint signif icance of all thecoeff icients on the treatment indicator from the regressions for the individual components of the reading tests estimated in a system of seemingly unrelatedregression equations.
- 33 -
Table A1: Attrition Patterns - Follow-Up Two
Non-Attritors Non-Attritors Less AttritorsControl Treatment Treatment Control Treatment Difference-in-
Dependent Variable Mean Mean Difference Difference Difference Difference(1) (2) (3) (4) (5) (6)
Panel A: Standardized Baseline Reading Test ScoresWritten Test 0.02 0.03 0.01 0.17 0.05 -0.12
(0.05) (0.10) Letter Recognition 0.01 0.05 0.04 0.10 0.16 0.07
(0.05) (0.07) Sound Recognition 0.03 -0.08 -0.11 0.22 0.17 -0.05
(0.07) (0.09) Word Recognition 0.03 0.07 0.04 0.27 0.44 0.17*
(0.07) (0.09) Oral Reading 0.03 0.06 0.03 0.21 0.33 0.12
(0.06) (0.13) Oral Reading Questions 0.01 0.06 0.05 0.08 0.18 0.11
(0.07) (0.10) Average Score 0.03 0.04 0.01 0.24 0.31 0.07
(0.07) (0.10)
Panel B: Individual CharacteristicsAge 9.29 9.29 < 0.01 -0.57 -0.54 0.03
(0.04) (0.16) Female 0.49 0.48 -0.01 0.10 0.10 0.00
(0.01) (0.04) Height 128.18 128.23 0.05 -2.12 -1.49 0.62
(0.32) (0.73) Weight 56.33 57.23 0.90 -1.89 -1.28 0.61
(0.81) (1.36) BMI 15.42 15.65 0.23 0.01 0.04 0.03
(0.18) (0.23) Siblings 3.83 3.91 0.08 -0.37 -0.36 0.02
(0.11) (0.17) Catholic 0.74 0.69 -0.05* 0.04 0.02 -0.02
(0.03) (0.05) INC 0.12 0.13 0.01 -0.04 -0.04 0.00
(0.02) (0.04) Aglipayan 0.02 0.03 0.01 -0.01 0.00 0.01
(0.01) (0.01) Born Again 0.07 0.08 0.02 0.01 -0.01 -0.02
(0.01) (0.02) Protestant 0.03 0.04 0.01 0.00 0.01 0.01
(0.01) (0.02) Other Religion 0.02 0.02 0.01 -0.01 0.01 0.02*
(0.01) (0.01) Filipino 0.44 0.45 0.01 -0.02 0.01 0.03
(0.07) (0.06) Iloco 0.19 0.15 -0.04 -0.01 0.04 0.05
(0.05) (0.04) Kapampangan 0.37 0.40 0.03 0.03 -0.03 -0.06
(0.09) (0.08) Pangasinan 0.01 < 0.01 < 0.01 < 0.01 -0.01 -0.01
(< 0.01) (0.01) Other Language < 0.01 < 0.01 < 0.01 < 0.01 -0.01 -0.01
(< 0.01) (0.01) Observations 2280 2607 4887 2596 2914 5510Note: This table presents a comparison of the baseline students w ho took the follow -up survey and those w ho did not across the control and treatment groups. Column 1 contains the average characteristic of the baseline control students w ho took the second follow -up survey, w hile Column 2 contains the average characteristic of the baseline treatment students w ho took the second follow -up survey. Column 3 presents an estimate of the average difference in characteristics betw een the baseline control and treatment students w ho took the second follow -up survey. Columns 4 and 5 present the average difference in characteristics betw een the baseline students w ho took the second follow -up survey (non-attritors) and those w ho did not (attritors) for the control and treatment groups, respectively. Column 6 contains an estimate of the difference betw een the average differences in Columns 4 and 5. Panel A contains students' standardized follow -up one test scores and Panel B contains students' demographic characteristics. Standard errors are clustered by school and show n in parentheses. * indicates statistical signif icance at the 10% level, ** at the 5% percent level, and *** at the 1% level.