Embed Size (px)
Citation preview

Bas Javid West Midlands
Police
July 2014
IMPROVING PUBLIC CONFIDENCE IN POLICING; A TEST OF A LOCAL ENGAGEMENT PROGRAMME

‘Can local police engagement tactics improve a community’s confidence in policing’?
Evaluation research
To assess how effective the programme of activity has been
RESEARCH QUESTION

1. Determine the impact that local police engagement tactics
have on public confidence;
2. Explore the drivers and barriers of public confidence in
policing;
3. Evaluate critically the effect of a specific engagement
programme on two separate communities in the West
Midlands, comparing them to two control areas, which did
not participate in the programme; and
4. Formulate recommendations on issues relating to public
confidence in policing.
OBJECTIVES

Are we measuring ‘confidence in policing’ because
it ’s important, or is it important because we’re
measuring it?
Tens of millions of pounds spent by UK police
forces each year on measuring ‘public confidence in
policing’ through variety of surveys
What actually happens with the outcome of survey
results in order to influence policy?
WHY IS THE RESEARCH QUESTION IMPORTANT?

MEDIA
March 2014 • Stephen Lawrence report described as
“profoundly disturbing” by Home Secretary • Legal action concerning undercover police • Plebgate • Hillsborough

WEST MIDLANDS POLICE
Test
Control

BASIC OUTLINE OF TEST
Loca l NPT ca r r y ou t su r vey s t o i den t i f y t he needs o f l o ca l
r e s i dent s
P rob l em so l v i ng p l ans imp l emented
t o add res s i den t i f i ed i s sues
Mosa i c i n f o rmat ion used t o t a rge t
commun i t y consu l t a t i on
Resu l t s f r om po l i ce ac t i on r e l ayed back
t o commun i t y
Con f i dence measu re f r om pub l i c su r vey s t aken p re and pos t
t e s t
Con f i dence r e su l t s compared t o two
con t ro l ne i ghbou rhoods

4 wards, which are coterminous with local authority boundaries
Selected based on their similarities of;
Comparatively low levels of confidence at start of test
‘Buy in’ of Local Command Team
Each neighbourhood had a dedicated Team Sergeant
Similarities in demographics (gender, age, ethnicity)
Assignment of ‘test’ or ‘control’ was not random. Level 3 test on Maryland Scale - before and after in both experimental and control
AREAS / SELECTION
Aim to ‘Improve trust and confidence in polic ing’
Measured through ‘Feeling the Difference’ surveys, conducted
independently by BMG Research
Surveys conducted since 2004 (BMG since 2012)
8,400 every 6 months, 16,800 PA
61 separate questions
Designed to understand resident’s views of their area, and how it
could be improved as a place to l ive
WEST MIDLANDS POLICE SURVEYS
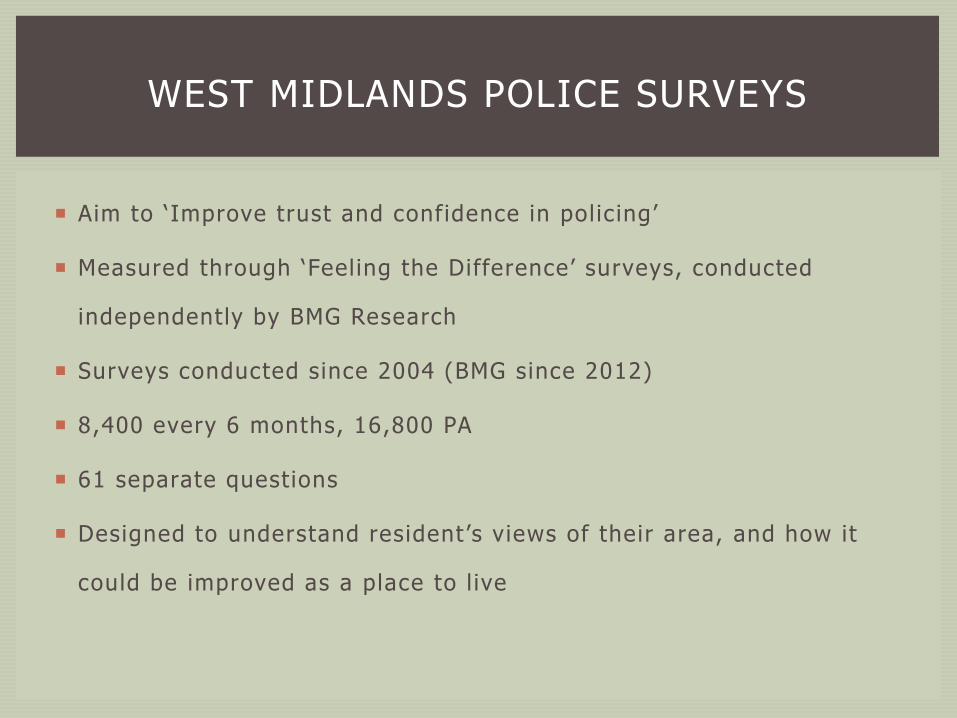
Baseline survey (March 2013) 300 surveys
Stage 1 evaluation (FTD survey – June 2013) 600
surveys
Stage 2 evaluation (September 2013)
300 surveys
TIMELINE
Activity started

Neighborhood forums
Local consultation (beat surgeries)
Repeat caller database
Monitoring daily crime and ASB information
Experiences of local team
Tasking processes (police and partnership)
Priorities are often crime or ASB focused
Very often lacks a specific engagement plan (at local level)
Limited, if any, feedback to communities
Community preferences based almost entirely on local
knowledge
NORMAL ENGAGEMENT/ PRIORITY SETTING

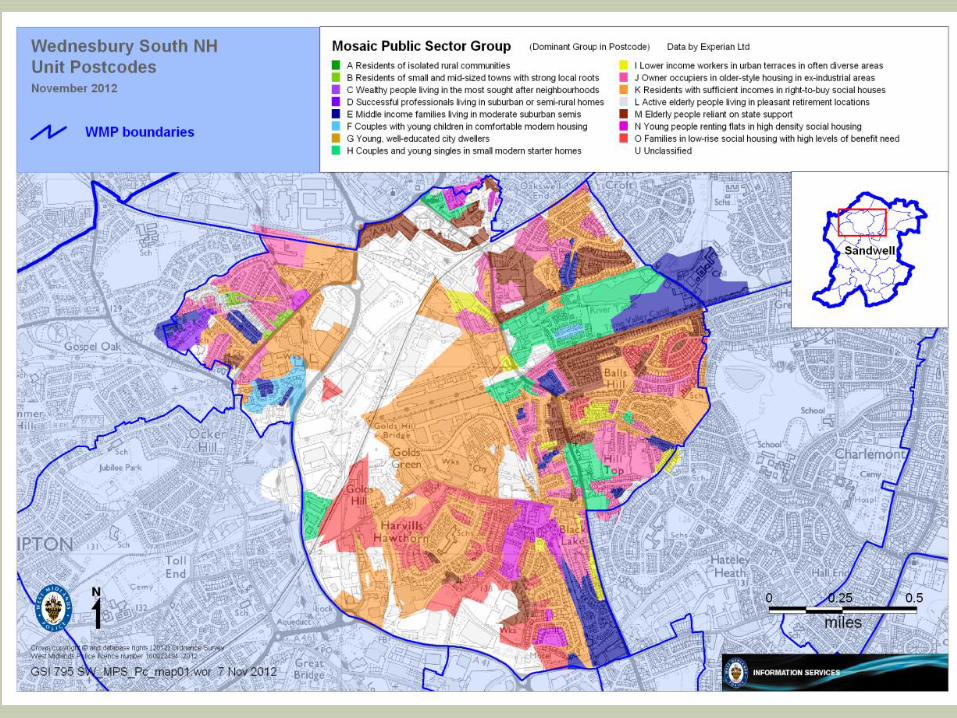
‘Mosaic Public Sector’ information (classifies all consumers in the UK by allocating to 15 groups and 69 types)
This offers a rich picture of citizens and their socio economic and socio cultural behaviour
Communication preferences identified (face to face, newsletter, internet, social media etc.)
NHT Sergeant selects engagement method and tasks completion of ‘You said’ forms
Form passed to OSD Inspector who selects top three priorities
Delivery plans developed
Feedback to community in line with preferences and via WMP local webpages
WHAT’S DIFFERENT?

Mosaic Data
Mosaic data suggests that on South
Yardley the following Sector Groups are
most highly represented.
I – 41.83% - Lower income workers in
urban terraces in often diverse areas.
O – 13.2% - Families in low rise social
housing with high levels of benefits need.
E – 12.75% - Middle income families
living in moderate suburban semis. These 3 groups I,O and E represent 67.78% of the population of South
Yardley followed by –
K – 8.95% - Residents with sufficient incomes in right to buy homes.
J – 8.28% - Owner occupiers in older-style housing in ex-industrial areas.
N – 5.15% - Young people renting flats in high density social housing.
H – 4.47% - Couples and young singles in small modern starter homes.


Community Surveys - You Said
• The initial target group was chosen as - Lower income workers in urban
terraces in often diverse areas (Yellow on the Mosaic data map) as this
represents the largest single Sector Group. By targeting their issues the
NHT would most likely influence a larger proportion of residents.
• The first wave of surveys began on 25th March, 2013.
• 112 surveys were completed in the first 2 weeks.
• This group is strongly represented in the Small Heath Park, Deakins Road, Hay
Mills and Tyseley areas of the Ward. We engaged with these residents through
door to door visits and interaction in areas of high foot fall.
• A review of surveys collated indicated that the most common issues raised by
residents were – Drug dealing, Parking, Fly-tipping/Litter, Youth Nuisance
and Speeding.

Ward Priorities - Wave 1
1. Drug dealing – Deakins Road area, Broadyates Road,
Hilderstone Road, Oldknow Road and Tennyson Road.
2. Speeding Vehicles – The 20m.p.h. speed limit on
Oldknow Road is being ignored by motorists.
3. Anti-social Behaviour – Deakins Road area and
Graham Road.
OSD then took the results and graded the collected data in order of priority in terms of most common issues reported by residents. The following three priorities were then confirmed as the starting point for the Experiment on the Ward.

South Yardley Ward Website
The existing public-facing Ward website was refreshed. One of
the key changes was to have a live Twitter link on the page
which updates automatically and instantly with live time
Tweets created by team members each day. The team also
have the capability to embed You Tube files in these Tweets so
that video clips can be shared with members of the public.
Following a “push” to advertise the team’s Twitter account the number of followers
since March 2013 has risen from 431 to 578 (as on 8th May, 2013).

Conducting three waves of surveys in four select neighbourhoods (two treatment and two control), before and
after those communities receive a specific police engagement intervention under the banner of;
‘you said, we did, we listened’
MEASURE OF CONFIDENCE

taken from single question;
“Taking everything into account I have
confidence in the police in this area”
Measured on 8 point Likert Scale
MEASURE OF CONFIDENCE
Comp. agree
Agree Agree some extent
Neither Disagree some extent
Disagree Comp. disagree
Don’t know
7 6 5 4 3 2 1 8

MEASURE
Confident Not Confident
excluded
Rationale being, those that elect the option of ‘neither’, are NOT saying
that they are ‘confident’ and this is a measure of ‘confidence’

Population sampled is limited to residents
Excludes transient population, business locations, homeless, visitors
Those not home between 10 a.m. and 8 p.m.
15 minute interview
Study was limited to the design and detail provided by WMP and BMG
LIMITATIONS OF SURVEY

SAMPLE SIZE

SAMPLE SIZE NEEDED
To achieve a confidence interval of +/- 3% at the 95% confidence level

RESPONSE RATE TAKEN AT STAGE 2
Thesis examiner: ‘the response rate was shameful and not fully transparent’.

PROGRAMME RELATED ENGAGEMENT
ACTIVITY


Sample sizes for all three stages of programme survey were inadequate, resulting in large confidence intervals. Shortfall of approx. 900 surveys for each neighbourhood at each stage
Response rates were poor, leading to bias in outcome of survey
Application of treatment (engagement) generally weak and inconsistent
Demographic of test and control were only slightly comparable
Level of ‘engagement’ difficult to measure - routine police activity, which is conducted in many ways.
Span of engagement (in test areas) compared to overall population was too small.
FINDINGS

‘All equally suggest more than anything how important it is to carefully plan experiments - even if
they are just level 3 studies’
‘Police led interventions are generally focussed on operational priorities and it is often difficult to find the right fit between these priorities and research
specific questions’
FEEDBACK

Specific local engagement tactics (as measured) did not lead to an improvement in public confidence
Findings highlighted weaknesses in how confidence is measured
Treatment applied was weak and not easily measured
Lack of assurance in the results due to samples sizes and response rates
Demographic match between neighbourhoods was poor
Weaknesses more generally in how confidence is measured
CONCLUSION

‘I would suggest from the host of methodological issues detailed carefully in the dissertation, that the
best conclusion would be that the engagement program could not be evaluated’
MORE FEEDBACK

Basic question: Why and how do police organisations measure public confidence?
Focus groups could offer a more interactive and qualitative alternative to better understand the needs of their communities
Using a smaller geographical scale, with more specific engagement tactics
FUTURE CONSIDERATIONS

Questions?

Currently measure ‘call outcomes’ (see next slide) and full
response rates NOT measured. For previous surveys, do not
know how many doors are ‘knocked’ to achieve desired
number of interviews per neighbourhood.
Agreement negotiated with BMG to capture total number of
‘door knocks’ (full response rate) for stage 2 (September
2013).
BMG adopt a ‘quota sampling approach ’ , not a ‘random
probability sampling’ approach.
RESPONSE RATES !

CALL OUTCOMES FOR BASELINE
?

CALL OUTCOMES FOR STAGE 1

Capturing full response rate agreed with BMG
BMG will record ‘response rate’ pre -coded as follows:
• Refusal: not enough time
• Refusal: not interested
• Refusal: don't do surveys
• Refusal: nature of subject
• Refusal: no reason
STAGE 2 (SEPTEMBER)

Unlikely to be able to match one test with one control due to
dif ferences in demographics of areas
Stage one (interim) results (compared to baseline) do not
suggest any increase in confidence within the test areas,
which can be attributed to the experiment
‘Issues’ of concern to residents as identified in FTD surveys,
match ‘You Said’ (experiment) consultation in one test area,
but not the other - so not a consistent theme
Key drivers to improve confidence (based on FTD survey
outcomes), have themes in common with experiment
consultation (you said forms)
INTERIM FINDINGS

INTERIM FINDINGS

INTERIM FINDINGS (2)

INTERIM FINDINGS (3) TOP 5 ISSUES FOR EACH AREA
‘You said’ consultation indicated
ASB, street drinking,
environmental issues

INTERIM FINDINGS (4) LARGEST DIFFERENCE OF CONFIDENT/ NOT CONFIDENT,
COMPARED TO TOP ISSUES IDENTIFIED PER AREA
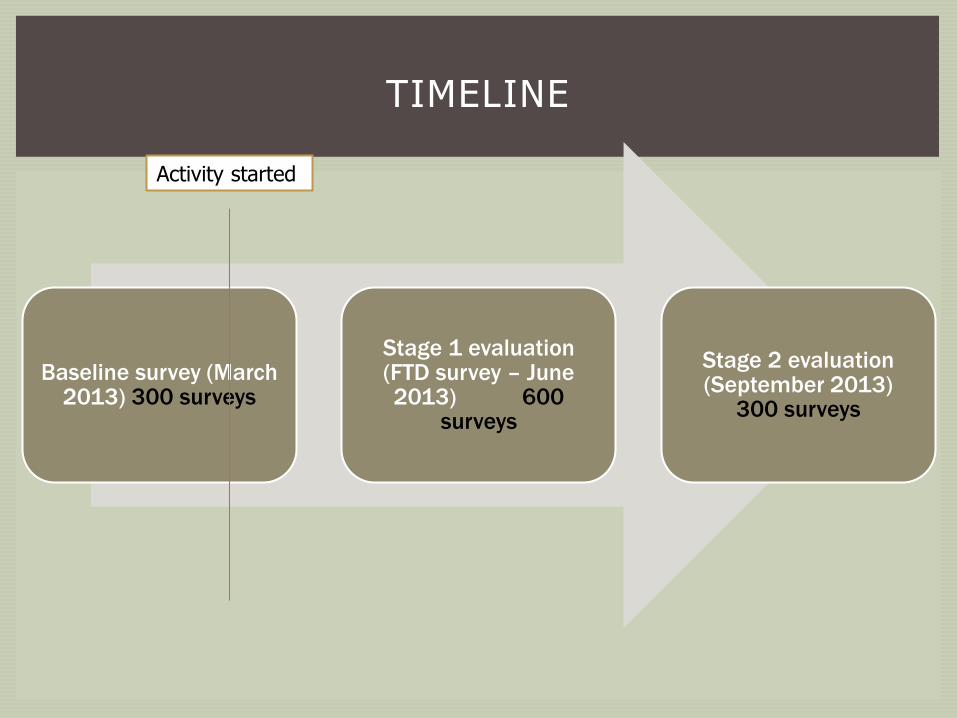
Have baseline data and stage 1 data in SPSS (merged file)
Stage 2 surveys start w/c 9 Sept and conclude on 29 Sept
Stage 2 data available in early October
Have detailed level of ‘engagement’ information to date, from
NHTs.
• Number of ‘You said ’ forms completed for each wave
• Number of pr ior i t ies set
• Number of SARA (problem solv ing) plans set and completed
Made start on analysing initial findings from BL and S1
Need to progress data analysis (including S2) and start to
interpret and discuss findings
WHERE AM I NOW? WHAT DO I NEED TO FOCUS ON BETWEEN NOW
AND SEPTEMBER?

Evidence of whether or not enhanced local level engagement improves confidence in local policing
Understand if there is a relationship/ correlation between local police engagement and confidence
Dosage/ level of engagement may prove difficult to quantify between test and control
Understand the limitations of surveys as a measure of confidence
Would like to assess the ‘real-world’ impact of local police engagement v local public confidence
WHAT WOULD I LIKE TO ACHIEVE? CONSIDERATIONS…..

Conducting three waves of surveys in four select neighbourhoods (two treatment and two control), before and after those communities receive a specific police engagement intervention under the banner of;
‘you said, we did, we listened’
Explanatory research
• seek to explain if intervention has the desired effect
• Also, seek to explain why an intervention has a desired
effect
Quasi-experimental design - impact on target population
and uses means other than randomization
Level 3/4 test (on Maryland Scale)
HOW WILL MY QUESTION BE ANSWERED?

Independent variable = ‘Treatment V Control’
Will have measures of treatment delivery, but not able to measure consistently across treatment and control
Dependent variable = ‘confidence in police’
• Measured through ‘Feeling the Difference’ surveys
Seek to understand if the test and control areas differ on their values for the dependent (outcome) variable, ‘confidence in police’.
VARIABLES/ METHODS

Q6) List ( i f any) top three problems for you in neighbourhood
Q7) Over last year, have the pol ice been tackl ing these issues?
Q8) Have you or anyone in household, reported any of these problems?
Q16) How could pol icing in your neighbourhood be improved?
• Show more interest in community issues
• Pol ice should integrate more with community
• Better communicat ion
• More pol ice presence general ly/ increase vis ibi l i ty
Q16) How could pol icing in your neighbourhood be improved?
Q17) to what extent do you agree or disagree that pol ice in th is
neighbourhood ……
• Understand the issues that affect th is community
CONFIDENCE/ ENGAGEMENT RELATED QUESTIONS (TAKEN FROM SURVEY)

TARGET GRID EXAMPLE
May 2010, Home Secretary scrapped last
remaining policing target – ‘increase trust and confidence in the police’. (The Independent, 29 June 2010)
Office for National Statistics still accountable for ‘Crime Survey for England and Wales’, which includes confidence measures
WHY IS THE RESEARCH QUESTION IMPORTANT?

Keith Vaz MP, Chair of Home Affairs Select Committee – “Public confidence in the police has been hurt by a dangerous cocktail of controversies, such as the critical Hillsborough report and the Andrew Mitchell (plebgate) row (BBC News, 30 Dec 2012)
Teresa May MP on recent launch of 6 week consultation on police use of stop/ search, main thrust of issue being disproportionate use of powers - "If anybody thinks that it's sustainable to allow that to continue, with all its consequences for public confidence in the police, they need to think again,” (The Guardian, 02 July 2013 )
PRESS/ MEDIA

Metropolitan Police Service
• Measure ‘Public Confidence in Policing London’, through Public Attitude Survey (PAS)
• Measure experiences of crime, ASB, contact etc since 1983
• 400 in-home interviews per borough, per year
• 3,200 across London each quarter, 12,800 PA
Greater Manchester Police
• ‘Increase Confidence in Policing’, part of Policing Plan, with milestones
• Measure - overall satisfaction with service
• Measure - Improve perception that GMP is doing a good job
CONFIDENCE SURVEYS

Political – PCC, Home Office, General Election…..
Because it ’s measured, i.e. what get’s measured, gets done….
In line with organisational values – ‘doing the right thing’
Makes a difference to people’s lives, the tangible differences
According to Jackson and Bradford (2010), trust and confidence can;
• Encourage active citizen participation in priority setting and the running of local services
• Make public bodies more accountable and responsive
• Secure public cooperation with the police and compliance with the law
BENEFITS?

Gap in knowledge, especially when considered against;
Shifting set of priorit ies in the UK (polit ical, f inancial etc.)
Context of current national policy against individual force’s
motivation to measure level of community confidence
Gap in knowledge, particularly with regards to specif ic community
based engagement tactics (at neighborhood level)
Understanding what public confidence actually means
May be that public confidence has no impact on the eff icacy of
policing
To what extent does good confidence lead to positive outcomes
ALSO….

PARLIAMENTARY CONSTITUENCIES IN THE WEST MIDLANDS (COUNTY )
From each of the 28 constituencies in West Midlands, 30 Census Output Areas (COA) are sampled to form sampling points, with a target of 10 interviews per COA

300 interviews per constituency, over 28 constituencies =
8,400 people surveyed in force area (every 6 months).
10 10 10 10 10 10 10 10 10 10
10 10 10 10 10 10 10 10 10 10
10 10 10 10 10 10 10 10 10 10
Constituency
30 x COA (sampling points)

MATCHING ONE AREA TO ANOTHER? NEIGHBOURHOOD DEMOGRAPHICS

MATCHING ONE AREA TO ANOTHER? NEIGHBOURHOOD DEMOGRAPHICS

MATCHING ONE AREA TO ANOTHER? AGE BANDS OF RESIDENTS

WMP/ BMG MEASURE
Confident Not Confident
excluded excluded
Force Target = 88%

Count of Q1
Q8 Total
(blank) 16 No problems
57 11 Animal/Dog Fouling
8 7 Litter/Rubbish/Fly tipping
62 6 Speeding
61 5 Parking
14 3 Mini-Motorbikes
18 3 ASB Other
37 2 Drug Dealing
75 2 Partnership other
24 2 BDH
4 1 Boy Racers
5 1 Vehicles off roading
58 1 Traffic calming
43 1 Street Drinking
11 1 Rowdy Behaviour
50 1 Street Lighting
7 1 Noise nuisance
15 1 Youth Nuisance
29 1 Theft
Grand Total 66
0
2
4
6
8
10
12
14
16
18
Count of Q1 Total
Count of Q1 Total
Total of 66 persons were surveyed. 16 (24%) had no issues/problems.
Issues 75, 57 & 8 relate to dog fouling and general litter/fly tipping. 20 (30%) gave this as their issue. This problem was reported as very localised to the streets in which they live and nearby wasteland.
Timing was predominantly early morning and early evening. This may be attributable to the time these people may be going/returning from work/school runs or engaging in dog walking activities themselves for example.
Issues 62, 61, 58, 14, 4 & 5 relate to vehicle issues such as speeding, parking, off roading etc. 17 (26%) gave this as their issue. Again these issues were very local and specific. As previously seen there is a link with the canal network that covers other concerns and issues
Issues 11, 15,18,43 relate to youth nuisance, drinking, rowdy behaviour. 6 (9%) gave this as their issue. This was very specific to Owen Street and identified Pubs. Again mention of the canal network.
Combination of these 3 priorities and those with no problems covers 89% of the people surveyed.