Embed Size (px)
Citation preview
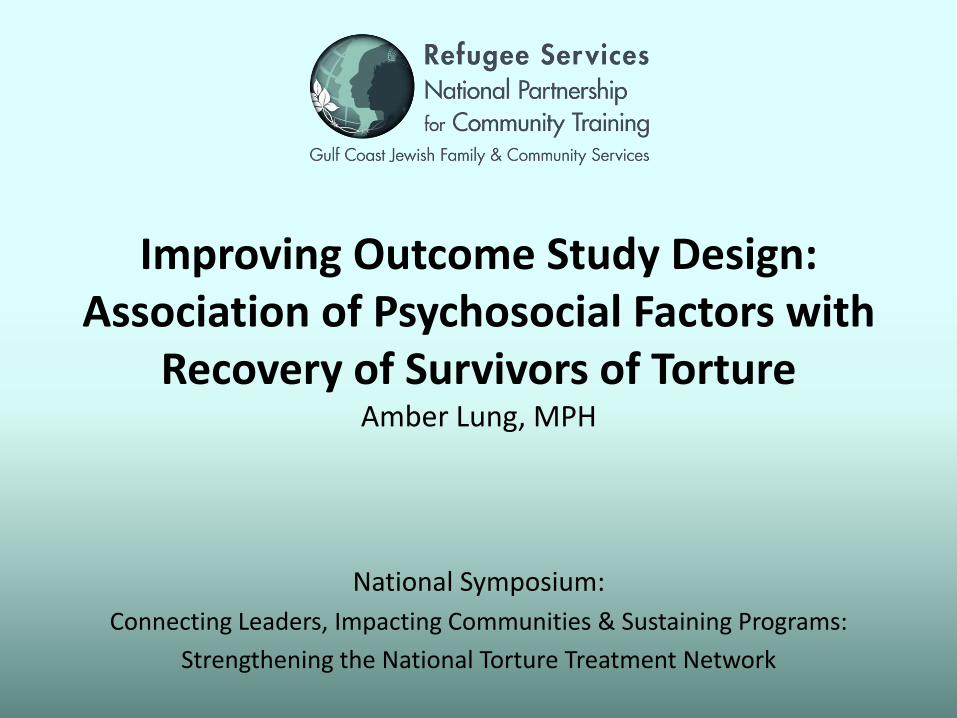
Improving Outcome Study Design: Association of Psychosocial Factors with
Recovery of Survivors of Torture Amber Lung, MPH
National Symposium:
Connecting Leaders, Impacting Communities & Sustaining Programs:
Strengthening the National Torture Treatment Network
OVERVIEW • Introductions & Stats 101
• Report research findings | What can be done with the data you collect
• Strategize ways to measure data & enhance evaluation of impact (research projects not required)

INTRODUCTORY QUESTIONS • What are you charged to do?
• How do you do it?
• How do you know it’s working?
INTRODUCTORY QUESTIONS • Roll call: who is in attendance?
• What is your comfort level with statistics?
• Anyone using the Client Progress Monitoring Tool (CPMT)?
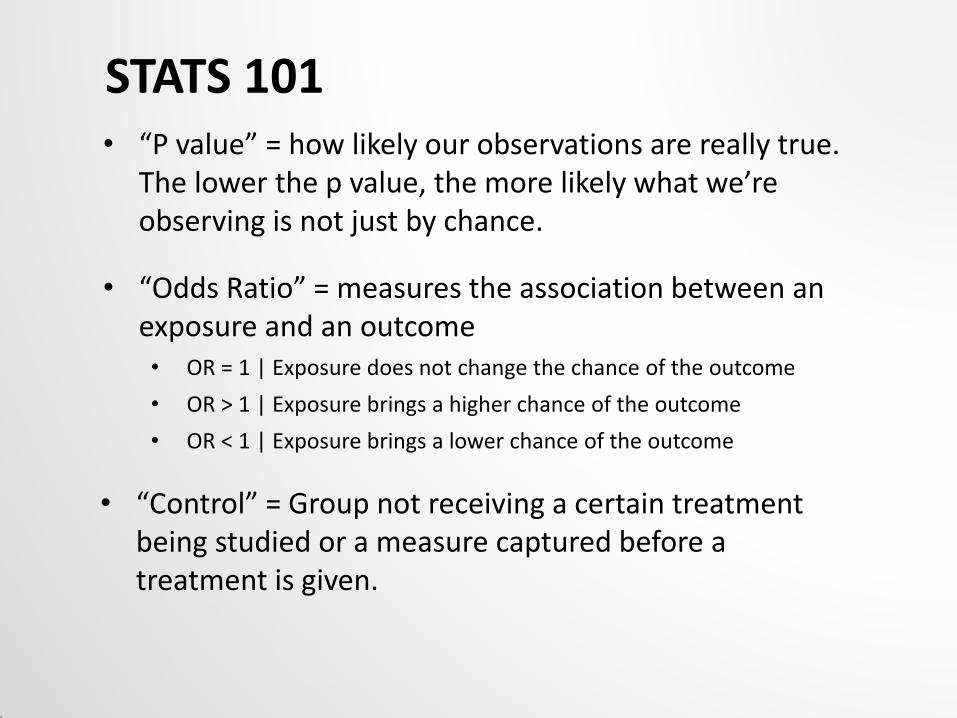
STATS 101 • “P value” = how likely our observations are really true.
The lower the p value, the more likely what we’re observing is not just by chance.
• “Odds Ratio” = measures the association between an exposure and an outcome • OR = 1 | Exposure does not change the chance of the outcome
• OR > 1 | Exposure brings a higher chance of the outcome
• OR < 1 | Exposure brings a lower chance of the outcome
• “Control” = Group not receiving a certain treatment being studied or a measure captured before a treatment is given.
DEFINITIONS • Torture – OHCHR 1984 definition
• Refugee – UNHCR Convention definition
• Asylee – Individual seeking protection and whose claims for refugee status have not yet been determined
BACKGROUND
• www.unhcr.org United Nations High Commission on Refugees. Web. January 2014. • United Nations High Commission on Refugees (2010). Convention and Protocol Relating to the Status of Refugees. Geneva, Switzerland. Communication and Public Information Service. • Office of Refugee Resettlement, Report to the Congress FY 2012 • Jaranson, J. et al. (2004). Somali and Oromo Refugees: Correlates of Torture and Trauma History. American Journal of Public Health.
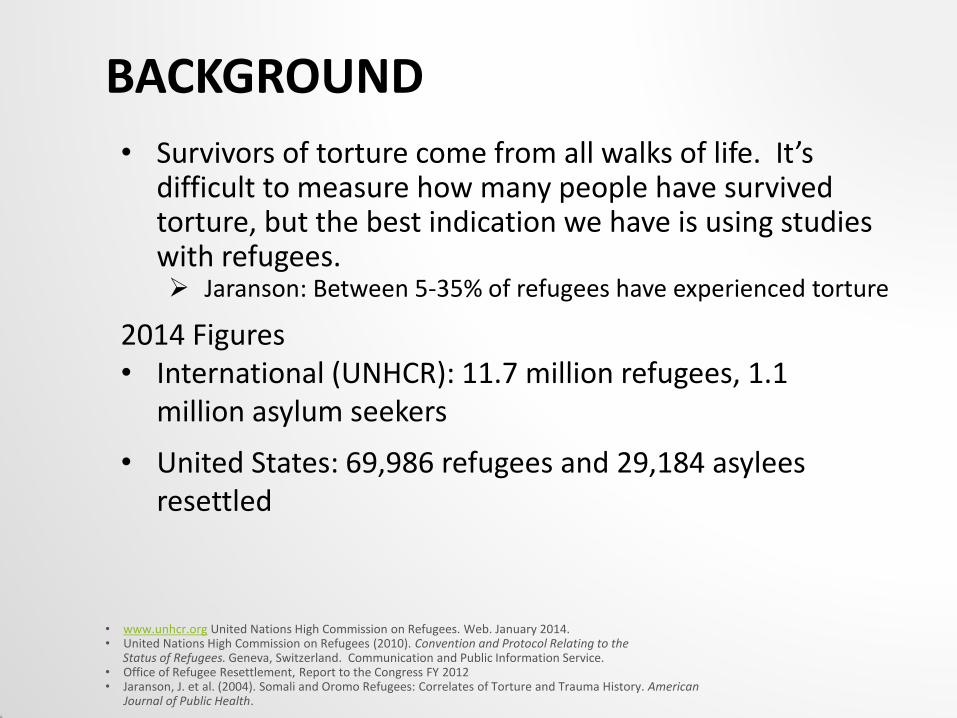
2014 Figures • International (UNHCR): 11.7 million refugees, 1.1
million asylum seekers
• United States: 69,986 refugees and 29,184 asylees resettled
• Survivors of torture come from all walks of life. It’s difficult to measure how many people have survived torture, but the best indication we have is using studies with refugees. Jaranson: Between 5-35% of refugees have experienced torture
BACKGROUND
• Estimated 11,000 survivors of torture live in San Diego
www.notorture.org. Survivors or Torture International. Web. October 2013.
• Survivors of Torture, International (SOTI) provides holistic services focusing on medical, dental, psychiatric, psychological, and social service needs
• SOTI is a part of the National Consortium of Torture Treatment Programs (NCTTP)
STATEMENT OF THE PROBLEM
• Kira et al: Negative effects go beyond individuals to families and communities
• Kira, I. A., Ahmed, A., Wasim, F., Mahmoud, V., Colrain, J., & Rai, D. (2012). Group Therapy for Refugees and Torture Survivors: Treatment Model Innovations. International Journal of Group Psychotherapy, 62(1), 69–88. • Jaranson, J. M., & Quiroga, J. (2011). Evaluating the services of torture rehabilitation programmes. Torture, 21, 98-140. • Quiroga, J., & Jaranson, J. M. (2005). Politically-motivated torture and its survivors. Torture, 15, 2-3.
• Quiroga and Jaranson One of the most urgent needs for this population is housing
or shelter Few outcome studies exist in the field of torture treatment,
and all of them have limitations
• Joyce et al: Triple trauma paradigm
LITERATURE: RECOVERY
• McFarlane: Ecological factors that will likely influence improvement, such as physical insecurity, poverty, and lack of medical care are rarely included in research designs
• Kira, I. A., Ashby, J. S., Odenat, L., & Lewandowsky, L. (2013). The Mental Health Effects of Torture Trauma and Its Severity: A Replication and Extension. Psychology, 04(05), 472–482. • McFarlane, C. A., & Kaplan, I. (2012). Evidence-based psychological interventions for adult survivors of torture and trauma: A 30-year review. Transcultural Psychiatry, 49(3-4), 539–567. • Quiroga, J., & Jaranson, J. M. (2005). Politically-motivated torture and its survivors. Torture, 15, 2-3.
• Quiroga and Jaranson: Depression and PTSD are the most common psychiatric diagnoses
• Kira et al: Dissociation and the great variability in the association between torture and PTSD
PSYCHOSOCIAL FACTORS/ CASE MANAGEMENT
Martikainen, P., Bartley, M., & Lahelma, E. (2002). Psychosocial determinants of health in social epidemiology. International Journal of Epidemiology, 31, 1091-1093.
• Definition: Pertaining to the influence of social factors on an individual’s mind or behavior, and to the interrelation of behavioral and social factors.
• Examples: Social networks/support Work Financial security
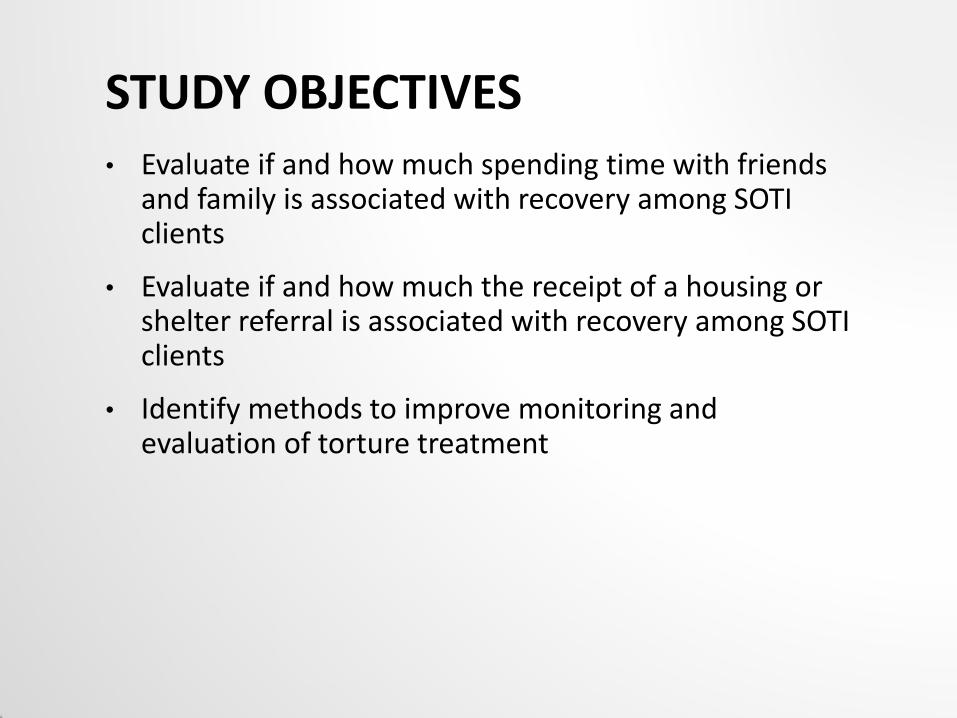
STUDY OBJECTIVES • Evaluate if and how much spending time with friends
and family is associated with recovery among SOTI clients
• Evaluate if and how much the receipt of a housing or shelter referral is associated with recovery among SOTI clients
• Identify methods to improve monitoring and evaluation of torture treatment
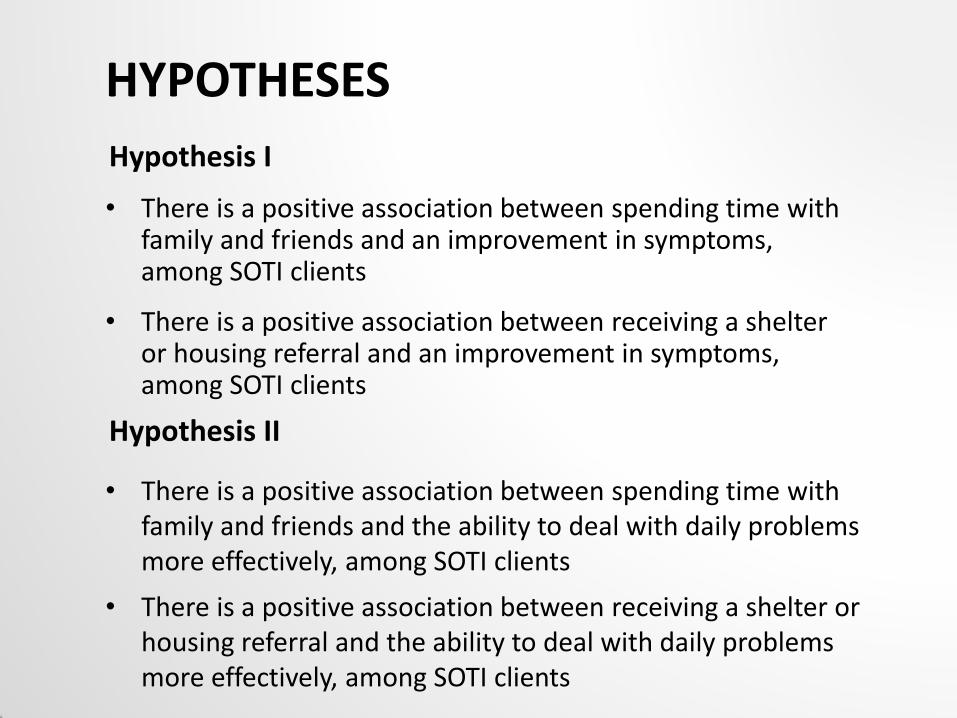
HYPOTHESES
Hypothesis I
• There is a positive association between spending time with family and friends and an improvement in symptoms, among SOTI clients
• There is a positive association between receiving a shelter or housing referral and an improvement in symptoms, among SOTI clients
Hypothesis II
• There is a positive association between spending time with family and friends and the ability to deal with daily problems more effectively, among SOTI clients
• There is a positive association between receiving a shelter or housing referral and the ability to deal with daily problems more effectively, among SOTI clients
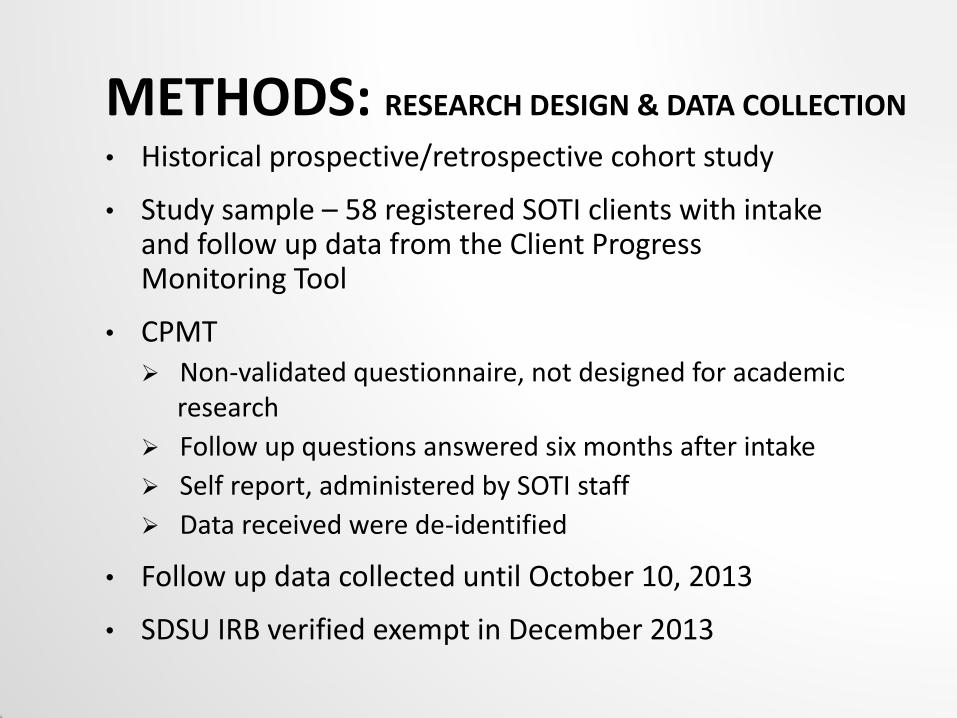
METHODS: RESEARCH DESIGN & DATA COLLECTION
• Historical prospective/retrospective cohort study
• Study sample – 58 registered SOTI clients with intake and follow up data from the Client Progress Monitoring Tool
• CPMT Non-validated questionnaire, not designed for academic research
Follow up questions answered six months after intake
Self report, administered by SOTI staff
Data received were de-identified
• Follow up data collected until October 10, 2013
• SDSU IRB verified exempt in December 2013
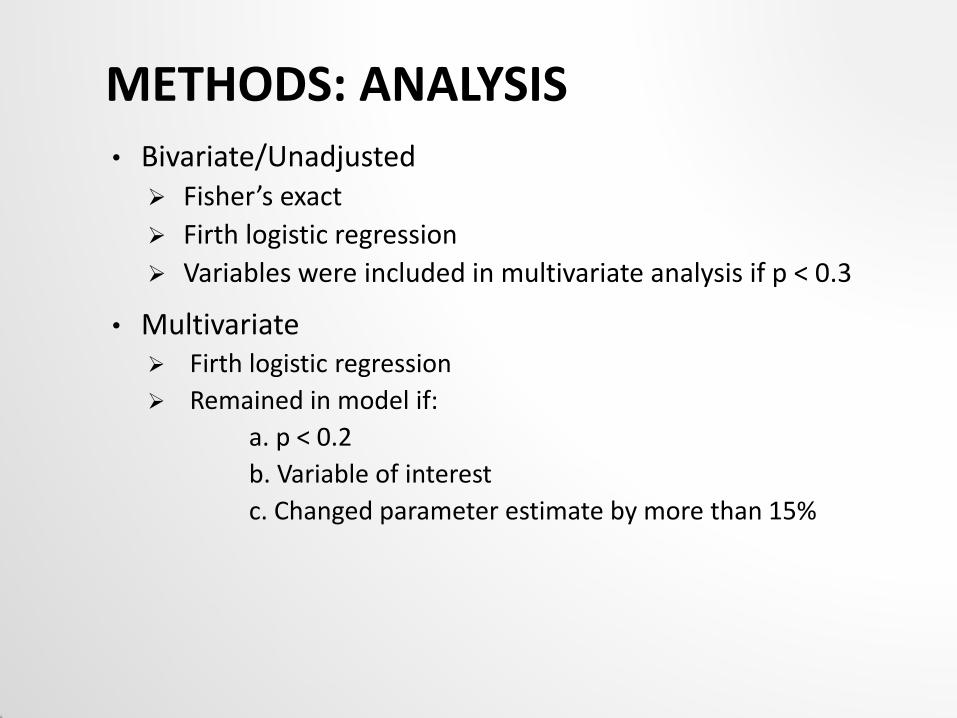
METHODS: ANALYSIS • Bivariate/Unadjusted
Fisher’s exact
Firth logistic regression
Variables were included in multivariate analysis if p < 0.3
• Multivariate Firth logistic regression
Remained in model if:
a. p < 0.2
b. Variable of interest
c. Changed parameter estimate by more than 15%
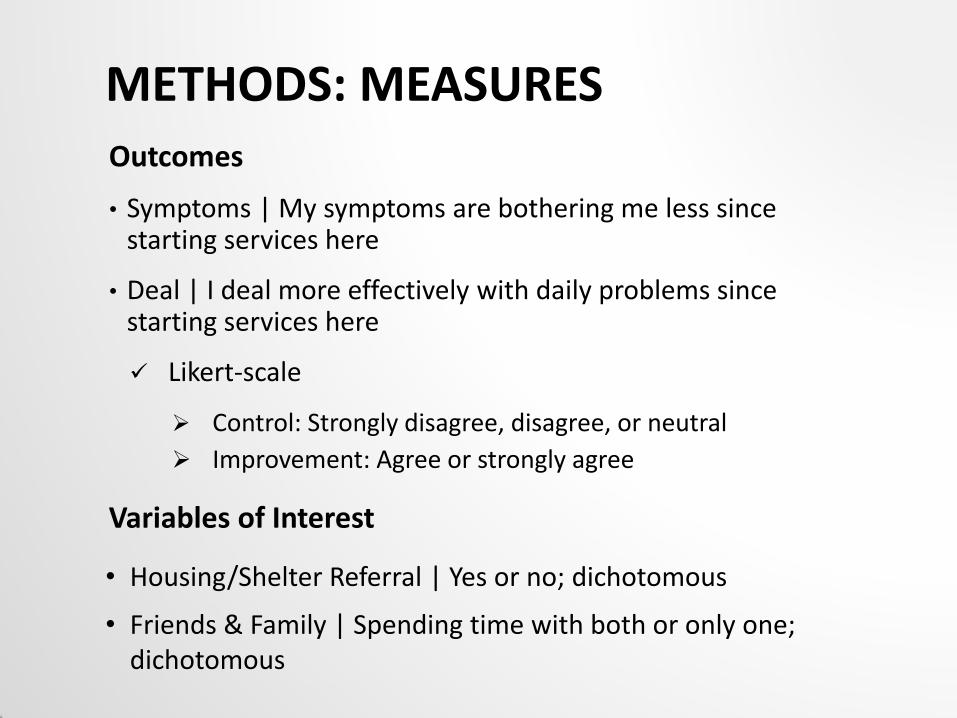
METHODS: MEASURES Outcomes
• Symptoms | My symptoms are bothering me less since starting services here
• Deal | I deal more effectively with daily problems since starting services here
Likert-scale
Control: Strongly disagree, disagree, or neutral
Improvement: Agree or strongly agree
Variables of Interest
• Housing/Shelter Referral | Yes or no; dichotomous
• Friends & Family | Spending time with both or only one; dichotomous
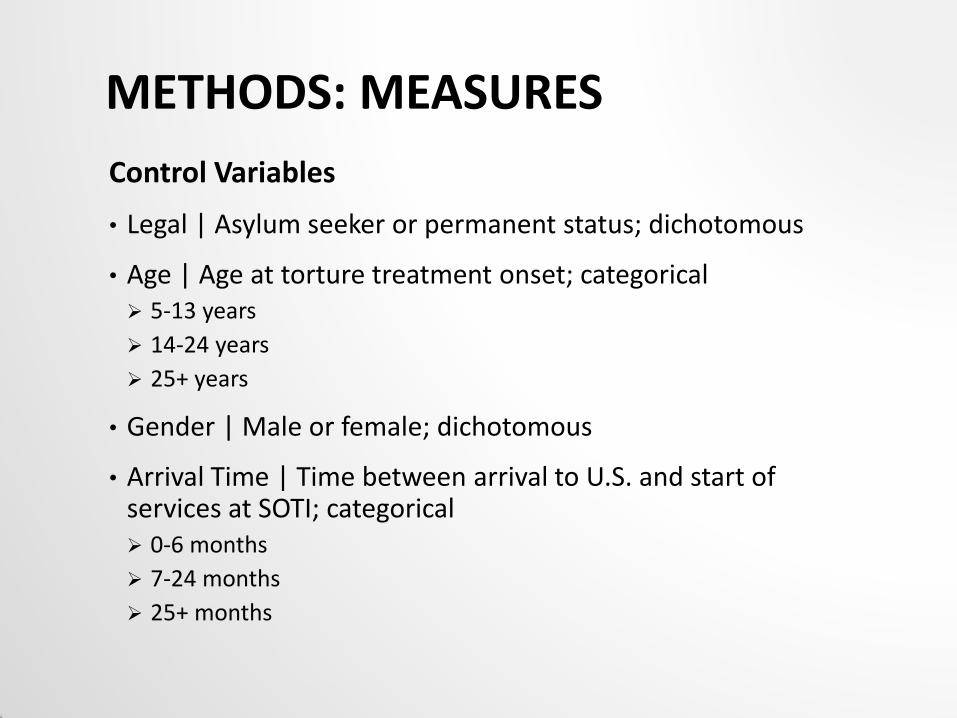
METHODS: MEASURES
Control Variables
• Legal | Asylum seeker or permanent status; dichotomous
• Age | Age at torture treatment onset; categorical 5-13 years
14-24 years
25+ years
• Gender | Male or female; dichotomous
• Arrival Time | Time between arrival to U.S. and start of services at SOTI; categorical 0-6 months
7-24 months
25+ months
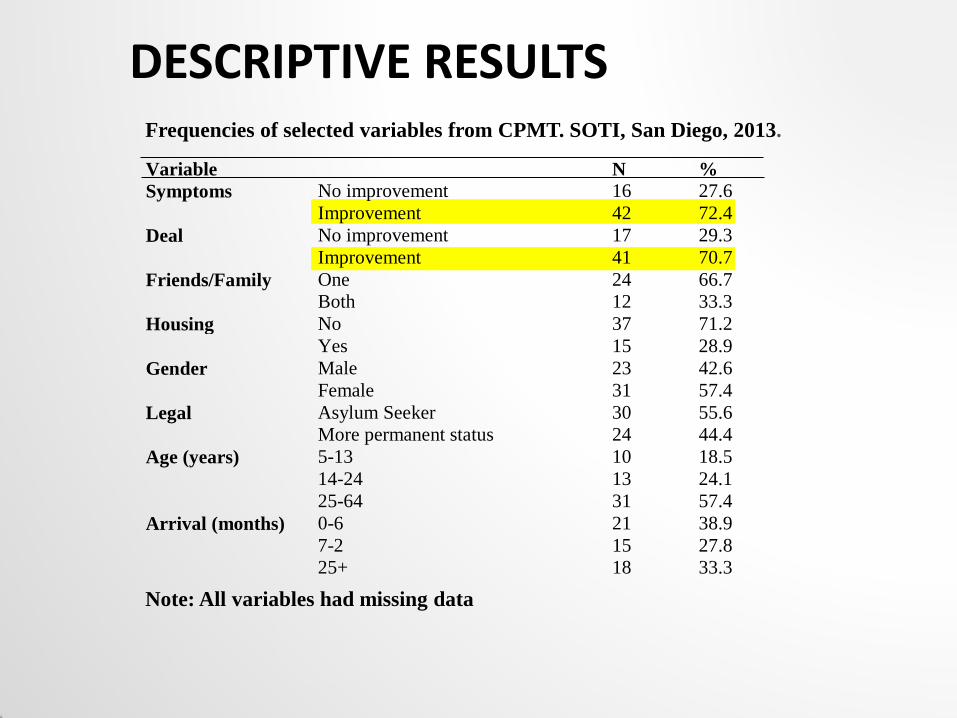
DESCRIPTIVE RESULTS Frequencies of selected variables from CPMT. SOTI, San Diego, 2013.
Note: All variables had missing data
Variable N %
Symptoms No improvement 16 27.6
Improvement 42 72.4
Deal No improvement 17 29.3
Improvement 41 70.7
Friends/Family One 24 66.7
Both 12 33.3
Housing No 37 71.2
Yes 15 28.9
Gender Male 23 42.6
Female 31 57.4
Legal Asylum Seeker 30 55.6
More permanent status 24 44.4
Age (years) 5-13 10 18.5
14-24 13 24.1
25-64 31 57.4
Arrival (months) 0-6 21 38.9
7-2 15 27.8
25+ 18 33.3
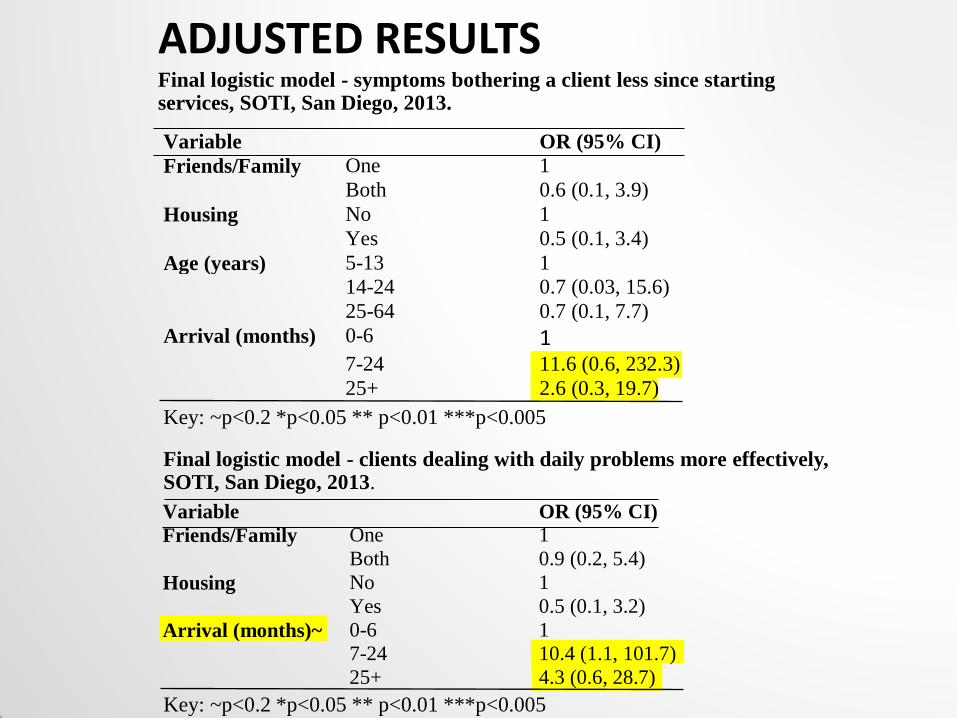
ADJUSTED RESULTS Final logistic model - symptoms bothering a client less since starting services, SOTI, San Diego, 2013.
Final logistic model - clients dealing with daily problems more effectively, SOTI, San Diego, 2013.
Key: ~p<0.2 *p<0.05 ** p<0.01 ***p<0.005
Key: ~p<0.2 *p<0.05 ** p<0.01 ***p<0.005
Variable OR (95% CI)
Friends/Family One 1
Both 0.9 (0.2, 5.4)
Housing No 1
Yes 0.5 (0.1, 3.2)
Arrival (months)~
0-6 1
7-24 10.4 (1.1, 101.7)
25+ 4.3 (0.6, 28.7)
Variable OR (95% CI)
Friends/Family One 1
Both 0.6 (0.1, 3.9)
Housing No 1
Yes 0.5 (0.1, 3.4)
Age (years) 5-13 1
14-24 0.7 (0.03, 15.6)
25-64 0.7 (0.1, 7.7)
Arrival (months)
0-6 1 7-24 11.6 (0.6, 232.3)
25+ 2.6 (0.3, 19.7)
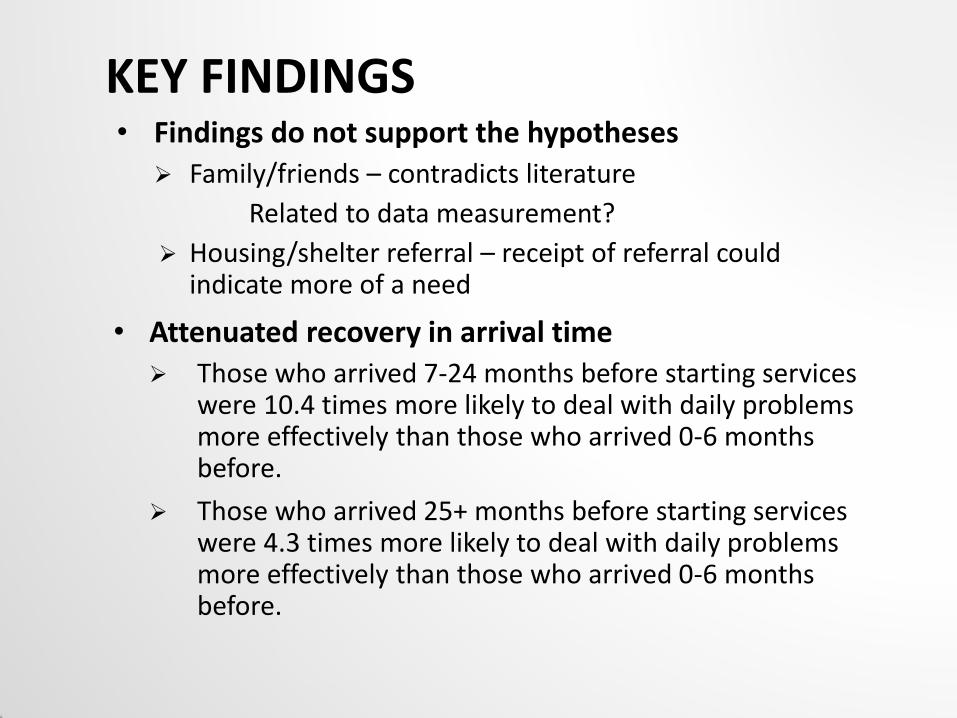
KEY FINDINGS • Findings do not support the hypotheses
Family/friends – contradicts literature
Related to data measurement?
Housing/shelter referral – receipt of referral could indicate more of a need
• Attenuated recovery in arrival time
Those who arrived 7-24 months before starting services were 10.4 times more likely to deal with daily problems more effectively than those who arrived 0-6 months before.
Those who arrived 25+ months before starting services were 4.3 times more likely to deal with daily problems more effectively than those who arrived 0-6 months before.
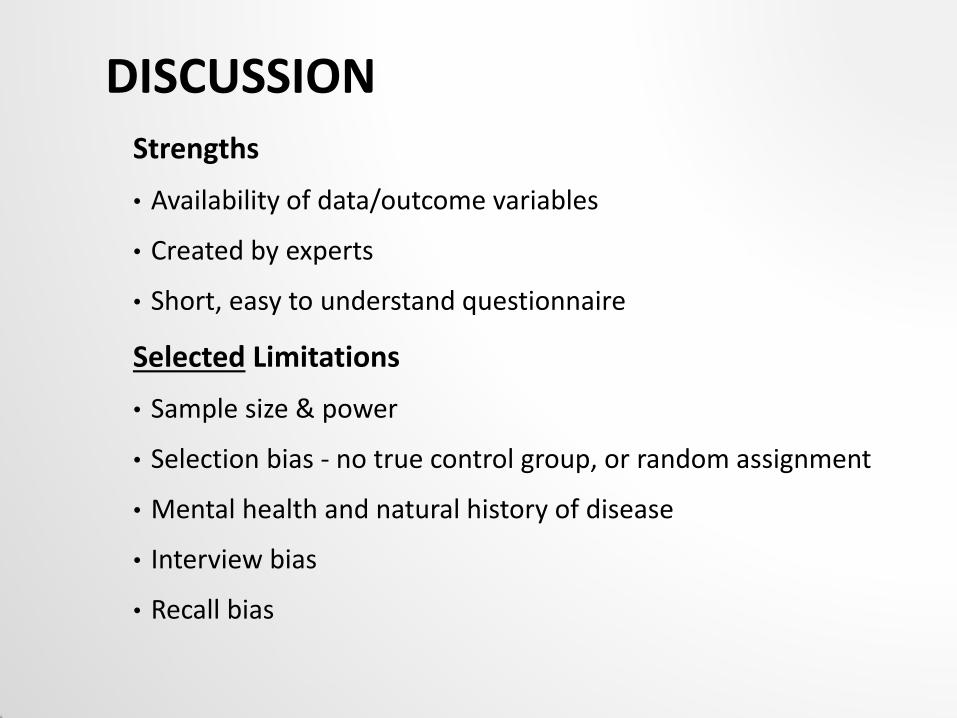
DISCUSSION
Selected Limitations
• Sample size & power
• Selection bias - no true control group, or random assignment
• Mental health and natural history of disease
• Interview bias
• Recall bias
Strengths
• Availability of data/outcome variables
• Created by experts
• Short, easy to understand questionnaire
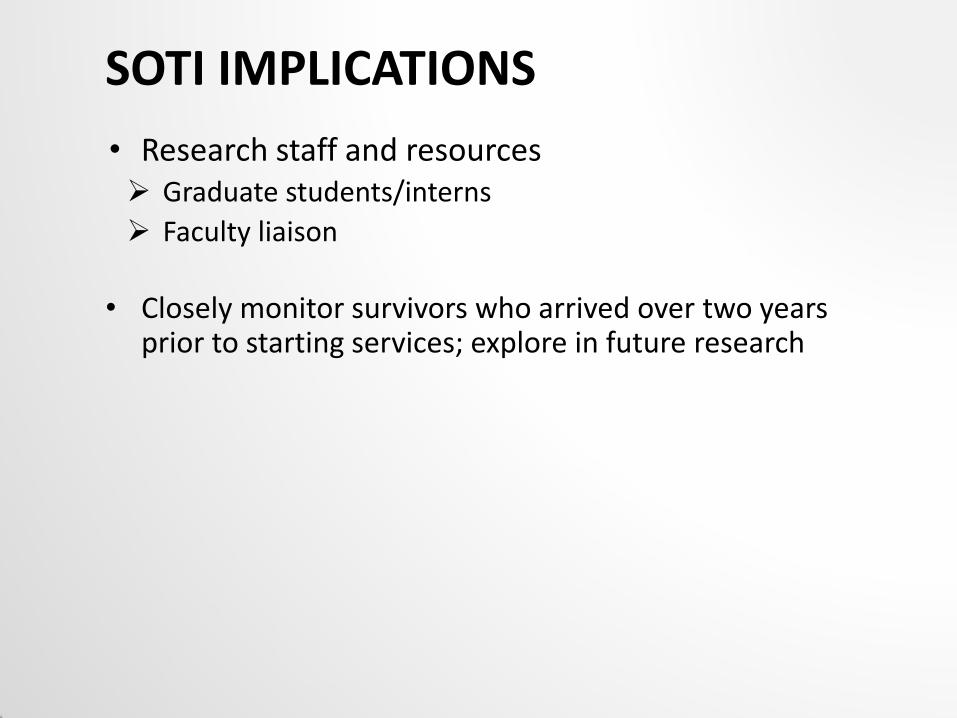
SOTI IMPLICATIONS
• Research staff and resources Graduate students/interns
Faculty liaison
• Closely monitor survivors who arrived over two years
prior to starting services; explore in future research
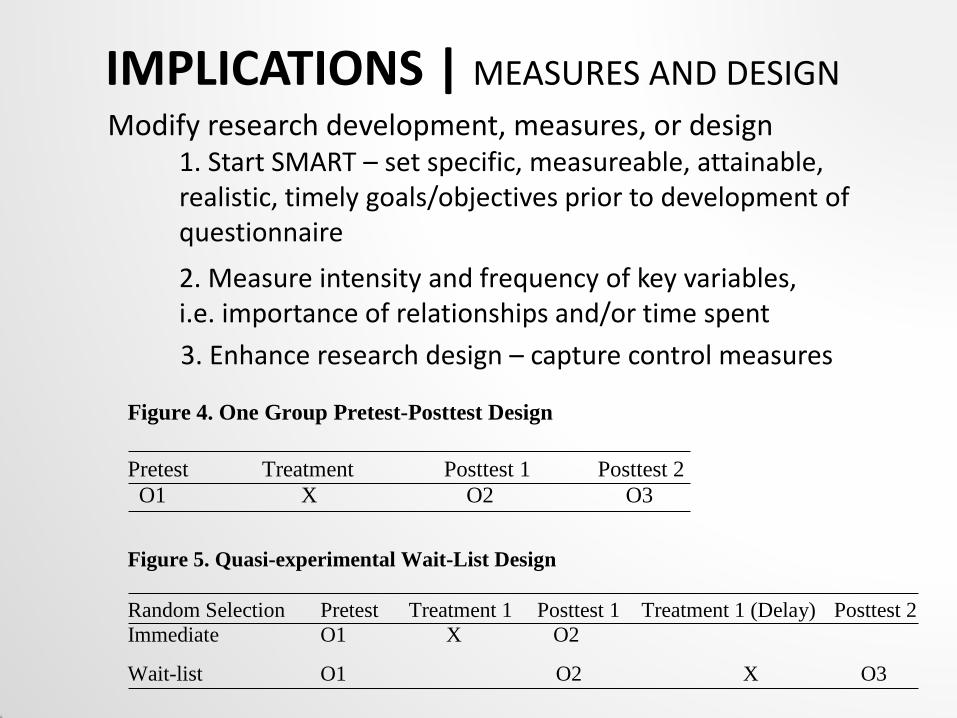
IMPLICATIONS | MEASURES AND DESIGN
Modify research development, measures, or design 1. Start SMART – set specific, measureable, attainable, realistic, timely goals/objectives prior to development of questionnaire
Figure 5. Quasi-experimental Wait-List Design
Random Selection Pretest Treatment 1 Posttest 1 Treatment 1 (Delay) Posttest 2
Immediate O1 X O2
Wait-list O1 O2 X O3
3. Enhance research design – capture control measures
Figure 4. One Group Pretest-Posttest Design
Pretest Treatment Posttest 1 Posttest 2
O1 X O2 O3
2. Measure intensity and frequency of key variables, i.e. importance of relationships and/or time spent
IMPLICATIONS | MEASURES AND DESIGN
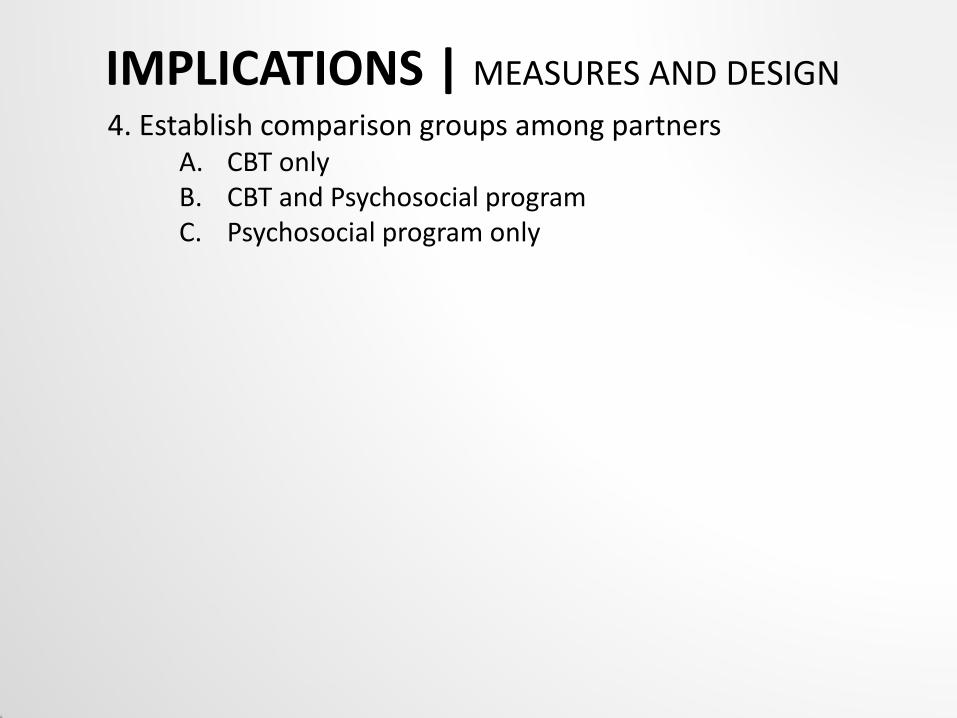
4. Establish comparison groups among partners A. CBT only B. CBT and Psychosocial program C. Psychosocial program only
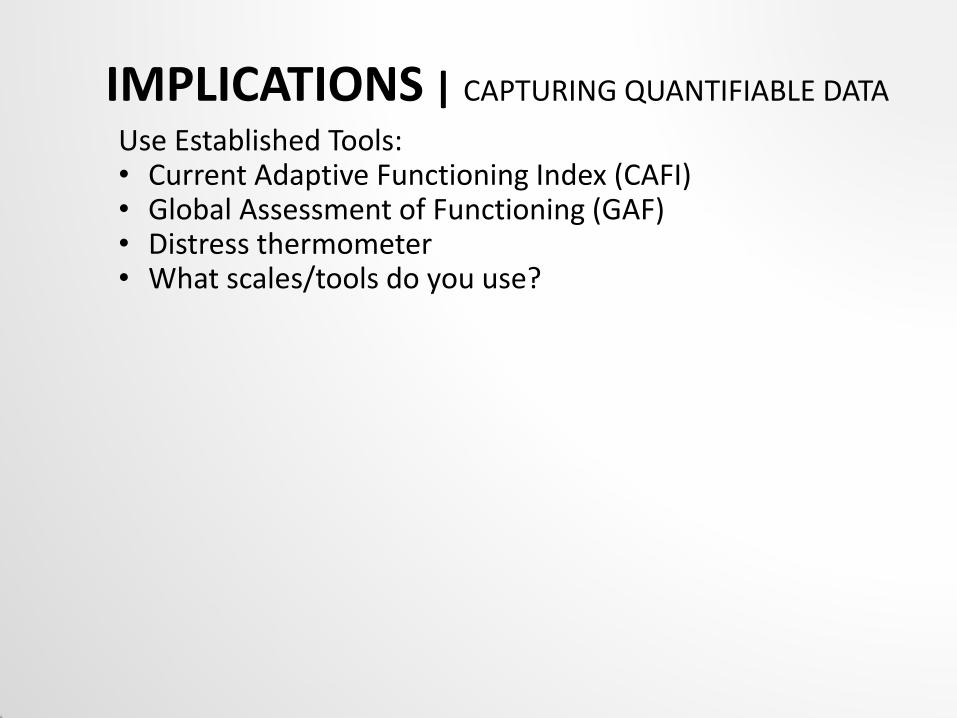
IMPLICATIONS | CAPTURING QUANTIFIABLE DATA
Use Established Tools: • Current Adaptive Functioning Index (CAFI) • Global Assessment of Functioning (GAF) • Distress thermometer • What scales/tools do you use?
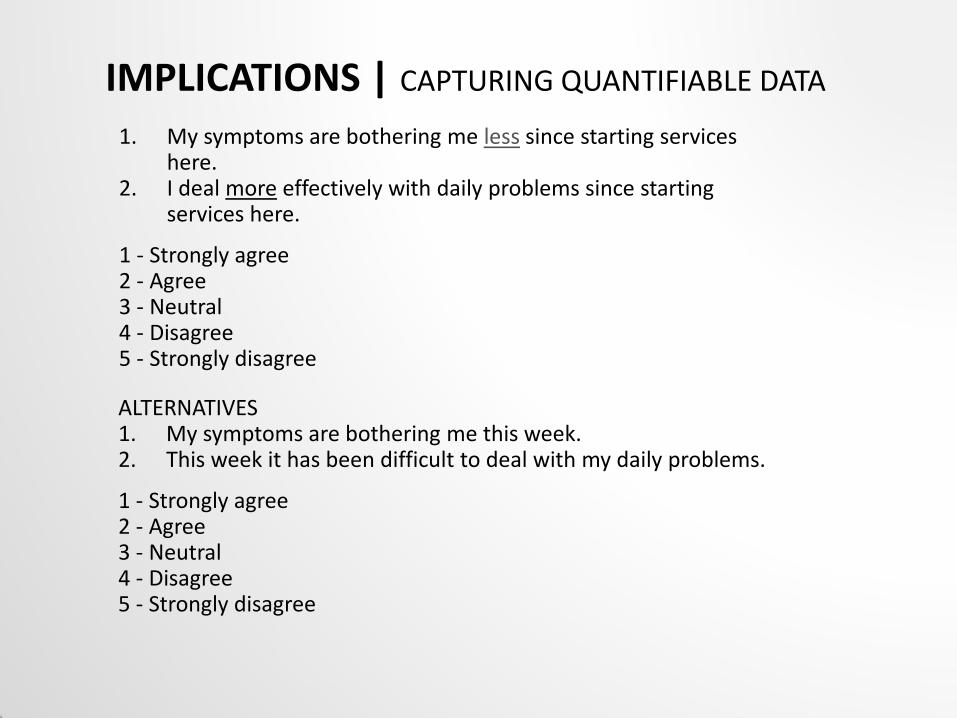
IMPLICATIONS | CAPTURING QUANTIFIABLE DATA
1. My symptoms are bothering me less since starting services here.
2. I deal more effectively with daily problems since starting services here.
1 - Strongly agree 2 - Agree 3 - Neutral 4 - Disagree 5 - Strongly disagree ALTERNATIVES 1. My symptoms are bothering me this week. 2. This week it has been difficult to deal with my daily problems.
1 - Strongly agree 2 - Agree 3 - Neutral 4 - Disagree 5 - Strongly disagree
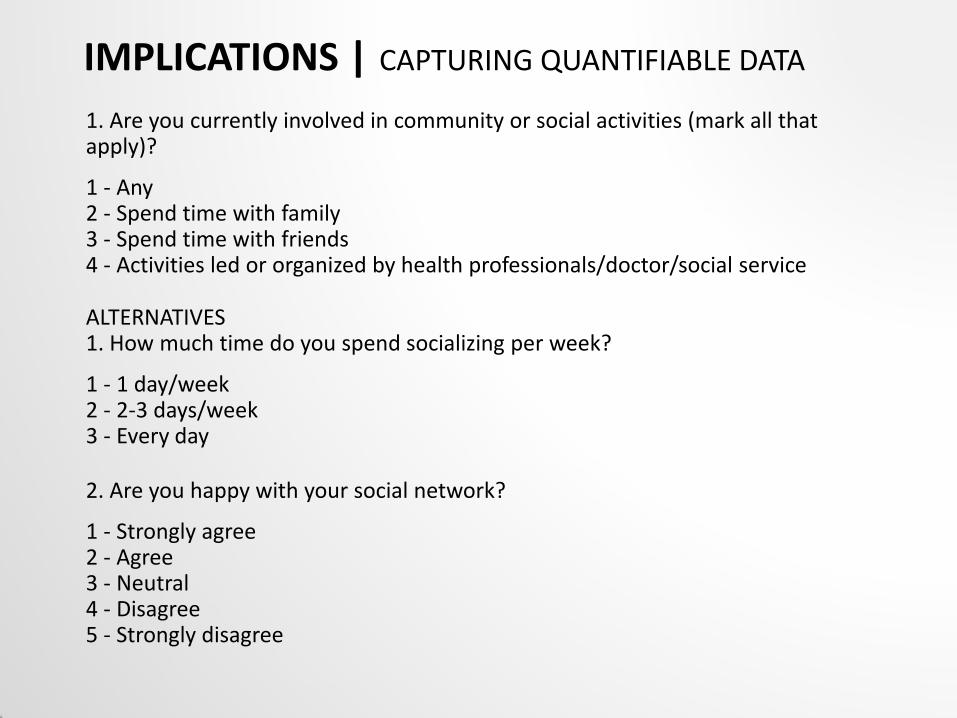
1. Are you currently involved in community or social activities (mark all that apply)?
1 - Any 2 - Spend time with family 3 - Spend time with friends 4 - Activities led or organized by health professionals/doctor/social service ALTERNATIVES 1. How much time do you spend socializing per week?
1 - 1 day/week 2 - 2-3 days/week 3 - Every day 2. Are you happy with your social network?
1 - Strongly agree 2 - Agree 3 - Neutral 4 - Disagree 5 - Strongly disagree
IMPLICATIONS | CAPTURING QUANTIFIABLE DATA
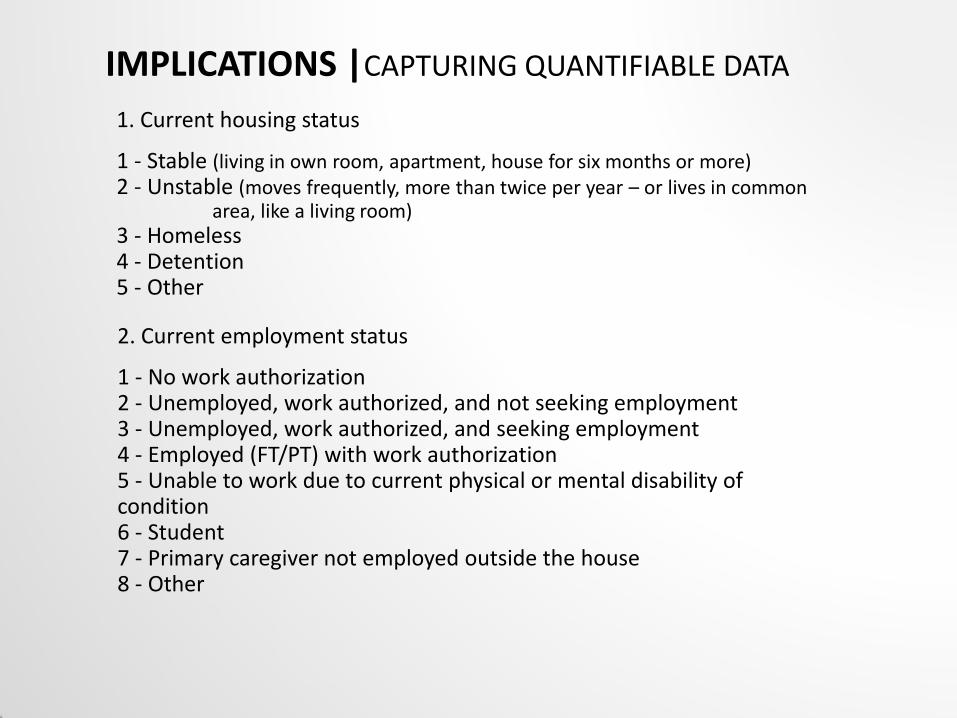
IMPLICATIONS |CAPTURING QUANTIFIABLE DATA
1. Current housing status
1 - Stable (living in own room, apartment, house for six months or more) 2 - Unstable (moves frequently, more than twice per year – or lives in common area, like a living room) 3 - Homeless 4 - Detention 5 - Other
2. Current employment status
1 - No work authorization 2 - Unemployed, work authorized, and not seeking employment 3 - Unemployed, work authorized, and seeking employment 4 - Employed (FT/PT) with work authorization 5 - Unable to work due to current physical or mental disability of condition 6 - Student 7 - Primary caregiver not employed outside the house 8 - Other
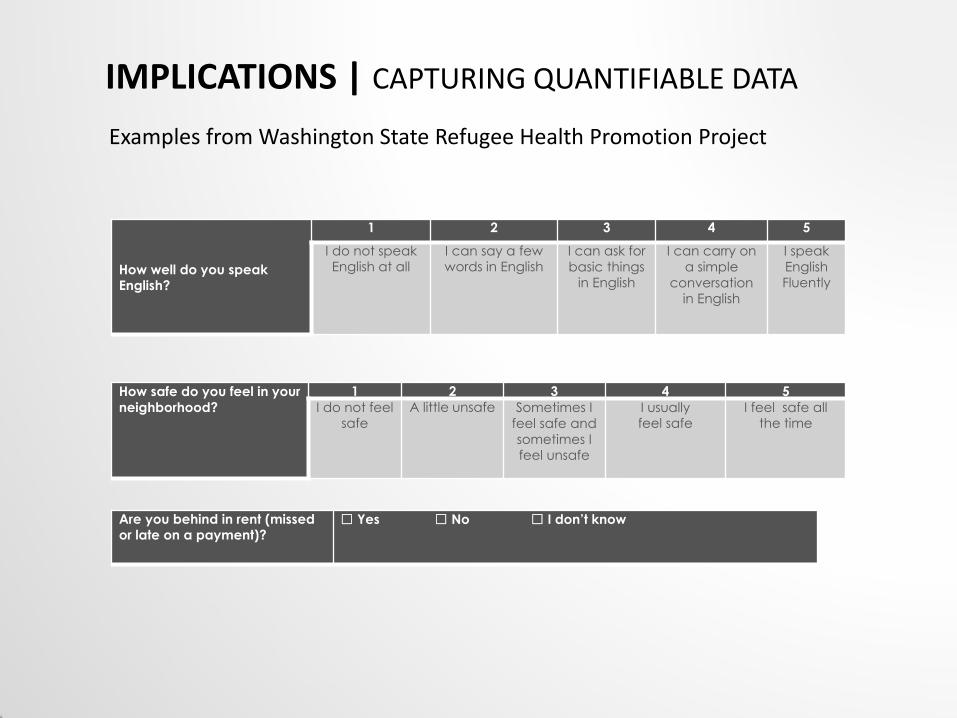
Examples from Washington State Refugee Health Promotion Project
IMPLICATIONS | CAPTURING QUANTIFIABLE DATA
How well do you speak English?
1 2 3 4 5
I do not speak English at all
I can say a few words in English
I can ask for
basic things in English
I can carry on
a simple
conversation in English
I speak
English Fluently
How safe do you feel in your
neighborhood?
1 2 3 4 5
I do not feel safe
A little unsafe Sometimes I
feel safe and
sometimes I feel unsafe
I usually feel safe
I feel safe all the time
Are you behind in rent (missed or late on a payment)?
☐ Yes ☐ No ☐ I don’t know
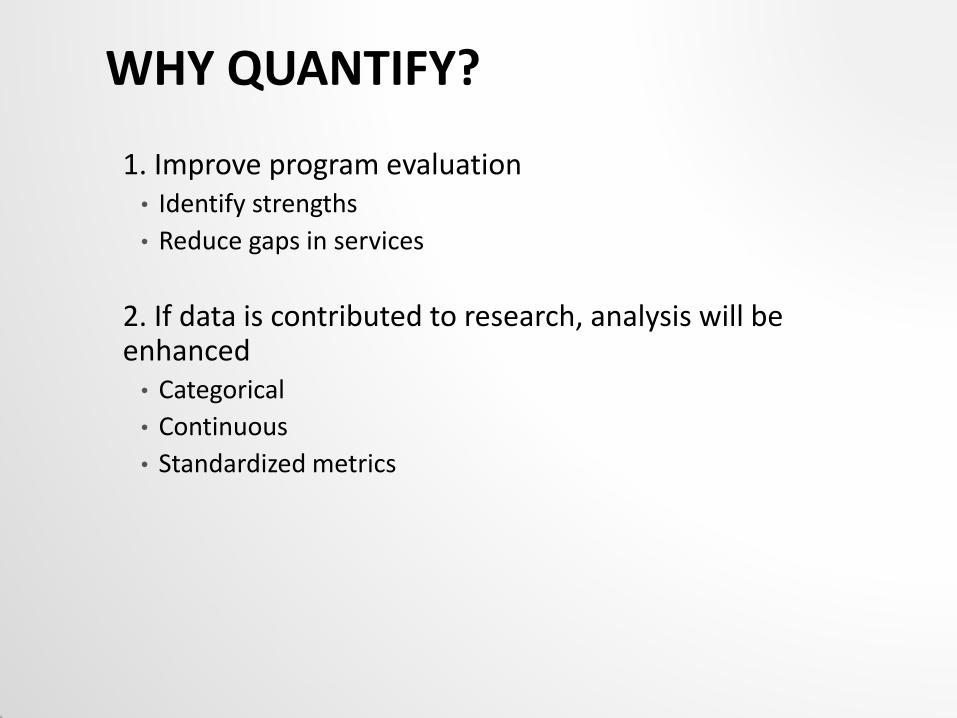
2. If data is contributed to research, analysis will be enhanced • Categorical
• Continuous
• Standardized metrics
WHY QUANTIFY?
1. Improve program evaluation • Identify strengths
• Reduce gaps in services

ACKNOWLEDGEMENTS • Survivors of Torture, International Kathi Anderson, Executive Director
Leilani Amiling, Data & Office Manager
• Drs. Lindsay, Novotny, Lemus, and Engstrom | San Diego State University Faculty
• Refugee Health Program | WA State Department of Health
• Beth Farmer, LICSW | Lutheran Community Services Northwest
• Office of Refugee & Immigrant Assistance | WA State Department of Social and Health Services
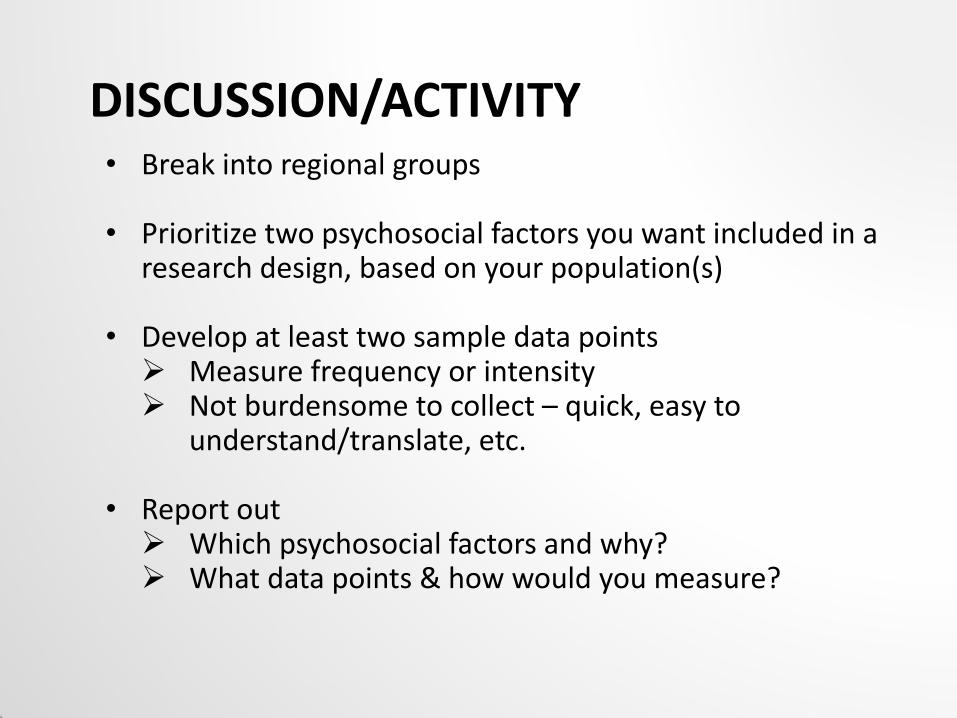
DISCUSSION/ACTIVITY • Break into regional groups • Prioritize two psychosocial factors you want included in a
research design, based on your population(s) • Develop at least two sample data points Measure frequency or intensity Not burdensome to collect – quick, easy to
understand/translate, etc.
• Report out Which psychosocial factors and why? What data points & how would you measure?

FINAL THOUGHTS/Q&A