Embed Size (px)
Citation preview

Making use of new data now publicly available on the College Results Online (CRO) website, The Education Trust finds some encouraging news for those concerned about broadening access and success in the nation’s four-year colleges: Over the past three years, the number of black and Latino undergraduates enrolled in four-year colleges grew far faster than the enrollment of white students, and success rates for both groups also increased. Certainly, more improvement is necessary. Success rates (i.e., six-year graduation rates) for both groups still lag those of white students.1 And even with the recent increases, the current graduation rate for black stu-dents is still below their rate in 2006 by 2.2 percentage points. But if more colleges and universities can match the improvement patterns seen at the leading institutions profiled in this brief, closing the col-lege completion gap is within our reach.
According to recent data from the U.S. Department of Education, between 2009 and 2011, the number of black undergraduates grew 8.5 percent, and the number of Latino undergraduates grew a whop-
ping 22 percent (Table 1).2 Over the same time period, white enroll-ment grew by only 2.7 percent.
In addition to large enrollment gains, success rates for both under-represented groups improved, too. Latino graduation rates ticked up by 2.3 percentage points, to 51 percent, and black graduation rates increased by just under 1 point, reaching 40 percent (Table 1). Though success rates nationally are moving in the right direction, these small increases are dwarfed by the improvements shown by individual institutions that have focused intensively on improving student success in recent years.
Identifying those institutions is hard work, but the Education Trust’s CRO database facilitates the process by allowing users to dig beneath the national averages and identify individual institutions achiev-ing markedly better results. Unlike most college-search tools, CRO empowers policymakers, parents, prospective students, and others to dig into a comprehensive dataset on colleges to identify schools that perform well relative to their peers. Whereas mass media rankings such as those produced by U.S. News & World Report consider only a small fraction of all institutions of higher education and focus heav-ily on inputs, CRO presents a wealth of outcome-oriented data on how well institutions perform, as well as demographic and financial information for four-year colleges and universities nationwide. There are many examples of significant and sustained improvement in suc-cess rates for students of color.
COLLEGES AND UNIVERSITIES LEADING THE WAY
Previous Education Trust publications highlighted a number of lead-ing institutions. Two Big Gaps, Small Gaps briefs focused on colleges with small differences in graduation rates between white students and black and Hispanic students, and two Advancing to Completion briefs identified colleges and universities with significant increases in black and Hispanic graduation rates between 2004 and 2010.3 Tracking these institutions’ progress over time, new data suggest that many have continued to improve.
African American student graduation rates at the University of North Carolina-Greensboro, for example, were highlighted in one of the Advancing to Completion briefs for being on par with those of their white peers. Now in 2011, the graduation rates jumped from 52.3 percent in 2010 to 60.1 percent. While this represents a one-
J U LY 2 0 1 3
Intentionally Successful Improving Minority Student College Graduation Rates BY JOSEPH YEADO
CO
LL
EG
ER
ES
UL
TS
.O
RG
C O L L E G E R E S U L T S I N B R I E F
Table 1: Enrollment and Graduation Rates Are Up for All Students at Four-Year Colleges and Universities
Fall Undergraduate Enrollment
Black Hispanic White
2009 1,271,636 949,304 5,928,302
2010 1,337,325 1,053,700 6,058,845
2011 1,379,680 1,158,268 6,090,212
09-11% Change +8.5% +22.0% +2.7%
Six-Year Graduation Rate
Black Hispanic White
2009 39.1% 48.7% 60.8%
2010 39.5% 50.1% 61.5%
2011 39.9% 51.0% 62.1%
09-11% Change +2.0% +4.7% +2.1%
Source: NCES (December 2012). Enrollment in Postsecondary Institutions, Fall 2011; Financial Statistics, Fiscal Year 2011; and Graduation Rates, Selected Cohorts, 2003-2008, First Look (Provisional Data); NCES (March 2012). Enrollment in Postsecondary Institutions, Fall 2010; Financial Statistics, Fiscal Year 2010; and Graduation Rates, Selected Cohorts, 2005-2007, First Look; and NCES (February 2011). Enrollment in Postsecondary Institutions, Fall 2009; Gradua-tion Rates, 2003 & 2006 Cohorts; and Financial Statistics, Fiscal Year 2009, First Look.
Joseph Yeado is a higher education research and policy analyst at The Education Trust © Copyright 2013 The Education Trust. All rights reserved.

2 THE EDUCATION TRUST | INTENTIONALLY SUCCESSFUL | JULY 2013
CO
LL
EG
ER
ES
UL
TS
.O
RG
C O L L E G E R E S U L T S I N B R I E F
year change and is to be interpreted with caution, it continues what was already strong and sustained performance for all groups of students. Since 2002 (the first year of data in CRO), UNC-Greensboro has graduated black students at similar or higher rates than white students.
In addition to improving success outcomes for minority students, some colleges and universities are also narrowing the completion gap between white students and students of color. For example, between 2010 and 2011, the graduation rate for Hispanic stu-dents at Stony Brook University grew from 58.1 percent to 66.5 percent (Figure 2). Hispanic students at Stony Brook now graduate at a slightly higher rate than their white peers. More impressive though, Stony Brook has driven enormous gains for all students over the past nine years, increasing overall graduation rates from 53.7 percent to 67.0 percent between 2002 and 2011.
Similarly, Northeastern University — previously highlighted for big gains in African American graduation rates — increased its graduation rate for black students from 64.7 percent in 2010 to 69.5 percent in 2011. Again, one-year changes are to be inter-preted with caution. But the long-term perspective provides truly telling results. In the past 10 years, the graduation rate for African American students at Northeastern has jumped by 27.4 percentage points from their 2002 rate of 42.1 percent. Notably, the gradua-tion rates for white students continued to improve at both Stony Brook and Northeastern during that same period. At these institu-tions as well as others, success for one student group does not need to come at the expense of another.
SHAMEFUL INEQUALITIES CONTINUE AT SOME INSTITUTIONS
The news, however, is not all good. Our Big Gaps, Small Gaps briefs also focused on a number of colleges with disturbingly large gaps in graduation rates between white students and students of color, and at some of those institutions the gaps continued to widen into 2011. At the University of Akron, white students had a graduation rate of 39.7 percent in 2010 while their black peers graduated at 14.2 percent — a gap of nearly 26 percentage points. Looking to 2011, the rate for white students increased to 43.4 percent, while the rate for black students fell to 9.8 percent, causing the gap to widen even further to nearly 34 percentage points — its highest level in the last 10 years (Figure 3). Interest-
THE EDUCATION TRUST | INTENTIONALLY SUCCESSFUL | JULY 2013 3
CO
LL
EG
ER
ES
UL
TS
.O
RG
C O L L E G E R E S U L T S I N B R I E F
ingly, the gap wasn’t always this large. In 2002, the graduation rate for white students was 37.1 percent, with the African American rate at 23.5 percent for a gap of 13.6 percentage points. In other words, the graduation rate for white students at Akron has held relatively steady over time, while the rate for black students is only about half of what it was a decade ago.
Likewise, Michigan State University serves its white students quite well, as demonstrated by its 80 percent white graduation rate in 2010. But Michigan State’s Hispanic students graduated at only a 64.4 percent rate and African American students at a 58.4 percent rate, resulting in gaps of 15.6 percentage points and 21.6 percent-age points, respectively. Yet as large as these gaps were in 2010, they actually widened in 2011. The graduation rate for white students grew to 80.9 percent, while the rates for Hispanic and African American students fell to 61.5 percent and 55.4 percent, respec-tively (Figure 4). Michigan State’s graduation gaps now stand at 19.4 percentage points for Hispanic students and 25.5 percentage points for African American students. Though the graduation rates for Hispanic and African American students are above the national averages, Michigan State has posted gaps of at least 15 percentage points for these groups as compared to their white peers each year since 2002. There is a continuing trend of inequitable success out-comes at Michigan State University.
DO HIGH GRADUATION RATES DEPEND ON HIGHER OR GREATER SELECTIVITY?
There are many in higher education who argue the only way to improve student success rates is greater selectivity in admissions. In effect, this approach says, “We would have better graduation rates if we had better students.” But the data in College Results Online debunk that myth. Certainly, institutions that are more selective have higher graduation rates — on average. But at every level of selectivity, institutions serving the same kinds of students have very different results.
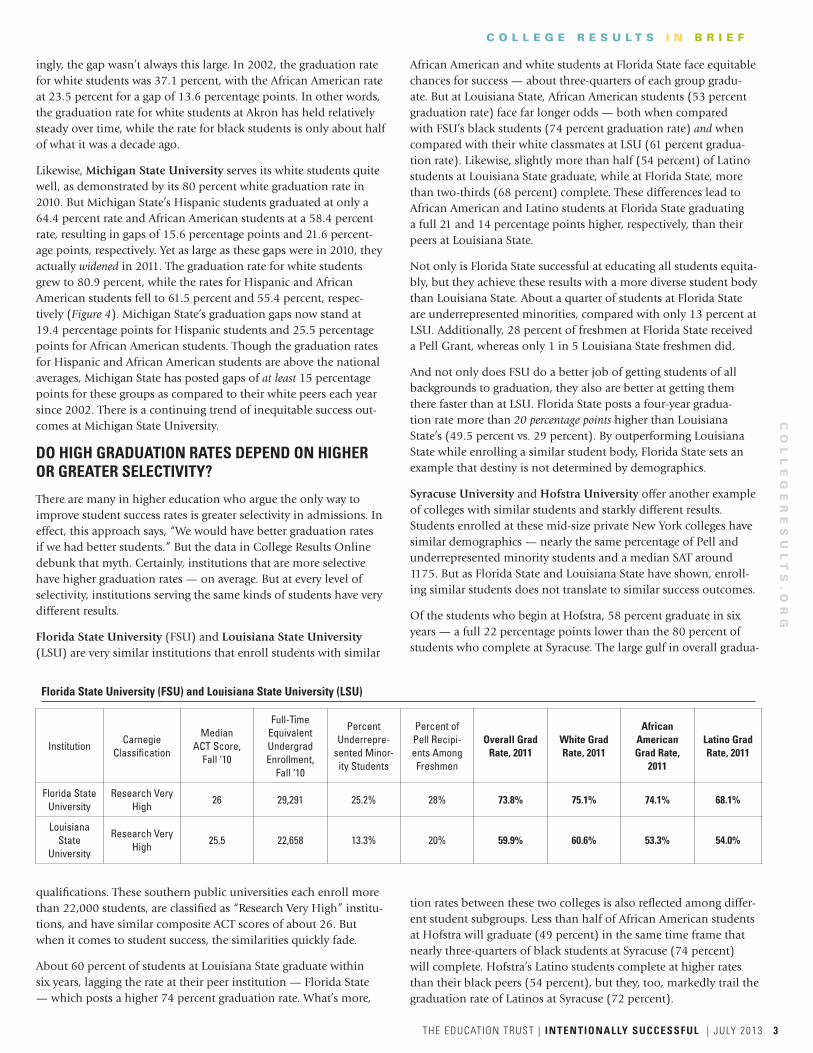
Florida State University (FSU) and Louisiana State University (LSU) are very similar institutions that enroll students with similar
qualifications. These southern public universities each enroll more than 22,000 students, are classified as “Research Very High” institu-tions, and have similar composite ACT scores of about 26. But when it comes to student success, the similarities quickly fade.
About 60 percent of students at Louisiana State graduate within six years, lagging the rate at their peer institution — Florida State — which posts a higher 74 percent graduation rate. What’s more,
African American and white students at Florida State face equitable chances for success — about three-quarters of each group gradu-ate. But at Louisiana State, African American students (53 percent graduation rate) face far longer odds — both when compared with FSU’s black students (74 percent graduation rate) and when compared with their white classmates at LSU (61 percent gradua-tion rate). Likewise, slightly more than half (54 percent) of Latino students at Louisiana State graduate, while at Florida State, more than two-thirds (68 percent) complete. These differences lead to African American and Latino students at Florida State graduating a full 21 and 14 percentage points higher, respectively, than their peers at Louisiana State.
Not only is Florida State successful at educating all students equita-bly, but they achieve these results with a more diverse student body than Louisiana State. About a quarter of students at Florida State are underrepresented minorities, compared with only 13 percent at LSU. Additionally, 28 percent of freshmen at Florida State received a Pell Grant, whereas only 1 in 5 Louisiana State freshmen did.
And not only does FSU do a better job of getting students of all backgrounds to graduation, they also are better at getting them there faster than at LSU. Florida State posts a four-year gradua-tion rate more than 20 percentage points higher than Louisiana State’s (49.5 percent vs. 29 percent). By outperforming Louisiana State while enrolling a similar student body, Florida State sets an example that destiny is not determined by demographics.
Syracuse University and Hofstra University offer another example of colleges with similar students and starkly different results. Students enrolled at these mid-size private New York colleges have similar demographics — nearly the same percentage of Pell and underrepresented minority students and a median SAT around 1175. But as Florida State and Louisiana State have shown, enroll-ing similar students does not translate to similar success outcomes.
Of the students who begin at Hofstra, 58 percent graduate in six years — a full 22 percentage points lower than the 80 percent of students who complete at Syracuse. The large gulf in overall gradua-
tion rates between these two colleges is also reflected among differ-ent student subgroups. Less than half of African American students at Hofstra will graduate (49 percent) in the same time frame that nearly three-quarters of black students at Syracuse (74 percent) will complete. Hofstra’s Latino students complete at higher rates than their black peers (54 percent), but they, too, markedly trail the graduation rate of Latinos at Syracuse (72 percent).
Florida State University (FSU) and Louisiana State University (LSU)
InstitutionCarnegie
Classification
Median ACT Score,
Fall ‘10
Full-Time Equivalent Undergrad Enrollment,
Fall ‘10
Percent Underrepre-
sented Minor-ity Students
Percent of Pell Recipi-ents Among Freshmen
Overall Grad Rate, 2011
White Grad Rate, 2011
African American Grad Rate,
2011
Latino Grad Rate, 2011
Florida State University
Research Very High
26 29,291 25.2% 28% 73.8% 75.1% 74.1% 68.1%
Louisiana State
University
Research Very High
25.5 22,658 13.3% 20% 59.9% 60.6% 53.3% 54.0%

The Education Trust is grateful to the Lumina Foundation for generously supporting our work. The views expressed in this publication are those of the author and the Education Trust and do not necessarily represent those of the Lumina Foundation, its officers, or employees.
ABOUT THE EDUCATION TRUST
The Education Trust promotes high academic achievement for all students at all levels — pre-kindergarten through college. We work alongside parents, educators, and community and business leaders across the country in transforming schools and colleges into institutions that serve all students well. Lessons learned in these efforts, together with unflinching data analyses, shape our state and national policy agendas. Our goal is to close the gaps in opportunity and achievement that consign far too many young people — especially those who are black, Latino, American Indian, or from low-income families — to lives on the margins of the American mainstream.
1250 H STREET, NW, SUITE 700 , WASHINGTON, D .C . 20005
P 202-293-1217 F 202-293-2605 WWW.EDTRUST. ORG
The high achievement and student success rate at Syracuse is com-mendable, but even more so because it has been sustained during a period of increasing student body diversity. Between 2002 and 2011, Syracuse expanded its Pell enrollment from 19 percent to 25 percent among freshmen (Figure 5). It increased its percentage of underrepresented minority students from 10.1 percent to 16.8 per-cent (Figure 6). And alongside its increase in student body diversity, Syracuse improved its graduation rates for white, African American, and Latino students.
CONCLUSION
If more colleges act on lessons from their faster gaining peers — such as UNC-Greensboro, Stony Brook, and Northeastern — far more will be successful in improving graduation rates for all students and closing long-standing gaps between minority students and their white classmates. As we have seen at Florida State and Syracuse, success isn’t predicated on tonier demographics or more selective admission standards. Widespread improvement takes attention to proven practices, determination, and resources. A groundswell of committed institutions could accelerate national graduation rates to new and higher levels for all students and help remedy racial and socioeconomic inequities in education and beyond.
NOTES1. The Department of Education collects graduation rates based on 150
percent of the intended length of a degree program. For a bachelor’s degree, that’s a six-year period. Six-year graduation rates are the standard measure of student success by the federal Department of Education.
2. There is a lag between when colleges collect data, when they are submit-ted to the federal Department of Education, and when the data are made public. Data for 2011 are the most current available.
3. Mary Nguyen, Erin Ward Bibo, and Jennifer Engle, “Advancing to Completion: Increasing Degree Attainment by Improving Graduation Rates and Closing Gaps for African American Students,” (Washington, D.C.: The Education Trust, 2012), http://www.edtrust.org/sites/edtrust.org/files/Advancing_AfAm.pdf; Mary Nguyen, Erin Ward Bibo, and Jennifer Engle, “Advancing to Completion: Increasing Degree Attainment by Improving Graduation Rates and Closing Gaps for Hispanic Students,” (Washington, D.C.: The Education Trust, 2012), http://www.edtrust.org/sites/edtrust.org/files/Advancing_Hisp.pdf; Mamie Lynch and Jennifer Engle, “Big Gaps, Small Gaps: Some Colleges and Universities Do Better Than Others in Graduating African American Students,” (Washington, D.C.: The Education Trust, 2010), http://www.edtrust.org/sites/edtrust.org/files/publications/files/CRO%20Brief-AfricanAmerican.pdf; Mamie Lynch and Jennifer Engle, “Big Gaps, Small Gaps: Some Colleges and Universities Do Better Than Others in Graduating Hispanic Students,” (Washington, D.C.: The Educa-tion Trust, 2010), http://www.edtrust.org/sites/edtrust.org/files/publica-tions/files/CRO%20Brief-Hispanic.pdf
Syracuse University and Hofstra University
InstitutionCarnegie
Classification
Median ACT Score,
Fall ‘10
Full-Time Equivalent Undergrad Enrollment,
Fall ‘10
Percent Underrepre-
sented Minor-ity Students
Percent of Pell Recipi-ents Among Freshmen
Overall Grad Rate, 2011
White Grad Rate, 2011
African American Grad Rate,
2011
Latino Grad Rate, 2011
SyracuseUniversity
Research High 1165 13,736 16.8% 25% 80.2% 82.0% 73.6% 72.2%
Hofstra University
Doctoral/Re-search
1185 6,999 17.8% 24% 57.9% 60.4% 49.4% 53.8%