Embed Size (px)
Citation preview
Improving Insight and Decision Making Using Microsoft Business Intelligence and SQL Server 2008Rafal LukawieckiStrategic Consultant, Project Botticelli Ltd

2
Objectives
• Overview BI and PM
• Technology Platform
• Introduce fundamental BI concepts
The information herein is for informational purposes only and represents the opinions and views of Project Botticelli and/or RafalLukawiecki. The material presented is not certain and may vary based on several factors. Microsoft makes no warranties, express,implied or statutory, as to the information in this presentation.
Portions © 2009 Project Botticelli Ltd & entire material © 2009 Microsoft Corp. Some slides contain quotations from copyrightedmaterials by other authors, as individually attributed or as already covered by Microsoft Copyright ownerships. All rights reserved.Microsoft, Windows, Windows Vista and other product names are or may be registered trademarks and/or trademarks in the U.S.and/or other countries. The information herein is for informational purposes only and represents the current view of Project BotticelliLtd as of the date of this presentation. Because Project Botticelli & Microsoft must respond to changing market conditions, it shouldnot be interpreted to be a commitment on the part of Microsoft, and Microsoft and Project Botticelli cannot guarantee the accuracy ofany information provided after the date of this presentation. Project Botticelli makes no warranties, express, implied or statutory, as tothe information in this presentation. E&OE.
This seminar is based on a number of sources including a few dozen of Microsoft-owned presentations, used with permission. Thank you to Marin Bezic, Kathy Sabourin, Aydin Gencler, Bryan Bredehoeft, and Chris Dial for all the support. Thank you to Maciej Pilecki for assistance with demos.

3
Overview of BI and PM
4
Business IntelligenceBI - Improving Business Insight
“A broad category of applications and technologies for gathering, storing, analyzing, sharing and providing access to data to help enterprise users make better business decisions.”– Gartner

5
What is Performance Management? PM & MAP
Processes, methodologies, and technologies used by enterprises to monitor, analyze, and plan
(MAP)
business performance.

6
BI in an Enterprise

7
“Companies in the top quartile in terms of their BPM practices … generate 2.4 times the three-year total shareholder return of the typical company in their industry”
Hackett Group, reported in Business Performance Management Magazine, February 2007
BI and PM - Opinions
“Business Intelligence (BI) is the #1 technology priority for CIO’s to deliver on in 2009.”
Gartner EXP Worldwide Survey, January, 2009
50% of large companies “believe that a gap exists between their company's ability to formulate and communicate sound strategies and its success at implementing them.”
OnPoint Consulting, reported in Business Finance Magazine, November 2006
8
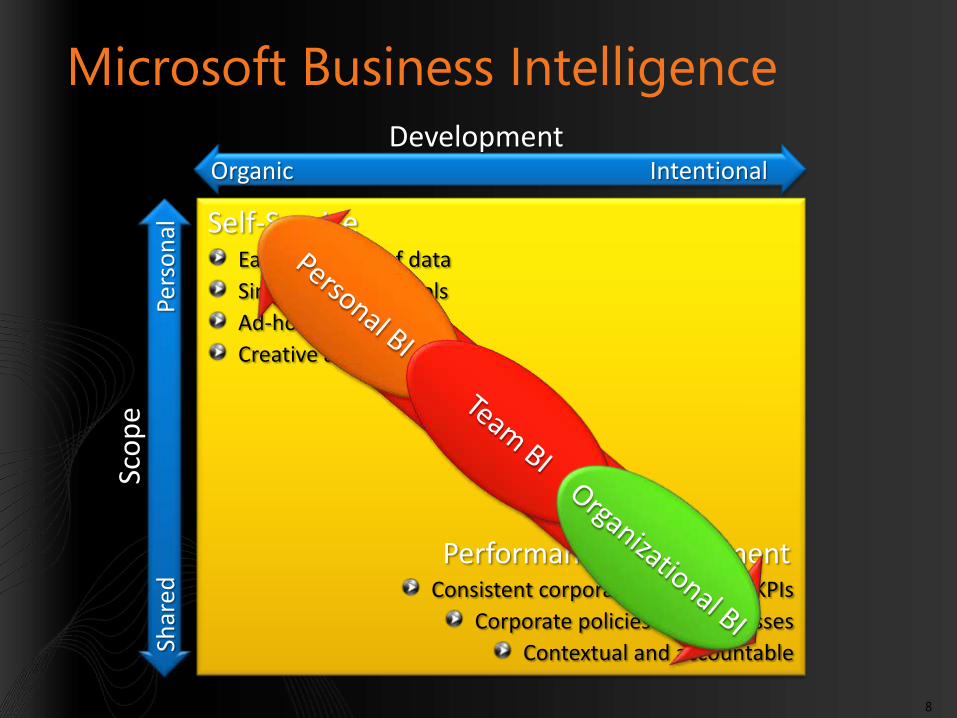
Microsoft Business Intelligence
Shar
edPe
rso
nal
Sco
pe
Organic IntentionalDevelopment
Self-Service
Performance Management
Easy discovery of data
Simple, intuitive tools
Ad-hoc
Creative and agile
Consistent corporate definitions, KPIs
Corporate policies and processes
Contextual and accountable

9
Three Contexts of BI Use
Personal BIBuilt by me, for me, used only by me
Team BIBuilt by someone on the team, for the team’s use
Organizational BI Built and maintained by IT, for use across company
1
2
3

10
Technology Platform

11
Integrated BI Platform
12
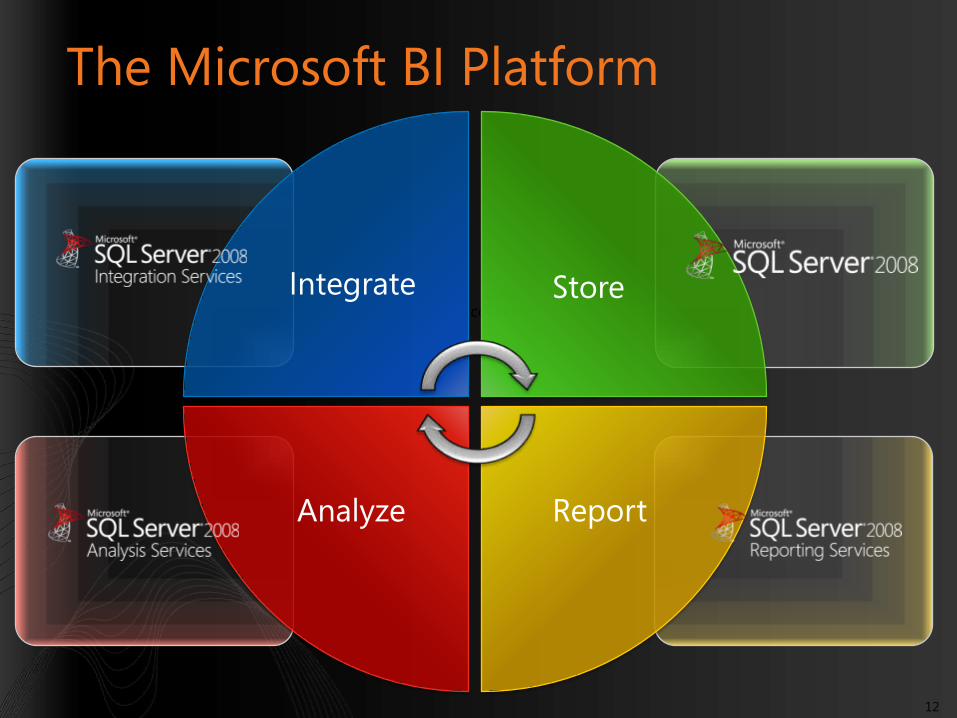
The Microsoft BI Platform
Integrate Store
ReportAnalyze

13
Fundamental Concepts

14
BI & PM in an Enterprise
Data Sources
Staging Area
Manual
Cleansing
Data Marts
Data Warehouse
Client
Access
Client
Access
1: Clients need access to data2: Clients may access data sources directly3: Data sources can be mirrored/replicated to reduce contention4: The data warehouse manages data for analyzing and reporting5: Data warehouse is periodically populated from data sources6: Staging areas may simplify the data warehouse population7: Manual cleansing may be required to cleanse dirty data8: Clients use various tools to query the data warehouse9: Delivering BI enables a process of continuous business improvement

15
Silos of Data
Data Warehouse
Call Center
Web Apps
Inventory
ERPHR
Finance
CRM

16
Source Systems
• Process real-time transactions
• Contain data structures optimized for modifications
• Normalized schema
• Usually provide limited decision support
• Are commonly referred to as:
• Online transaction processing (OLTP) systems
• Operational systems
HR Finance Inventory

17
Data Warehouse Characteristics
• Provides data for business analysis processes
• Grouped in subject-specific stores called Data Marts
• Optimized for rapid ad hoc information retrieval
• Integrates data from heterogeneous source systems
• Provides a consistent historical data store

18
ETL: Extract, Transform, and Load
1. Extract data from the source systems
2. Transform the data to convert it to a desired state
3. Load the data into the data warehouse
ETL
19
Data IntegrationMore than Just ETL
• Transform corporate data into meaningful and actionable information
• Challenges
• Retrieve and merge data from multiple sources
• Cleanse and transform the data
• Load the data into appropriate data stores for analysis and reporting
• Enterprises spend 60%–80% of their BI resources in the data integration stage

20
Dimensions and FactsBasis of All BI
• Fact – something that happened
• Sale, purchase, shipping...
• Transaction or an event
• Verb
• Essentially a Measure
• Dimension – describes a fact
• Customer, product, account...
• Object
• Noun
• A fact (measure) is expressed in terms of dimensions
• 16 Bamborginis sold to John on 20090115.

21
Dimensions
• Describe business entities
• Contain attributes that provide context to numeric data
• Present data organized into hierarchies

22
Predictive Analysis
Presentation Exploration Discovery
Passive
Interactive
Proactive
Role of Software
Business Insight
Canned reporting
Ad-hoc reporting
OLAP
Data mining
Predictive Analysis

23
Data Mining
• Discovery of (very) hidden patterns in mountains of data
• Correlation search engine
• Recent combination of statistics, probability analysis, database technologies, machine learning, and AI

24
OLAP or Multidimensional Data
• Online Analytical Processing = Multidimensional Data
• Measures and Dimensions
• Uses a calculation engine for fast, flexible transformation of base data (such as aggregates)
• Supports discovery of business trends and statistics not directly visible in data warehouse queries

25
Cube (UDM)Unified Dimensional Model
• Combination of measures (from facts) and dimensions as one conceptual model
• Rich data model enhanced by
• Calculations
• Key Performance Indicators (KPIs)
• Actions
• Perspectives
• Translations
• Partitions
• Formally, cube is called a UDM

26
Querying a Simple Cube
N/A
Q1
Q2
Q3
Measures Dimension
Sal
es T
errit
ory
Q4
Pacific
Europe
North America
N/A
Q1
Q2
Q3
Measures Dimension
Sal
es T
errit
ory
Q4
Pacific
Europe
North America
N/A
Q1
Q2
Q3
Measures Dimension
Sal
es T
errit
ory
Q4
Pacific
Europe
North America
N/A
Q1
Q2
Q3
Measures Dimension
Sal
es T
errit
ory
Q4
Pacific
Europe
North America
N/A
Q1
Q2
Q3
Measures Dimension
Sal
es T
errit
ory
Q4
Pacific
Europe
North America
5,005,000
What sales did we expect to achieve in North America for CY 2004 Q1?

27
Key Performance Indicator (KPI)
• Quantifiable measurement comparing business performance to goals
• Measure of overall organizational health when combined into a collection for a business scorecard
• Three main ways to build KPIs:• Using OLAP (cubes)
• Directly in PerformancePoint Server
• Using data mining (predictive KPI)

28
KPI Characteristics
• Value
• Goal
• Status
• Trend

29
Dashboards and Scorecards
• Scorecard
• Table (pivot-like) of KPIs
• Dashboard
• Contains scorecards, reports, and other analytical visualisations

30
Conclusions
31
Microsoft BI and PM Solutions At:www.microsoft.com/casestudies
32
Summary
• Business Intelligence and Performance Management are the top IT priorities for businesses
• Data warehousing, analytics, presentation, and interactive use
• Rich conceptual design that makes quick and easy self-service BI applications possible

33
© 2009 Microsoft Corporation & Project Botticelli Ltd. All rights reserved.
The information herein is for informational purposes only and represents the opinions and views of Project Botticelli and/or Rafal Lukawiecki. The materialpresented is not certain and may vary based on several factors. Microsoft makes no warranties, express, implied or statutory, as to the information in thispresentation.
Portions © 2009 Project Botticelli Ltd & entire material © 2009 Microsoft Corp. Some slides contain quotations from copyrighted materials by other authors,as individually attributed or as already covered by Microsoft Copyright ownerships. All rights reserved. Microsoft, Windows, Windows Vista and otherproduct names are or may be registered trademarks and/or trademarks in the U.S. and/or other countries. The information herein is for informationalpurposes only and represents the current view of Project Botticelli Ltd as of the date of this presentation. Because Project Botticelli & Microsoft mustrespond to changing market conditions, it should not be interpreted to be a commitment on the part of Microsoft, and Microsoft and Project Botticellicannot guarantee the accuracy of any information provided after the date of this presentation. Project Botticelli makes no warranties, express, implied orstatutory, as to the information in this presentation. E&OE.