Embed Size (px)
Citation preview
Improving Healthcare Outcomes and Managing Costs
Final Report and Recommendations of the State Health Benefits Quality and Value Task Force
CONFIDENTIAL AND PROPRIETARY
1
Contents
Foreward ....................................................................................................................................... 2
Executive summary ................................................................................................................... 5 Near-term opportunities identified in the interim report......................................................... 5 Recommendations for longer-term opportunities .................................................................... 6 Potential for quality improvements and cost savings ............................................................... 7 Resources required to pursue the strategies .............................................................................. 8
Methodology behind the recommendations ................................................................... 10
I. Primary care and care coordination ............................................................................. 10 A. Value-based payment for advanced primary care ................................................................... B. Direct contracting for primary care ..................................................................................... 13 C. Helping members navigate their benefits and healthcare system ......................................15
II. Behavioral health ............................................................................................................... 16 A. Integration of behavioral health and primary care .............................................................. 17 B. Direct contracting with providers of behavioral health ...................................................... 18 C. Behavioral health workforce development .......................................................................... 22
III. Specialty care ..................................................................................................................... 22 A. Reference-based pricing ....................................................................................................... 24 B. Centers of excellence ............................................................................................................. 26 C. Episode-based payment ........................................................................................................ 27
Moving forward ........................................................................................................................ 29
Appendix...................................................................................................................................... 31 Members of the State Health Benefits Quality and Value Task Force.................................... 31 Executive Order No. 31.............................................................................................................. 32
2
FOREWARD The State Health Benefits Quality and Value Task Force began our work in June 2018. At that time and until spring of 2020, New Jersey enjoyed a period of moderate but sustained economic growth, measured in both increased employment as well as increased tax revenue to the State and local municipalities.1 Nonetheless, our work progressed amidst speculation among many economists regarding a possible recession in the near-term that could reverse improvements in the economy. As a Task Force and as individuals, we understood the importance of identifying opportunities to improve the efficiency of our State Health Benefits programs, as necessary to mitigate the potential that continued growth in benefits expenses might otherwise erode the State’s ability to fund increases in employee wages, minimize levels of premium and cost sharing or make critical investments in education, infrastructure, or vital social services.
The Task Force began this process long before the public health and economic crisis we now find ourselves in, as a consequence of the COVID-19 pandemic. As of February 23rd, more than 2.4 million lives have been lost to COVID-19 worldwide, including more than 500,000 in the United States.2 As of February 23rd, New Jersey ranks 6th among states in total deaths (22,858) and 2nd in deaths per capita (276 per 100,000 population).3 About 685,000 New Jerseyans have been confirmed to have COVID-19.4
As a result of COVID-19, as well as restrictions on social and economic activity undertaken in response the pandemic, New Jersey’s unemployment rate increased from 3.7% in March to 16.6% in June.5 New Jersey raised over $4.2 billion based on its projected revenue shortfall in November, and incurred extraordinary costs due to COVID-19, including increases in unemployment insurance claims; expenditures for COVID-19 testing, contact tracing, and other aspects of our public health response; as well as increases in Medicaid and other social services, among other factors. While New Jersey seeks to maximize funding from federal relief programs, state agencies are also actively looking for opportunities to reduce spending to address the fiscal difficulties caused by COVID-19. These circumstances only serve to reinforce the importance of improving the efficiency of our State Health Benefits programs.
The public health impact of the pandemic extends well beyond those infected with the COVID-19 virus. Those with chronic medical conditions are not only at higher risk of complications arising from COVID-19, even if they avoid infection, many are at greater risk of acute exacerbations of their medical conditions due to delays or disruptions to routine management of their chronic conditions this spring, based on reduced availability of primary care and/or fear of accessing care out of concern for the possibility of COVID-19 infection. Anxiety over the possible financial and/or health
1 U.S. Bureau of Labor Statistics. 2 Johns Hopkins University. 3 U.S. Centers for Disease Control and Prevention. 4 State of New Jersey COVID-19 Information Hub. 5 U.S. Bureau of Labor Statistics.
3
consequences of COVID-19 and increased social isolation have placed all New Jerseyans at increased risk of stress-related illness, mental health challenges, and misuse of alcohol and other substances. While the impact of these trends on our State Health Benefits Program is not yet fully known, we expect it could be significant given the early and continuing impact of the pandemic on New Jersey, to say nothing of the extraordinary stress placed on first responders, healthcare providers and the social safety net, school teachers and staff, and other essential workers among the members served by our benefits programs.
None of the solutions contemplated by the Task Force, including those recommended in the pages that follow, could have prevented the rapid spread of the virus that we experienced this past year. However, the solutions recommended in the pages that follow – if fully adopted and well executed – could mitigate the impact of future public health emergencies on members of our health benefits programs, by increasing availability, accessibility, and continuity of care—particularly primary care and behavioral health.
We also recognize the overwhelming strain that the pandemic has placed on our acute care system – notably our hospitals. The Task Force joins other voices in commending our healthcare providers for the extraordinary determination, professionalism, and compassion with which they have helped our community to navigate the effects of the virus. Many of our hospital systems now face significant financial strain, based in part on the shift in patient mix from higher-margin elective procedures to lower-margin medical care including for COVID-19 patients; financial stress that may be further exacerbated for months (or years) to come as the pandemic- induced recession disrupts families’ employment and health insurance coverage arrangements.
In the context of immediate financial strain on many of our healthcare facilities, it may be at first counter-intuitive that the Task Force would recommend a move toward value-based payment (or incentives) for specialized services as outlined in this report. In fact, the Task Force fully embraces the need for financial support to hospitals and nursing homes adversely impacted by COVID-19. Nonetheless, we continue to see need for long-term term improvements in hospital efficiency, as well as incentives for members and referring physicians to give preference to hospitals or alternative sites of care that can deliver high quality at a lower cost and for all healthcare delivery organizations to improve. We hope that the recommendations for improvements in specialty care may be seen in this light, as complementary to, rather than competing with, federal and state relief programs meant to mitigate the direct financial impact of COVID-19.
Finally, we recognize that the solutions outlined in the pages that follow may be, on their own, insufficient to fully mitigate the near-term fiscal pressures arising from the COVID-19 pandemic. Undoubtedly, others will continue to propose solutions that promise greater savings based on reductions in benefits and/or payment levels to providers. We hope that there may be reduced need for the use of such blunt-object approaches, to the extent that our health benefits programs adopt solutions such as
4
those recommended by the Task Force, which combine improvements in efficiency with sustained or improved access to high-quality care.
The Task Force recognizes the urgency, now more than ever, to explore and embrace the opportunities presented in this report. Our state continues to reel from the health and economic impact of the pandemic, and our public workforce has been on the front lines of this crisis in many ways. It will take time to fully understand the health impacts of the pandemic, both mental and physical, on our plan members. This report recognizes the challenges we find ourselves in, and the key recommendations which promote accessibility and affordability in primary care, behavioral health and specialty case will move us toward a stronger and fairer New Jersey.
5
Improving Healthcare Outcomes and Managing Costs Final report and recommendations of the State Health Benefits Quality and Value Task Force
EXECUTIVE SUMMARY The State Health Benefits Program (SHBP) and the School Employees’ Health Benefit Program (SEHBP) provide healthcare coverage to State employees, retirees and eligible dependents as well as to the employees, retirees and eligible dependents of local governments and school districts that have elected to purchase coverage through the plans. Together, SHBP and SEHBP covered approximately 781,000 people at a cost to the State and local participating employers of about $5.79 billion in 2019. The State of New Jersey spent about 8.4% of its budget on these programs, or about $3.2 billion in 2019. In June 2018, Governor Phil Murphy signed Executive Order No. 31 creating the State Health Benefits Quality and Value Task Force. The Executive Order noted that the State government, local governments, and schools deserve health care coverage that delivers quality health outcomes and good value for plan members and taxpayers. The Governor charged the Task Force with undertaking a comprehensive review of public employee and retiree health benefits programs. The Task Force is comprised of State leaders, academic experts, labor leaders, and employer representatives (see Appendix).
As part of its review, the Task Force identified near-term strategies (published in an interim report) and long-term strategies (the focus of this report) that could significantly improve health outcomes and better manage the costs of employee and retiree health benefits.
Near-term opportunities identified in the interim report In December 2018, the State Health Benefits Task Force identified actionable recommendations to improve the contracting and management of SHBP and SEHBP. These Task Force recommendations focused on changes to the third-party administrator (TPA) contract in order to:
■ Support innovation to improve health outcomes and costs;
6
■ Improve contractor accountability;
■ Prioritize quality;
■ Ensure access to care; and
■ Use data and analytics to improve outcomes and reduce costs.
Since the publication of that report, the New Jersey Division of Pensions and Benefits, the SHBP and the SEHBP Commissions and Plan Design Committees have undertaken important changes, including:
■ Re-procurement of the TPA contract, which now includes: best-in-class pricing guarantees; clinical and engagement metrics; and increased transparency tools meant to improve contractor accountability and provide the Division with the data it needs to improve outcomes and reduce costs;
■ Personal and digital engagement tools to help members navigate their benefits and the health care delivery system, in order to improve access, outcomes and costs;
■ Changes in reimbursement for out-of-network care, including pricing indexed relative to Medicare for certain plans, and improved processes to ensure pre- and post-payment integrity for out-of-network claims; and
■ Re-procurement of the Pharmacy Benefit Manager Contract through a reverse auction platform, which now includes improved accountability, vendor transparency, and opportunities to address future cost drivers.
The New Jersey Division of Pension and Benefits elected not to implement the Task Force recommendation on unbundling management of the network management function from the claims administration function that had been merged in previous TPA contracts. Consistent with the recommendation of the Task Force, however, the new TPA contract provides the flexibility for SHBP/SEHBP to pilot multiple delivery system reforms, including continuation of the Direct Primary Care pilot as well as initiation of the First Responders Primary Care Medical Home pilot, among other reforms such as those contemplated in our final recommendations that follow.
Recommendations for longer-term opportunities Building on the interim short-term findings, the Task Force evaluated many long-term opportunities by reviewing programs and case examples from other plans against eight criteria detailed in the methodology section. Based on this assessment, the Task Force recommends nine strategies for long-term improvement in quality and value, organized into three thematic areas: (I) Primary care and care coordination; (II) Behavioral health; and (III) Specialty care.
7
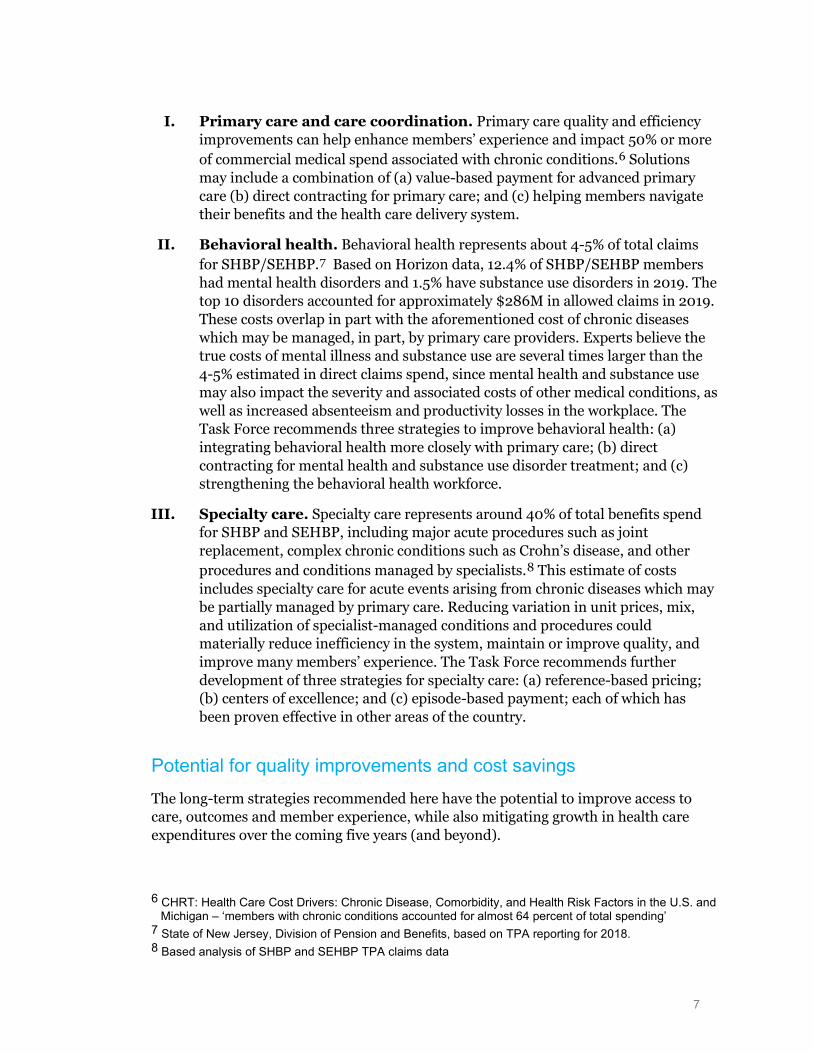
I. Primary care and care coordination. Primary care quality and efficiency improvements can help enhance members’ experience and impact 50% or more of commercial medical spend associated with chronic conditions.6 Solutions may include a combination of (a) value-based payment for advanced primary care (b) direct contracting for primary care; and (c) helping members navigate their benefits and the health care delivery system.
II. Behavioral health. Behavioral health represents about 4-5% of total claims for SHBP/SEHBP.7 Based on Horizon data, 12.4% of SHBP/SEHBP members had mental health disorders and 1.5% have substance use disorders in 2019. The top 10 disorders accounted for approximately $286M in allowed claims in 2019. These costs overlap in part with the aforementioned cost of chronic diseases which may be managed, in part, by primary care providers. Experts believe the true costs of mental illness and substance use are several times larger than the 4-5% estimated in direct claims spend, since mental health and substance use may also impact the severity and associated costs of other medical conditions, as well as increased absenteeism and productivity losses in the workplace. The Task Force recommends three strategies to improve behavioral health: (a) integrating behavioral health more closely with primary care; (b) direct contracting for mental health and substance use disorder treatment; and (c) strengthening the behavioral health workforce.
III. Specialty care. Specialty care represents around 40% of total benefits spend for SHBP and SEHBP, including major acute procedures such as joint replacement, complex chronic conditions such as Crohn’s disease, and other procedures and conditions managed by specialists.8 This estimate of costs includes specialty care for acute events arising from chronic diseases which may be partially managed by primary care. Reducing variation in unit prices, mix, and utilization of specialist-managed conditions and procedures could materially reduce inefficiency in the system, maintain or improve quality, and improve many members’ experience. The Task Force recommends further development of three strategies for specialty care: (a) reference-based pricing; (b) centers of excellence; and (c) episode-based payment; each of which has been proven effective in other areas of the country.
Potential for quality improvements and cost savings The long-term strategies recommended here have the potential to improve access to care, outcomes and member experience, while also mitigating growth in health care expenditures over the coming five years (and beyond).
6 CHRT: Health Care Cost Drivers: Chronic Disease, Comorbidity, and Health Risk Factors in the U.S. and
Michigan – ‘members with chronic conditions accounted for almost 64 percent of total spending’ 7 State of New Jersey, Division of Pension and Benefits, based on TPA reporting for 2018. 8 Based analysis of SHBP and SEHBP TPA claims data
8
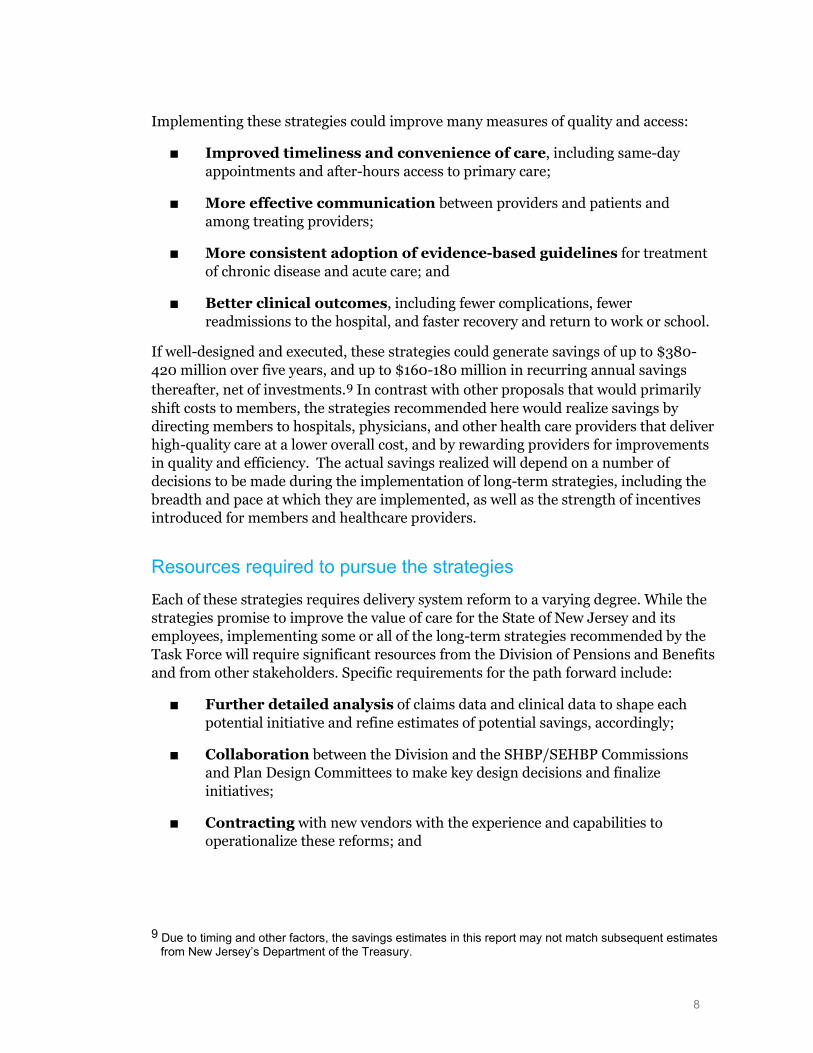
Implementing these strategies could improve many measures of quality and access:
■ Improved timeliness and convenience of care, including same-day appointments and after-hours access to primary care;
■ More effective communication between providers and patients and among treating providers;
■ More consistent adoption of evidence-based guidelines for treatment of chronic disease and acute care; and
■ Better clinical outcomes, including fewer complications, fewer readmissions to the hospital, and faster recovery and return to work or school.
If well-designed and executed, these strategies could generate savings of up to $380-420 million over five years, and up to $160-180 million in recurring annual savings thereafter, net of investments.9 In contrast with other proposals that would primarily shift costs to members, the strategies recommended here would realize savings by directing members to hospitals, physicians, and other health care providers that deliver high-quality care at a lower overall cost, and by rewarding providers for improvements in quality and efficiency. The actual savings realized will depend on a number of decisions to be made during the implementation of long-term strategies, including the breadth and pace at which they are implemented, as well as the strength of incentives introduced for members and healthcare providers.
Resources required to pursue the strategies Each of these strategies requires delivery system reform to a varying degree. While the strategies promise to improve the value of care for the State of New Jersey and its employees, implementing some or all of the long-term strategies recommended by the Task Force will require significant resources from the Division of Pensions and Benefits and from other stakeholders. Specific requirements for the path forward include:
■ Further detailed analysis of claims data and clinical data to shape each potential initiative and refine estimates of potential savings, accordingly;
■ Collaboration between the Division and the SHBP/SEHBP Commissions and Plan Design Committees to make key design decisions and finalize initiatives;
■ Contracting with new vendors with the experience and capabilities to operationalize these reforms; and
9 Due to timing and other factors, the savings estimates in this report may not match subsequent estimates
from New Jersey’s Department of the Treasury.
9
■ Investing in the Division’s capabilities to undertake the necessary analysis and conduct detailed design, implementation, and rigorous vendor management.
These activities are projected to require an investment of $8-10 million in the first year of implementation, assuming the SHBP/SEHBP were to adopt most (or all) of the recommendations outlined in the pages that follow. Additional investment would be necessary beyond the first year of implementation, but these investments are expected to be fully offset by same-year savings in the form of reduced health care claims costs.
10
METHODOLOGY BEHIND THE RECOMMENDATIONS The Task Force initially convened in July 2018 and met regularly through 2019. It has sought public input through its website and hosted three listening sessions with public employees, retirees and other stakeholders in Hamilton, Rutherford, and Mount Laurel. The Task Force used this input to identify a series of quickly actionable recommendations to improve the contracting and management of SHBP/SEHBP; these recommendations were outlined in the interim report published in December 2018.10
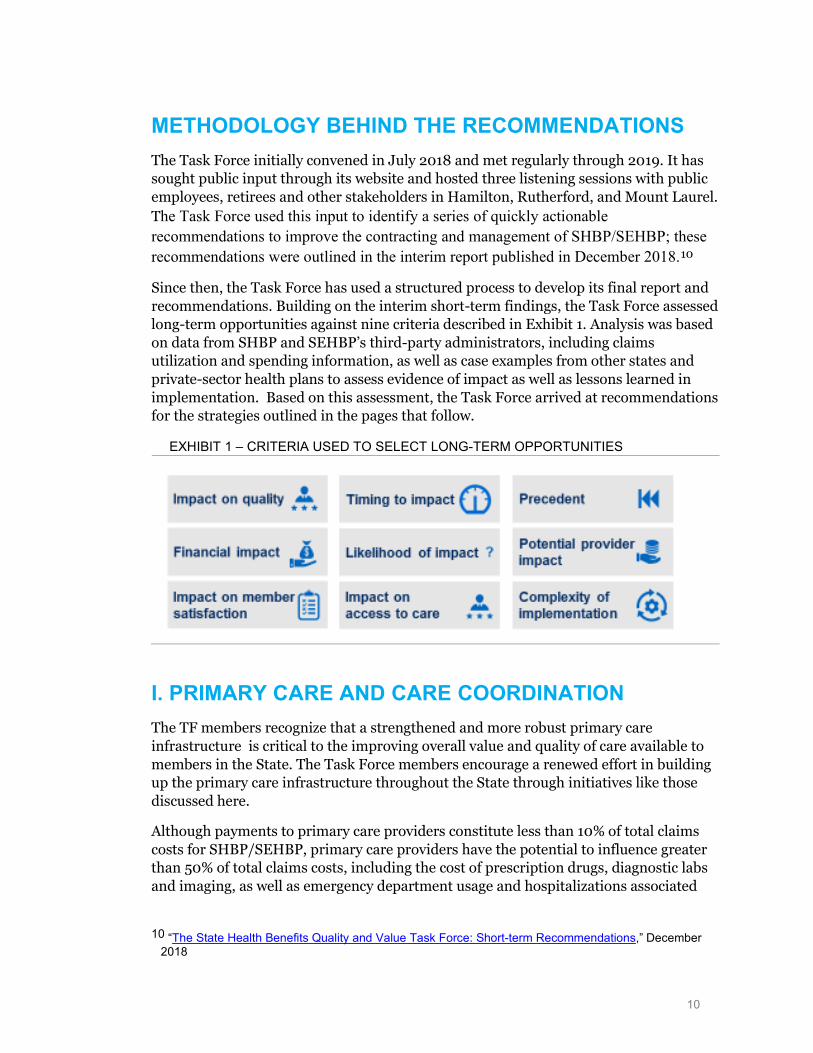
Since then, the Task Force has used a structured process to develop its final report and recommendations. Building on the interim short-term findings, the Task Force assessed long-term opportunities against nine criteria described in Exhibit 1. Analysis was based on data from SHBP and SEHBP’s third-party administrators, including claims utilization and spending information, as well as case examples from other states and private-sector health plans to assess evidence of impact as well as lessons learned in implementation. Based on this assessment, the Task Force arrived at recommendations for the strategies outlined in the pages that follow.
EXHIBIT 1 – CRITERIA USED TO SELECT LONG-TERM OPPORTUNITIES
I. PRIMARY CARE AND CARE COORDINATION The TF members recognize that a strengthened and more robust primary care infrastructure is critical to the improving overall value and quality of care available to members in the State. The Task Force members encourage a renewed effort in building up the primary care infrastructure throughout the State through initiatives like those discussed here.
Although payments to primary care providers constitute less than 10% of total claims costs for SHBP/SEHBP, primary care providers have the potential to influence greater than 50% of total claims costs, including the cost of prescription drugs, diagnostic labs and imaging, as well as emergency department usage and hospitalizations associated
10 “The State Health Benefits Quality and Value Task Force: Short-term Recommendations,” December
2018
11
with chronic medical conditions.11 Primary care providers also play an important role in referral to behavioral health providers and other specialists.
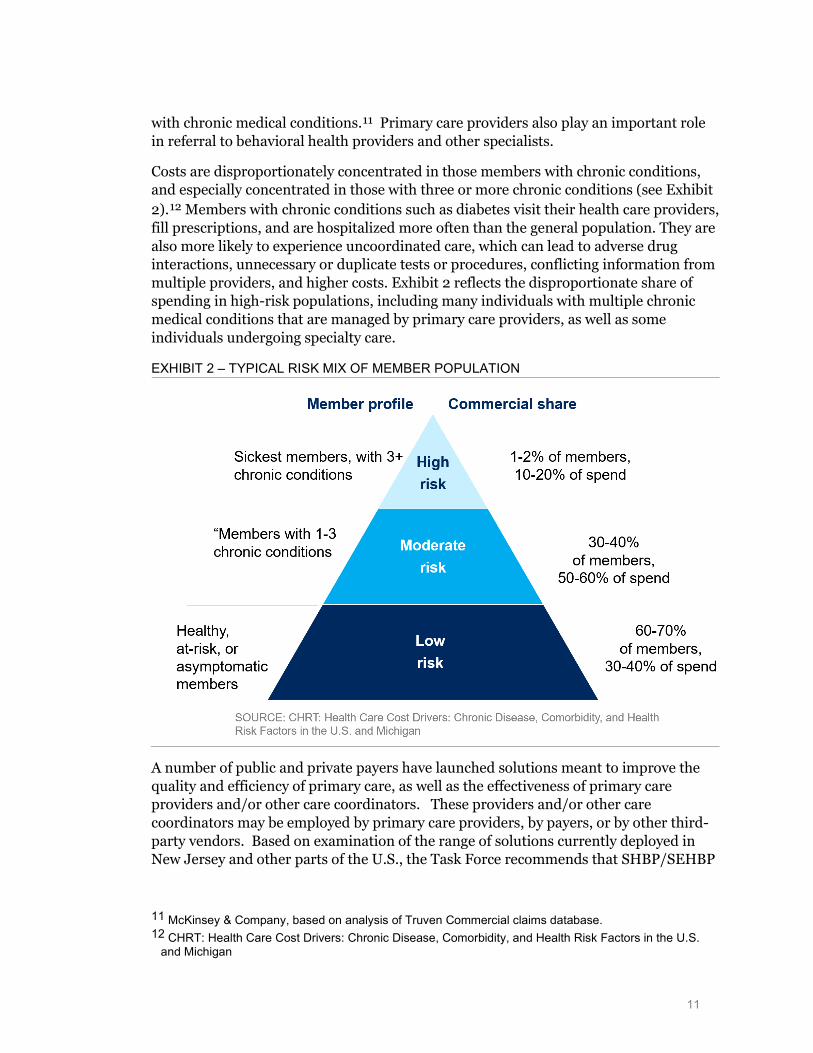
Costs are disproportionately concentrated in those members with chronic conditions, and especially concentrated in those with three or more chronic conditions (see Exhibit 2).12 Members with chronic conditions such as diabetes visit their health care providers, fill prescriptions, and are hospitalized more often than the general population. They are also more likely to experience uncoordinated care, which can lead to adverse drug interactions, unnecessary or duplicate tests or procedures, conflicting information from multiple providers, and higher costs. Exhibit 2 reflects the disproportionate share of spending in high-risk populations, including many individuals with multiple chronic medical conditions that are managed by primary care providers, as well as some individuals undergoing specialty care.
EXHIBIT 2 – TYPICAL RISK MIX OF MEMBER POPULATION
A number of public and private payers have launched solutions meant to improve the quality and efficiency of primary care, as well as the effectiveness of primary care providers and/or other care coordinators. These providers and/or other care coordinators may be employed by primary care providers, by payers, or by other third-party vendors. Based on examination of the range of solutions currently deployed in New Jersey and other parts of the U.S., the Task Force recommends that SHBP/SEHBP
11 McKinsey & Company, based on analysis of Truven Commercial claims database. 12 CHRT: Health Care Cost Drivers: Chronic Disease, Comorbidity, and Health Risk Factors in the U.S.
and Michigan
12
further test and (if there is evidence of effectiveness) scale three models for improving primary care and care coordination:
A. Value-based payments for advanced primary care
B. Direct contracting for advanced primary care
C. Member navigation (i.e., helping members navigate their benefits and healthcare system)
These solutions aim to transform primary care and chronic disease management through improvements to some or all of: (1) access and convenience, (2) adherence to evidence-based medicine, (3) patient engagement in between appointments, and (4) coordination among treating providers.
If well-designed and effectively implemented, these strategies could deliver up to $60 million in savings annually within five years, and significantly improve member satisfaction. However, if designed or implemented ineffectively, these strategies may not generate a meaningful return on investment. Several factors have historically impeded such strategies from reaching their full potential, some of which are operational, while others of which are related to the opportunities and challenges of impacting patient behavior. The issues that would need to be assessed and overcome as a precondition for scale include:
(1) lack of scale and working capital among small primary care providers (PCPs) in many communities.
(2) operational challenges for primary care providers to integrate member navigation and other care management processes in their practice workflows.
(3) limited ability of primary care providers or third-party navigation vendors to identify and engage with members at precisely the time when they are most at risk of an acute event and most willing to engage; and ultimately.
(4) difficulty influencing the behavior of members and/or treating clinicians.
Given these challenges, the Task Force recommends carefully staging investments in these three strategies so that results may be rigorously measured at each stage to allow for course corrections prior to scaling of any one strategy or program.
Based on measured results of these strategies over the next two to three years, SHBP/SEHBP may choose to differentially invest in one strategy or program to the exclusion of others. However, the plans may also choose to scale more than one of these three strategies, given their potential to serve different subsets of the SHBP/SEHBP populations.
13
B. Direct contracting for primary care Like many other states, New Jersey faces a shortage of primary care physicians and physician’s assistants.13 Partly in response to this shortage, SHBP/SEHBP launched a direct primary care pilot in 2016, which provided for an increased level of reimbursement to a select number of primary care providers, meant to support improvements in access to primary care for both minor acute conditions as well as for the treatment of high-risk populations with one or more chronic conditions. In 2019, capitation payments to providers participating in the Direct Primary Care Pilot were an estimated $5.1 million.
In 2019, the State also launched a request for proposals for the First Responders Pilot Program. Providers would offer comprehensive primary care services, including pharmacy, preventive care, episodic sick care, basic urgent care, disease management, medication management, behavioral health, pain management services, health and wellness coaching, immunizations, lab draws and collections, and coordinate care for comprehensive specialist, hospital and outpatient service.
The Direct Primary Care Pilot has, to date, experienced only modest uptake, with approximately 5,404 total members participating in the pilot (as of June, 2019). The limited number of members in these models has confounded meaningful measurement of return-on-investment. Anecdotally, low adoption has been attributed in part to limited member outreach, as well as a possible preference among many (or most) members to maintain their existing PCPs, absent any incentive to switch to one of the PCP groups participating in the pilot.
While greater scale may be necessary to definitively measure the return-on-investment of the Direct Primary Care Pilot, the Division of Pensions and Benefits has reviewed patterns of utilization of primary care for pilot participants which suggests the need for adjustments in the model as part of any plan for expansion. Specifically, under the current model design, members who have signed up with a Direct Primary Care Pilot provider are free to continue to seek primary care from PCPs with no consequence for continued payment of capitation rates to pilot providers. The Division’s analysis of claims data indicates that a considerable portion of pilot participants are in fact seeking care from other PCPs, potentially diluting any return-on-investment from the model.14 Under an alternative approach, pilot providers may only receive capitation payments if they demonstrate that they are able to engage with patients and fully meet their needs for primary care.
Out of interest in continuing to improve access to primary care for SHBP/SEHBP members, the Task Force recommends that SHBP/SEHBP continue to invest incrementally in Direct Contracting for Primary Care, in order to achieve the scale necessary to measure the success of these models and then make a determination of
13 “State-Level Projections of Supply and Demand for Primary Care Practitioners: 2013-2025,” November
2016, U.S. Department of Health and Human Services 14 State of New Jersey Division of Pensions and Benefits, based on analysis of claims data.
14
whether to further scale, modify, or discontinue these programs. However, based on both anecdotal experience with the pilot, to date, as well as analysis conducted by the Division, the Task Force qualifies its recommendation for pilot expansion with the suggestion that SHBP/SEHBP explore several immediate changes to the design and implementation of these programs in order to increase the potential for success: (1) increase the size of the pilot to a level sufficient to support analysis of quality improvement and cost savings; (2) set clear targets for quality improvement, and cost savings which must be met as preconditions for further scaling of these programs15; (2) improving coordination between the Division, TPA(s), and unions to support member outreach and enrollment; (3) improving data and analytics to support continuous improvement in marketing tactics and sharing such data ad analytics to DPCMH providers to enable both proactive patient care management and strategic growth planning; (4) changing the rules based on which patients are attributed to participating vendors, including more stringent requirements for members to seek care from DPCMH providers prior to those providers receiving capitation payments; ; and (5) incorporating risk-adjustment as another method to ensure that vendors have an incentive to attract and retain high-risk populations. Some Task Force members have also suggested the consideration of models whereby vendors are paid to exclusively focus on high-risk members.
The Task Force expects that direct contracting of primary care – if well-designed and executed – could yield significant savings for attributed populations. The Task Force observes three possible limitations or risks to this initiative, which should be carefully weighed in scaling of the existing pilots: (i) the anticipated preference of many members to remain with existing PCPs, especially high-risk populations under active treatment for one or more chronic conditions; and (ii) the need to fairly reimburse legacy PCP networks as well as Direct Primary Care providers based on outcomes achieved.
Estimates for the possible savings associated with direct primary care vary widely. Some vendors have described the potential to save more than 10% of total costs for attributed members. However, published data at this savings level is largely limited to self-reported case examples, with small population sizes and without adjustments for differences in risk of DPC and non-DPC populations. While there are few independent evaluations of the impact of DPC at scale, what studies have been published suggest
15 Because the number of members currently in the pilot are likely too small for total cost and outcomes
measures of quality to be statistically reliable, it may be necessary in the near-term to rely on proxies for cost efficiency and quality, such as the frequency of ED visits and hospitals admissions, as well as process measures of quality.
15
savings of up to 6% or as low as 0% savings or even an increase in spending.16,17,18 The upper end of this range (6%) represents material savings accompanying improvements in access to care. However, variability in the estimated impact of DPC models underscores the importance of careful examination of New Jersey’s Direct Primary Care pilot (following scaling to a level that would support analysis of total cost of care savings), to confirm whether the pilot is generating reductions in fee-for-service spending equal to or greater than DPC capitation payments.19
The Task Force observes three possible limitations or risks to this initiative, which should be carefully weighed in scaling of the existing pilots: (i) the anticipated preference of many members to remain with existing PCPs, especially high-risk populations under active treatment for one or more chronic conditions; and (ii) the potential for legacy PCP networks to feel threatened or frustrated by implied reimbursement differentials.
C. Helping members navigate their benefits and healthcare system As health benefits continue to evolve, many members – especially the chronically ill and most vulnerable – struggle to understand their options and navigate the healthcare system. The State has undertaken multiple initiatives to address the need of plan members for personalized navigation through the healthcare delivery system. These include: (1) Direct Primary Care providers, which are meant to serve in part as support for member navigation; (2) ombudspersons which could be deployed through public employee unions to support navigation; and (3) third-party vendors to whom a request for proposals for dedicated navigation and advocacy was issued this past summer, due for implementation in January 1, 2020. With respect to the latter of these three approaches, the State is following five main vendor partnership principles:
■ Delivery of superior service and attention during implementation and beyond, on an ongoing basis;
■ Cost effectiveness with accountability through performance and financial guarantees;
■ A focus on quality with outcomes-based navigation and advocacy that demonstrate strong, measurable outcomes and customer satisfaction;
16 Busch F, Grzeskowiak D, Huth E, Direct Primary Care: Evaluating a New Model of Delivery and
Financing, Society of Actuaries, May 2020. 17 Andelin J, Ronaldson EW, Direct Primary Care and its Impact on Healthcare Costs and Patient
Experience. 18 Musich, Shirley, Shaohung, Wang, Kevin, Hawkins, and Andrea, Klemes. 2016. The Impact of
Personalized Preventive Care on Health Care Quality, Utilization, and Expenditures. Population Health Management 19, no. 6:389–397.
19 For planning purposes, estimates for total potential savings from improvements in primary care described earlier in this report are based on achieving 3% net savings from Direct Primary Care.
16
■ Support for network, navigation and advocacy; and
■ Innovative data analytics to improve outcomes and manage costs.
In the coming months, it is anticipated that the Division for Pensions and Benefits will implement a new contract for member navigation. The Task Force recommends that clear goals be established for member engagement and effectiveness in supporting improvements in the quality of care, efficiency, and member experience. The Division should rigorously evaluate performance of any contracted vendor against these goals in order to support future re-evaluation of whether this approach should be scaled, modified, or discontinued in favor of other strategies as introduced above.
II. BEHAVIORAL HEALTH More than 45 million Americans struggle with mental illness, yet most lack access to adequate mental health treatment.20 Indeed, 57% of American adults with mental illness did not receive care in the last year, and nearly half of adults with mental health conditions have a co-occurring substance abuse disorder.21 The average costs of treating a patient with a chronic medical and comorbid mental health or substance use disorder is two to three times higher than treating a member without comorbid conditions.22
Behavioral health represents a key part of total claims for SHBP and SEHBP, but experts believe the true costs of mental illness and substance use are several times larger, since they include impacts on physical health, absenteeism and productivity in the workplace. Enhancing behavioral health access and quality is a priority for the Task Force, particularly given the increased prevalence of behavioral health conditions among first-responders: perhaps attributable to the extraordinary pressure of their jobs (30% of first responders develop behavioral health conditions including depression and posttraumatic stress disorder compared with 20% in the general population, according to national research).23
The behavioral health network represents a key opportunity for New Jersey. Based on our evaluation, the Task Force recommends three strategies:
A. Integration of behavioral health with primary care
B. Direct contracting with providers of behavioral health
20 “Mental Health Facts, Stats, and Data,” Mental Health America The State of Mental Health in America
2020 - 18.57 percent of adults are experiencing a mental illness 21 “The State of Mental Health in America 2018The,” State of Mental Health in America 2020 – 57.2
percent of adults with a mental illness receive no treatment 22 “Potential economic impact of integrated mental-behavioral health care: Updated projections for 2017,”
Milliman Research, January 2018 23 “What’s killing our medics? Ambulance Service Manager Program,” Abbot, C., Barber, E., Burke, B.,
Harvey, J., Newland, C., Rose, M., & Young, A., Reviving Responders, Conifer, Colo., 2015
17
C. Behavioral health workforce development
Improvements in access to behavioral health providers could generate savings of $5-10 million in each of the next five years by managing chronic medical conditions more effectively and relying less on costly out-of-network providers. These savings may be offset, however, by the diagnosis and treatment of behavioral health issues that would otherwise go undiagnosed or undertreated.
A. Integration of behavioral health and primary care Building on the models described in the primary care section, such as Direct Primary Care and other patient-centered medical homes, SHBP and SEHBP have a distinct opportunity to integrate and coordinate clinical care across core medical and behavioral health by offering, as an example, value-based payments and on a multi-payer basis.
Members’ behavioral health-related inpatient admissions and emergency department usage are highly influenced by effective care coordination, including transitions from hospital to home, that can reduce readmission rates.
SHBP and SEHBP could consider a range of approaches to integrating behavioral health solutions including:
■ Clinically integrating and coordinating primary care and behavioral health
■ Offering value-based payments to providers, who take responsibility for total cost and outcomes for an entire attributed population or an entire episode
■ Expanding benefits to reimburse behavioral health providers for care coordination
■ Improving transitions of care by communicating members’ needs more clearly and promptly across all sites of care
Case examples reveal many archetypes for integrating behavioral health and primary care:
■ Coordination or remote collaboration among clinicians: Providers practice separately but share basic information about each patient. Behavioral health providers may rely on telehealth to provide services and use vendors that enable collaboration and information exchange between primary care and behavioral health providers
■ Co-location of primary care and behavioral health clinicians: Providers work in the same facility, improving communication and hand-offs between primary care and behavioral health providers
■ Integration of primary and behavioral health into one care team: Behavioral health providers can be integrated into primary care, or primary care providers integrated into a behavioral health facility, to create a single
18
care plan for each patient with physical and behavioral health goals. The integrated care team delivers both behavioral and physical health services.
Some states have also gained traction with Medicaid value-based behavioral health models. New York, Massachusetts, Tennessee and Ohio, for example, have embedded behavioral health accountability metrics into their PCMH models.24 Other states have created specific population health models focused on behavioral health, such as health homes. As of April 2018, 22 states and the District of Columbia had adopted a total of 34 approved Medicaid health home models, which have enrolled more than a million beneficiaries.
The Task Force expects that integrating behavioral health and primary care may generate cost savings over the next five years with more effective management of chronic medical conditions. However, our recommendation to support the integration of behavioral health and primary care is motivated principally by the potential to improve diagnosis and treatment of behavioral health issues that might otherwise go undiagnosed or undertreated.
A. Value-based payment for advanced primary care Typical primary care fee-for-service (FFS) models reimburse providers for treating patients who seek care at an office appointment, but do not pay providers for proactively engaging members in between visits, most notably patients with known chronic conditions who nonetheless do not access care on a routine basis.
Primary care value-based payment models support patient engagement outside of traditional appointments, while also rewarding improvements in access (e.g., same-day appointment availability, extended hours), adherence to guidelines for evidence-based medicine, referral to high-performing specialists, and/or improved outcomes such as fewer complications leading to costly visits to the hospital.
In New Jersey and other parts of the U.S., we observe two predominant models to support more effective population health management:
■ The patient-centered medical home (PCMH) model typically includes the continuation of fee-for-service payments, supplemented with, a per-member-per-month fee for care coordination as well as bonus payments based on improvements in quality and efficiency; and
■ Accountable Care Organization (ACO) models, which offer participating providers a share of any savings gained when the total cost of care for patients is less than the expected amount while maintaining quality—this model being applicable either to independent physicians, or physicians organizing an ACO in combination with one or more hospitals.
24 CMS State by State Health Home Metrix
19
Most national health insurers as well as regional Blue Cross Blue Shield plans have experience with PCMH as well as with ACOs, including some within New Jersey. Many believe that PCMH’s have achieved improvements in quality of care and at a lower total cost of care. However, while claims of impact have been publicly documented, rigorous and independent analysis of outcomes is limited.
In New Jersey, Horizon Blue Cross Blue Shield launched its own PCMH model in 2012. Under the program, participating primary care practices that had achieved NCQA PCMH recognition were eligible to receive care coordination payments from Horizon in addition to fee-for-service reimbursement for patients under their care. Horizon BCBS’s PCMH program formally concluded in 2018 and other value-based payment models have evolved. Results from the PCHM program were generally favorable, according to Horizon. For example, according to 2017 results of the PCMH program, Horizon states that members engaged with a patient-centered practice experienced a 4% lower total cost of care trend, 4% lower rate of hospital inpatient admissions and a 7% higher rate of breast cancer screenings when compared to all commercial members. Formal health care savings rates and patient outcome metrics for the participating PCMH SHBP and SEHBP populations population are not available.
CareFirst, a commercial health insurer serving more than three million lives in Maryland, Washington, DC, and Northern Virginia, operates the nation’s largest PCMH program of its kind.25 Medical panels of 5 to 15 primary care providers coordinate member care and are accountable for the quality and cost outcomes of their pooled member populations. Any savings a panel achieves against the budget target is shared by the providers if the quality of care exceeds certain standards. For each panel, higher quality outcomes and greater cost savings produce greater rewards. CareFirst uses clinical and utilization indicators to generate a “core target list” of sick members who need care coordination and additional programming. CareFirst’s overall medical trend – a measure of annual total growth in all health care costs, including pharmacy – averaged 3.5 percent from 2013 to 2017, compared with an average of 7.5 percent per year in the five years prior. Emergency department visits fell by 7.3% and readmissions by more than 41%.
Blue Cross Blue Shield of Massachusetts, a commercial health insurer, has operated one of the longest-running ACO models, in the form of its Alternative Quality Contract. Populations included in the model experienced a lower rate of growth in healthcare spending, estimated at nearly 12% savings over an eight-year period, as well as improved quality of care.26 Atrius Health, a physician-led independent practice association (IPA) was among the ACOs participating in the Alternative
25 “CareFirst Patient-Centered Medical Home Program Nets $1.2 Billion in Savings Since 2011,” CareFirst
BlueCross BlueShield press release, June 27, 2018 26 NEJM report on Health Care Spending, Utilization, and Quality 8 Years into Global Payment;
https://www.nejm.org/doi/10.1056/NEJMsa1813621https://www.nejm.org/doi/10.1056/NEJMsa1813621 - ‘During the 8-year post-intervention period from 2009 to 2016, the increase in the average annual medical spending on claims for the enrollees in organizations that entered the AQC in 2009 was $461 lower per enrollee than spending in the control states (P<0.001), an 11.7% relative savings on claims.’
20
Quality Contract that had the greatest success in the early years, attributed by many to the independence of these physicians from the financial interests of local hospitals. Moreover, since the launch of the Alternative Quality Contract, very positive results have also been observed among many hospital-led ACOs participating in the AQC, as distinguished from many other ACO models under the federal Medicare Shared Savings Demonstration Program, which struggled to achieve meaningful savings.
Notwithstanding some of the examples of success from both PCMH and ACO models, however, broader studies of such models across the country have uncovered mixed results. In most cases, models have delivered incremental improvements in access to care and adoption of evidence-based medicine. However, in some cases of PCMH in particular, cost savings have been insufficient to offset investments in care coordination fees (i.e., per-member-per-month fees paid for care coordination, patient education, and/or investments in primary care practice improvements)27. Some Task Force members have raised the concern that PCMH’s may have an incentive (whether explicit or implicit) to generate referrals for specialty care within their affiliated health system, which could create a barrier to achieving the best care at the lowest possible cost. Under the Medicare Shared Savings Program (ACO), meanwhile, the majority of hospital-led ACOs have not achieved meaningful savings relative to benchmarks, dampening the overall effectiveness of the program in delivering savings to Medicare.
The Task Force recommends that the SHBP/SEHBP work closely with their TPA(s) to rigorously examine the results of existing or newly planned models for PCMH and ACOs, in order to determine whether the models are, in fact, delivering improvements in quality as well as lower growth in total cost of care, net of investments that are being passed on to SHBP/SEHBP. Based on such analysis, SHBP/SEHBP should determine whether continued investment in these models is warranted, or if resources should be re-directed toward other strategies such as those outlined in this report.
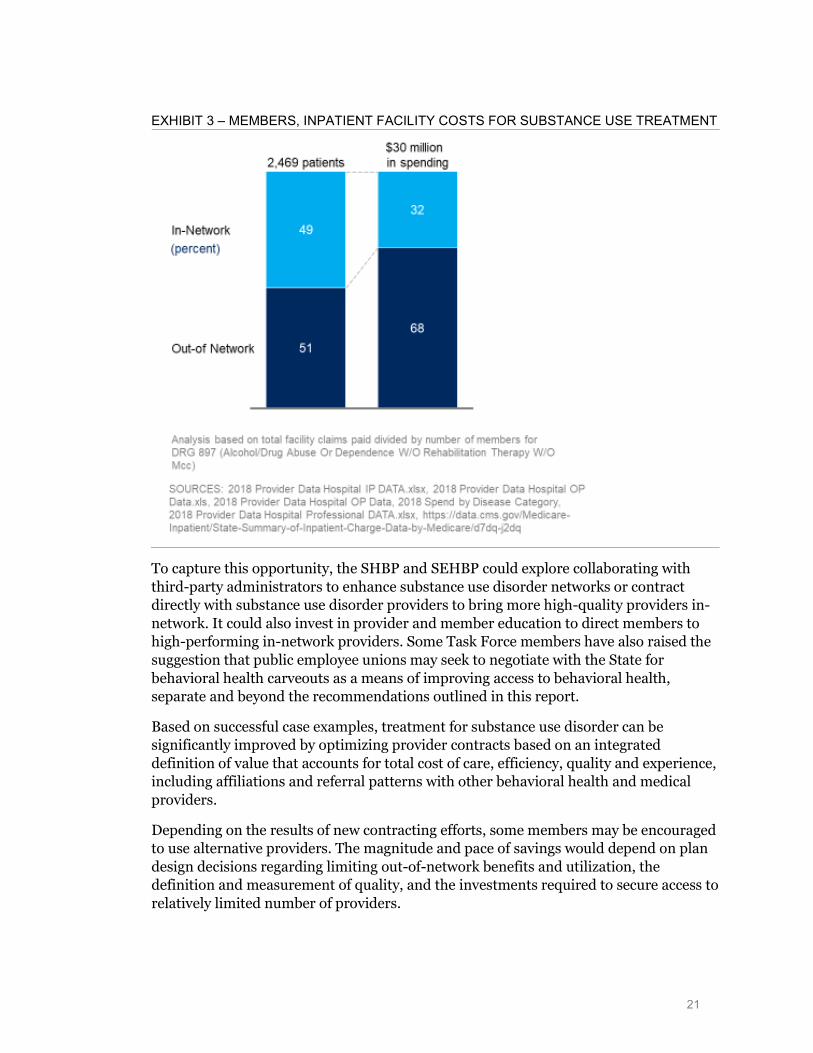
B. Direct contracting with providers of behavioral health Most insurers contract with select behavioral health providers considered in-network, while other providers are excluded from the benefit design and considered out-of-network. Within SHBP and SEHBP’s member base, 45-55% of patients and 65-75% of facility spending for inpatient and residential treatment for substance abuse is out-of-network, as shown in Exhibit 3, indicating a substantial opportunity for enhanced contracting with providers.
27 https://www.managedcaremag.com/archives/2017/9/study-carefirst-s-patient-centered-medical-home-
didn-t-save-money-medicare-patients https://www.managedcaremag.com/archives/2017/9/study-carefirst-s-patient-centered-medical-home-didn-t-save-money-medicare-patients - ‘CareFirst’s patient-centered medical home model, which provides financial incentives to primary care practices and care coordination for high-risk patients, did not reduce Medicare spending or hospitalizations’
21
EXHIBIT 3 – MEMBERS, INPATIENT FACILITY COSTS FOR SUBSTANCE USE TREATMENT
To capture this opportunity, the SHBP and SEHBP could explore collaborating with third-party administrators to enhance substance use disorder networks or contract directly with substance use disorder providers to bring more high-quality providers in-network. It could also invest in provider and member education to direct members to high-performing in-network providers. Some Task Force members have also raised the suggestion that public employee unions may seek to negotiate with the State for behavioral health carveouts as a means of improving access to behavioral health, separate and beyond the recommendations outlined in this report.
Based on successful case examples, treatment for substance use disorder can be significantly improved by optimizing provider contracts based on an integrated definition of value that accounts for total cost of care, efficiency, quality and experience, including affiliations and referral patterns with other behavioral health and medical providers.
Depending on the results of new contracting efforts, some members may be encouraged to use alternative providers. The magnitude and pace of savings would depend on plan design decisions regarding limiting out-of-network benefits and utilization, the definition and measurement of quality, and the investments required to secure access to relatively limited number of providers.
22
C. Behavioral health workforce development That so many of SHBP/SEHBP members obtain behavioral healthcare from out-of-network providers provides evidence to indicate that in-network reimbursement rates for behavioral health may be inadequate; a situation which the previously outlined recommendation for direct contracting is meant to address. However, several Task Force members have also urged the need to expand our behavioral health workforce. As noted, well over half of the nation’s adults with a mental illness (more than 26M) receive no treatment, even though access to treatment is slowly improving. New Jersey ranks 40th in the nation, with 59.9% of adults with a mental illness left untreated. More than one in five adults with a mental illness in the U.S. reports not being able to receive the treatment they needed. New Jersey ranks 35th on this metric, slightly worst than the national figure of 22.3%12. If we are to meaningfully reduce the number of people in the state with untreated behavioral health issues, we will require an expanded behavioral health workforce.
A shortage of mental health providers is driving access issues and a growing reliance on emergency services for psychiatric care. These providers include psychiatrists, psychologists, licensed clinical social workers, counselors, marriage and family therapists, and advanced practice nurses specializing in mental health care.
As noted, integrating primary care and behavioral health services is a key to early identification and intervention, but it is only part of the solution. Primary care providers cannot fill the void created by a lack of psychiatrists. The problem could get worse: More than 60% of practicing psychiatrists are over the age of 55, and the number of physicians entering psychiatry continues to decline28. New Jersey’s mental health workforce ranks 31st in the nation with a rate of 5300 providers per patient29.
The Task Force expects that investing in the behavioral health workforce could be a key enabler for the long-term success of all behavioral health initiatives across the State, including outside of SHBP and SEHBP.
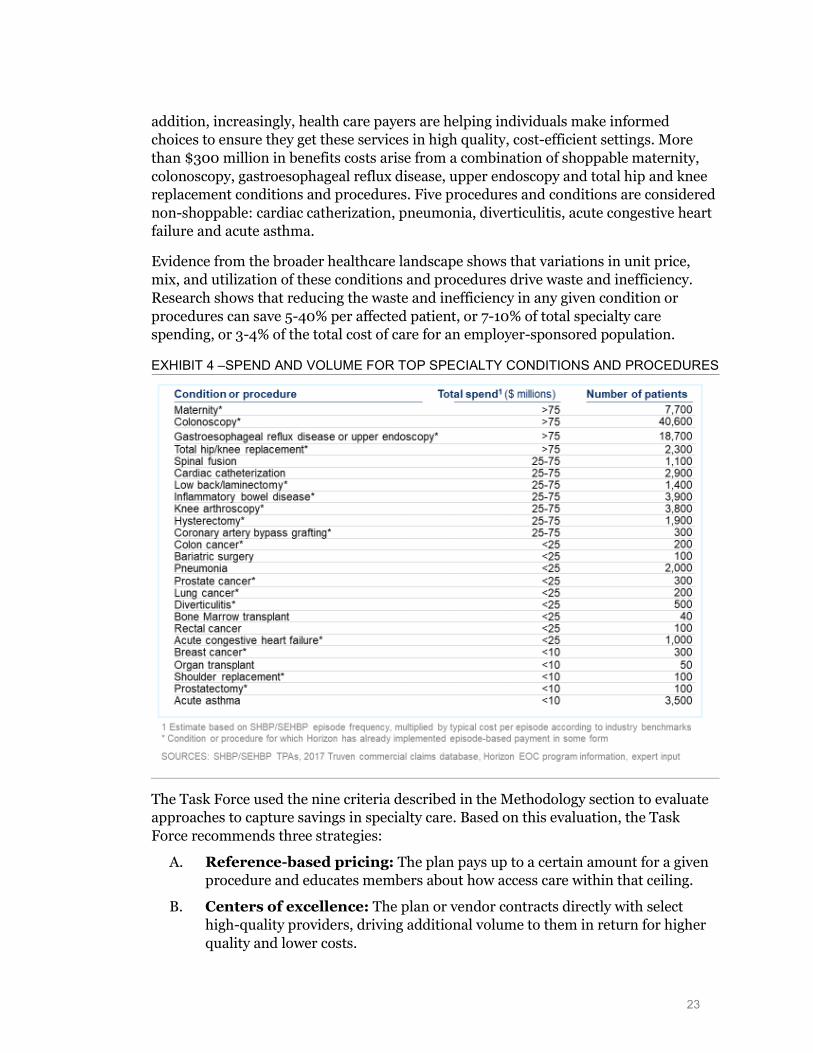
III. SPECIALTY CARE Specialty care accounts for around 40% of total benefits spend for SHBP and SEHBP. It includes major acute procedures such as joint replacements, complex chronic conditions such as Crohn’s disease, and many other procedures and conditions managed by specialists. As an example, 20 of the top 25 conditions and procedures, shown in Exhibit 4, are considered “shoppable” – that is, non-emergent conditions and procedures where there is time and opportunity available for the individual to make a proactive decision about where and with whom to have the procedure performed. With shoppable services, the individual has some choice of provider and/or setting. In
28 https://www.aamc.org/data/workforce/reports/458494/1-4-chart.html 29 “Mental Health Facts, Stats, and Data,” Mental Health America
23
addition, increasingly, health care payers are helping individuals make informed choices to ensure they get these services in high quality, cost-efficient settings. More than $300 million in benefits costs arise from a combination of shoppable maternity, colonoscopy, gastroesophageal reflux disease, upper endoscopy and total hip and knee replacement conditions and procedures. Five procedures and conditions are considered non-shoppable: cardiac catherization, pneumonia, diverticulitis, acute congestive heart failure and acute asthma.
Evidence from the broader healthcare landscape shows that variations in unit price, mix, and utilization of these conditions and procedures drive waste and inefficiency. Research shows that reducing the waste and inefficiency in any given condition or procedures can save 5-40% per affected patient, or 7-10% of total specialty care spending, or 3-4% of the total cost of care for an employer-sponsored population.
EXHIBIT 4 –SPEND AND VOLUME FOR TOP SPECIALTY CONDITIONS AND PROCEDURES
The Task Force used the nine criteria described in the Methodology section to evaluate approaches to capture savings in specialty care. Based on this evaluation, the Task Force recommends three strategies:
A. Reference-based pricing: The plan pays up to a certain amount for a given procedure and educates members about how access care within that ceiling.
B. Centers of excellence: The plan or vendor contracts directly with select high-quality providers, driving additional volume to them in return for higher quality and lower costs.
24
C. Episode-based-payment: The plan rewards providers for the quality and efficiency of the entire clinical episode, including all facility, professional and other expenses for a procedure.
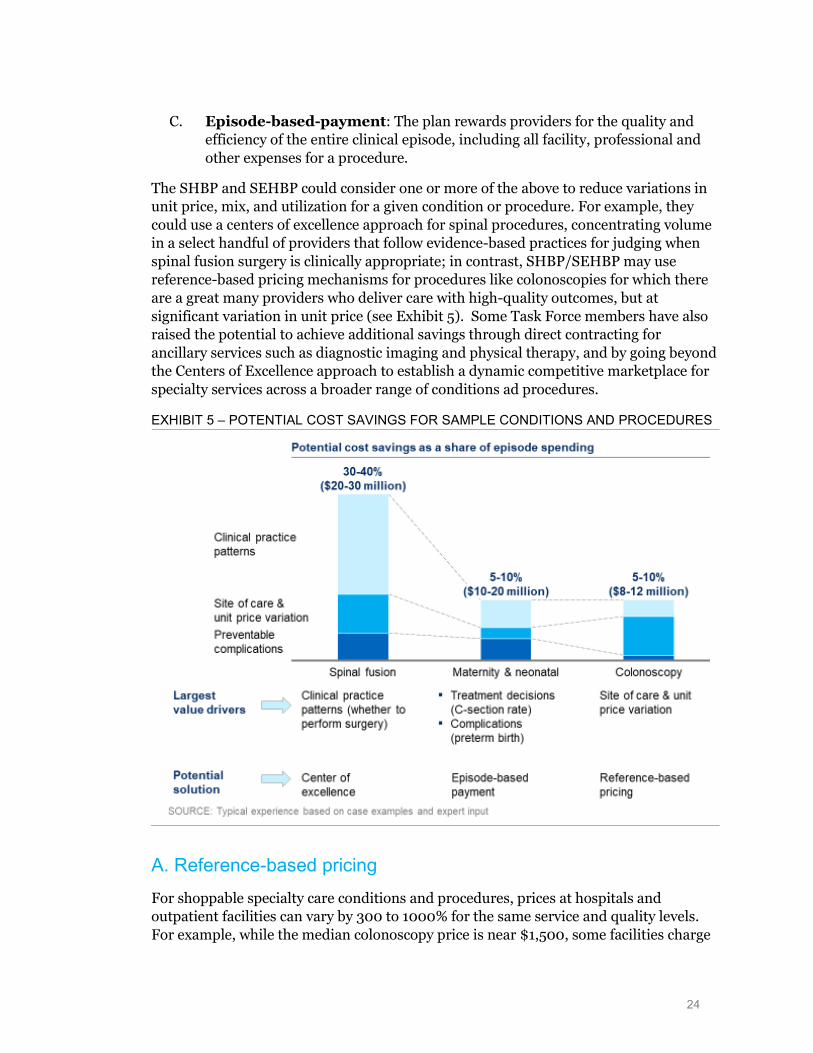
The SHBP and SEHBP could consider one or more of the above to reduce variations in unit price, mix, and utilization for a given condition or procedure. For example, they could use a centers of excellence approach for spinal procedures, concentrating volume in a select handful of providers that follow evidence-based practices for judging when spinal fusion surgery is clinically appropriate; in contrast, SHBP/SEHBP may use reference-based pricing mechanisms for procedures like colonoscopies for which there are a great many providers who deliver care with high-quality outcomes, but at significant variation in unit price (see Exhibit 5). Some Task Force members have also raised the potential to achieve additional savings through direct contracting for ancillary services such as diagnostic imaging and physical therapy, and by going beyond the Centers of Excellence approach to establish a dynamic competitive marketplace for specialty services across a broader range of conditions ad procedures.
EXHIBIT 5 – POTENTIAL COST SAVINGS FOR SAMPLE CONDITIONS AND PROCEDURES
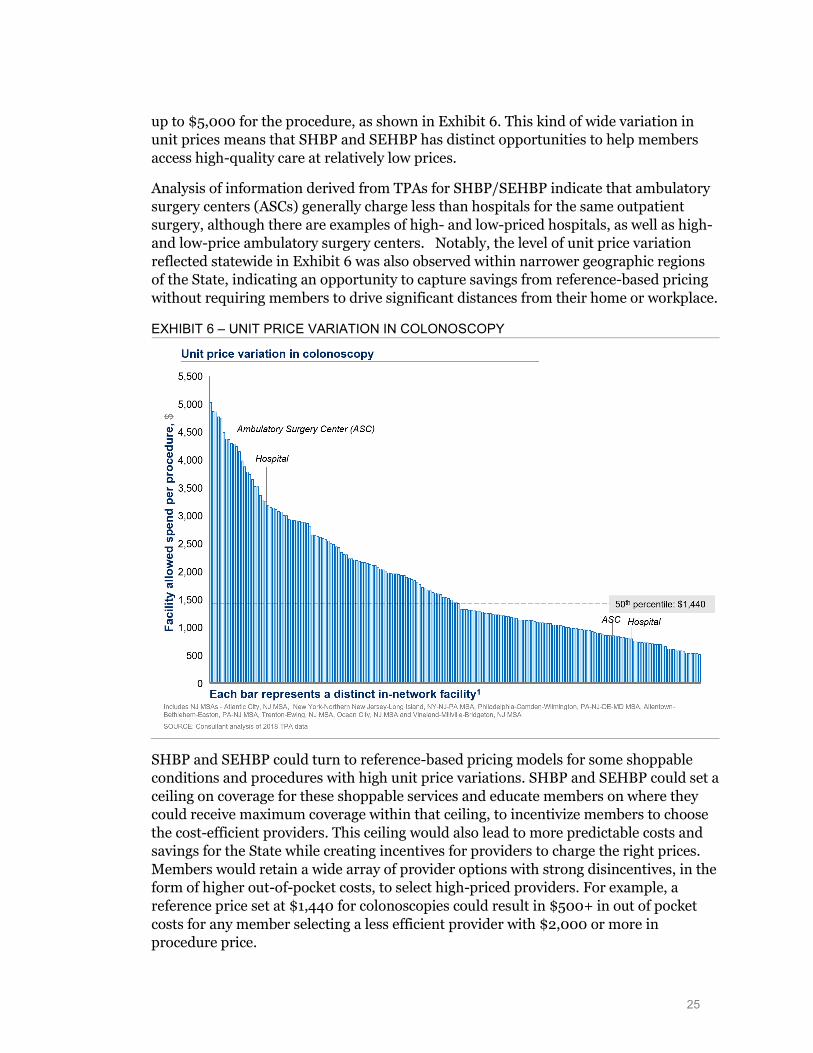
A. Reference-based pricing For shoppable specialty care conditions and procedures, prices at hospitals and outpatient facilities can vary by 300 to 1000% for the same service and quality levels. For example, while the median colonoscopy price is near $1,500, some facilities charge
25
up to $5,000 for the procedure, as shown in Exhibit 6. This kind of wide variation in unit prices means that SHBP and SEHBP has distinct opportunities to help members access high-quality care at relatively low prices.
Analysis of information derived from TPAs for SHBP/SEHBP indicate that ambulatory surgery centers (ASCs) generally charge less than hospitals for the same outpatient surgery, although there are examples of high- and low-priced hospitals, as well as high- and low-price ambulatory surgery centers. Notably, the level of unit price variation reflected statewide in Exhibit 6 was also observed within narrower geographic regions of the State, indicating an opportunity to capture savings from reference-based pricing without requiring members to drive significant distances from their home or workplace.
EXHIBIT 6 – UNIT PRICE VARIATION IN COLONOSCOPY
SHBP and SEHBP could turn to reference-based pricing models for some shoppable conditions and procedures with high unit price variations. SHBP and SEHBP could set a ceiling on coverage for these shoppable services and educate members on where they could receive maximum coverage within that ceiling, to incentivize members to choose the cost-efficient providers. This ceiling would also lead to more predictable costs and savings for the State while creating incentives for providers to charge the right prices. Members would retain a wide array of provider options with strong disincentives, in the form of higher out-of-pocket costs, to select high-priced providers. For example, a reference price set at $1,440 for colonoscopies could result in $500+ in out of pocket costs for any member selecting a less efficient provider with $2,000 or more in procedure price.
26
Other plan sponsors have implemented such models with various reference prices at specific percentiles or with certain high-quality, low-cost providers. CalPERS, for example, turned to reference-based pricing to save more than $13 million over three years for just four shoppable, non-emergency services with wide price variations.30 CalPERS set a reference price for each procedure and directs members to designated facilities; those using non-reference-priced facilities pay more. The price of knee and hip replacements fell by 34%, saving $2.8 million and $13.4 million ($0.50 PMPM) across all of the referenced-based pricing programs.
Based on successful examples from across the industry, SHBP and SEHBP could explore the breadth of conditions and procedures to be included, and consider provider outreach and/or member education through a third-party administrator or other vendor.
The Task Force expects that reference-based pricing opportunity could save up to $80-90 million in each of the five years following full implementation with a return on investment of about 20:1. Depending on the solution, 0-7% of members would need to change providers or face higher cost-sharing. The magnitude and rate of capture for savings would depend on the choices of conditions and procedures, reference price-setting methodology, member education and upfront investment to develop the reference-based pricing program.
B. Centers of excellence Variations in clinical practice and quality of care drive material waste and inefficiency. For example, enhancing clinical practice patterns in spinal fusion surgery episodes, including whether to perform surgery, can save 30-40% in total spending by reducing unit price variation and preventable complications.
The State should consider a centers of excellence model built on a direct contracting relationship to promote higher-quality providers and see savings from improved clinical decisions. In exchange for giving up some provider options, members would get better outcomes, higher quality and cost savings. The most suitable procedures for a center of excellence strategy would be shoppable health care services with meaningful variations in quality and costs. Common examples are non-emergent and complex specialty services, such as total joint replacement, heart surgeries, spine surgeries, bariatric surgeries, cancer and transplants. In this model, members would receive better quality and lower costs (with maximum coverage) if they obtain care from a center of excellence. Depending on how the model is designed, members may continue to obtain care from other providers but at a higher out of pocket cost.
30 “Reference Pricing in Health Insurance,” James C. Robinson, Berkeley Center for Health Technology;
“Association of Reference Pricing for Diagnostic Laboratory Testing With Changes in Patient Choices, Prices, and Total Spending for Diagnostic Tests,” James C. Robinson, Christopher Whaley and Timothy
27
Several plan sponsors have implemented such models with variations in the choice of specialty conditions and procedures and preferred providers. Lowes, for example, achieved significant cost savings, greater patient satisfaction and better health outcomes.31
In 2014, Lowe’s COE network, through the Employers Centers of Excellence Network, achieved significantly greater results compared to their carriers’ average results. Under the program, no patients were discharged to a skilled nursing facility, for example, compared to 9.1% for the carrier, and just 0.4% of patients were readmitted within 30 days, compared to 6.6% for the carrier. Further, no patients required a revision within 6 months compared to 1.1% for the carrier. Lowe’s COE network also significantly reduced the number of joint replacement surgeries: with only 79% deemed medically appropriate. Of the remaining 21% of non-medically appropriate surgeries, 6% were left pending based on health improvements, such as weight loss and smoking cessation, 14% of surgeries were avoided when misdiagnoses were identified, and more conservative therapies attempted. Only 1% had the surgery against the COE’s recommendation.
Virginia Mason and Washington State Employees provides yet another example of Centers of Excellence. Based on successful case examples from across both public and private employer plan sponsors, SHBP and SEHBP could explore the breadth of conditions and procedures to be included, consider voluntary vs. mandatory participation for beneficiaries, align on an approach to measure quality and site selection, and consider direct contracting or a third-party-administrator-led approach.
The Task Force expects that the center of excellence strategy could save $70-80 million in each of the five years following full implementation with a return on investment of about 6:1. To capture this level of savings, it is estimated that 7% or fewer members would face the choice of either using a center of excellence or face higher cost-sharing in order to use another provider. The magnitude and pace of savings would depend on a number of implementation decisions, including; the conditions and procedures for which the COE approach is adopted; the number of providers selected as COEs for a given procedure/condition; and the strength of member incentives applied to encourage use of COEs over other providers.
C. Episode-based payment Certain specialty care conditions and procedures include treatment decisions and complications that can materially influence overall cost and quality. Beyond reference-based pricing and center of excellence approaches that focus on unit price variation and clinical practice patterns and quality, an episode-based payment strategy could reward
31 The Employers Centers of Excellence Network Sixth National Bundled Payment Summit Report; expert
interviews The Employers Centers of Excellence Network Sixth National Bundled Payment Summit Report; expert interviews
28
providers for quality and efficiency of each clinical episode in its entirety, including all facility, professional, other expenses, to drive enhanced outcomes.
Episode-based payment mechanisms could lead to longer-term savings and quality improvements, given the nature of provider partnership and ownership around payment and quality. Members should have better outcomes without changing providers. The most suitable conditions and procedures for episode-based payments would be those with the highest potential for improvement in quality and total cost per episode.
Many public and private payers have moved to episode-based payments in the past few years because they can deliver faster and more consistent impact than alternative payment models. Some plan sponsors have implemented such models with variations in the number of episodes included, as well as several other key features: (1) whether the models are voluntary or mandatory for provider participation; (2) whether providers participate in both savings and losses (gain sharing and risk-sharing) or only in any savings (gain sharing); and (3) whether the model is deployed by only one payer or plan sponsor, or through multiple payers on a coordinated basis in order to reach a greater share of a provider’s panel of patients. Three different options for reward structure are further elaborated upon below:
1. Gain-sharing based on improvement: Claims continue to be paid on a fee-for-service basis and the total costs incurred are calculated (retrospectively) and compared to the historical costs for patients treated by the same provider. If costs are reduced, or if they grow at a slower-than-budget rate, the provider may share in the implied savings (gain sharing). This approach has already been implemented in New Jersey and other markets on a voluntary basis. However, savings have been more limited than in other models that have been mandatory and/or have required providers to pay limited penalties if costs exceed goals or benchmarks.
2. Gain- and risk-sharing based on improvement: This model is similar to the aforementioned, except that providers are also subject to sharing in a portion of losses if costs rise faster than targeted. Medicare’s Bundled Payments for Care Improvement program has implemented a form of this model. While the model has generated strong results for participating providers, the total savings for the program have been constrained by voluntary participation, including the potential for providers to participate only selectively in those clinical episodes for which they believe they have greatest opportunity for improvement.
3. Gain- and risk-sharing based on market-wide benchmark or target: Under this model, rewards and penalties are based on performance compared with a market-wide benchmark or target for cost-per-episode. These models have been implemented on a multi-payer basis in Arkansas, Ohio, and Medicaid on a mandatory basis, not only maximizing the number of participating providers but also maximizing the share of their patient panels
29
that are included under the model, thereby increasing the strength of the incentives.
Tennessee’s Medicaid program32 has seen success with a risk-based EOC payment model, which saved $28.6 million across 19 episodes in 2017, including the three largest episodes: valve repair and replacement, acute asthma exacerbation and pneumonia. Under the program, quality improved across the majority of episodes, and 74% of quality metrics included in gain-sharing incentives either increased or maintained performance. In perinatal (maternity) episodes, C-section rates declined with improved patient education, complication avoidance, and care coordination. In asthma acute exacerbation, hospitalizations decreased with improved screening, triage, and follow up-care, and prescribing more appropriate medications.
Based on successful case examples from across the industry, SHBP and SEHBP could explore the breadth of conditions and procedures to be included, consider voluntary vs. mandatory participation for providers, consider gain sharing vs. risk sharing models for providers, align with other payers and plan sponsors in the State, consider direct contracting for episodes vs. through third-party administrators, and align on existing vs. home-grown episode definitions.
The Task Force expects that the episode-based payment strategy could save up to $90-100 million annually, within five years, if implemented in a manner that ensures substantially higher levels of provider adoption and commitment than has been realized, to date, under Horizon’s existing approach. The level of quality improvement and savings achieved would depend on the number of conditions and procedures for which episode-based payment is adopted, the level of financial risk and rewards, and the degree to which SHBP/SEHBP aligns efforts with other plan sponsors and payers in order to create incentives that apply to a larger share of patient panels for participating providers.
MOVING FORWARD Implementing some or all of these opportunities will require significant resources and buy-in from the Division of Pensions and Benefits and other stakeholders. Pursuing each of the strategies would require four key steps:
1. Detailed analysis: Design decisions associated with each of the nine strategies require an analytical fact base to consider trade-offs. For example, the specialty care recommendation would require an analysis of geographic utilization and cost of various acute procedures to understand the options for reference price points and the location of centers of excellence. These findings can then help the State choose the execution strategy with the highest quality, lowest cost and best member experience.
32 State of Tennessee Strategic Planning and Innovation Report, Sept. 2018
30
2. Collaboration between the Division and the SHBP/SEHBP Commissions and Plan Design Committees: With a detailed analysis in hand, relevant stakeholders would make final decisions on which strategies to pursue and when. The timing would directly impact the five-year impact of each strategy.
3. Contracting with new vendors as necessary: For each strategy, the State will need to analyze whether the existing third-party administrator or other vendor is best suited to maximize impact. This decision could directly impact the timing, quality of care and member experience of each strategy. In the case of a third-party carrier, a best-in-class RFP process would help identify the most attractive vendor partner.
4. Investments in capabilities of the Division: The Division will need new capabilities to implement the first three steps and deliver the impacts outlined in this report. Investments in Division capabilities could influence both the quality and timing of each strategy.
In conclusion, the Task Force believes that the actionable strategies identified in these recommendations could make a meaningful difference in the value of the State’s and other public employers’ investments in SHBP/SEHBP. Acting on these recommendations could help improve the quality of the programs, reduce costs, and strengthen the SHBP/SEHBP’s management and oversight of the programs. The Task Force looks forward to helping the State implement these recommendations.
31
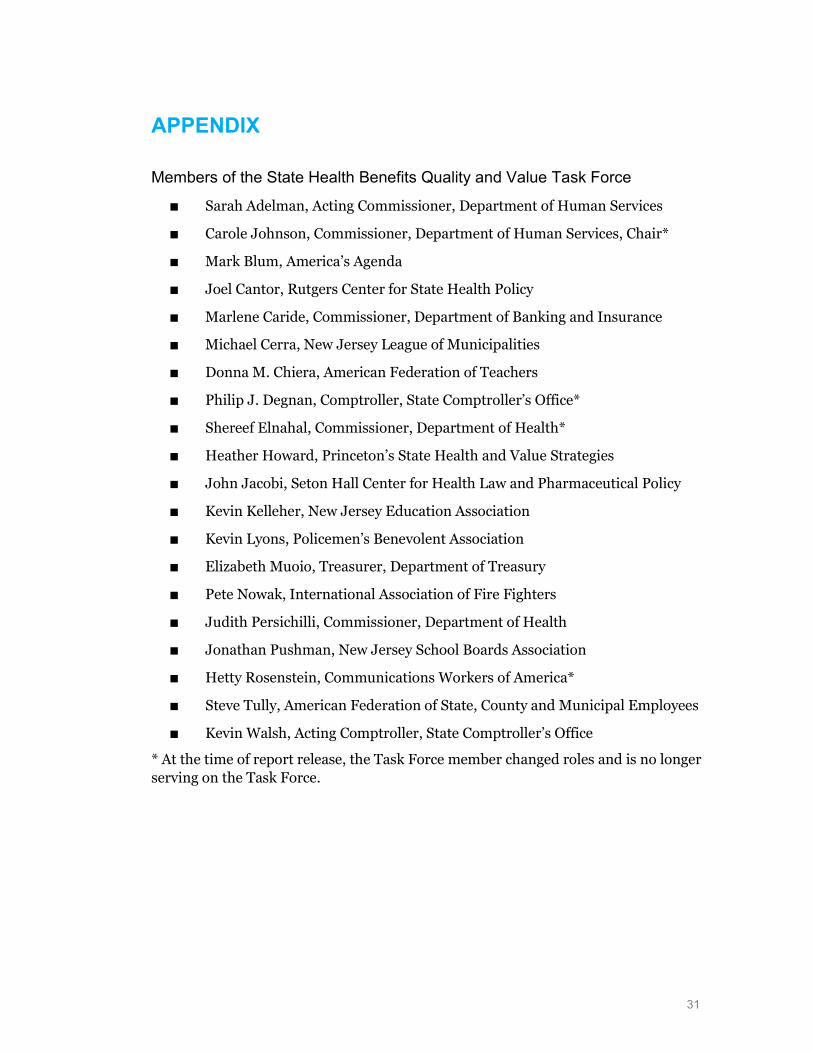
APPENDIX
Members of the State Health Benefits Quality and Value Task Force
■ Sarah Adelman, Acting Commissioner, Department of Human Services
■ Carole Johnson, Commissioner, Department of Human Services, Chair*
■ Mark Blum, America’s Agenda
■ Joel Cantor, Rutgers Center for State Health Policy
■ Marlene Caride, Commissioner, Department of Banking and Insurance
■ Michael Cerra, New Jersey League of Municipalities
■ Donna M. Chiera, American Federation of Teachers
■ Philip J. Degnan, Comptroller, State Comptroller’s Office*
■ Shereef Elnahal, Commissioner, Department of Health*
■ Heather Howard, Princeton’s State Health and Value Strategies
■ John Jacobi, Seton Hall Center for Health Law and Pharmaceutical Policy
■ Kevin Kelleher, New Jersey Education Association
■ Kevin Lyons, Policemen’s Benevolent Association
■ Elizabeth Muoio, Treasurer, Department of Treasury
■ Pete Nowak, International Association of Fire Fighters
■ Judith Persichilli, Commissioner, Department of Health
■ Jonathan Pushman, New Jersey School Boards Association
■ Hetty Rosenstein, Communications Workers of America*
■ Steve Tully, American Federation of State, County and Municipal Employees
■ Kevin Walsh, Acting Comptroller, State Comptroller’s Office
* At the time of report release, the Task Force member changed roles and is no longer serving on the Task Force.
32
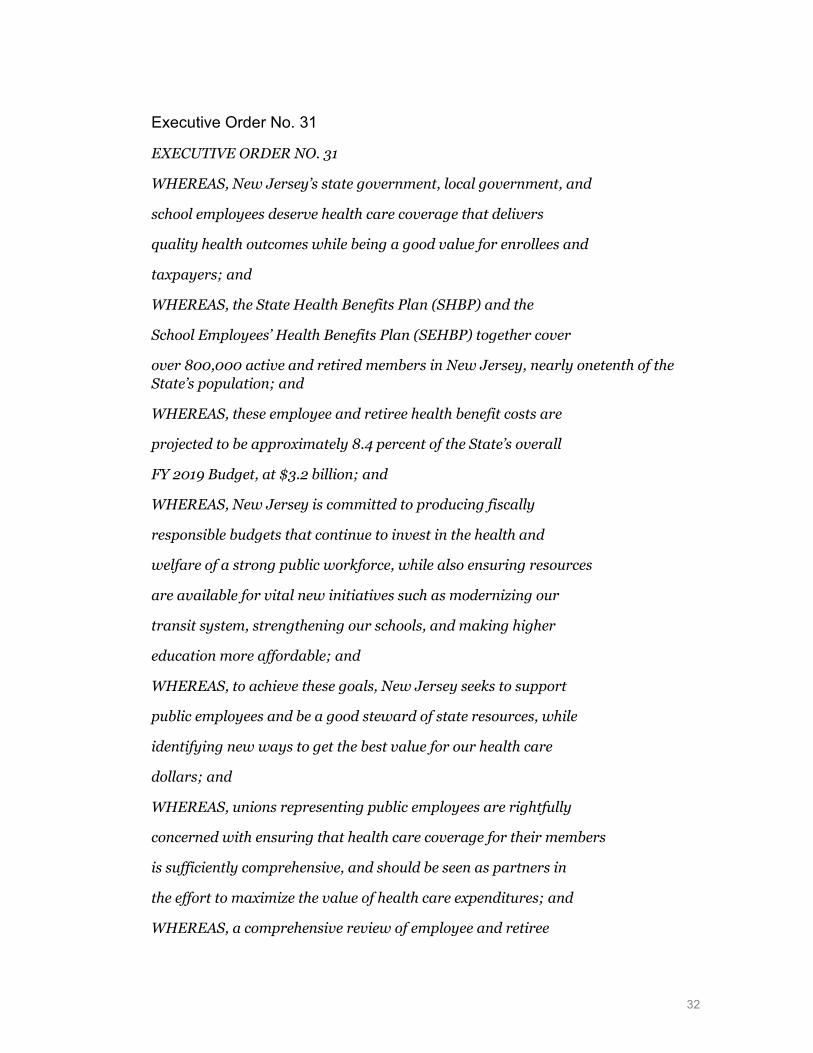
Executive Order No. 31
EXECUTIVE ORDER NO. 31
WHEREAS, New Jersey’s state government, local government, and
school employees deserve health care coverage that delivers
quality health outcomes while being a good value for enrollees and
taxpayers; and
WHEREAS, the State Health Benefits Plan (SHBP) and the
School Employees’ Health Benefits Plan (SEHBP) together cover
over 800,000 active and retired members in New Jersey, nearly onetenth of the State’s population; and
WHEREAS, these employee and retiree health benefit costs are
projected to be approximately 8.4 percent of the State’s overall
FY 2019 Budget, at $3.2 billion; and
WHEREAS, New Jersey is committed to producing fiscally
responsible budgets that continue to invest in the health and
welfare of a strong public workforce, while also ensuring resources
are available for vital new initiatives such as modernizing our
transit system, strengthening our schools, and making higher
education more affordable; and
WHEREAS, to achieve these goals, New Jersey seeks to support
public employees and be a good steward of state resources, while
identifying new ways to get the best value for our health care
dollars; and
WHEREAS, unions representing public employees are rightfully
concerned with ensuring that health care coverage for their members
is sufficiently comprehensive, and should be seen as partners in
the effort to maximize the value of health care expenditures; and
WHEREAS, a comprehensive review of employee and retiree
33
health benefits programs is necessary to identify strategies to
improve the value of our state government, local government, and
school employee health care investments to achieve better health
outcomes and better management of the costs of employee and retiree
health benefits; and
WHEREAS, such a review should be conducted by State officials
and stakeholders who represent a variety of perspectives and who
have the expertise to develop innovative solutions; and
WHEREAS, this review will provide the State Health Benefits
Commission (“SHBC”) and the School Employees’ Health Benefits
Commission (“SEHBC”) Plan Design Committees with opportunities for
the State to be a leader in the broader effort to design, purchase,
and deliver health care services more efficiently and effectively;
NOW, THEREFORE, I, PHILIP D. MURPHY, Governor of the State of
New Jersey, by virtue of the authority vested in me by the
Constitution and by the Statutes of this State, do hereby ORDER
and DIRECT:
1. There is hereby created the State Health Benefits
Quality and Value Task Force (the “Task Force”) that will evaluate
the employee and retiree health benefits systems and make
recommendations to provide quality and value in the State’s health
benefits in a cost-effective manner.
2. The Task Force shall be composed of at least 16 members,
including the State Treasurer or a designee, serving ex officio;
the Commissioner of Banking and Insurance or a designee, serving
ex officio; the State Comptroller or a designee, serving ex
officio; the Commissioner of Human Services or a designee, serving
ex officio; and 12 public members, who shall be appointed by the

34
Governor and shall serve at his or her pleasure, as follows: four
individuals who have experience, knowledge or expertise in the
areas of health policy and/or procurements; six representatives
from six different employee organizations; one representative from
the New Jersey League of Municipalities; and one representative
from the New Jersey School Boards Association. The Governor shall
select a chairperson from among the members of the Task Force.
All public members of the Task Force shall serve without
compensation.
3. The Governor may, as determined to be appropriate,
appoint additional members to the Task Force, who shall serve at
the pleasure of the Governor.
4. The Task Force shall organize as soon as practicable
after the appointment of its members, and shall convene as often
as practicable and as requested by the Governor or chairperson.
5. The Task Force is authorized to call upon any department,
office, division or agency of this State to supply it with data
and any other information or assistance available to such agency
as the Task Force deems necessary to discharge its duties under
this Order. Each department, office, division or agency of this
State is hereby required, to the extent not inconsistent with law,
to cooperate fully with the Task Force within the limits of its
statutory authority and to furnish it with such assistance on as
timely a basis as is necessary to accomplish the purposes of this
Order. The Task Force may consult with experts or other
knowledgeable individuals in the public or private sector on any
aspect of its mission.
6. The Department of the Treasury shall provide staffing
35
for the Task Force to the extent permitted by law and within
existing appropriations.
7. The objectives of the Task Force shall include, but not
be limited to, the following:
a. Examining the current and future costs of employee
and retiree health benefits to State and local government workers
and to the State and local governments;
b. Identifying opportunities for short-term
improvements, including best practices in health management,
potential efficiencies to improve health outcomes, and plan design
opportunities; and
c. Exploring long-term reforms for the broader
employee and retiree health benefits system.
8. The Task Force shall be purely advisory in nature, and
shall release recommendations as appropriate.
9. This Order shall take effect immediately.
GIVEN, under my hand and seal this
20th day of July,
[seal] Two Thousand and Eighteen,
and of the Independence of
the United States, the Two
Hundred and Forty-Third.
/s/ Philip D. Murphy
Governor
Attest:
/s/ Parimal Garg
Deputy Chief Counsel to the Governor