Embed Size (px)
Citation preview
Improving GDP: Demolishing, Repointing or Extending?*
Carol Corrado, The Conference Board and Georgetown Center on Business and Public Policy
Kevin Fox, University of New South Wales
Peter Goodridge, Imperial College Business School
Jonathan Haskel, Imperial College Business School, CEPR and IZA
Cecilia Jona-Lasinio, ISTAT and LUISS, Rome
Daniel Sichel, Wellesley College
Stian Westlake, NESTA
September 2017
Abstract
Recent years have seen a proliferation of indices of economic achievement: from the worldwide Human Development Index; to the Measures of Australia's Progress; to the EU Innovation Scoreboard. Unfortunately, none of them satisfy the principles of good measurement. That is, none of these indices have the desirable properties we would want from an index number, namely not double counting and having meaningful weights. GDP does. But economies have dramatically changed structure since the development of GDP: more knowledge production, more digital goods, more things for free. Should then we demolish the GDP edifice altogether? No. We propose repointing GDP in line with the transformation in economic structure: to measure intangible and environmental capital, to quality-adjust prices, to run online experiments on willingness-to-pay for free goods. We then propose extending GDP to measure economic well-being better: using some of the components of GDP such as consumption, along with leisure and measures of security. The newly developed measures will follow the principles of good economic measurement and reflect production and well-being in modern global economies.
*Contact author: Jonathan Haskel, Imperial College Business School, Imperial College, London SW7 2AZ, [email protected]. This essay is an entry for the Indigo Prize. Word count (excluding front page and references) 4,9991. Our contributions are equal. Errors and opinions are our own.
1
Improving GDP: Demolishing, Repointing or Extending?
1 Introduction
We have a plethora of measures of economic and social achievement besides GDP. The Human
Development Index adds life expectancy, education and GDP per head. The Measures of
Australia’s Progress includes trust, close relationships and the home; the EU Innovation
Scoreboard global connectivity, the Indigo Score political stability and the WIPO Global
Innovation Index infrastructure and business sophistication.
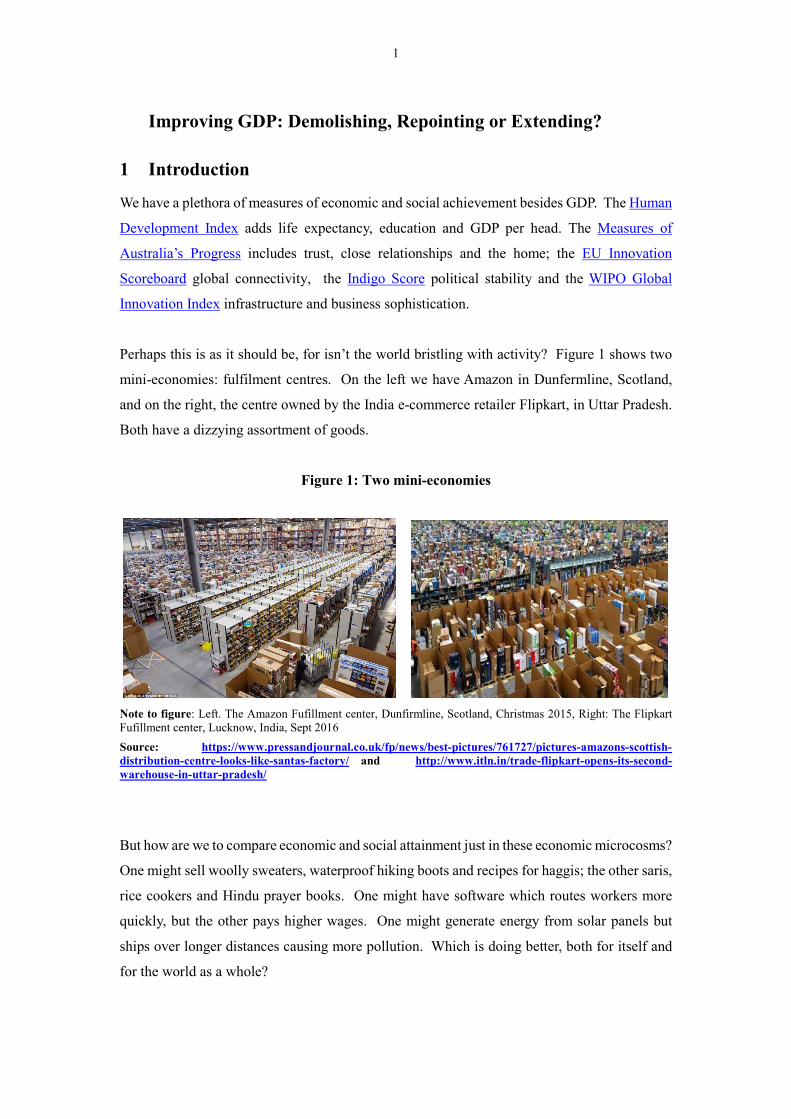
Perhaps this is as it should be, for isn’t the world bristling with activity? Figure 1 shows two
mini-economies: fulfilment centres. On the left we have Amazon in Dunfermline, Scotland,
and on the right, the centre owned by the India e-commerce retailer Flipkart, in Uttar Pradesh.
Both have a dizzying assortment of goods.
Figure 1: Two mini-economies
Note to figure: Left. The Amazon Fufillment center, Dunfirmline, Scotland, Christmas 2015, Right: The Flipkart Fufillment center, Lucknow, India, Sept 2016 Source: https://www.pressandjournal.co.uk/fp/news/best-pictures/761727/pictures-amazons-scottish-distribution-centre-looks-like-santas-factory/ and http://www.itln.in/trade-flipkart-opens-its-second-warehouse-in-uttar-pradesh/
But how are we to compare economic and social attainment just in these economic microcosms?
One might sell woolly sweaters, waterproof hiking boots and recipes for haggis; the other saris,
rice cookers and Hindu prayer books. One might have software which routes workers more
quickly, but the other pays higher wages. One might generate energy from solar panels but
ships over longer distances causing more pollution. Which is doing better, both for itself and
for the world as a whole?
2
As this thought experiment shows, it’s pretty hard to compare even these two relatively similar
economic entities. So before proposing another index, let’s take a step back and ask a more
fundamental question: what would a “good” index look like?
2 Some economic measurement principles
The Indigo Prize question asks for an “…economic measure for global economies”. So let’s
turn away from these little economies-within-an-economy. Instead, let’s describe the economy
of the entire World. This is set out below.
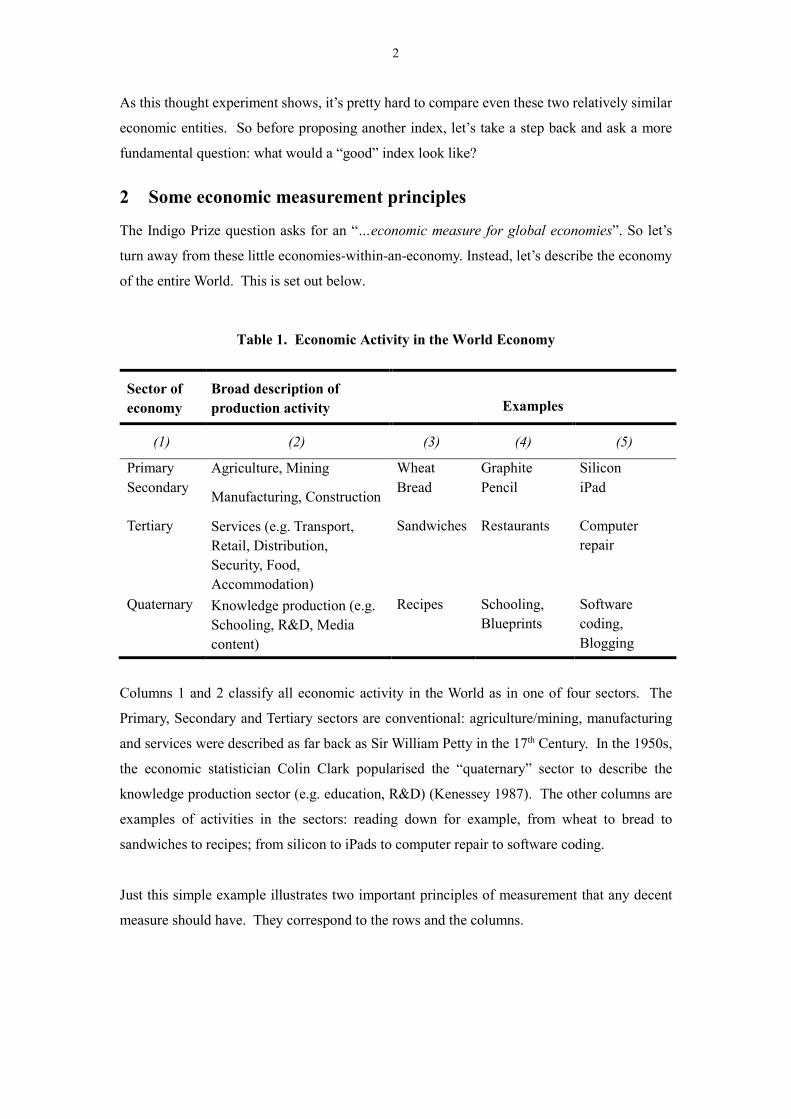
Table 1. Economic Activity in the World Economy
Sector of economy
Broad description of production activity
Examples
(1) (2) (3) (4) (5)
Primary Agriculture, Mining Wheat Graphite Silicon Secondary Manufacturing, Construction Bread Pencil iPad
Tertiary Services (e.g. Transport, Retail, Distribution, Security, Food, Accommodation)
Sandwiches Restaurants Computer repair
Quaternary Knowledge production (e.g. Schooling, R&D, Media content)
Recipes Schooling, Blueprints
Software coding, Blogging
Columns 1 and 2 classify all economic activity in the World as in one of four sectors. The
Primary, Secondary and Tertiary sectors are conventional: agriculture/mining, manufacturing
and services were described as far back as Sir William Petty in the 17th Century. In the 1950s,
the economic statistician Colin Clark popularised the “quaternary” sector to describe the
knowledge production sector (e.g. education, R&D) (Kenessey 1987). The other columns are
examples of activities in the sectors: reading down for example, from wheat to bread to
sandwiches to recipes; from silicon to iPads to computer repair to software coding.
Just this simple example illustrates two important principles of measurement that any decent
measure should have. They correspond to the rows and the columns.
3
2.1.1 Principle 1- Down the columns: no double counting.
Start by reading down the columns. What would a good indicator of world economic activity
be? One’s first thought is to simply add up all the columns: perhaps the sales of all the goods
or their numbers/tonnage? Perhaps we should add world wheat production (724m tonnes
annually in 2014) plus bread production (125m tonnes) plus sandwiches (300m per day in the
US alone)?
On reflection however, this would be wrong. Since the wheat is made into the bread which is
then made into the sandwiches adding them all together would count activity more than once.
So principle 1 of any decent measure is: no double counting.
Unfortunately, a number of indices violate this principle. The EU Innovation Scoreboard adds
R&D and patent applications; and high-tech equipment and high-tech sales. Each may be an
input into the other. The WIPO Global Innovation Index adds electricity production and ICT
service exports: again, the former is an input into the latter.
2.1.2 Principle 2 - Across the rows: add up meaningfully
Now read across the rows. How are we to add up row 2: loaves of bread, pencils and iPads?
Bread, pencils and iPads do have a physical tonnage. But schooling and software code? And
the question itself asks for a measure including “creativity, entrepreneurship and digital skills”:
these then need a weight too. So the question is: what should these weights be?
One option is for the index developer to invent them. A popular choice is to set them equal.
The EU Innovation Scoreboard for example adds up a number of disparate indicators:
Trademark applications, non-EU doctoral students and population in lifelong learning. The
Human Development Index does the same: equal weights for life expectancy, education and
GDP per head.
These weights are decided by the index instigator. The polar opposite is to outsource the
computation of the weights to the user. This is the dashboard approach to extending GDP,
exemplified in the Australian Measure of Australian Progress, where a reader is presented with
traffic lights on progress in a few dozen different measures (health measures, environment, trust
for example) from which they can then form their own judgement on how Australia is doing.
This seems arbitrary as well, and so this is why the influential World Bank economist Martin
Ravillion calls these indices “Mashup Indices” (Ravallion 2012).
4
There is another point regarding weights. The question asks for a “global” index. The weights
certainly vary across the globe. So even if we could settle for weights for, say Australia, we
would need some others for elsewhere. And we might want to let the weights change. For a
thousand years the Catholic Church required members to abstain from meat on Fridays. In
December 1966 the Pope allowed meat eating on (non-Lent) Fridays. Thus for a pretty big
share of the world’s population, meat now had more use on Fridays. So the weights have to
reflect this: if we had meat and fish in the columns, we would want a measure that changed
after December 1966.
So principle 2 is: have informative weights - weights that are not arbitrary and that change
appropriately when circumstances change. A number of indices fail this criteria. The Human
Development Index has fixed, arbitrary weights over time and place. The EU Innovation index
and WIPO Global Innovation Index are riddled with double counting.
2.2 So what’s right about GDP?
How does GDP do? Despite all the criticism, it satisfies the two principles.
First, it avoids double counting. It does this by adding up value added at each stage of
production. That is, it adds each production stage output minus all the inputs that went into that
output and so were counted at an earlier stage: (a) wheat plus (b) bread minus wheat plus (c)
sandwiches minus bread for example.
Second, GDP has weights. They are called prices. That is, we add up an iPad and a pencil by
weighting them by their prices i.e. we add up the number of iPads sold times their selling price.
Since an iPad costs about £500 and a pencil £1, that puts a relative weight of 500 on an iPad.
Is using prices as weights a good metric? That depends what you think “good” weights are.
Choosing equal weights, like the HDI, seems arbitrary because it doesn’t reflect the
comparative “importance” of the elements in the index. Some people might think that pencils
are more important, others that iPads are more important. But we cannot have individual
weights or else we will have as many indices as there are people. So, how can we settle on a
single weight for a society that somehow represents all those preferences and changes when
circumstances change? What we need is a minute-by-minute voting system so preferences of
buyers over goods can be expressed subject of course to the constraint that they have the money
to buy the goods they want and firms are willing to supply those goods. This is the beauty of
5
prices. Prices reflect the balance between what consumers want, what they can afford and what
firms can feasibly supply. Almost all of economics is about just what information is in those
prices, and for many purposes, they give the right signals, as the price of fish before and after
December 1966 illustrates. The price of meat relative to fish rose by 12.5% in the 10 months
after the decree. Thus weights are based on information observed in markets that reflect the
interactions of millions of people, rather than the biases or preconceptions of the person
compiling a new index.
2.3 So what’s wrong with GDP?
GDP is widely computed, scrutinized--and disputed--for adhering to the principles set out
above. It captures the goods and services the economy is producing in a way that doesn’t double
count and has flexible and informative weights. But as Okun has pointed out (1971, quoted in
(Tarasofsky 1998)) any number of improvements might make the economy better without the
slightest change in GDP: “..we might start the list with peace, equality of opportunity, the
elimination of injustice and violence, greater brotherhood among Americans of different racial
and ethnic backgrounds, better understanding between parents and children and between
husbands and wives, and we could go on endlessly. To suggest that [GDP] could become the
indicator of social welfare is to imply that an appropriate price tag could be put on changes in
all these social factors from one year to the next”. All this means that (a) GDP breaks down if
prices are missing or uninformative and (b) measures production and not well-being.
2.4 Our proposals
Our proposals for the improvements the question asks for (How should your new measure be
used to improve the way we measure GDP in official statistics?) are therefore in two parts.
a. “Fixing GDP to measure production better”, that is, keeping the principles of GDP but improving its measurement e.g. by better incorporating the quartenary sector, better price measurement etc.
b. “Extending GDP to measure well-being”, that is, expanding the scope of measurement beyond production to a broader measure of welfare.
Both these proposals must, however, fulfil the properties above, namely of no double-counting
and informative weights.
6
3 Fixing GDP to measure production better
We have two broad suggestions for better measurement of GDP, both of which follow the model
above, namely more work on the (a) sectors; (b) prices.
3.1 Improving measures of the sectors
There are in fact two dimensions to this: within the sectors and between the sectors.
3.1.1 Within the sector: the market/non-market divide
Let’s start within a sector. At least some activity in all of the sectors is not performed in the
market-place but at home: growing your own food, doing the family chores, writing Wikipedia
entries at home. Thus GDP measurement divides production within these sectors into “market
production” and “home production”, and does not count the latter. Thus we need to be clear
about where, within the sectors, the home/market production boundary lies.
Actually, this has been an enduring problem in counting GDP, elegantly illustrated by
Samuelson’s famous observation that when an aristocrat marries the cook GDP falls (as the
cooking that was previously paid in the market for becomes home production). Of course, some
activities might go the other way: the trend towards professional dog-walkers or personal
trainers for example. Likewise, someone who offers regular casual lifts to people but now joins
Uber goes from domestic to market production: indeed the observation that conventional taxis
take cash but Uber does not suggests that the effect of Uber might very well be to raise
measured activity in the market economy.
From an implementation viewpoint, the problem with non-market activities follows directly
from our principles above: if they are unpaid, we have no prices to use as weights. Thus any
call to include them has to fill in this missing data. The internet, being the cause of many of
these activities (e.g. Uber, TaskRabbit etc) is of course a potential source of information here
i.e. data on costs of tasks can be obtained. So we suggest statistical agencies monitor changing
production boundaries where activities can be measured in this way.
3.1.2 Between the sectors: counting ideas and creativity better - the quaternary sector.
When we look between the sectors, we need to work out what goods feed into what to avoid
double counting. Figuring out what goods to subtract off at each stage of production is simple
in the case of sandwiches. We’ve already counted the output of wheat and, say, cheese, so we
7
need to subtract them from the value of a sandwich. But it’s harder with iPads. Some of the
inputs are silica and semi-conductors, which we can count elsewhere. But what’s in the iPad is
ideas, being a manifestation of just what is identified in the question, namely creativity,
entrepreneurship and digital skills. Those belong in the “quaternary” sector.
How are they measured at the moment? Usual practice, both in national and company accounts
largely has been to then ignore this area, in the sense of treating spending on, for example, new
designs or market research as simply being used up in the course of production, like air
conditioning or electricity. So it’s not that these sectors are treated as producing nothing, but
rather that all they do is completely transformed in the course of production. Thus it would be
double-counting to count both the design of a football T-shirt to celebrate the winning of a
particular match and the value of the T-shirt as well. Under this treatment, the value of output
of the quaternary sector is the sales of designs, but that value exactly nets out when we count
the value added of the other sectors.
Some of the output of the quaternary sector is short-lived. But some is very long-lived: think
of the enduring popularity of Coca Cola, the movie of Mary Poppins and the reputation of Rolls
Royce. If this is the case, and if the quaternary sector is getting more important in economic
activity, it’s vital that we measure it better. Herein lies the contribution of Corrado, Hulten, and
Sichel (2005); Corrado, Hulten, and Sichel (2009), who set out a comprehensive categorisation
of outputs produced by that sector and suggested that the long-lived portion be counted as
investment. Some of those outputs are already recorded as such in the national accounts (e.g.
software and databases, scientific R&D, mineral exploration, the creation of artistic originals)
but others are not. Therefore, a better measure of the activity of the quaternary sector would
recognize that expenditures on the design of new goods, services, and processes; the cleaning,
transformation and curation of (big) data; and labour training are national investments.
Of course, accurate measurement of knowledge outputs is difficult. This is especially true when
there are no market transactions but rather in-house activity undertaken on own-account. But
that is not a valid reason to not undertake measurement, or to measure something else just
because it is easier. As noted by Read (1898) (often wrongly attributed to Keynes) “it is better
to be vaguely right than exactly wrong”.
Investments in knowledge build “knowledge capital”. We advocate the same general principle
to incorporate consistently the natural environment. So, for example, planting a new forest is
an investment in “natural capital”, polluting the Barrier Reef is destroying it and managing
farmland better reduces the costs of using it. A start along these lines has been made in the
8
UN/EU/FAO/OECD/World Bank System of Environmental-Economic Accounting (SEEA)
((UN/EU/FAO/OECD/World Bank 2014a; UN/EU/FAO/OECD/World Bank 2014b)).
3.2 Measuring prices better
If we are to use prices as weights, we need to confront the following issues
a. We need to compare prices for like-with-like items. This is particulary important when we look over time and quality is changing fast.
b. There may be no prices: e.g. free goods.
Let’s then review our recommendations for improvement under these headings
3.2.1 Like-with-like prices
On the face of it, measuring prices seems easy enough: do a survey of brick-and-mortar and
online sellers and compile a price index. However, when the mix and quality of goods and
services are changing over time, this simple recipe becomes more complex.
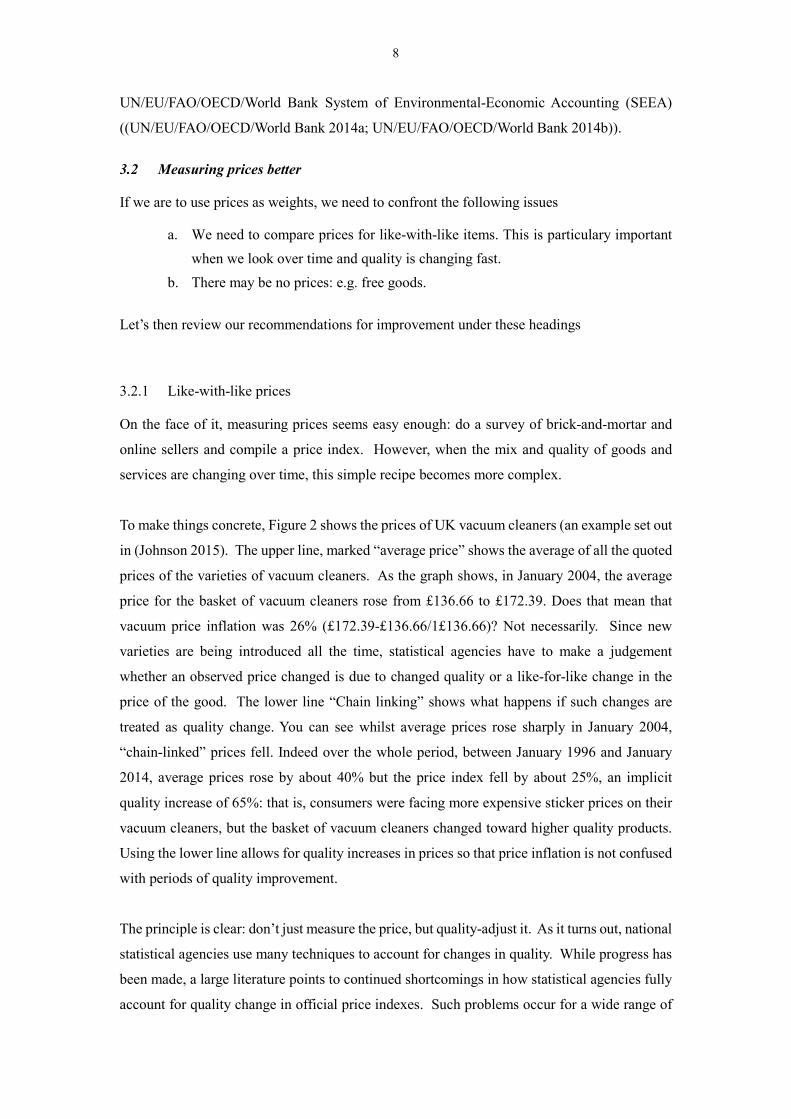
To make things concrete, Figure 2 shows the prices of UK vacuum cleaners (an example set out
in (Johnson 2015). The upper line, marked “average price” shows the average of all the quoted
prices of the varieties of vacuum cleaners. As the graph shows, in January 2004, the average
price for the basket of vacuum cleaners rose from £136.66 to £172.39. Does that mean that
vacuum price inflation was 26% (£172.39-£136.66/1£136.66)? Not necessarily. Since new
varieties are being introduced all the time, statistical agencies have to make a judgement
whether an observed price changed is due to changed quality or a like-for-like change in the
price of the good. The lower line “Chain linking” shows what happens if such changes are
treated as quality change. You can see whilst average prices rose sharply in January 2004,
“chain-linked” prices fell. Indeed over the whole period, between January 1996 and January
2014, average prices rose by about 40% but the price index fell by about 25%, an implicit
quality increase of 65%: that is, consumers were facing more expensive sticker prices on their
vacuum cleaners, but the basket of vacuum cleaners changed toward higher quality products.
Using the lower line allows for quality increases in prices so that price inflation is not confused
with periods of quality improvement.
The principle is clear: don’t just measure the price, but quality-adjust it. As it turns out, national
statistical agencies use many techniques to account for changes in quality. While progress has
been made, a large literature points to continued shortcomings in how statistical agencies fully
account for quality change in official price indexes. Such problems occur for a wide range of
9
products: on high-tech/digital goods and services and medical goods/services see (Byrne and
Corrado 2017; Byrne, Oliner, and Sichel 2013). Thus, we recommend, as did Johnson (a) close
monitoring and detailing of the judgements made on what is like for like and (b) especially
looking at price adjustment for high-technology goods, where specifications are changing
rapidly and it’s particularly hard to compare like with like.
Figure 2: Two price series for vacuum cleaners.
Source: ONS, graph by Johnson (2015), Figure 12-2.
3.2.2 No prices: free goods
What if we don’t have any prices at all? In the non-digital world, nobody worried about this.
But in a world of free apps, search engines, email and Wikipedia this is a problem we need to
tackle. Do we therefore have to junk GDP?
No. One way to make progress is to find out what prices would be and to add to GDP the value
of what consumers would be willing to pay for the free good (more details in Diewert and Fox
2017). So how do we find out what people are willing to pay? In the era of the Internet, we
can cheaply reach many people (if they are online) and ask them. Of course, it’s easy to ask
10
people, but harder to know if they are telling the truth and/or cannot be bothered with yet
another intrusive internet survey. So we need to do better.
In recent work Erik Brynjolfsson and his students (Gannamaneni 2017)) conduct Single Binary
Discrete Choice Experiments using a huge sample of online users at low cost via Google
Consumer Surveys to make a choice: keep a digital good (say Facebook or email) or give it up
in return for $X. In the experiment, $X is varied, which can easily be done online. Thus for
example, you might ask three random samples of users whether they would be willing to give
up a month of Facebook access for $30, $20 or $10, thereby tracing out the different valuations
at various prices, and so building up a picture of total valuation, which is then added to GDP
The very large samples potentially dominate other sampling methods (such as a panel of
consumers, or a sample of undergraduates in a researcher’s university). Even better, researchers
can check responses are accurate by randomly selecting individuals and actually fulfilling their
selection. So, if randomly selected, and if they bid $30 to give up Facebook for a month (before
the random selection) they can indeed earn $30 but as long as they do indeed give it up
(Facebook can check on this). By knowing that a bid will be accepted with some probability,
responders are more likely to respond accurately. As examples, median monthly valuations are
around $14 for Facebook, $500 for email and $1,300 for search engines, and results seem close
to those validated by random selection. In this way we can add the value of free goods to GDP.
4 Extending GDP
4.1 From production to well-being
As we have seen, GDP measures production: Boeings, iPads or Big Macs. But what if we go
beyond production to well-being? A monk in a remote Tibetan monastery values quiet, solitude
and contemplation. A Wall Street trader in a New York nightclub probably takes a different
view. So if we are to look at well-being, we need to solve two problems: (a) what indicators
shall we put into a well-being calculation that are comparable? (b) how shall we incorporate
these extra elements according to the principles of no double-counting and meaningful weights?
Let’s start with the question of what indicators of well-being we want to include. Most people
would probably agree that having more happy families would add to well-being. But how are
we to measure this? Asking a parent how happy they are with their teenage child will likely
elicit a range of answers. But then you have to ask the children too. And the grandparents, and
11
the cousins and the uncles and aunts. Then you have to decide how to treat the childless. Once
you have sorted this out, you then have to ask how happy people are with their neighbours.
And their workmates: the list is potentially endless.
To go down this route then, the only thing to ask is some summary measure of well-being,
taking everything into account. This is subject to at least two very large problems. First, part
of well-being might come from consumption, immediately violating the principle of double-
counting. Second, what interpretation do we give to answers about well-being? If a parent of
an angry teenager answers they are unhappy, do we conclude we should get rid of teenagers?
In the light of these difficulties, we advocate having only three broad indicators of social well-
being: consumption, leisure and what we shall call security. How do we justify this?
Let’s start by thinking about individuals. What’s common to every individual the world over?
There is one answer suggested by the economist Gary Becker. Everyone faces the same
constraint in that there are only 24 hours in the day. How can they spend that time? They can
sleep, work or take leisure. So their well-being depends on how much leisure they can take (a
good thing) and how much income they can generate from working (also a good thing). In turn
that income allows them to consume the goods and services they need and like: food, travel and
wifi reception. So, an important component of well-being is leisure hours and consumption.
Note that this way of thinking avoids double-counting: leisure hours, not spending on leisure
(which is consumption).
But we can go further. Individuals presumably worry not just about their consumption today,
but in the future. After all, they make current sacrifices for future gain (going to school) and
buy durable goods for future benefit (buying a house). And that future consumption depends
on being around to enjoy it: life expectancy. It also depends on the interaction of unexpected
shocks to the economic system, inequality and the social safety net. So for example, the Great
Depression in the US, an adverse shock in a very unequal society with little safety net, turned
Wall Street bankers into street apple sellers, forcing them to lower their consumption and work
many more hours.
Let’s then adopt the catch-all term “security” for this part of well-being. Thus well-being is
composed of consumption, leisure and security.
At first pass, all this looks a long, long way from GDP. But is it really? Let’s start with an
economy that (a) produces wheat/bread and (b) makes tractors. So GDP, or production, is the
12
bread plus the tractors. Current consumption is just the bread. Now, go back to the logic above:
suppose well-being is a mix of current and future consumption (ignore leisure and security for
the moment). How does that compare with GDP i.e. production? The answer is that it’s closer
than you think.
We can easily boost consumption in the economy by taking workers away from making tractors
and have more of them on the farm harvesting the wheat. But if the tractors are not replaced,
future consumption falls. So, having part of the workforce producing current consumption and
part producing machines might be good for welfare, since machines will help with consumption
in the future. So GDP, by counting production, includes both current consumption but also
something about future consumption. So we might ask: if well-being is the stream of
consumption over time might GDP in fact count well-being by counting both current
consumption and that in the future? In a remarkable paper, the economist Martin Weitzman
(Weitzmann 1976) showed that, leaving aside leisure and security, a few adjustments to GDP
will indeed measure welfare, precisely by capturing that consumption stream. So in this case
at least, (slightly adjusted) GDP is in fact equal to welfare.
What if we wanted to go further and incorporate leisure and security? This is the subject of a
recent study by Jones and Klenow (2016). They gathered cross-country data on GDP, hours of
work i.e. the inverse of leisure (very high in the US and most developing countries and low
elsewhere) and aspects of security. Their summary measures of security were mortality and
consumption/working hours inequality, capturing the idea that in the event of an adverse shock
someone at the top would have less consumption and more working hours in an unequal society.
Inequality (measured as the standard deviation) of consumption and leisure are relatively low
in, for example, France and Italy, but relatively high in the US and China (for example, the
standard deviation of annual hours worked is 747 in France, 905 in Italy, 1,091 in the US and
1,093in China, see their table 2).
Having done this, they then had to settle on some weights for consumption versus leisure, which
they did by choosing a variety of numbers, starting from the assumption that preference for
leisure varies with the square of leisure hours: as it turns out, their results are insensitive to this.
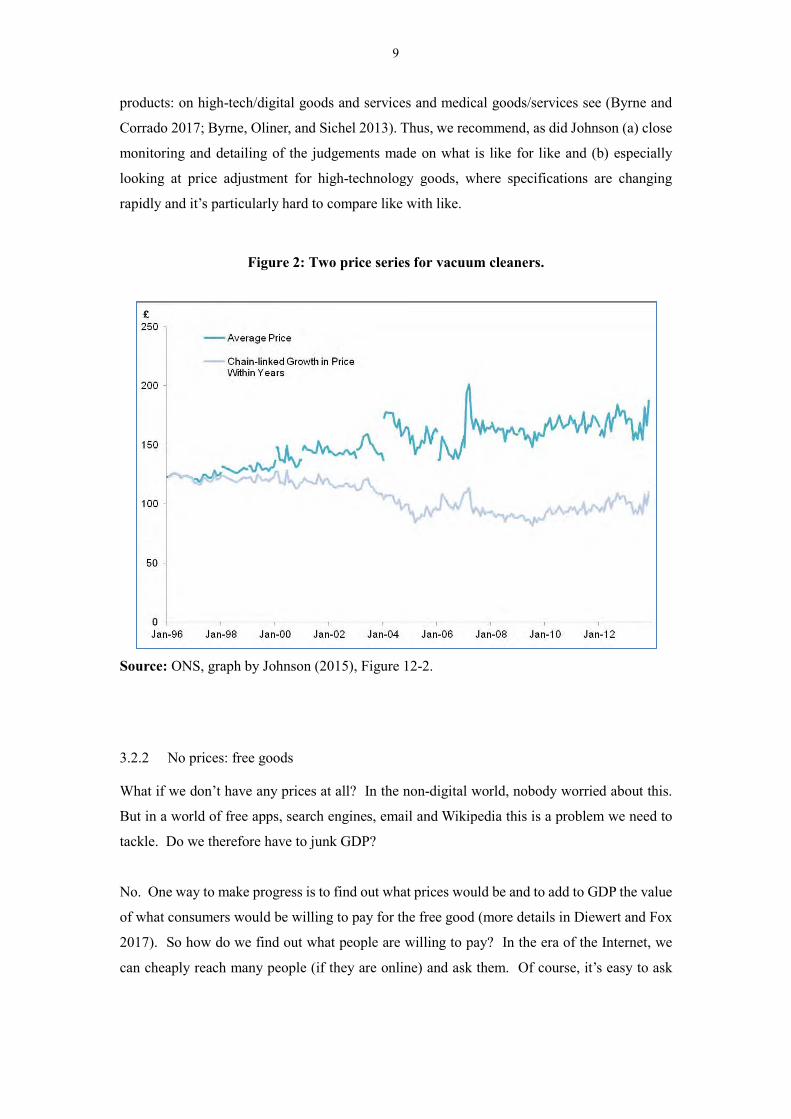
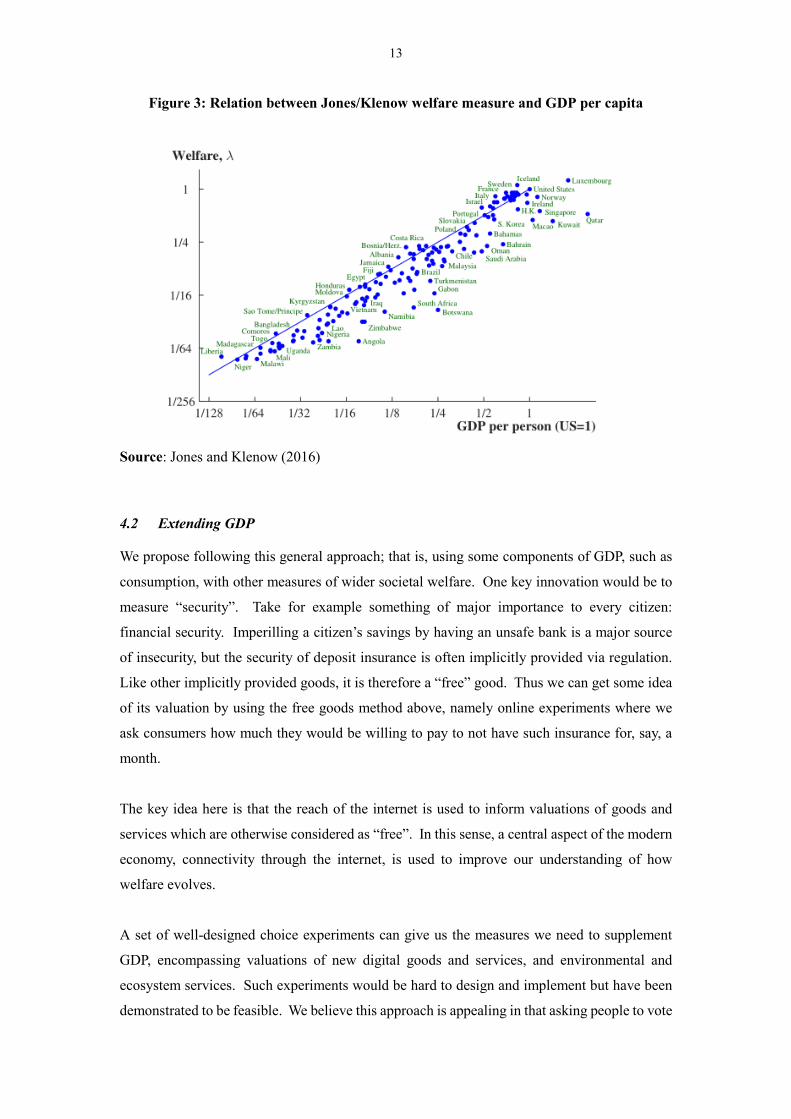
Remarkably, their measure of well-being is strongly correlated with GDP per capita, with a
correlation coefficient of 0.98 across about 100 countries: see Figure 3. So for example, GDP
per capita in the UK is 75% of the US level. But working hours are 34% lower and life
expectancy 2% longer, so it turns out that that, on this measure, welfare is 97% that of the US
level.
13
Figure 3: Relation between Jones/Klenow welfare measure and GDP per capita
Source: Jones and Klenow (2016)
4.2 Extending GDP
We propose following this general approach; that is, using some components of GDP, such as
consumption, with other measures of wider societal welfare. One key innovation would be to
measure “security”. Take for example something of major importance to every citizen:
financial security. Imperilling a citizen’s savings by having an unsafe bank is a major source
of insecurity, but the security of deposit insurance is often implicitly provided via regulation.
Like other implicitly provided goods, it is therefore a “free” good. Thus we can get some idea
of its valuation by using the free goods method above, namely online experiments where we
ask consumers how much they would be willing to pay to not have such insurance for, say, a
month.
The key idea here is that the reach of the internet is used to inform valuations of goods and
services which are otherwise considered as “free”. In this sense, a central aspect of the modern
economy, connectivity through the internet, is used to improve our understanding of how
welfare evolves.
A set of well-designed choice experiments can give us the measures we need to supplement
GDP, encompassing valuations of new digital goods and services, and environmental and
ecosystem services. Such experiments would be hard to design and implement but have been
demonstrated to be feasible. We believe this approach is appealing in that asking people to vote
14
with real money is likely to yield useful measures rather than constructing indexes or
dashboards with an arbitrary collection of elements and weights.
5 Conclusions
We propose here not to demolish GDP, but to repoint and to extend it. Our argument depends
upon two key observations. First, a new index will be only useful if it (a) avoids double
counting and (b) has sensible weights. Second, GDP measures production. It captures well-
being only to the extent that all that matters is part of production. To expect an unaltered (or
unextended) GDP to capture well-being sets GDP up to fail.
Regarding repointing, we think measuring intangible capital, quality-adjusted prices and free
goods will help GDP capture the move to the knowledge economy and its rapid digitization.
The initial work on this area ( e.g. Corrado, Hulten, and Sichel 2009; Diewert and Fox 2017)
suggests it can be done and within the current broad framework of GDP: similar principles hold
for the environment. Regarding extending, GDP is not as far away from well-being as some
seem to think: we propose to add to the consumption part of GDP other indicators (e.g.,
financial security) but in a systematic way to get it closer to an accepted measure of well-being.
15
References Byrne, David M., and Carol Corrado. 2017. “ICT Prices and ICT Services: What Do They Tell
Us about Productivity and Technology?” International Productivity Monitor, no. Fall.
Byrne, David M., Stephen D. Oliner, and Daniel E. Sichel. 2013. “Is the Information
Technology Revolution Over?” International Productivity Monitor 25 (Spring): 20–36.
Corrado, Carol, Charles Hulten, and Daniel Sichel. 2005. “Measuring Capital and Technology:
An Expanded Framework.” In Measuring Capital in the New Economy, edited by Carol
Corrado, John Haltiwanger, and Daniel Sichel, 11–46. Studies in Income and Wealth No.
65. Chicago: University of Chicago Press.
———. 2009. “Intangible Capital And U.S. Economic Growth.” Review of Income and Wealth
55 (3). International Association for Research in Income and Wealth: 661–85.
Diewert, Erwin, and Kevin J. Fox. 2017. “The Digital Economy, GDP and Consumer Welfare.”
Presented at the NBER Summer Institute CRIW Workshop 17-18 July 2017.
Gannamaneni, Avinsash. 2017. “Using Massive Online Choice Experiments to Measure
Changes in Well-Being.” MIT.
Johnson, Paul. 2015. “UK Consumer Price Statistics: A Review.”
Jones, Charles I, and Peter J Klenow. 2016. “Beyond GDP? Welfare across Countries and
Time.” American Economic Review 106 (9): 2426–57.
Kenessey, Zoltan. 1987. “The Primary, Secondary, Tertiary And Quaternary Sectors Of The
Economy.” Review of Income and Wealth 33 (4). Blackwell Publishing Ltd: 359–85.
doi:10.1111/j.1475-4991.1987.tb00680.x.
Ravallion, Martin. 2012. “Mashup Indices of Development.” The World Bank Research
Observer 27 (1). World Bank, Washington DC: 1–32. doi:10.1093/wbro/lkr009.
Tarasofsky, Abe. 1998. “GDP and Its Derivatives as Welfare Measure: A Selective Look at the
Literature.” CSLS Conference on the State of Living Standards and the Quality of Life in
Canada.
UN/EU/FAO/OECD/World Bank. 2014a. “System of Environmental-Economic Accounting:
Central Framework.” New York.
———. 2014b. “System of Environmental-Economic Accounting: Experimental Ecosystem
Accounting.” New York.
Weitzmann, M L. 1976. “On the Welfare Significance of National Product in a Dynamic
Economy.” Quarterly Journal of Economics 90 (364): 156–62.