Embed Size (px)
Citation preview

This article was downloaded by: [University of New Hampshire]On: 07 October 2014, At: 04:26Publisher: Taylor & FrancisInforma Ltd Registered in England and Wales Registered Number: 1072954 Registeredoffice: Mortimer House, 37-41 Mortimer Street, London W1T 3JH, UK
Journal of Hunger & EnvironmentalNutritionPublication details, including instructions for authors andsubscription information:http://www.tandfonline.com/loi/when20
Improving Food Security Classification ofHouseholds With ChildrenMark Norda & Alisha Coleman-Jensena
a Food Economics Division, Economic Research Service, U.S.Department of Agriculture, Washington, DC, USAPublished online: 25 Aug 2014.
To cite this article: Mark Nord & Alisha Coleman-Jensen (2014) Improving Food Security Classificationof Households With Children, Journal of Hunger & Environmental Nutrition, 9:3, 318-333, DOI:10.1080/19320248.2014.898174
To link to this article: http://dx.doi.org/10.1080/19320248.2014.898174
PLEASE SCROLL DOWN FOR ARTICLE
Taylor & Francis makes every effort to ensure the accuracy of all the information (the“Content”) contained in the publications on our platform. However, Taylor & Francis,our agents, and our licensors make no representations or warranties whatsoever as tothe accuracy, completeness, or suitability for any purpose of the Content. Any opinionsand views expressed in this publication are the opinions and views of the authors,and are not the views of or endorsed by Taylor & Francis. The accuracy of the Contentshould not be relied upon and should be independently verified with primary sourcesof information. Taylor and Francis shall not be liable for any losses, actions, claims,proceedings, demands, costs, expenses, damages, and other liabilities whatsoever orhowsoever caused arising directly or indirectly in connection with, in relation to or arisingout of the use of the Content.
This article may be used for research, teaching, and private study purposes. Anysubstantial or systematic reproduction, redistribution, reselling, loan, sub-licensing,systematic supply, or distribution in any form to anyone is expressly forbidden. Terms &Conditions of access and use can be found at http://www.tandfonline.com/page/terms-and-conditions

Journal of Hunger & Environmental Nutrition, 9:318–333, 2014ISSN: 1932-0248 print/1932-0256 onlineDOI: 10.1080/19320248.2014.898174
Improving Food Security Classificationof Households With Children
MARK NORD and ALISHA COLEMAN-JENSENFood Economics Division, Economic Research Service, U.S. Department of Agriculture,
Washington, DC, USA
We examine the extent to which the household food securityclassification methods currently used by the US Department ofAgriculture may bias comparisons of food security between house-holds with and without children and between households withchildren of different ages. An alternative method for classifyinghouseholds with children as to their food security status is describedthat removes the source of those biases by considering the food secu-rity of adults and children based on separate measures. Using datafrom the Current Population Survey Food Security Supplementsfrom 2001 to 2011, the analysis suggests that the current methodsmay have overstated the prevalence of food insecurity and under-stated the prevalence of very low food security in households withchildren vis-à-vis households without children. The extent to whichvery low food security may have been understated increased duringand following the economic downturn of 2008.
KEYWORDS food security, food insecurity, food security measure-ment
INTRODUCTION
Accurate representation of the extent and severity of food insecurity invarious subpopulations is an important function of the US food security
This article not subject to US copyright law.The views expressed are those of the authors and should not be attributed to the
Economic Research Service or the United States Department of Agriculture.Address correspondence to Alisha Coleman-Jensen, Food Economics Division, Economic
Research Service, US Department of Agriculture, Economic Research Service, Room 5-233A, 1400 Independence Ave., SW, Mail Stop 1800, Washington, DC 20250-0002, USA.E-mail: [email protected]
318
Dow
nloa
ded
by [
Uni
vers
ity o
f N
ew H
amps
hire
] at
04:
26 0
7 O
ctob
er 2
014

Improving Food Security in Children 319
monitoring and reporting system. In this article, we examine the extent towhich the classification procedures currently used by the US Department ofAgriculture (USDA) may distort such comparisons between households withand without children and between households with children in differentage ranges, and we describe a modified classification procedure that wouldreduce those biases.
Food security, defined as access by all people at all times to adequatefood for active healthy lives, is an important foundation for a nation’s nutri-tion and health. The USDA monitors the food security of U.S. householdsusing data from an annual, nationally representative household survey, theCurrent Population Survey Food Security Supplement (CPS-FSS). Food secu-rity is measured in the CPS-FSS, and in several other national surveys inthe United States, by responses to a series of questions about experiencesand conditions that characterize households when they are having difficultymeeting their food needs.1–4
Responses to the food security questions are combined to represent theseverity of food insecurity in each household using statistical methods basedon a latent trait item response theory (IRT) statistical model. Latent trait mod-els are used in the social sciences to measure constructs that are not directlyobservable but that may be inferred from observable conditions or occur-rences caused by the unobservable (ie, latent) trait. IRT statistical methods,which were developed primarily in the educational testing field, measurethe latent trait of competency or ability in a specific field of knowledge byresponses to a set of test items. The food security scale, which measures thelatent trait of severity of food insecurity experienced by households, is basedon one of the simplest IRT statistical models, the single-parameter logisticlatent trait model commonly known as the Rasch model.5,6
To summarize the food security of the population overall and of selectedsubpopulations, households are classified as to their food security statusbased on their measured severity of food insecurity. The percentages ofhouseholds (prevalence rates) in these severity categories are then reportedas population summary measures. Food security status is typically classifiedin 4 categories: high, marginal, low, and very low. For reporting purposes,the high and marginal categories are combined and described as “foodsecure,” and the low and very low categories are combined and described as“food insecure.” The percentage of households in the most severe category,very low food security, is also reported separately.
This food security measure has been the cornerstone of USDA’s domes-tic household food security monitoring system since its development in themid-1990s.13 It has played important roles in assessing and communicatingthe extent of food hardship in the country, identifying the subpopulationsmost vulnerable to food insecurity and supporting research into the causesand consequences of food insecurity and the role of USDA’s food andnutrition assistance programs.
Dow
nloa
ded
by [
Uni
vers
ity o
f N
ew H
amps
hire
] at
04:
26 0
7 O
ctob
er 2
014

320 M. Nord and A. Coleman-Jensen
Following a decade of use, the measurement methods were reviewedby a panel convened by the Committee on National Statistics at the requestof USDA. The panel affirmed the general statistical approach, recommendedseveral minor changes that USDA subsequently adopted, and recommendedthat USDA investigate several more substantial potential technical enhance-ments to the statistical methods.4 The USDA’s Economic Research Serviceassessed 5 of those potential enhancements with technical assistance fromresearchers at Iowa State University and Colombia University TeachersCollege.7 In summary, that study concluded that “. . . little would be gainedby measuring food security with any of the more complex measures, pro-vided an alternative methodology can be implemented to remove the currentbias in comparing the prevalence of food insecurity between households withand without children”(p4) (emphasis added). The “current bias” in this pro-viso refers to distortions in comparisons of food security between householdswith and without children, and between households with children in dif-ferent age ranges, that are inherent in the USDA’s current food securityclassification procedures. In this article, we document the source and extentof those distortions and describe a modified classification procedure thatwould avoid those biases.
This article explores the classification question only on theoretical andmeasurement-statistical grounds. It will also be important to assess which ofthe 2 classification methods is more consistent with alternative indicators offood insecurity and with expected outcomes of food insecurity. That assess-ment is beyond the scope of this article but will be crucial, along with theevidence provided in this article, for informing a decision on how best toclassify the food security status of households with children.
BIASES IN THE CURRENT MEASUREMENT AND CLASSIFICATIONMETHODS
The methods that the USDA uses to measure the severity of food insecurityin households and to classify them as to food security status are justifiedstatistically to the extent that responses to the food security questions areconsistent with assumptions of the Rasch measurement model. Provided thatthose assumptions are met, a household’s raw score on a specific set ofitems—that is, the number of potentially food insecure conditions reported—is an ordinal measure of the severity of food insecurity experienced by thehousehold. In the original development of the food security measure, itemswere assessed for inclusion in the scale with the intention of meeting Raschmodel assumptions in order to achieve that ordinality.1 So, for example,households with children with raw scores 0–2 (out of 18) are classified asfood secure, those with raw scores 3–7 are classified as having low foodsecurity, and those with raw scores 8–18 are classified as having very lowfood security.3
Dow
nloa
ded
by [
Uni
vers
ity o
f N
ew H
amps
hire
] at
04:
26 0
7 O
ctob
er 2
014

Improving Food Security in Children 321
In recent years, as the food security measure has been used for increas-ingly detailed and complex analysis, researchers have become aware thatthe current standard methods of food security measurement and classifica-tion have 2 characteristics that cause biases in prevalence rates large enoughto be substantively important.7 The first is that response data to the 18 itemsadministered to households with children represent 2 dimensions, whereasthe Rasch model assumes unidimensionality. Though not egregious, the vio-lation is large enough to cause a modest distortion in some food securityprevalence comparisons. The model assumption is expressed more gener-ally as conditional independence of item responses. That is, the correlationsamong item responses across households are entirely due to the commonassociations of those items with the latent trait, and responses to items areuncorrelated across households that have the same value on the latent trait.
Responses to the 18 items in the household scale, however, generallyrepresent 2 dimensions, corresponding to the severity of food insecurityamong adults and the severity of food insecurity among children. The dif-ference between the 2 dimensions is due primarily to the ages of children.8
Younger children are generally shielded by their parents from effects of foodinsecurity to a greater extent than older children at a given level of sever-ity of food insecurity among adults in the household.9,10 The distortion thatresults from this bidimensionality in the measure is that the food insecurityof households with only very young children is understated relative to thatof households with older children or households without children. Althoughthis is true across the range of severity of food insecurity, it is most notice-able for very low food security. For overall food insecurity, this bias is morethan offset by the second source of bias, which is described next.
The second source of bias in the current standard method of householdfood security classification is that the threshold for food insecurity appliedto households without children differs in severity from the threshold appliedto households with children. This biases comparisons of prevalence rates offood insecurity between households with and without children. This problemdoes not result from any violation of assumptions of the measurement modelbut rather from USDA’s policy of classifying households discretely as foodsecure or food insecure based on raw score. The problem occurs because noraw score–based threshold on the 10-item scale that is applied to householdswithout children is exactly equivalent in severity to the 3+ threshold for foodinsecurity on the 18-item scale applied to households with children. Thesame raw-score threshold of 3+ is applied to households with no children,but it represents a more severe level of food insecurity (Figure 1). A rawscore of 2+ for households with no child would represent a less severe levelof food insecurity. The USDA is aware of this bias and includes a footnote inits annual food security report describing the source and approximate extentof the bias. For example, Coleman-Jensen et al. (footnote 11),3 commentingon the difference in prevalence rates of food insecurity in 2012 betweenhouseholds with children (20.0%) and without children (11.9%), stated,
Dow
nloa
ded
by [
Uni
vers
ity o
f N
ew H
amps
hire
] at
04:
26 0
7 O
ctob
er 2
014

322 M. Nord and A. Coleman-Jensen
1
2
3
4
5
6
7
8
9
10
11
12
13
14
15
16
17
18
1
2
3
4
5
6
7
8
9
10
0
2
4
6
8
10
12
14
Se
ve
rit
y o
f h
ou
se
ho
ld f
oo
d i
nse
cu
rit
y*
Household
with child
Household
with no child
FIGURE 1 Severity of food insecurity (latent trait measure) by raw score for households withand without children. ∗The vertical axis represents the Rasch model estimate of the householdparameter for the indicated raw score. This is the estimated mean measure on the latent trait(severity of food insecurity) for households with that raw score. The parameter for householdswith maximum scores, those that affirmed all 18 items (all 10 items for households with nochildren), are technically undefined. The values shown are approximations based on rawscores a half-unit below maximum. Source: Guide to Measuring Household Food Security:Revised 2000, Exhibit C-2.2.
About one-third of the difference in food insecurity between householdswith and without children results from a difference in the measuresapplied to the two types of households. Responses to questions aboutchildren as well as adults are considered in assessing the food securitystatus of households with children, but for both types of households, atotal of three indications of food insecurity is required for classificationas food insecure.3, p.12
The corresponding problem for determination of very low food security issmaller because the raw score thresholds applied to households with chil-dren (8+) and households without children (6+) correspond to more nearlyequal levels of severity of food insecurity. In addition, the proportions ofhouseholds in each raw score near the threshold for very low food securityare smaller than those near the threshold for food insecurity.
Dow
nloa
ded
by [
Uni
vers
ity o
f N
ew H
amps
hire
] at
04:
26 0
7 O
ctob
er 2
014

Improving Food Security in Children 323
The bias due to the difference in severity of thresholds for food inse-curity could be obviated by assigning food security status probabilisticallyrather than discretely, taking into account the measurement error inherentin the latent trait measure.4,7 This method would support estimation of pop-ulation prevalence rates beyond a consistent threshold for households withand without children. There are, however, advantages to classifying house-holds discretely based on raw scores, provided that this can be done withoutintroducing excessive distortions in the national statistics.7 The discrete clas-sification process is more easily explained to policy officials and the publicand therefore creates a more transparent measurement system. This simplic-ity and transparency has considerable value in a highly visible indicator ofwell-being such as the prevalence of food insecurity. Furthermore, thoughprobabilistic assignment of food security status would solve the problem ofunequal thresholds, it would not solve the problem of bidimensionality.
In this article, we describe an alternative food security classification pro-cedure for households with children that avoids both of these biases. Theclassification procedure incorporates information on the food security statusof both adults and children in the households but uses separate measuresfor the 2 age groups to do so. Using the alternative measure as a baseline,we then assess the extent to which the current standard procedures biascomparisons of statistics routinely published by the USDA.
DATA AND METHODS
Data are from the CPS-FSS conducted in December of each year from 2001 to2011. The CPS-FSS is sponsored by the USDA’s Economic Research Serviceand fielded annually by the US Census Bureau as a supplement to its monthlyCurrent Population Survey. The CPS-FSS includes about 45 000 householdseach year and is representative of the civilian, noninstitutionalized popula-tion of the nation. It is the data source for the USDA’s annual reports onhousehold food security in the United States.3
Food security classifications are based on 3 currently defined scales:
● HH18, the 18-item “household scale” or “combined adult–child scale,”includes 3 household-referenced items, 7 adult-referenced items, and 8child-referenced items. This is the scale currently used to classify house-holds with children as to the food security status of the household. Rawscores range from 0 to 18, with 0–2 indicating food security, 3–7 low foodsecurity, and 8–18 very low food security. (Technically, the scale includes15 items, of which 12 are dichotomous and 3 are trichotomous. The tri-chotomous items represent whether the condition or behavior occurrednever, in only 1 or 2 months, or in 3 or more months. The items contribute1 raw score point for occurrence in only 1 or 2 months and 2 points foroccurrence in 3 or more months.)
Dow
nloa
ded
by [
Uni
vers
ity o
f N
ew H
amps
hire
] at
04:
26 0
7 O
ctob
er 2
014
324 M. Nord and A. Coleman-Jensen
● AD10, the 10-item “adult scale” includes the 3 household-referenced itemsand 7 adult-referenced items in HH18. This is the scale currently usedto classify households with no children present. It can also be used toclassify households with children as to the food security status of adults inthe household. Raw scores range from 0 to 10, with 0–2 indicating foodsecurity, 3–5 low food security, and 6–10 very low food security.
● CH8 includes the 8 child-referenced items in HH18. This scale is currentlyused to classify households with children as to the food security status ofchildren in the household. Raw scores range from 0 to 8, with raw scores0–1 indicating food security among children, 2–4 low food security amongchildren, and 5–8 very low food security among children.
The alternative household food security classification is based on cross-classification by the AD10 and CH8 scales. Households with children whoare food insecure on either the adult or child scale are classified as foodinsecure. Households with very low food security on either scale are classi-fied as having very low food security. Those classified as food insecure butwithout very low food security are classified as having low food security.Classification of households with no children is unchanged from the currentmethod. The HH18 scale would have no further role in food security mea-surement. In the rest of the article, we refer to this as the cross-classificationmethod. Health Canada uses this method for their reports on householdfood insecurity, although they use a less severe threshold—raw score 2 orgreater—for adult food insecurity.11
The cross-classification method explicitly takes account of the adult–child bidimensionality in the response data by assessing the 2 dimensionsseparately. Households with and without children that have the same mea-sured severity of food insecurity among adults will be assigned the samefood security status unless children are classified in a more severe food inse-curity status than the adults. This is a rare condition, as will be seen in theFindings section. Households in which it does occur are justifiably classifiedin the more severe food insecure category.
Household demographic and economic data from the CPS labor forcecore survey are used to classify households as to household composition,income (relative to the federal poverty line), race and Hispanic ethnicity ofhousehold reference person, area of residence relative to metropolitan areas,and census geographic region. These follow the methods used in the USDA’sannual food security reports.3
The extent and practical importance of the biases in the current meth-ods are assessed by comparing prevalence rates of food insecurity and verylow food security based on current methods with those based on the cross-classification method. Prevalence rates based on the 2 methods are comparedat the national level, over time from 2001 to 2011, and across subpopulationsdefined by the household demographic and economic variables.
Dow
nloa
ded
by [
Uni
vers
ity o
f N
ew H
amps
hire
] at
04:
26 0
7 O
ctob
er 2
014

Improving Food Security in Children 325
FINDINGS
Before examining the detailed comparisons, it may be helpful to examinethe source and scale of the differences in classification between the currentstandard method and the cross-classification method. Most of the cells in across-tabulation of households by raw score on the adult and child scales areassigned to the same food security status by both methods (Table 1). Foodsecurity status differs between the two methods in just 14 cells, of which8 represent nonnegligible numbers of cases in national data. Looking firstat the food insecure threshold, on average over the study period, 1.98% of
TABLE 1 Percentage of Households With Children by Raw Score on the Adult and ChildFood Security Scales, Average 2001–2011a
Raw score, adult scale
Child food secureChild food insecure
Child low food security Child very low food securityRaw score on child food security scale
0 1 2 3 4 5 6 7 8
Adu
lt fo
od
secu
re
0 0.15 * * *
1 * *
2 1.98 *
Adu
lt fo
od in
secu
re Adu
lt lo
w
food
sec
urity 3
4 0.07
5 0.35 0.08
Adu
lt ve
ry lo
w f
ood
secu
rity
6 0.29 0.43
7 0.17
8
9
10
*Households in these cells would be classified as having very low food security by the cross-classification method but not by the current standard method. However, each of the cells had either no observed households or fewer than 0.01%, and the total in the 6 cells was less than 0.01%. Percentages are displayed only for cells for which food securitystatus based on cross-classification differs from that based on the current standard method.Shading indicates the current standard classification of households with children, which is based on a “household”
aPercentages are displayed only for cells for which food security status based on cross-classification differs from
raw score that is the sum of adult and child raw scores:
Food secure, combined raw score 0–2 (82.08 percent of households with children)Low food security, combined raw score 3–7 (13.06 percent of households with children)Very low food security, combined raw score 8–18 (4.86 percent of households with children)
that based on the current standard method.
Source: Calculated by the authors using data from the 2001–2011 Current Population Survey Food SecuritySupplements (CPS-FSS). U.S. Census Bureau. 2001-2011. Microdata files on CD-ROM.
Dow
nloa
ded
by [
Uni
vers
ity o
f N
ew H
amps
hire
] at
04:
26 0
7 O
ctob
er 2
014

326 M. Nord and A. Coleman-Jensen
households with children were classified as food insecure by the standardmethod but as food secure by the cross-classification method. These werehouseholds with raw score 2 on the adult scale and raw score 1 on the childscale. Thus, neither adults nor children were food insecure, although bothwere only marginally secure. Depending on the level of severity consideredto be appropriate for identifying food insecurity, these households could beconsidered either food secure or food insecure. We do not make any claimin that regard because within some range of severity, the precise level atwhich households should be declared food insecure is somewhat arbitrary.We argue only that within that range it is advantageous to classify householdswith and without children by consistent criteria.
The 1.98% of households that are classified as food insecure by thecurrent method but not by cross-classification was partially offset by a smallproportion (0.15%) of households with children that are classified as foodinsecure by cross-classification but not by the standard method. These arehouseholds with food insecurity among the children (raw score 2 on the childscale) and with no reported food insecure conditions among the adults (rawscore 0 on the adult scale). The net bias on the prevalence of food insecurityin the current method, then, was 1.83 percentage points, which amounted toabout 10% of the average prevalence of food insecurity in households withchildren over the study period (17.9%) and about 22% of the difference inprevalence of food insecurity between households with and without childrenas measured by current standard methods (8.4 percentage points).
Classification of very low food security differs between the standard andcross-classification for 3 raw score clusters, although only 2 had nonnegli-gible percentages of households. Households with raw scores 6 and 7 onthe adult scale and 0 on the child scale or with raw score 6 on the adultscale and 1 on the child scale had very low food security among adults butare classified as having low food security by the current standard methodbecause their combined raw score on the HH18 scale is 6 or 7. Six cells atthe other extreme, those with very low food security among children butcombined raw scores less than 8, would be similarly misclassified; however,most of these cells were empty, and their combined total was less than0.01% of households with children. Thus, a total of 0.89% of householdswith children had very low food security based on cross-classification butwere classified as having low food security by the standard method. Thispercentage was partially offset by 0.50% of households classified as havingvery low food security by the current methods but not having very low foodsecurity among either adults or children (raw scores 4 and 5 on the adultscale and raw scores 3 and 4 on the child scale). This leaves an average netdownward bias for very low food security in households with children of0.39 percentage points over the study period.
The differences in classification at the very low food security thresholdwould not necessarily indicate a problem with the current standard method if
Dow
nloa
ded
by [
Uni
vers
ity o
f N
ew H
amps
hire
] at
04:
26 0
7 O
ctob
er 2
014

Improving Food Security in Children 327
the differences were random with respect to household characteristics. But infact, ages of children differ substantially between households in the 2 groupsthat differ in classification on the standard and cross-classification methods.On average, children are younger in the first group, those with very lowfood security based on cross-classification, but not on the current standardclassification. In 27.6% of those households, the oldest child was 4 years oldor younger, compared to 9.1% of households in the second group—thosewith very low food security based on the current methods but not on cross-classification (analysis not shown). The corresponding percentages in whichthe oldest child was 12 years old or older were 38.0% and 55.5%.
Trends From 2001 to 2011
Over the study period, the prevalence of food insecurity in households withchildren averaged 1.8 percentage points lower based on cross-classification(16.1%) than on the current standard measure (17.9%; Figure 2). The differ-ence in prevalence rates for all households was about one third as large (0.6percentage point) because the classification of households with no childrenis the same in both methods and about two thirds of US households haveno children present. Over the study period, the difference in prevalencerates based on the 2 measures ranged from 1.2 to 2.4 percentage points forhouseholds with children and 0.4 to 0.8 percentage points for all households.Thus, the 2 methods represent trends in food insecurity similarly, althoughat different levels.
Trends in the estimated prevalence of very low food security differedbetween the 2 methods in more complex ways (Figure 3). Estimates ofvery low food security in households with children were higher based oncross-classification than on the current standard method throughout the studyperiod, but the gap widened beginning in 2008. The difference between
0
5
10
15
20
25
2001 2003 2005 2007 2009 2011
Per
cent
Households with children, current standard
Households with children, cross-classification
All households, current standard
All households, cross-classification
Households with no children
FIGURE 2 Prevalence of food insecurity based on current standard method and cross-classification method. Source: Calculated by the authors using data from the 2001–2011Current Population Survey Food Security Supplements.
Dow
nloa
ded
by [
Uni
vers
ity o
f N
ew H
amps
hire
] at
04:
26 0
7 O
ctob
er 2
014

328 M. Nord and A. Coleman-Jensen
0
1
2
3
4
5
6
7
8
2001 2003 2005 2007 2009 2011
Per
cent
Households with children, current standard
Households with children, cross-classification
All households, current standard
All households, cross-classification
Households with no children
FIGURE 3 Prevalence of very low food security based on current standard method andcross-classification method. Source: Calculated by the authors using data from the 2001–2011Current Population Survey Food Security Supplements.
the 2 methods averaged 0.2 percentage points from 2001 to 2007 and thenincreased to 0.8 percentage points from 2008 to 2011. The current standardmethod indicates that the prevalence of very low food security in house-holds with children declined by almost a percentage point after reachinga high in 2008–2009 and was essentially equal to that in households withno children in 2011. Cross-classification indicates a greater increase in verylow food security in households with children during and following the eco-nomic downturn and little improvement subsequently, with very low foodsecurity remaining more than a percentage point higher than the prevalencein households with no children.
The prevalence of very low food security among adults in householdswith children was very near that of very low food security based on cross-classification as depicted in Figure 3 during the entire study period (analysisnot shown). Thus, the current standard method underrepresents the extentto which very low food security increased among adults in households withchildren during the economic downturn and remained high subsequently.The difference is large enough to be of substantive importance, because itaffects the relative standing of households with and without children withregard to very low food security.
Associations With Household Characteristics
The cross-classification and current standard methods suggest similar asso-ciations of food insecurity with household characteristics that are routinelyreported by the USDA (Figure 4). Rankings across households with differentcharacteristics were the same based on either measure, and proportionatedifferences were generally similar. Within each category, the relative sizeof the difference between the 2 methods reflected primarily the share ofhouseholds with children in the category.
Dow
nloa
ded
by [
Uni
vers
ity o
f N
ew H
amps
hire
] at
04:
26 0
7 O
ctob
er 2
014

Improving Food Security in Children 329
0 10 20 30 40
All households
Household composition:
With children < 18 yrs
With children < 6 yrs
Married-couple families
Female head, no spouse
Male head, no spouse
With no children < 18 yrs
More than one adult
Women living alone
Men living alone
With elderly
Elderly living alone
Race/ethnicity of households:
White non-Hispanic
Black non-Hispanic
Hispanic
Other non-Hispanic
Household income-to-poverty ratio:
Under 1.00
Under 1.30
Under 1.85
1.85 and over
Area of residence:
Inside metropolitan area
In principal incorporated cities
Not in principal incorporated cities
Outside metropolitan area
Census geographic region:
Northeast
Midwest
South
West
Percent of households
Current standard
Cross-classification
FIGURE 4 Prevalence of food insecurity by current standard method and cross-classificationmethod, average 2001–2011. Source: Calculated by the authors using data from the 2001–2011Current Population Survey Food Security Supplements.
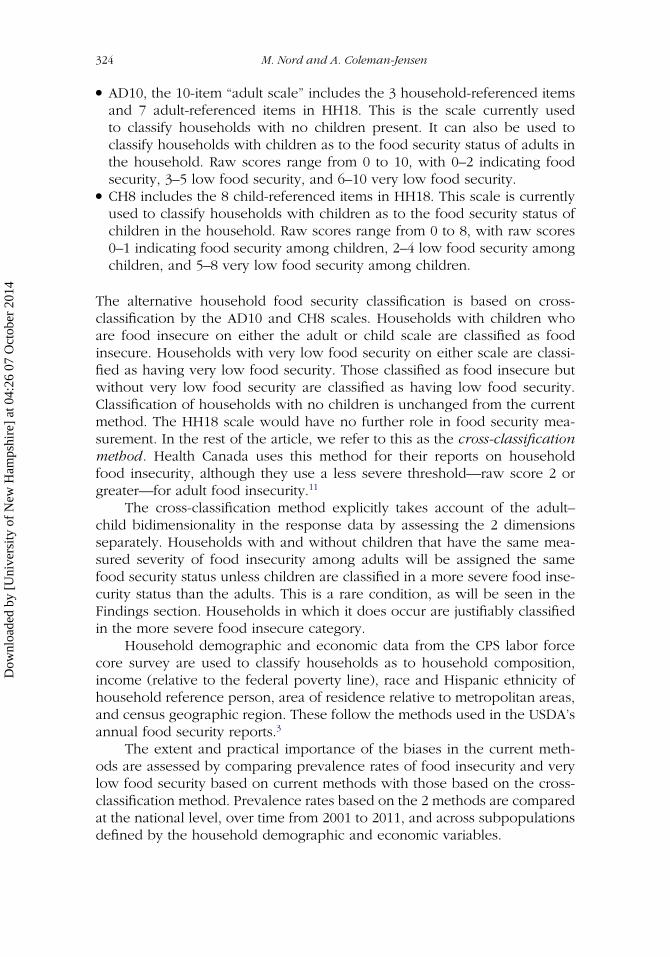
The 2 classification methods also suggest similar associations of very lowfood security with household characteristics (Figure 5). Proportionate differ-ences in the prevalence of very low food security were also generally similar
Dow
nloa
ded
by [
Uni
vers
ity o
f N
ew H
amps
hire
] at
04:
26 0
7 O
ctob
er 2
014
330 M. Nord and A. Coleman-Jensen
across categories of households except that Hispanic households registeredessentially the same prevalence based on either method.
0
All households
Household composition:
With children < 18 yrs
With children < 6 yrs
Married-couple families
Female head, no spouse
Male head, no spouse
With no children < 18 yrs
More than one adult
Women living alone
Men living alone
With elderly
Elderly living alone
Race/ethnicity of households:
White non-Hispanic
Black non-Hispanic
Hispanic
Other non-Hispanic
Household income-to-poverty ratio:
Under 1.00
Under 1.30
Under 1.85
1.85 and over
Area of residence:
Inside metropolitan area
In principal incorporated cities
Not in principal incorporated cities
Outside metropolitan area
Census geographic region:
Northeast
Midwest
South
West
Percent of households
Current standard
Cross-classification
2015105
FIGURE 5 Prevalence of very low food security by current standard method and cross-classification method, average 2001–2011. Source: Calculated by the authors using data fromthe 2001–2011 Current Population Survey Food Security Supplements.
Dow
nloa
ded
by [
Uni
vers
ity o
f N
ew H
amps
hire
] at
04:
26 0
7 O
ctob
er 2
014
Improving Food Security in Children 331
The comparisons of associations of household characteristics with foodinsecurity and very low food security based on the 2 classification meth-ods were repeated with the sample restricted to households interviewed in2010 and 2011 (analysis not shown). This was the period when the dif-ference in prevalence rates between the two measures was greatest. Theresults were qualitatively similar to those presented in Figures 4 and 5. Therecent divergence of prevalence rates in households with children based onthe 2 classification methods, then, appears to have been general and notconcentrated in a particular type of household.
DISCUSSION
Comparisons of prevalence rates of food insecurity and very low food secu-rity between households with and without children are biased by the currentmethods used to measure food security and to classify households as tofood security status. The alternative cross-classification method more accu-rately represents the food security of households with children compared tothat of households without children because it takes account of food securityconditions among adults and children separately. This avoids problems dueto bidimensionality in the 18-item scale and classifies households with andwithout children based on a consistent threshold yet maintains the simplicityof a raw score–based classification.
Comparisons of prevalence rates based on the current and alternativemethods indicate that over the past decade the prevalence of food insecurityin households with children as reported by the USDA was biased upward byan average of 1.8 percentage points vis-à-vis households with no children,a bias amounting to about 22% of the difference between the 2 groups.This resulted from the difference in the true severity of the thresholds forhouseholds with and without children, which dominated any bias due tobidimensionality.
The reported prevalence of very low food security, on the other hand,was biased downward for households with children vis-à-vis householdswithout children if the cross-classification method more accurately repre-sents true food security status. Prior to the economic downturn in 2008,the bias was about a quarter of a percentage point. However, the biasincreased in 2008 and later years. The standard methods indicated that theprevalence rates of very low food security for households with and with-out children converged from 2008 to 2011 and were essentially identical by2011 at 5.7%. However, the cross-classification method indicates that verylow food security among households with children remained higher thanthat among households with no children and was about 6.8% in 2011. Thedifference in these trends reflects an increase during and after the economicdownturn in the proportion of households with children in which only the
Dow
nloa
ded
by [
Uni
vers
ity o
f N
ew H
amps
hire
] at
04:
26 0
7 O
ctob
er 2
014

332 M. Nord and A. Coleman-Jensen
adults experienced very low food security. It may be that in the wake ofthe economic downturn, the mix of households in which adults had verylow food security shifted somewhat to include a larger share of householdswith higher long-term average income. Such households may have sufficientresources to provide enough food for the children even though adults arenot able to get enough to eat at times.
Other than biasing comparisons between households with and withoutchildren, the current methods do not appear to distort comparisons of foodinsecurity or very low food security among the subpopulations for whichthe USDA routinely reports food security. Research applications would beminimally affected by adopting the cross-classification method, because mostfood security analyses include controls for presence and ages of childrenor use only the adult scale. These practices are necessary irrespective ofwhich measure of household food security is used. It is primarily the foodsecurity monitoring function that would be improved by implementing thecross-classification method.
Implementation of the cross-classification method of assigning foodsecurity status would be straightforward because the adult and childscales on which it is based are already provided in the public-use data.Communication of results to policy officials and the public would be nomore difficult than under the current measurement system and could besomewhat more straightforward. Prevalence rates based on the new method-ology could be calculated for previous years at minimal cost and effort inorder to provide a consistent statistical series.
A limitation of the analysis is that it does not demonstrate that assigningfood security status by the cross-classification method strengthens associa-tions of measured food security with expected health and nutrition outcomesor with alternative measures of food security. Further research is neededto examine the association of food security status by each method withhealth outcomes in data from surveys such as the National Health andNutrition Examination Survey. However, because the severity of food secu-rity of households that are classified differently by the current and alternativemethods differ by only small increments (most of them by a single raw scorepoint on the current measure), large, multiyear samples would be requiredto obtain reliable results. The CPS-FSS includes several questions about foodadequacy that could provide standards for assessing the cross-classificationmethod versus the current method: a question about whether the house-hold would need to spend more for food to just meet their food needs orcould spend less; a question about food sufficiency; and a question aboutwhether the household obtained emergency food from a food pantry orsimilar agency.
If results of the proposed further research are consistent with the theory-based findings described in this article, then it may be worthwhile to make
Dow
nloa
ded
by [
Uni
vers
ity o
f N
ew H
amps
hire
] at
04:
26 0
7 O
ctob
er 2
014

Improving Food Security in Children 333
the relatively simple change to the cross-classification methodology as anincremental improvement to reduce the modest biases in the current systemand align the methodology more consistently with the underlying statisticaltheory.
REFERENCES
1. Hamilton WL, Cook JT, Thompson WW, et al. Household Food Security in theUnited States in 1995: Technical Report. Alexandria, VA: Food and ConsumerService, US Department of Agriculture; 1997.
2. Bickel G, Nord M, Price C, Hamilton WL, Cook JT. Guide to MeasuringHousehold Food Security, Revised 2000. Alexandria, VA: Food and NutritionService, US Department of Agriculture; 2000.
3. Coleman-Jensen A, Nord M, Singh A. Household Food Security in theUnited States in 2012. Washington, DC: Economic Research Service,US Department of Agriculture; 2013. Economic Research Report ERR-155. Available at: http://www.ers.usda.gov/publications/err-economic-research-report/err155.aspx. Accessed November 14, 2013.
4. Wunderlich GS, Norwood JL, eds. Food Insecurity and Hunger in the UnitedStates: An Assessment of the Measure, Report of the Panel to Review the USDepartment of Agriculture’s Measurement of Food Insecurity and Hunger.Washington, DC: Committee on National Statistics, National Research Council;2006.
5. Bond TG, Fox CM. Applying the Rasch Model: Fundamental Measurement in theHuman Sciences. Mahwah, NJ: Lawrence Erlbaum Associates; 2001.
6. Fischer GH, Molenaar IW, eds. Rasch Models: Foundations, Recent Developments,and Applications. New York, NY: Springer-Verlag; 1995.
7. Nord M. Assessing Potential Technical Enhancements to the US HouseholdFood Security Measures. Washington, DC: Economic Research Service,US Department of Agriculture; 2012. Technical Bulletin No. TB-1936.Available at: http://www.ers.usda.gov/publications/tb-technical-bulletin/tb1936.aspx. Accessed November 14, 2013.
8. Nord M, Bickel G. Measuring Children’s Food Security in US Households, 1995–99. Washington, DC: Economic Research Service, US Department of Agriculture;2002. Food Assistance and Nutrition Research Report No. FANRR-25.
9. Nord M. Youth are less likely to be food insecure than adults in the samehousehold. J Hunger Environ Nutr. 2013;8(2):146–163.
10. Coleman-Jensen A, McFall W, Nord M. Food Insecurity in Households WithChildren: Prevalence, Severity, and Household Characteristics, 2010–11.Washington, DC: Economic Research Service, US Department of Agriculture;2013. Economic Information Bulletin No. EIB-113. Available at: http://www.ers.usda.gov/publications/eib-economic-information-bulletin/eib113.aspx.Accessed November 14, 2013.
11. Health Canada. Community Health Survey, Cycle 2.2, Nutrition (2004)—Income-Related Household Food Security in Canada. Ottawa, ON, Canada: Office ofNutrition Policy and Promotion, Health Canada; 2007.
Dow
nloa
ded
by [
Uni
vers
ity o
f N
ew H
amps
hire
] at
04:
26 0
7 O
ctob
er 2
014