Embed Size (px)
Citation preview
Improving Financial Justice for Victims of Crime
RESEARCH PARTNERS Amanda Sawa, JRI Restitution Accountability Project Coordinator Crime Victim Compensation Commission State of Hawai‘i Joseph Allen, Ph.D. Chaminade University Criminology & Criminal Justice Department
Report Submitted: December 15, 2018
Research Funded through Justice Research & Statistics Association (JRSA) and U.S. Department of Justice, Office of Justice Programs through the Office for Victims of Crime Award #2016-XV-GX-K006, Creating a National Resource Center Providing Training and Technical Assistance that Enhances Service Providers’ Capacity to Support and Integrate Victim-Related Research and Evaluation Activities
Table of Contents Introduction 2
Problem Statement 2 Research Question(s) 4 Methodology 5
Data Sources, Quality, & Addressing Issues 6
Results 8 Overview of Victim Demographics 8 Compensation Awards 11 Overview of Criminal Cases 14 Restitution Requests 16 Restitution Orders 17 Restitution Payments & Collections 21
Discussion of Findings & Implications for Policy & Practice 34 Victim Demographics 34 Compensation Awards 34 Criminal Cases: Offenses & Sentence Dispositions 35 Restitution Requests 35 Restitution Orders 35 Restitution Payments/Collections 37 Concluding Statements on Findings Discussion 40
Research Partnership & Future (Pathways) 42 Ways Partnership can be Sustained 42 If/How the Project Strengthened the Relationship 42 Informing Stakeholders of Findings/Results (Present & Ongoing) 42
1

Introduction
Problem Statement Crime victims have historically been unable to recover from the financial impacts they suffered
as the result of a crime. In Hawai‘i, this is due to many failures of the criminal justice system to
order and collect the restitution required for the crime victim to fully recover financially. Section
706-605(1)(e), Hawai‘i Revised Statutes (HRS), was enacted in 1975 to provide the courts with
specific statutory authority to order defendants to make restitution payments to reimburse the
economic losses suffered by the victims of their crime. In 2006, the legislature enacted HRS §
706-646 which made it mandatory for courts to order “restitution for reasonable and verified
losses suffered by the victim or victims as a result of the defendant’s offense when requested by
the victim.” However, the real promise of justice for victims envisioned by these provisions has
not been fully realized. Not only is restitution due to victims not always ordered by the court, but
in cases where restitution is ordered, many offenders fail to pay the restitution they owe.
According to a 2010 report by the State of Hawai‘i Department of the Attorney General, 72.1%
of crime victims surveyed in Hawai‘i reported that they were financially affected by the crimes
committed against them. Forty-four percent (43.7%) of the survey respondents reported an 1
annual income of less than $50,000. Only victims of violent crime are eligible to receive 2
compensation from the State of Hawai‘i Crime Victim Compensation Commission (Commission).
All others, especially victims of property crimes, are currently underserved and must rely on
court-ordered restitution for repayment of their financial losses. When offenders fail to pay
1 State of Hawai‘i Department of the Attorney General, “Crime & Justice in Hawai‘i: 2010 Household Survey Report” (August 2011), 25. 2 State of Hawai‘i Department of the Attorney General, “Crime & Justice in Hawai‘i: 2010 Household Survey Report” (August 2011), 10.
2
restitution, it is victims who must suffer the financial consequences of the crime. These
underserved victims rely on criminal justice agencies to enforce restitution orders and to uphold
their rights as crime victims to be made financially whole.
Nearly fifteen years ago, the Commission initiated a pilot project to collect restitution from prison
inmates and parolees (the “Restitution Project”). In the first six months (January – June 2003) of
the Restitution Project, the Commission collected slightly more than $22,000 and in the past
fiscal year (FY2017), the Commission collected over $500,000. From January 1, 2003 through
June 30, 2017, the Commission opened over 8,000 restitution and crime victim compensation
fee cases and collected over $4 million to disburse to crime victims. The Commission believes
that the significant increase in restitution collection over the life of the Restitution Project reflect
the gradual institutionalization of restitution assessment by judges and of restitution
enforcement by correctional facilities and parole officers. The continually increasing amount of
restitution collected over the last few years has been enhanced by the Justice Reinvestment
Initiative (JRI), a policy package adopted by the Hawai‘i State Legislature in 2012, which
includes a comprehensive victim services component that prioritizes improvements to restitution
collections as a way to better serve victim needs and to increase offender accountability.
There has been augmented collaborations between criminal justice agencies and notable
progress in the improvement of restitution management since the onset of JRI in 2012.
However, there is still a significant amount of victim restitution owed, and a significant number of
victims who have not received the court-ordered restitution that they are entitled to. For
example, between 2006 and 2010, defendants placed on probation or other types of court
supervision were ordered to pay $21,574,596 in restitution, and of this amount, the defendants
3

paid $6,819,728 or approximately 31.6% of the amount ordered, leaving $14,754,868 unpaid. 3
More needs to be done to improve the reliability, consistency and efficiency of restitution
enforcement across all state and local agencies charged with collecting restitution from
offenders. In sum, the promise of financial justice for victims is still not fully realized.
Research Question(s) In cases where the Commission previously provided compensation awards to crime victims for
medical, mental health, or funeral costs, the Commission receives direct reimbursement of
those funds through restitution, allowing more crime victims to receive assistance. Because 4
the Commission stands in place of our victims for the sake of restitution recovery in these cases,
the Commission is uniquely positioned to examine the experience of a victim seeking to recover
their financial losses through restitution, and to look at the question of whether or not restitution
is consistently being ordered and collected as required by law. This project investigates
restitution assessment and enforcement in cases where the Commission awarded
compensation to crime victims and requested restitution from offenders in return. The data
collected for this project comes from two cohorts of compensation cases -- claims that were
closed in 2010 and 2014 -- which allows for a comparison of various metrics over time.
For this study, data collected and analyzed from compensation cases eligible for restitution
focus on better understanding victims’ experiences along the continuum of: (1) harms suffered,
to (2) legal judgments/orders, and finally to (3) the restitution payments received. Within each of
these stages of the process, the nature and extent of several indicators of completion are
investigated. Moreover, the progression of victims’ cases between these stages are analyzed.
3 Ken Kobayashi, “Convicts Scarcely Pay Harmed Innocents,” Star Advertiser (June 26, 2011). 4 Section 706-646(2), Hawai‘i Revised Statutes, provides, in part, that “the court shall order restitution to be paid to the crime victim compensation commission in the event that the victim has been given an award for compensation under chapter 351.”
4
This allows for an assessment of successful outcomes, (i.e. was restitution ordered and paid
pursuant to state law and/or court order), but also provides important information on where the
flow of cases break down, thus providing stakeholders with information on where to concentrate
efforts for future restitution cases.
Finally, this project builds on past research efforts that only included inmates or parolees, as it
also includes data about offenders on probation who were ordered to reimburse the
Commission through restitution. This will be an extension of past findings, especially in terms of
restitution assessment and payment/collection. It will also provide an opportunity to examine
restitution management system-wide, including collections by the Judiciary and the Department
of Public Safety/Hawai‘i Paroling Authority.
Methodology The success of this project relies upon a new collaboration between the Crime Victim
Compensation Commission and Research Partner, Dr. Joseph Allen, Associate Professor of
Criminology and Criminal Justice at Chaminade University. To allow for a meaningful
examination of restitution management over a period of time, the data set for this study is
derived from compensation claims the Commission closed in 2010 and 2014. This study is an
analysis of secondary data, ranging from victim demographic data to restitution payment data
which was captured through May 1, 2018. The data were collected by the Commission and
turned over to the researcher. The data were then made uniform and consistent for use in
statistical analyses, namely simple frequencies, cross tabulations, and mean comparisons.
5
For this study, the variables examined within each stage of the restitution process were the
following:
● Harms Suffered – (1) type of crime committed against the victim, and (2) types of
crime-related losses submitted by the victim.
● Legal Judgments/Orders – (1) conviction status of the perpetrator, (2) restitution
requests submitted to the judge, (3) sentencing outcomes, and (4) restitution orders.
● Restitution Received – (1) amount of restitution paid, (2) length of time for the victim to
receive first payment, (3) custody status of the offender at the time of payment (e.g.
probationer, inmate, or parolee), and (4) restitution paid-in-full/length of time for the
victim to receive full financial restitution.
The data are also explored across the victims’ ages, genders, and county/state of residence.
This information provides insight into the levels of service experienced by various groups.
Analyses of these variables provide a good overview of the current state of Hawaii’s criminal
justice processing mechanisms, specifically those related to victims and restitution. Further data
mining addresses the lags or breakdown in the flow of cases within and between these major
dispensation points to highlight potential obstacles encountered (e.g., via the system, the
offender, or a combination of the two).
Data Sources, Quality, & Addressing Issues The data for this study were collected from a mix of hardcopy and digital sources, including: (1)
the Commission hardcopy case files, (2) the Commission digital database -- Compensation and
Restitution Management System (CRMS), and (3) the Hawai‘i State Judiciary ‘eCourt Kokua’
public record website. Upon completion, the data collected were assessed to be accurate and
largely complete. The data were often cross-validated with the researcher when analyses were
6
performed, providing numerous points of reconciliation and verification. This created
opportunities to correct and/or input erroneous or missing data. Besides minor, though normal,
issues of data reconciliation and cleaning, the data collection process was more protracted than
initially anticipated. Due to the mixed sources used to complete incomplete records, usually
hardcopy and digital, more effort was required to capture all necessary data elements.
7
Results The following section reports the results of the data analyses. Within this section, there will be
focus on (1) victim demographics, (2) offense types and sentence dispositions, (3) restitution
requests, (4) restitution orders, and (5) collection of restitution payments.
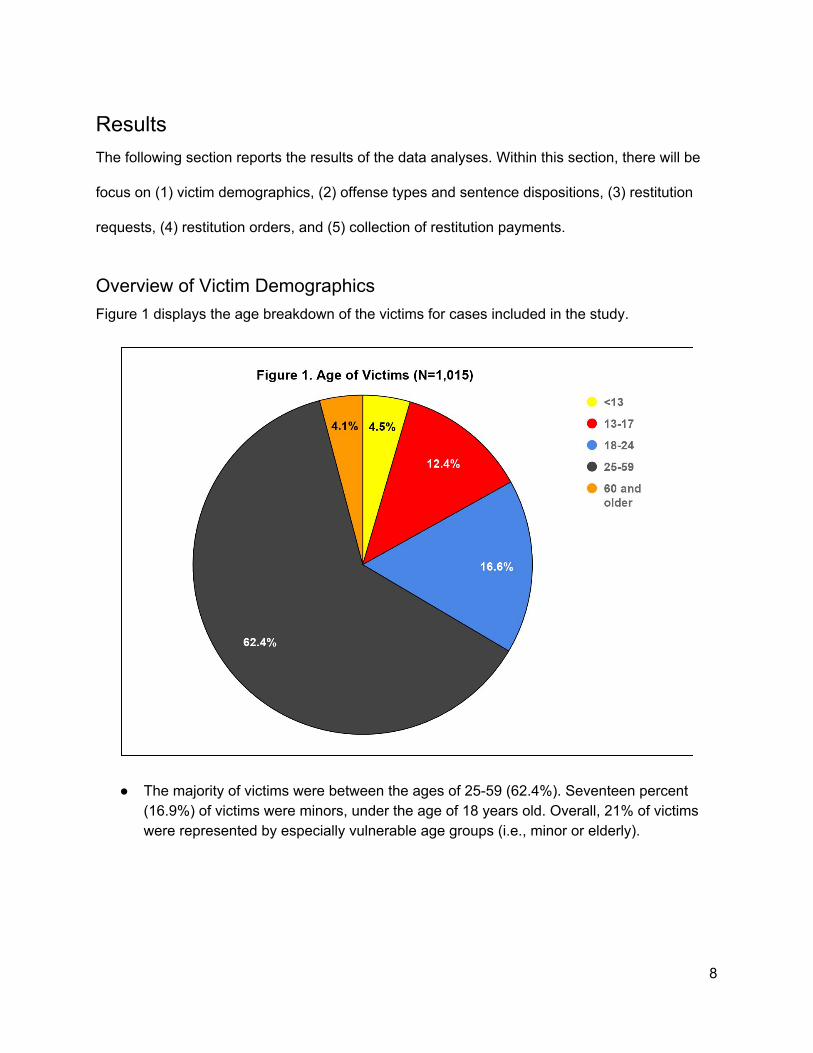
Overview of Victim Demographics Figure 1 displays the age breakdown of the victims for cases included in the study.
● The majority of victims were between the ages of 25-59 (62.4%). Seventeen percent (16.9%) of victims were minors, under the age of 18 years old. Overall, 21% of victims were represented by especially vulnerable age groups (i.e., minor or elderly).
8
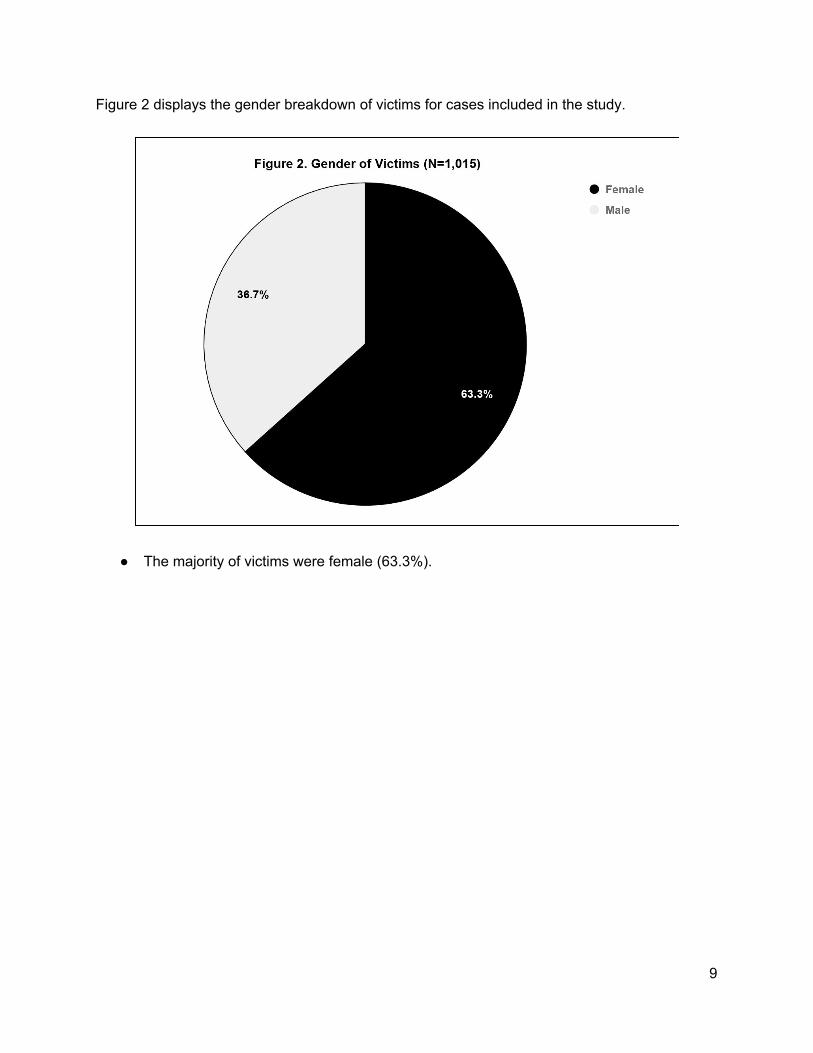
Figure 2 displays the gender breakdown of victims for cases included in the study.
● The majority of victims were female (63.3%).
9
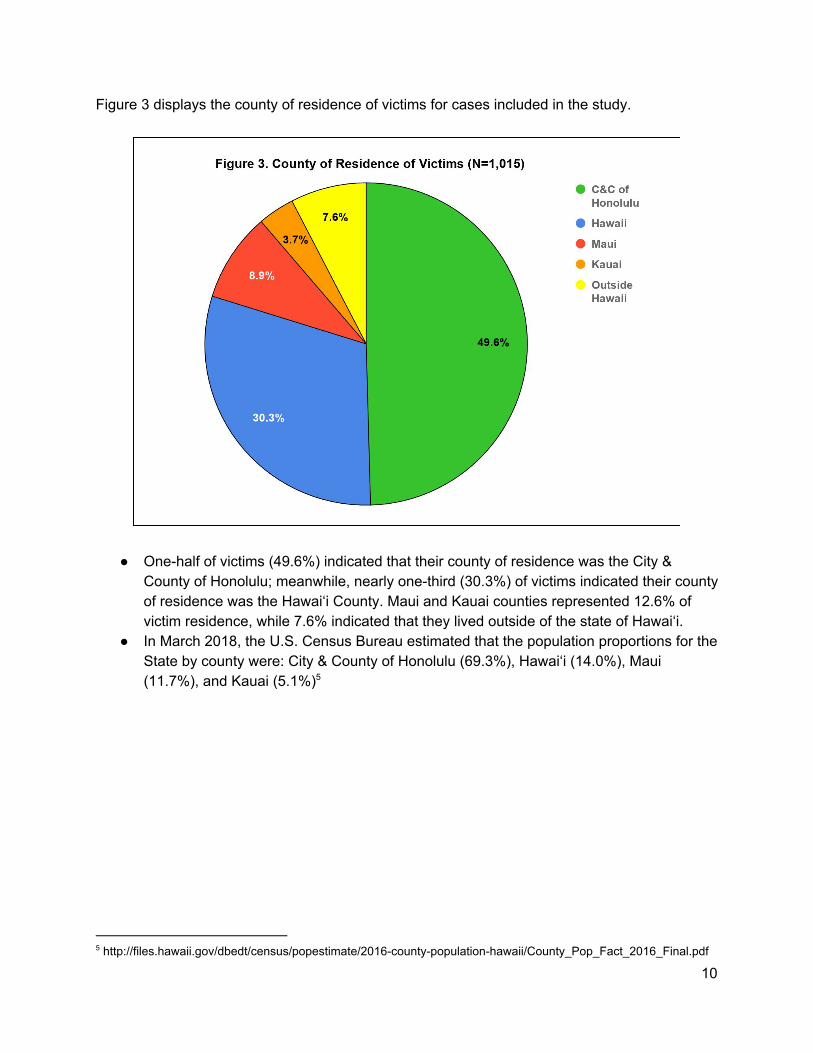
Figure 3 displays the county of residence of victims for cases included in the study.
● One-half of victims (49.6%) indicated that their county of residence was the City & County of Honolulu; meanwhile, nearly one-third (30.3%) of victims indicated their county of residence was the Hawai‘i County. Maui and Kauai counties represented 12.6% of victim residence, while 7.6% indicated that they lived outside of the state of Hawai‘i.
● In March 2018, the U.S. Census Bureau estimated that the population proportions for the State by county were: City & County of Honolulu (69.3%), Hawai‘i (14.0%), Maui (11.7%), and Kauai (5.1%) 5
5 http://files.hawaii.gov/dbedt/census/popestimate/2016-county-population-hawaii/County_Pop_Fact_2016_Final.pdf
10
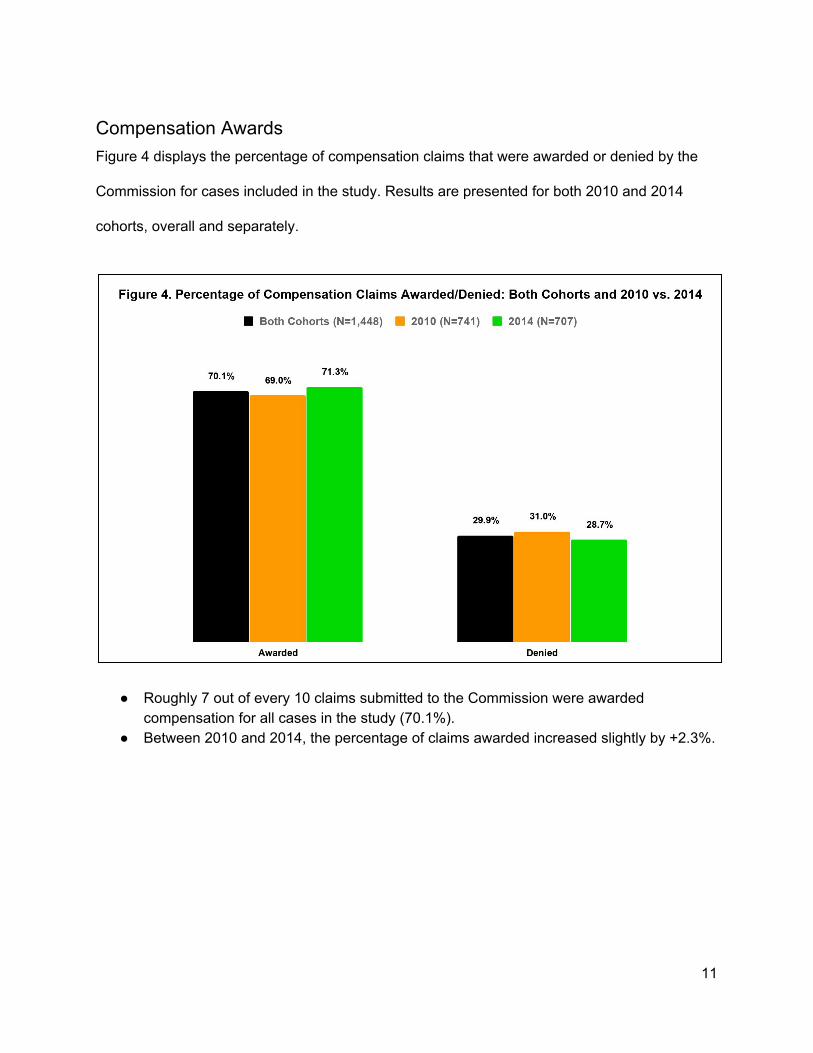
Compensation Awards Figure 4 displays the percentage of compensation claims that were awarded or denied by the
Commission for cases included in the study. Results are presented for both 2010 and 2014
cohorts, overall and separately.
● Roughly 7 out of every 10 claims submitted to the Commission were awarded compensation for all cases in the study (70.1%).
● Between 2010 and 2014, the percentage of claims awarded increased slightly by +2.3%.
11
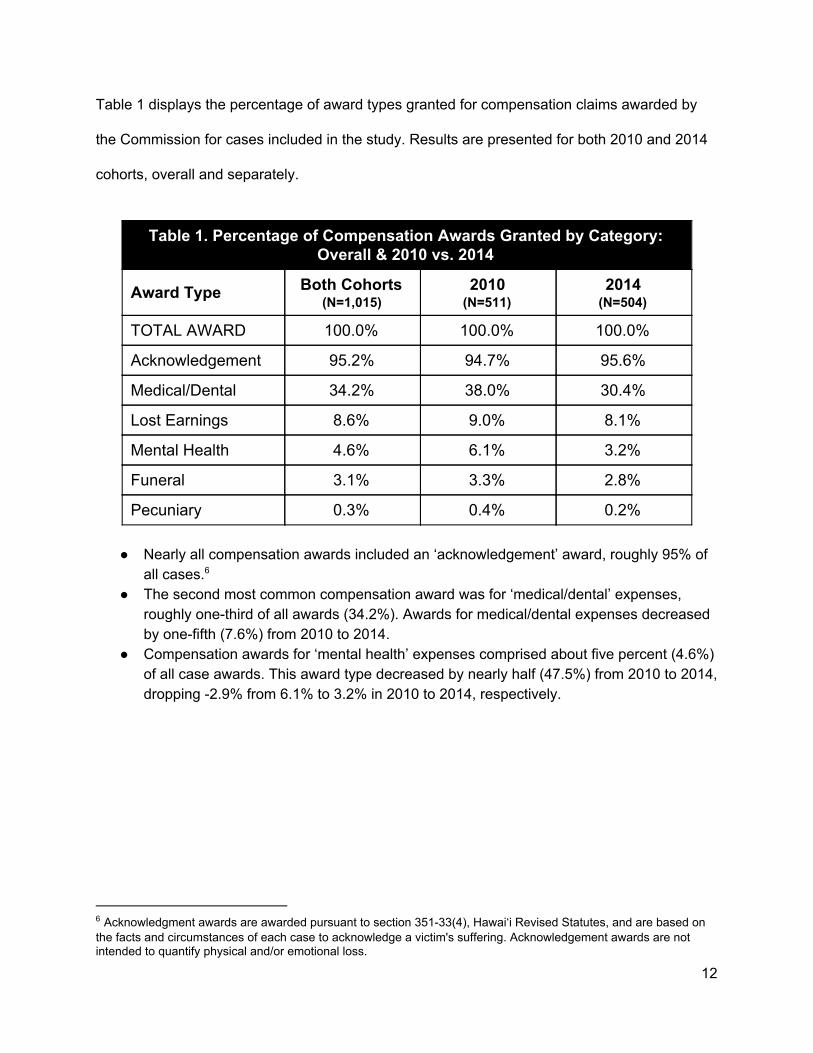
Table 1 displays the percentage of award types granted for compensation claims awarded by
the Commission for cases included in the study. Results are presented for both 2010 and 2014
cohorts, overall and separately.
Table 1. Percentage of Compensation Awards Granted by Category: Overall & 2010 vs. 2014
Award Type Both Cohorts (N=1,015)
2010 (N=511)
2014 (N=504)
TOTAL AWARD 100.0% 100.0% 100.0%
Acknowledgement 95.2% 94.7% 95.6%
Medical/Dental 34.2% 38.0% 30.4%
Lost Earnings 8.6% 9.0% 8.1%
Mental Health 4.6% 6.1% 3.2%
Funeral 3.1% 3.3% 2.8%
Pecuniary 0.3% 0.4% 0.2%
● Nearly all compensation awards included an ‘acknowledgement’ award, roughly 95% of all cases. 6
● The second most common compensation award was for ‘medical/dental’ expenses, roughly one-third of all awards (34.2%). Awards for medical/dental expenses decreased by one-fifth (7.6%) from 2010 to 2014.
● Compensation awards for ‘mental health’ expenses comprised about five percent (4.6%) of all case awards. This award type decreased by nearly half (47.5%) from 2010 to 2014, dropping -2.9% from 6.1% to 3.2% in 2010 to 2014, respectively.
6 Acknowledgment awards are awarded pursuant to section 351-33(4), Hawai‘i Revised Statutes, and are based on the facts and circumstances of each case to acknowledge a victim's suffering. Acknowledgement awards are not intended to quantify physical and/or emotional loss.
12
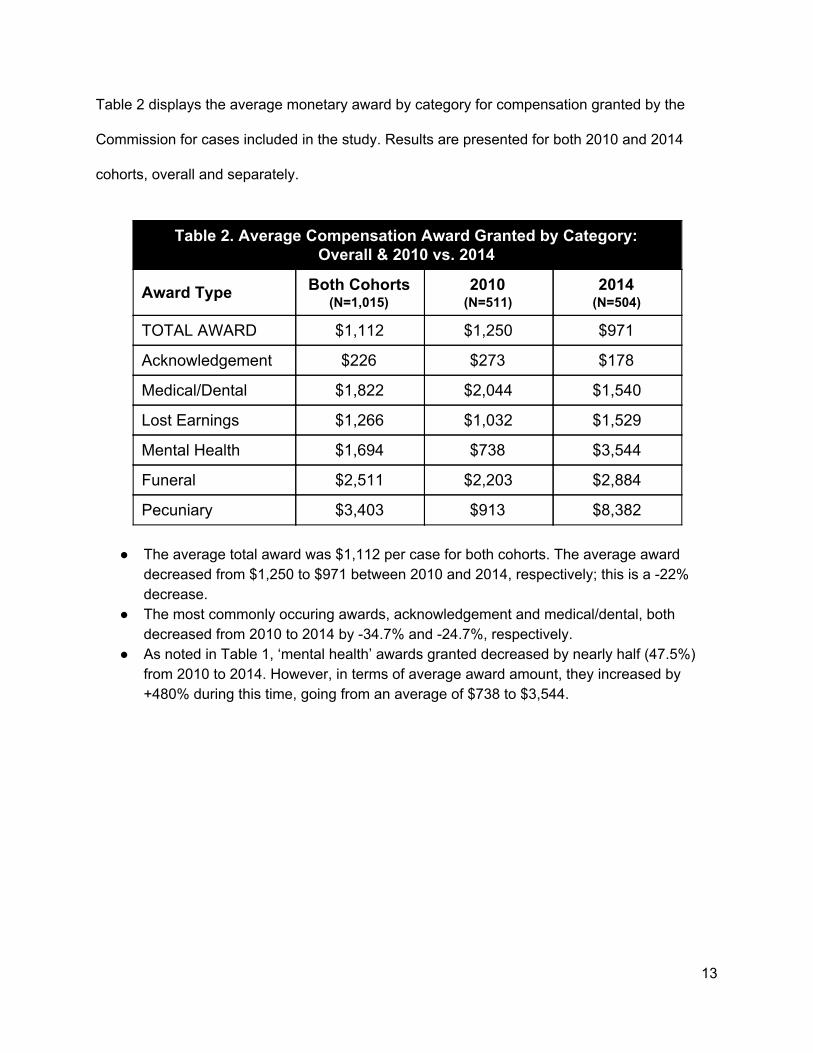
Table 2 displays the average monetary award by category for compensation granted by the
Commission for cases included in the study. Results are presented for both 2010 and 2014
cohorts, overall and separately.
Table 2. Average Compensation Award Granted by Category: Overall & 2010 vs. 2014
Award Type Both Cohorts (N=1,015)
2010 (N=511)
2014 (N=504)
TOTAL AWARD $1,112 $1,250 $971
Acknowledgement $226 $273 $178
Medical/Dental $1,822 $2,044 $1,540
Lost Earnings $1,266 $1,032 $1,529
Mental Health $1,694 $738 $3,544
Funeral $2,511 $2,203 $2,884
Pecuniary $3,403 $913 $8,382
● The average total award was $1,112 per case for both cohorts. The average award decreased from $1,250 to $971 between 2010 and 2014, respectively; this is a -22% decrease.
● The most commonly occuring awards, acknowledgement and medical/dental, both decreased from 2010 to 2014 by -34.7% and -24.7%, respectively.
● As noted in Table 1, ‘mental health’ awards granted decreased by nearly half (47.5%) from 2010 to 2014. However, in terms of average award amount, they increased by +480% during this time, going from an average of $738 to $3,544.
13

Overview of Criminal Cases Figure 5 displays the final offense types charged to the offenders for the criminal cases included
in the study. The categories were developed based on patterns seen across the specific
offenses and the nature of the offense. 7
● The most commonly occuring offense types committed were physical assault/offense (42.9%), abuse (29.8%), and sexual assault/offense (10.5%).
● Nearly all (97.1%) were person-focused (not property crimes).
7 “Physical Assault/Offense” includes: (1) Assault, (2) Robbery, (3) Choking, (4) Negligent Injury. ‘“Abuse (FAM/HHM/FEL)” includes: (1) Abuse of a Family or Household Member, (2) Felony Abuse, and (3) Endangering the Welfare of a minor. ““Sexual Assault/Offense” includes: (1) Sexual Assault, (2) Accomplice to Sexual Assault, Continuous Sexual Assault of a Minor, and Promoting Prostitution. “Harassment/Threatening” includes: (1) Harassment, (2) Harassment (strike/shove/kick), (3) Terroristic Threatening, and (4) Violating an Order of Protection. “Murder/Manslaughter/NH” includes: (1) Murder/Attempted, (2) Manslaughter/Attempted, and (3) Negligent Homicide. “Property Offense” includes: (1) Theft, (2) Unauthorized Entry into a Dwelling, (3) Unauthorized Entry into a Motor Vehicle, (4) Criminal Property Damage, (5) Burglary, and (6) Arson. “Other” includes: (1) Reckless Endangerment, (2) Disorderly Conduct, and (3) Extortion.
14
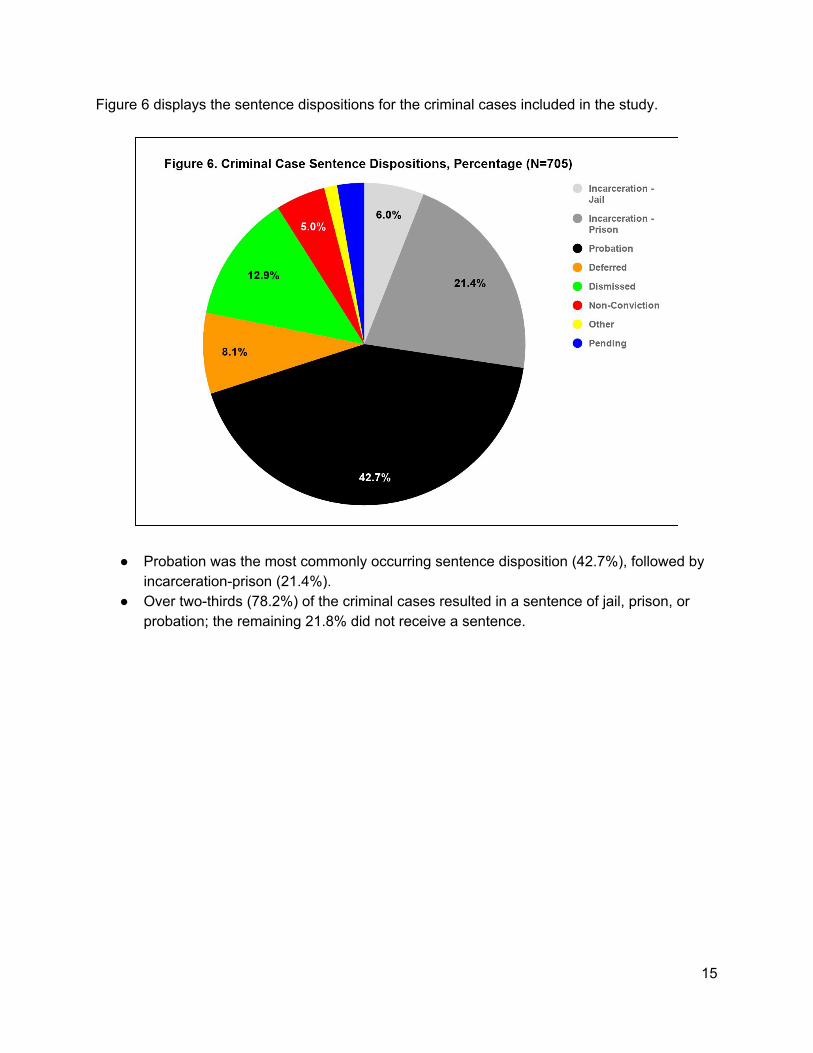
Figure 6 displays the sentence dispositions for the criminal cases included in the study.
● Probation was the most commonly occurring sentence disposition (42.7%), followed by incarceration-prison (21.4%).
● Over two-thirds (78.2%) of the criminal cases resulted in a sentence of jail, prison, or probation; the remaining 21.8% did not receive a sentence.
15
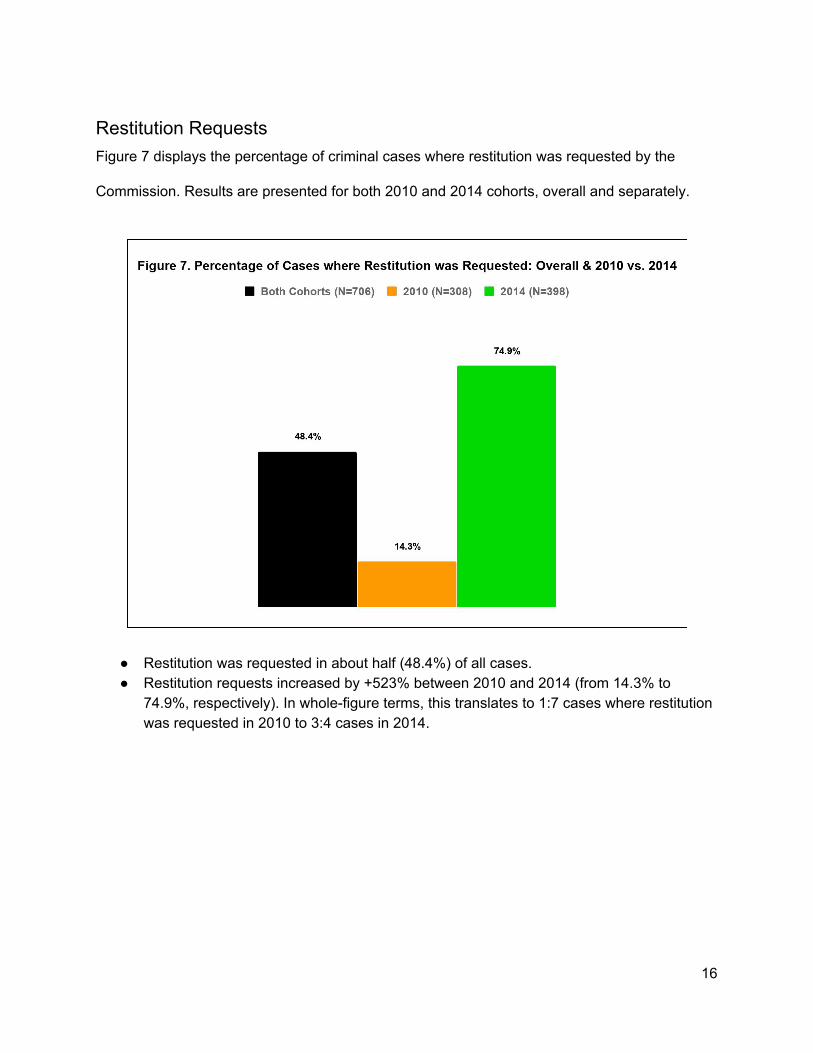
Restitution Requests Figure 7 displays the percentage of criminal cases where restitution was requested by the
Commission. Results are presented for both 2010 and 2014 cohorts, overall and separately.
● Restitution was requested in about half (48.4%) of all cases. ● Restitution requests increased by +523% between 2010 and 2014 (from 14.3% to
74.9%, respectively). In whole-figure terms, this translates to 1:7 cases where restitution was requested in 2010 to 3:4 cases in 2014.
16
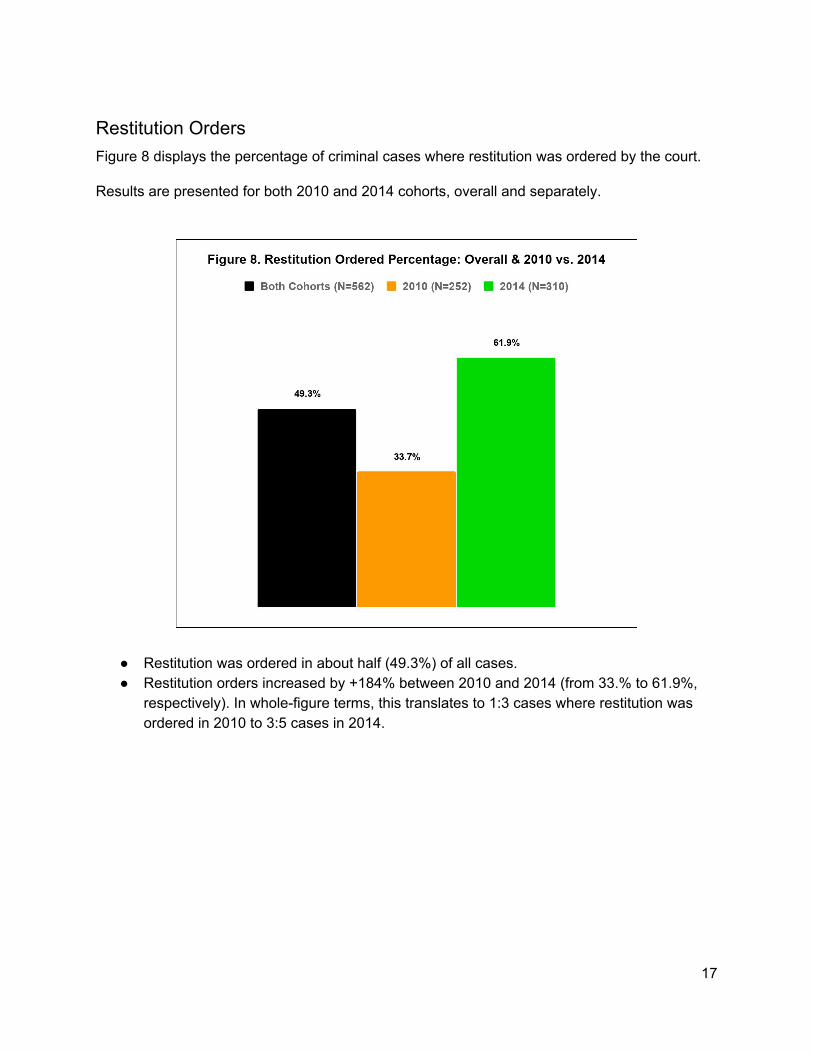
Restitution Orders Figure 8 displays the percentage of criminal cases where restitution was ordered by the court.
Results are presented for both 2010 and 2014 cohorts, overall and separately.
● Restitution was ordered in about half (49.3%) of all cases. ● Restitution orders increased by +184% between 2010 and 2014 (from 33.% to 61.9%,
respectively). In whole-figure terms, this translates to 1:3 cases where restitution was ordered in 2010 to 3:5 cases in 2014.
17
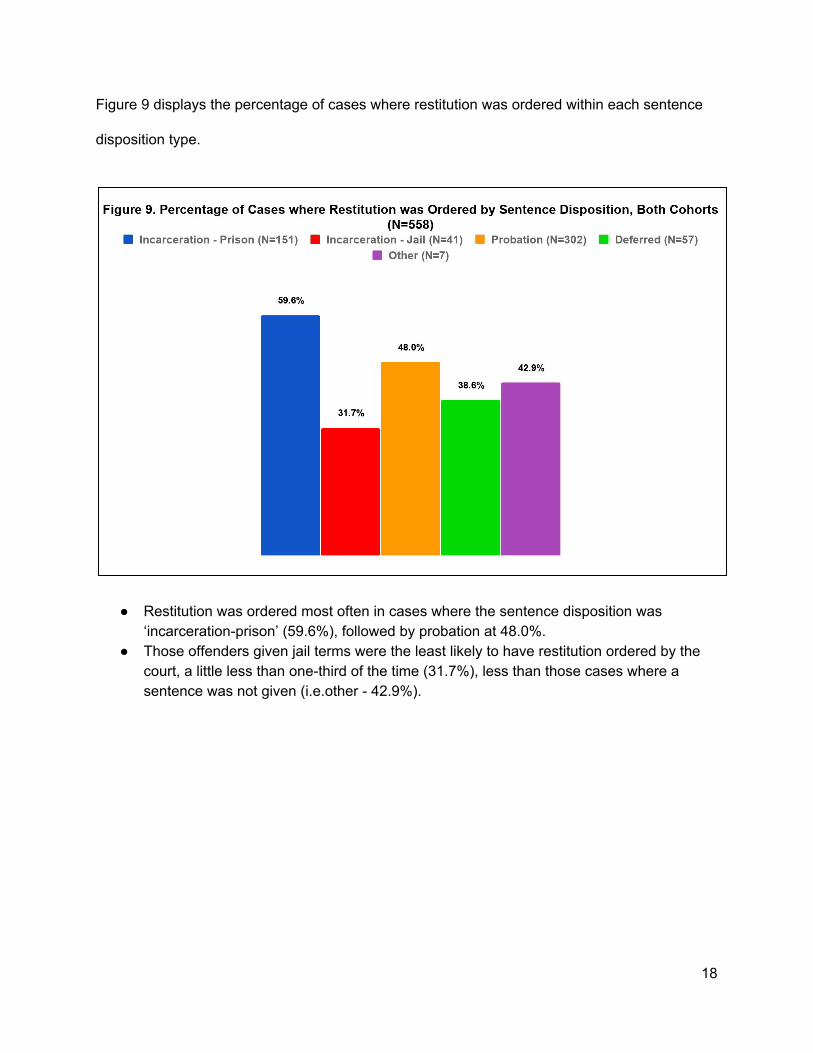
Figure 9 displays the percentage of cases where restitution was ordered within each sentence
disposition type.
● Restitution was ordered most often in cases where the sentence disposition was ‘incarceration-prison’ (59.6%), followed by probation at 48.0%.
● Those offenders given jail terms were the least likely to have restitution ordered by the court, a little less than one-third of the time (31.7%), less than those cases where a sentence was not given (i.e.other - 42.9%).
18
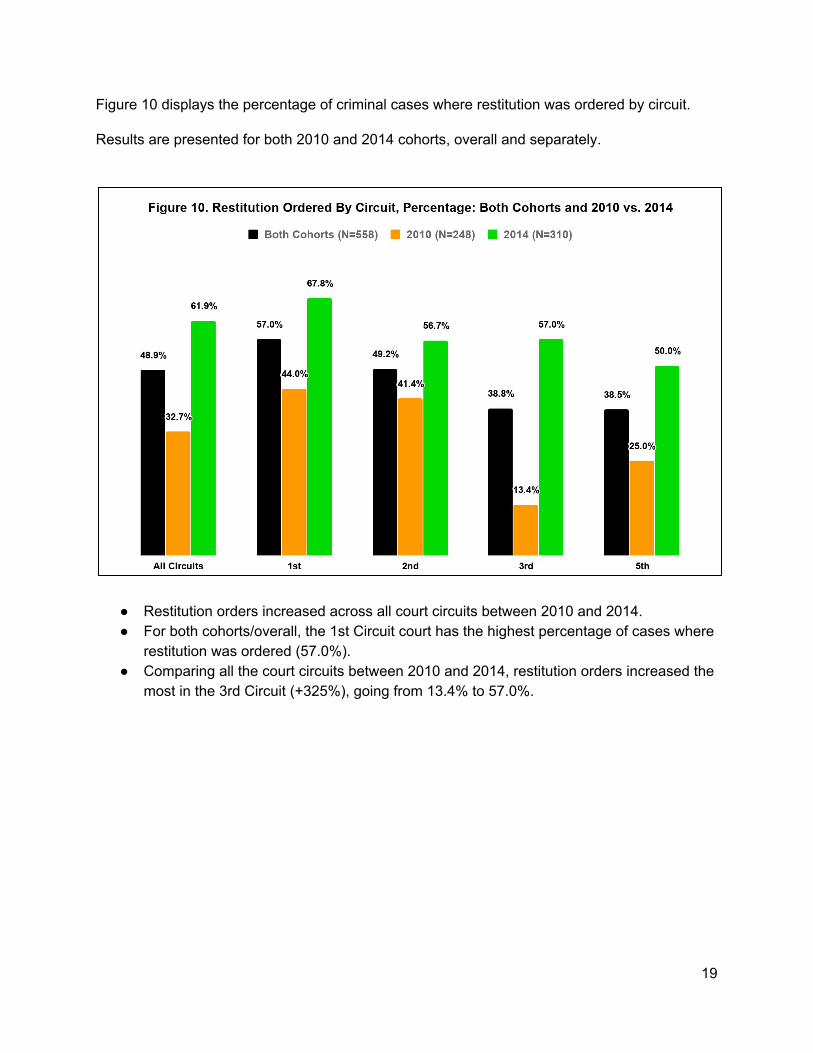
Figure 10 displays the percentage of criminal cases where restitution was ordered by circuit.
Results are presented for both 2010 and 2014 cohorts, overall and separately.
● Restitution orders increased across all court circuits between 2010 and 2014. ● For both cohorts/overall, the 1st Circuit court has the highest percentage of cases where
restitution was ordered (57.0%). ● Comparing all the court circuits between 2010 and 2014, restitution orders increased the
most in the 3rd Circuit (+325%), going from 13.4% to 57.0%.
19
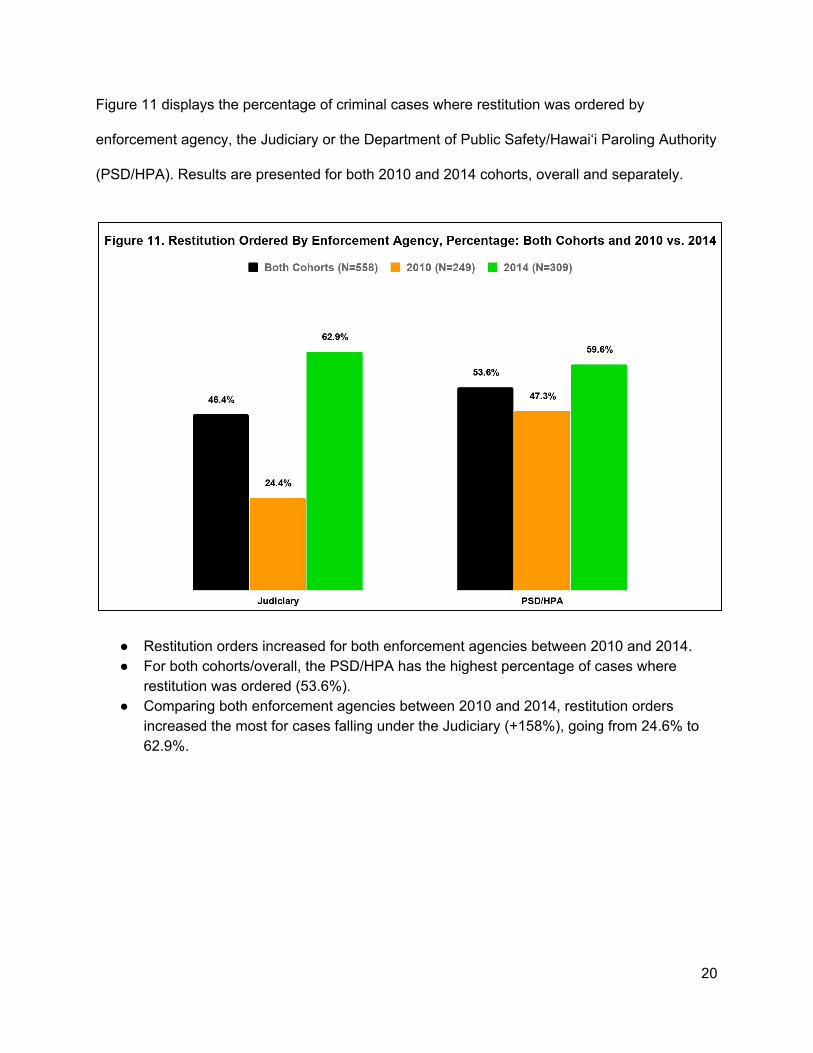
Figure 11 displays the percentage of criminal cases where restitution was ordered by
enforcement agency, the Judiciary or the Department of Public Safety/Hawai‘i Paroling Authority
(PSD/HPA). Results are presented for both 2010 and 2014 cohorts, overall and separately.
● Restitution orders increased for both enforcement agencies between 2010 and 2014. ● For both cohorts/overall, the PSD/HPA has the highest percentage of cases where
restitution was ordered (53.6%). ● Comparing both enforcement agencies between 2010 and 2014, restitution orders
increased the most for cases falling under the Judiciary (+158%), going from 24.6% to 62.9%.
20
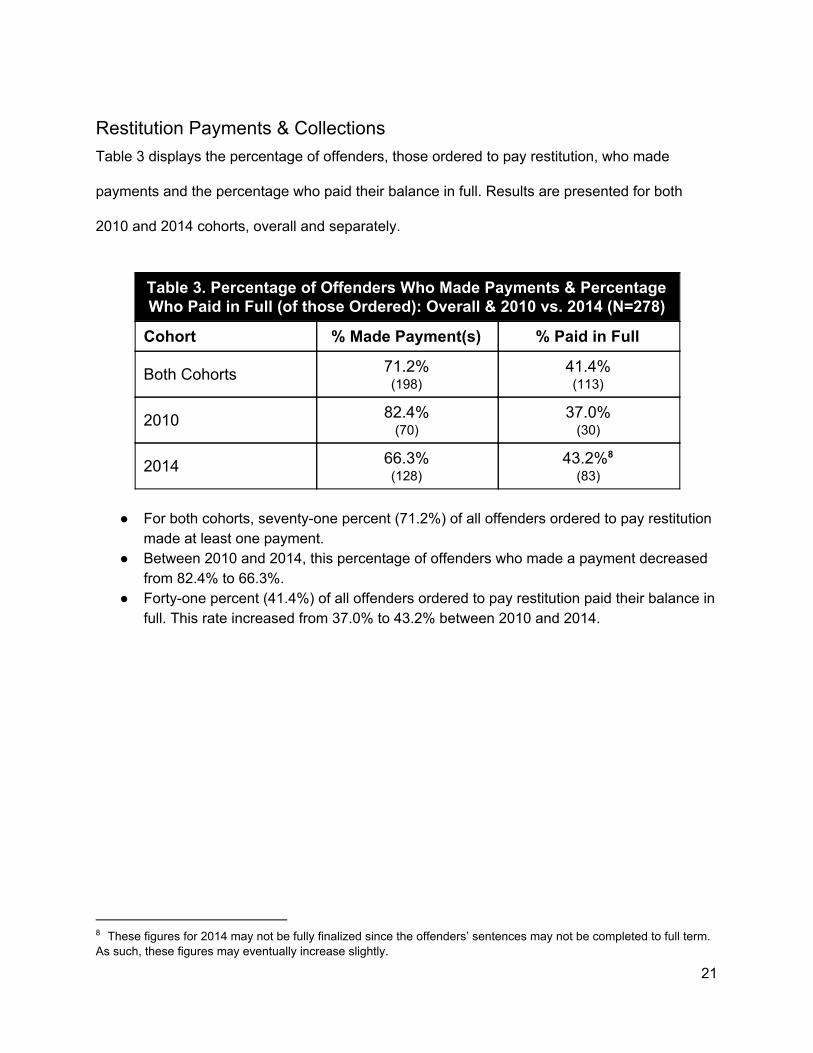
Restitution Payments & Collections
Table 3 displays the percentage of offenders, those ordered to pay restitution, who made
payments and the percentage who paid their balance in full. Results are presented for both
2010 and 2014 cohorts, overall and separately.
Table 3. Percentage of Offenders Who Made Payments & Percentage Who Paid in Full (of those Ordered): Overall & 2010 vs. 2014 (N=278)
Cohort % Made Payment(s) % Paid in Full
Both Cohorts 71.2% (198)
41.4% (113)
2010 82.4% (70)
37.0% (30)
2014 66.3% (128)
43.2% 8
(83)
● For both cohorts, seventy-one percent (71.2%) of all offenders ordered to pay restitution
made at least one payment. ● Between 2010 and 2014, this percentage of offenders who made a payment decreased
from 82.4% to 66.3%. ● Forty-one percent (41.4%) of all offenders ordered to pay restitution paid their balance in
full. This rate increased from 37.0% to 43.2% between 2010 and 2014.
8 These figures for 2014 may not be fully finalized since the offenders’ sentences may not be completed to full term. As such, these figures may eventually increase slightly.
21
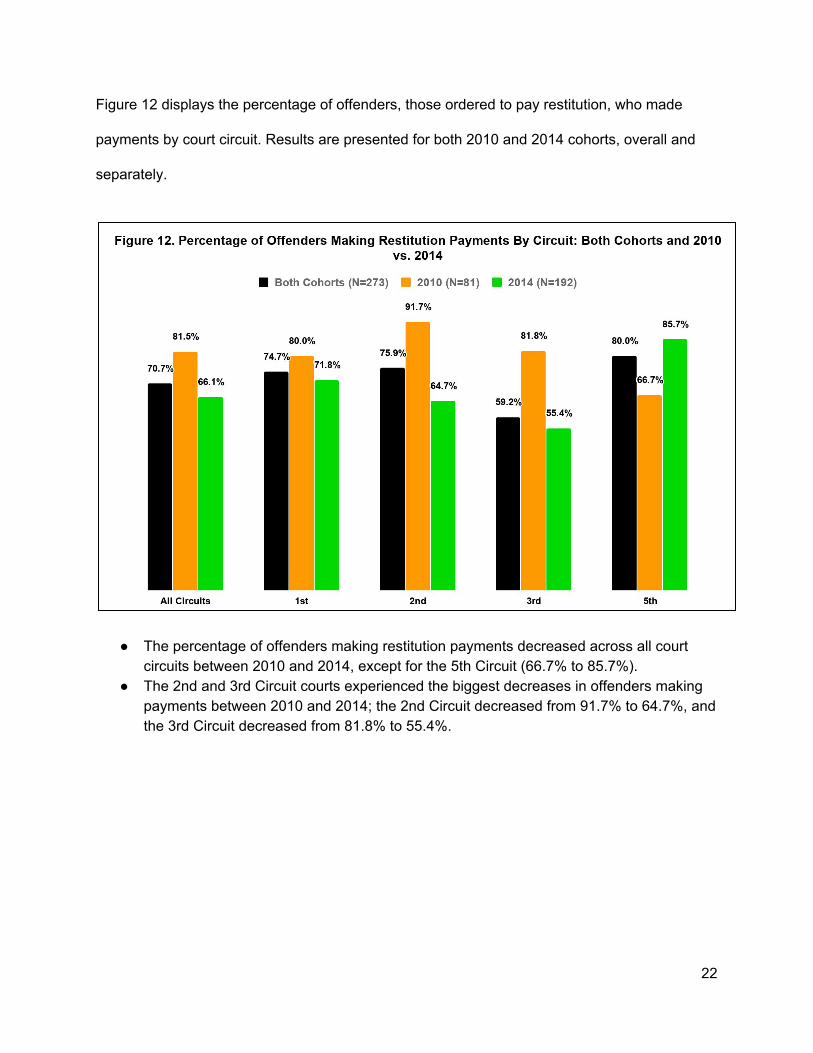
Figure 12 displays the percentage of offenders, those ordered to pay restitution, who made
payments by court circuit. Results are presented for both 2010 and 2014 cohorts, overall and
separately.
● The percentage of offenders making restitution payments decreased across all court circuits between 2010 and 2014, except for the 5th Circuit (66.7% to 85.7%).
● The 2nd and 3rd Circuit courts experienced the biggest decreases in offenders making payments between 2010 and 2014; the 2nd Circuit decreased from 91.7% to 64.7%, and the 3rd Circuit decreased from 81.8% to 55.4%.
22
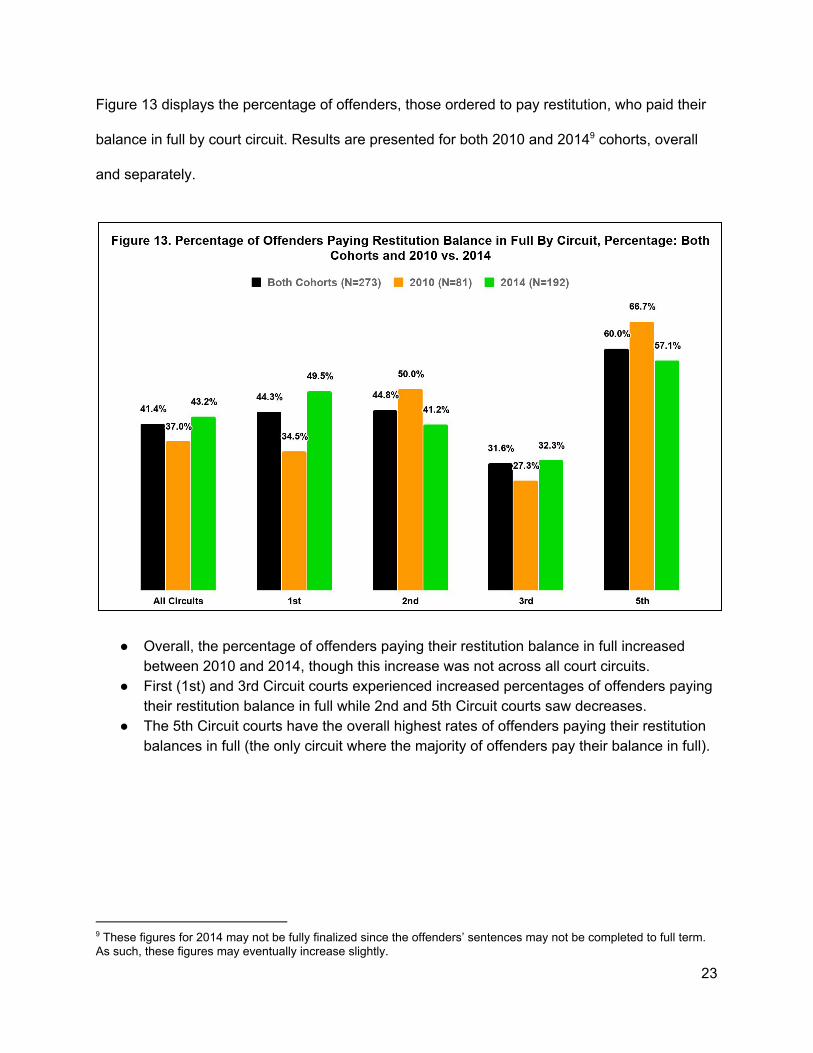
Figure 13 displays the percentage of offenders, those ordered to pay restitution, who paid their
balance in full by court circuit. Results are presented for both 2010 and 2014 cohorts, overall 9
and separately.
● Overall, the percentage of offenders paying their restitution balance in full increased between 2010 and 2014, though this increase was not across all court circuits.
● First (1st) and 3rd Circuit courts experienced increased percentages of offenders paying their restitution balance in full while 2nd and 5th Circuit courts saw decreases.
● The 5th Circuit courts have the overall highest rates of offenders paying their restitution balances in full (the only circuit where the majority of offenders pay their balance in full).
9 These figures for 2014 may not be fully finalized since the offenders’ sentences may not be completed to full term. As such, these figures may eventually increase slightly.
23
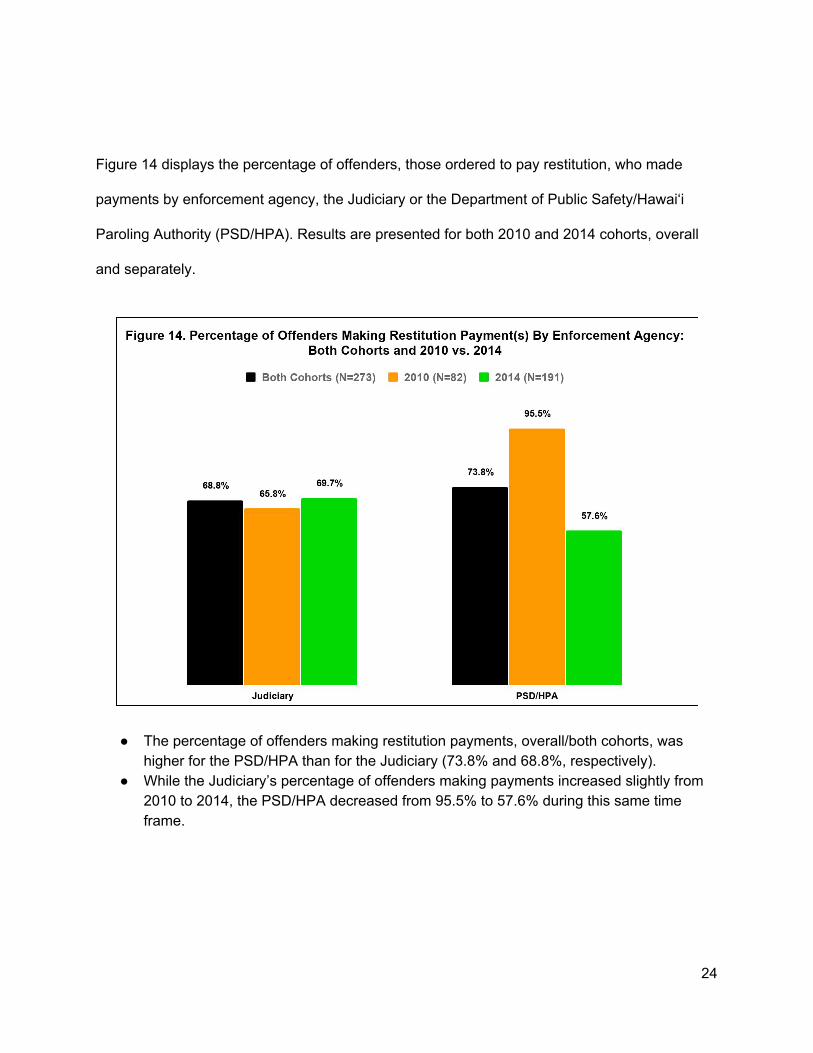
Figure 14 displays the percentage of offenders, those ordered to pay restitution, who made
payments by enforcement agency, the Judiciary or the Department of Public Safety/Hawai‘i
Paroling Authority (PSD/HPA). Results are presented for both 2010 and 2014 cohorts, overall
and separately.
● The percentage of offenders making restitution payments, overall/both cohorts, was higher for the PSD/HPA than for the Judiciary (73.8% and 68.8%, respectively).
● While the Judiciary’s percentage of offenders making payments increased slightly from 2010 to 2014, the PSD/HPA decreased from 95.5% to 57.6% during this same time frame.
24

Figure 15 displays the percentage of offenders, those ordered to pay restitution, who paid their
balance in full by enforcement agency, the Judiciary or the Department of Public Safety/Hawai‘i
Paroling Authority (PSD/HPA). Results are presented for both 2010 and 2014 cohorts, overall 10
and separately.
● Overall, the percentage of offenders paying their restitution balance in full remained relatively unchanged between 2010 and 2014, though the levels of those who paid in full was not equal across enforcement agency.
● Roughly one-half of offenders under the Judiciary paid their balance in full versus about one-fourth of offenders overseen by the PSD/HPA.
10 These figures for 2014 may not be fully finalized since the offenders’ sentences may not be completed to full term. As such, these figures may eventually increase slightly.
25
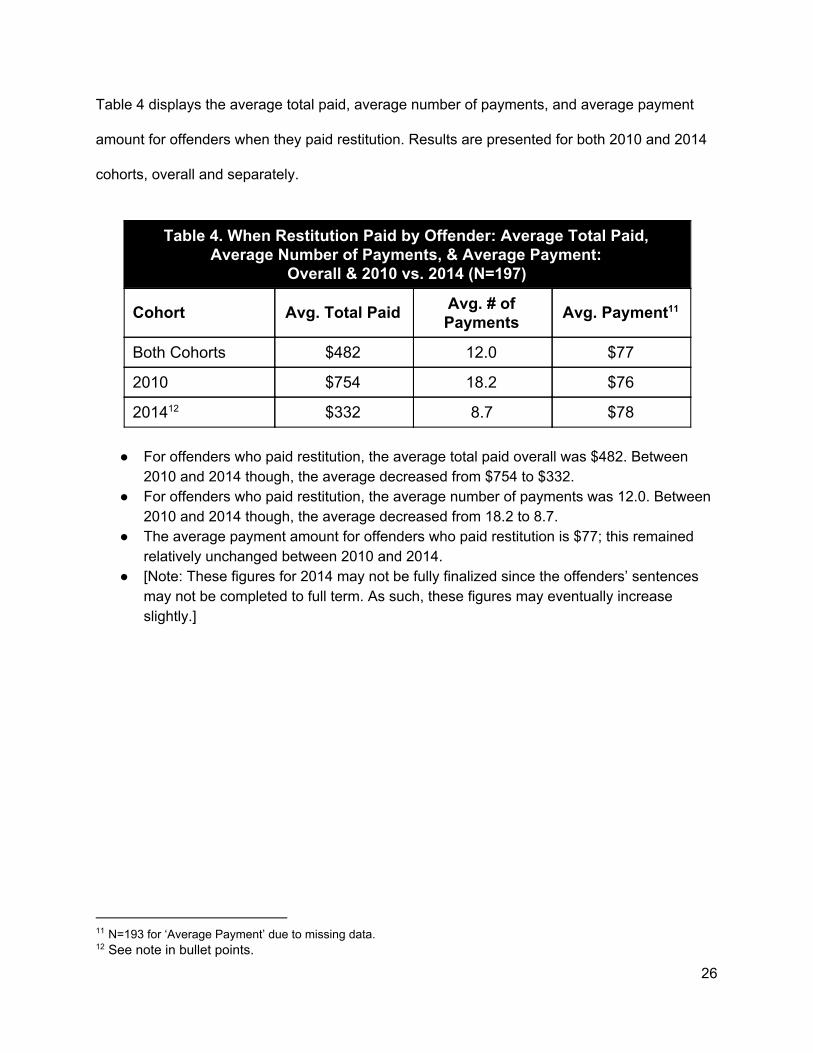
Table 4 displays the average total paid, average number of payments, and average payment
amount for offenders when they paid restitution. Results are presented for both 2010 and 2014
cohorts, overall and separately.
Table 4. When Restitution Paid by Offender: Average Total Paid, Average Number of Payments, & Average Payment:
Overall & 2010 vs. 2014 (N=197)
Cohort Avg. Total Paid Avg. # of Payments Avg. Payment 11
Both Cohorts $482 12.0 $77
2010 $754 18.2 $76
2014 12 $332 8.7 $78
● For offenders who paid restitution, the average total paid overall was $482. Between 2010 and 2014 though, the average decreased from $754 to $332.
● For offenders who paid restitution, the average number of payments was 12.0. Between 2010 and 2014 though, the average decreased from 18.2 to 8.7.
● The average payment amount for offenders who paid restitution is $77; this remained relatively unchanged between 2010 and 2014.
● [Note: These figures for 2014 may not be fully finalized since the offenders’ sentences may not be completed to full term. As such, these figures may eventually increase slightly.]
11 N=193 for ‘Average Payment’ due to missing data. 12 See note in bullet points.
26
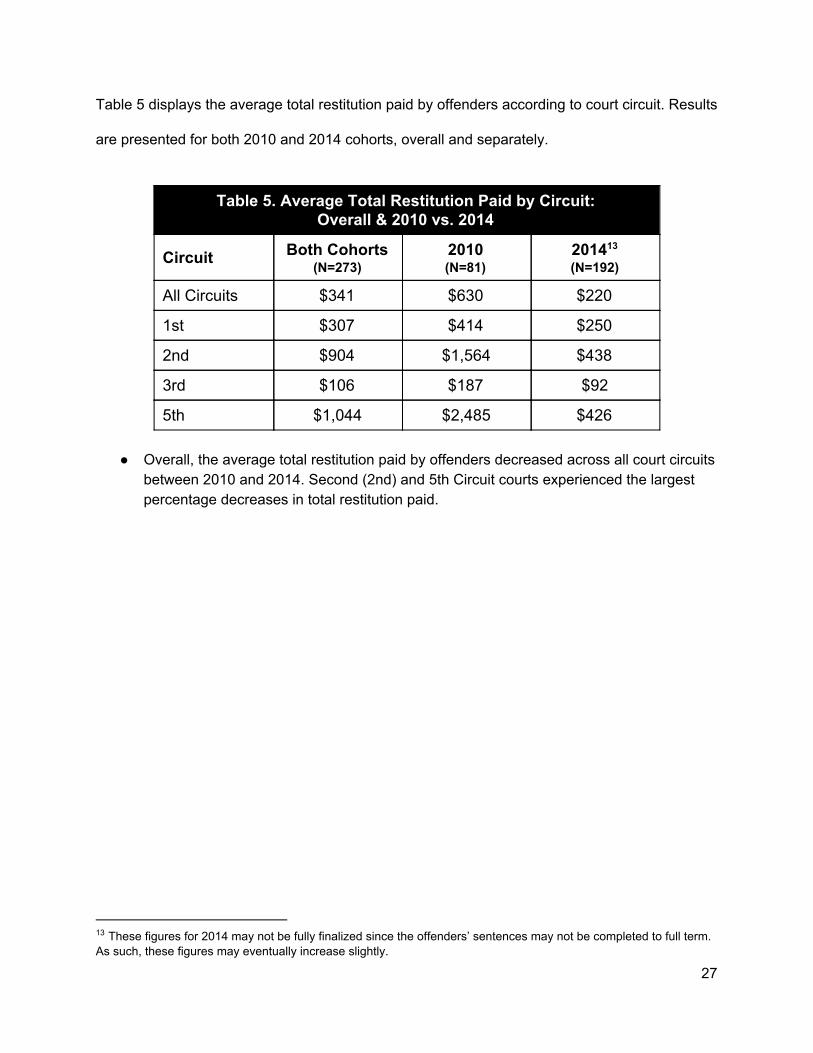
Table 5 displays the average total restitution paid by offenders according to court circuit. Results
are presented for both 2010 and 2014 cohorts, overall and separately.
Table 5. Average Total Restitution Paid by Circuit: Overall & 2010 vs. 2014
Circuit Both Cohorts (N=273)
2010 (N=81)
2014 13
(N=192)
All Circuits $341 $630 $220
1st $307 $414 $250
2nd $904 $1,564 $438
3rd $106 $187 $92
5th $1,044 $2,485 $426
● Overall, the average total restitution paid by offenders decreased across all court circuits between 2010 and 2014. Second (2nd) and 5th Circuit courts experienced the largest percentage decreases in total restitution paid.
13 These figures for 2014 may not be fully finalized since the offenders’ sentences may not be completed to full term. As such, these figures may eventually increase slightly.
27
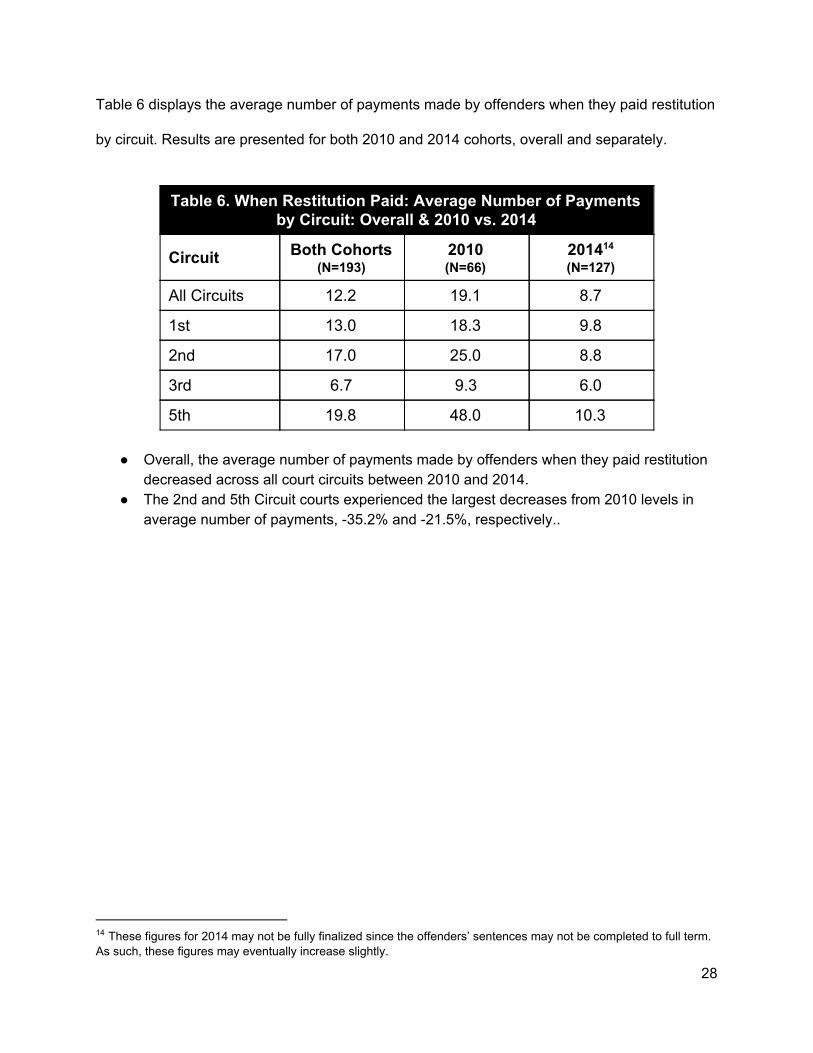
Table 6 displays the average number of payments made by offenders when they paid restitution
by circuit. Results are presented for both 2010 and 2014 cohorts, overall and separately.
Table 6. When Restitution Paid: Average Number of Payments by Circuit: Overall & 2010 vs. 2014
Circuit Both Cohorts (N=193)
2010 (N=66)
2014 14
(N=127)
All Circuits 12.2 19.1 8.7
1st 13.0 18.3 9.8
2nd 17.0 25.0 8.8
3rd 6.7 9.3 6.0
5th 19.8 48.0 10.3
● Overall, the average number of payments made by offenders when they paid restitution decreased across all court circuits between 2010 and 2014.
● The 2nd and 5th Circuit courts experienced the largest decreases from 2010 levels in average number of payments, -35.2% and -21.5%, respectively..
14 These figures for 2014 may not be fully finalized since the offenders’ sentences may not be completed to full term. As such, these figures may eventually increase slightly.
28
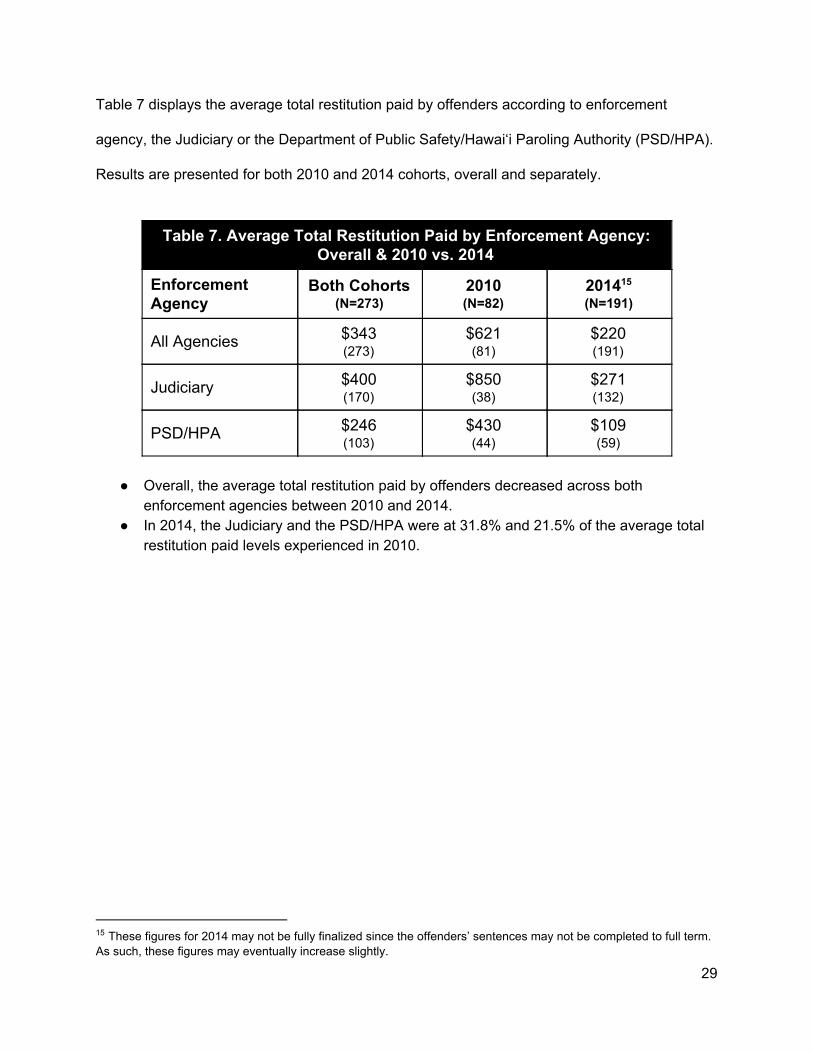
Table 7 displays the average total restitution paid by offenders according to enforcement
agency, the Judiciary or the Department of Public Safety/Hawai‘i Paroling Authority (PSD/HPA).
Results are presented for both 2010 and 2014 cohorts, overall and separately.
Table 7. Average Total Restitution Paid by Enforcement Agency: Overall & 2010 vs. 2014
Enforcement Agency
Both Cohorts (N=273)
2010 (N=82)
2014 15
(N=191)
All Agencies $343 (273)
$621 (81)
$220 (191)
Judiciary $400 (170)
$850 (38)
$271 (132)
PSD/HPA $246 (103)
$430 (44)
$109 (59)
● Overall, the average total restitution paid by offenders decreased across both
enforcement agencies between 2010 and 2014. ● In 2014, the Judiciary and the PSD/HPA were at 31.8% and 21.5% of the average total
restitution paid levels experienced in 2010.
15 These figures for 2014 may not be fully finalized since the offenders’ sentences may not be completed to full term. As such, these figures may eventually increase slightly.
29
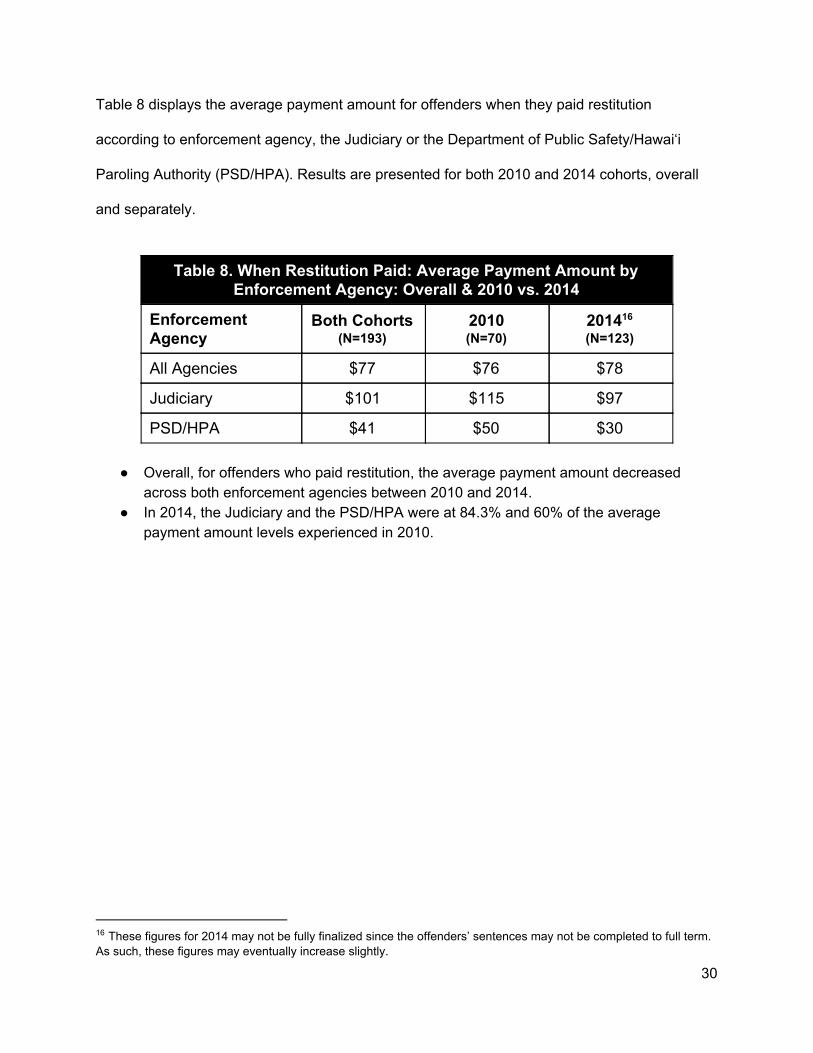
Table 8 displays the average payment amount for offenders when they paid restitution
according to enforcement agency, the Judiciary or the Department of Public Safety/Hawai‘i
Paroling Authority (PSD/HPA). Results are presented for both 2010 and 2014 cohorts, overall
and separately.
Table 8. When Restitution Paid: Average Payment Amount by Enforcement Agency: Overall & 2010 vs. 2014
Enforcement Agency
Both Cohorts (N=193)
2010 (N=70)
2014 16
(N=123)
All Agencies $77 $76 $78
Judiciary $101 $115 $97
PSD/HPA $41 $50 $30
● Overall, for offenders who paid restitution, the average payment amount decreased across both enforcement agencies between 2010 and 2014.
● In 2014, the Judiciary and the PSD/HPA were at 84.3% and 60% of the average payment amount levels experienced in 2010.
16 These figures for 2014 may not be fully finalized since the offenders’ sentences may not be completed to full term. As such, these figures may eventually increase slightly.
30
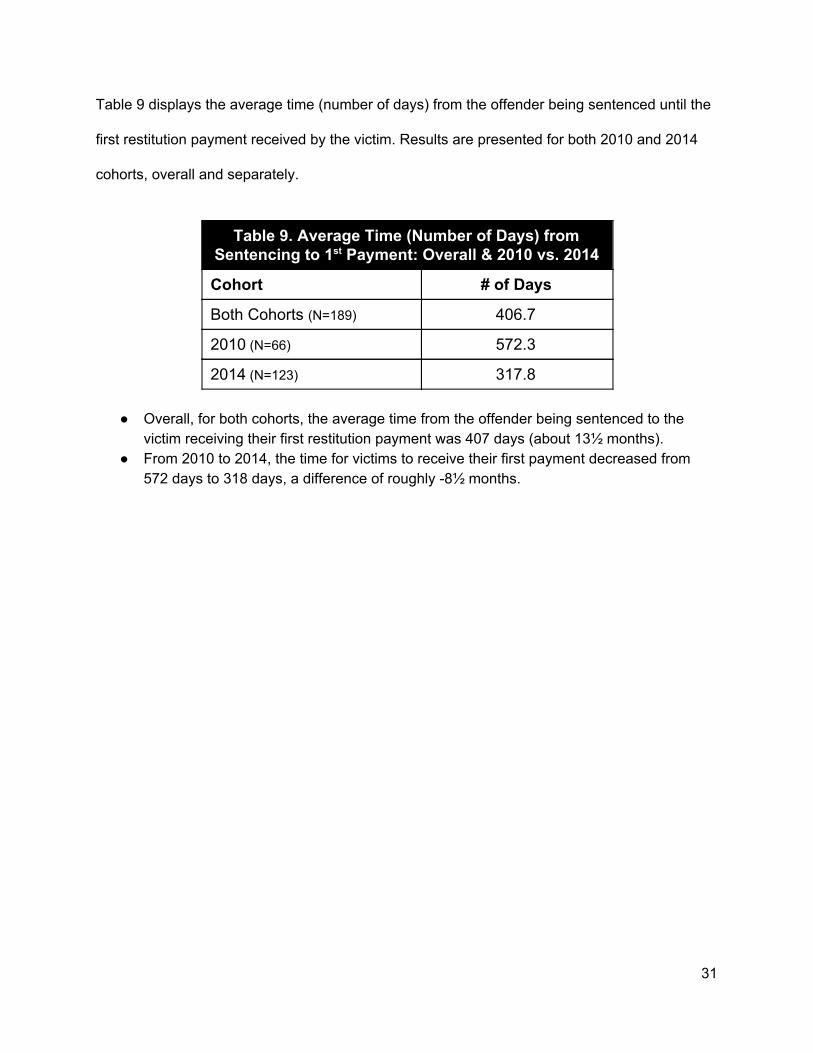
Table 9 displays the average time (number of days) from the offender being sentenced until the
first restitution payment received by the victim. Results are presented for both 2010 and 2014
cohorts, overall and separately.
Table 9. Average Time (Number of Days) from Sentencing to 1st Payment: Overall & 2010 vs. 2014
Cohort # of Days
Both Cohorts (N=189) 406.7
2010 (N=66) 572.3
2014 (N=123) 317.8
● Overall, for both cohorts, the average time from the offender being sentenced to the victim receiving their first restitution payment was 407 days (about 13½ months).
● From 2010 to 2014, the time for victims to receive their first payment decreased from 572 days to 318 days, a difference of roughly -8½ months.
31
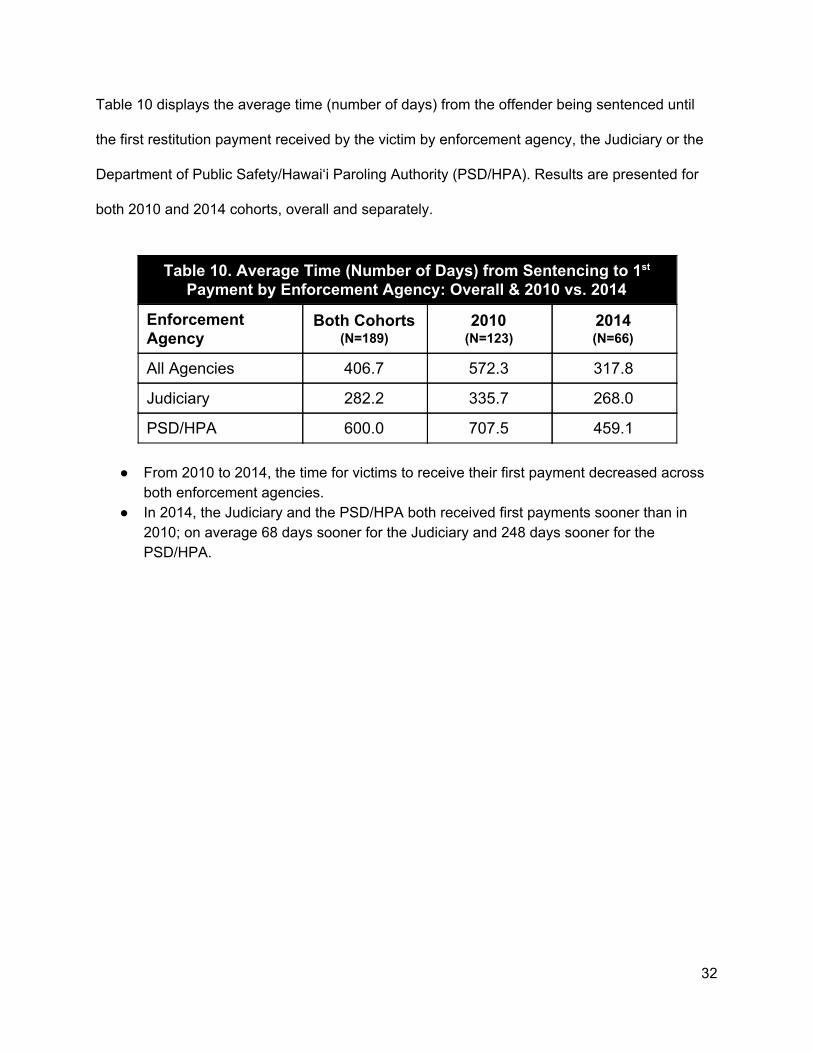
Table 10 displays the average time (number of days) from the offender being sentenced until
the first restitution payment received by the victim by enforcement agency, the Judiciary or the
Department of Public Safety/Hawai‘i Paroling Authority (PSD/HPA). Results are presented for
both 2010 and 2014 cohorts, overall and separately.
Table 10. Average Time (Number of Days) from Sentencing to 1st Payment by Enforcement Agency: Overall & 2010 vs. 2014
Enforcement Agency
Both Cohorts (N=189)
2010 (N=123)
2014 (N=66)
All Agencies 406.7 572.3 317.8
Judiciary 282.2 335.7 268.0
PSD/HPA 600.0 707.5 459.1
● From 2010 to 2014, the time for victims to receive their first payment decreased across both enforcement agencies.
● In 2014, the Judiciary and the PSD/HPA both received first payments sooner than in 2010; on average 68 days sooner for the Judiciary and 248 days sooner for the PSD/HPA.
32
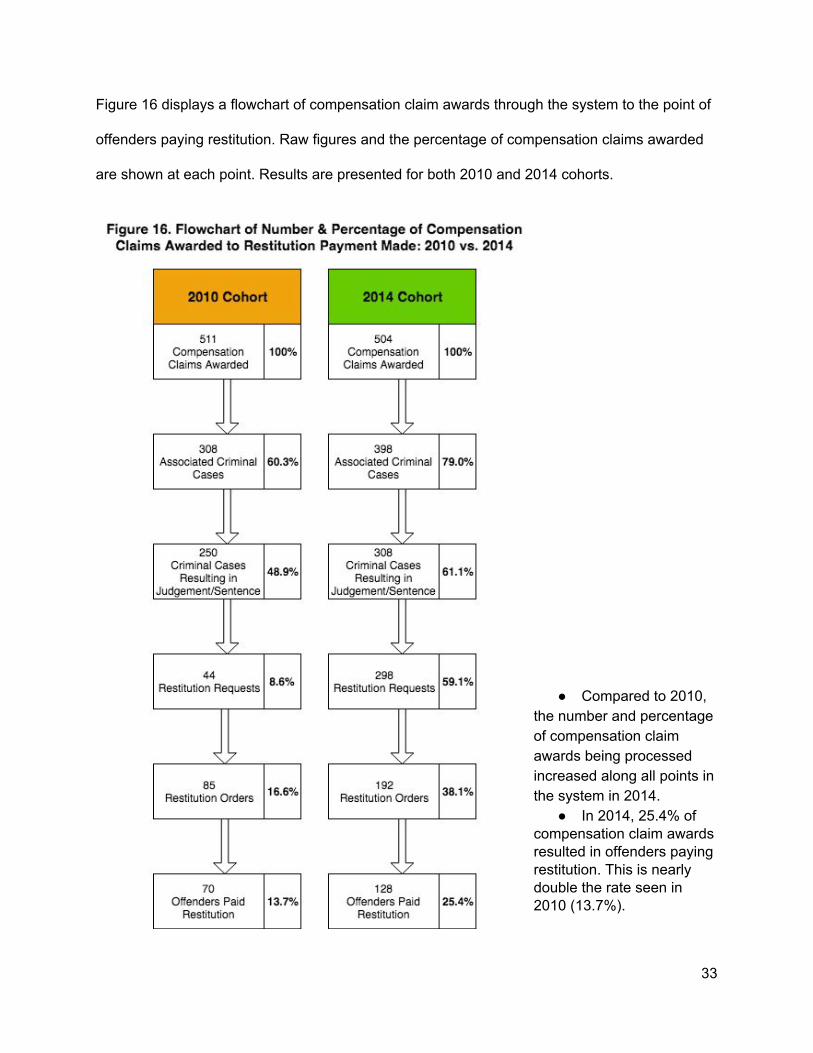
Figure 16 displays a flowchart of compensation claim awards through the system to the point of
offenders paying restitution. Raw figures and the percentage of compensation claims awarded
are shown at each point. Results are presented for both 2010 and 2014 cohorts.
● Compared to 2010, the number and percentage of compensation claim awards being processed increased along all points in the system in 2014.
● In 2014, 25.4% of compensation claim awards resulted in offenders paying restitution. This is nearly double the rate seen in 2010 (13.7%).
33
Discussion of Findings & Implications for Policy & Practice
Victim Demographics The majority of victims were female (63.3%); meanwhile, in terms of age, 21% of all victims
were represented by especially vulnerable groups (i.e., minor or elderly). The county of
residence of the victims points to the City & County of Honolulu being underrepresented in the
number of victims making restitution claims, while Hawai‘i County is overrepresented (i.e., the
proportion of state population percentage when compared to the percentage of victims making
restitution claims was 69%:50% for C&C of Honolulu and 14%:30% for Hawai‘i County). Unless
offender and victim dynamics are extremely different for each county, this suggests that,
proportionately, residents of Hawai‘i County may be more aware of and/or willing to seek out
compensation through the Commission than the other three counties.
Compensation Awards The rate of awarding compensation claims was about 70% with the remaining 30% being
denied due to the availability of other collateral benefits, unmet eligibility requirements or
duplicate claims. This rate remained steady when comparing 2010 and 2014 data. The rate of
compensation for medical/dental and mental health expenses experienced notable decreases
during this time frame. The average compensation award granted decreased overall by -22%
between 2010 and 2014. Decreases in the rate of compensation awarded for medical/dental
expenses accounted for the largest proportion of this overall decrease. This change can likely
be attributed to the Commission’s Medical Expense Reduction Project, which seeks to reduce
and contain escalating medical expenses by working with medical treatment providers to accept
a reduced amount as payment in full.
34
Criminal Cases: Offenses & Sentence Dispositions Overall, corresponding criminal cases were identified for 70.0% of the compensation claim
awards in the study. For the remaining 30% of compensation claims, associated criminal cases
could not be identified, possibly because the perpetrator was not apprehended, or criminal
charges were not pursued. Because the Commission is statutorily authorized to award
compensation to only victims of violent crimes, the vast majority of offense convictions in the
criminal cases included in this study (83.2%) were physical, abusive, or sexual in nature. A full
70% of these criminal cases resulted in a sentence; 42.7% received probation, 21.4%
incarceration-prison, and 6.0% incarceration-jail. This indicates that the large majority of those
subject to paying restitution are being directly supervised or in the custody of criminal justice
agencies in the state (i.e., Judiciary, Department of Public Safety, Hawai‘i Paroling Authority).
Restitution Requests Restitution requests increased significantly from 2010 to 2014, going from a rate of 14.3% to
74.9%, respectively. Overall, for both cohorts, the rate was about half (48.4%). This finding
points to increased efficiency in requesting restitution and possibly, secondarily, improved data
collection within this time frame.
Restitution Orders Restitution ordered by the courts in these cases occurred about half of the time (49.3%).There
was a sizable increase in the rate of restitution ordered from 2010 to 2014, going from 33.7% to
61.9%. A chief reason for this increase is likely due to an increase in restitution being requested
initially, though the rate of increase in restitution requests is not fully reflected in the rate of
increase in restitution ordered. The reasons for this difference needs to be explored further;
35
explanations could range from, or be a combination of, different restitution request dynamics
between these two years to different decision-making regarding the ordering of restitution.
Looking at restitution orders more closely, it was found that nearly sixty percent (59.6%) of
cases that resulted in a sentence to incarceration-prison included restitution as a part of the
sentence. This was followed by probation cases (48.0%); meanwhile, incarceration-jail had the
lowest rate (31.7%), which was lower than those cases where a sentence was not given (i.e.,
other-42.9%). Assuming normal case dynamics and restitution requests for these cases
antecedent to sentence disposition, one would expect that the rate of restitution ordered as part
of the sentence would be higher for incarceration-jail. The reason for the lowered rate of
restitution orders for those sentenced to incarceration-jail should be investigated further.
The rate of restitution orders increased across all court circuits from 2010 to 2014. All circuits
displayed a restitution ordered rate of less than half in 2010; subsequently in 2014, all circuits
showed at least a 50% rate of restitution being ordered, with the 1st Circuit courts having the
highest rate (67.8%). The largest percentage increases between 2010 and 2014 were for the
3rd and 5th Circuits (13.4% to 57.0% and 25.0% to 50.0%, respectively). When looking at
restitution orders by the enforcement agency responsible for collecting payments, either the
Judiciary or the Department of Public Safety/Hawai‘i Paroling Authority (PSD/HPA), both
agencies saw increases in the percentage of restitution cases falling under their purview
(naturally due to an increase in requests and orders). Between 2010 and 2014, the percentage
of cases ordered to pay restitution increased from 24.4% to 62.9% for the Judiciary and from
47.3% to 59.6%. This finding advances the conclusion that as the rate of restitution orders
increase, these agencies need to be more efficient at managing restitution payments if current
resources are not further expanded or developed.
36
Restitution Payments/Collections The great majority of offenders ordered to pay restitution made payments (71.2%). This
percentage decreased though from 2010 to 2014, from 82.4% to 66.3%. A fair proportion of
offenders ordered to pay restitution paid their balance in full (41.4%), with an increase in this
regard from 37.0% in 2010 to 43.2% in 2014. [Note for discussion in this section: the figures 17
for 2014 in terms of total restitution paid, restitution balance paid in full, and average total
restitution paid may not be fully finalized since the offenders’ sentences may not be completed
to full term. As such, these figures may eventually increase slightly].
When examining restitution payments by court circuit, all circuits except for the 5th experienced
decreases in offenders making payments. Most were in the 80-90% range in 2010, but these
generally fell to the 60-70% range in 2014. The 5th Circuit was the only circuit to experience an
increase in the percentage of offenders making a payment between 2010 to 2014, going from
66.7% to 85.7%, respectively. In terms of the percentage of offenders paying restitution
balances in full, overall this rate increased between 2010 and 201417, though this increase was
not across all court circuits. The 1st and 3rd Circuits showed increases between 2010 and 2014
(+15% and +5%, respectively), but 2nd and 5th Circuits decreased during this time frame (-8.8%
and -9.6%, respectively). The 5th Circuit had the overall highest rates of offenders paying their
restitution balance in full (about 60%). The reasons for these difference in levels and
increases/decreases across court circuits when looking at restitution payments need to be
explored further; explanations could range from, or be a combination of, available resources,
allocation of resources, procedure (e.g., follow-up), etc.
17 These figures for 2014 may not be fully finalized since the offenders’ sentences may not be completed to full term. As such, these figures may eventually increase slightly.
37
In regards to the percentage of offenders making restitution payments by the enforcement
agency, either the Judiciary or the Department of Public Safety/Hawai‘i Paroling Authority
(PSD/HPA), for those cases under the purview of the Judiciary, the rate remained relatively
unchanged between 2010 and 2014, a slight increase from 65.8% to 69.7%, respectively.
However, the rate for those cases under the enforcement of PSD/HPA decreased significantly
from 95.5% in 2010 to 57.6% in 2014. When examining the percentage of offenders paying
restitution balances in full by enforcement agency, this rate remained relatively unchanged
between 2010 and 2014 for the Judiciary and the PSD/HPA (52.6% to 53.0% and 25.0% to 18
22.0%). Most notably though was an overall difference between offenders paying their
restitution balances in full by these agencies; roughly one-half of offenders under the Judiciary
paid their balance in full versus about one-fourth of offenders overseen by the PSD/HPA. The
notable decrease from 2010 to 2014 for the PSD/HPA in terms of percentage of offenders who
paid restitution and the overall lowered level of restitution balances paid in full when compared
to the Judiciary warrant further investigation. It is unknown if these patterns and trends are due
to offender dynamics, lack of communication/effort/follow-up and if these seeming problematic
issues can be addressed either organizationally or through increased support for efforts via
expanded/more developed resources or reallocation of current resources.
Upon examination of the average total restitution paid and average number of payments by
offenders, these rates decreased from 2010 to 201418 across all court circuits and both
enforcement agencies. Generally speaking, the levels of average total restitution paid amounts
and the average number of payments in 2014 were roughly half of the levels seen in 2010. This
pattern of decrease was also seen in the average payment amount, though not to the same
18 These figures for 2014 may not be fully finalized since the offenders’ sentences may not be completed to full term. As such, these figures may eventually increase slightly.
38
extent (about -20% to -30%). Again, it is not fully unknown if these patterns and trends are due
to offender dynamics, lack of communication/effort/follow-up and if these seeming problematic
issues can be addressed either organizationally or through increased support for efforts via
expanded/more developed resources or reallocation of current resources.
When looking at the time (number of days) from sentencing to the victim receiving their first
restitution payment, the results show that there was significant improvement. In 2010, it would
take on average 572 days for a victim to receive their first restitution payment; this decreased to
318 days in 2014. Examining these data by enforcement agency, time to first payment for those
under the Judiciary decreased from 336 days in 2010 to 268 days in 2014; meanwhile, the time
to first payment for those under the PSD/HPA was more dramatic, decreasing from 708 days in
2010 to 459 days in 2014. These findings point to possible increased efficiency, communication,
leverage, etc. of the system and with or upon the offender. While these figures are improving
significantly, it is noted that these current levels of ‘days to 1st payment’ are still outside what
one would normally expect. While there are likely numerous intervening factors not included
herein, the discrepancy between the expectations via statute and what transpires in the system
warrants further consideration.
Lastly, Figure 16 in the results section is an especially important overview of the flow of
compensation claims that have been awarded and that ultimately end up at the point of an
offender making a restitution payment. At all points within this flow of awarded claims through
the system, the percentages increased from 2010 to 2014 -- and these increases were
substantial. In 2014, 25.4% of compensation claim awards resulted in offenders paying
restitution; this is nearly double the rate seen in 2010 (13.7%). What is also evident from this
flowchart is the increased volume of restitution cases at all points in the system when comparing
39
2010 to 2014. These results are illustrative of an overall increased use of restitution and
efficiency of processing cases within the system. That said, there is still a substantial amount of
attrition; one-fourth of compensation claims that resulted in a restitution payment being made in
2014 is double that of the rate seen in 2010, but it also means that, still, 75% of claims awarded
did not result in an offender making a restitution payment. While overall efficiency is increasing,
there is marked room for improvement. The advancement of resources and attention paid to
restitution cases will ultimately increase the number of victims realizing compensation for the
harms they have suffered.
Concluding Statements on Findings Discussion In any research project, often as answers or directions to find answers are uncovered, more
questions arise. These additional questions usually reside in deeper levels of analysis. Overall,
some trends in restitution in the State show definite improvement, while there are areas that
need to be strengthened. As this project concludes, more is now known about the target
populations, trends/patterns in awards, sentencing/offenders, and trends/patterns in restitution
orders and payments/collections. Additionally, we included a fuller spectrum of offenders,
including probationers who were ordered to reimburse the Commission through restitution
(when usually only those incarcerated have been focused on in previous studies). We also
achieved insights into where strengths and deficiencies may reside, and this has pointed us to
more specific questions to ask and analyze in order to root out the answers. So far, it is a mixed
bag: restitution requests and orders have increased, though payment/collection is mixed
(lowered rates of payment, lowered average payment amounts, but higher rates of balances
paid in full). Meanwhile, the time to first payment has shortened significantly. Some of these
trends and patterns present themselves across all court circuits and enforcement agencies.
When this is the case, one needs to examine things at a systemic level. However, there are
40

some court circuits and enforcement agencies that buck negative trends in various areas --
these groups need to be looked at in earnest to see if their activities can be applied and adopted
by those other circuits and enforcement agencies where things are not at levels that they would
hope to be.
41
Research Partnership & Future (Pathways)
Ways Partnership can be Sustained The partnership between the Crime Victim Compensation Commission and Chaminade
University (CUH) worked quite well. Communication and follow-up were at high levels. Research
tasks were completed with solid teamwork and when obstacles were encountered, they were
minimal and overcome. The primaries on this research project at the Commission and
Chaminade University have discussed the future of this partnership and feel that there are
definitely areas where future collaborations would be beneficial to initiate. The groups have
discussed performing further analyses of the data, exploring support for furthered research, and
integrating CUH graduate students into the research and mission efforts put forth by the
Commission.
If/How the Project Strengthened the Relationship Prior to this project, there was no working relationship between the Commission and CUH.
Despite working in similar and sometimes overlapping areas historically, the primaries from both
partners never worked directly on a project. This opportunity has cultivated this relationship.
Informing Stakeholders of Findings/Results (Present & Ongoing) The research project partners will be presenting the results of this research minimally to the
commissioners and staff of the Crime Victim Compensation Commission, the State’s Justice
Reinvestment Initiative (JRI) workgroups, the Hawai‘i State Legislature, and to leadership at
involved agencies and departments, including but not limited to the: Department of Public
Safety, Hawai‘i State Judiciary, Hawai‘i Paroling Authority, and County Prosecutors. The
research may also be presented at professional conferences.
42