Embed Size (px)
Citation preview

applied sciences
Article
Improving Energy Recovery Rate of the RegenerativeBraking System by Optimization ofInfluencing Factors
Lei Xu 1, Xiaohui He 1,* and Xinmin Shen 1,2,*1 Department of Mechanical Engineering, College of Field Engineering, Army Engineering University,
No. 1 Haifu Street, Nanjing 210007, China; [email protected] State Key Laboratory in Ultra-Precision Machining Technology, Department of Industrial and Systems
Engineering, The Hong Kong Polytechnic University, Kowloon, Hong Kong SAR 999077, China* Correspondence: [email protected] (X.H.); [email protected] (X.S.); Tel.: +86-025-8082-1343 (X.H.);
+86-025-8082-1451 (X.S.)
Received: 17 July 2019; Accepted: 6 September 2019; Published: 11 September 2019�����������������
Featured Application: The obtained high energy recovery rate would promote the application ofthe regenerative braking system in the hydraulic and other kinds of hybrid vehicles.
Abstract: The braking energy can be recovered and recycled by the regenerative braking system,which is significant to improve economics and environmental effect of the hydraulic hybrid vehicle.Influencing factors for the energy recovery rate of regenerative braking system in hydraulic hybridvehicle were investigated in this study. Based on the theoretical analysis of accumulator and energyrecovery rate, modeling of the regenerative braking system and its energy management strategy wasconducted in the simulation platform of LMS Imagine Lab AMESim. The simulation results indicatedthat the influencing factors included braking intensity, initial pressure of the accumulator, and initialbraking speed, and the optimal energy recovery rate of 87.61% was achieved when the parameterswere 0.4, 19 MPa, and 300 rpm, respectively. Experimental bench was constructed and a series ofexperiments on energy recovery rate with different parameters were conducted, which aimed tovalidate the simulation results. It could be found, that with the optimal parameters obtained in thesimulation process, the actual energy recovery rate achieved in the experiment was 83.33%, whichwas almost consistent with the simulation result. The obtained high energy recovery rate wouldpromote the application of regenerative braking system in the hydraulic hybrid vehicle.
Keywords: energy recovery rate; hydraulic hybrid vehicle; regenerative braking system; brakingintensity; initial pressure of the accumulator; initial braking speed; energy management strategy
1. Introduction
The braking energy can be recovered and recycled by the regenerative braking system in thehybrid vehicle, which was propitious to save energy, reduce the emission of polluting gases, and protectthe environment [1,2]. The hydraulic hybrid vehicle is an important type of the hybrid vehicle, whichtakes the internal-combustion engine as a power source, the hydraulic fluid as energy transfer medium,and the controllable valve as regulator [3,4]. It has the advantages of a large driving force, excellentfuel economy, long service life, fast response, and flexible controllability, which make it the promisingcandidate vehicle type for most of the construction machineries and some special vehicles [5,6].Therefore, analysis, simulation, and optimization of the influencing factors for energy recovery rate ofregenerative braking system not only be meaningful to improve economic and environmental effect of
Appl. Sci. 2019, 9, 3807; doi:10.3390/app9183807 www.mdpi.com/journal/applsci

Appl. Sci. 2019, 9, 3807 2 of 19
the hydraulic hybrid vehicle [7,8], but also can provide significant and valuable guidance for the otherkinds of hybrid vehicles.
The researches on the influencing factors of other kinds of hybrid vehicles supply the meaningfulreferences for this study [9–13]. A novel cyber-physical system approach was reported by Lv et al. [9]to determine how to optimally adapt the automatic control of an intelligent electric vehicle to drivingstyles, and the experimental results validated feasibility and effectiveness of the proposed codesignoptimization approach. Meanwhile, a novel continuous observation method was proposed basedon the artificial neural networks to quantitatively analyze and recognize the brake intensity [10].In addition, the experimental results demonstrated feasibility and accuracy of the proposed hybridlearning methods. Furthermore, a novel probabilistic estimation method of the brake pressure hadbeen developed for the electrified vehicles based on the multilayer artificial neural networks (ANNs)with the Levenberg-Marquardt backpropagation (LMBP) training algorithm [11], feasibility andaccuracy of which were validated by the conducted experiments. Moreover, the regenerative brakingcontribution to energy efficiency improvement of the electrified vehicles was investigated by thetheoretical analysis, analog simulation, and vehicle tests [12]. Kumar and Subramanian had proposeda new cooperative control of regenerative braking and friction braking called the “combined braking”for the rear-wheel-driven series hybrid electric vehicle [13], and the simulation results under the urbandriving and across the Modified Indian Driving Cycle and vehicle road testing results showed that theproposed combined braking could regenerate more than twice the braking energy of normal parallelbraking. Although research targets of these studies were not the hydraulic hybrid vehicle, the usedmethods in theory, in simulation, and in experiment provided helpful references for investigationon influencing factors for the energy recovery rate of regenerative braking system in the hydraulichybrid vehicle.
The mainly present researches on the influencing factors for energy recovery rate, focus on theselection of auxiliary power source, which includes the battery [14], supercapacitor [15], mechanicalflywheel [16], hydraulic accumulator [17], and so on. Among the auxiliary power sources, hydraulicaccumulator has the advantages of a high efficiency, simple structure, high reliability, and a lowcost [18]. Moreover, the hydraulic accumulator can restrain the impact and remain the steady when theforklift truck, excavator, loader, bulldozer, or other vehicles carry some heavy goods [19]. Therefore,the hydraulic accumulator is a promising auxiliary power source for the hydraulic hybrid vehicle.Relative to system structure of the parallel connection or the mixed connection, the series connectioncan achieve a higher energy recovery rate [20]. Until now, there are few researches investigating theinfluencing factors for the energy recovery rate in the hydraulic hybrid vehicle with series connection,which has been gradually applied in some large engineering machinery and heavy vehicle. Therefore,theoretical analysis, analog simulation, and experimental validation of the influencing factors forthe energy recovery rate of regenerative braking system in the hydraulic hybrid vehicle with theseries connection were conducted in this research, and optimization of these influencing factorswere also obtained in both the simulation process and experimental process, which was an effectiveattempt to develop novel regenerative braking system for the next generation hydraulic hybrid vehicle.Meanwhile, optimizing the influencing factors for energy recovery rate of the regeneration brakingsystem would also be meaningful for the hydraulic hybrid cars used in the city or the inter-city driving,which could reduce the fuel consumption, increase the driving mileage, and improve the off-roadcapacity, since there was frequent braking usually in the driving process.
In this study, based on the theoretical analysis of the accumulator and that of the energy recoveryrate [21,22], modeling of the regenerative braking system and its energy management strategy [23]was conducted in the simulation platform of LMS Imagine Lab AMESim [24], which could obtain theinfluencing factors for energy recovery rate and their corresponding effects. Experimental bench wasconstructed according to the theoretical model, and a series of experiments on the energy recovery ratewith different parameters were conducted, which aimed to validate the simulation results and obtainoptimal influencing factors.

Appl. Sci. 2019, 9, 3807 3 of 19
2. Theoretical Analysis
Schematic diagram of the hydraulic hybrid vehicle with a series connection is shown in Figure 1.There are four pump/motors installed in the investigated hydraulic hybrid vehicle, because there arefour wheels and each wheel is driven independently. There is another pump to connect the engine,high-pressure accumulator, and the four pump/motors, which is used to transform the mechanicalenergy generated by the engine to the hydraulic energy and transmit it to the four wheels throughthe flow of hydraulic oil. Meanwhile, the low-pressure accumulator was used to form a completehydraulic oil circuit. The four directional valves are used to control flow direction of the hydraulic oil,which can work in the forward or backward conduction status. The four clutches are used to connectthe four pump/motors and the four wheels, which are used to transmit the energies between the fourpump/motors and the four wheels. When the vehicle is in the normal running process, the engine istaken as the original power supply of whole vehicle, and four pump/motors work in the condition ofhydraulic motor. The mechanical energy generated by the engine is transformed to the hydraulic energyof the hydraulic oil, and the four directional valves work in the forward conduction status, by whichthe hydraulic oil is delivered to the four pump/motors and the hydraulic energy is transferred to fourwheels. For the mechanism of energy transfer, it included two processes. Firstly, during the brakingprocess, the wheels are considered as the power supply and the four pump/motors work in the conditionof the pump, and the four directional valves work in the backward conduction status. The mechanicalenergies of four wheels are transferred to the hydraulic energies in the four pump/motors and thosefour are laid in the high-pressure accumulator. Secondly, when the vehicle starts again or accelerates,the stored hydraulic energies in the high-pressure accumulator can be released to auxiliary drive thefour wheels and the four directional valves work in the forward conduction status again, which canobtain the aim of energy recovery in the hydraulic hybrid vehicle. The anti-lock braking (ABS) systemis usually fixed between the wheel and the pump/motor to improve the driving safety, which has noinfluence to operation of the energy recovery system in Figure 1. However, the energy recovery rate willbe decreased, because the ABS system uses some braking energy and this energy can’t be regenerated.Furthermore, the additional tare mass on the hydraulic hybrid vehicle has complicated effect to theenergy recovery rate. The larger the additional tare mass is, the higher capacity of the pump/motor andthe bigger volume of the accumulator will be. For the same speed, the hydraulic hybrid vehicle withadditional tare mass indicates more braking energy can be recovered in the braking process and moreenergy is required when the vehicle starts again or accelerates. Thus, to a certain extent, the energyrecovery rate is not affected when the additional tare mass is small. When the energy recovery exceedscapacity of the selected accumulator along with increase of the additional tare mass, the excessive energyis not reused and the energy recovery rate will decrease.
Appl. Sci. 2019, 9, x FOR PEER REVIEW 3 of 21
2. Theoretical Analysis
Schematic diagram of the hydraulic hybrid vehicle with a series connection is shown in Figure 1. There are four pump/motors installed in the investigated hydraulic hybrid vehicle, because there are four wheels and each wheel is driven independently. There is another pump to connect the engine, high-pressure accumulator, and the four pump/motors, which is used to transform the mechanical energy generated by the engine to the hydraulic energy and transmit it to the four wheels through the flow of hydraulic oil. Meanwhile, the low-pressure accumulator was used to form a complete hydraulic oil circuit. The four directional valves are used to control flow direction of the hydraulic oil, which can work in the forward or backward conduction status. The four clutches are used to connect the four pump/motors and the four wheels, which are used to transmit the energies between the four pump/motors and the four wheels. When the vehicle is in the normal running process, the engine is taken as the original power supply of whole vehicle, and four pump/motors work in the condition of hydraulic motor. The mechanical energy generated by the engine is transformed to the hydraulic energy of the hydraulic oil, and the four directional valves work in the forward conduction status, by which the hydraulic oil is delivered to the four pump/motors and the hydraulic energy is transferred to four wheels. For the mechanism of energy transfer, it included two processes. Firstly, during the braking process, the wheels are considered as the power supply and the four pump/motors work in the condition of the pump, and the four directional valves work in the backward conduction status. The mechanical energies of four wheels are transferred to the hydraulic energies in the four pump/motors and those four are laid in the high-pressure accumulator. Secondly, when the vehicle starts again or accelerates, the stored hydraulic energies in the high-pressure accumulator can be released to auxiliary drive the four wheels and the four directional valves work in the forward conduction status again, which can obtain the aim of energy recovery in the hydraulic hybrid vehicle. The anti-lock braking (ABS) system is usually fixed between the wheel and the pump/motor to improve the driving safety, which has no influence to operation of the energy recovery system in Figure 1. However, the energy recovery rate will be decreased, because the ABS system uses some braking energy and this energy can’t be regenerated. Furthermore, the additional tare mass on the hydraulic hybrid vehicle has complicated effect to the energy recovery rate. The larger the additional tare mass is, the higher capacity of the pump/motor and the bigger volume of the accumulator will be. For the same speed, the hydraulic hybrid vehicle with additional tare mass indicates more braking energy can be recovered in the braking process and more energy is required when the vehicle starts again or accelerates. Thus, to a certain extent, the energy recovery rate is not affected when the additional tare mass is small. When the energy recovery exceeds capacity of the selected accumulator along with increase of the additional tare mass, the excessive energy is not reused and the energy recovery rate will decrease.
Figure 1. Schematic diagram of the hydraulic hybrid vehicle with a series connection. Figure 1. Schematic diagram of the hydraulic hybrid vehicle with a series connection.
Appl. Sci. 2019, 9, 3807 4 of 19
The hydraulic accumulator is the critical component of the regenerative braking system, and itsproperties are the major influencing factors for the energy recovery rate [25,26]. As the major energyconversion component, gas in the hydraulic accumulator changes along with the temperature duringthe energy conversion process. Therefore, the heat dissipation loss should be taken into account whenenergy recovery rate of the accumulator is calculated. The heat dissipation loss is mainly influenced byair polytropic exponent n, which can be calculated by Equation (1) [27]. Here, qmax is maximum flowof the pipeline connected with the accumulator, in m3/s; qa is current flow, in m3/s.
n =0.4
qmaxqa + 1 (1)
In consideration of the heat dissipation loss, the corresponding energy conversion Eh along with thechange of pressure of the hydraulic oil in the hydraulic accumulator can be calculated, as shown inEquation (2). According to the working principle of the hydraulic accumulator, pressure adjustment ofthe hydraulic oil is realized by controlling pressure of the pre-stored nitrogen in it. Here, V1 and V2 arevolume of the nitrogen in the hydraulic accumulator before and after change, in m3; P0 is pre-chargepressure of the hydraulic accumulator, in Pa; V0 is the corresponding gas volume in the hydraulicaccumulator for the pre-charge pressure, in m3.
Eh =
V2∫V1
PdV =
V2∫V1
P0(V0
V)
ndV =
V2∫V1
P0(V0
V)
0.4qmax qa+1
dV (2)
Supposing that temperature in the hydraulic accumulator does not change in energy conversionprocess, the corresponding energy conversion can be calculated by Equations (3) and (4) [28]. Here,E is the energy conversion in the condition of the isothermal process, in J; Eh is the energy conversionin the condition of the adiabatic process, in J; Er is the heat dissipation loss, in J; P1 and P2 are thepressure of the accumulator before and after the change, in Pa.
E =
V2∫V1
PdV =P0V0
0.4
(
P1
P0
) 0.41.4
−
(P2
P0
) 0.41.4
(3)
Er = E− Eh (4)
Besides the heat dissipation loss, there are also on-way pressure loss in the pipeline and local pressureloss in the joint and elbow [29]. In order to simplify the calculation, the local pressure loss is replacedby the equivalent on-way pressure loss. Therefore, the pressure loss ∆PL (in Pa) between the twohydraulic components can be calculated by the Equation (5), and the energy loss WL (in J) can becalculated by the Equation (6). Here, ξ is the on-way resistance coefficient, which can be consulted inthe handbook for the mechanical design or handbook for the hydraulic transmission design; Le is totalequivalent effective length of the pipeline, in m; QL is the flow passed through the pipeline, in m3/s;g is the gravitational acceleration, in m/s2; D is diameter of the pipeline, in m; A is cross-sectional areaof the pipeline, in m2.
∆PL =ξLeQL
2
2gDA2 (5)
WL =
t∫0
∆PLQLdt =
t∫0
ξLeQL3
2gDA2 dt (6)
When the vehicle is braked, the mechanical energies of the wheels are transferred to hydraulic energiesof the hydraulic accumulator, and the pressure is increased until the maximum pressure, whichindicates that the hydraulic accumulator is full filled. Afterwards, the residual braking energy flows
Appl. Sci. 2019, 9, 3807 5 of 19
back to the low-pressure accumulator through the overflow valve, and these energies cannot beregenerated. The energy recovery rate is defined as the ratio between the recycled energy by thehydraulic accumulator and the kinetic energy change of the vehicle before and after braking, and it canbe calculated by the Equation (7). Here, m is weight of the vehicle, in Kg; v0 and v1 are the velocityof the vehicle before and after braking, in m/s. In this way, the theoretical energy recovery rate ηacc
can be obtained. There were several reasons for the energy loss in the recovery process, which couldbe resulted from transmission of the hydraulic oil in the pipelines and these hydraulic components,friction of the wheel and mechanical transmission system, and so on.
ηacc =E− Er −WL12 m(v2
1 − v20)
=
V2∫V1
P0(V0V )
0.4qmax qa+1
dV −t∫
0
ξLeQL3
2gDA2 dt
12 m(v2
1 − v20)
(7)
3. Modeling and Simulation
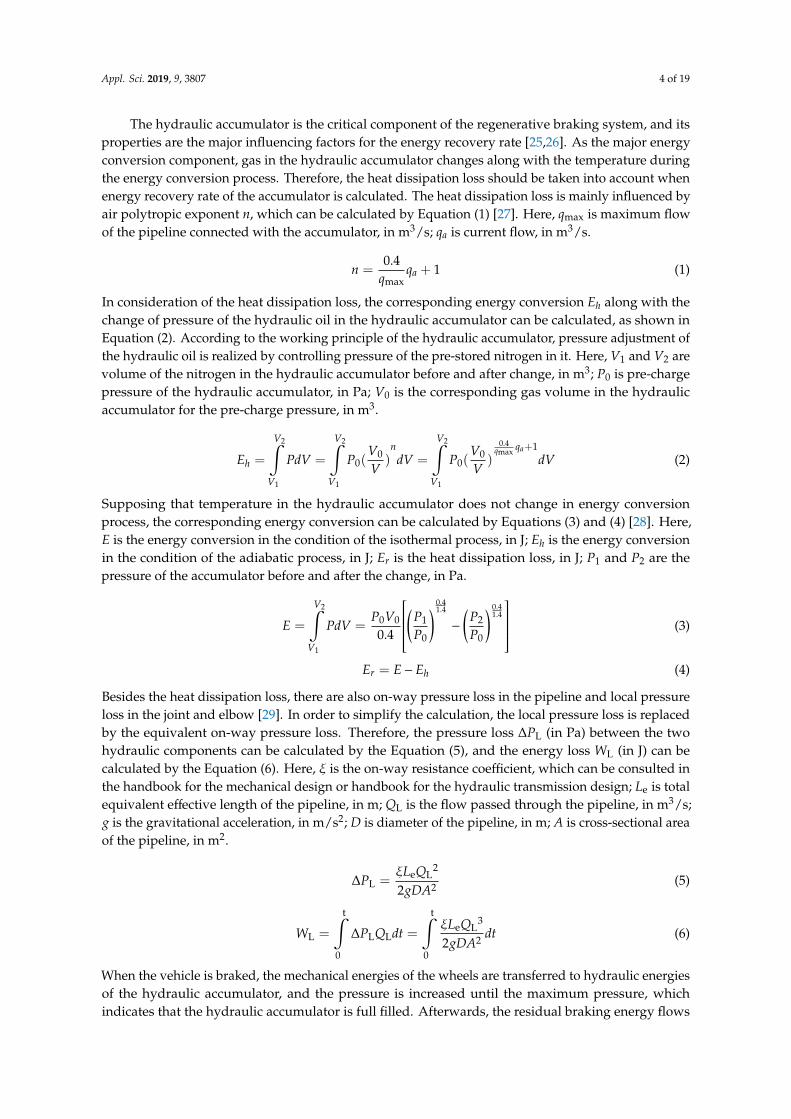
The regenerative braking system consists of the accumulator, pump/motor, flywheel, tank, andcontroller, and its structure and operational principle is shown in Figure 2, which is local enlargementof the regenerative braking system for one of the four wheels of the hydraulic hybrid vehicle inFigure 1. Under manipulations of the accumulator, pump/motor, and the flywheel by the controller,the hydraulic energy and the mechanical energy are interchanged, by which realize the recyclabilityand regeneration of the braking energy. According to the operational principle of the regenerativebraking system, it can be found that the major influencing factors for the energy recovery rate arethe braking intensity, initial pressure of the accumulator, initial braking speed, displacement of thepump/motor, and the volume of the accumulator. Here, braking intensity is an evaluation index ofthe vehicle’s braking efficiency, which represents braking capacity of the braking system, and it isdefined as the ratio between the braking deceleration of the vehicle and the gravitational acceleration.However, volume of the accumulator and displacement of the pump/motor are constant for certainregenerative braking system when it is selected and installed on the experimental bench in this study,and their performances are decided by size of the accumulator and parameters of the pump/motorrespectively. Thus, for the selected accumulator and pump/motor, the adjustable parameters for theregenerative braking system are the braking intensity, initial pressure of the accumulator, and the initialbraking speed, and these influencing factors are investigated in this research. Meanwhile, influences ofsize of the accumulator and parameters of the pump/motor to energy recovery rate of the regenerativebraking system will be further investigated in future study. Moreover, more detailed study, whichincluded impact of the arrangement of pump/motor, operating conditions, different objective functions,and so on, will be taken into consideration in further research.Appl. Sci. 2019, 9, x FOR PEER REVIEW 6 of 21
Figure 2. Structure and operational principle of the regenerative braking system.
3.1. Energy Control Strategy
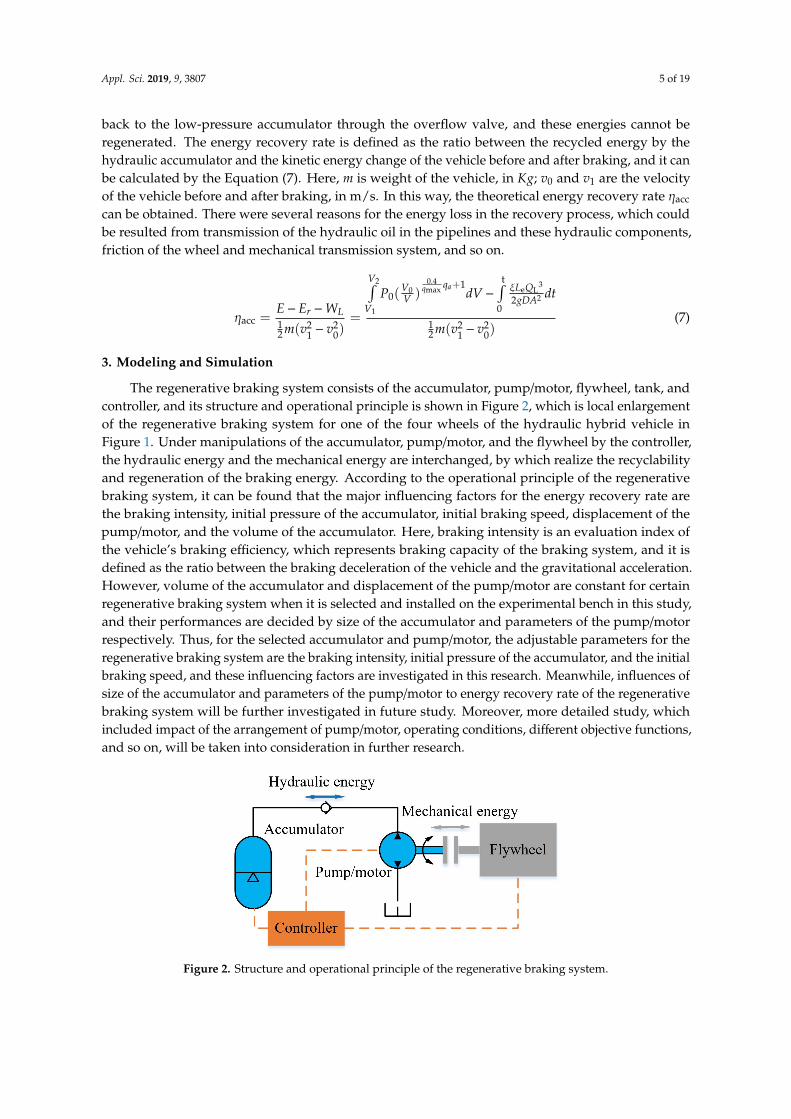
The energy control strategy directly affects the energy recovery rate, and it includes calculation of the required braking torque based on the driving condition, calculation of the hydraulic braking torque according to the pressure of the accumulator, the target torque for the pump/motor, and other modular. Flow chart of the critical control strategy is shown in Figure 3. Firstly, the braking mode is judged and decided through calculating the required braking torque according to the present driving conditions. If the braking mode is emergency brake, the friction brake is adopted to ensure safety. Otherwise, the target torque is compared with the regenerative braking torque. If the regenerative braking torque supplied by the hydraulic accumulator can meet the requirement, only the hydraulic brake is adopted. Otherwise, the friction brake will be used to compensate the lack of the braking torque. Thirdly, the recycled energy stored in the hydraulic accumulator can be released when the vehicle starts again or accelerates. Thus, due to incompressibility of the used hydraulic oil, possible failure of the regenerative braking system would not result in the crash potentials, and the friction brake could keep safety of the driving cycle. The double-brake system not only can improve the safety factor of the vehicle, but also will increase the energy usage efficiency.
Figure 3. Flow chart of the critical energy control strategy.
3.2. Model Construction
Modeling of the regenerative braking system and corresponding energy management strategy was conducted in the simulation platform of LMS Imagine Lab AMESim in this research, and the
Figure 2. Structure and operational principle of the regenerative braking system.
Appl. Sci. 2019, 9, 3807 6 of 19
3.1. Energy Control Strategy
The energy control strategy directly affects the energy recovery rate, and it includes calculationof the required braking torque based on the driving condition, calculation of the hydraulic brakingtorque according to the pressure of the accumulator, the target torque for the pump/motor, and othermodular. Flow chart of the critical control strategy is shown in Figure 3. Firstly, the braking mode isjudged and decided through calculating the required braking torque according to the present drivingconditions. If the braking mode is emergency brake, the friction brake is adopted to ensure safety.Otherwise, the target torque is compared with the regenerative braking torque. If the regenerativebraking torque supplied by the hydraulic accumulator can meet the requirement, only the hydraulicbrake is adopted. Otherwise, the friction brake will be used to compensate the lack of the brakingtorque. Thirdly, the recycled energy stored in the hydraulic accumulator can be released when thevehicle starts again or accelerates. Thus, due to incompressibility of the used hydraulic oil, possiblefailure of the regenerative braking system would not result in the crash potentials, and the frictionbrake could keep safety of the driving cycle. The double-brake system not only can improve the safetyfactor of the vehicle, but also will increase the energy usage efficiency.
Appl. Sci. 2019, 9, x FOR PEER REVIEW 6 of 21
Figure 2. Structure and operational principle of the regenerative braking system.
3.1. Energy Control Strategy
The energy control strategy directly affects the energy recovery rate, and it includes calculation of the required braking torque based on the driving condition, calculation of the hydraulic braking torque according to the pressure of the accumulator, the target torque for the pump/motor, and other modular. Flow chart of the critical control strategy is shown in Figure 3. Firstly, the braking mode is judged and decided through calculating the required braking torque according to the present driving conditions. If the braking mode is emergency brake, the friction brake is adopted to ensure safety. Otherwise, the target torque is compared with the regenerative braking torque. If the regenerative braking torque supplied by the hydraulic accumulator can meet the requirement, only the hydraulic brake is adopted. Otherwise, the friction brake will be used to compensate the lack of the braking torque. Thirdly, the recycled energy stored in the hydraulic accumulator can be released when the vehicle starts again or accelerates. Thus, due to incompressibility of the used hydraulic oil, possible failure of the regenerative braking system would not result in the crash potentials, and the friction brake could keep safety of the driving cycle. The double-brake system not only can improve the safety factor of the vehicle, but also will increase the energy usage efficiency.
Figure 3. Flow chart of the critical energy control strategy.
3.2. Model Construction
Modeling of the regenerative braking system and corresponding energy management strategy was conducted in the simulation platform of LMS Imagine Lab AMESim in this research, and the
Figure 3. Flow chart of the critical energy control strategy.
3.2. Model Construction
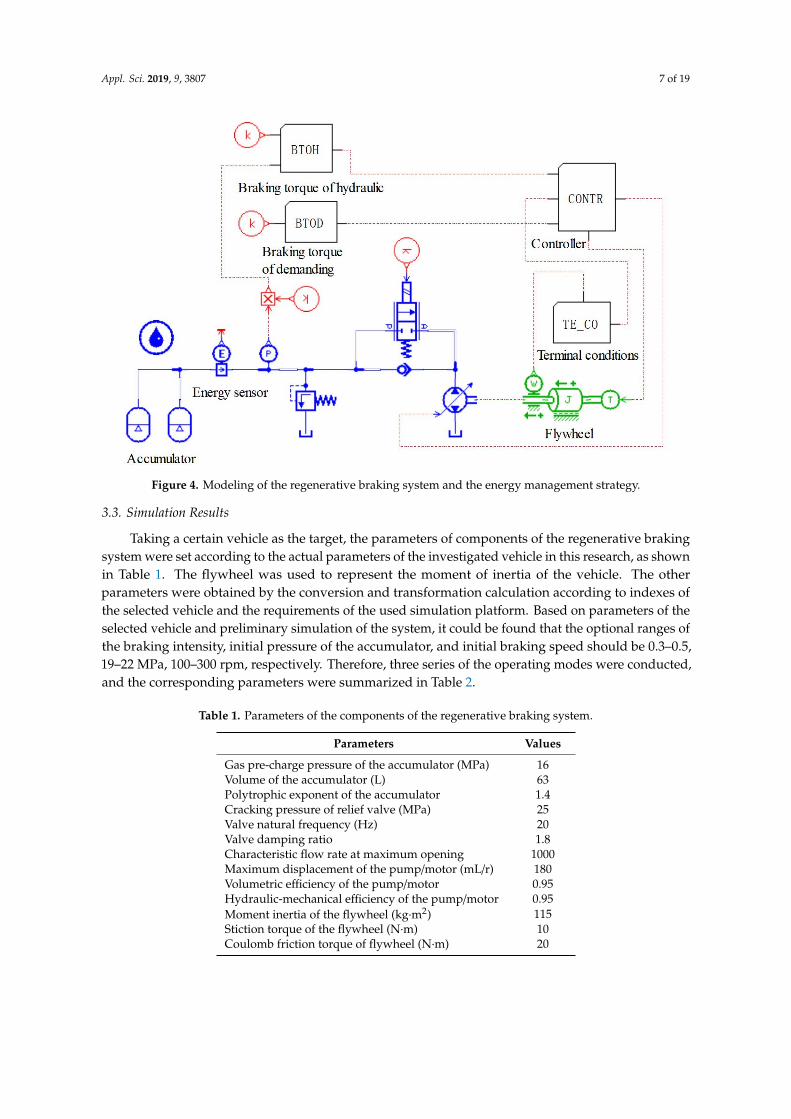
Modeling of the regenerative braking system and corresponding energy management strategywas conducted in the simulation platform of LMS Imagine Lab AMESim in this research, and theconstructed model is shown in Figure 4. The accumulator, pump/motor, and the flywheel were criticalcomponents in the simulation system. According to the operational principle of the regenerativebraking system and its energy management strategy, the critical components and some sensors wereselected and connected, and each component was manipulated by the controller. By setting differentinitial conditions, the regenerative braking system could work under different operating mode. In thisway, the effects of these influencing factors could be simulated and analyzed respectively.
Appl. Sci. 2019, 9, 3807 7 of 19
Appl. Sci. 2019, 9, x FOR PEER REVIEW 7 of 21
constructed model is shown in Figure 4. The accumulator, pump/motor, and the flywheel were critical components in the simulation system. According to the operational principle of the regenerative braking system and its energy management strategy, the critical components and some sensors were selected and connected, and each component was manipulated by the controller. By setting different initial conditions, the regenerative braking system could work under different operating mode. In this way, the effects of these influencing factors could be simulated and analyzed respectively.
Figure 4. Modeling of the regenerative braking system and the energy management strategy.
3.3. Simulation Results
Taking a certain vehicle as the target, the parameters of components of the regenerative braking system were set according to the actual parameters of the investigated vehicle in this research, as shown in Table 1. The flywheel was used to represent the moment of inertia of the vehicle. The other parameters were obtained by the conversion and transformation calculation according to indexes of the selected vehicle and the requirements of the used simulation platform. Based on parameters of the selected vehicle and preliminary simulation of the system, it could be found that the optional ranges of the braking intensity, initial pressure of the accumulator, and initial braking speed should be 0.3-0.5, 19-22 MPa, 100–300 rpm, respectively. Therefore, three series of the operating modes were conducted, and the corresponding parameters were summarized in Table 2.
Figure 4. Modeling of the regenerative braking system and the energy management strategy.
3.3. Simulation Results
Taking a certain vehicle as the target, the parameters of components of the regenerative brakingsystem were set according to the actual parameters of the investigated vehicle in this research, as shownin Table 1. The flywheel was used to represent the moment of inertia of the vehicle. The otherparameters were obtained by the conversion and transformation calculation according to indexes ofthe selected vehicle and the requirements of the used simulation platform. Based on parameters of theselected vehicle and preliminary simulation of the system, it could be found that the optional ranges ofthe braking intensity, initial pressure of the accumulator, and initial braking speed should be 0.3–0.5,19–22 MPa, 100–300 rpm, respectively. Therefore, three series of the operating modes were conducted,and the corresponding parameters were summarized in Table 2.
Table 1. Parameters of the components of the regenerative braking system.
Parameters Values
Gas pre-charge pressure of the accumulator (MPa) 16Volume of the accumulator (L) 63Polytrophic exponent of the accumulator 1.4Cracking pressure of relief valve (MPa) 25Valve natural frequency (Hz) 20Valve damping ratio 1.8Characteristic flow rate at maximum opening 1000Maximum displacement of the pump/motor (mL/r) 180Volumetric efficiency of the pump/motor 0.95Hydraulic-mechanical efficiency of the pump/motor 0.95Moment inertia of the flywheel (kg·m2) 115Stiction torque of the flywheel (N·m) 10Coulomb friction torque of flywheel (N·m) 20

Appl. Sci. 2019, 9, 3807 8 of 19
Table 2. The corresponding parameters in the three series of operating modes.
Operating Mode Parameters
Braking Intensity Initial Pressure of theAccumulator (MPa)
Initial Braking Speed(rpm)
With different brakingintensity
0.30 19 3000.35 19 3000.40 19 3000.45 19 3000.50 19 300
With different initialpressure of theaccumulator
0.40 19 3000.40 20 3000.40 21 3000.40 22 300
With different initialbraking speed
0.40 19 1000.40 19 1500.40 19 2000.40 19 2500.40 19 300
3.3.1. Simulation Data with Different Braking Intensity
The braking intensity ranged from 0.3 to 0.5 at the interval of 0.05 when the initial pressureof the accumulator was kept as 19 MPa and the initial braking speed was kept as 300 rpm. Firstly,the accumulator was charged to 19 MPa. Secondly, the flywheel was separately driven to the speed of300 rpm by the accumulator. The speed of 300 rpm of the flywheel was equivalent to the 120 km/h ofthe selected vehicle. Thirdly, the flywheel was braked with the different braking intensity of 0.3–0.5at the interval of 0.05. The obtained evolutions of speed of the flywheel and those of pressure of theaccumulator were shown in Figure 5a,b, respectively.
Appl. Sci. 2019, 9, x FOR PEER REVIEW 9 of 21
(a) (b)
Figure 5. Simulation results with the different braking intensity: (a) Evolution of speed of the flywheel, (b) Evolution of pressure of the accumulator.
It could be observed that the simulation process could be divided into three periods. In the first period, the flywheel was driven by the accumulator. Speed of the flywheel was increased along with release of the hydraulic energy in the accumulator. In the second period, the vehicle was braked. The mechanical energy of the flywheel was transferred to the hydraulic energy of the accumulator. In the third period, the flywheel stopped. Speed of the flywheel was back to 0 rpm and pressure of the accumulator was tending towards stability. The braking time, change of the kinetic energy, recycled energy amount, and the energy recovery rate with different braking intensity were calculated and summarized in Table 3.
Table 3. The simulation results in the operating mode with different braking intensity.
Parameters
Braking intensity 0.30 0.35 0.40 0.45 0.50 Initial pressure of the accumulator (MPa)
19 19 19 19 19
Initial braking speed (rpm) 300 300 300 300 300
Results
Braking time (s) 10.23 9.11 7.54 6.62 6.15 Kinetic energy change (J) 56,750 56,750 56,750 56,750 56,750 The recycled energy by the accumulator (J) 49,432 49,620 49,719 46,961 42,446
Energy recovery rate (%) 87.12 87.44 87.61 82.75 74.79
From Table 3, it could be found that effect of the braking intensity to the energy recovery rate was not linear, and energy recovery rate reached its peak value of 87.61% when the braking intensity was 0.4. Further increase of the braking intensity led to decrease of the energy recovery rate, because the target torque exceeded the maximum regenerative braking torque supplied by the accumulator, which indicated that the friction brake was introduced, and some kinetic energy was lost.
3.3.2. Simulation Data with Different Initial Pressure of the Accumulator
The initial pressure of the accumulator ranged from 19 MPa to 22 MPa at the interval of 1 MPa when the braking intensity was kept at 0.4 and the initial braking speed was set at 300 rpm. In this section, the obtained evolutions of speed of the flywheel and pressure of the accumulator were shown in Figure 6a,b, respectively, and the braking time, change of the kinetic energy, recycled energy amount, and the energy recovery rate with different initial pressure of the accumulator were calculated and summarized in Table 4. It could be observed, that effect of the initial pressure of the accumulator to the energy recovery rate was unobvious, and the energy recovery rate was slightly
Figure 5. Simulation results with the different braking intensity: (a) Evolution of speed of the flywheel,(b) Evolution of pressure of the accumulator.
It could be observed that the simulation process could be divided into three periods. In the firstperiod, the flywheel was driven by the accumulator. Speed of the flywheel was increased along withrelease of the hydraulic energy in the accumulator. In the second period, the vehicle was braked.The mechanical energy of the flywheel was transferred to the hydraulic energy of the accumulator.In the third period, the flywheel stopped. Speed of the flywheel was back to 0 rpm and pressure of theaccumulator was tending towards stability. The braking time, change of the kinetic energy, recycled
Appl. Sci. 2019, 9, 3807 9 of 19
energy amount, and the energy recovery rate with different braking intensity were calculated andsummarized in Table 3.
Table 3. The simulation results in the operating mode with different braking intensity.
ParametersBraking intensity 0.30 0.35 0.40 0.45 0.50Initial pressure of the accumulator (MPa) 19 19 19 19 19Initial braking speed (rpm) 300 300 300 300 300
Results
Braking time (s) 10.23 9.11 7.54 6.62 6.15Kinetic energy change (J) 56,750 56,750 56,750 56,750 56,750The recycled energy by the accumulator (J) 49,432 49,620 49,719 46,961 42,446Energy recovery rate (%) 87.12 87.44 87.61 82.75 74.79
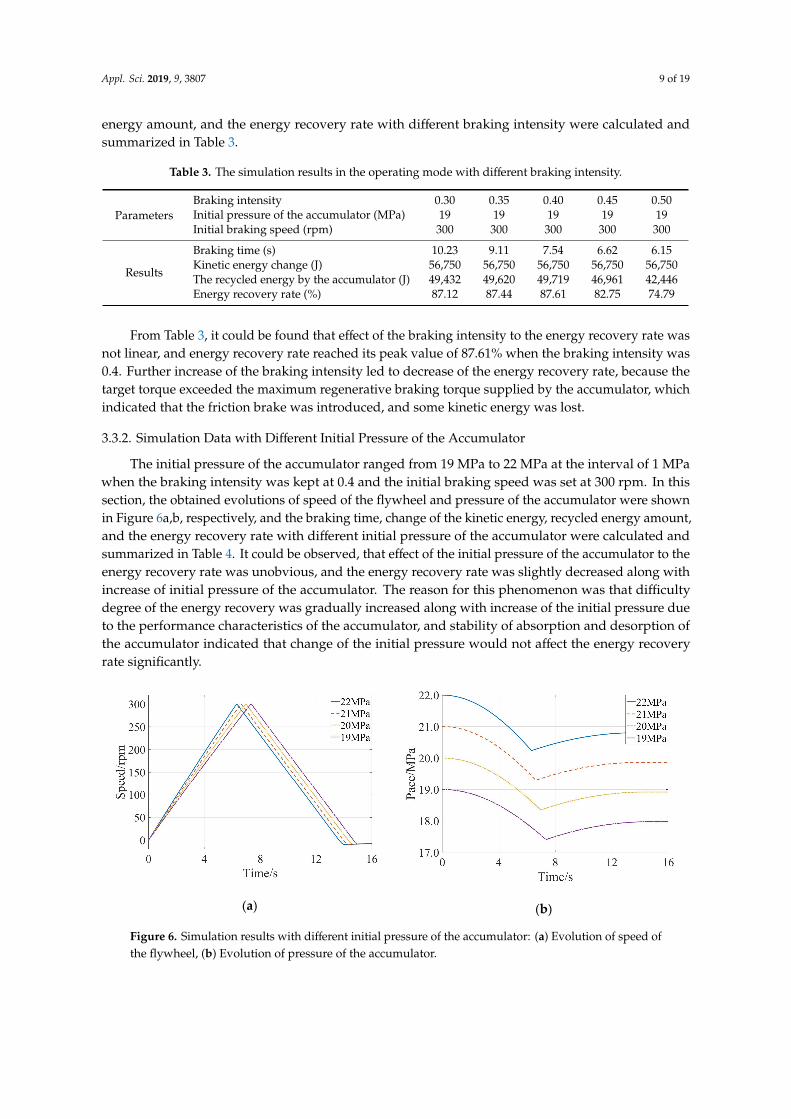
From Table 3, it could be found that effect of the braking intensity to the energy recovery rate wasnot linear, and energy recovery rate reached its peak value of 87.61% when the braking intensity was0.4. Further increase of the braking intensity led to decrease of the energy recovery rate, because thetarget torque exceeded the maximum regenerative braking torque supplied by the accumulator, whichindicated that the friction brake was introduced, and some kinetic energy was lost.
3.3.2. Simulation Data with Different Initial Pressure of the Accumulator
The initial pressure of the accumulator ranged from 19 MPa to 22 MPa at the interval of 1 MPawhen the braking intensity was kept at 0.4 and the initial braking speed was set at 300 rpm. In thissection, the obtained evolutions of speed of the flywheel and pressure of the accumulator were shownin Figure 6a,b, respectively, and the braking time, change of the kinetic energy, recycled energy amount,and the energy recovery rate with different initial pressure of the accumulator were calculated andsummarized in Table 4. It could be observed, that effect of the initial pressure of the accumulator to theenergy recovery rate was unobvious, and the energy recovery rate was slightly decreased along withincrease of initial pressure of the accumulator. The reason for this phenomenon was that difficultydegree of the energy recovery was gradually increased along with increase of the initial pressure dueto the performance characteristics of the accumulator, and stability of absorption and desorption ofthe accumulator indicated that change of the initial pressure would not affect the energy recoveryrate significantly.
Appl. Sci. 2019, 9, x FOR PEER REVIEW 10 of 21
decreased along with increase of initial pressure of the accumulator. The reason for this phenomenon was that difficulty degree of the energy recovery was gradually increased along with increase of the initial pressure due to the performance characteristics of the accumulator, and stability of absorption and desorption of the accumulator indicated that change of the initial pressure would not affect the energy recovery rate significantly.
(a) (b)
Figure 6. Simulation results with different initial pressure of the accumulator: (a) Evolution of speed of the flywheel, (b) Evolution of pressure of the accumulator.
Table 4. The simulation results in operating mode with different initial pressure of the accumulator.
Parameters Braking intensity 0.40 0.40 0.40 0.40 Initial pressure of the accumulator (MPa) 19 20 21 22 Initial braking speed (rpm) 300 300 300 300
Results
Braking time (s) 7.54 7.54 7.54 7.54 Kinetic energy change (J) 56,750 56,750 56,750 56,750 The recycled energy by the accumulator (J) 49,719 49,663 49,608 49,553 Energy recovery rate (%) 87.61 87.51 87.41 87.32
3.3.3. Simulation Data with Different Initial Braking Speed
The initial braking speed ranged from 100 rpm to 300 rpm at an interval of 50 rpm when the braking intensity was kept at 0.4 and the initial pressure of the accumulator was set at 19 MPa. In this section, the obtained evolutions of speed of the flywheel and pressure of the accumulator were shown in Figure 7a,b, respectively, and the braking time, change of the kinetic energy, recycled energy amount, and the energy recovery rate with different initial pressure of the accumulator were calculated and summarized in Table 5. It could be found that improvement of the energy recovery rate was almost linear along with increase of the initial braking speed. Performance characteristics of the hydraulic accumulator indicated that efficiencies of the energy absorption and desorption of the hydraulic accumulator would be higher with a larger energy input, which meant that the hydraulic accumulator could recycle more braking energy when the initial braking speed was larger.
Figure 6. Simulation results with different initial pressure of the accumulator: (a) Evolution of speed ofthe flywheel, (b) Evolution of pressure of the accumulator.

Appl. Sci. 2019, 9, 3807 10 of 19
Table 4. The simulation results in operating mode with different initial pressure of the accumulator.
ParametersBraking intensity 0.40 0.40 0.40 0.40Initial pressure of the accumulator (MPa) 19 20 21 22Initial braking speed (rpm) 300 300 300 300
Results
Braking time (s) 7.54 7.54 7.54 7.54Kinetic energy change (J) 56,750 56,750 56,750 56,750The recycled energy by the accumulator (J) 49,719 49,663 49,608 49,553Energy recovery rate (%) 87.61 87.51 87.41 87.32
3.3.3. Simulation Data with Different Initial Braking Speed
The initial braking speed ranged from 100 rpm to 300 rpm at an interval of 50 rpm when thebraking intensity was kept at 0.4 and the initial pressure of the accumulator was set at 19 MPa. In thissection, the obtained evolutions of speed of the flywheel and pressure of the accumulator were shownin Figure 7a,b, respectively, and the braking time, change of the kinetic energy, recycled energy amount,and the energy recovery rate with different initial pressure of the accumulator were calculated andsummarized in Table 5. It could be found that improvement of the energy recovery rate was almostlinear along with increase of the initial braking speed. Performance characteristics of the hydraulicaccumulator indicated that efficiencies of the energy absorption and desorption of the hydraulicaccumulator would be higher with a larger energy input, which meant that the hydraulic accumulatorcould recycle more braking energy when the initial braking speed was larger.
Appl. Sci. 2019, 9, x FOR PEER REVIEW 11 of 21
(a) (b)
Figure 7. Simulation results with different initial braking speed: (a) Evolution of speed of the flywheel, (b) Evolution of pressure of the accumulator.
Table 5. The simulation results in the operating mode with different initial braking speed.
Parameters Braking intensity 0.40 0.40 0.40 0.40 0.40 Initial pressure of the accumulator (MPa) 19 19 19 19 19 Initial braking speed (rpm) 100 150 200 250 300
Results
Braking time (s) 2.60 4.09 5.08 6.24 7.54 Kinetic energy change (J) 6035 13,579 25,222 37,719 56,750 The recycled energy by the accumulator (J)
4476 10,500 20,546 31,714 49,719
Energy recovery rate (%) 74.16 77.32 81.46 84.08 87.61
4. Experimental Validation
Based on the established theoretical model of the regenerative braking system, an experimental bench was constructed, and its schematic diagram was shown in Figure 8. Its operating principle was as follows, which corresponded to the marks Figure 8.
(1) The motor was utilized to realize the function of internal-combustion engine of the selected vehicle, and it drove the connected pump as the major power source.
(2) The accumulator could work as accumulation component during the braking time and as auxiliary power source during the driving time, and switch of the working mode could be adjusted through the electro-hydraulic proportional directional valve.
(3) The maximum working pressure of the system was set by the electromagnetic relief valve, and the real-time working pressure could be adjusted through the relief valve.
(4) The moment of inertia of the selected vehicle was equivalent to a flywheel, and it could be considered as a power component to drive the hydraulic pump/motor during the braking time.
(5) There were many sensors used in the constructed experimental bench, which consisted of pressure sensor, temperature sensor, flow sensor, torque-speed transducer, and so on, which aimed to constantly test and monitor status of the system.
Besides these components, the integrated control system was designed and developed by the digital signal processor of TMS320F2812 and the corresponding data acquisition module, which could realize accurate control of the experimental bench and rapid collection of the experimental data. Meanwhile, the validated experiments were also conducted in three series of operating modes, which was consistent with the simulation process.
Figure 7. Simulation results with different initial braking speed: (a) Evolution of speed of the flywheel,(b) Evolution of pressure of the accumulator.
Table 5. The simulation results in the operating mode with different initial braking speed.
ParametersBraking intensity 0.40 0.40 0.40 0.40 0.40Initial pressure of the accumulator (MPa) 19 19 19 19 19Initial braking speed (rpm) 100 150 200 250 300
Results
Braking time (s) 2.60 4.09 5.08 6.24 7.54Kinetic energy change (J) 6035 13,579 25,222 37,719 56,750The recycled energy by the accumulator (J) 4476 10,500 20,546 31,714 49,719Energy recovery rate (%) 74.16 77.32 81.46 84.08 87.61
4. Experimental Validation
Based on the established theoretical model of the regenerative braking system, an experimentalbench was constructed, and its schematic diagram was shown in Figure 8. Its operating principle wasas follows, which corresponded to the marks Figure 8.

Appl. Sci. 2019, 9, 3807 11 of 19
Appl. Sci. 2019, 9, x FOR PEER REVIEW 12 of 21
Figure 8. Schematic diagram of the experimental bench.
4.1. Energy Recovery Rate with Different Braking Intensity
Similar to the simulation process with different braking intensity, the braking intensity ranged from 0.3 to 0.5 at the interval of 0.05 when the initial pressure of the accumulator was kept at 19 MPa and the initial braking speed was kept at 300 rpm. Comparisons of the simulation data and the experimental data were exhibited in Figures 9–13 corresponding to the braking intensity from 0.3 to 0.5. From the comparisons of speeds of the flywheel in Figures 9a, 10a, 11a, 12a, and 13a, it could be observed that the actual peak speed was larger than 300 rpm, because response of the accumulator had a time delay. Meanwhile, from the comparisons of pressures of the accumulator in Figures 9b, 10b, 11b, 12b, and 13b, it could be found that the actual reduction of the pressures was larger than the simulation data, because there were pressure loss in the hydraulic system and frictional resistance for the inertial flywheel, which indicated that the accumulator must release more energy to drive the flywheel for the given initial braking speed. Similarly, the recycled energy collected by the accumulator was also reduced. In addition, there were obvious fluctuations of the pressure during the braking time, because sudden reversal of the hydraulic fluid led to tremendous impact to the hydraulic system. Moreover, fluctuations of the pressure during the braking time had no influence to working status of the directional valve, because the directional valve was adjusted by controller of the experimental bench according to the driving condition. Meanwhile, fluctuations of the pressure during the braking time affected the overall system control and the mechanical integrity indeed, but it had no influence on the research results in this study, because calculation of the energy recovery rate used the overall trends of the pressure instead of each individual data. Some new equipment, such as pulsation dampener or pulse attenuator, will be added in the experimental bench to reduce fluctuations of the pressure in further improvement.
Figure 8. Schematic diagram of the experimental bench.
(1) The motor was utilized to realize the function of internal-combustion engine of the selectedvehicle, and it drove the connected pump as the major power source.
(2) The accumulator could work as accumulation component during the braking time and asauxiliary power source during the driving time, and switch of the working mode could be adjustedthrough the electro-hydraulic proportional directional valve.
(3) The maximum working pressure of the system was set by the electromagnetic relief valve, andthe real-time working pressure could be adjusted through the relief valve.
(4) The moment of inertia of the selected vehicle was equivalent to a flywheel, and it could beconsidered as a power component to drive the hydraulic pump/motor during the braking time.
(5) There were many sensors used in the constructed experimental bench, which consisted ofpressure sensor, temperature sensor, flow sensor, torque-speed transducer, and so on, which aimed toconstantly test and monitor status of the system.
Besides these components, the integrated control system was designed and developed by thedigital signal processor of TMS320F2812 and the corresponding data acquisition module, which couldrealize accurate control of the experimental bench and rapid collection of the experimental data.Meanwhile, the validated experiments were also conducted in three series of operating modes, whichwas consistent with the simulation process.
4.1. Energy Recovery Rate with Different Braking Intensity
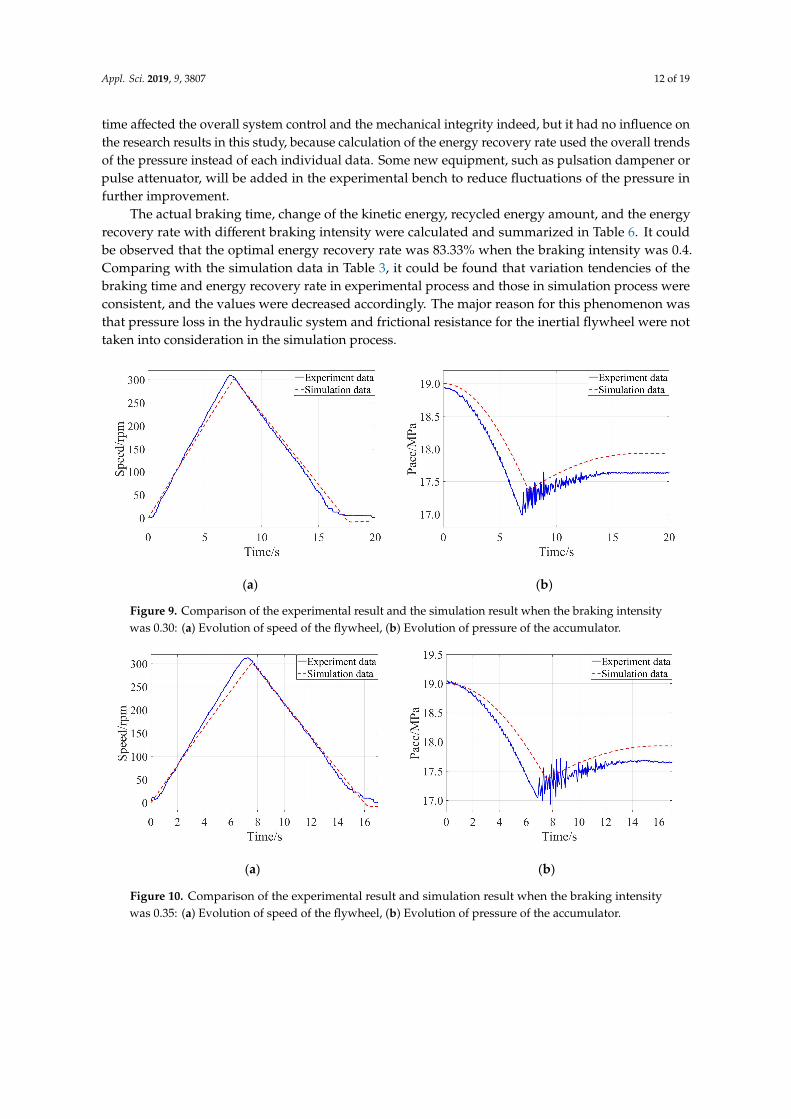
Similar to the simulation process with different braking intensity, the braking intensity rangedfrom 0.3 to 0.5 at the interval of 0.05 when the initial pressure of the accumulator was kept at 19 MPaand the initial braking speed was kept at 300 rpm. Comparisons of the simulation data and theexperimental data were exhibited in Figures 9–13 corresponding to the braking intensity from 0.3 to0.5. From the comparisons of speeds of the flywheel in Figures 9a, 10a, 11a, 12a and 13a, it could beobserved that the actual peak speed was larger than 300 rpm, because response of the accumulatorhad a time delay. Meanwhile, from the comparisons of pressures of the accumulator in Figures 9b,10b, 11b, 12b and 13b, it could be found that the actual reduction of the pressures was larger than thesimulation data, because there were pressure loss in the hydraulic system and frictional resistancefor the inertial flywheel, which indicated that the accumulator must release more energy to drive theflywheel for the given initial braking speed. Similarly, the recycled energy collected by the accumulatorwas also reduced. In addition, there were obvious fluctuations of the pressure during the brakingtime, because sudden reversal of the hydraulic fluid led to tremendous impact to the hydraulic system.Moreover, fluctuations of the pressure during the braking time had no influence to working statusof the directional valve, because the directional valve was adjusted by controller of the experimentalbench according to the driving condition. Meanwhile, fluctuations of the pressure during the braking
Appl. Sci. 2019, 9, 3807 12 of 19
time affected the overall system control and the mechanical integrity indeed, but it had no influence onthe research results in this study, because calculation of the energy recovery rate used the overall trendsof the pressure instead of each individual data. Some new equipment, such as pulsation dampener orpulse attenuator, will be added in the experimental bench to reduce fluctuations of the pressure infurther improvement.
The actual braking time, change of the kinetic energy, recycled energy amount, and the energyrecovery rate with different braking intensity were calculated and summarized in Table 6. It couldbe observed that the optimal energy recovery rate was 83.33% when the braking intensity was 0.4.Comparing with the simulation data in Table 3, it could be found that variation tendencies of thebraking time and energy recovery rate in experimental process and those in simulation process wereconsistent, and the values were decreased accordingly. The major reason for this phenomenon wasthat pressure loss in the hydraulic system and frictional resistance for the inertial flywheel were nottaken into consideration in the simulation process.
Appl. Sci. 2019, 9, x FOR PEER REVIEW 13 of 21
(a) (b)
Figure 9. Comparison of the experimental result and the simulation result when the braking intensity was 0.30: (a) Evolution of speed of the flywheel, (b) Evolution of pressure of the accumulator.
(a) (b)
Figure 10. Comparison of the experimental result and simulation result when the braking intensity was 0.35: (a) Evolution of speed of the flywheel, (b) Evolution of pressure of the accumulator.
(a) (b)
Figure 11. Comparison of the experimental result and simulation result when the braking intensity was 0.40: (a) Evolution of speed of the flywheel, (b) Evolution of pressure of the accumulator.
Figure 9. Comparison of the experimental result and the simulation result when the braking intensitywas 0.30: (a) Evolution of speed of the flywheel, (b) Evolution of pressure of the accumulator.
Appl. Sci. 2019, 9, x FOR PEER REVIEW 13 of 21
(a) (b)
Figure 9. Comparison of the experimental result and the simulation result when the braking intensity was 0.30: (a) Evolution of speed of the flywheel, (b) Evolution of pressure of the accumulator.
(a) (b)
Figure 10. Comparison of the experimental result and simulation result when the braking intensity was 0.35: (a) Evolution of speed of the flywheel, (b) Evolution of pressure of the accumulator.
(a) (b)
Figure 11. Comparison of the experimental result and simulation result when the braking intensity was 0.40: (a) Evolution of speed of the flywheel, (b) Evolution of pressure of the accumulator.
Figure 10. Comparison of the experimental result and simulation result when the braking intensitywas 0.35: (a) Evolution of speed of the flywheel, (b) Evolution of pressure of the accumulator.

Appl. Sci. 2019, 9, 3807 13 of 19
Appl. Sci. 2019, 9, x FOR PEER REVIEW 13 of 21
(a) (b)
Figure 9. Comparison of the experimental result and the simulation result when the braking intensity was 0.30: (a) Evolution of speed of the flywheel, (b) Evolution of pressure of the accumulator.
(a) (b)
Figure 10. Comparison of the experimental result and simulation result when the braking intensity was 0.35: (a) Evolution of speed of the flywheel, (b) Evolution of pressure of the accumulator.
(a) (b)
Figure 11. Comparison of the experimental result and simulation result when the braking intensity was 0.40: (a) Evolution of speed of the flywheel, (b) Evolution of pressure of the accumulator.
Figure 11. Comparison of the experimental result and simulation result when the braking intensitywas 0.40: (a) Evolution of speed of the flywheel, (b) Evolution of pressure of the accumulator.
Appl. Sci. 2019, 9, x FOR PEER REVIEW 14 of 21
(a) (b)
Figure 12. Comparison of the experimental result and simulation result when the braking intensity was 0.45: (a) Evolution of speed of the flywheel, (b) Evolution of pressure of the accumulator.
(a) (b)
Figure 13. Comparison of the experimental result and simulation result when the braking intensity was 0.50: (a) Evolution of speed of the flywheel, (b) Evolution of pressure of the accumulator.
The actual braking time, change of the kinetic energy, recycled energy amount, and the energy recovery rate with different braking intensity were calculated and summarized in Table 6. It could be observed that the optimal energy recovery rate was 83.33% when the braking intensity was 0.4. Comparing with the simulation data in Table 3, it could be found that variation tendencies of the braking time and energy recovery rate in experimental process and those in simulation process were consistent, and the values were decreased accordingly. The major reason for this phenomenon was that pressure loss in the hydraulic system and frictional resistance for the inertial flywheel were not taken into consideration in the simulation process.
Figure 12. Comparison of the experimental result and simulation result when the braking intensitywas 0.45: (a) Evolution of speed of the flywheel, (b) Evolution of pressure of the accumulator.
Appl. Sci. 2019, 9, x FOR PEER REVIEW 14 of 21
(a) (b)
Figure 12. Comparison of the experimental result and simulation result when the braking intensity was 0.45: (a) Evolution of speed of the flywheel, (b) Evolution of pressure of the accumulator.
(a) (b)
Figure 13. Comparison of the experimental result and simulation result when the braking intensity was 0.50: (a) Evolution of speed of the flywheel, (b) Evolution of pressure of the accumulator.
The actual braking time, change of the kinetic energy, recycled energy amount, and the energy recovery rate with different braking intensity were calculated and summarized in Table 6. It could be observed that the optimal energy recovery rate was 83.33% when the braking intensity was 0.4. Comparing with the simulation data in Table 3, it could be found that variation tendencies of the braking time and energy recovery rate in experimental process and those in simulation process were consistent, and the values were decreased accordingly. The major reason for this phenomenon was that pressure loss in the hydraulic system and frictional resistance for the inertial flywheel were not taken into consideration in the simulation process.
Figure 13. Comparison of the experimental result and simulation result when the braking intensitywas 0.50: (a) Evolution of speed of the flywheel, (b) Evolution of pressure of the accumulator.
Appl. Sci. 2019, 9, 3807 14 of 19
Table 6. The experimental results in the operating mode with different braking intensity.
ParametersBraking intensity 0.30 0.35 0.40 0.45 0.50Initial pressure of the accumulator (MPa) 19 19 19 19 19Initial braking speed (rpm) 300 300 300 300 300
Results
Braking time (s) 10.12 9.03 7.45 6.51 5.50Kinetic energy change (J) 56,750 56,750 56,750 56,750 56,750The recycled energy by the accumulator (J) 45,042 45,882 46,722 42,518 38,305Energy recovery rate (%) 79.37 80.85 83.33 74.92 67.49
4.2. Energy Recovery Rate with Different Pressure of the Accumulator
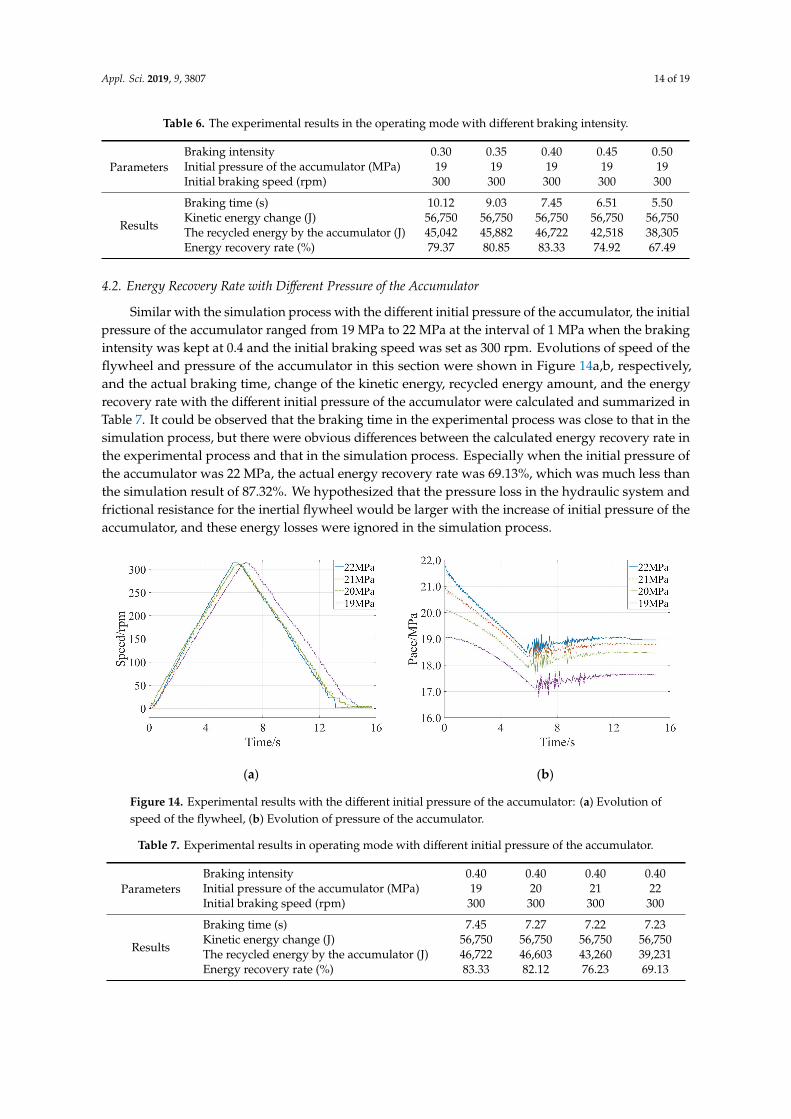
Similar with the simulation process with the different initial pressure of the accumulator, the initialpressure of the accumulator ranged from 19 MPa to 22 MPa at the interval of 1 MPa when the brakingintensity was kept at 0.4 and the initial braking speed was set as 300 rpm. Evolutions of speed of theflywheel and pressure of the accumulator in this section were shown in Figure 14a,b, respectively,and the actual braking time, change of the kinetic energy, recycled energy amount, and the energyrecovery rate with the different initial pressure of the accumulator were calculated and summarized inTable 7. It could be observed that the braking time in the experimental process was close to that in thesimulation process, but there were obvious differences between the calculated energy recovery rate inthe experimental process and that in the simulation process. Especially when the initial pressure ofthe accumulator was 22 MPa, the actual energy recovery rate was 69.13%, which was much less thanthe simulation result of 87.32%. We hypothesized that the pressure loss in the hydraulic system andfrictional resistance for the inertial flywheel would be larger with the increase of initial pressure of theaccumulator, and these energy losses were ignored in the simulation process.
Appl. Sci. 2019, 9, x FOR PEER REVIEW 15 of 21
Table 6. The experimental results in the operating mode with different braking intensity.
Parameters Braking intensity 0.30 0.35 0.40 0.45 0.50 Initial pressure of the accumulator (MPa) 19 19 19 19 19 Initial braking speed (rpm) 300 300 300 300 300
Results
Braking time (s) 10.12 9.03 7.45 6.51 5.50 Kinetic energy change (J) 56,750 56,750 56,750 56,750 56,750 The recycled energy by the accumulator (J)
45,042 45,882 46,722 42,518 38,305
Energy recovery rate (%) 79.37 80.85 83.33 74.92 67.49
4.2. Energy Recovery Rate with Different Pressure of the Accumulator
Similar with the simulation process with the different initial pressure of the accumulator, the initial pressure of the accumulator ranged from 19 MPa to 22 MPa at the interval of 1 MPa when the braking intensity was kept at 0.4 and the initial braking speed was set as 300 rpm. Evolutions of speed of the flywheel and pressure of the accumulator in this section were shown in Figure 14a,b, respectively, and the actual braking time, change of the kinetic energy, recycled energy amount, and the energy recovery rate with the different initial pressure of the accumulator were calculated and summarized in Table 7. It could be observed that the braking time in the experimental process was close to that in the simulation process, but there were obvious differences between the calculated energy recovery rate in the experimental process and that in the simulation process. Especially when the initial pressure of the accumulator was 22 MPa, the actual energy recovery rate was 69.13%, which was much less than the simulation result of 87.32%. We hypothesized that the pressure loss in the hydraulic system and frictional resistance for the inertial flywheel would be larger with the increase of initial pressure of the accumulator, and these energy losses were ignored in the simulation process.
(a) (b)
Figure 14. Experimental results with the different initial pressure of the accumulator: (a) Evolution of speed of the flywheel, (b) Evolution of pressure of the accumulator.
Figure 14. Experimental results with the different initial pressure of the accumulator: (a) Evolution ofspeed of the flywheel, (b) Evolution of pressure of the accumulator.
Table 7. Experimental results in operating mode with different initial pressure of the accumulator.
ParametersBraking intensity 0.40 0.40 0.40 0.40Initial pressure of the accumulator (MPa) 19 20 21 22Initial braking speed (rpm) 300 300 300 300
Results
Braking time (s) 7.45 7.27 7.22 7.23Kinetic energy change (J) 56,750 56,750 56,750 56,750The recycled energy by the accumulator (J) 46,722 46,603 43,260 39,231Energy recovery rate (%) 83.33 82.12 76.23 69.13
Appl. Sci. 2019, 9, 3807 15 of 19
4.3. Energy Recovery Rate with Different Braking Speed
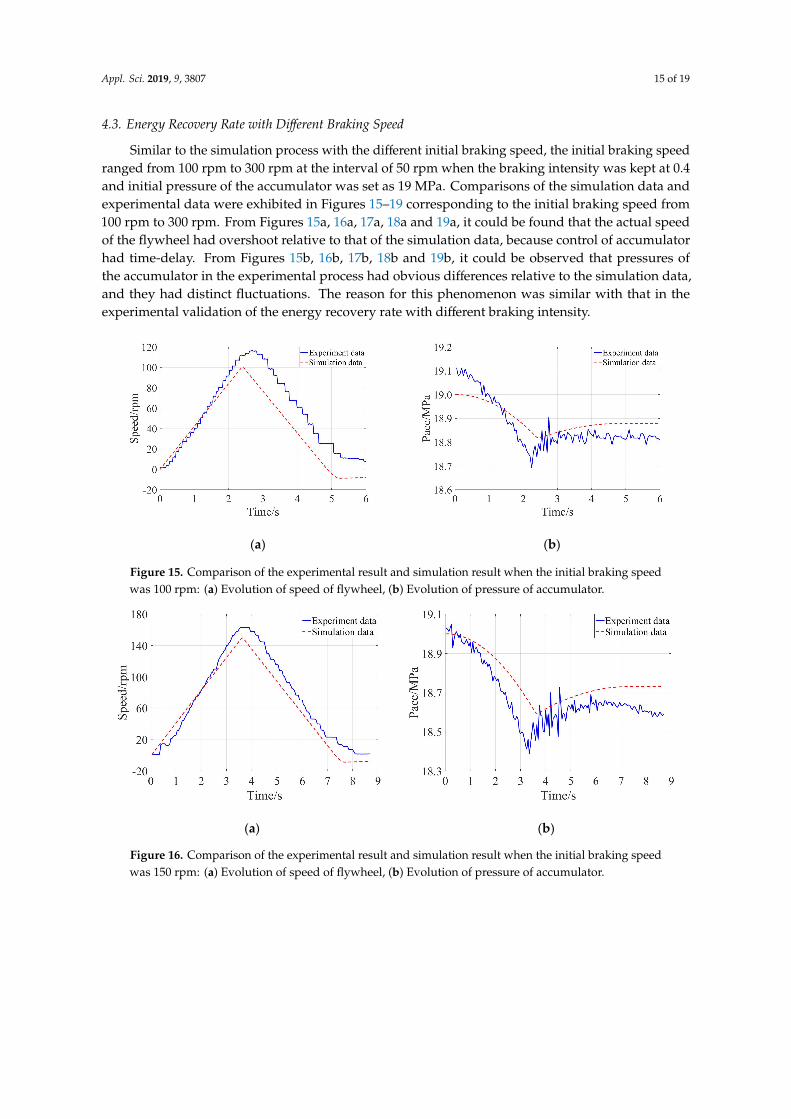
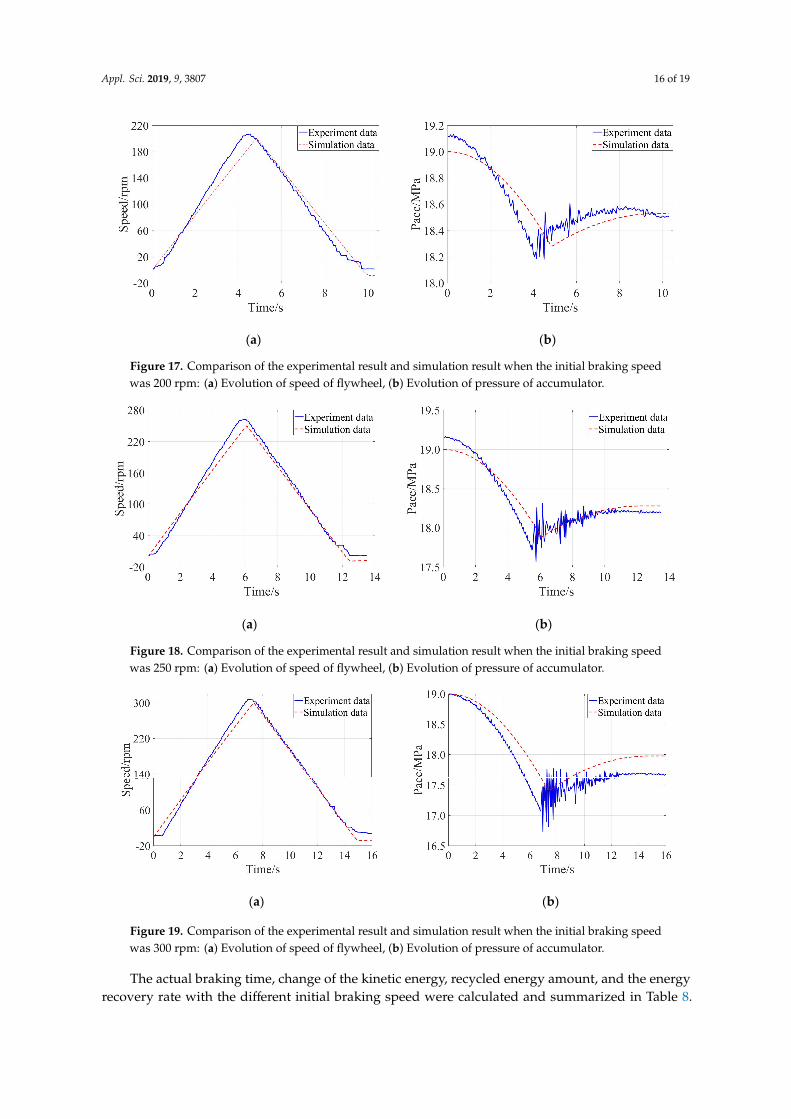
Similar to the simulation process with the different initial braking speed, the initial braking speedranged from 100 rpm to 300 rpm at the interval of 50 rpm when the braking intensity was kept at 0.4and initial pressure of the accumulator was set as 19 MPa. Comparisons of the simulation data andexperimental data were exhibited in Figures 15–19 corresponding to the initial braking speed from100 rpm to 300 rpm. From Figures 15a, 16a, 17a, 18a and 19a, it could be found that the actual speedof the flywheel had overshoot relative to that of the simulation data, because control of accumulatorhad time-delay. From Figures 15b, 16b, 17b, 18b and 19b, it could be observed that pressures ofthe accumulator in the experimental process had obvious differences relative to the simulation data,and they had distinct fluctuations. The reason for this phenomenon was similar with that in theexperimental validation of the energy recovery rate with different braking intensity.
Appl. Sci. 2019, 9, x FOR PEER REVIEW 16 of 21
Table 7. Experimental results in operating mode with different initial pressure of the accumulator.
Parameters Braking intensity 0.40 0.40 0.40 0.40 Initial pressure of the accumulator (MPa) 19 20 21 22 Initial braking speed (rpm) 300 300 300 300
Results
Braking time (s) 7.45 7.27 7.22 7.23 Kinetic energy change (J) 56,750 56,750 56,750 56,750 The recycled energy by the accumulator (J) 46,722 46,603 43,260 39,231 Energy recovery rate (%) 83.33 82.12 76.23 69.13
4.3. Energy Recovery Rate with Different Braking Speed
Similar to the simulation process with the different initial braking speed, the initial braking speed ranged from 100 rpm to 300 rpm at the interval of 50 rpm when the braking intensity was kept at 0.4 and initial pressure of the accumulator was set as 19 MPa. Comparisons of the simulation data and experimental data were exhibited in Figures 15–19 corresponding to the initial braking speed from 100 rpm to 300 rpm. From Figures 15a, 16a, 17a, 18a, and 19a, it could be found that the actual speed of the flywheel had overshoot relative to that of the simulation data, because control of accumulator had time-delay. From Figures 15b, 16b, 17b, 18b, and 19b, it could be observed that pressures of the accumulator in the experimental process had obvious differences relative to the simulation data, and they had distinct fluctuations. The reason for this phenomenon was similar with that in the experimental validation of the energy recovery rate with different braking intensity.
(a)
(b)
Figure 15. Comparison of the experimental result and simulation result when the initial braking speed was 100 rpm: (a) Evolution of speed of flywheel, (b) Evolution of pressure of accumulator.
Figure 15. Comparison of the experimental result and simulation result when the initial braking speedwas 100 rpm: (a) Evolution of speed of flywheel, (b) Evolution of pressure of accumulator.
Appl. Sci. 2019, 9, x FOR PEER REVIEW 17 of 21
(a) (b)
Figure 16. Comparison of the experimental result and simulation result when the initial braking speed was 150 rpm: (a) Evolution of speed of flywheel, (b) Evolution of pressure of accumulator.
(a) (b)
Figure 17. Comparison of the experimental result and simulation result when the initial braking speed was 200 rpm: (a) Evolution of speed of flywheel, (b) Evolution of pressure of accumulator.
(a) (b)
Figure 18. Comparison of the experimental result and simulation result when the initial braking speed was 250 rpm: (a) Evolution of speed of flywheel, (b) Evolution of pressure of accumulator.
Figure 16. Comparison of the experimental result and simulation result when the initial braking speedwas 150 rpm: (a) Evolution of speed of flywheel, (b) Evolution of pressure of accumulator.
Appl. Sci. 2019, 9, 3807 16 of 19
Appl. Sci. 2019, 9, x FOR PEER REVIEW 17 of 21
(a) (b)
Figure 16. Comparison of the experimental result and simulation result when the initial braking speed was 150 rpm: (a) Evolution of speed of flywheel, (b) Evolution of pressure of accumulator.
(a) (b)
Figure 17. Comparison of the experimental result and simulation result when the initial braking speed was 200 rpm: (a) Evolution of speed of flywheel, (b) Evolution of pressure of accumulator.
(a) (b)
Figure 18. Comparison of the experimental result and simulation result when the initial braking speed was 250 rpm: (a) Evolution of speed of flywheel, (b) Evolution of pressure of accumulator.
Figure 17. Comparison of the experimental result and simulation result when the initial braking speedwas 200 rpm: (a) Evolution of speed of flywheel, (b) Evolution of pressure of accumulator.
Appl. Sci. 2019, 9, x FOR PEER REVIEW 17 of 21
(a) (b)
Figure 16. Comparison of the experimental result and simulation result when the initial braking speed was 150 rpm: (a) Evolution of speed of flywheel, (b) Evolution of pressure of accumulator.
(a) (b)
Figure 17. Comparison of the experimental result and simulation result when the initial braking speed was 200 rpm: (a) Evolution of speed of flywheel, (b) Evolution of pressure of accumulator.
(a) (b)
Figure 18. Comparison of the experimental result and simulation result when the initial braking speed was 250 rpm: (a) Evolution of speed of flywheel, (b) Evolution of pressure of accumulator.
Figure 18. Comparison of the experimental result and simulation result when the initial braking speedwas 250 rpm: (a) Evolution of speed of flywheel, (b) Evolution of pressure of accumulator.
Appl. Sci. 2019, 9, x FOR PEER REVIEW 18 of 21
(a)
(b)
Figure 19. Comparison of the experimental result and simulation result when the initial braking speed was 300 rpm: (a) Evolution of speed of flywheel, (b) Evolution of pressure of accumulator.
The actual braking time, change of the kinetic energy, recycled energy amount, and the energy recovery rate with the different initial braking speed were calculated and summarized in Table 8. Comparing with the simulation data in Table 4, the actual braking time and energy recovery rate were reduced accordingly, and the variation tendencies of them were consistent.
Table 8. The experimental results in the operating mode with different initial braking speed.
Parameters Braking intensity 0.40 0.40 0.40 0.40 0.40 Initial pressure of the accumulator (MPa) 19 19 19 19 19 Initial braking speed (rpm) 100 150 200 250 300
Results
Braking time (s) 2.21 3.89 4.81 6.18 7.45 Kinetic energy change (J) 6035 13,579 25,222 37,719 56,750 The recycled energy by the accumulator (J)
4449 10,359 20,501 31,310 46,722
Energy recovery rate (%) 73.72 76.29 81.28 83.01 83.33
From comparisons of the experimental data and the simulation data, effects of the influencing factors of the braking intensity, initial pressure of the accumulator, and the initial braking speed, were analyzed and validated respectively. The research results indicated that energy recovery rate of the regenerative braking system would be improved by optimization of the influencing factors.
5. Conclusions
Influencing factors for energy recovery rate of regenerative braking system in hydraulic hybrid vehicles were investigated in this study. Through the theoretical analysis, analog simulation, and the experimental validation, the following conclusions were obtained.
(1) The adjustable influencing factors for energy recovery rate of the regenerative braking system in the hydraulic hybrid vehicle, which included braking intensity, initial pressure of the accumulator, and initial braking speed, were theoretical analyzed, analog simulated, and experimental validated in this research. The best energy recovery rate achieved in the constructed experimental bench was 83.33%, and the corresponding optimal parameters of the braking intensity, initial pressure of the accumulator, and the initial braking speed were 0.4, 19 MPa, and 300 rpm, respectively, which was exactly consistent with the simulation results. The obtained best energy recovery rate was favorable to develop novel regenerative braking system for the next generation hydraulic hybrid vehicle.
Figure 19. Comparison of the experimental result and simulation result when the initial braking speedwas 300 rpm: (a) Evolution of speed of flywheel, (b) Evolution of pressure of accumulator.
The actual braking time, change of the kinetic energy, recycled energy amount, and the energyrecovery rate with the different initial braking speed were calculated and summarized in Table 8.

Appl. Sci. 2019, 9, 3807 17 of 19
Comparing with the simulation data in Table 4, the actual braking time and energy recovery rate werereduced accordingly, and the variation tendencies of them were consistent.
Table 8. The experimental results in the operating mode with different initial braking speed.
ParametersBraking intensity 0.40 0.40 0.40 0.40 0.40Initial pressure of the accumulator (MPa) 19 19 19 19 19Initial braking speed (rpm) 100 150 200 250 300
Results
Braking time (s) 2.21 3.89 4.81 6.18 7.45Kinetic energy change (J) 6035 13,579 25,222 37,719 56,750The recycled energy by the accumulator (J) 4449 10,359 20,501 31,310 46,722Energy recovery rate (%) 73.72 76.29 81.28 83.01 83.33
From comparisons of the experimental data and the simulation data, effects of the influencingfactors of the braking intensity, initial pressure of the accumulator, and the initial braking speed, wereanalyzed and validated respectively. The research results indicated that energy recovery rate of theregenerative braking system would be improved by optimization of the influencing factors.
5. Conclusions
Influencing factors for energy recovery rate of regenerative braking system in hydraulic hybridvehicles were investigated in this study. Through the theoretical analysis, analog simulation, and theexperimental validation, the following conclusions were obtained.
(1) The adjustable influencing factors for energy recovery rate of the regenerative braking systemin the hydraulic hybrid vehicle, which included braking intensity, initial pressure of the accumulator,and initial braking speed, were theoretical analyzed, analog simulated, and experimental validatedin this research. The best energy recovery rate achieved in the constructed experimental bench was83.33%, and the corresponding optimal parameters of the braking intensity, initial pressure of theaccumulator, and the initial braking speed were 0.4, 19 MPa, and 300 rpm, respectively, which wasexactly consistent with the simulation results. The obtained best energy recovery rate was favorable todevelop novel regenerative braking system for the next generation hydraulic hybrid vehicle.
(2) Effects of three influencing factors to energy recovery rate of the regenerative braking systemwere studied by simulation and experiment respectively, and the research results were summarizedas follows, which were favorable to select appropriate parameters for the various conditions.
(i) The simulation and experimental validation with different braking intensity indicated thateffect of the braking intensity was not linear, and the energy recovery rate reached its peak with theoptimal braking intensity of 0.4, because the maximum regenerative braking torque supplied by theaccumulator was limited.
(ii) It could be concluded from the analog simulation and experimental validation with differentinitial pressure of the accumulator that the energy recovery rate was gradually decreased along withthe increase of initial pressure of the accumulator, because the difficulty degree of the energy recoverywas increased along with increase of the initial pressure owing to performance characteristics of thehydraulic accumulator.
(iii) Judging from the simulation and experimental validation with different initial braking speed,it could be concluded that improvement of the energy recovery rate was almost linear along with theincrease of initial braking speed, because performance characteristics of the hydraulic accumulatorshowed that its efficiencies of energy absorption and desorption were higher when the correspondingenergy input was larger.
(3) The feasibility of energy recovery by the regenerative braking system was simulated by themodel and validated by the experiment. Consistence between the simulation result and experimentalresult proved effectiveness of the constructed simulation model and that of the built experimentalbench, which provided a helpful method to improve energy recovery rate of the regenerative braking

Appl. Sci. 2019, 9, 3807 18 of 19
system and promote its practical application in the hydraulic hybrid vehicle. Meanwhile, it supplieda meaningful reference for the further development of other hybrid vehicles.
In brief, the obtained high energy recovery rate exceeded 80% would promote the application ofregenerative braking system in the hydraulic hybrid vehicle, which would be favorable to acceleratethe development of hydraulic and other kinds of hybrid vehicles. In future study, the real vehicletest will be conducted to further validate effectiveness of the optimal influencing factors, which waspropitious to advance practical application of the achievements obtained in this research.
Author Contributions: Conceptualization, X.H.; Software, X.S.; Validation, L.X., X.H. and X.S.; Formal analysis,X.S.; Investigation, X.L.; Data curation, X.L. and X.H.; Writing—original draft preparation, X.L.; Writing—reviewand editing, X.H. and X.S.; Supervision, X.H.; Funding acquisition, X.H. and X.S.
Funding: This research was funded by National Natural Science Foundation of China, grant number 51505498;Natural Science Foundation of Jiangsu Province, grant number BK20150714; National Key R & D Program ofChina, grant number 2016YFC0802900; Hong Kong Scholars Program, grant number XJ2017025.
Acknowledgments: The authors wish to express their sincere thanks to Xuzhou Construction Machinery Groupfor their help in construction of the experimental bench.
Conflicts of Interest: The authors declare no conflict of interest.
References
1. Ahn, J.K.; Jung, K.H.; Kim, D.H.; Jin, H.B.; Hwang, S.H. Analysis of a regenerative braking system for HybridElectric Vehicles using an Electro-Mechanical Brake. Int. J. Automot. Technol. 2009, 10, 229–234. [CrossRef]
2. Zhao, K.G.; Liang, Z.H.; Huang, Y.J.; Wang, H.; Khajepour, A.; Zhen, Y.K. Research on a NovelHydraulic/Electric Synergy Bus. Energies 2018, 11, 34. [CrossRef]
3. Sun, H. Multi-objective optimization for hydraulic hybrid vehicle based on adaptive simulated annealinggenetic algorithm. Eng. Appl. Artif. Intell. 2010, 23, 27–33.
4. Kwon, H.; Sprengel, M.; Ivantysynova, M. Thermal modeling of a hydraulic hybrid vehicle transmissionbased on thermodynamic analysis. Energy 2016, 116, 650–660. [CrossRef]
5. Chen, Y.L.; Liu, S.A.; Jiang, J.H.; Shang, T.; Zhang, Y.K.; Wei, W. Dynamic analysis of energy storage unit ofthe hydraulic hybrid vehicle. Int. J. Automot. Technol. 2013, 14, 101–112. [CrossRef]
6. Chen, J.S. Energy Efficiency Comparison between Hydraulic Hybrid and Hybrid Electric Vehicles. Energies2015, 8, 4697–4723. [CrossRef]
7. Sun, H.; Yang, L.F.; Jing, J.Q.; Luo, Y.L. Control strategy of hydraulic/electric synergy system in heavy hybridvehicles. Energy Convers. Manag. 2011, 52, 668–674.
8. Zhang, Z.L.; Chen, J.; Wu, B.F. The control strategy of optimal brake energy recovery for a parallel hydraulichybrid vehicle. Proc. Inst. Mech. Eng. 2012, 226, 1445–1453. [CrossRef]
9. Lv, C.; Hu, X.; Vincentelli, A.; Marina, C.; Li, Y.; Cao, D. Driving-Style-Based Co-Design Optimization ofan Automated Electric Vehicle: A Cyber-Physical System Approach. IEEE Trans. Ind. Electron. 2018, 66,2965–2975. [CrossRef]
10. Lv, C.; Xing, Y.; Lu, C.; Liu, Y.; Guo, H.; Gao, H.; Cao, D. Hybrid-Learning-Based Classification andQuantitative Inference of Driver Braking Intensity of an Electrified Vehicle. IEEE Trans. Veh. Technol. 2018,67, 5718–5729. [CrossRef]
11. Lv, C.; Xing, Y.; Zhang, J.; Na, X.; Li, Y.; Liu, T.; Cao, D.; Wang, F.-Y. Levenberg–Marquardt BackpropagationTraining of Multilayer Neural Networks for State Estimation of a Safety-Critical Cyber-Physical System.IEEE Trans. Ind. Inform. 2018, 14, 3436–3446. [CrossRef]
12. Lv, C.; Zhang, J.; Li, Y.; Yuan, Y. Mechanism analysis and evaluation methodology of regenerative brakingcontribution to energy efficiency improvement of electrified vehicles. Energy Convers. Manag. 2015, 92,469–482. [CrossRef]
13. Kumar, C.S.N.; Subramanian, S.C. Cooperative control of regenerative braking and friction braking fora hybrid electric vehicle. Proc. Inst. Mech. Eng. 2016, 230, 103–116. [CrossRef]
14. Giannouli, M.; Yianoulis, P. Study on the incorporation of photovoltaic systems as an auxiliary power sourcefor hybrid and electric vehicles. Sol. Energy 2012, 86, 441–451. [CrossRef]
Appl. Sci. 2019, 9, 3807 19 of 19
15. Thounthong, P.; Raël, S.; Davat, B. Energy management of fuel cell/battery/supercapacitor hybrid powersource for vehicle applications. J. Power Sources 2009, 193, 376–385. [CrossRef]
16. Mierlo, J.V.; Bossche, P.V.D.; Maggetto, G. Models of energy sources for EV and HEV: Fuel cells, batteries,ultracapacitors, flywheels and engine-generators. J. Power Sources 2004, 128, 76–89. [CrossRef]
17. Karbaschian, M.A.; Söffker, D. Review and Comparison of Power Management Approaches for HybridVehicles with Focus on Hydraulic Drives. Energies 2014, 7, 3512–3536. [CrossRef]
18. Wang, D.Y.; Guan, C.; Pan, S.X.; Zhang, M.J.; Lin, X. Performance analysis of hydraulic excavator powertrainhybridization. Autom. Constr. 2009, 18, 249–257. [CrossRef]
19. Sun, H.; Yang, L.F.; Jing, J.Q. Hydraulic/electric synergy system (HESS) design for heavy hybrid vehicles.Energy 2010, 35, 5328–5335.
20. Hung, C.-W.; Vu, T.-V.; Chen, C.-K. The Development of an Optimal Control Strategy for a Series HydraulicHybrid Vehicle. Appl. Sci. 2016, 6, 93. [CrossRef]
21. Vu, T.-V.; Chen, C.-K.; Hung, C.-W. A Model Predictive Control Approach for Fuel Economy Improvementof a Series Hydraulic Hybrid Vehicle. Energies 2014, 7, 7017–7040. [CrossRef]
22. Ho, T.H.; Ahn, K.K. Modeling and simulation of hydrostatic transmission system with energy regenerationusing hydraulic accumulator. J. Mech. Sci. Technol. 2010, 24, 1163–1175. [CrossRef]
23. González-Gil, A.; Palacin, R.; Batty, P. Sustainable urban rail systems: Strategies and technologies for optimalmanagement of regenerative braking energy. Energy Convers. Manag. 2013, 75, 374–388. [CrossRef]
24. Ramakrishnan, R.; Hiremath, S.S.; Singaperumal, M. Theoretical investigations on the effect of systemparameters in series hydraulic hybrid system with hydrostatic regenerative braking. J. Mech. Sci. Technol.2012, 26, 1321–1331. [CrossRef]
25. Lin, T.L.; Wang, Q.F.; Hu, B.Z.; Gong, W. Research on the energy regeneration systems for hybrid hydraulicexcavators. Autom. Constr. 2010, 19, 1016–1026. [CrossRef]
26. Yang, Y.; Luo, C.; Li, P. Regenerative Braking Control Strategy of Electric-Hydraulic Hybrid (EHH) Vehicle.Energies 2017, 10, 1038. [CrossRef]
27. Pourmovahed, A.; Otis, D.R. An Experimental Thermal Time-Constant Correlation for HydraulicAccumulators. J. Dyn. Syst. Meas. Control. 1990, 112, 116–121. [CrossRef]
28. Ho, T.H.; Ahn, K.K. Design and control of a closed-loop hydraulic energy-regenerative system. Autom. Constr.2012, 22, 444–458. [CrossRef]
29. Tan, S.C.; Wang, Z.W.; Wang, C.; Lan, S. Flow fluctuations and flow friction characteristics of vertical narrowrectangular channel under rolling motion conditions. Exp. Therm. Fluid Sci. 2013, 50, 69–78. [CrossRef]
© 2019 by the authors. Licensee MDPI, Basel, Switzerland. This article is an open accessarticle distributed under the terms and conditions of the Creative Commons Attribution(CC BY) license (http://creativecommons.org/licenses/by/4.0/).


![REGENERATIVE BRAKING SYSTEM IN ELECTRIC VEHICLES · REGENERATIVE BRAKING SYSTEM IN ELECTRIC VEHICLES ... REGENERATIVE BRAKING SYSTEM ... Regenerative action during braking[9]](https://img.pdfslide.us/doc/110x75/5adccef67f8b9a1a088c7cf0/regenerative-braking-system-in-electric-vehicles-braking-system-in-electric-vehicles.jpg)


![[PPT]Regenerative Braking Systems and their functions · Web viewHow Does Regenerative Braking Work? Regular brakes waste large amounts of useable energy6 Regenerative Braking systems](https://img.pdfslide.us/doc/110x75/5ae8634b7f8b9aee078f7805/pptregenerative-braking-systems-and-their-functions-viewhow-does-regenerative.jpg)