Embed Size (px)
Citation preview


2
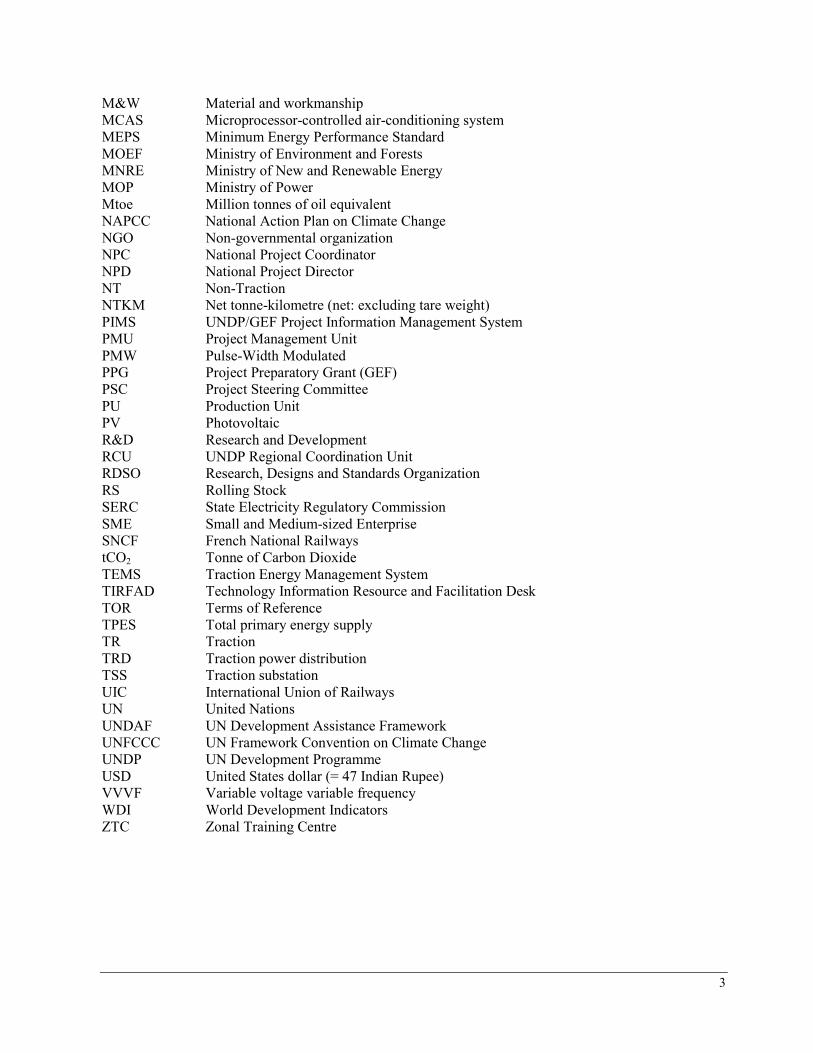
ACRONYMS AND ABBREVIATIONS
ABB ASEA, Brown and Boveri & Cie ASCB Automatic-switched capacitor bank AC/DC Alternating Current (AC) Electricity APR-PIR Annual Project Report - Project Implementation Review BEE Bureau of Energy Efficiency BS Building Services CAGR Compound annual growth rate CDM Clean Development Mechanism CFL Compact Fluorescent Lamp COFMOW Central Organisation for Modernisation of Workshops CO UNDP Country Office CO2 Carbon Dioxide COE Centre of Excellence CP Country Programme CPAP Country Programme Action Plan DEA Department of Economic Affairs DSM Demand-side management E&M Energy and Management EC Energy Conservation EE Energy Efficiency EECP Energy Efficiency and Conservation Programme EMS Energy management system ESCO Energy service company EMU Electric Multiple Unit ESMON Energy-cum-speed monitoring system FY Fiscal Year FYP Five-Year Plan GDP Gross Domestic Product GEF Global Environment Facility GOI Government of India GHG Greenhouse gas GPS Global Positioning System GPSDAS GPS-based Driver Advice System GTKM Gross Tonne-Kilometre (including tare weight) HOG Head-on Generation IEA International Energy Agency IEP Integrated Energy Policy IGBT Insulated-gate bipolar transistor INR Indian Rupee IR Indian Railways IREDA Indian Renewable Energy Development Agency IRIEEN Indian Railways Institute of Electrical Engineering IRS Indian Railways System KMS Knowledge Management and Sharing kWh kilowatt hour LED Light-Emitting Diode LRDSS Long-range decision support system
3
M&W Material and workmanship MCAS Microprocessor-controlled air-conditioning system MEPS Minimum Energy Performance Standard MOEF Ministry of Environment and Forests MNRE Ministry of New and Renewable Energy MOP Ministry of Power Mtoe Million tonnes of oil equivalent NAPCC National Action Plan on Climate Change NGO Non-governmental organization NPC National Project Coordinator NPD National Project Director NT Non-Traction NTKM Net tonne-kilometre (net: excluding tare weight) PIMS UNDP/GEF Project Information Management System PMU Project Management Unit PMW Pulse-Width Modulated PPG Project Preparatory Grant (GEF) PSC Project Steering Committee PU Production Unit PV Photovoltaic R&D Research and Development RCU UNDP Regional Coordination Unit RDSO Research, Designs and Standards Organization RS Rolling Stock SERC State Electricity Regulatory Commission SME Small and Medium-sized Enterprise SNCF French National Railways tCO2 Tonne of Carbon Dioxide TEMS Traction Energy Management System TIRFAD Technology Information Resource and Facilitation Desk TOR Terms of Reference TPES Total primary energy supply TR Traction TRD Traction power distribution TSS Traction substation UIC International Union of Railways UN United Nations UNDAF UN Development Assistance Framework UNFCCC UN Framework Convention on Climate Change UNDP UN Development Programme USD United States dollar (= 47 Indian Rupee) VVVF Variable voltage variable frequency WDI World Development Indicators ZTC Zonal Training Centre

4
TABLE OF CONTENTS
PART A. SITUATION ANALYSIS ....................................................................................................... 5
1. Context and global significance: environmental, policy and instititional setup ............................... 5 2. Stakeholder analysis ......................................................................................................................... 9 3. Baseline, energy efficiency solutions and barrier analysis ............................................................. 12
PART B. PROJECT STRATEGY ....................................................................................................... 17
4. Project rationale, design principles and strategic considerations ................................................... 17 5. Country eligibility, policy conformity and country ownership ...................................................... 22 6. Project objectives, outcomes and outputs....................................................................................... 23 7. Key indicators and assumptions ..................................................................................................... 32 8. GEF incremental reasoning and cost-effectiveness ........................................................................ 35 9. Sustainability and replicability ....................................................................................................... 37 10. Project results framework ............................................................................................................... 39 11. Total budget and work plan ............................................................................................................ 45 12. Management Arrangements ........................................................................................................... 50 13. Monitoring framework and evaluation ......................................................................................... 555 14. Legal context and other agreements ............................................................................................... 59
PART C. ANNEXES ............................................................................................................................. 60
ANNEX A. RISK ANALYSIS ................................................................................................................. 61
ANNEX B. AGREEMENTS .................................................................................................................... 64
ANNEX C. TERMS OF REFERENCE .................................................................................................. 65
ANNEX D. EMISSION REDUCTION CALCULATION .................................................................... 67
ANNEX E. ORGANISATIONAL SETUP OF INDIAN RAILWAYS ................................................ 78
ANNEX F. TRAINING & CAPACITY BUILDING ACTIVITIES .................................................... 81
ANNEX G. PROJECT ANNUAL TARGETS ........................................................................................ 81
5
Part A. SITUATION ANALYSIS
1. CONTEXT AND GLOBAL SIGNIFICANCE: ENVIRONMENTAL, POLICY AND INSTITITIONAL SETUP
1.1 Energy consumption growth in India and climate change
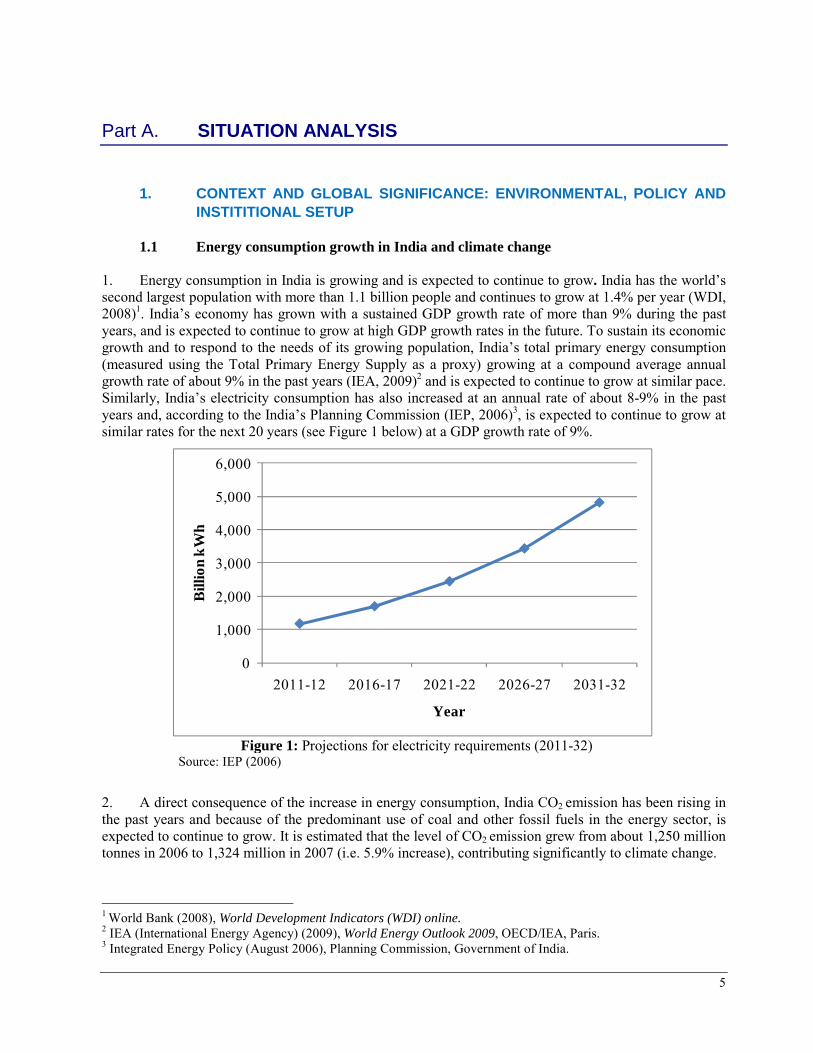
1. Energy consumption in India is growing and is expected to continue to grow. India has the world’s second largest population with more than 1.1 billion people and continues to grow at 1.4% per year (WDI, 2008)1. India’s economy has grown with a sustained GDP growth rate of more than 9% during the past years, and is expected to continue to grow at high GDP growth rates in the future. To sustain its economic growth and to respond to the needs of its growing population, India’s total primary energy consumption (measured using the Total Primary Energy Supply as a proxy) growing at a compound average annual growth rate of about 9% in the past years (IEA, 2009)2 and is expected to continue to grow at similar pace. Similarly, India’s electricity consumption has also increased at an annual rate of about 8-9% in the past years and, according to the India’s Planning Commission (IEP, 2006)3, is expected to continue to grow at similar rates for the next 20 years (see Figure 1 below) at a GDP growth rate of 9%.
0
1,000
2,000
3,000
4,000
5,000
6,000
2011-12 2016-17 2021-22 2026-27 2031-32
Bill
ion
kWh
Year
Figure 1: Projections for electricity requirements (2011-32) Source: IEP (2006)
2. A direct consequence of the increase in energy consumption, India CO2 emission has been rising in the past years and because of the predominant use of coal and other fossil fuels in the energy sector, is expected to continue to grow. It is estimated that the level of CO2 emission grew from about 1,250 million tonnes in 2006 to 1,324 million in 2007 (i.e. 5.9% increase), contributing significantly to climate change.
1 World Bank (2008), World Development Indicators (WDI) online. 2 IEA (International Energy Agency) (2009), World Energy Outlook 2009, OECD/IEA, Paris. 3 Integrated Energy Policy (August 2006), Planning Commission, Government of India.

6
1.2 Government policies, strategies and institutional set-up
3. India’ strategy is to overcome these challenges, as described in the Integrated Energy Policy (IEP) and the National Action Plan on Climate Change (NAPCC), the two major documents outlines the Government strategy with regard to energy and climate change. The Integrated Energy Policy (IEP, 2006) puts emphasis on the need to increase energy security by reducing the import dependence to avoid price fluctuations. It outlines a number of strategic directions to achieve this objective, including increasing local coal production, improving energy efficiency and energy conservation in use and demand side management to reduce electricity demand, shifting freight traffic to railways, and expanding electrification of railways to reduce diesel needs. The National Action Plan on Climate Change (NAPCC, 2008) defines the key strategies and actions to address the causes of climate change and reduce the impact of climate change on India. The NAPCC is organized along eight priority programs, or ‘national missions’, which include the National Solar Mission, the National Mission for Energy Efficiency, the National Mission on Sustainable Habitat, among others. It is worth noticing that both the IEP and the NAPCC put at the centre of their strategies an increased use of energy efficiency and energy conservation measures.
Box 1 India strategies and institutional set-up to promote energy efficiency.
The main targets and strategies with regard to energy efficiency are set in the Five-Year Plans of the Government of India. The Ninth Five-Year Plan (1999-2003) provided the basis for the issuance of the Energy Conservation (EC) Act in 2001 and the establishment of the Bureau of Energy Efficiency as central institution for the implementation of an energy conservation program (see below). The Tenth Five-Year Plan (2003-2007) focused on the need for an efficient use of energy sources to achieve sustainable development, and provided the basis for the establishment of an appropriate institutional set-up for the provision of energy efficiency services, including the authorization of the Ministry of Power (MOP) to develop energy efficiency programs. The Eleventh Five-Year Plan (2007-2012) aims at enhancing rural energy access, and to this purpose it targets savings of 5% of energy consumption levels through the implementation of a set of energy efficiency interventions in all sectors, including the establishment of an appropriate set of incentives; the creation of an enabling institutional framework; the promotion of energy service companies (ESCOs); and the promotion of energy efficient technologies, including energy efficient lighting; mandatory audits of facilities with loads above 1 MW, etc.
The Bureau of Energy Efficiency (BEE) was established under the MOP to implement the EC Act 2001 and is responsible for implementation of energy efficiency and energy conservation measures in the country. The EC Act 2001 further mandates BEE to work with designated consumers and other agencies to enforce the provisions of the Act. Currently, there are no provisions in the budget of the central government to enforce checks and compliance to the EC Act besides limited capacity and experience to implement energy efficiency programmes at large scale.
1.3 Rationale for improving energy efficiency in the Indian Railways (IR)
4. Indian Railway (IR) is the single largest organization with the highest electricity consumption in India. It consumes about 2.4% of India’s total electricity consumption. In the fiscal year (FY) 2007-08, Indian Railways consumed 14.1 billion kilowatt-hours (kWh), of which 11.7 billion (about 83%) for traction usages and 2.4 billion (17%) in non-traction usages (IR Year Book 2007-08).
5. It is estimated that the demand of electricity in this industry will grow in the coming years. First, in compliance with the Integrated Energy Policy, India plans to progressively shift freight traffic to railways. Passenger traffic is also expected to increase. Overall, it is estimated that the railway sector will have a growth in the total traffic (freight and passengers) of 8-9% in the next decade. Second, Indian Railways
7
has initiated an ambitious Electrification Plan to increase the electrification of its routes4 converting diesel-fuelled traffic (which represented 36% and 53% of the freight and passenger traffic respectively in fiscal year 2007-08) into electric traffic, because electric traction is more efficient than diesel traction. According to this Plan, 80% of rail freight and 60% of passenger traffic will run on electric energy by 2031-32. It is estimated that the total demand of electricity in the railways sector will grow at a rate of more than 9% annually. The electricity consumption is projected to be about 100.5 billion kWh by 2031-32 with the electrification dominant scenario. Therefore, an enormous energy saving potential exists in the Indian Railways (IR) sector for implementing energy efficiency measures and energy conservation technologies.
6. In addition, the annual electricity bill of Indian Railways in FY2007-08 was about USD 1.272 billion (of which USD 1.071 billion for traction and about USD 0.201 billion for non-traction5). The operating costs represented 76% of the total costs. In FY 2007-08, energy cost represented about 24% of the ordinary working expenses of Indian Railways (electricity accounts for 14.6% of the total ordinary working expenses). Thus, the possibility of savings on electricity would have a positive effect on the operating margins of Indian Railways.
Box 2 Indian Railways
Indian Railways (IR) has a total state monopoly on India’s rail transport. It is one of the largest and busiest rail networks in the world. It has a vast rail network, covering 6,909 stations over a total route length of more than 63,327 km, transporting more than 18 million passengers daily (6.52 billion passengers annually) and more than 2.2 million tonnes of freight daily. IR is the world's largest utility employer with more than 1.4 million employees. IR is managed through 16 Zones which are subdivided into 68 Divisions. There are six production units engaged in manufacturing rolling stock, wheels and axles and other ancillary components to meet IR requirements. In addition, a number of specialized units like the Research, Design and Standards Organisation (RDSO), training institutes and corporations have been set up that provide special services. IR is managed by the Railway Board6 under the Ministry of Railways (an organizational chart of IR is reported in Annex E).
1.4 Assistance by UNDP in the area of environment and energy
7. The United Nations Development Assistance Framework (UNDAF) provides the overall framework and sets the objectives of the assistance of the United Nations to the Government of India for the period 2008-2012. The overarching objective of the UNDAF is “promoting social, economic and political inclusion for the most disadvantaged, especially women and girls”. These objectives are in line with the national priorities of the Government of India’s Eleventh Five Year Plan. Specifically on environmental sustainability, UNDAF states that “by 2012 the most vulnerable people, including women and girls and government at all levels have enhanced abilities to prepare, respond, and adapt/recover from sudden and slow onset disasters and environmental challenges” (Outcome 4).
8. UNDP is a key partner in the development and implementation of the UNDAF. UNDP is also the lead UN agency for the coordination of UN support in several thematic areas, including sustainable environmental management. Specifically in this area, UNDP supports government’s efforts towards meeting commitments under multilateral agreements through a two-pronged approach involving leveraging of additional environmental finance and supporting activities on the ground that seek to safeguard environmental resources. A special focus of UNDP support is placed on energy efficiency as a means to contribute to reduction of greenhouse gas emissions in energy intensive industries, transport and commercial sectors.
4 Currently only 30% of the total route kilometres are electrified. 5 Non-traction purposes include workshops, stations, service buildings, colonies, street lighting, water pumping
installations, and residential buildings. 6 Shared by a Chairman and with 6 Members (Electrical, Engineering, Traffic, Staff, Mechanical and Finance).
8
9. The Government of India, through its designated nodal department, the Department of Economic Affairs (DEA), ensures national ownership and provides direction of UNDP programme activities by approving and signing the Country Programme Action Plans (CPAP), the document that provides the overall cooperation framework for UNDP in India. The CPAP 2008-2012 emphasizes the need to ensure that growth is resource efficient and environmentally sustainable in sectors such as industry, infrastructure and agriculture, in line with the Government’s Eleventh Five-Year Plan, and acknowledges that the multilateral environmental agreements to which India is a signatory - climate change, biodiversity, desertification, chemical management and ozone depleting substances - offer an enormous opportunity to address global environmental concerns through action at national and local levels. Particularly, the CPAP states that, within the framework of the UNFCCC, the Government of India and UNDP would work together to identify collaborative areas to address climate change.
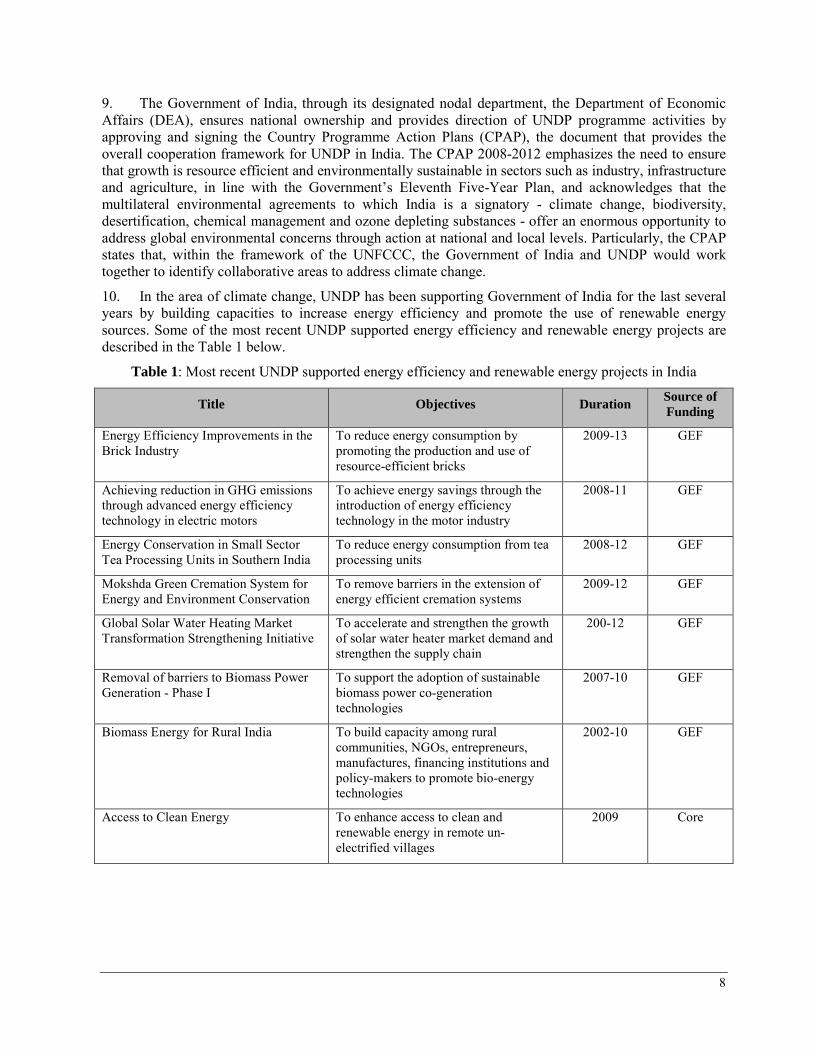
10. In the area of climate change, UNDP has been supporting Government of India for the last several years by building capacities to increase energy efficiency and promote the use of renewable energy sources. Some of the most recent UNDP supported energy efficiency and renewable energy projects are described in the Table 1 below.
Table 1: Most recent UNDP supported energy efficiency and renewable energy projects in India
Title Objectives Duration Source of Funding
Energy Efficiency Improvements in the Brick Industry
To reduce energy consumption by promoting the production and use of resource-efficient bricks
2009-13 GEF
Achieving reduction in GHG emissions through advanced energy efficiency technology in electric motors
To achieve energy savings through the introduction of energy efficiency technology in the motor industry
2008-11 GEF
Energy Conservation in Small Sector Tea Processing Units in Southern India
To reduce energy consumption from tea processing units
2008-12 GEF
Mokshda Green Cremation System for Energy and Environment Conservation
To remove barriers in the extension of energy efficient cremation systems
2009-12 GEF
Global Solar Water Heating Market Transformation Strengthening Initiative
To accelerate and strengthen the growth of solar water heater market demand and strengthen the supply chain
200-12 GEF
Removal of barriers to Biomass Power Generation - Phase I
To support the adoption of sustainable biomass power co-generation technologies
2007-10 GEF
Biomass Energy for Rural India To build capacity among rural communities, NGOs, entrepreneurs, manufactures, financing institutions and policy-makers to promote bio-energy technologies
2002-10 GEF
Access to Clean Energy To enhance access to clean and renewable energy in remote un-electrified villages
2009 Core

9
2. STAKEHOLDER ANALYSIS
11. The Project stake-holders identified, brief description and their role in the GEF project is given below:
Table 2: List of stakeholders involved in project
Stakeholder Main role
Government entities
Planning Commission, Government of India
The Planning Commission was set up by a resolution of the Government of India in March 1950 in pursuance of declared objectives of the Government to promote a rapid rise in the standard of living of the people by efficient exploitation of the resources of the country, increasing production and offering opportunities to all for employment in the service of the community. The Planning Commission has the responsibility of making assessment of all resources of the country, augmenting deficient resources, formulating plans for the most effective and balanced utilization of resources and determining priorities. Five Year Plans are formulated by Planning Commission.
Inclusion of appropriate outcome of the project in the policy formulation such as Five Year Plans, etc. may be best affected through the Planning Commission. Therefore Planning Commission is an invited member to the Project Steering Committee (PSC) during the project implementation and their role will be like the other members of the PSC under the project.
Ministry of Environment and Forestry (MOEF)
MOEF is the nodal agency in the administrative structure of the Central Govt. for the planning, promotion, co-ordination and overseeing the implementation of India's environmental and forestry policies and programmes. MOEF is also GEF focal point for GEF projects in India and thus liaise for overall coordination of the project.
Bureau of Energy Efficiency (BEE), MoP
BEE is a statutory body under Ministry of Power, Government of India. It was set up in set up in 2002, it is responsible for implementation of the Energy Conservation Act 2001 with the primary objective of promoting energy saving measures and in turn reducing energy intensity. BEE co-ordinates with designated consumers7, designated agencies and other organizations and recognize, identify and utilize the existing resources and infrastructure, in performing the functions assigned to it under the Energy Conservation Act. The Energy Conservation Act provides for regulatory and promotional functions.
BEE is the coordinator of umbrella programme on “Programmatic Framework Project for EE” under which the Improving EE in Indian Railways System is one of the projects. BEE is one of the PSC members during the project implementation (see Section 4.5). BEE will play a key role in risk mitigation, particularly in mitigating the risks to project implementation due to lack of manufacturers’ interest in investing in EE products (see Annex A). BEE will also play a key facilitation role among partners.
Ministry of Power (MOP)
MOP is responsible for perspective planning, policy formulation, processing of projects for investment decision, monitoring of the implementation of power projects, the administration and enactment of legislation in regard to thermal, hydro power generation, transmission and distribution, rural electrification and energy efficiency and conservation. MoP will ultimately serve as central authority and guide BEE in meeting program objectives and in implementation of programmes listed in EC Act 2001.
MoP will be informed on the project progress during the implementation so that the EE
7 The Central Government identified nine energy intensive industries in 2007 as designated consumers under the Energy Conservation Act 2001: (1) Thermal Power Stations, (2) Fertilizer producers, (3) Cement producers, (4) Iron and Steel producers, (5) Chlor-Alkali, (6) Aluminum, (7) Railways, (8) Textile, and (9) Pulp and Paper.

10
Stakeholder Main role
efforts in Indian Railways are noted in their plans.
Ministry of Railways The Ministry of Railways in India is in charge of the Indian Railways, the state-owned company that enjoys a monopoly in Rail transport in India.
Indian Railways (IR)
Indian Railways (IR) Indian Railways is the state-owned railway company of India, which owns and operates most of the country's rail transport. It is overseen by the Ministry of Railways of the Government of India. It is governed by the Railway Board, which is headed by Chairman Railway Board.
IR has been appointed as the project implementing agency of this project. IR would be responsible for implementing the project, achieving the results outlined in the proposal. IR would be in addition responsible to liaise with UNDP, BEE, MoEF, DEA and other agencies as required to achieve the expected outcome of the project. IR would be finally responsible to implement the policy formulation activity under the project and also work on the advocacy and lobbying efforts that would ultimately secure the approval and enforcement of the formulated policies and associated implementing rules and regulations.
IR Board and Directorates
The Indian Railway Board is the apex body of the Indian Railways. It reports to the Indian Ministry of Railways. It has the following members currently; Chairman Railway Board: Member Electrical, Member Staff, Member Mechanical, Member Traffic, and Finance Commissioner. Important Directorates as related to EE are: Long-Range Decision Support Systems (LRDSS), Electrical Engineering, Planning, Tracks, Mechanical Engineering (Production Units) and Workshops.
These directorates of Railway Board would provide logistical and technical support for the implementation of the project.
Zonal Railways Indian Railways is divided into zones, which are further sub-divided into divisions. The number of zones in Indian Railways increased from six to eight in 1951, nine in 1952, and finally 16 in 2003. Each zonal railway is made up of a certain number of divisions, each having a divisional headquarters. There are a total of sixty-eight divisions. These 16 Zonal Railways manages Indian Railway operations within zone boundaries. Each Zone has zonal training centres (ZTCs) to impart training to the staff and a workshop where to repair and maintain their assets and rolling stock.
Under this project, such zonal field units will function as implementer as well as develop training capacity and skills.
Indian Railway Production Units
Indian Railway production units take care of production of parts and are integral part of proper functioning of railway system in India. They are categorized (located in) as; locomotives (Chittaranjan, Patiala, Varanasi); coaching stock (Kapurtala and Chennai); axles and wheels (Bengaluru).
Under this project, these units will function as project implementing partners.
RDSO (Research, Designs and Standards Organisation)
RDSO is the organization of Indian Railways (IR) responsible for research and design. It serves as the technical advisor to the Railway Board, Zonal Railways and Production Units. It is responsible for the development of new and improved designs, adoption, absorption of new technologies, development of standards and specifications for materials and equipment, technical investigation, statutory clearances, testing and providing consultancy services. IR procurement is based on the specifications that are released by RDSO.
Under this project, RDSO would assist in framing/updating the technical requirements and specifications of the equipment.
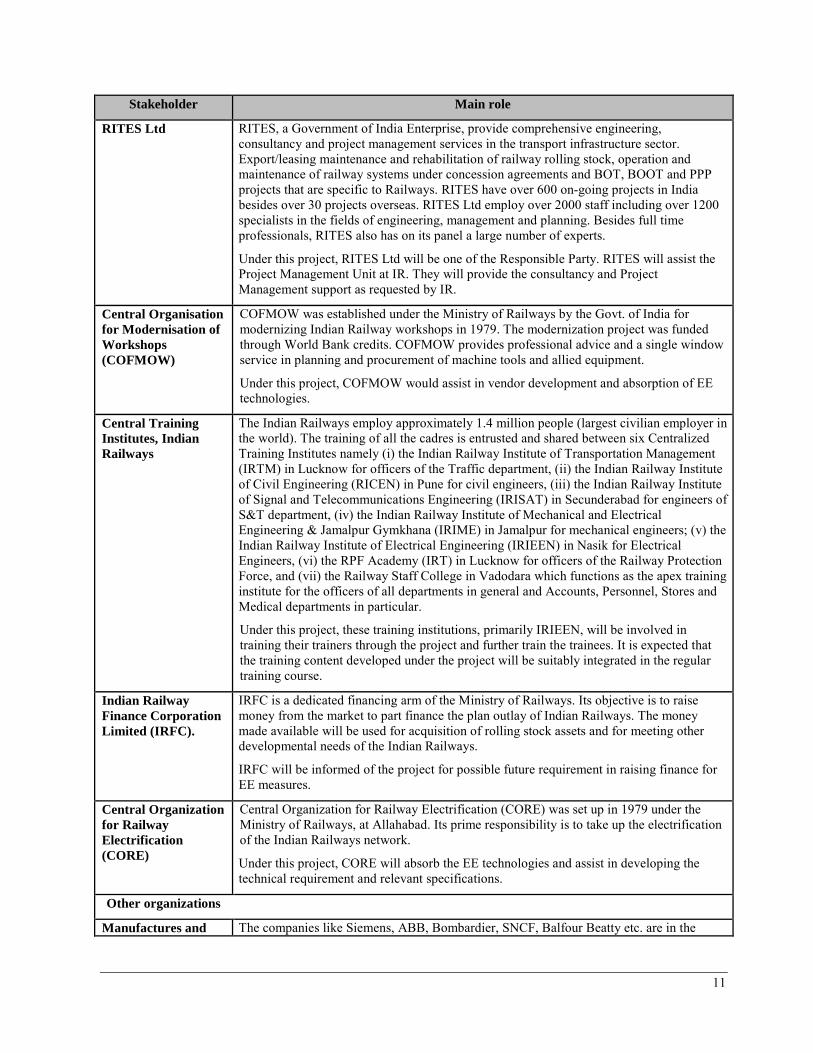
11
Stakeholder Main role
RITES Ltd RITES, a Government of India Enterprise, provide comprehensive engineering, consultancy and project management services in the transport infrastructure sector. Export/leasing maintenance and rehabilitation of railway rolling stock, operation and maintenance of railway systems under concession agreements and BOT, BOOT and PPP projects that are specific to Railways. RITES have over 600 on-going projects in India besides over 30 projects overseas. RITES Ltd employ over 2000 staff including over 1200 specialists in the fields of engineering, management and planning. Besides full time professionals, RITES also has on its panel a large number of experts.
Under this project, RITES Ltd will be one of the Responsible Party. RITES will assist the Project Management Unit at IR. They will provide the consultancy and Project Management support as requested by IR.
Central Organisation for Modernisation of Workshops (COFMOW)
COFMOW was established under the Ministry of Railways by the Govt. of India for modernizing Indian Railway workshops in 1979. The modernization project was funded through World Bank credits. COFMOW provides professional advice and a single window service in planning and procurement of machine tools and allied equipment.
Under this project, COFMOW would assist in vendor development and absorption of EE technologies.
Central Training Institutes, Indian Railways
The Indian Railways employ approximately 1.4 million people (largest civilian employer in the world). The training of all the cadres is entrusted and shared between six Centralized Training Institutes namely (i) the Indian Railway Institute of Transportation Management (IRTM) in Lucknow for officers of the Traffic department, (ii) the Indian Railway Institute of Civil Engineering (RICEN) in Pune for civil engineers, (iii) the Indian Railway Institute of Signal and Telecommunications Engineering (IRISAT) in Secunderabad for engineers of S&T department, (iv) the Indian Railway Institute of Mechanical and Electrical Engineering & Jamalpur Gymkhana (IRIME) in Jamalpur for mechanical engineers; (v) the Indian Railway Institute of Electrical Engineering (IRIEEN) in Nasik for Electrical Engineers, (vi) the RPF Academy (IRT) in Lucknow for officers of the Railway Protection Force, and (vii) the Railway Staff College in Vadodara which functions as the apex training institute for the officers of all departments in general and Accounts, Personnel, Stores and Medical departments in particular.
Under this project, these training institutions, primarily IRIEEN, will be involved in training their trainers through the project and further train the trainees. It is expected that the training content developed under the project will be suitably integrated in the regular training course.
Indian Railway Finance Corporation Limited (IRFC).
IRFC is a dedicated financing arm of the Ministry of Railways. Its objective is to raise money from the market to part finance the plan outlay of Indian Railways. The money made available will be used for acquisition of rolling stock assets and for meeting other developmental needs of the Indian Railways.
IRFC will be informed of the project for possible future requirement in raising finance for EE measures.
Central Organization for Railway Electrification (CORE)
Central Organization for Railway Electrification (CORE) was set up in 1979 under the Ministry of Railways, at Allahabad. Its prime responsibility is to take up the electrification of the Indian Railways network.
Under this project, CORE will absorb the EE technologies and assist in developing the technical requirement and relevant specifications.
Other organizations
Manufactures and The companies like Siemens, ABB, Bombardier, SNCF, Balfour Beatty etc. are in the

12
Stakeholder Main role
their associations business of manufacturing and supply equipments including energy appliances to IR.
Under this project these companies are expected to produce and supply the energy efficient devices decided for intervention. They will also develop indigenous EE products developed through piloting them under the project.
International agencies: UIC, SNCF, etc.
Leading Centres of Excellence in industrialized countries, international agencies like International Union of Railways (UIC) or at country level (e.g., SNCF/ France) provide assistance on energy efficiency.
Under this project, interaction with these centres will be held to obtain the know-how on EE technologies for railway systems and identify suitable options for India.
3. BASELINE, ENERGY EFFICIENCY SOLUTIONS AND BARRIER ANALYSIS
3.1 Baseline
12. Indian Railways (IR) is developing a long-term Energy Efficiency and Conservation Program (EECP) (2010-2032). The Program aims at progressively introducing a number of energy efficiency technologies and measures in the railways system (more details in par. 3.2). The objective of this Program is to save 10% of the electricity consumption in absolute terms by 2032, in line with the targets of national initiatives on energy conservation and climate change8.
13. These figures represent the baseline of the project, against which the GEF alternative will be compared (see Section 8).
2009-10 2012-13 2022-23 2031-32 Cumulative
2010/11-2022/23
Cumulative 2010/11-2031/32
Baseline scenario (i.e. with EECP)
Electricity consumption (billion kWh) 15.65 19.90 45.77 100.51 377.75 1,030.20
CO2 Production (million tonnes) 12.83 16.32 37.53 82.41 309.75 844.77
Assumptions:
- Total energy consumption growing at 8.82% CGAR/year due to increased traffic and progressing electrification routes
- Forecast of electricity consumption growth for traction operation and general services on base of 2007-08 at 4.5% CAGR per year
- Energy saving rate: 0.5% per year according to Internal Policy on Energy Saving i.e. EECP (i.e. 10% cumulatively by 2031-32)
8 Key strategic elements of the Program included the following: (1) the development of a long-term vision,
internal policies, directives, regulations, procedures and manuals on energy efficiency; (2) the establishment of an autonomous Center of Excellence within IR responsible for assessing and identifying specific EE technologies and measures, standards, performance criteria, material standards and specifications, etc., and promoting and monitoring the implementation of EE measures; (3) the preparation of annual plans for energy efficiency with specific targets and allocated budget; (4) the development and institutionalization of a monitoring and verification and audit system; (5) the development and institutionalization of an internal incentive system to promote and reward energy efficiency behaviors; (6) the institutionalization of energy efficiency and conservation awareness programs within the organization.
13
14. More specifically, due to the implementation of EECP, India is expected to move from the current9 15.7 billion kWh of electricity consumption in the railways sector to 100.5 billion kWh in 2031-32 (about 1,030 billion kWh cumulatively for the period 2010-2032). These figures are equivalent to about 12.8, 82.4 and 844 million tonnes of CO2 respectively, assuming a 0.82 kg CO2/kWh emission factor10.
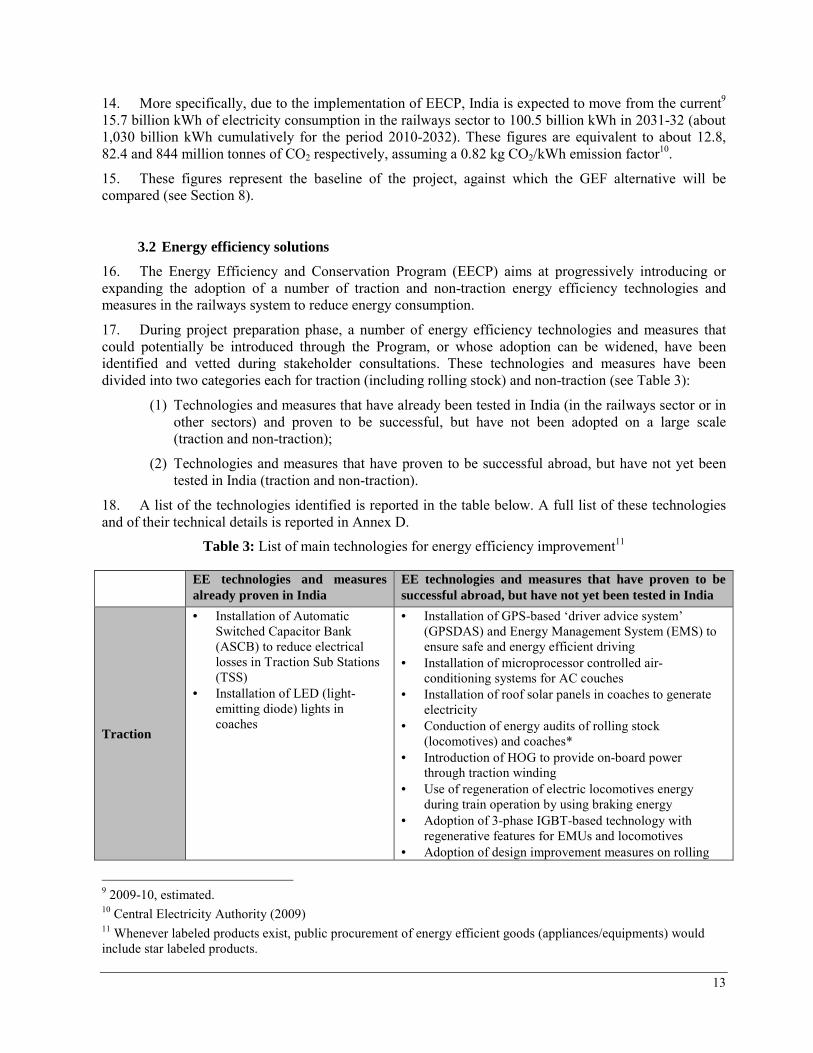
15. These figures represent the baseline of the project, against which the GEF alternative will be compared (see Section 8).
3.2 Energy efficiency solutions
16. The Energy Efficiency and Conservation Program (EECP) aims at progressively introducing or expanding the adoption of a number of traction and non-traction energy efficiency technologies and measures in the railways system to reduce energy consumption.
17. During project preparation phase, a number of energy efficiency technologies and measures that could potentially be introduced through the Program, or whose adoption can be widened, have been identified and vetted during stakeholder consultations. These technologies and measures have been divided into two categories each for traction (including rolling stock) and non-traction (see Table 3):
(1) Technologies and measures that have already been tested in India (in the railways sector or in other sectors) and proven to be successful, but have not been adopted on a large scale (traction and non-traction);
(2) Technologies and measures that have proven to be successful abroad, but have not yet been tested in India (traction and non-traction).
18. A list of the technologies identified is reported in the table below. A full list of these technologies and of their technical details is reported in Annex D.
Table 3: List of main technologies for energy efficiency improvement11
EE technologies and measures already proven in India
EE technologies and measures that have proven to be successful abroad, but have not yet been tested in India
Traction
• Installation of Automatic Switched Capacitor Bank (ASCB) to reduce electrical losses in Traction Sub Stations (TSS)
• Installation of LED (light-emitting diode) lights in coaches
• Installation of GPS-based ‘driver advice system’ (GPSDAS) and Energy Management System (EMS) to ensure safe and energy efficient driving
• Installation of microprocessor controlled air-conditioning systems for AC couches
• Installation of roof solar panels in coaches to generate electricity
• Conduction of energy audits of rolling stock (locomotives) and coaches*
• Introduction of HOG to provide on-board power through traction winding
• Use of regeneration of electric locomotives energy during train operation by using braking energy
• Adoption of 3-phase IGBT-based technology with regenerative features for EMUs and locomotives
• Adoption of design improvement measures on rolling
9 2009-10, estimated. 10 Central Electricity Authority (2009) 11 Whenever labeled products exist, public procurement of energy efficient goods (appliances/equipments) would include star labeled products.
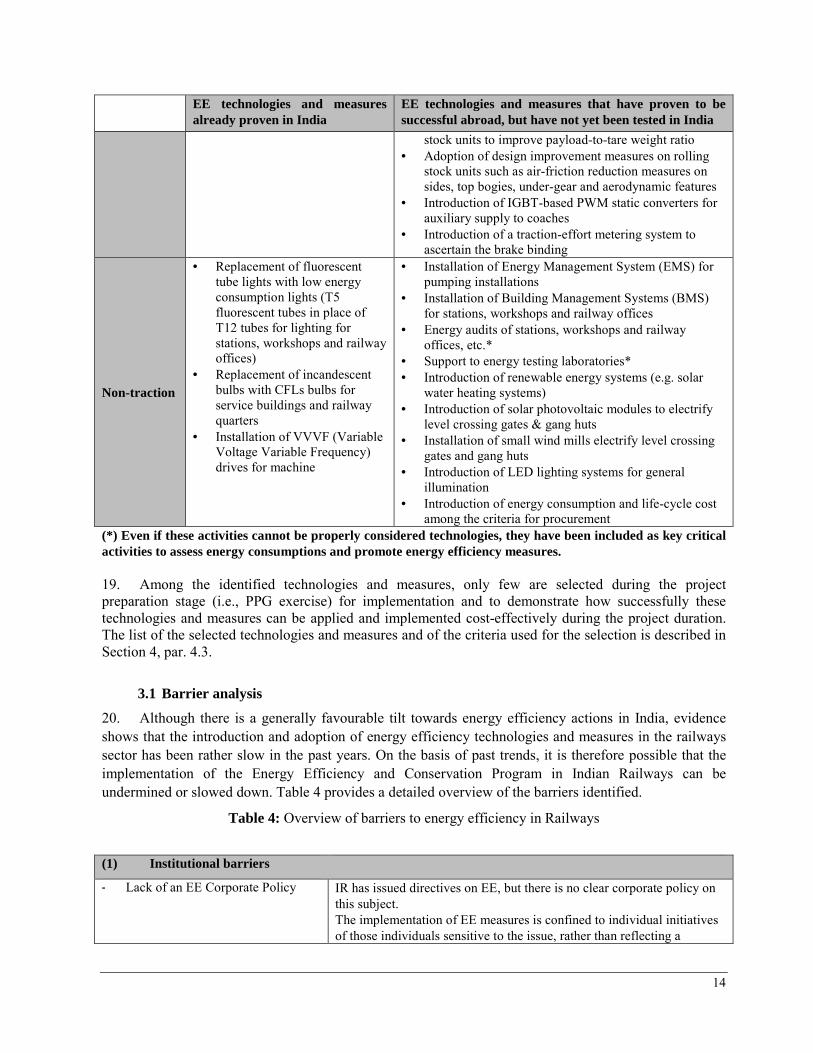
14
EE technologies and measures already proven in India
EE technologies and measures that have proven to be successful abroad, but have not yet been tested in India
stock units to improve payload-to-tare weight ratio • Adoption of design improvement measures on rolling
stock units such as air-friction reduction measures on sides, top bogies, under-gear and aerodynamic features
• Introduction of IGBT-based PWM static converters for auxiliary supply to coaches
• Introduction of a traction-effort metering system to ascertain the brake binding
Non-traction
• Replacement of fluorescent tube lights with low energy consumption lights (T5 fluorescent tubes in place of T12 tubes for lighting for stations, workshops and railway offices)
• Replacement of incandescent bulbs with CFLs bulbs for service buildings and railway quarters
• Installation of VVVF (Variable Voltage Variable Frequency) drives for machine
• Installation of Energy Management System (EMS) for pumping installations
• Installation of Building Management Systems (BMS) for stations, workshops and railway offices
• Energy audits of stations, workshops and railway offices, etc.*
• Support to energy testing laboratories* • Introduction of renewable energy systems (e.g. solar
water heating systems) • Introduction of solar photovoltaic modules to electrify
level crossing gates & gang huts • Installation of small wind mills electrify level crossing
gates and gang huts • Introduction of LED lighting systems for general
illumination • Introduction of energy consumption and life-cycle cost
among the criteria for procurement (*) Even if these activities cannot be properly considered technologies, they have been included as key critical activities to assess energy consumptions and promote energy efficiency measures. 19. Among the identified technologies and measures, only few are selected during the project preparation stage (i.e., PPG exercise) for implementation and to demonstrate how successfully these technologies and measures can be applied and implemented cost-effectively during the project duration. The list of the selected technologies and measures and of the criteria used for the selection is described in Section 4, par. 4.3.
3.1 Barrier analysis
20. Although there is a generally favourable tilt towards energy efficiency actions in India, evidence shows that the introduction and adoption of energy efficiency technologies and measures in the railways sector has been rather slow in the past years. On the basis of past trends, it is therefore possible that the implementation of the Energy Efficiency and Conservation Program in Indian Railways can be undermined or slowed down. Table 4 provides a detailed overview of the barriers identified.
Table 4: Overview of barriers to energy efficiency in Railways
(1) Institutional barriers
- Lack of an EE Corporate Policy IR has issued directives on EE, but there is no clear corporate policy on this subject. The implementation of EE measures is confined to individual initiatives of those individuals sensitive to the issue, rather than reflecting a
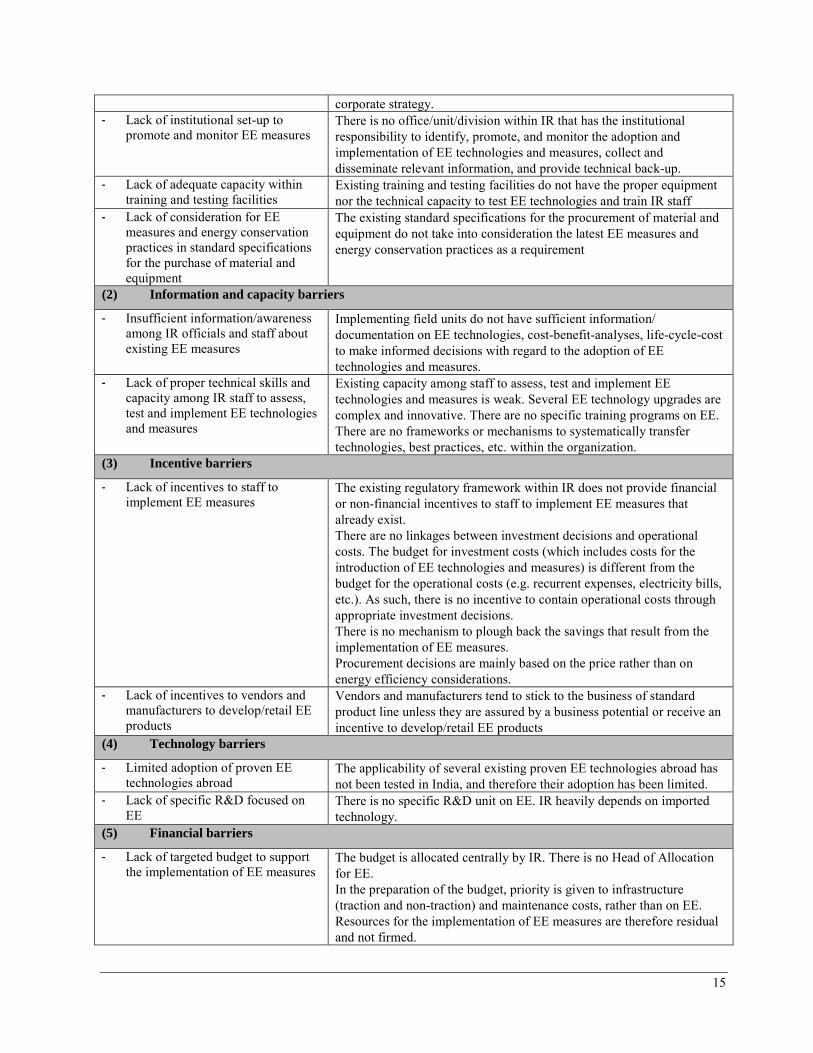
15
corporate strategy. - Lack of institutional set-up to
promote and monitor EE measures There is no office/unit/division within IR that has the institutional responsibility to identify, promote, and monitor the adoption and implementation of EE technologies and measures, collect and disseminate relevant information, and provide technical back-up.
- Lack of adequate capacity within training and testing facilities
Existing training and testing facilities do not have the proper equipment nor the technical capacity to test EE technologies and train IR staff
- Lack of consideration for EE measures and energy conservation practices in standard specifications for the purchase of material and equipment
The existing standard specifications for the procurement of material and equipment do not take into consideration the latest EE measures and energy conservation practices as a requirement
(2) Information and capacity barriers
- Insufficient information/awareness among IR officials and staff about existing EE measures
Implementing field units do not have sufficient information/ documentation on EE technologies, cost-benefit-analyses, life-cycle-cost to make informed decisions with regard to the adoption of EE technologies and measures.
- Lack of proper technical skills and capacity among IR staff to assess, test and implement EE technologies and measures
Existing capacity among staff to assess, test and implement EE technologies and measures is weak. Several EE technology upgrades are complex and innovative. There are no specific training programs on EE. There are no frameworks or mechanisms to systematically transfer technologies, best practices, etc. within the organization.
(3) Incentive barriers
- Lack of incentives to staff to implement EE measures
The existing regulatory framework within IR does not provide financial or non-financial incentives to staff to implement EE measures that already exist. There are no linkages between investment decisions and operational costs. The budget for investment costs (which includes costs for the introduction of EE technologies and measures) is different from the budget for the operational costs (e.g. recurrent expenses, electricity bills, etc.). As such, there is no incentive to contain operational costs through appropriate investment decisions. There is no mechanism to plough back the savings that result from the implementation of EE measures. Procurement decisions are mainly based on the price rather than on energy efficiency considerations.
- Lack of incentives to vendors and manufacturers to develop/retail EE products
Vendors and manufacturers tend to stick to the business of standard product line unless they are assured by a business potential or receive an incentive to develop/retail EE products
(4) Technology barriers
- Limited adoption of proven EE technologies abroad
The applicability of several existing proven EE technologies abroad has not been tested in India, and therefore their adoption has been limited.
- Lack of specific R&D focused on EE
There is no specific R&D unit on EE. IR heavily depends on imported technology.
(5) Financial barriers
- Lack of targeted budget to support the implementation of EE measures
The budget is allocated centrally by IR. There is no Head of Allocation for EE. In the preparation of the budget, priority is given to infrastructure (traction and non-traction) and maintenance costs, rather than on EE. Resources for the implementation of EE measures are therefore residual and not firmed.
16
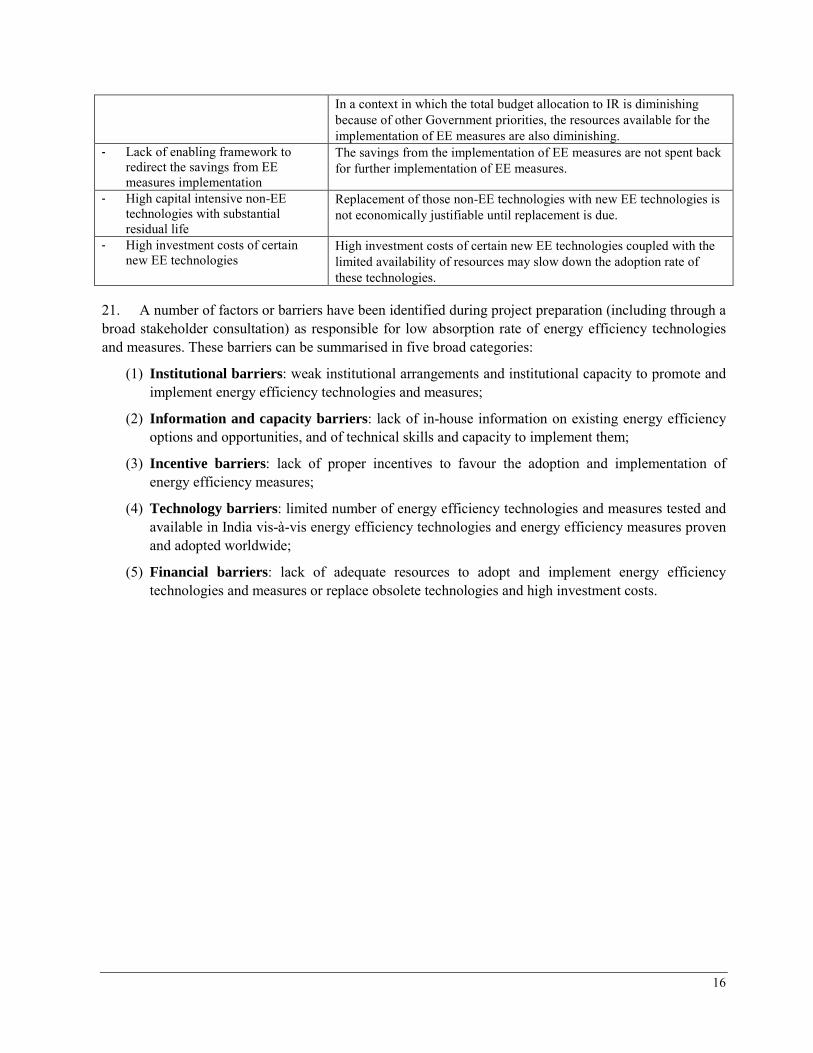
21. A number of factors or barriers have been identified during project preparation (including through a broad stakeholder consultation) as responsible for low absorption rate of energy efficiency technologies and measures. These barriers can be summarised in five broad categories:
(1) Institutional barriers : weak institutional arrangements and institutional capacity to promote and implement energy efficiency technologies and measures;
(2) Information and capacity barriers: lack of in-house information on existing energy efficiency options and opportunities, and of technical skills and capacity to implement them;
(3) Incentive barriers: lack of proper incentives to favour the adoption and implementation of energy efficiency measures;
(4) Technology barriers: limited number of energy efficiency technologies and measures tested and available in India vis-à-vis energy efficiency technologies and energy efficiency measures proven and adopted worldwide;
(5) Financial barriers: lack of adequate resources to adopt and implement energy efficiency technologies and measures or replace obsolete technologies and high investment costs.
In a context in which the total budget allocation to IR is diminishing because of other Government priorities, the resources available for the implementation of EE measures are also diminishing.
- Lack of enabling framework to redirect the savings from EE measures implementation
The savings from the implementation of EE measures are not spent back for further implementation of EE measures.
- High capital intensive non-EE technologies with substantial residual life
Replacement of those non-EE technologies with new EE technologies is not economically justifiable until replacement is due.
- High investment costs of certain new EE technologies
High investment costs of certain new EE technologies coupled with the limited availability of resources may slow down the adoption rate of these technologies.
17
Part B. PROJECT STRATEGY
4. PROJECT RATIONALE, DESIGN PRINCIPLES AND STRATEGIC CONSIDERATIONS
4.1 Project rationale and design principles
22. Indian Railways (IR) is intended to develop a long-term Energy Efficiency and Conservation Program (EECP) which aims at saving around 10% of the total energy consumption by 2032 by progressively introducing energy saving technologies and measures in both the traction and non-traction systems. However, the achievement of the Program objective may be undermined or slowed-down by the barriers described in Section 3.
23. The proposed GEF-supported project aims at supporting the implementation of the Indian Railways’ Energy Efficiency and Conservation Program (EECP) by removing some of the key barriers identified above. More specifically, the proposed project plans to:
(1) Address ‘institutional’ and ‘capacity’ barriers by supporting institutional capacity development and technical training.
(2) Facilitate the adoption on a large scale of already proven energy efficiency technologies and measures by facilitating the dissemination of relevant information on existing technologies and measures, and implementing an appropriate incentive system.
(3) Address ‘technology’ barriers by piloting and testing energy efficiency technologies and measures (i.e. technologies and measures that have proven to be successful abroad), but have not yet been tested in India, to check their applicability in India.
(4) Facilitate the acquisition and dissemination of knowledge and lessons learnt.
24. The project will not address financial barriers.
25. Table 5 summarizes how the barriers identified in Section 3 will be specifically addressed through the project is reported below.
4.2 Strategic considerations: ‘training of trainers’ to address capacity gaps, and the role
of TIRFAD in addressing information and awareness gaps
26. One of the key elements of the proposed project will be the capacity building component. The project will support a broad technical assistance program aiming at (i) raising awareness and building confidence among Indian Railways staff on energy efficiency measures, international benchmarks and best practices, and (ii) strengthening the capacity of IR staff, testing and training facilities/institutes, and vendors and manufactures in implementing energy efficiency technologies and measures. The capacity building component will include practical demonstrations in workshops, field technical visits, and trainings in the three major disciplines (rolling stock, traction power distribution, and building and general electrical services)12. It is estimated that about 2,000 staff (managers, supervisors and technical staff13) will benefit from the capacity building activities supported by the project.
12 An example of the proposed training modules is reported in Annex F.

18
Table 5: Overview of barriers and options supported by the project
13 Even if the number of the people that are proposed to be trained may appear significant, in fact it represents
only a small percentage of the entire 1.4 million staff of Indian Railways. A detailed list of the proposed participants is reported in Annex F.
Barrier Measures supported by the project to address the identified barriers
(1) Institutional barriers
- Lack of an EE Corporate Policy The project will support the creation of a Centre of Excellence (COE) within IR which will be responsible for (i) promoting and coordinating EE activities within IR; (ii) providing technical support and advice on EE technologies and measures, including trainings; and (iii) collecting and disseminating information on EE technologies and measures (Output 1.2).
- Lack of institutional set-up to promote and monitor EE measures
- Lack of adequate capacity within training and testing facilities
The project will support existing training institutes in upgrading/strengthening their capacity for delivering trainings and conducting tests on EE (Output 1.3).
- Lack of consideration for EE measures and energy conservation practices in standard specifications for the purchase of material and equipment
The project will support the creation of a Centre of Excellence (COE) which will be responsible, among other tasks, to collect and disseminate information on EE technologies. One of the tasks of the COE will be the review and development of improved EE specifications for technologies, installation, testing, and operation and maintenance procedures, and of audit manuals/guidelines on EE for specific railway operations (Output 1.2).
Within the COE, a Technology Information Resource and Facilitation Desk (TIRFAD) will be established to disseminate information on EE technologies and measures to equipment vendors (Output 1.2).
(2) Information and capacity barriers
- Insufficient information/awareness among IR officials and staff about existing EE measures
The project will support the creation of a Centre of Excellence (COE) which will be responsible, among other tasks, to collect and disseminate information on EE technologies and measures (Output 1.2).
One of the tasks of COE will be to assess the existing EE technologies adopted by different units of the IR, and come-up with a list of priority technologies to be implemented in IR (Output 2.1).
The COE will also develop and implement energy audit procedures for each railway operation to identify energy intensive departments and benchmarks for EE, and produce audit manuals for IR staff to monitor the key parameters of EE (Output 2.2).
Finally, some of the activities that the project will support are the creation of a web-based portal for the dissemination of information of EE technologies and measures, benchmarks, training material and best practices to IR staff (Output 1.2), and the production of publications, leaflets, reports, and newsletters to disseminate the information and lessons learnt through the implementation of the project (Output 4.1).
19
27. The trained staff will become trainers or resource persons on energy efficiency for Indian Railways in their respective Units or Departments. The main idea behind this approach is that these trained staff would contribute to progressively train and awareness raising among the whole Indian Railways staff. It is estimated that about 5,000 local level staff will benefit from training and awareness raising activities on energy efficiency within the three years of the project (see Annex F for details).
28. Part of the capacity building activities (i.e. field technical visits) will be conducted abroad as some of the energy efficiency technologies and measures that are proposed to be implemented in India are currently available only abroad. Therefore it is important that staff have a ‘first-hand’ experience to assess their efficiency and feasibility, and build their confidence.
29. To address the issue of lack of information and awareness on energy efficiency technologies and measures among IR staff and third-parties (e.g. vendors, equipment suppliers, etc.), a critical role will be played by the Technology Information Resource and Facilitation Desk (TIRFAD). TIRFAD will be established through the project to disseminate information on EE technologies and measures to all key stakeholders, both from the public (i.e. Indian Railways) and private sector (i.e. small and medium enterprises, vendors, etc.). TIRFAD will make available and easily accessible a wide range of knowledge
- Lack of proper technical skills and capacity among IR staff to assess, test and implement EE technologies and measures
The project will support existing training institutes in developing and delivering trainings on EE technologies and best practices (Output 1.3).
The project will in addition support the implementation of already proven EE technologies and measures to build confidence and capacity among IR staff to adopt and implement EE technologies (Output 2.3).
(3) Incentive barriers
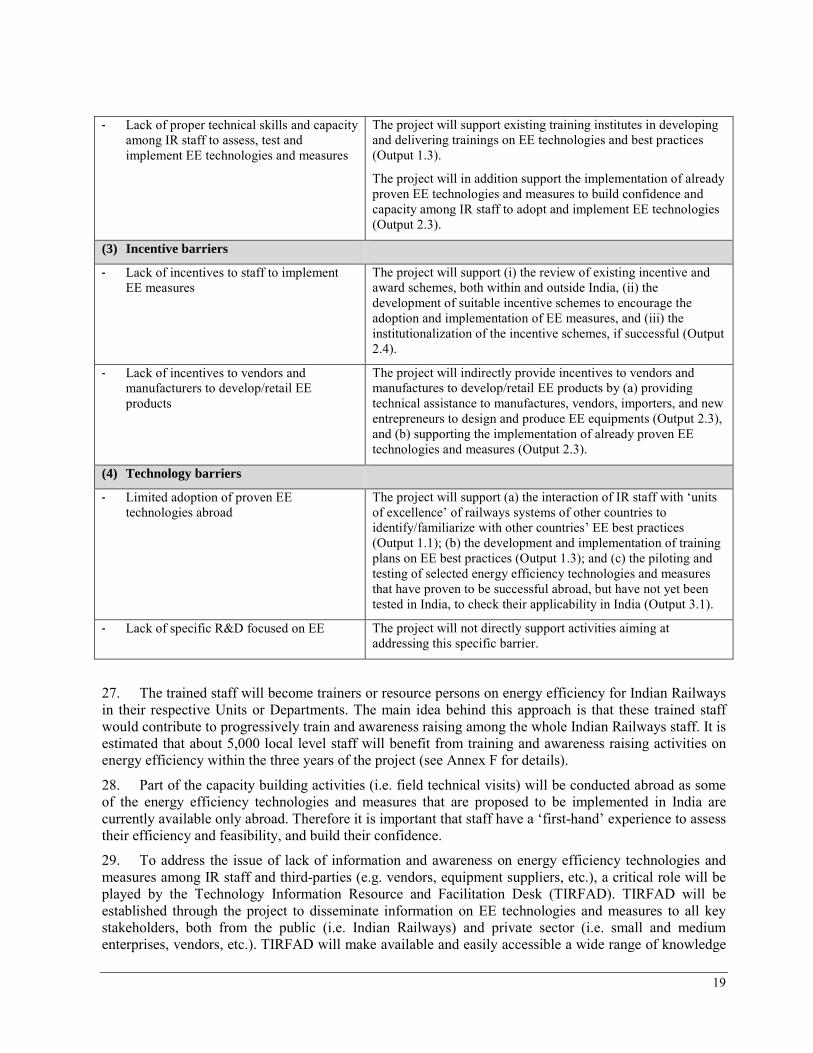
- Lack of incentives to staff to implement EE measures
The project will support (i) the review of existing incentive and award schemes, both within and outside India, (ii) the development of suitable incentive schemes to encourage the adoption and implementation of EE measures, and (iii) the institutionalization of the incentive schemes, if successful (Output 2.4).
- Lack of incentives to vendors and manufacturers to develop/retail EE products
The project will indirectly provide incentives to vendors and manufactures to develop/retail EE products by (a) providing technical assistance to manufactures, vendors, importers, and new entrepreneurs to design and produce EE equipments (Output 2.3), and (b) supporting the implementation of already proven EE technologies and measures (Output 2.3).
(4) Technology barriers
- Limited adoption of proven EE technologies abroad
The project will support (a) the interaction of IR staff with ‘units of excellence’ of railways systems of other countries to identify/familiarize with other countries’ EE best practices (Output 1.1); (b) the development and implementation of training plans on EE best practices (Output 1.3); and (c) the piloting and testing of selected energy efficiency technologies and measures that have proven to be successful abroad, but have not yet been tested in India, to check their applicability in India (Output 3.1).
- Lack of specific R&D focused on EE The project will not directly support activities aiming at addressing this specific barrier.

20
products on EE practices, which include information on their technical, environmental and economic parameters.
Table 6: Selection of technologies and measures for the project
EE technologies and measures already proven in India
EE technologies and measures that have proven to be successful abroad, but have not
yet been tested in India
Traction and Rolling Stock
• Installation of Automatic Switched Capacitor Bank (ASCB) to reduce electrical losses in Traction Sub Stations (TSS)
• Installation of LED (light-emitting diode) lights in coaches
• Installation of GPS-based ‘driver advice system’ (GPSDAS) and Energy Management System (EMS) to ensure safe and energy efficient driving
• Installation of microprocessor controlled air-conditioning systems for AC couches
• Introduction of roof solar panels in coaches to generate electricity
• Conduct energy audits of rolling stock (locomotives) and coaches*
Non-traction
• Replacement of fluorescent tube lights with low energy consumption lights (T5 fluorescent tubes in place of T12 tubes for lighting stations, workshops and railway offices)
• Replacement of incandescent bulbs with CFLs bulbs for service buildings and railway quarters
• Introduction of VVVF (Variable Voltage Variable Frequency) drives for machine
• Installation of Energy Management System (EMS) for pumping installations
• Installation of Building Management Systems (BMS) for stations, workshops and railway offices
• Energy audits of stations, workshops and railway offices, etc.*
• Support to energy testing laboratories*
(*) Even if these activities cannot be properly considered technologies, they have been included as key critical activities to assess energy consumptions and promote energy efficiency measures.
4.3 Strategic considerations: rationale and criteria for selection of energy efficiency technologies and measures to be implemented or tested through the project
30. After stakeholder consultations, a limited number of energy efficiency technologies and measures have been selected to be implemented or tested through the project (see Table 6). The criteria used for selecting these technologies are the following (see Table 7):
(a) For energy efficiency technologies and measures already technically proven in India (although not widespread due to before-mentioned barriers): priority was given to technologies and measures that:
• Have high rate of return • Are easy to implement • Require a single department intervention (vs. multi-department intervention) • Are complementary to existing knowledge within IR • Have already proven to be successful in India • Have high potential for absorption/replicability
(b) For pilot demonstration of energy efficiency technologies and measures (i.e. technologies and measures that have proven to be successful abroad, but that have not yet been tested in India): priority was given to technologies and measures that:
• Have high rate of return
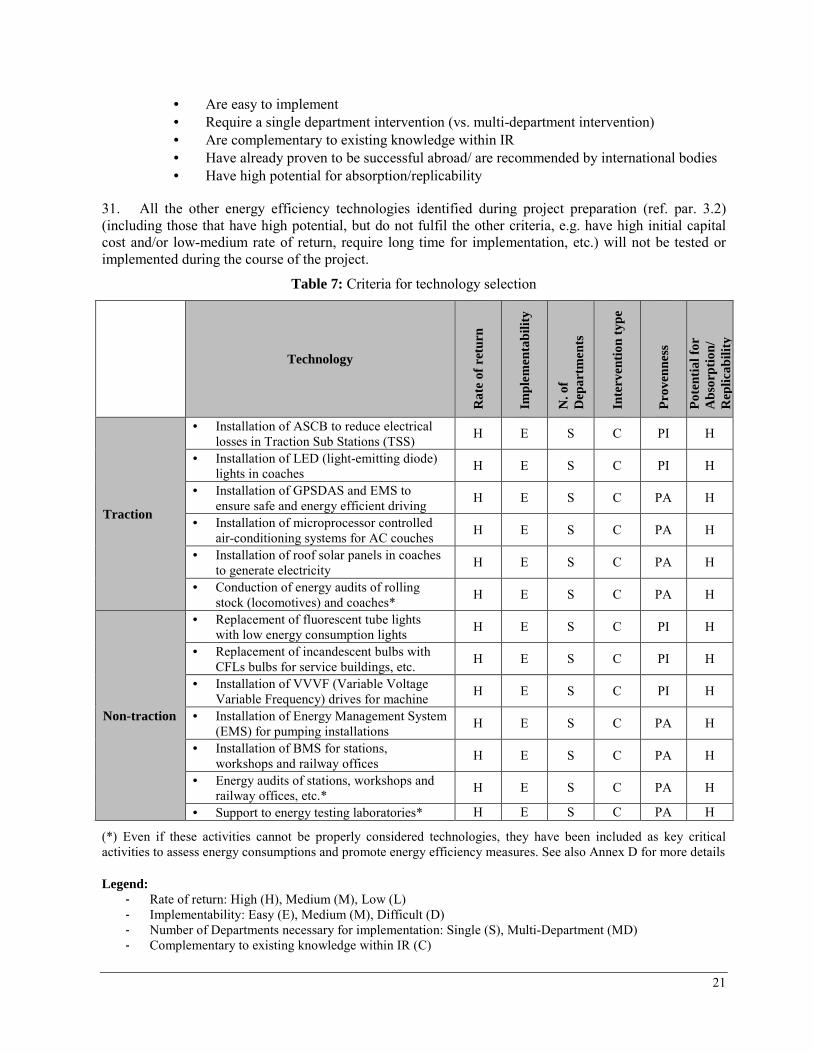
21
• Are easy to implement • Require a single department intervention (vs. multi-department intervention) • Are complementary to existing knowledge within IR • Have already proven to be successful abroad/ are recommended by international bodies • Have high potential for absorption/replicability
31. All the other energy efficiency technologies identified during project preparation (ref. par. 3.2) (including those that have high potential, but do not fulfil the other criteria, e.g. have high initial capital cost and/or low-medium rate of return, require long time for implementation, etc.) will not be tested or implemented during the course of the project.
Table 7: Criteria for technology selection
Technology
Rat
e of
ret
urn
Impl
emen
tabi
lity
N. o
f D
epar
tmen
ts
Inte
rven
tion
type
Pro
venn
ess
Pot
entia
l for
A
bsor
ptio
n/
Rep
licab
ility
Traction
• Installation of ASCB to reduce electrical losses in Traction Sub Stations (TSS) H E S C PI H
• Installation of LED (light-emitting diode) lights in coaches H E S C PI H
• Installation of GPSDAS and EMS to ensure safe and energy efficient driving H E S C PA H
• Installation of microprocessor controlled air-conditioning systems for AC couches H E S C PA H
• Installation of roof solar panels in coaches to generate electricity H E S C PA H
• Conduction of energy audits of rolling stock (locomotives) and coaches* H E S C PA H
Non-traction
• Replacement of fluorescent tube lights with low energy consumption lights H E S C PI H
• Replacement of incandescent bulbs with CFLs bulbs for service buildings, etc. H E S C PI H
• Installation of VVVF (Variable Voltage Variable Frequency) drives for machine H E S C PI H
• Installation of Energy Management System (EMS) for pumping installations H E S C PA H
• Installation of BMS for stations, workshops and railway offices H E S C PA H
• Energy audits of stations, workshops and railway offices, etc.* H E S C PA H
• Support to energy testing laboratories* H E S C PA H
(*) Even if these activities cannot be properly considered technologies, they have been included as key critical activities to assess energy consumptions and promote energy efficiency measures. See also Annex D for more details Legend:
- Rate of return: High (H), Medium (M), Low (L) - Implementability: Easy (E), Medium (M), Difficult (D) - Number of Departments necessary for implementation: Single (S), Multi-Department (MD) - Complementary to existing knowledge within IR (C)

22
- Provenness: Proven in India (PI), Proven in abroad/Recommended by international bodies (PA), Not-Proven (NP)
- Potential for Absorption/ Replicability: High (H), Medium (M), Low (L)
4.4 Strategic considerations: consistency with GEF strategies and strategic programs
32. The proposed project is in line with the GEF objective of the Operational Program 5, i.e. “to promote energy-efficient technologies and practices in industrial production and manufacturing processes” and the related Strategic Program 2 (SP-2), i.e. “promoting energy efficiency in the industrial sector”.
4.5 Strategic considerations: consistency with UNDAF and UNDP Country Programme
33. The proposed project is consistent with the objectives of the UNDAF (2008-2012), the planning framework for UN support to the Government of India, and particularly to the objectives set in Outcome 4, i.e. “the most vulnerable people […] have the abilities to prepare, adapt/recover from […] environmental changes”.
34. The proposed project is in addition consistent with the objectives set in the UNDP Country Programme Action Plan (CPAP) 2008-2012, the planning framework for the specific UNDP support to the Government of India. The CPAP 2008-2012 states that a special focus will be placed on energy efficiency in order to contribute to reduction of greenhouse gas emissions in energy intensive industries, transport and commercial sectors, and that under this Program actions aiming at identifying and facilitating access to clean energy and piloting energy efficiency technologies to reduce greenhouse gas emissions will be supported. Specifically, the proposed project is consistent with the CPAP Outcome 4.3, i.e. “Progress towards meeting national commitments under multilateral environmental agreements”, and Output 4.3.3, partnerships and capacities developed to meet national commitments under multilateral environmental agreements”.
4.6 Strategic considerations: consistency with other national initiatives
35. The proposed project is one of the five projects under the “Programmatic Framework Project for Energy Efficiency in India” (GEF project 3538). The other four energy efficiency projects under this programme include: (i) the “Energy Efficiency Improvements in Commercial Buildings” project (UNDP); (ii) the “Chillers Energy Efficiency” project (World Bank); (iii) the “Financing Energy Efficiency in Small and Medium Enterprises” project (World Bank); and (iv) the “Promoting Energy Efficiency and Renewable Energy in selected SME clusters in India” project (UNIDO). The proposed project will establish the necessary communication and coordination mechanisms through its project board and management to ensure a proper coordination with this programme on energy efficiency. UNDP India will also take the lead ensuring adequate coordination and exchange of experiences.
5. COUNTRY ELIGIBILITY, POLICY CONFORMITY AND COUNTRY OWNERSHIP
5.1 Country eligibility
36. India ratified the United Nations Framework Convention on Climate Change (UNFCCC) on 1 November 1993. India has completed and submitted its First National Communication and is currently preparing its Second National Communication.

23
5.2 Policy conformity and country ownership
37. The proposed project supports the objectives and targets on energy efficiency set in the Eleventh Five-Year Plan (2007-12), i.e. reducing energy intensity per unit of GDP by 20% over the 11th FYP period; savings of 5% energy consumption levels through the implementation of a set of energy efficiency interventions, including the establishment of an appropriate set of incentives; the creation of an enabling institutional framework; the promotion of energy service companies (ESCOs); and the promotion of energy efficient technologies.
38. The proposed project is in addition consistent with the actions envisaged in the Integrated Energy Policy (2006), i.e. improving energy efficiency and energy conservation in use and demand side management, shifting freight traffic to railways, and expanding electrification of railways to reduce diesel needs.
39. Finally, the proposed project is consistent with the National Action Plan on Climate Change (2008), and particularly with the National Mission for Energy Efficiency, which calls for strengthening the legal mandate of Energy Conservation Act of 2001; promoting market based mechanisms to enhance cost effective investments in energy efficiency in energy-intensive large industries and facilities; accelerating the shift to energy efficient equipments; creating mechanisms to finance demand side management energy saving programmes; and developing fiscal instruments to promote energy efficiency.
6. PROJECT OBJECTIVES, OUTCOMES AND OUTPUTS
6.1 Project goal, objective and expected results
40. The project goal is the reduction of GHG emissions from the Indian Railway system. The proposed project aims at improving energy efficiency in the Indian Railways system (and thereby reducing greenhouse gas emissions) by removing some of the key barriers that prevent the wide adoption of energy efficiency technologies and measures in the Indian Railways system. Emission reduction estimates are quantified in Section 8.
6.2 Project components, outcomes, outputs and activities
41. The project is organized along four components:
(1) Institutional capacity development and technical training
(2) Implementation of proven energy efficiency technologies and measures
(3) Pilot demonstration of energy efficiency technologies and measures
(4) Information and knowledge sharing

24
Component 1 Institutional capacity development and technical training
Expected Outcome: (1.1) Strengthened IR institutional capacity; (1.2) Improved EE management and technical capacity of IR staff
Output Activities
1.1 Documented energy efficiency (EE) best practices (measures and technologies) and defined EE benchmarks for railway systems
1.1.1 Review of available information and collection of technical data on energy efficiency technologies in railway operation in India.
1.1.2 Gap analysis to define focus areas for the implementation of EE technologies and measures.
1.1.3 Interaction with industrialized countries (such as Japan, Germany, France, UK), including visits to their ‘units of excellence’, to assess the efficacy of their EE technologies and measures and define benchmarks.
1.1.4 Based on activities 1.1.1 and 1.1.2, identification and documentation of ‘best practices’, and efficiency benchmarks and assessment of their applicability in the context of Indian Railways.
1.1.5 Definition and establishment of specific EE benchmarks for the Indian Railways System (IRS)
42. The activities to be carried out to deliver Output 1.1 are aimed at identifying a set of energy efficiency technologies and measures with application potential in the Indian Railways, and at defining specific energy efficiency benchmarks for the Indian Railways.
43. The activities include a comparative analysis between the existing energy efficiency technologies and measures in India and the pilot demonstration of technologies proved to be successfully demonstrated in developed countries. Best practices and energy efficiency benchmarks in industrialised countries will be analysed and assessed on applicability in the Indian context. A key activity for the achievement of this output will be the interaction with the units of excellence that have expertise in EE technology applications in railway systems in industrialized countries, including limited technical field visits to them to familiarize and directly assess the efficacy and the compatibility of energy efficiency technologies applied abroad to the Indian context.
44. The information on energy efficiency technologies, measures, and benchmarks will be documented and disseminated to the Indian Railway divisions and production units, suppliers and the various associations in the operating zones and divisions of the company through the web portal and the Technology Information Resource Facilitation Desk (TIRFAD) which will be established during the project (ref. Activities 1.2.3, 1.2.4, and 4.1.2).
Output Activities
1.2 Established and supported Centre of Excellence (COE)
1.2.1 Development of a business plan for the COE
1.2.2 Establishment of the COE
1.2.3 Development of a web- portal for the dissemination of information on EE technologies and measures
1.2.4 Establishment of a Technology Information Resource and Facilitation Desk (TIRFAD) to disseminate information to equipment vendors for product development
45. The activities that will be implemented to deliver Output 1.2 aim at establishing and supporting a Centre of Excellence (COE) for energy efficiency within Indian Railways.
25
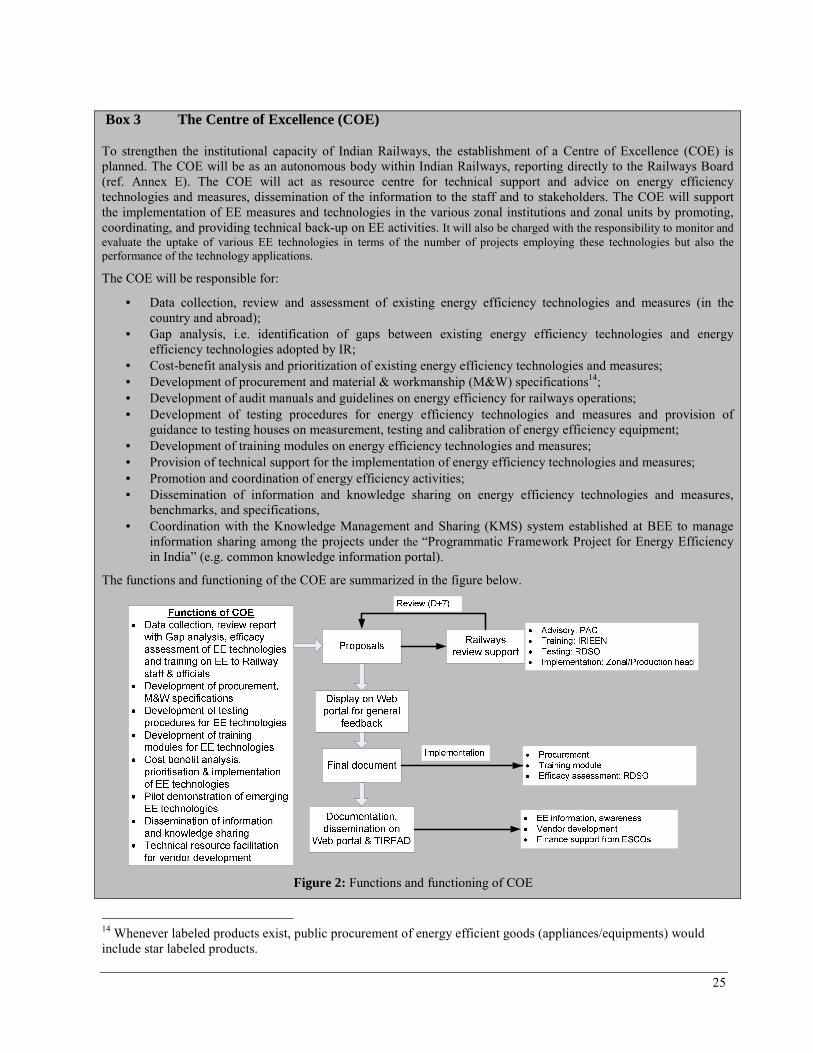
Box 3 The Centr e of Excellence (COE)
To strengthen the institutional capacity of Indian Railways, the establishment of a Centre of Excellence (COE) is planned. The COE will be as an autonomous body within Indian Railways, reporting directly to the Railways Board (ref. Annex E). The COE will act as resource centre for technical support and advice on energy efficiency technologies and measures, dissemination of the information to the staff and to stakeholders. The COE will support the implementation of EE measures and technologies in the various zonal institutions and zonal units by promoting, coordinating, and providing technical back-up on EE activities. It will also be charged with the responsibility to monitor and evaluate the uptake of various EE technologies in terms of the number of projects employing these technologies but also the performance of the technology applications.
The COE will be responsible for:
• Data collection, review and assessment of existing energy efficiency technologies and measures (in the country and abroad);
• Gap analysis, i.e. identification of gaps between existing energy efficiency technologies and energy efficiency technologies adopted by IR;
• Cost-benefit analysis and prioritization of existing energy efficiency technologies and measures; • Development of procurement and material & workmanship (M&W) specifications14; • Development of audit manuals and guidelines on energy efficiency for railways operations; • Development of testing procedures for energy efficiency technologies and measures and provision of
guidance to testing houses on measurement, testing and calibration of energy efficiency equipment; • Development of training modules on energy efficiency technologies and measures; • Provision of technical support for the implementation of energy efficiency technologies and measures; • Promotion and coordination of energy efficiency activities; • Dissemination of information and knowledge sharing on energy efficiency technologies and measures,
benchmarks, and specifications, • Coordination with the Knowledge Management and Sharing (KMS) system established at BEE to manage
information sharing among the projects under the “Programmatic Framework Project for Energy Efficiency in India” (e.g. common knowledge information portal).
The functions and functioning of the COE are summarized in the figure below.
Figure 2: Functions and functioning of COE
14 Whenever labeled products exist, public procurement of energy efficient goods (appliances/equipments) would include star labeled products.
26
The COE is not meant to duplicate the functions of existing units/divisions within IR. On the contrary, it will strengthen the capacity and rely on the functions already in place in the railways system. For example, while draft proposals will be developed by the experts of COE, they will be reviewed by the existing testing units (e.g. RDSO and other training institutes of IR). (See Annex E for more details).
The functions of the COE will be initially carried out by the Project Management Unit (PMU) for the duration of the project. As an exit strategy, it is foreseen that staff of the PMU may be absorbed in the COE at the completion of the project, so as to retain the capacity and expertise developed during project implementation.
46. To deliver this output, the activities that will be conducted include the development of a business plan for the COE, which describes organizational set-up, functions, and activities of the Centre; the establishment of the COE, including physical infrastructures and equipment; the development of a web-portal for the collection and dissemination of relevant information on energy efficiency technologies and measures, including benchmarks, training material, etc.; and the establishment of a Technology Information Resource Facilitation Desk (TIRFAD) within COE for the dissemination of information to all key stakeholders, both from the public (i.e. Indian Railways) and private sector (i.e. small and medium enterprises, vendors, etc.). TIRFAD will make available and easily accessible a wide range of knowledge products on EE practices, which include information on their technical, environmental and economic parameters. TIRFAD will function as an interface between the COE and the industry, manufacturers, entrepreneurs and vendors. It will help promoting EE measures among these stakeholders, thus facilitating the development of specific EE equipment in India.
Output Activities
1.3 Trained and qualified staff members of the relevant IR departments capable of implementing EE technologies, measures, and best practices
1.3.1 Detailed capacity need assessment of IR (IR staff skills and expertise in EE, and capacity of training and testing institutes to conduct EE tests and trainings)
1.3.2 Development of a training plan, program and training modules
1.3.3 Conduct of training of trainers and awareness raising workshops
1.3.4 Conducting training courses at divisional level
1.3.5 Capacity building for training and testing units to ensure effective implementation and monitoring of EE technologies and measures, and maintenance of EE assets
47. The activities that will be carried out to deliver Output 1.3 aim at strengthening the capacity of Indian Railways (i.e. competences and expertise of IR staff, and facilities and equipment of IR training and testing institutions) to adopt and replicate energy efficiency technologies, measures and best practices.
48. Such activities include: a review and assessment of the expertise/technical skills available within IR staff (at both managerial and technical level) in relevant fields (i.e. rolling stock, traction and distribution, etc.) and the capacity of testing and training institutes and units to conduct energy efficiency tests and trainings; identification of the training needs and support to training institutes and units in developing a training plan and training modules; conduct training of trainers and awareness raising workshops among IR staff (ref. section 4.2 and Annex F for more details on the training and awareness raising activities) and training courses at divisional level; and capacity building for training and testing institutes/units, including accredited test-houses, by providing testing, measurement and calibration facilities, and training facilities to ensure effective implementation and monitoring of energy efficiency technologies and measures, and maintenance of energy efficiency assets.

27
Component 2 Implementation of proven15 energy efficiency technologies and measures
Expected Outcome: Proven EE technologies and measures in traction and non-traction operations are implemented and energy savings realized
Output Activities
2.1 Documented detailed information on available EE technologies and measures
2.1.1 Review and assessment of existing energy efficiency technologies and measures that have proven to be successful in India (either in IR or in other sectors) and definition of EE benchmarks
2.1.2 Cost-benefit analysis of identified EE technologies
2.1.3 Prioritization of energy efficiency technologies and measures to be implemented
2.1.4 Documentation of EE technologies (e.g. standards, code of practices, M&W specifications, test procedures, installations & testing check lists, etc.)
49. The activities that will be implemented to deliver Output 2.1 aim at assessing and compiling detailed information on existing energy efficiency technologies and measures in both the electric traction (TR) and non-traction (NT) fields.
50. These activities include: assessment of the proven energy efficiency technologies and measures (i.e. technologies and measures that have proven to be successful in India, either in the IR or in other sectors), a cost-benefit analysis of the identified technologies; the prioritization of energy efficiency technologies and measures to be implemented based on their cost-benefit, readiness and timeframe for implementation, risks, etc.); and a definition of energy benchmarks (based also on the analysis of Activity 1.1.3). Information on technologies (e.g. standards, code of practices, M&W specifications, test procedures, installations & testing check lists, etc.) and benchmarks will be collected and documented.
51. The collected information will be disseminated to the Indian Railway divisions and production units, suppliers and the various associations within the operating zones and divisions of the company through the web portal and the Technology Information Resource Facilitation Desk (TIRFAD), which will be established during the course of project implementation.
Output Activities
2.2 Developed and implemented energy audit procedures
2.2.1 Identification of energy intensive departments, segments, and units
2.2.2 Development of energy audit guidelines, manuals, and procedures for each railway operation (e.g. production units, traction substations, workshops, production units, maintenance depots and buildings etc.)
2.2.3 Conduct of energy audits and definition of benchmarks
2.2.4 Development of contract procedures for energy audits, procurement and implementation16
52. The activities that will be carried out to produce Output 2.2 aim at developing and implementing energy audit procedures for railways operation. 15 That is, energy efficiency technologies and measures that have already proven to be successful in India (either in IR or in other sectors). The project demonstrates how successfully these technologies and measures can be applied and implemented cost-effectively as these have not yet been widely adopted. 16 Whenever labeled products exist, public procurement of energy efficient goods (appliances/equipments) would include star labeled products.

28
53. The activities include: identification of energy intensive departments, segments and units (e.g. sub-stations, work centres, traction sub-stations, etc.); development of audit guidelines, procedures and manuals for each railway operation (e.g. production units, traction substations, workshops, production units, maintenance depots and buildings etc.); conduct of demonstrative energy audits (in about 20 different utilities) to promote energy audit procedures and demonstrate the benefits of energy audits to improve energy efficiency, and the definition of energy efficiency benchmarks17.
54. The PMU will provide support in developing the contract and procurement procedures for energy audits.
Output Activities
2.3 Completed implementation of ready and proven technologies and measures
2.3.1 Preparation of standards (both technical and financial) for EE services while inviting tenders.
2.3.2 Implementation of ready and proven energy efficiency technologies and good housekeeping measures as identified during project preparation and under the audits to build confidence and promote EE
2.3.3 Development of the guidelines and standards that needs to be met by the manufacturers, vendors, importers, new entrepreneurs, indigenous entrepreneurs to replicate and produce EE technologies locally and reduce the costs of production.
2.3.4 Capacity building for manufacturers of energy efficient equipment on the design, production and testing of energy efficient equipment.
55. The activities that will be carried out to produce Output 2.3 aim at supporting the implementation of energy efficiency technologies and measures that have already proven to be successful in India (either in IR or in other sectors) but have not been yet widely adopted. In favouring the implementation of these technologies and measures, the project expects to build capacity and confidence among IR staff on energy efficiency measures, thus favouring the replication of these technologies and measures on a larger scale.
56. Box 4 below summarizes the proven technologies and measures that have been identified during project preparation phase that will be implemented during project implementation, including their investment cost, estimated energy saving, and estimated annual CO2 reduction. A detailed description of the technologies/measures, electricity consumption with the present method, estimated electricity consumption with the intervention, estimated electricity saved, estimated amount saved, payback period and estimated annual emission reduction are reported in Annex D and Table 18.
57. The EE measures identified above will be implemented in each Zonal Railways and field unit to showcase their effectiveness and benefits thereby building and/or enhancing the confidence of zonal railway managers in investing resources in EE.
58. The GEF contribution to the implementation of the above EE technologies and measures will amount at about 10-15% of the total costs. GEF resources will be primarily used for capacity development, training, awareness creation and information dissemination, which practically are the incremental activities that are needed to ensure the effective demonstration of the selected EE technologies, techniques and measures. IR will contribute with investments in equipment and infrastructure.
59. In delivering this output, technical support will be provided to manufacturers, vendors, importers, new entrepreneurs, etc. to upgrade the design, testing and technical characteristics of EE equipment and products, to indigenous entrepreneurs to replicate and produce EE technologies locally and reduce the
17 The best energy efficiency achieved at any of the field units will be considered as EE benchmarks.

29
costs of production. Manufacturers of equipment will receive further guidance regarding the design, production and testing of energy efficient equipment.
Output Activities 2.4 Developed and implemented
incentive schemes
2.4.1 Review of existing incentive and award schemes, both within and outside India
2.4.2 Development of suitable incentive schemes to encourage the adoption and implementation of EE measures
2.4.3 Institutionalization of the proven successful incentive schemes
2.4.4 Mobilization of financial support for the implementation of the incentive schemes
60. Output 2.4 will be delivered through the implementation of activities aimed at developing and implementing an incentive scheme to provide incentives to IR staff to adopt and implement energy efficiency technologies and measures.
61. Such activities include: review of existing incentive and award schemes, both within and outside India, development of suitable incentive schemes to encourage the adoption and implementation of EE measures, and the institutionalization of the proven successful incentive schemes. In order to support the effective implementation of incentive scheme, funds need to be mobilized for an effective implementation of incentive scheme from the respective authority.
Box 4 Proven interventions and impact estimate (Outcome 2)18
(A) Traction
1. Automatic Switched Capacitor Bank to reduce electrical losses in Traction Sub Stations (ASCB for TSS) 2. LED (Light Emitting Diode) lights in coaches
(B) Non Traction
3. T5 tubes in place of T12 tubes for lighting for stations, workshops and railway offices 4. CFLs replacing incandescent bulbs for service buildings and railway quarters 5. VVVF (Variable Voltage Variable Frequency) drives for machines
# Technology/Device/Measure description Investment cost (USD)
Estimated annual energy savings (million kWh per
year)
Estimated annual CO2 reduction
(tonnes/year)
(A) Traction
1 Installation and operation of Automatic Switched Capacitor Bank to reduce electrical losses in Traction Sub Stations (ASCB for TSS)
425,532 0.38 308
2 Installation and use of LED (Light Emitting Diode) lights in coaches
1,276,596 1.21 992
(B) Non-traction
18 See Annex D for more details.
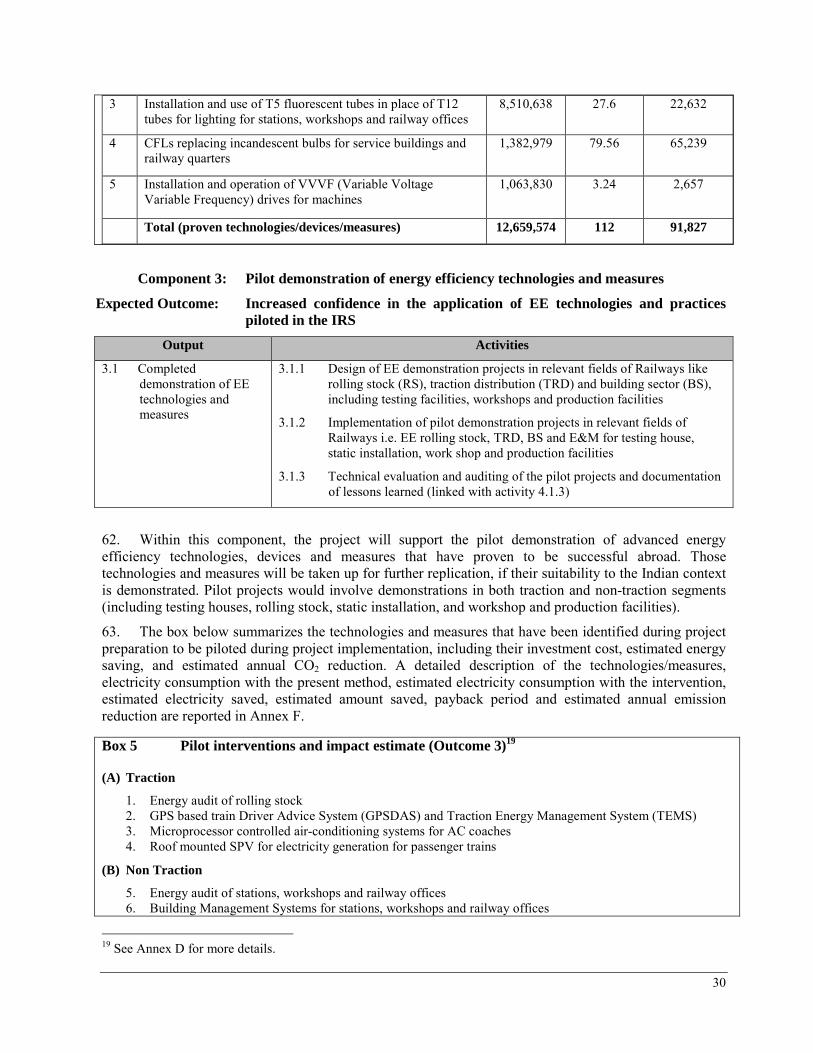
30
3 Installation and use of T5 fluorescent tubes in place of T12 tubes for lighting for stations, workshops and railway offices
8,510,638 27.6 22,632
4 CFLs replacing incandescent bulbs for service buildings and railway quarters
1,382,979 79.56 65,239
5 Installation and operation of VVVF (Variable Voltage Variable Frequency) drives for machines
1,063,830 3.24 2,657
Total (proven technologies/devices/measures) 12,659,574 112 91,827
Component 3: Pilot demonstration of energy efficiency technologies and measures
Expected Outcome: Increased confidence in the application of EE technologies and practices piloted in the IRS
Output Activities
3.1 Completed demonstration of EE technologies and measures
3.1.1 Design of EE demonstration projects in relevant fields of Railways like rolling stock (RS), traction distribution (TRD) and building sector (BS), including testing facilities, workshops and production facilities
3.1.2 Implementation of pilot demonstration projects in relevant fields of Railways i.e. EE rolling stock, TRD, BS and E&M for testing house, static installation, work shop and production facilities
3.1.3 Technical evaluation and auditing of the pilot projects and documentation of lessons learned (linked with activity 4.1.3)
62. Within this component, the project will support the pilot demonstration of advanced energy efficiency technologies, devices and measures that have proven to be successful abroad. Those technologies and measures will be taken up for further replication, if their suitability to the Indian context is demonstrated. Pilot projects would involve demonstrations in both traction and non-traction segments (including testing houses, rolling stock, static installation, and workshop and production facilities).
63. The box below summarizes the technologies and measures that have been identified during project preparation to be piloted during project implementation, including their investment cost, estimated energy saving, and estimated annual CO2 reduction. A detailed description of the technologies/measures, electricity consumption with the present method, estimated electricity consumption with the intervention, estimated electricity saved, estimated amount saved, payback period and estimated annual emission reduction are reported in Annex F.
19 See Annex D for more details.
Box 5 Pilot interventions and impact estimate (Outcome 3)19
(A) Traction
1. Energy audit of rolling stock 2. GPS based train Driver Advice System (GPSDAS) and Traction Energy Management System (TEMS) 3. Microprocessor controlled air-conditioning systems for AC coaches 4. Roof mounted SPV for electricity generation for passenger trains
(B) Non Traction
5. Energy audit of stations, workshops and railway offices 6. Building Management Systems for stations, workshops and railway offices

31
64. The PMU/COE will identify the pilot projects after the efficacy assessment under activity 1.1.2, in consultation with other the IR units. Zonal railways and other field units will design the demonstration projects, procure, install and commission the necessary hardware with suitable external engineering support. Where and when necessary, the PMU/COE will provide support in reviewing the design and monitor the procurement and installation process as well as providing advice during procurement (e.g., identification of suppliers, preparation of bids). The results of the pilot projects will be evaluated, and the lesson learnt and knowledge gained will be shared to support decision making processes.
7. Energy Management System (EMS) for pumping installations 8. Energy Testing and Resource Centres
# Technology description (pilot demonstration) Investment cost (USD)
Estimated annual energy savings (million kWh per
year)
Estimated annual CO2 reduction
(tonnes/year)
(A) Traction
1a/1b Energy audit of rolling stock (locomotives)
Energy audit of coaches
Implementation of selected energy conservation opportunities (ECOs) and EE improvements (EEIs) identified and recommended by the energy audits.
212,766 1.02 835
2 GPS based Driver Advice System (GPSDAS) and Energy Management System
244,681 2.11 1,733
3 Microprocessor controlled air-conditioning systems for AC couches
255,319 1.04 850
4 Roof mounted SPV for electricity generation for passenger trains
223,404 0.05 37
(B) Non Traction
5 Energy audit of stations, workshops and railway offices
Implementation of selected energy conservation opportunities (ECOs) and EE improvements (EEIs) identified and recommended by the energy audits.
531,915 12.0 9,840
6 Building Management Systems (BMS) for stations, workshops and railway offices
1,063,830 12.0 9,840
7 Energy Management System (EMS) for pumping installations
638,298 2.19 1,796
8 Energy Testing and Resource Centres 2,127,660
Total (pilot technologies/devices/measures) 5,297,872 30 24,931

32
Component 4: Information and knowledge sharing
Expected Outcome: Information and knowledge on EE technologies and measures are widely available and accessible for IRS divisions and their affiliates
Output Activities
4.1 Collected lessons learned and developed knowledge sharing products
4.1.1 Collection and documentation of information on EE technologies, measures, best practices, and lessons learnt
4.1.2 Dissemination of collected information through the web portal and TIRFAD
4.1.3 Production of documentation, publications; leaflets; reports, and of a regular (project) newsletter
4.1.4 Conduct of awareness campaigns at divisional level
4.2 Developed post-project action plan for COE
4.2.1 Synthesis of project results and development of an action plan for the post-project functioning of the COE
4.2.2 Conduct of closing workshop
65. The activities that will be carried out under this component are aimed at supporting the sharing of information and knowledge regarding energy efficiency technologies, measures and best practices through the activities of the project.
66. Such activities include: collection and documentation of information on EE technologies, measures, best practices, and lessons learnt; activities to favour information dissemination and knowledge sharing such as dissemination of collected information through the web portal and Technology Information Resource and Facilitation Desk (TIRFAD); production of documentation, publications; leaflets; reports, and of a regular (project) newsletter; and, the conduct of awareness campaigns at the divisional level within the IRS.
67. Under this component, a post-project action plan for the COE will be developed. A synthesis of all project results will be done, and used as basis for the post-project action plan. Such plan will be presented in a workshop, along with the synthesis of the project results.
68. A key role for the dissemination of information and knowledge will be played by the TIRFAD, established under output 1.2. TIRFAD will disseminate information on EE technologies and measures to all key stakeholders, both from the public (i.e. Indian Railways) and private sector (i.e. small and medium enterprises, vendors, etc.). TIRFAD will make available and easily accessible a wide range of knowledge products on EE practices, which include information on their technical, environmental and economic parameters.
69. This component will, in addition, favour and support knowledge sharing from the other projects under the “Programmatic Framework Project for Energy Efficiency in India” (GEF project 3538), coordinated by BEE.
7. KEY INDICATORS AND ASSUMPTIONS
7.1 Indicators
70. Progress towards and attainment of the project goal and objective will be measured through the following outcome indicators:

33
Project objective Outcome indicators
Improvement of the energy utilization efficiency in the Indian Railways system (and thereby reducing greenhouse gas emissions) through the removal of some of the key barriers that prevents the wide adoption of energy efficiency technologies and measures in the Indian Railways system.
(1) Total direct energy savings by EOP
(2) Total direct CO2 emission reductions achieved in the IRS by EOP
71. Progress and achievements within the single components are measured through the following intermediate-outcome and output indicators (details are presented in Section 10):
Table 8: Project outcome and output indicators
Project component/ outcome Component output Intermediate-outcome/ output indicators
(1) Institutional capacity development and technical training
Expected outcomes: (1.1) strengthened IR institutional capacity (1.2) improved EE management and technical capacity of IR staff
1.1. Documented energy efficiency (EE) best practices (measures and technologies) and defined EE benchmarks for railways systems
• Status report of targeted EE technologies / measures, its availability in India/abroad and gap analysis for its implementation
1.2. Established and supported Centre of Excellence (COE)
• Established and functioning of EE Centre of Excellence (COE) in IRS by EOP
• TIRFAD established and functioning by EOP
• COE website established and operational by EOP
1.3. Trained and qualified staff members of the relevant IR departments capable of implementing EE technologies, measures, and best practices
• Number of training courses conducted by the training institutes each year starting from year 3
• Number of managers and staff members trained on EE best practices and technologies by EOP
• Number of training and testing institutes with capacity to provide trainings and test EE measures/equipment by year 3
• Number of successful EE projects implemented by the trained managers and staff members by EOP

34
Project component/ outcome Component output Intermediate-outcome/ output indicators
(2) Implementation of proven energy efficiency technologies and measures
Expected outcome: Proven EE technologies and measures in traction and non-traction operations are implemented and energy savings realized
2.1 Documented detailed information on available EE technologies and measures
• Number of project proposals (technical and financial) prepared by EOP for EE technology / measure application projects
2.2 Developed and implemented energy audit procedures • Potential energy savings from the
implementation of EE technologies and/or measures by year 3
2.3 Completed implementation of ready and proven technologies and measures
2.4 Developed and implemented incentive schemes
• Percentage of savings derived from EE measures implemented allocated as incentives to EE implementers by EOP
(3) Pilot demonstration of energy efficiency technologies and measures
Expected outcome: Increased confidence in the application of piloted EE technologies and practices in the IRS
3.1 Completed pilot demonstration of EE technologies and measures
• Number of energy audits conducted in IRS units above 0.5 MW load by year 3
• Number of pilot demonstrations designed and implemented by year 3
• Total energy savings achieved from pilot projects by EOP, million kWh
• Percentage of successful pilot demonstrations adopted by IRS for replication by EOP
• Based on energy audits, number of EE technologies and measures identified as feasible for implementation (planned and budgeted) by year 3
(4) Information and knowledge sharing
Expected outcome: Information and knowledge on EE technologies and measures are widely available and accessible for IRS divisions and their affiliates
4.1 Collected lessons learned and developed knowledge sharing products
• Average number of visitors visiting the web portal each year starting year 2
• Number of sets of knowledge sharing products (KSPs) developed and disseminated by EOP
• Number of awareness campaigns conducted per division per year starting year 3
• Number of IRS divisions that are actively participating in IRS EE programs by EOP
• Number of vendors registering with TIRFAD each year starting year 3(i.e. from 2013)
• Cumulative number of vendors attending TIRFAD campaigns by the EOP
7.2 Assumptions
72. General assumptions are (see Section 10 for more details):
• The commitment on energy efficiency by the Indian Railways’ decision-makers; • Existing organizations within IR, such as RDSO and IRIEEN, do not feel threatened by the new
COE, but see it as support centre for mobilising internal institutional support for promotion of EE technologies and measures and coordination;

35
• The support by RDSO and training institutions to review the technical documentation on EE technologies and measures, testing and training modules and to assist in implementation;
• Required contributions from UNDP and Railways are available; • The field units facilitate the implementation and pilot demonstrations; • The COE will be institutionalised to function independently under the IR Board.
7.3 Risks
73. The main risks to the effective implementation of the proposed GEF project are related to the following:
• Failure to secure continuous support to the Energy Efficiency and Conservation Programme (EECP) from planners in Indian Railways zonal production and other units;
• Lack of manufacturers’ interest in investing for EE products, thus leading to initiatives failure; • Failure to trigger a positive response from technical staff on initiatives supporting EECP; • Lack of effective coordination between IR units on initiatives supporting the EECP; • Willingness of IR managers to give proper priority to EE in investment decisions; • Competition from inefficient and cheap technologies and high cost of advanced (monopolistic)
technologies; • Fast changing technologies in particular in the electronics segment.
74. Details on measures that will be undertaken to mitigate the risks are reported in Annex A.
8. GEF INCREMENTAL REASONING AND COST-EFFECTIVENESS
8.1 Baseline scenario
75. Indian Railways has in the past carried out some initiatives on energy efficiency in accordance with the Energy Conservation Act, and policy directives are periodically issued to promote the adoption of energy efficiency measures. However, the implementation of such initiatives and measures has been rather ad-hoc (i.e. based on the good will of sensitive officers) and uncoordinated. In general, the uptake of energy efficiency technologies and measures has been rather slow.
76. To promote the adoption of energy efficiency technologies and measures in a more comprehensive and effective way, Indian Railways is developing a long-term Energy Efficiency and Conservation Program (EECP) (2010/11-2031/32) with the objective of saving 10% of the total electricity consumption in absolute terms by 2032.
77. However, considering the pace with which energy efficiency measures have been implemented in the past, there is an inherent risk that the implementation of the Energy Efficiency and Conservation Program (EECP) would also be slow. During project preparation a number of barriers have been identified as being responsible for low absorption rate of energy efficiency technologies and measures (ref. Section 3.3 for more details). Unless these barriers are addressed, it is likely that the implementation of the EECP would also be slow.
78. Without GEF intervention (i.e. baseline scenario), Indian Railways is expected to move from the current (2009-10) estimate of 15.7 billion kWh of electricity consumption in the railways sector to 100.5 billion kWh in 2031-32 (about 1,030 billion kWh cumulatively for the period 2010/11-2031/32). These figures are equivalent to the emission of about 12.8 and 82.4 million tonnes of CO2 respectively. Details on the baseline scenario are provided in Annex D.

36
8.2 GEF alternative scenario
79. With GEF intervention (i.e. GEF alternative), it is assumed that, thanks to improved institutional set-up, improved capacity, confidence and awareness, improved incentive system, etc., energy efficiency technologies and measures will be adopted and implemented at a faster pace and on a wider scale.
80. As a result of the GEF intervention, the adoption of energy efficiency technologies and measures will be faster in the Indian Railways’ Energy Efficiency and Conservation Program (EECP) thereby reduction in energy consumption and related CO2 emissions when compared to baseline scenario. It is estimated that due to GEF intervention, total CO2 emissions during the period 2031-32 will be about 75.4 million tCO2, which is less than the estimated emissions under the baseline scenario for the same period. Table 19 in Annex D compares total energy consumption (per year and cumulative), energy savings (per year and cumulative), and CO2 emissions (per year and cumulative) under the baseline and GEF scenarios for the years 2010-11 (beginning of the project) up to 2031-32, however considering up to the year 2020-21 is advised on a conservative basis.
81. Annual direct CO2 emission savings are estimated at 0.117 million tCO2 (ref. Box 4 and 5). Cumulative direct CO2 emission reductions over 10-year investment lifetime (average) are estimated at 1.17 million tonnes of CO2 (tCO2). Considering the total avoided GHG emission reductions that are attributable to the project, which amounts to 1.17 million tCO2, the corresponding unit abatement cost (UAC20) (i.e. GEF$ per tCO2) is USD 4.45/tCO2.
82. After the project’s completion, investments will be affected by the long-term outcomes of the barrier-removal activities, e.g. capacity building and institutional strengthening. The corresponding CO2 emissions reduction is referred to as indirect emission reduction. A replication factor of “3” has been chosen as a conservative estimate for Indian Railways based on the market transformation and demonstration approach of the project. Thus, indirect emission reductions (bottom-up) over 10-year investment lifetime are estimated at 1.17 million tCO2 * 3 = 3.50 million tCO2.
83. In the alternative scenario the cumulative amount of 4.16 MtCO2 would be reduced over the period 2011/12-2020/21 (that is, a total duration of 10 years during and after the project’s lifetime). Of course, this potential cannot be fully attributed to the GEF intervention alone as other projects may have an influence over the entire IR system. Uptake of EE technologies would also take place to some extent due to ongoing (and future) national efforts and future donor-funded initiatives. We propose to apply conservatively a ‘causality factor’ 4 of 80%. This gives indirect emission reduction (top-down) 4.16 MtCO2 * 80% = 3.32 MtCO2.
Box 6 Summary of the emission reduction impacts of the project
(a) Direct savings
2010-13 Alternative scenario (i.e. implementation of EECP with GEF support)
Energy Savings Electricity consumption (billion kWh) 0.142
CO2 emission savings CO2 emission savings (million tonnes)
0.117 1.168 (cumulatively for 10 years)
Savings directly due to the specific energy saving technologies and measures implemented during the project (i.e. implementation of proven technologies and measures and pilot demonstrations - ref. Box 4 and 5). Cumulative emissions over 10-years are 1.168 million tCO2, assuming a 10 year lifetime of equipment on average.
20 Only direct emission reductions are considered for 10 years of economic lifetime as per GEF guidelines. There are no direct post-project emissions pertain to the project. Therefore, GEF finance of USD 5,200,000/1,167,581 tCO2.

37
(b) Indirect savings (bottom-up)
During 10 years of lifetime Alternative scenario (i.e. implementation of EECP with GEF support)
CO2 emission savings (million tonnes) 3.503
Based on direct emissions reduction, applying replication factor of 3.
(c) Indirect savings (top-down)
2009-10 2012-13 Cumulative
2010/11-12/13
2020-21 Cumulative
2011/12-20/21
Baseline scenario (i.e. implementation of EECP without GEF support)
Electricity consumption (billion kWh) 15.65 19.90 55.21 38.60 273.00
CO2 Production (million tonnes) 12.83 16.32 45.27 31.66 223.86
Alternative scenario (i.e. implementation of EECP with GEF support)
Electricity consumption (billion kWh) 15.65 19.82 55.07 37.21 267.93
CO2 Production (million tonnes) 12.83 16.25 45.16 30.52 219.71
Energy Savings Electricity consumption (billion kWh) 0.14 5.07
CO2 Savings CO2 Production (million tonnes) 0.11 4.16
Savings due to the progressive uptake of energy efficiency technologies and measures indirectly induced by the activities of the project (e.g. awareness raising, capacity building, etc.).
Applying a causality factor of 80%, indirect (top-down) emission reduction is estimated at 3.32 million tCO2
9. SUSTAINABILITY AND REPLICABILITY
9.1 Sustainability
84. After completion of the proposed GEF project, the Energy Efficiency and Conservation Program (EECP) will continue. The improved institutional environment and implementation and evaluation structures, to be developed with support from the proposed GEF project, are expected to be maintained by the Indian Railways (IR) Board upon completion of the project. Since the proposed GEF project has a strong capacity-building element, its outputs will foster institutional capacities to effectively maintain and expand the EE programme through its EE Centre of Excellence (COE) as a resource centre that provides advisory and technical support to other IR units in the implementation of EE technology and measures. The project places high priority on active participation by all Indian Railways stakeholders, i.e. staff of the various zonal units, testing houses, RDSO, training institutes, workshops, etc., ensuring ownership and sustainability of the EE programme.
85. The proposed project will establish an enabling framework and promote and strategic partnerships between Indian Railways, equipment manufacturers and importers and international EE agencies like UIC, SNCF etc. Such capacities and partnerships are expected to remain in place and facilitate the continuation of the EECP. Since the proposed GEF project has a strong capacity-building element, its outputs will foster institutional capacities to effectively maintain and revise the EE programme through Centre of Excellence.

38
9.2 Replicability
86. It is expected that the proposed project will demonstrate an effective model for the implementation of EE applicable to a wide-range of equipments and departments within Indian Railways. The outcomes of the project will support the accelerated transformation of Railways towards energy efficient Organisation. The enabling environment and the enhanced institutional capacities will facilitate the effective implementation of EE and the awareness campaign on EE under the proposed GEF project will motivate the Indian Railway implementing agencies, test houses and other users. The successful implementation of demonstration pilot projects along with effective dissemination and capacity building measures are expected to enhance replication potential. This process will be accelerated through adoption of 4-step replication strategy as follows:
• Step 1: A Project Management Unit will be set up and institutional capacity within IR will be strengthened by creating a Centre of Excellence (COE) to monitor and implement the EE initiatives. Experts and consultancy agencies as engaged under PMU will undertake detailed studies, efficacy assessment of various technologies, gap assessments and identify areas for improvement in technology and skills including the training modules as required.
• Step 2: Indian Railways will initiate implementation of EE measures and pilot demonstration projects in its various zonal and other units, assisted and monitored by COE.
• Step 3: Systems will be developed by COE for sharing information within each zone on technical skills, availability of technical support services, cost effectiveness and characteristics of EE technologies and measures (as well as internal and external sources of finance). The documentation and dissemination of ‘best practices’ through a web portal, monitoring of energy consumption patterns and profile as well as the development of progress indicators for assimilation and absorption of technologies together with training and deployment of energy mangers in each zone would lead to a large-scale development of energy efficiency projects in the Railways.
• Step 4: Case studies of financial returns on investment and demonstration of cost recovery of EE projects would lead to development of a culture of ‘willingness to finance’ amongst financial institutes and ESCOs (currently non-existent in India). The capacity building activity for all stakeholders at Zone and Headquarters level and other technical support through the TIRFAD will facilitate fast replication of pilot technologies. This would be further strengthened in cooperation with the potential equipment vendors, i.e. a group of entrepreneurs will be developed for cooperative procurement of services for hedging the transaction costs, post-installation assistance and after-sales services.

10. PROJECT RESULTS FRAMEWORK
This project will contribute to achieving the following Country Programme Outcomes (as defined in CPD):
Outcome: Progress towards meeting national commitments under multilateral environmental agreements (CP, Outcome 4.3) Output: Strengthened capacity for low carbon development and sustainable management of natural resources (CP, Output 4.3) Output indicators: Number of clean technologies / mechanisms piloted CPAP Outcomes and Indicators Outcome: Progress towards meeting national commitments under multilateral environmental agreements (CPAP, Outcome 4.3) Output: Partnerships and capacities developed to meet national commitments under multilateral environmental agreements Output indicators: (a) Million USD received as funding from GEF and Montreal Protocol through UNDP; (b) number of additional UNDP initiatives for achieving global and national targets under multilateral environmental agreements Primary applicable Key Environment and Sustainable Development Key Result Area: Mainstreaming environment and energy Applicable GEF Strategic Objective and Program: Strategic Programme 2 (SP-2): Promoting Energy Efficiency in the Industrial sector Applicable GEF Expected Outcomes: Increased deployment of energy efficient technologies and practices Applicable GEF Outcome Indicators: (a) amount of energy saved (b) tonnes of CO2 avoided, (c) number of energy efficient technologies and measures promoted
Table 9: Project Planning Matrix (PPM)
Strategy Objectively Verifiable Indicators
Means of Gauging Success Assumptions Indicator Baseline Targets
Project Goal: Reduction of GHG emissions in the Indian Railways System (IRS)
Cumulative emission reductions21 achieved in the IRS by EOP22 (million t CO2)
• 0 • 0.117
• M&E reports of the pilot/model projects and documents available with IRS.
• Timely execution of planned activities planned with adequate resource mobilization
• Efficient and quality measurement & recording systems are available
• Field units of IR extend the support in desired manner and effectively implement the identified EE measures
21 Total direct emission reductions (from year 3 of the project i.e. final year) 22 The use of words “End of Project (EOP)” and “Year 3” are interchangeably used, which means the same
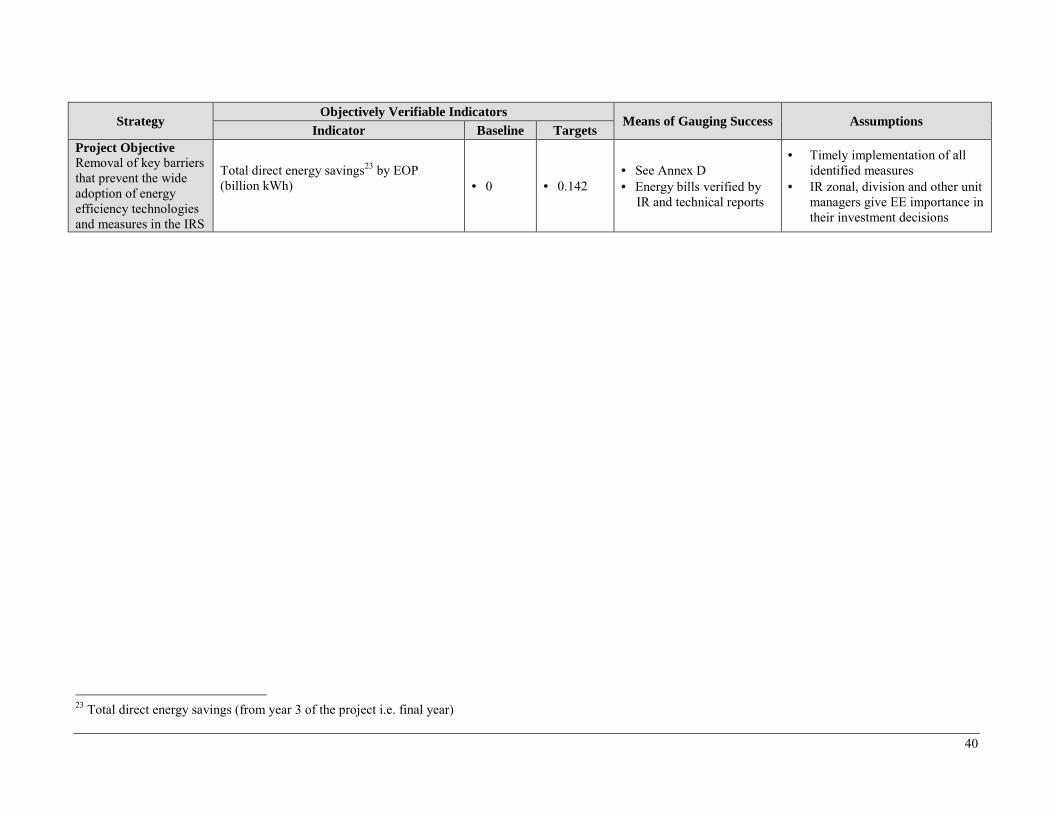
40
Strategy Objectively Verifiable Indicators
Means of Gauging Success Assumptions Indicator Baseline Targets
Project Objective Removal of key barriers that prevent the wide adoption of energy efficiency technologies and measures in the IRS
Total direct energy savings23 by EOP (billion kWh)
• 0 • 0.142 • See Annex D • Energy bills verified by
IR and technical reports
• Timely implementation of all identified measures
• IR zonal, division and other unit managers give EE importance in their investment decisions
23 Total direct energy savings (from year 3 of the project i.e. final year)
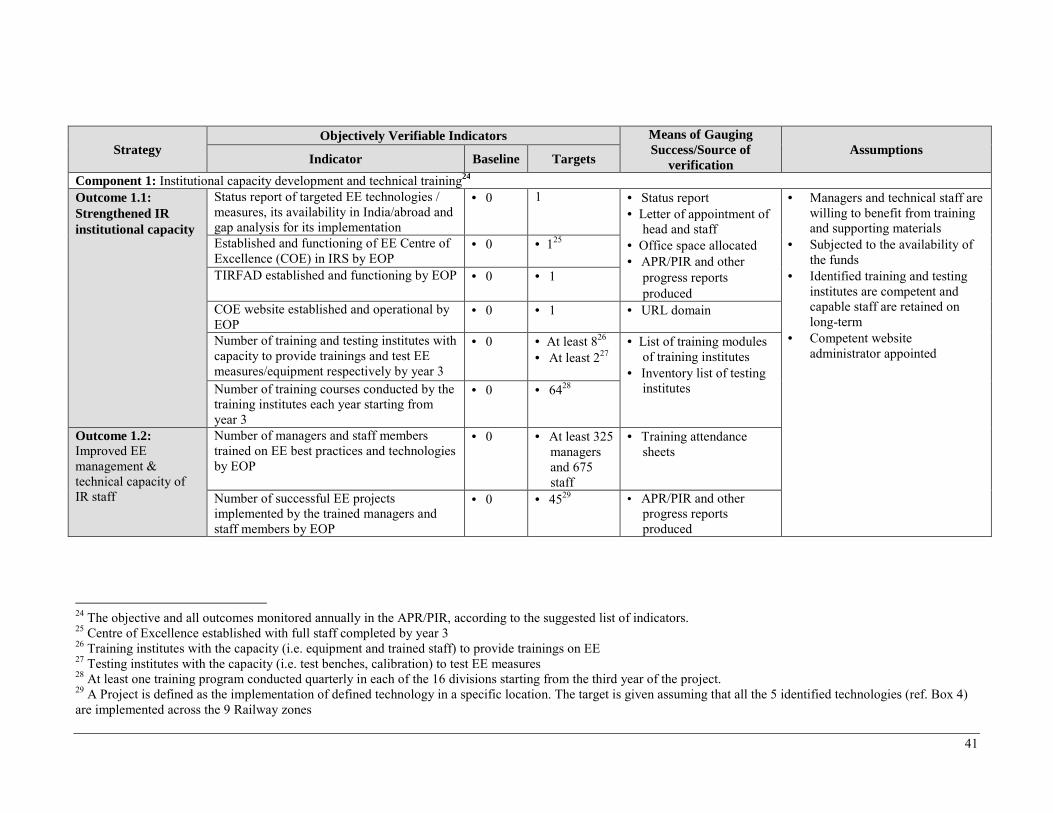
41
Strategy Objectively Verifiable Indicators Means of Gauging
Success/Source of verification
Assumptions Indicator Baseline Targets
Component 1: Institutional capacity development and technical training24 Outcome 1.1: Strengthened IR institutional capacity
Status report of targeted EE technologies / measures, its availability in India/abroad and gap analysis for its implementation
• 0 1 • Status report • Letter of appointment of
head and staff • Office space allocated • APR/PIR and other
progress reports produced
• Managers and technical staff are willing to benefit from training and supporting materials
• Subjected to the availability of the funds
• Identified training and testing institutes are competent and capable staff are retained on long-term
• Competent website administrator appointed
Established and functioning of EE Centre of Excellence (COE) in IRS by EOP
• 0 • 125
TIRFAD established and functioning by EOP • 0 • 1
COE website established and operational by EOP
• 0 • 1 • URL domain
Number of training and testing institutes with capacity to provide trainings and test EE measures/equipment respectively by year 3
• 0 • At least 826 • At least 227
• List of training modules of training institutes
• Inventory list of testing institutes Number of training courses conducted by the
training institutes each year starting from year 3
• 0 • 6428
Outcome 1.2: Improved EE management & technical capacity of IR staff
Number of managers and staff members trained on EE best practices and technologies by EOP
• 0 • At least 325 managers and 675 staff
• Training attendance sheets
Number of successful EE projects implemented by the trained managers and staff members by EOP
• 0 • 4529 • APR/PIR and other progress reports produced
24 The objective and all outcomes monitored annually in the APR/PIR, according to the suggested list of indicators. 25 Centre of Excellence established with full staff completed by year 3 26 Training institutes with the capacity (i.e. equipment and trained staff) to provide trainings on EE 27 Testing institutes with the capacity (i.e. test benches, calibration) to test EE measures 28 At least one training program conducted quarterly in each of the 16 divisions starting from the third year of the project. 29 A Project is defined as the implementation of defined technology in a specific location. The target is given assuming that all the 5 identified technologies (ref. Box 4) are implemented across the 9 Railway zones

42
Strategy Objectively Verifiable Indicators Means of Gauging
Success/Source of verification
Assumptions Indicator Baseline Targets
Component 2: Implementation of proven energy efficiency technologies and measures Outcome 2 Proven EE technologies and measures in traction and non-traction operations are implemented and energy savings realized.
Potential energy savings from the implementation of EE technologies and/or measures by Year 3, million kWh/yr
• 0
• 1.58 (for traction)
• 110.40 (for non-traction)
• Project progress reports • Energy audit reports • Project reports on
implemented EE measures
• Energy bills
• Relevant details are shared by the respective field units.
• Standard tools/ methods/ procedures of evaluations are used
• Criterion & significant factors considered for prioritization.
• Prioritization is identified by a competent team/ energy managers/ auditors
Percentage of savings derived from EE measures implemented allocated as incentives to EE implementers by EOP
• NA • At least 10%
• Cash outflow report • IRS Project progress
reports Number of project proposals (technical and financial) prepared by EOP for EE technology / measure application projects
• 0 • 4530 • Prepared detailed project proposals (technical and financial)
Component 3: Pilot demonstration of energy efficiency technologies and measures Outcome 3 Increased confidence in the application of piloted EE technologies and practices in the IRS
Number of energy audits conducted in IRS units above 0.5 MW load by year 3
• NA 50 • Energy audit reports • Project progress reports • Project reports on
implemented EE measures
• Energy bills • Documentation on
demonstration project design and financial closure and/or budget allocation
• Project progress reports
• The developed countries agree to share the information on technology
• Transfer of technology is negotiated.
• Prioritization is identified by a competent team / energy managers / auditors
• An interaction is established with developed countries to absorb the technologies on IR
• Resources are mobilized in time
Number of pilot demonstrations designed and implemented by year 3
• NA • At least 831
Total energy savings achieved from pilot projects by EOP, million kWh
• 0 • 30.40
30 A Project is defined as the implementation of defined technology in a specific location. The target is given assuming that all the 5 identified technologies (ref. Box 4) are implemented across the 9 Railway zones 31 Pilot/demo activities implemented and audited per selected technology (as in indicated in Box 5 and Annex D)

43
Strategy Objectively Verifiable Indicators Means of Gauging
Success/Source of verification
Assumptions Indicator Baseline Targets
Percentage of successful pilot demonstrations adopted by IRS for replication by EOP, %
• NA • At least 25%32
• Budget report to verify funds allocated for implementation of successful projects
• Efficient and quality measurement & recording systems are available for measurement
Based on energy audits, number of EE technologies and measures identified as feasible for implementation (planned and budgeted) by year 3
• NA • At least 533 • Documentation on demonstration project design and financial closure and/or budget allocation
• Project implementation progress reports
32 For replication by the end of the project and initiated 33 Pilots design for implementation as per selected technology and/or measure (as in indicated in Box 4 and Annex D)

44
Component 4: Information and knowledge sharing Outcome 4 Information and knowledge on EE technologies and measures are widely available and accessible for IRS divisions and their affiliates
Average number of visitors visiting the web portal each year starting year 2
• NA • 24,000 • Web portal counter
• Captured all the information, updated knowledge and documented the results
• The web portal is created and operational
• TIRFAD is created and operational
Number of sets of knowledge sharing products (KSPs) developed and disseminated by EOP
• NA • 1334 • Annual report
Number of awareness campaigns conducted per division per year starting year 3
• 0 • 55235 • Annual report
Number of IRS divisions that are actively participating in IRS EE programs by EOP
• 0 • 68 • Annual report at the divisional level
Number of vendors registering with TIRFAD each year starting year 3 (i.e. from 2013)
• NA • About 336 • TIRFAD registration log
Cumulative number of vendors attending TIRFAD campaigns by the EOP
• 0 • At least 3937
34 At least one leaflet/booklet for each technology or a measure that will be demonstrated will be produced. This information is included in a regular (project) newsletter and also uploaded onto the web. 35 At least 2 campaigns per division per year conducted by the end of the project (i.e. 68 divisions + 16 zonal headquarters + 1 railways + IRIEEN + IDSO + 5 production units x 3 years) over 16 zonal headquarters 36 Per successful pilot technology register with TIRFAD
37 At least three vendors per technology (13 numbers)
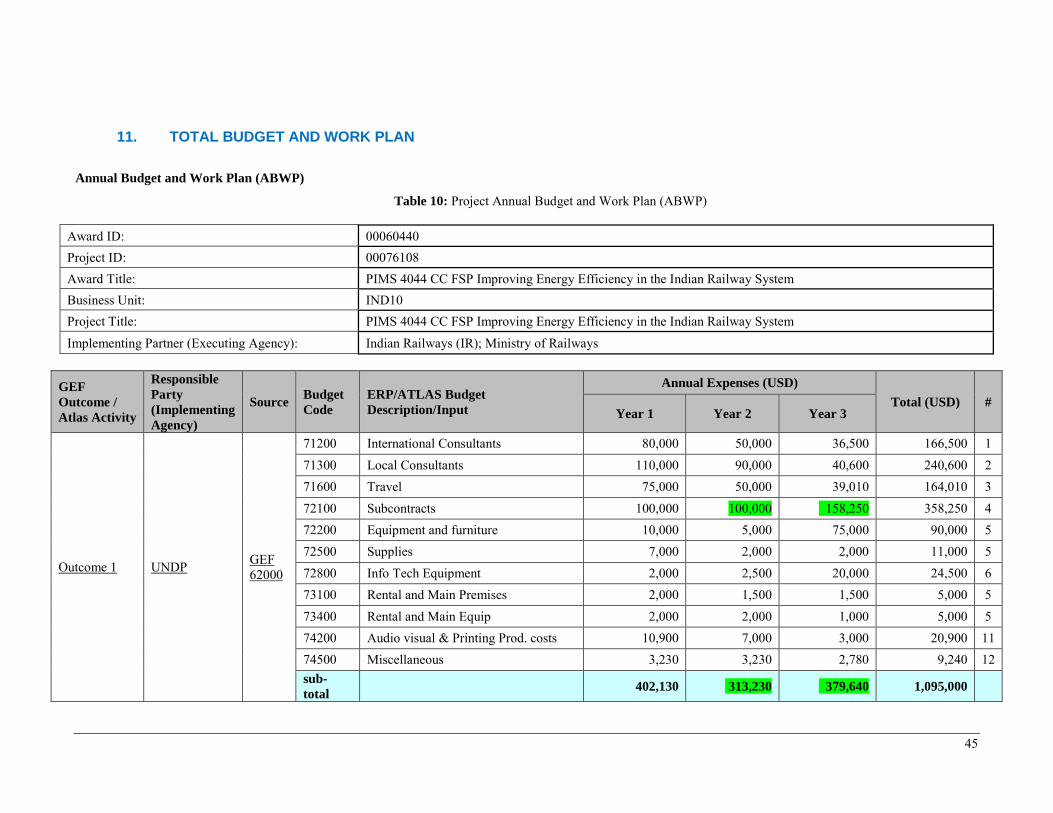
45
11. TOTAL BUDGET AND WORK PLAN
Annual Budget and Work Plan (ABWP)
Table 10: Project Annual Budget and Work Plan (ABWP)
Award ID: 00060440 Project ID: 00076108 Award Title: PIMS 4044 CC FSP Improving Energy Efficiency in the Indian Railway System Business Unit: IND10 Project Title: PIMS 4044 CC FSP Improving Energy Efficiency in the Indian Railway System
Implementing Partner (Executing Agency): Indian Railways (IR); Ministry of Railways
GEF Outcome / Atlas Activity
Responsible Party (Implementing Agency)
Source Budget Code
ERP/ATLAS Budget Description/Input
Annual Expenses (USD)
Total (USD) # Year 1 Year 2 Year 3
Outcome 1 UNDP GEF 62000
71200 International Consultants 80,000 50,000 36,500 166,500 1 71300 Local Consultants 110,000 90,000 40,600 240,600 2 71600 Travel 75,000 50,000 39,010 164,010 3 72100 Subcontracts 100,000 100,000 158,250 358,250 4 72200 Equipment and furniture 10,000 5,000 75,000 90,000 5 72500 Supplies 7,000 2,000 2,000 11,000 5 72800 Info Tech Equipment 2,000 2,500 20,000 24,500 6 73100 Rental and Main Premises 2,000 1,500 1,500 5,000 5 73400 Rental and Main Equip 2,000 2,000 1,000 5,000 5 74200 Audio visual & Printing Prod. costs 10,900 7,000 3,000 20,900 11 74500 Miscellaneous 3,230 3,230 2,780 9,240 12 sub-total
402,130 313,230 379,640 1,095,000

46
GEF Outcome / Atlas Activity
Responsible Party (Implementing Agency)
Source Budget Code
ERP/ATLAS Budget Description/Input
Annual Expenses (USD)
Total (USD) # Year 1 Year 2 Year 3
Outcome 2 UNDP GEF 62000
71200 International Consultants 75,000 200,000 88,000 363,000 7 71300 Local Consultants 90,000 275,000 103,500 468,500 8 71600 Travel 35,000 90,000 30,750 155,750 3 72100 Subcontracts 35,000 75,000 171,250 281,250 9 72200 Equipment and furniture 100,000 100,000 83,000 283,000 10 72500 Supplies 2,000 1,750 7,000 10,750 5 72800 Info Tech Equipment 1,000 750 250 2,000 6 73100 Rental and Main Premises 250 500 250 1,000 5 73400 Rental and Main Equip 400 400 450 1,250 5 74200 Audio visual & Printing Prod. costs 1,000 2,000 1,100 4,100 11 74500 Miscellaneous 1,000 1,000 900 2,900 12 sub-total
340,650 746,400 486,450 1,573,500
Outcome 3: UNDP GEF 62000
71200 International Consultants 20,000 100,000 67,500 187,500 13 71300 Local Consultants 30,000 140,000 147,025 317,025 14 71600 Travel 10,000 50,000 27,952 87,952 3 72100 Subcontracts 250,000 374,250 624,250 15 72200 Equipment and furniture 10,000 20,000 20,000 50,000 16 72500 Supplies 5,000 3,000 4,000 12,000 5 73100 Rental and Main Premises 1,000 1,000 1,000 3,000 5 74200 Audio visual & Printing Prod. costs 500 1,500 2,100 4,100 5 74500 Miscellaneous 2,000 1,500 673 4,173 12 sub-total
78,500 567,000 644,500 1,290,000
Outcome 4: UNDP GEF 62000
71200 International Consultants 90,000 45,000 64,500 199,500 17 71300 Local Consultants 100,000 64,525 100,000 264,525 18

47
GEF Outcome / Atlas Activity
Responsible Party (Implementing Agency)
Source Budget Code
ERP/ATLAS Budget Description/Input
Annual Expenses (USD)
Total (USD) # Year 1 Year 2 Year 3
71600 Travel 38,853 25,000 47,449 111,302 3 72100 Subcontracts 85,000 100,000 143,500 328,500 19 72200 Equipment and furniture 5,000 2,500 2,500 10,000 5 72500 Supplies 500 250 250 1,000 5 73100 Rental and Main Premises 1,000 500 500 2,000 5 73400 Rental and Main Equip 2,000 1,000 2,000 5,000 5 74100 Professional Services 4,000 4,000 4,000 12,000 20 74200 Audio visual & Printing Prod. costs 3,500 2,000 3,700 9,200 11 74500 Miscellaneous 4,000 2,000 973 6,973 12 sub-total
333,853 246,775 369,372 950,000
Project Management Unit
UNDP GEF 62000
71400 Contractual Services-Individuals 81,083 81,083 81,084 243,250 21 71600 Travel 10,000 7,500 4,372 21,872 72200 Equipment and furniture 5,000 5,000 3,000 13,000 72500 Supplies 2,000 2,000 2,000 6,000
74200 Printing and audiovisuals 3,285 2,500 1,593 7,378
74500 Miscellaneous - - - -
Sub-total 101,368 98,083 92,049 291,500
TOTAL 1,256,501 1,971,488 1,972,011 5,200,000
General notes to the budget: • International consultants (IC) are budgeted at USD 3,000 per week, senior national consultants (NC) are budgeted at USD 550 per week and junior consultants at
USD 375 per week • The cost of workshops has been divided of various budget lines as per UNDP ATLAS budget which does not have a separate budget line for training/ workshops.
For example, budget line ‘international consultant’ will have a % allocation for international experts to support workshops. The number of workshops for each output is given in the ‘results framework’. A workshop will cost about USD 2,500 per day.

48
Specific notes (the numbers correspond to the last column of Table 10): 1. 56 person/weeks of international expertise for capacity assessment analysis, development of training and imparting training and other events (workshops, seminars) 2. 483 person/weeks of local short-term consultancy on traction, non-traction and energy efficiency for institutional capacity development and training 3. Travel cost (DSA and ticket) is budgeted at 30% of international consultant’s fee and 10% of national consultant’s fee as a general rule-of thumb 4. Subcontracts with companies for organization of workshops training events and study tours as well as website design 5. Equipment, rental premises, rental equipment for workshop and event organization; 6. Info tech equipment, includes software acquisition for training purposes 7. 121 person/weeks of international expertise) for assessment of technology status and implementation of EE technology in measures in traction and non-traction 8. 864 person/weeks of local short-term consultancy for assessment of technology status and implementation of EE technology in measures in traction and non-
traction as well as related on-the-job training 9. Subcontracts with companies for energy audits, and technical assistance during assessment and implementation of EE measures in traction and on-traction (see Box
4) 10. Equipment, rental premises, rental equipment for workshop and event organization; and instrumentation for EE measures assessment 11. Printing and reproduction cost of workshop papers and proceedings and training materials as well as printing of project technical reports (assessments, feasibility
analysis, investment proposals, technical studies, etc.) 12. Miscellaneous is for unforeseen expenses that are difficult to anticipate 13. 63 person/weeks of international expertise) for assessment and implementation of pilot demonstration activities 14. 617 person/weeks of local short-term consultancy to assist in the implementation of EE pilot projects 15. Subcontracts for technical assistance in the implementation of pilot projects as detailed in Box 5 16. Equipment, rental premises, rental equipment for workshop and event organization; and instrumentation for EE measures assessment 17. 67 person/weeks of international expertise) to support baseline, end-of-project impact and evaluation studies 18. 551 person/weeks of to support baseline, end-of-project impact and evaluation studies as well as supporting TIRFAD in info dissemination 19. Subcontracts to conduct baseline and end-of-project impact study 20. Professional services for annual financial auditing 21. Project management, as detailed in Table 14

Table 11: Summary of Funds (GEF and co-financing)
Donor Year 1 Year 2 Year 3 Total
GEF 1,256,501 1,971,488 1,972,011 5,200,000 Indian Railways 7,000,000 7,000,000 7,000,000 21,000,000 Total 8,256,501 8,971,488 8,972,011 26,200,000
Table 12: Budget per Project Component and Major Budget Items
Category USD Components
1 2 3 4 5
International experts 916,500 166,500 363,000 187,500 199,500 -
National consultants 1,533,900 240,600 468,500 317,025 264,525 243,250
Travel 540,886 164,010 155,750 87,952 111,302 21,872
Subcontracts 1,592,250 358,250 281,250 624,250 328,500 -
Equipment 446,000 90,000 283,000 50,000 10,000 13,000 Supplies and rental premises and equipment 89,500 45,500 15,000 15,000 8,000 6,000
Printing and audiovisuals 45,678 20,900 4,100 4,100 9,200 7,378
Professional services 12,000 - - - 12,000 -
Miscellaneous 23,286 9,240 2,900 4,173 6,973 - Total 5,200,000 1,095,000 1,573,000 1,290,000 950,000 291,500
Table 13A: Co-financing Details
Outcome GEF (USD) Co-fin (USD) Cash (USD)
In-kind (USED) Total (USD)
1 Institutional capacity development and technical training
1,095,000 600,000 500,000 100,000 1,695,000
2 Implementation of proven EE technologies and measures
1,573,500 12,835,750 12,700,000 135,750 14,409,250
3 Pilot demonstration of EE technologies and measure38
1,290,000 6,035,750 5,800,000 235,750 7,325,750
4 Knowledge sharing and learning 950,000 350,000 250,000 100,000 1,300,000
5 Project management 291,500 1,178,500 750,000 428,500 1,470,000 Total 5,200,000 21,000,000 20,000,000 1,000,000 26,200,000
Note: Co-financing of Outcome 2 includes investment in ‘proven’ EE technologies and measures of USD 12,659,574. Co-financing of Outcome 3 includes investment in pilot and demonstrations of USD 5,297,872
38 This includes conducting energy audit and implementing energy audit recommendations. The recommendations (ECO/EEI) will be coming from the energy audits which are not known yet. Therefore the budget allocated tentatively is US$ 212,766.

50
Table 13.B shows the breakdown of the project management costs for this project.
Table 13.B: Project Management Costs
Budget Items Person weeks
GEF Amount
($)
Co-financing
($)
Project Total ($)
Local consultants and staff 275 243,250 861,650 1,104,900 Office facilities, equipment 26,378 131,197 157,575 Travel 21,872 185,653 207,525
Total
291,500 1,178,500 1,470,000
12. MANAGEMENT ARRANGEMENTS
12.1 Project organization structure
87. The project will be implemented by the Indian Railways under the Ministry of Railways. IR will assume the overall responsibility for the achievement of the project results as the Implementing Partner. The project is co-financed with funding from the GEF fund and UNDP acts as the GEF Executing Agency. UNDP provides overall management and guidance from its New Delhi Country Office and the Asia Pacific Regional Centre (APRC) in Bangkok, and is responsible for monitoring and evaluation of the project as per normal GEF and UNDP requirements. Indian Railways (IR) will designate a senior official as the National Project Director (NPD) for the project (usually an official with the rank of ‘Joint Secretary’ level or above). The NPD will be responsible for overall guidance to project management, including adherence to the work plan and achievement of planned results, and for the use of UNDP funds through effective management and well established project review and oversight mechanisms. The NPD also will ensure coordination with various government ministries and agencies provide guidance to the project team, to coordinate with UNDP, to review reports and to look after administrative arrangements required under the Government of India and UNDP.
88. A Project Management unit (PMU) shall be established to implement the project. Under the overall responsibility of the NPD, the PMU shall be responsible for implementing day-to-day activities headed by the National Project Coordinator (NPC). Efforts shall be made to mobilise the project team for the full project tenure to ensure the availability of experts and consultants until the end of project. The project manager (PM) will be supported by administration and finance staff, and Project Managers for Traction (TR), Non-Traction (NT) and Energy Efficiency (EE). As needed, adequate numbers of technical experts in different disciplines and project management consultants with expertise in project, finance, legal matters, etc. will be associated on both longer-term and short-term time basis depending upon the work load. The job description and ToRs for the PMU positions and assignments are enclosed in Annex C. Rites Ltd has entered in agreement with IR to provide support for the preparation of the project during the PPG stage with provisions to extend the support for project management and provision of consultancy services during the FSP stage, but only if ratified by the PSC.
89. The Project Steering Committee (PSC) is responsible for making management decisions for a project in particular when guidance is required by the NPC. The PSC plays a critical role in project monitoring and evaluations by quality assuring these processes and products, and using evaluations for performance improvement, accountability and learning. It ensures that required resources are committed and arbitrates on any conflicts within the project or negotiates a solution to any problems with external bodies. Indian Railways will sign the budgeted Annual Work Plan (AWP) with UNDP on an annual basis, as per UNDP rules and regulations. Based on the approved AWP, the PSC will consider and approve the quarterly plans and also approve any essential deviations from the original plans.
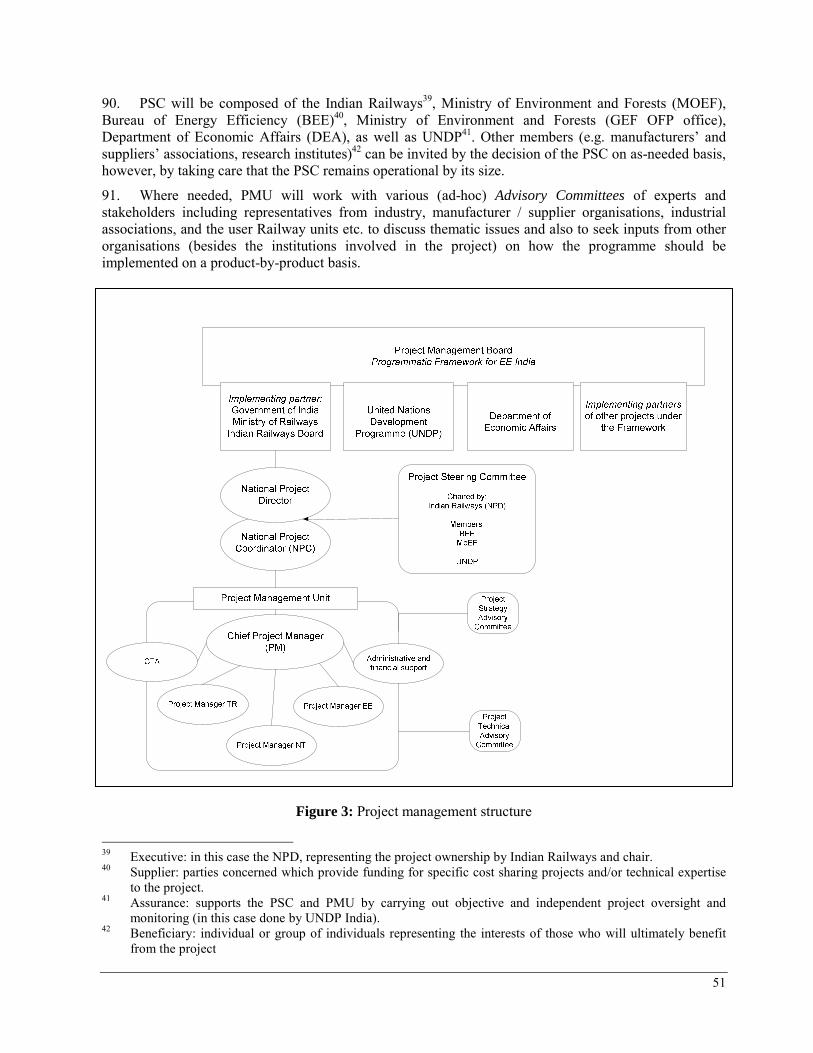
51
90. PSC will be composed of the Indian Railways39, Ministry of Environment and Forests (MOEF), Bureau of Energy Efficiency (BEE)40, Ministry of Environment and Forests (GEF OFP office), Department of Economic Affairs (DEA), as well as UNDP41. Other members (e.g. manufacturers’ and suppliers’ associations, research institutes)42 can be invited by the decision of the PSC on as-needed basis, however, by taking care that the PSC remains operational by its size.
91. Where needed, PMU will work with various (ad-hoc) Advisory Committees of experts and stakeholders including representatives from industry, manufacturer / supplier organisations, industrial associations, and the user Railway units etc. to discuss thematic issues and also to seek inputs from other organisations (besides the institutions involved in the project) on how the programme should be implemented on a product-by-product basis.
Figure 3: Project management structure
39 Executive: in this case the NPD, representing the project ownership by Indian Railways and chair. 40 Supplier: parties concerned which provide funding for specific cost sharing projects and/or technical expertise
to the project. 41 Assurance: supports the PSC and PMU by carrying out objective and independent project oversight and
monitoring (in this case done by UNDP India). 42 Beneficiary: individual or group of individuals representing the interests of those who will ultimately benefit
from the project

52
12.2 UNDP support service
92. Railways may enter into an agreement with UNDP for support services in the form of procurement of goods and services during the project implementation process43. In such a case, appropriate cost recovery will be charged as per UNDP rules and regulations. The support services will be outlined in the form of Letter of Agreement signed between IR and UNDP. UNDP India may assume the role of project assurance, providing independent project oversight, carrying out monitoring functions and ensuring project implementation. It will support project implementation by disbursing project funds on a regular basis. It will also monitor project implementation through Project Implementation Reports (PIRs) and mid-term and final evaluations.
12.3 Collaborative arrangements with related projects
93. The proposed project is closely related to the framework programme of “Supporting National Development Objectives with Co-Benefits of Mitigation Climate Change” with the following specific outputs:
• Energy efficiency improvements in selected energy-intensive sectors • Framework developed for inclusive planning and delivery of clean energy services • Strategic partnerships to leverage environmental financing • Knowledge sharing and inputs provided for environmental and climate policy regimes
94. The indicative GEF budget is USD 5.2 million for the period 2011-2014 (three-year period) with expected co-financing of USD 21 million. Regarding the energy efficiency output, co-financing is sought from the GEF, and for this purpose and overall “Programmatic Framework Project for Energy Efficiency in India” (GEF project 3538). Five projects on energy efficiency are proposed under this programme: (i) Energy Efficiency Improvements in commercial Buildings (UNDP); (ii) Chillers Energy Efficiency Project (World Bank); (iii) Financing Energy Efficiency in Small and Medium Enterprises (World Bank); (iv) Promoting Energy Efficiency and Renewable Energy in Selected SME Clusters in India (UNIDO); and, (v) Improving Energy Efficiency in the Indian Railways System (UNDP).
95. The proposed project will establish the necessary communication and coordination mechanisms through its PMU and PSC with the Project Management Board of the “before-mentioned framework programmes to ensure proper coordination between the various projects under the GEF “Programmatic Framework for EE” umbrella programme on energy efficiency. UNDP India will also take the lead ensuring adequate coordination and exchange of experiences. In addition, the project will seek to coordinate its actions with other UNDP energy and climate change activities in India. Similarities in the strategy of the proposed project may extend an opportunity to share lessons and exploit synergies, in particular in the areas of harmonization and mutual recognition.
12.4 Prior obligations and prerequisites
96. There are no prior obligations or prerequisites that been identified
12.5 Brief description of inputs to be provided
97. The tentative GEF-supported budget of the Project Management Unit (PMU) is given below:
Table 14: GEF-supported budget of the Project Management Unit (PMU)
43 Whenever labeled products exist, public procurement of energy efficient goods (appliances/equipments) would
include star labeled products.

53
PM Budget Item GEF
Budget (USD)
Remarks
National Project Coordinator (NPC) with a total of 93 person weeks (pw) @ USD 950/pw
88,350
• Assist NPD in the preparation of the project execution scheme/work plan; • Support the NPD, in the provision of guidance in the organization and
implementation of all activities specified in the project document and ensuring timely completion;
• Responsible for day-to-day planning, operation and monitoring project activities; • Provision of substantive inputs on project implementation results and issues to the
NPD, consultants and stakeholders; • Organization and coordination of project meetings (across Division and Zones),
workshops and other expected deliverables from the Project; • Responsibility for the monitoring of overall project implementation, project
review and facilitate independent project mid-term and terminal review; • Coordination of financial auditing of the project according to the standards and
rules established by UNDP and prepare work plans, reports, budgets, and terms of reference for sub-contractors and consultants;
• Liaison with Indian Railways units, equipment and technology providers, national R&D institutions, test laboratories and technology institutes of the project and promote exchanges of information among project participants;
• Review of drafts of any working documents to be submitted to meetings or emanating from project activities, and communicate comments to consultants;
• Represent the project at forums and meetings.
Project Manager, TR with a total of 37 person weeks (pw) @ USD 950/pw
35,150
• Support the planning and monitoring of “rolling stock” and “Traction distribution” related railway operation activities;
• Review and provide comments on outputs pertain to traction; • Assistance in the formulation of TORs and activity descriptions where needed; • Provision of substantive inputs on project activity implementation to the expert
consultants and stakeholders. Project Manager, NT with a total of 37 person weeks (pw) @ USD 950/pw
35,150
• Support the planning and monitoring of non-traction related activities & services; • Review and provide comments on outputs pertain to non-traction; • Assistance in the formulation of TORs and activity descriptions where needed; • Provision of substantive inputs on project activity implementation to the expert
consultants and stakeholders. Project Manager, EE with a total of 63 person weeks (pw) @ USD 950/pw
59,850
• Support for the planning, implementation, monitoring and reporting of energy efficiency related activities such as energy audits, awareness creation, training and capacity building;
• Assistance in the formulation of TORs and activity descriptions where needed
Office manager (F&A) with a total of 45 person weeks (pw) @ USD 550/pw
24,750
• Responsible for administrative and secretarial matters; • Perform project-related communication and liaison work: arrangement of
logistics, including travel and organization of meetings/workshops; • Make annual budget and review its implementation, making adjustment
correspondingly; • Carry out and manage the project contract payments; • Conduct annual financial audit of the project in line with the UNDP, produce the
required statements as needed, keep checks and balances in place to ensure proper use of finances under various heads and report the financial progress;
• Assist processing and reporting project incomes and expenditures.
Travel (in-country) 21,872 • Travel expenses of the Project Coordinator and the project managers for their
project monitoring work in the different project sites under the various Zones and Divisions of IR.
Office facilities, equipment
26,378
• Cost of office space rental for the PMO. • Equipment such as computers and their peripherals, document reproduction
equipment as well as office supplies (e.g., stationeries) • Purchase and use of telecommunication equipment and the monthly payment for
the communication costs (e.g., phone bills, internet service fees, etc.). Total 291,500

54
98. Indian Railway (IR) is the single largest organization with the highest electricity consumption in India. With the aim of realizing the project objective, the project specifically targets traction and non-traction activities of IR. To realize the project objective, the PMU will have an enormous task of properly managing and coordinating the project activities. The PMU shall coordinate with IR’s six production units that are engaged in the manufacturing of rolling stock, wheels and axles and other ancillary components to properly direct and manage the project activities. In this regard, the PMU must have specific skill set of project managers and office staff that will oversee the implementation of these specific project activities in 16 Zones of Indian Railways and are further subdivided into 68 Divisions. These Zones and Divisions are spread across India and needs extensive travelling of PMU staff in order to coordinate and manage the project activities. Considering the required additional project management personnel and PMU officers/staff members, and based on the estimated person-weeks for each type of PMU staff, the estimated cost for such local consultants and staff is US$ 243,250. IR will provide the other staff members that will be assigned to carry out project management tasks in the various Zones and Divisions of Indian Railways. The cost for such personnel amounts to US$ 861,650.
99. As part of the PM work, office facilities such as computers and their peripherals, document reproduction equipment as well as office supplies (e.g., stationeries) are required. The proposed budget for office facilities and equipment also includes the purchase and use of telecommunication equipment and the monthly payment for the communication costs (e.g., phone bills, internet service fees, etc.). The cost of office space rental for the PMO is also part of this PM budget line item. The co-financing for this budget line item, which is about the same as the GEF contribution, includes the in-kind contribution for office space and office equipment, as well as testing facilities, for project activities that will be hosted by the various Zones and Divisions of Indian Railways.
100. The travel budget to be paid for by GEF funds, which is about 11% of the total travel budget for project management, is for the travel expenses of the Project Coordinator and the project managers for their project monitoring work in the different project sites under the various Zones and Divisions of Indian Railways. The counterpart financing for the travel budget, includes the travel costs of various IR staff members who will be involved in the project implementation, including in-kind contribution for the utilization of Indian Railways transport services during monitoring missions.
101. The management of the proposed project will entail the deployment of personnel and office facilities, equipment and supplies described above, as well as travel for the project management staff. With the abovementioned project management requirements, a total of about US$ 291,500 is needed and is being requested from the GEF. This is 6% of the total GEF contribution to the proposed project. The total co-financing for the PM activities amounts to US$ 1,178,500, which is about 80% of the estimated total PM cost of US$ 1.47 million.
12.6 Audit arrangements
102. The Government will provide the Resident Representative with certified periodic financial statements, and with an annual audit of the financial statements relating to the status of UNDP (including GEF) funds according to the established procedures set out in the programming and finance manuals. The audit will be conducted by the legally recognized auditor of the Government, or by a commercial auditor engaged by the Government.

55
12.7 Agreement on the intellectual property rights and use of logo on the project’s deliverables
103. In order to accord proper acknowledgement to GEF for providing funding, a GEF logo should appear on all relevant GEF-supported project publications, including among others, project hardware, if any, purchased with GEF funds. Any citation on publications regarding projects funded by GEF should also accord proper acknowledgement to GEF. Alongside GEF and UNDP logo, Government of India or the Ministry of Railways logo may also feature as the Implementing Partner of the proposed project.
13. MONITORING FRAMEWORK AND EVALUATION
13.1 Project start
104. A Project Inception Workshop will be held within the first two months of project start with those with assigned roles in the project organization structure, UNDP country office (CO) and where appropriate/feasible regional technical policy and programme advisors as well as other stakeholders. The Inception Workshop is crucial to building ownership for the project results and to plan the first year annual work plan. The Inception Workshop should address a number of key issues including:
• Understand objectives & other outputs and activities • Assist all partners to fully understand and take ownership of the project. Detail the roles, support
services and complementary responsibilities of UNDP CO and Asia Pacific Regional Centre (APRC) staff vis-à-vis the project team. Discuss the roles, functions, and responsibilities within the project's decision-making structures, including reporting and communication lines, and conflict resolution mechanisms. The Terms of Reference for project staff will be discussed again as needed.
• Based on the project results framework and the relevant GEF tracking tools, if appropriate, finalize the first Annual Work Plan (AWP). Review and agree on the indicators, targets and their means of verification, and recheck assumptions and risks.
• Provide a detailed overview of reporting, monitoring and evaluation (M&E) requirements. The Monitoring and Evaluation work plan and budget should be agreed and scheduled.
• Discuss financial reporting procedures and obligations, and arrangements for annual audit. • Plan and schedule meetings of the Project Steering Committee (PSC). Roles and responsibilities
of all project organization structures should be clarified and meetings planned. The first Project Board meeting should be held within the first 12 months following the inception workshop.
105. An Inception Workshop report is a key reference document and must be prepared and shared with participants to formalize various agreements and plans decided during the meeting.
13.2 Quarterly review
106. Will consist of:
• Progress made shall be monitored in the UNDP Enhanced Results Based Management Platform. • Based on the initial risk analysis submitted, the risk log shall be regularly updated in ATLAS.
Risks become critical when the impact and probability are high. Based on the information recorded in Atlas, a Project Progress Reports (PPR) can be generated in the Executive Snapshot.
• Other ATLAS logs can be used to monitor issues, lessons learned, etc. The use of these functions is a key indicator in the UNDP Executive Balanced Scorecard.

56
13.3 Annual review
107. Annual Project Review/Project Implementation Reports (APR/PIR): These key reports are prepared to monitor progress made since project start and in particular for the previous reporting period (30 June to 1 July). The APR/PIR combines both UNDP and GEF reporting requirements. The APR/PIR includes, but is not limited to, reporting on the following:
• Progress made toward project objective and project outcomes - each with indicators, baseline data and end-of-project targets (cumulative);
• Project outputs delivered per project outcome (annual); • Lesson learned/good practice; • AWP and other expenditure reports; • Risk and adaptive management; • ATLAS quarterly progress reports (QPR); • Portfolio level indicators (i.e. GEF focal area tracking tools) are used by most focal areas on an
annual basis as well.
108. UNDP CO and the UNDP APRC will conduct visits to project sites based on the agreed schedule in the project's Inception Report/Annual Work Plan to assess first hand project progress. Other members of the PSC may also join these visits. A Field Visit Report will be prepared by the CO and UNDP APRC and will be circulated no less than one month after the visit to the project team and Project Board members.
Table 15: Elements and cost of monitoring and evaluation (M&E)
Type of M&E activity Responsible Parties Budget USD
Excluding project team staff time
Time frame
Inception Workshop and Report
� Implementing Partner (National Project Director and National Project Coordinator)
� UNDP CO
Indicative cost: $10,000
Within first two months of project start up
Measurement of Means of Verification of project results (baseline and end-of-project impact studies)
� UNDP GEF RTA/ NPC will oversee the hiring of specific studies and institutions, and delegate responsibilities to relevant team members.
Indicative cost: $120,000
Start, mid and end of project (during evaluation cycle) and annually when required.
Measurement of Means of Verification for Project Progress on output and implementation
� Oversight by National Project Coordinator
� Project team
Indicative cost: $8,000 (To be determined more precisely) as part of the Annual Work Plan's preparation.
Annually prior to ARR/PIR and to the definition of annual work plans
APR/PIR � NPD, NPC and Project team � UNDP CO � UNDP RTA � UNDP EEG
Already included in the PMU cost
Annually
Periodic status/ progress reports
� NPD, NPC and Project team Already included in the PMU cost
Quarterly
Mid-term Evaluation � NPD, NPC � UNDP CO � UNDP RCU � External Consultants (i.e.
evaluation team)
Indicative cost: $25,000
At the mid-point of project implementation.
Final Evaluation � NPD, NPC Indicative cost : At least three months
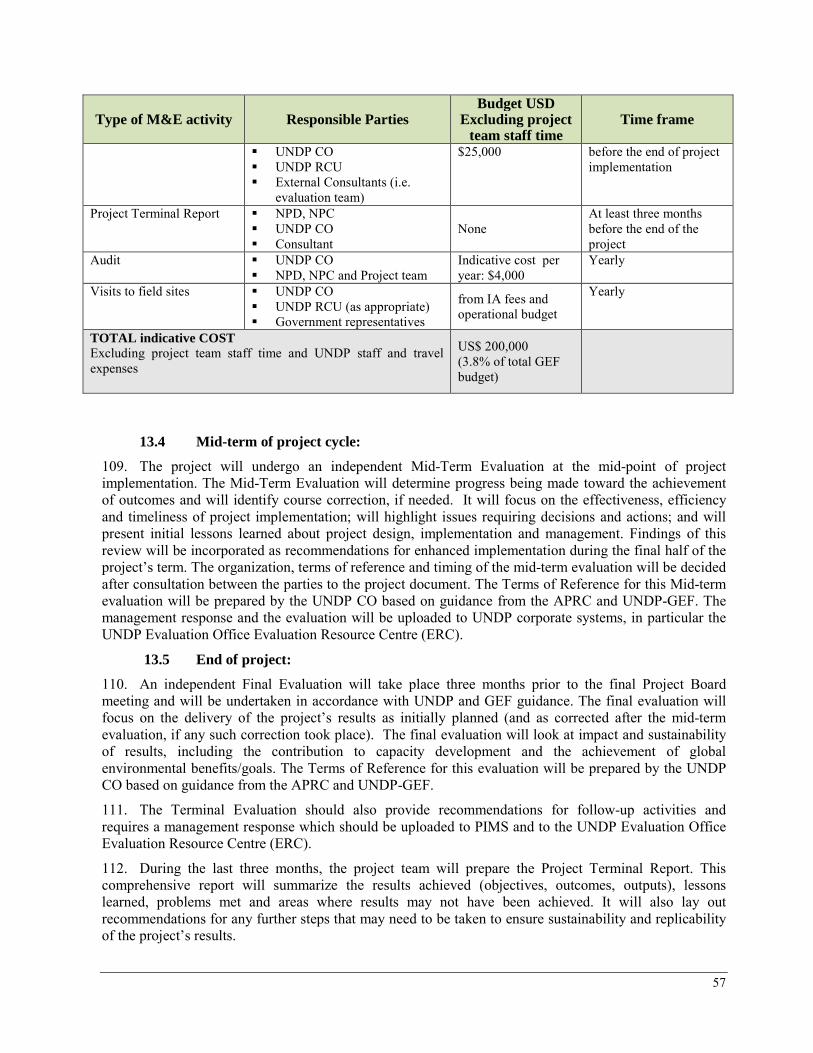
57
Type of M&E activity Responsible Parties Budget USD
Excluding project team staff time
Time frame
� UNDP CO � UNDP RCU � External Consultants (i.e.
evaluation team)
$25,000 before the end of project implementation
Project Terminal Report � NPD, NPC � UNDP CO � Consultant
None At least three months before the end of the project
Audit � UNDP CO � NPD, NPC and Project team
Indicative cost per year: $4,000
Yearly
Visits to field sites � UNDP CO � UNDP RCU (as appropriate) � Government representatives
from IA fees and operational budget
Yearly
TOTAL indicative COST Excluding project team staff time and UNDP staff and travel expenses
US$ 200,000 (3.8% of total GEF budget)
13.4 Mid-term of project cycle:
109. The project will undergo an independent Mid-Term Evaluation at the mid-point of project implementation. The Mid-Term Evaluation will determine progress being made toward the achievement of outcomes and will identify course correction, if needed. It will focus on the effectiveness, efficiency and timeliness of project implementation; will highlight issues requiring decisions and actions; and will present initial lessons learned about project design, implementation and management. Findings of this review will be incorporated as recommendations for enhanced implementation during the final half of the project’s term. The organization, terms of reference and timing of the mid-term evaluation will be decided after consultation between the parties to the project document. The Terms of Reference for this Mid-term evaluation will be prepared by the UNDP CO based on guidance from the APRC and UNDP-GEF. The management response and the evaluation will be uploaded to UNDP corporate systems, in particular the UNDP Evaluation Office Evaluation Resource Centre (ERC).
13.5 End of project:
110. An independent Final Evaluation will take place three months prior to the final Project Board meeting and will be undertaken in accordance with UNDP and GEF guidance. The final evaluation will focus on the delivery of the project’s results as initially planned (and as corrected after the mid-term evaluation, if any such correction took place). The final evaluation will look at impact and sustainability of results, including the contribution to capacity development and the achievement of global environmental benefits/goals. The Terms of Reference for this evaluation will be prepared by the UNDP CO based on guidance from the APRC and UNDP-GEF.
111. The Terminal Evaluation should also provide recommendations for follow-up activities and requires a management response which should be uploaded to PIMS and to the UNDP Evaluation Office Evaluation Resource Centre (ERC).
112. During the last three months, the project team will prepare the Project Terminal Report. This comprehensive report will summarize the results achieved (objectives, outcomes, outputs), lessons learned, problems met and areas where results may not have been achieved. It will also lay out recommendations for any further steps that may need to be taken to ensure sustainability and replicability of the project’s results.

58
13.6 Learning and knowledge sharing
113. Results from the project will be disseminated within and beyond the project intervention zone through existing information sharing networks, forums and Information web portals including the TIRFAD.
114. The project will identify and participate, as relevant and appropriate, in scientific, policy-based and/or any other networks, which may be of benefit to project implementation though lessons learned. The project will identify, analyze, and share lessons learned that might be beneficial in the design and implementation of similar future projects.
115. Finally, there will be a two-way flow of information between this project and other projects of a similar focus.

59
14. LEGAL CONTEXT AND OTHER AGREEMENTS
116. This document together with the CPAP signed by the Government and UNDP, which is incorporated by reference, constitute together the instrument envisaged in the Supplemental Provisions to the Project Document. Consistent with the above Supplemental Provisions, the responsibility for the safety and security of the implementing partner and its personnel and property, and of UNDP’s property in the implementing partner’s custody, rests with the implementing partner.
117. The implementing partner shall:
• Put in place an appropriate security plan and maintain the security plan, taking into account the security situation in the country where the project is being carried;
• Assume all risks and liabilities related to the implementing partner’s security, and the full implementation of the security plan.
118. UNDP reserves the right to verify whether such a plan is in place, and to suggest modifications to the plan when necessary. Failure to maintain and implement an appropriate security plan as required hereunder shall be deemed a breach of this agreement.
119. The implementing partner agrees to undertake all reasonable efforts to ensure that none of the UNDP funds received pursuant to the Project Document are used to provide support to individuals or entities associated with terrorism and that the recipients of any amounts provided by UNDP hereunder do not appear on the list maintained by the Security Council Committee established pursuant to resolution 1267 (1999). This provision must be included in all sub-contracts or sub-agreements entered into under this Project Document. The list can be accessed via:
http://www.un.org/Docs/sc/committees/1267/1267ListEng.htm.

60
Part C. ANNEXES
ANNEX A: RISK ANALYSIS
ANNEX B: AGREEMENTS
ANNEX C: TERMS OF REFERENCE
ANNEX D: EMISSION REDUCTION CALCULATION
ANNEX E: ORGANISATIONAL SETUP OF RAILWAYS AND WEBSITES
ANNEX F: TRAINING AND CAPACITY BUILDING ACTIVITIES
ANNEX G: PROJECT ANNUAL TARGETS

ANNEX A. RISK ANALYSIS Table 16: Summary of Risk Log and counter measures
Project Title: Improving Energy Efficiency in the Indian Railways System Award ID:00057084 Date: April 2010
# Description Date identified Type
Impact & Probability - on a scale of 1 (low)
to 5 (high) Countermeasures / Management response Owner Submitted,
updated by
1 Failure to secure continuous support from planners in Indian Railways zonal, production and other units to the EE programme
30 April 2010
Operational Probability = 1
Impact = 5
• Zonal Railway and production units are governed by Indian Railways under the Ministry of Railways. The PMU is housed in IR and the PSC is headed by senior official in IR. Hence any non lack in commitment will be addressed through PSC and other channels.
• Commitment of stake holders IR, zonal / production Field units will be established during inception workshop and project implementation.
UNDP UNDP CO
2 Lack of manufacturers’ interest in investing for EE products
30 April 2010
Strategic Probability = 1
Impact = 5
• Project offers significant number of devices to create an interest in manufacturers.
• IR showcase the intent for larger scale replications of devices trailed through the project.
• BEE will play a key role in stimulating manufacturers’ interest in investing in EE products.
UNDP UNDP CO
3 Failure to trigger a positive response from technical staff on initiatives supporting EE programme
30 April 2010
Operational Probability = 3
Impact = 4
• The incentive programmes designed helps create adequate interest.
• IR being the Implementing Agency of the project will also make it obligatory to support the project activities
UNDP UNDP CO
4 Lack of effective coordination between IR units on initiatives supporting the EE programme
30 April 2010
Operational Probability = 2
Impact = 4
• PSC is chaired by senior official from IR and the PSC meetings are held at regular intervals. This helps in getting adequate support from different divisions.
UNDP UNDP CO
5 Willingness of IR managers to give priority to EE in investment decisions
30 April 2010
Strategic Probability = 2
Impact = 5
• A directive will be prepared and approved by the IR Board to support the project activities. UNDP UNDP CO

62
# Description Date identified Type
Impact & Probability - on a scale of 1 (low)
to 5 (high) Countermeasures / Management response Owner Submitted,
updated by
6 Competition from inefficient & cheap EE devices
30 April 2010
Financial Probability = 1
Impact = 2
• IR has committed co-financing for hardware interventions. Hence the project implementation is not likely to get affected.
• Minimum energy performance standards (MEPS) and energy benchmarking would be made basis for selecting the devices. This would be propagated through IR channels to the divisions.
UNDP UNDP CO
7 Devices chosen may become obsolete (particularly electronics segment devices)
30 April 2010
Strategic Probability = 2
Impact =4
• Firstly, Annual Maintenance Contract and other spare part supply guarantees will be carefully considered by the PMU with manufacturer so that the devices installed can run for a reasonable time.
• Secondly, PSC will take stock of the situation and recommend mid course correction (in choosing an alternate device to what has been proposed in the project) without changing the overall framework of project.
UNDP UNDP CO
8 Delays in implementing the measures 30 April 2010
Operational Probability = 4
Impact = 3
• IR has well structured top down system to carry out its operations. PMU is hosted in IR and the PSC is chaired by a senior official from IR. These systems are expected to ensure timely implementation of measures.
UNDP UNDP CO
9 Failure to get Centre of Excellence (COE) institutionalised with proper mandate
30 April 2010
Strategic Probability = 4
Impact = 4
• The institutionalisation of COE will start from year 2 itself to learn its adaptability in IR system. In Year 3, the same will be reviewed by PSC and steps to institutionalise it are strengthened.
UNDP UNDP CO
10 Lack of effective coordination between IR units and training institutes
30 April 2010
Operational Probability = 2
Impact =4
• Different training institutes and IR units are governed through IR, Ministry of Railways. The project PMU is hosted at IR which has organic linkages. Regular PSC will help coordinating the IR units and training to effectively carry out the project activities.
UNDP UNDP CO
11 Test laboratories do not find EE testing and certification sufficiently attractive
30 April 2010
Operational Probability = 1
Impact = 4
• Analyses made on most (except few) of the technologies/devices/measures indicate fast payback. Hence PMU will impress upon IR to get these testing and certification first as voluntary and
UNDP UNDP CO

63
# Description Date identified Type
Impact & Probability - on a scale of 1 (low)
to 5 (high) Countermeasures / Management response Owner Submitted,
updated by
then as mandatory based on project results.

ANNEX B. AGREEMENTS GEF PIF and GEF OFP Endorsement Letter Will be attached in a separate electronic file Co-financing letter (Indian Railways)
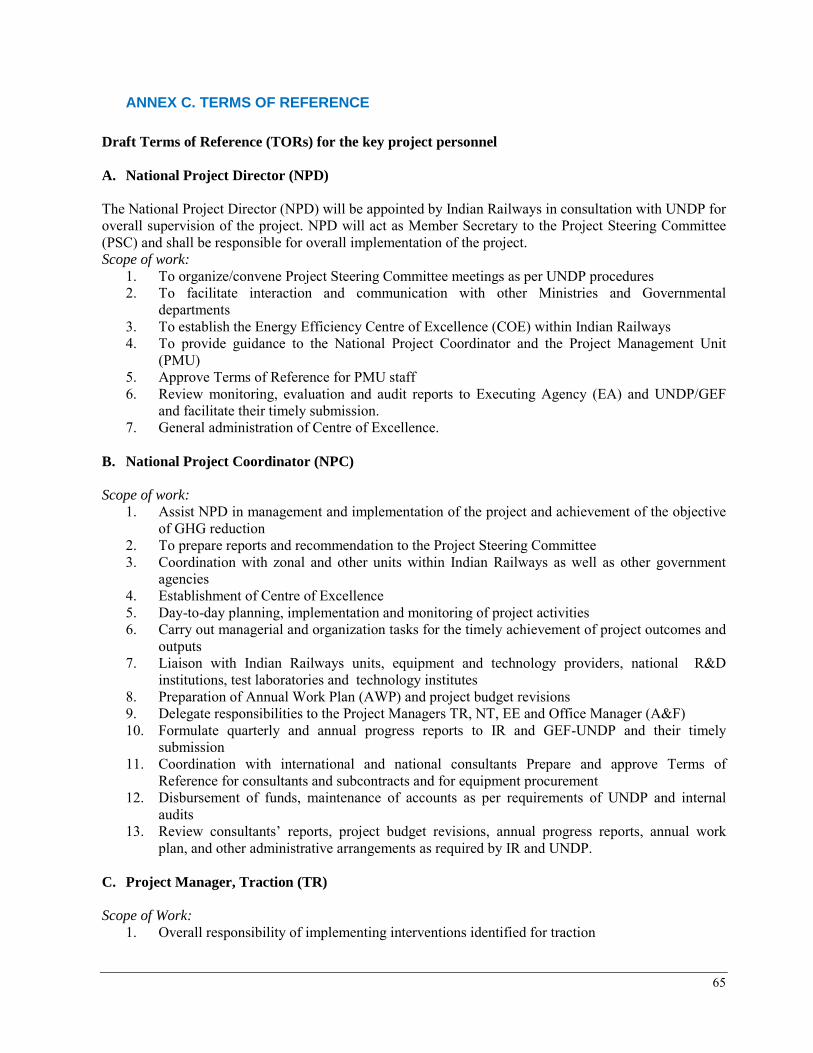
65
ANNEX C. TERMS OF REFERENCE Draft Terms of Reference (TORs) for the key project personnel A. National Project Director (NPD) The National Project Director (NPD) will be appointed by Indian Railways in consultation with UNDP for overall supervision of the project. NPD will act as Member Secretary to the Project Steering Committee (PSC) and shall be responsible for overall implementation of the project. Scope of work:
1. To organize/convene Project Steering Committee meetings as per UNDP procedures 2. To facilitate interaction and communication with other Ministries and Governmental
departments 3. To establish the Energy Efficiency Centre of Excellence (COE) within Indian Railways 4. To provide guidance to the National Project Coordinator and the Project Management Unit
(PMU) 5. Approve Terms of Reference for PMU staff 6. Review monitoring, evaluation and audit reports to Executing Agency (EA) and UNDP/GEF
and facilitate their timely submission. 7. General administration of Centre of Excellence.
B. National Project Coordinator (NPC) Scope of work:
1. Assist NPD in management and implementation of the project and achievement of the objective of GHG reduction
2. To prepare reports and recommendation to the Project Steering Committee 3. Coordination with zonal and other units within Indian Railways as well as other government
agencies 4. Establishment of Centre of Excellence 5. Day-to-day planning, implementation and monitoring of project activities 6. Carry out managerial and organization tasks for the timely achievement of project outcomes and
outputs 7. Liaison with Indian Railways units, equipment and technology providers, national R&D
institutions, test laboratories and technology institutes 8. Preparation of Annual Work Plan (AWP) and project budget revisions 9. Delegate responsibilities to the Project Managers TR, NT, EE and Office Manager (A&F) 10. Formulate quarterly and annual progress reports to IR and GEF-UNDP and their timely
submission 11. Coordination with international and national consultants Prepare and approve Terms of
Reference for consultants and subcontracts and for equipment procurement 12. Disbursement of funds, maintenance of accounts as per requirements of UNDP and internal
audits 13. Review consultants’ reports, project budget revisions, annual progress reports, annual work
plan, and other administrative arrangements as required by IR and UNDP. C. Project Manager, Traction (TR) Scope of Work:
1. Overall responsibility of implementing interventions identified for traction

66
2. Participate in preparation of AWP and prepare quarterly plan 3. Provide inputs to prepare quarterly and annual reports 4. Plan, implement, monitor and report project activities related to ‘rolling stock’ and ‘Traction
distribution’ identified in the project 5. Benchmark performance parameters, monitor energy savings and report on quarterly basis 6. Carryout cost-benefit analysis, economic, and environmental (benefits due to carbon dioxide
reduction) as outlined in indicators 7. Report to NPC and extend support to other managers as and when required.
D. Project Manager, Non-Traction Services (NT) Scope of work:
1. Overall responsibility of implementing interventions in non traction 2. Participate in preparation of AWP and quarterly work plans 3. Provide inputs to prepare quarterly and annual reports 4. Plan, implement, monitor and report project activities related to non traction related
interventions a. Benchmark performance parameters, monitor energy savings and report it quarterly basis b. Carryout cost benefit analysis, economic and environmental (benefits due to carbon dioxide
reduction) as outlined in indicators 5. Report to NPC and extend support to other managers as and when required in consultation with
NPC.
E. Project Manager, Energy Efficiency and Training Scope of work:
1. Overall responsibility of implementing energy efficiency related activities such as energy audits, awareness creation, training and capacity building
2. Participate in preparation of AWP and quarterly work plans 3. Provide inputs to prepare quarterly and annual progress reports 4. Plan, implement, monitor and report project activities as outlined in point 1. 5. Synergise the implementation of EE in Indian Railways in BAU with the project activities 6. Liaise the awareness, training and capacity building activities for different target groups of IR 7. Identify the technologies to be learnt from abroad and implemented in IR 8. Benchmark the energy performance 9. Report overall benefits of energy savings and CO2 emission.
F. Office Manager, Administration & Finance Scope of work:
1. Maintenance of accounts, inventory, assets register, and other requirements of GEF-UNDP and IR
2. Timely preparation and submission of quarterly FACE (Funding Authorisation and Certificate of Expenditure) to account for expenditure GEF-UNDP and as required by IR,
3. Facilitate annual financial audit of the project, prepare management responses to audit observations and carry out follow up action for GEF-UNDP and IR
4. Exercise financial due diligence in expenditure 5. Arrange logistics for travel (national and international), meetings, workshops
A detailed list of International and National Consultants for Technical Assistance activities is annexed to the GEF CEO Endorsement Request sheet.

67
ANNEX D. EMISSION REDUCTION CALCULATION
120. This Annex presents the assessment of the CO2 emissions that are avoided as a consequence of the project’s interventions. The assessment has been done in accordance with the GEF Manual for calculating CO2 emission reduction44. It describes the calculation of direct and indirect emission reduction.
D.1 Direct emission reduction 121. As indicated in the Boxes 4 and 5 (in Section 6.2), IR will make investments during the project’s supervised implementation period (3 years) as part of the Outcomes 2 and 3.
122. Several energy efficiency technologies and measures that could potentially be introduced through the Energy Efficiency and Conservation Program, or whose adoption can be widened, have been identified during project preparation. These technologies and measures have been divided into four (traction and non-traction wise) categories:
(1) Technologies and measures that have already been tested in India (in the railways sector or in other sectors) but need a more widespread dissemination (traction and non-traction);
(2) Technologies and measures that have proven to be successful abroad, but have not yet been tested in India (traction and non-traction).
123. In order to select the energy efficiency technologies and measures to be implemented or tested through the project, each identified technology has been assessed against the following criteria (see Table 7 in Section 4.3)
• Rate of return • Easiness to implement • Number of departments involved for the implementation • Complementarity to existing knowledge within IR • Provenness in India or abroad/recommended by international bodies • Potential for absorption/replicability
The direct emission reduction is calculated based on the following formula and assumptions:
CO2 direct = E * L * C; where • C – CO2 emission factor: grid emission factors of 0.82 tCO2/MWh for grid • L – average useful lifetime of equipment: considering the fact that a range of technologies will be
demonstrated, which may have varying lifetimes, an average of 10 years has been assumed for the calculation; and
• E – annual energy saved, 142 million kWh in electrical energy is estimated to be saved annually through the implementation of measures (Outcome 2) and project demonstrations (Outcome 3), as detailed in the Tables 17 and 18 (and summarized in the Boxes 4 and 5)
Thus, applying the above formula separately to electricity and thermal energy savings, cumulative direct CO2 emission reductions over 10-year investment lifetime are estimate at: 44 Manual for Calculating GHG Benefits of GEF Projects: Energy Efficiency and Renewable Energy Projects,
GEF/C.33/Inf.18

68
142 million kWh * 0.82 kgCO2/kWh * 10 years = 1.17 million tCO2 Cost effectiveness
If we divide the GEF contribution (USD 5.2 million) by the combined direct and direct post-project emission reductions gives the corresponding unit abatement cost (UAC45) (i.e. GEF$ per tCO2) of USD 4.45/tCO2.
Table 17: Estimates of energy savings and direct emission reduction
(a) Traction and Rolling Stock
Technology/Device/Measure description Investment cost USD
Est. annual energy savings (million kWh per
year)
Est. annual CO2
reduction (tonnes/
year)
Already proven in India
Installation and operation of Automatic Switched Capacitor Bank to reduce electrical losses in Traction Sub Stations (ASCB for TSS)
Provision for Automatic switched Capacitors help correcting the power factor1 of electrical loads at Traction Sub Stations (TSS). All TSS at present have fixed capacitor banks to compensate Power Factor (PF) to save electricity losses in line. Due to fluctuating nature of traction demand, they are unable to optimally compensate the losses. Modern Automatic switched Capacitor Banks can compensate PF to 0.98 compared to PF of 0.85 achieved at TSS with older capacitor banks. (PF of 1 has minimum losses.)
(The power factor of an AC (alternating current) has relation to drawing of current and thereby electrical losses. Electrical load with low power factor draws more current than a load with high power factor for the same amount of useful power transferred. The higher currents increase the energy lost in the distribution system, and require higher size conductors, cables and other equipment. An Automatic switched capacitor corrects the Power Factor optimally based on the sensed power transfer and adjusts the power factor on real time to the required quantum, thereby reducing the electrical losses.)
It is assumed that the line losses presently at 5% of traction energy will reduce by 25% (of the line losses) on introduction of Intelligent Capacitor Banks and the device is expected to have a life of 20 years.
There are 400 TSS in Indian Railways. These TSS supply traction power estimated to total about 12 BU of electricity annually. Intelligent Capacitor Bank will be implemented in one TSS initially. The measure is estimated to cost USD 425,532 and the payback on investment is rather low i.e. 10.7 years (@ electricity cost 0.106 USD/kWh). State electricity agencies also provide incentives to end user having higher power factor. This co-benefit also helps reducing the payback period further.
425,532 0.38 308
Installation and use of LED (Light Emitting Diode) lights in coaches
Light emitting diodes, commonly called LEDs, basically, are just tiny light bulbs
1,276,596 1.21 992
45 Only direct emission reductions are considered for 10 years of economic lifetime as per GEF guidelines. There are no direct post-project emissions pertain to the project. Therefore, GEF finance of USD 5,200,000/1,167,581 tCO2.

69
that fit easily into an electrical circuit. They are illuminated solely by the movement of electrons in a semiconductor material, and they last just as long as a standard transistor. Their efficiency of conversion of electricity to light is about 4 times more that of incandescent lamps (lumens per watt).
At present train coaches have 20 Watt lamps each of which consume 28 Watts including 8 Watts for choke. It is envisaged that LED replacement lights will require only 12 Watts that gives better light and save approximately 60% of electricity. While this is a direct saving, there are indirect savings in lesser electricity generation by axle powered coach low efficiency generating units and reducing the frictional burden of coaches46. The present lamps last for about 5,000 hours while the LED light is expected to last for 50,000 hours.
Indian Railways has about 36,100 coaches (5,800 AC coaches and 30,300 Non AC normal coaches). It is envisaged to replace the lamps in 200 AC coaches with LED lights. One coach requires 70 lights nos. The present cost of lights in a coach is about USD 1,489 while the replacement of LED lights would cost about USD 6,383. However, the electricity consumption reduces by about 6048 kWh per coach annually. The payback on investment is 2.5 years (@ electricity cost 0.426 USD per kWh – on locomotive it costs higher).
Proven abroad
Energy audit of rolling stock and implementation of recommendations
Energy audit of locomotive and AC coaches to measure the energy used by each system and subsystem. It will analyse the present duty cycles and consumption levels and provide the means to assess the scope for improvements in the system to reduce the energy consumption.
There are about 3600 electric locomotives and about 5,800 AC Coaches in IR. Energy audit will be carried out in two locomotives and 8 AC coaches of different classes namely, First class AC, AC Two tier, AC Three tier, Chair Car. In addition there are 30,300 non AC coaches which consume much less electricity and will be tackled separately.
A locomotive is estimated to consume about 4.23 MU of electricity annually. And uses about 10% in Auxiliaries Most energy audits give at least scope for 10% savings. Assuming this reduction if recommendations are incorporated, the new electricity consumption would be reduced by 1% of annual traction energy consumed by the locomotive, about 42,300 kWh per locomotive. The cost of audit is USD 85106 per locomotive and the payback is expected to be 0.5 year (@ 0.426 USD/kWh) if the recommendations are implemented. It is proposed to carry out energy audits in two locomotives. Low cost and high return measures recommended will be implemented.
In AC coaches a saving potential of 10% is also (21,600kWh) is also expected per coach. The cost of audit is USD 5,319; the payback is expected to be 0.6 years (@ 0.426 USD/kWh).
212,766 1.02 835
Installation and operation of GPS based Driver Advice System (GPSDAS) and Energy Management System
GPS based ‘Driver Advice System’ guides the driver on route conditions, traffic ahead on the line, speed optimisation, coasting47 guidance ensuring safe and energy-efficient driving. The system would include integration with onboard
244,681 2.11
1,733
46 Self generation, frictional burden, low capacity wiring network: 47 Coasting: It is defined as a free-running operational timing mode in which continuous or periodic movement is not made

70
energy management system, digital energy meters to monitor energy used, regenerated energy and specific energy consumption (SEC) achieved for the trip against the best norm possible. GPSDAS will assist the driver through a console showing, location of the train and the route, will furnish on line information and advise the driver of optimum speed to be maintained and monitor his performance. This will be interfaced for EE management at the Central Control office, which will have real time train running information.
The GPSDAS system will be a complement to the existing to the Railways Traction Supervisory control & Data acquisition system (SCADA) providing a tool for an intelligent Energy Management system (EMS) with Demand Controllers to monitor real time trends of traction energy These systems would minimize energy demand from the Power Utility network and also help verify energy consumption profile of driver, type of train (passenger or goods), traction substation loads and ascertain losses under various components. It is expected that the life of the system would be 15 years.
On board GPSDAS system along with EMS support will cost about USD 48,936 (INR 2,300,000). Centralised Control centre support systems include work stations, communication support etc. A locomotive approximately consumes 4.23 MU per year without GPSDAS. With the introduction of GPSDAS it is expected to derive 10% reduction (0.42 MU per year) in energy consumption.
Installation and operation of Microprocessor controlled air-conditioning systems for AC couches
Microprocessor Controlled Air-conditioning system (MCAS) involves adding sensors in different parts of the coach to optimally provide the air-conditioning and ventilation through intelligent control of output to the actual need depending upon number of persons and the weather conditions. At present only a thermostat at one location governs the temperature control.
It is expected that this measure can save 20% of electricity over conventional controllers. Electricity consumption in an AC coach consumes 0.065 MU per annum that would get reduced to 0.052 MU per annum with MCAC. This measure is estimated to cost USD 3,191 (INR 150,000) per coach. It is expected that the life of MCAS would be about 15 years.
IR has about 5,800 AC coaches. It is planned to pilot this measure in 80 coaches.
255,319 1.04 850
Installation and operation of Roof mounted SPV for electricity generation for passenger trains
Generally coaches are illuminated by electricity of self-generating coaches which have axle hung generators. These are very inefficient and the cost of electricity is about USD 0.426 per kWh (INR 20). Part of electricity can be provided by solar cells located on the roof of the coaches.
It is proposed to install 2 kW modules in 15 coaches. Each coach would be able to generate about 3,000 kWh electricity annually. This is assuming generation of electricity will occur in 5 day light hours and the system runs for 300 days per year. The life of the SPV system is about 25 years. The estimated cost for SPV system per coach is USD 14,894 (INR 700,000).
223,404 0.05
37
(b) Non-Traction
Technology/Device/Measure description Investment cost USD
Estimated annual energy savings (million
Est. annual CO2
reduction (tonnes/

71
kWh per year)
year)
Proven in India, but not widespread applied
Installation and use of T5 Fluorescent tubes in place of T12 tubes for lighting for stations, workshops and railway offices
T5 lights provide better light, than the T12. T5 provide 104 lumen/ Watt whereas T 12 provides 60.
T12 consumes about 55 Watts, (40-Watt per tube and 15 Watt for choke). This is proposed to be replaced by T5 tubes. T5 tube light has electronic ballast, power factor corrected, instant soft start, tri-phosphor coatings having better performance and consumes 32 Watts (28 W tube per tube light and 4 Watt for choke). Approximately, 42% reduction in electricity consumption is expected with this replacement.
T5’s life is approximately 20,000 hours as compared with the T-12’s 5,000 hours.
IR has about 500,000 houses and 500,000 service buildings. It is proposed to replace 500,000 T12 with T5. The cost increase per light unit is from 12.8 USD for T12 to 17 USD for T5. However, the annual electricity consumption reduces from 66 MU for 500,000 T12 to 38.4 MU for T5. The payback on investment is 2.9 years (electricity cost @ 0.106 USD per kWh).
8,510,636
27.6
22,632
CFLs replacing incandescent bulbs for service buildings and railway quarters
Recently introduced Compact Fluorescent Lamp (CFL) can fit into existing incandescent light fixtures. They consume much less power for the same light output. It is proposed to replace 60 Watt incandescent bulbs with 9 Watt CFL. The estimated electricity savings due to this replacement is 80%. An incandescent bulb has an average life of just 1000 hours whereas a CFL can last for 8,000 hours. CFL lamps, however, cost more. The cost of CFL is 2.13 USD while an incandescent bulb is 0.21 USD per piece.
IR has about 650,000 houses for employees which are mostly fitted with incandescent bulb for lighting. It is estimated that each household has about 6 bulbs totalling to about 3.9 million bulbs which will be replaced. Initially It is envisaged that 650,000 incandescent bulbs used in these houses will first be replaced by CFLs.
Electricity consumption per lamp reduces from 144 kWh in incandescent bulb to 21.6 kWh per annum in CFL. The payback on investment is just 0.2 years (electricity cost @ 0.106 per kWh).
1,382,979 79.56 65,239
Installation and operation of VVVF (Variable Voltage Variable Frequency) drives for machines
VVVF drives for electric motors are more versatile and draw minimum energy from source for the duty-cycle and have minimum losses in starting. These drives will be installed on machines with frequent starts and stop, and variable load duties, like lifts, compressors, lathes, pumps etc.
It is proposed to install VVVF drives on 1,000 machines in IR. It is expected to save about 30% in energy demand due to this. .For an average motor Electricity consumption without VVVF drive is about 10,800 kWh per drive per annum while machine with VVVF drive would consume be 7,560 kWh per annum (a reduction of 30% electricity). The cost of a VVVF drive is about 1,064 USD per device. It is expected that the life of such drive is about 20 years. The payback on
1,063,830 3.24 2,657

72
investment is 3.1 years (electricity cost @ 0.106 USD per kWh)
Proven in abroad
Energy audit of stations, workshops and railway offices
IR has about 8,200 building facilities namely; 8,000 stations, 100 workshops and 100 railway offices. Average connected load of these facilities is 500 MW.
It is proposed to carry out Energy Audits of 50 stations, workshops and railway offices (40 stations, 5 workshops and 5 railway offices). It is expected that the recommendations can lead to energy saving of at least 20%.
Energy Audit helps in putting a plan for implementation of measures that can reduce the energy consumption in these facilities. Building Management System may be one of the follow up action of Energy audit in these facilities.
It is estimated that Energy audit of each facility will cost about USD 10,638 (INR 0.5 million).
531,915 12.0 9,840
Installation and operation of Building Management Systems (BMS) for stations, workshops and railway offices ECBC (Energy Conservation Building Codes) to bring Energy Efficiency in buildings is currently voluntary. It is likely to become mandatory in a few years, especially for buildings with connected load of 500 kW. As already explained in the previous section, railways have about 8,200 facilities that have an average load of 500 kW. The BMS helps establish benchmarks. It helps energy monitoring, control and efficient management. The system helps identifying predictive maintenance through monitoring power consumption profile of machinery & equipment. It is estimated that each facility consumes about 1.2 MU of electricity annually. This is estimated to get reduced to 0.96 MU annually (saving of 20%). The expected life of the system is about 15 years. It is envisaged that 50 facilities will be brought under BMS. It is expected to cost about USD 21,277 per facility (INR 1.0 million).
1,063,830 12.0 9,840
Installation and operation of Energy Management System (EMS) for pumping installations Pumping installations: Provision of Discharge meters at pumping installations can control waste. The discharge meters at pump delivery sides monitor the pumping performance, water discharge and collection to regulate the use of water through SCADA based monitoring & control system. Following parameters will be looked into to bring EMS at pumping installations; (i) Redesign the system with most efficient piping and pump and motor size providing optimum pumping with minimum energy consumption, whenever due for replacement, (ii) controlling the flow rate by speed variation, (iii) eliminating flow control valve; (iv) eliminating by-pass control; and (v) start/stop control of pump. IR has about 6800 installations across 68 divisions, approximately 100 installations per division. The project aims to put up EMS in about 100 pumping installations. On an average the pump rating per installation is 25 kW. The present electricity consumption is about 0.073 MU per installation. The EMS is expected to save 30% (0.0219 MU/year) of the electricity consumption. Thus the electricity consumption is expected to be 0.0511 MU/year. The cost of EMS per installation is about USD 6,383 (INR 0.3 million).
638,298 2.19 1,796
Energy Testing and Resource Centres
RDSO (Lucknow, UP) will develop facilities to test energy efficiency parameters of Energy Efficiency measures. Energy Resource Centre at Indian Institution of
2,127,660

73
Electrical Engineers at Nasik (Maharashtra) will be developed to demonstrate and teach the means of Energy Efficiency measures.
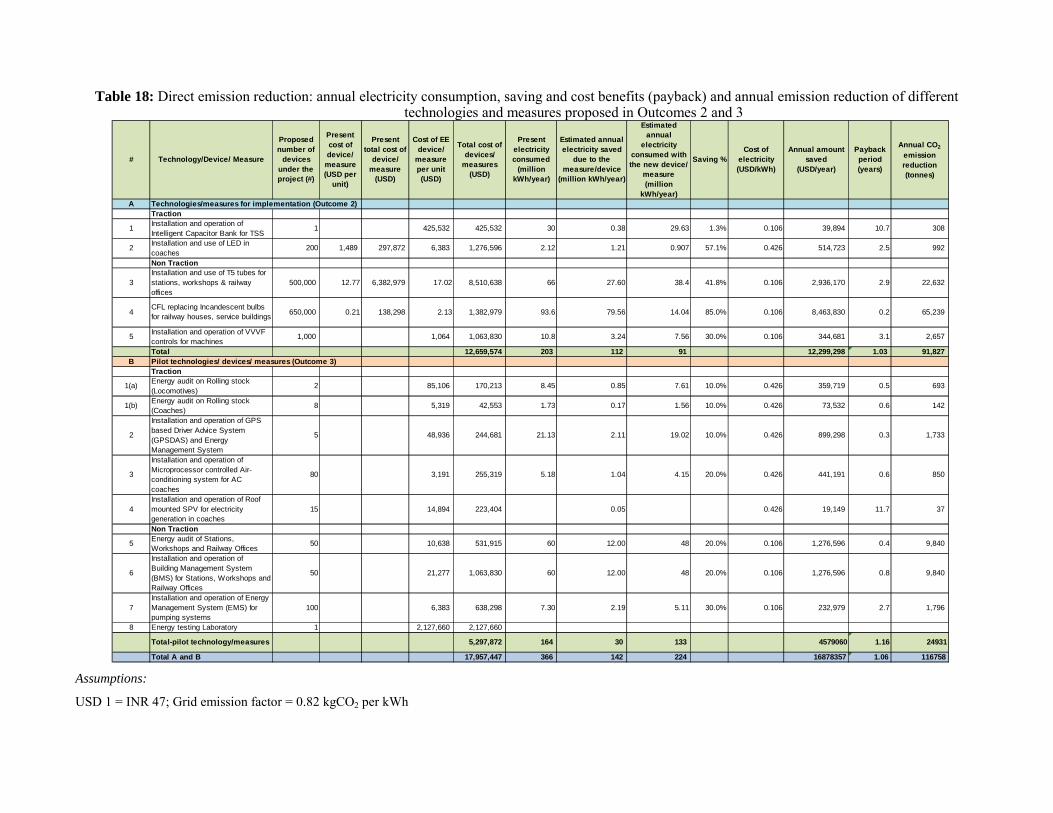
Table 18: Direct emission reduction: annual electricity consumption, saving and cost benefits (payback) and annual emission reduction of different technologies and measures proposed in Outcomes 2 and 3
# Technology/Device/ Measure
Proposed number of
devices under the project (#)
Present cost of device/
measure (USD per
unit)
Present total cost of
device/ measure
(USD)
Cost of EE device/
measure per unit (USD)
Total cost of devices/
measures (USD)
Present electricity consumed
(million kWh/year)
Estimated annual electricity saved
due to the measure/device
(million kWh/year)
Estimated annual
electricity consumed with the new device/
measure (million
kWh/year)
Saving %Cost of
electricity (USD/kWh)
Annual amount saved
(USD/year)
Payback period (years)
Annual CO2
emission reduction (tonnes)
A Technologies/measures for implementation (Outcome 2)Traction
1Installation and operation of Intelligent Capacitor Bank for TSS
1 425,532 425,532 30 0.38 29.63 1.3% 0.106 39,894 10.7 308
2Installation and use of LED in coaches
200 1,489 297,872 6,383 1,276,596 2.12 1.21 0.907 57.1% 0.426 514,723 2.5 992
Non Traction
3Installation and use of T5 tubes for stations, workshops & railway offices
500,000 12.77 6,382,979 17.02 8,510,638 66 27.60 38.4 41.8% 0.106 2,936,170 2.9 22,632
4CFL replacing Incandescent bulbs for railway houses, service buildings
650,000 0.21 138,298 2.13 1,382,979 93.6 79.56 14.04 85.0% 0.106 8,463,830 0.2 65,239
5Installation and operation of VVVF controls for machines
1,000 1,064 1,063,830 10.8 3.24 7.56 30.0% 0.106 344,681 3.1 2,657
Total 12,659,574 203 112 91 12,299,298 1.03 91,827 B Pilot technologies/ devices/ measures (Outcome 3)
Traction
1(a)Energy audit on Rolling stock (Locomotives)
2 85,106 170,213 8.45 0.85 7.61 10.0% 0.426 359,719 0.5 693
1(b)Energy audit on Rolling stock (Coaches)
8 5,319 42,553 1.73 0.17 1.56 10.0% 0.426 73,532 0.6 142
2
Installation and operation of GPS based Driver Advice System (GPSDAS) and Energy Management System
5 48,936 244,681 21.13 2.11 19.02 10.0% 0.426 899,298 0.3 1,733
3
Installation and operation of Microprocessor controlled Air-conditioning system for AC coaches
80 3,191 255,319 5.18 1.04 4.15 20.0% 0.426 441,191 0.6 850
4Installation and operation of Roof mounted SPV for electricity generation in coaches
15 14,894 223,404 0.05 0.426 19,149 11.7 37
Non Traction
5Energy audit of Stations, Workshops and Railway Offices
50 10,638 531,915 60 12.00 48 20.0% 0.106 1,276,596 0.4 9,840
6
Installation and operation of Building Management System (BMS) for Stations, Workshops and Railway Offices
50 21,277 1,063,830 60 12.00 48 20.0% 0.106 1,276,596 0.8 9,840
7Installation and operation of Energy Management System (EMS) for pumping systems
100 6,383 638,298 7.30 2.19 5.11 30.0% 0.106 232,979 2.7 1,796
8 Energy testing Laboratory 1 2,127,660 2,127,660
Total-pilot technology/measures 5,297,872 164 30 133 4579060 1.16 24931
Total A and B 17,957,447 366 142 224 16878357 1.06 116758 Assumptions:
USD 1 = INR 47; Grid emission factor = 0.82 kgCO2 per kWh

D.2 Indirect emission reduction
124. After the project’s completion, investments will be affected by the long-term outcomes of the barrier-removal activities, e.g. capacity building and institutional strengthening. The corresponding CO2 emissions reduction is referred to as indirect emission reduction. Following the GEF Manual for calculating CO2 emission reduction48, these are estimated as described below. Bottom-up approach 125. The GEF bottom-up approach implies the replication of the project demonstration investments to other Zonal Railways with Indian Railways over the GEF project influence period of 10 years and the CO2 emission reductions are calculated using the following formula: Indirect CO2 emission reductions (billion kWh) = CO2 direct * RF, where CO2 direct = estimate for total direct emission reductions RF = replication factor For RF, the value of “3” has been chosen as a conservative estimate for Indian Railways based on the market transformation and demonstration approach of the project. Thus, applying the above formula, indirect emission reductions (bottom-up) are estimated as 1.17 million tCO2 * 3 = 3.50 million tCO2.
Top-down approach 126. The ‘top-down’ approach provides an ‘upper limit’ by looking at the potential leverage of the project of the market for the EE technology for Indian Railways as a whole. In this approach the market potential for technology within 10 years during and after the project’s lifetime is looked at (2011/12-2020/21). Table 19 provides a baseline scenario and an alternative scenario, based on energy growth figures provided by Indian Railways, taking fiscal year 2009/10 as the base year for electricity consumption estimate. 127. In the baseline scenario it is estimated that the total demand of electricity in the railways sector will grow at a rate of more than 9% annually (see also Section 1.3 for a description). The electricity consumption is projected to be about 100.5 billion kWh by 2031-32. The rapid growth is due to ambitious electrification plans, in which 80% of rail freight and 60% of passenger traffic will run on electric energy by 2031-32.
128. Indian Railways (IR) is developing a long-term Energy Efficiency and Conservation Program (EECP) (2010-2032). The Program aims at progressively introducing a number of energy efficiency technologies and measures in the railways system). The objective of this Program is to save 10% of the electricity consumption in absolute terms by 2032, in line with the targets of national initiatives on energy conservation and climate change.
48 Manual for Calculating GHG Benefits of GEF Projects: Energy Efficiency and Renewable Energy Projects,
GEF/C.33/Inf.18
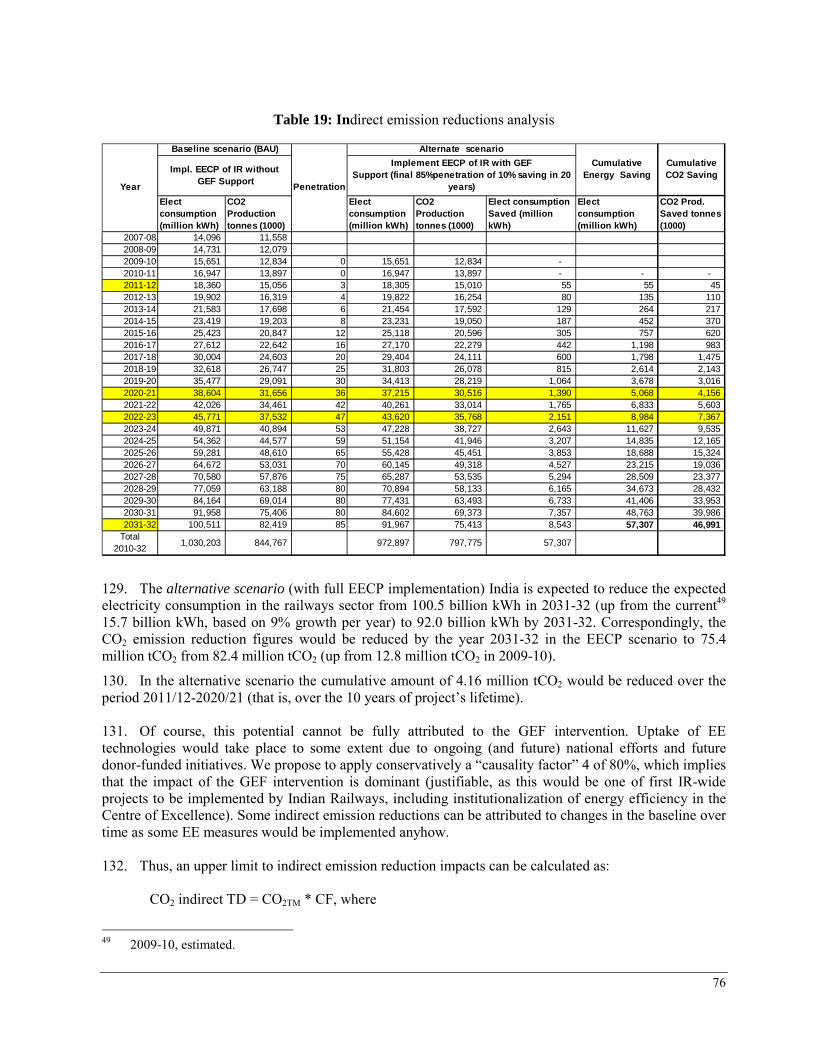
76
Table 19: Indirect emission reductions analysis
Elect consumption (million kWh)
CO2 Production tonnes (1000)
Elect consumption (million kWh)
CO2 Production tonnes (1000)
Elect consumption Saved (million kWh)
Elect consumption (million kWh)
CO2 Prod. Saved tonnes (1000)
2007-08 14,096 11,558 2008-09 14,731 12,079 2009-10 15,651 12,834 0 15,651 12,834 - 2010-11 16,947 13,897 0 16,947 13,897 - - - 2011-12 18,360 15,056 3 18,305 15,010 55 55 45 2012-13 19,902 16,319 4 19,822 16,254 80 135 110 2013-14 21,583 17,698 6 21,454 17,592 129 264 217 2014-15 23,419 19,203 8 23,231 19,050 187 452 370 2015-16 25,423 20,847 12 25,118 20,596 305 757 620 2016-17 27,612 22,642 16 27,170 22,279 442 1,198 983 2017-18 30,004 24,603 20 29,404 24,111 600 1,798 1,475 2018-19 32,618 26,747 25 31,803 26,078 815 2,614 2,143 2019-20 35,477 29,091 30 34,413 28,219 1,064 3,678 3,016 2020-21 38,604 31,656 36 37,215 30,516 1,390 5,068 4,156 2021-22 42,026 34,461 42 40,261 33,014 1,765 6,833 5,603 2022-23 45,771 37,532 47 43,620 35,768 2,151 8,984 7,367 2023-24 49,871 40,894 53 47,228 38,727 2,643 11,627 9,535 2024-25 54,362 44,577 59 51,154 41,946 3,207 14,835 12,165 2025-26 59,281 48,610 65 55,428 45,451 3,853 18,688 15,324 2026-27 64,672 53,031 70 60,145 49,318 4,527 23,215 19,036 2027-28 70,580 57,876 75 65,287 53,535 5,294 28,509 23,377 2028-29 77,059 63,188 80 70,894 58,133 6,165 34,673 28,432 2029-30 84,164 69,014 80 77,431 63,493 6,733 41,406 33,953 2030-31 91,958 75,406 80 84,602 69,373 7,357 48,763 39,986 2031-32 100,511 82,419 85 91,967 75,413 8,543 57,307 46,991
Total 2010-32
1,030,203 844,767 972,897 797,775 57,307
Cumulative CO2 Saving
Year Penetration
Baseline scenario (BAU) Alternate scenario
Impl. EECP of IR without GEF Support
Implement EECP of IR with GEFSupport (final 85%penetration of 10% saving in 20
years)
Cumulative Energy Saving
129. The alternative scenario (with full EECP implementation) India is expected to reduce the expected electricity consumption in the railways sector from 100.5 billion kWh in 2031-32 (up from the current49 15.7 billion kWh, based on 9% growth per year) to 92.0 billion kWh by 2031-32. Correspondingly, the CO2 emission reduction figures would be reduced by the year 2031-32 in the EECP scenario to 75.4 million tCO2 from 82.4 million tCO2 (up from 12.8 million tCO2 in 2009-10).
130. In the alternative scenario the cumulative amount of 4.16 million tCO2 would be reduced over the period 2011/12-2020/21 (that is, over the 10 years of project’s lifetime). 131. Of course, this potential cannot be fully attributed to the GEF intervention. Uptake of EE technologies would take place to some extent due to ongoing (and future) national efforts and future donor-funded initiatives. We propose to apply conservatively a “causality factor” 4 of 80%, which implies that the impact of the GEF intervention is dominant (justifiable, as this would be one of first IR-wide projects to be implemented by Indian Railways, including institutionalization of energy efficiency in the Centre of Excellence). Some indirect emission reductions can be attributed to changes in the baseline over time as some EE measures would be implemented anyhow. 132. Thus, an upper limit to indirect emission reduction impacts can be calculated as:
CO2 indirect TD = CO2TM * CF, where
49 2009-10, estimated.

77
CO2TM = total market potential for CO2 emission reductions CF = causality factor
4.16 MtCO2 * 80% = 3.32 million tCO2

ANNEX E. ORGANISATIONAL SETUP OF INDIAN RAILWAYS Table 20: Organisational setup of Indian Railways
ZONAL RAILWAYS PRODUCTION UNITS OTHERS OTHERS
Central Railway Chittaranjan Loco Works Central Organization for Railway Electrification IT Projects under CAO/FOIS
East Central Railway Diesel-Loco Modernization Works Dargeeling Himalayan Railways ORGANISATION
East Coast Railway Diesel Locomotive Works Delhi Metro Rail Corporation Metro Railway Kolkata
Eastern Railway Integral Coach Factory Dedicated Freight Corridor Corporation of India Limited (DFCC)
National Rail Museum sites
North Central Railway Rail Coach Factory, Kapurthala Federation of Railway Officers Associations Palace on Wheels
North Eastern Railway Rail Coach Factory, Raebareli General Rules Review Committee Railway Claims Tribunal
North Western Railway Rail Wheel Factory Indian Railway Accounting Rail Land Development Authority
Northeast Frontier Railway CORPORATION SITES Indian Railway Accounts Service Association Railway Recruitment Boards
Northern Railway Central Organization For Modernization of Workshops
Indian Railway Central Organization for Telecom Railway Staff College, Baroda
South Central Railway Centre for Railway Information System Indian Railways Institute of Electrical Engineering Rail Vikas Nigam Ltd.
South East Central Railway Container Corporation of India Ltd. Indian Railways Institute of Mechanical and Electrical Engineering
Research Design and Standards Organization
South Eastern Railway Indian Railway Catering and Tourism Corporation Ltd.
Indian Railways Institute of Signal Engineering and Telecommunications
Secret Ballot Committee
South Western Railway Indian Railway Finance Corporation Indian Railways Service of Mechanical Engineers Southern Railway IRCON International Ltd. Indian Railway Traffic Service Association West Central Railway Konkan Railway Corporation's Institute of Rail transport Western Railway Pipavav Railway Corporation Limited Indian Railways Institute of Transport
Management
Mumbai Railway Vikas Corporation RAILTEL Corporation of India Ltd. RITES Ltd.
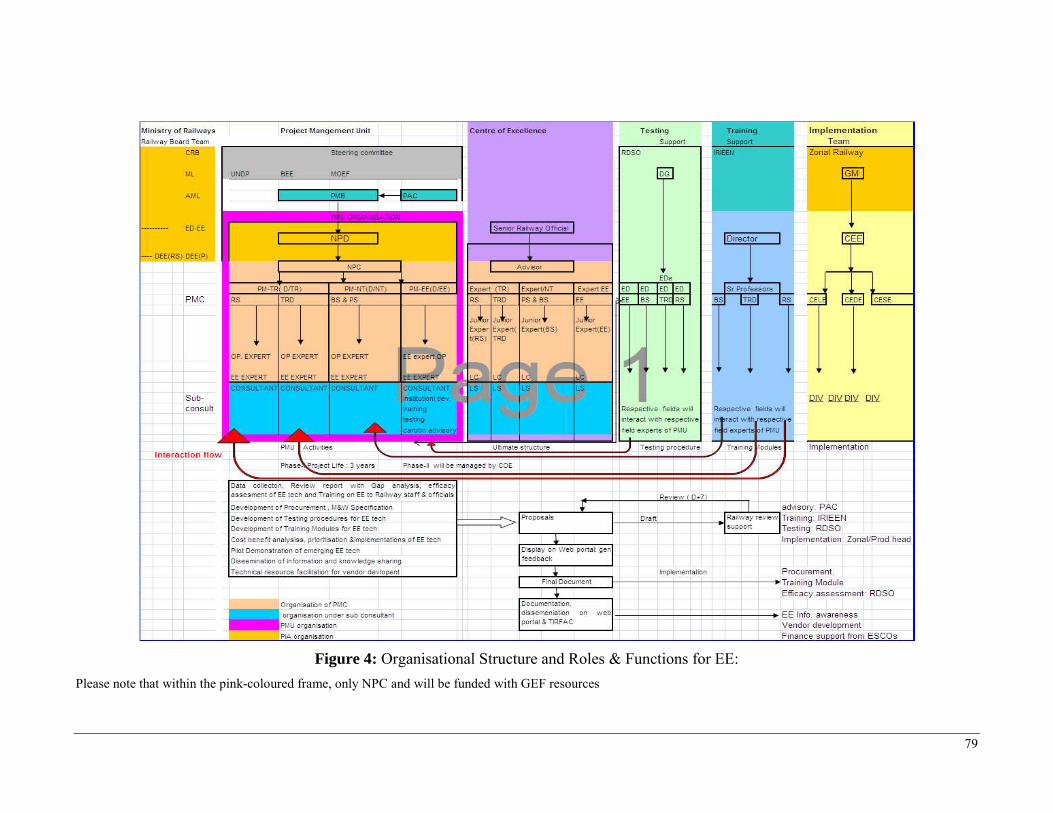
79
Figure 4: Organisational Structure and Roles & Functions for EE:
Please note that within the pink-coloured frame, only NPC and will be funded with GEF resources
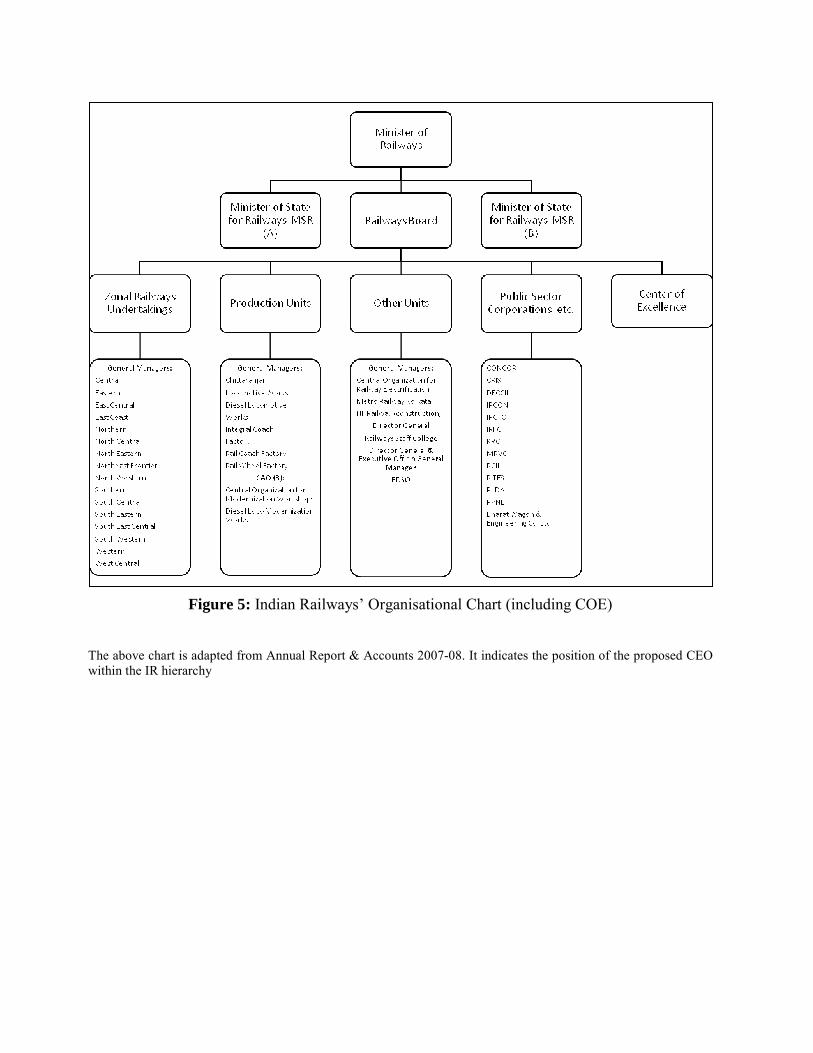
Figure 5: Indian Railways’ Organisational Chart (including COE)
The above chart is adapted from Annual Report & Accounts 2007-08. It indicates the position of the proposed CEO within the IR hierarchy

81
ANNEX F. TRAINING & CAPACITY BUILDING ACTIVITIES
F.1 Proposed participants to capacity building activities
Table 21: Top managers
PMU/COE Railways Board
Zonal Railways
(32)
Zonal Divisional
Units
(68)
Production Units
(5)
RDSO IRIEEN
Staff Training Institute
(16)
Others (e.g.
technical staff)
(16)
Planners and policy makers
2 2 2 2
Rolling stock
2 2 2 2
Traction distribution
2 2 2 2
Building services
2 2 2 2
Energy Managers
2 2 5 2 2
Total 10 10 64 122 10 10 10 32 32
Total: 300
Table 22: Middle-managers
PMU/COE Railways Board
Zonal Railways
(16)
Zonal Divisional
Units
(68)
Production Units
(5)
RDSO Training Institutes
Staff Training Institute
(16)
Others (e.g.
technical staff)
(16)
Planners and policy makers
3 2 1 2
Rolling stock
2 2 2
Traction distribution
2 2 2
Building services
2 2 2
Energy Managers
2 4 2 1
Total 8 13 32 122 10 10 2 32 32
Total: 261

82
Table 23: Supervisors and technical staff
PMU/COE Railways Board
Zonal Railways
(16)
Zonal Divisional
Units
(68)
Production Units
(5)
RDSO Training Institutes
Staff Training Institute
(16)
Others (e.g.
technical staff)
(16)
Planners and policy makers
2
Rolling stock
2 2 2 2 2 1
Traction distribution
2 2 2 2 2 1
Building services
2 2 2 2 2 1
Energy Managers
2 1 2 2 2 2 1 2
Total 8 8 264 696 10 20 16 102 48
Total: 1,172
F.2 Examples of training modules and activities
Table 24: Training program for pilot demonstrations
Day 1 Day 2 Day 3 Day 4 Day 5
Session 1 Presentation on the setup and Brief on best practices pursued Structure, functions & focus areas of COE
Energy Efficiency bench marks of pilot demonstration technologies/measures & comparison
Designs capabilities & simulations
Efficacy assessment, verification of performance, & records
Energy audit procedures
Session 2 Evolution of best practices on EE
Testing facilities & conducting tests
Training facilities & training modules
Reliability, Availability, Maintainability, Safety assessment of the best practices
Implementation strategies, Transfer of technology
Session 3 Contemporary technologies
Site visit/working technology & model demonstration
Site visit/working technology & model demonstration
Site visit/working technology & model demonstration
Customization potential
Session 4 Site visit/ working technology & model demonstration of pilot demonstration technologies/measures
Interaction with the users and sharing knowledge with experts
Interaction with the users and sharing knowledge with experts
Interaction with the users and sharing knowledge with experts
Development of strategy for replication in India
Table 25: Training program on Proven Technologies (i.e. technologies that have already been tested in India and proven to be technically successful, but not widespread disseminated yet)

83
Day 1 Day 2 Day 3 Day 4 Day 5
Session 1 Presentation on the setup and Brief on best practices pursued Structure, functions & focus areas of COE
Energy Efficiency bench marks of pilot demonstration technologies/measures & comparison
Designs capabilities & simulations
Efficacy assessment, verification of performance, & records
Energy audit procedures
Session 2 Evolution of best practices on EE
Testing facilities & conducting tests
Training facilities & training modules
Reliability, Availability, Maintainability, Safety assessment of the best practices
Implementation strategies, Transfer of technology
Session 3 Contemporary technologies
Site visit/working technology & model demonstration
Site visit/working technology & model demonstration
Site visit/working technology & model demonstration
Customization potential
Session 4 Site visit/ working technology & model demonstration of proven technologies
Interaction with the users and sharing knowledge with experts
Interaction with the users and sharing knowledge with experts
Interaction with the users and sharing knowledge with experts
Development of strategy for replication in India
(a) Training activities for local level staff
The managers, supervisors and technical staff that will initially benefit from the above described training programs on energy efficiency will become trainers or resource persons for the IR system and will contribute to train or raise awareness among the whole IR staff.
Trainings for local level staff will be regularly organized in the appropriate training institutes benefiting from the competences of the trained staff.
At least 100 local staff in each of the 16 zone will annually be trained on energy efficiency in their respective service of competence (i.e. rolling stock, traction power distribution, and building services). A total of 4,800 (100x16x3) staff is therefore expected to be trained annually.
In addition, at least four courses of 25 officials each will be conducted separately.
Finally, one module on energy efficiency will be added in each refresh course on rolling stock, traction power distribution, and building services (to which about 2,000 staff participate annually).
Training modules will be developed by the PMU/COE.

ANNEX G. PROJECT ANNUAL TARGETS Table 26: “Improving Energy Efficiency in the Indian Railways System” Project Annual Targets
Indicator Target Year 1 Year 2 Year 3 Project Goal: Reduction of GHG emissions in the Indian Railways System (IRS)
Cumulative emission reductions achieved in the IRS by EOP (million t CO2)
0.117 0 0 0.117
Project Objective Removal of key barriers that prevent the wide adoption of energy efficiency technologies and measures in the IRS
Total direct energy savings by EOP (billion kWh) 0.142 0 0 0.142
Component 1: Institutional capacity development and technical training Outcome 1.1: Strengthened IR institutional capacity
Status report of targeted EE technologies / measures, its availability in India/abroad and gap analysis for its implementation
1 1 0 0
Established and functioning of EE Centre of Excellence (COE) in IRS by EOP
1 0 0 1
TIRFAD established and functioning by EOP
1 0 0 1
COE website established and operational by EOP
1 0 1 0
Number of training and testing institutes with capacity to provide trainings and test EE measures/equipment respectively by year 3
At least 8 At least 2
0 0
2 0
6 2
Number of training courses conducted by the training institutes each year starting from year 3
64 0 0 64
Outcome 1.2 Improved EE management & technical capacity of IR staff
Number of managers and staff members trained on EE best practices and technologies by EOP
At least 325 managers and 675
staff
200/75 75/200 50/400
Number of successful EE projects implemented by the trained managers and staff members by EOP
45 0 20 25

85
Indicator Target Year 1 Year 2 Year 3 Component 2: Implementation of proven energy efficiency technologies and measures Outcome 2 Proven EE technologies and measures in traction and non-traction operations are implemented and energy savings realized.
Potential energy savings from the implementation of EE technologies and/or measures by year 3
• 1.58 million kWh/y (for traction)
• 110.40 million kWh/y (for non-traction) from 3rd year onwards
0/0 0/0 1.58/110.40
Percentage of savings derived from EE measures implemented allocated as incentives to EE implementers by EOP
At least 10% 10% 10% 10%
Number of project proposals (technical and financial) prepared by EOP for EE technology / measure application projects
45 0 20 25
Component 3: Pilot demonstration of energy efficiency technologies and measures Outcome 3 Increased confidence in the application of EE technologies and practices in the IRS
Number of energy audits conducted in IRS units above 0.5 MW load by year 3
50 0 20 30
Number of pilot demonstrations designed and implemented by year 3
At least 8 0 0 8
Total energy savings achieved from pilot projects by EOP, million kWh
30.40 0 0 30.40
Percentage of successful pilot demonstrations adopted by IRS for replication by EOP
At least 25% of successful pilot
projects are adopted by IR for replication
by the EOP and initiated
0 0 25%
Based on energy audits, number of EE technologies and measures identified as feasible for implementation (planned and budgeted) by year 3
At least 5 0 0 5
Component 4: Information and knowledge sharing Outcome 4 Information and knowledge on
Number of visitors visiting the web portal each year starting year 2
24,000 0 12,000 12,000
86
Indicator Target Year 1 Year 2 Year 3 EE technologies and measures are widely available and accessible for IRS divisions and their affiliates
Number of sets of knowledge sharing products (KSPs) developed and disseminated by EOP
13 0 0 13
Number of awareness campaigns conducted per year starting year 3
552 184 184 184
Number of IRS divisions that are actively participating in IRS EE programs by EOP
68 0 0 68
Number of vendors registering with TIRFAD each year starting year 3 (i.e. from 2013)
About 3 vendors per successful pilot technology register with TIRFAD
0 0 3
Cumulative number of vendors attending TIRFAD campaigns by the EOP
At least 39 0 0 39

March 22, 2011 Dear Council Member:
The UNDP as the Implementing Agency for the project entitled: India: IND Improving Energy Efficiency in the Indian Railway System - under the Programmatic Framework for Energy Efficiency in India, has submitted the attached proposed project document for CEO endorsement prior to final Agency approval of the project document in accordance with the UNDP procedures.
The Secretariat has reviewed the project document. It is consistent with the project concept approved by the Council in January 2009 and the proposed project remains consistent with the Instrument and GEF policies and procedures. The attached explanation prepared by the UNDP satisfactorily details how Council’s comments and those of the STAP have been addressed.
We have today posted the proposed project document on the GEF website at www.TheGEF.org for your information. We would welcome any comments you may wish to provide by April 19, 2011 before I endorse the project. You may send your comments to [email protected] .
If you do not have access to the Web, you may request the local field office of UNDP or the World Bank to download the document for you. Alternatively, you may request a copy of the document from the Secretariat. If you make such a request, please confirm for us your current mailing address. Sincerely,
Attachment: Project Document Copy to: Country Operational Focal Point GEF Agencies STAP Trustee
1818 H Street, NW Washington, DC 20433 USA Tel: 202.473.3202 Fax: 202.522.3240/3245
E-mail: [email protected]
MONIQUE BARBUT Chief Executive Officer and Chairperson

1
Date of submission: 31st August 2010 Date of resubmission: 28th February 2011
PART I: PROJECT IDENTIFICATION GEFSEC PROJECT ID: 3554 GEF AGENCY PROJECT ID: 4044 COUNTRY(IES): India PROJECT TITLE: Improving Energy Efficiency in the Indian Railways system GEF AGENCY(IES): UNDP OTHER EXECUTING PARTNERS: INDIAN RAILWAYS (IR); MINISTRY OF RAILWAYS GEF FOCAL AREAS: Climate Change GEF-4 STRATEGIC PROGRAM(S): CC-SP2 - Promote market transformation for energy efficiency in industry and the building sector NAME OF PARENT PROGRAM/ UMBRELLA PROJECT: PROGRAMMATIC FRAMEWORK FOR EE IN INDIA A. PROJECT FRAMEWORK
Project Objective: To improve energy efficiency in the Indian Railways system (and thereby reducing greenhouse gas emissions) by removing some of the key barriers that prevent the wide adoption of energy efficiency technologies and measures in the Indian Railways system
Project Components
Indicate whether Inv.,TA or STA2
Expected Outcomes
Expected Outputs
GEF
Financing1
Co-Financing1
Total ($)
c=a+ b ($) a % ($) b %
1. Institutional Capacity Development and Technical Training
TA 1.1: Strengthened IR institutional capacity
1.2: Improved EE management & technical capacity of IR staff
1.1.1 Documented energy efficiency (EE) best practices (measures and technologies) and defined EE benchmarks for railways systems 1.1.2 Established and supported Centre of Excellence (COE) 1.2.1 Trained and qualified staff members of the relevent IR departments capable of implementing EE technologies, measures, and best practices
1,095,000 65% 600,000 35% 1,695,000
2. Imple-mentation of proven EE technologies and measures
TA/Inv. Proven EE technologies and measures in traction and non-traction operations are implemented and energy savings realized
2.1 Documented detailed information on available EE technologies and measures 2.2 Developed and implemented energy audit procedures 2.3 Completed implementation of ready and proven technologies and measures 2.4 Developed and implemented incentive schemes
1,573,500 11% 12,835,750 89% 14,409,250
REQUEST FOR CEO ENDORSEMENT/APPROVAL PROJECT TYPE: FULL-SIZED PROJECT
THE GEF TRUST FUND
INDICATIVE CALENDAR
Milestones Expected Dates
Work Program (for FSP) Nov. 2008 CEO Endorsement/Approval March 2011 GEF Agency Approval April 2011 Implementation Start May 2011 Mid-term Review October 2012
Implementation Completion June 2014

2
3. Pilot demonstration of EE technologies and measures
TA/Inv. Increased confidence in the application of EE technologies and practices piloted in the IRS
3.1 Completed demonstration of EE technologies and measures
1,290,000 18% 6,035,750 82% 7,325,750
4. Information and knowledge sharing;
TA Information and knowledge on EE technologies and measures are widely available and accessible for IRS divisions and their affiliates
4.1 Collected lessons learned and developed knowledge sharing products 4.2 Developed post-project action plan for DOE
950,000 73% 350,000 27% 1,300,000
5. Project management 291,500 20% 1,178,500 80% 1,470,000
Total project costs 5,200,000 21,000,000 26,200,000 1 List the $ by project components. The percentage is the share of GEF and Co-financing respectively of the total amount for the component. 2 Inv. = Investments, TA = Technical Assistance; STA = Scientific & Technical Analysis.
B. SOURCES OF CONFIRMED CO-FINANCING FOR THE PROJECT (expand the table line items as necessary)
Name of Co-financier (source)
Classification Type Project %*
Indian Railway Government Cash 20,000,000 95%
Kind 1,000,000 5%
21,000,000 * Percentage of each co-financier’s contribution at CEO endorsement to total co-financing.
C. FINANCING PLAN SUMMARY FOR THE PROJECT ($)
Project Preparation
a Project
b
Total
c = a + b Agency Fee
For comparison (*)
GEF and Co-financing at PIF
GEF Grant 100,000 5,200,000 5,300,000 530,000 5,200,000 Co-financing (Cash & Kind)
150,000 21,000,000 21,150,000
21,000,000
Total 250,000 26,200,000 26,450,000 26,200,000
(*) Excluding project preparation
D. GEF RESOURCES REQUESTED BY AGENCY(IES), FOCAL AREA(S) AND COUNTRY(IES)1
Not applicable, as this is a single focal area, single country and single GEF Agency project.
E. CONSULTANTS WORKING FOR TECHNICAL ASSISTANCE COMPONENTS:
Component Estimated
person weeks (GEF)
GEF amount($)
Co-financing ($)
Project total ($)
Local consultants* 2,515 1,290,650 300,000 1,590,650 International consultants* 306 916,500 916,500 Total 2,821 2,207,150 300,000 2,507,150
*Details to be provided in Annex C.
3
F. PROJECT MANAGEMENT BUDGET/COST
Cost Items Total Estimated
person weeks (GEF)
GEF amount
($)
Co-financing
($)
Project total
($) Local consultants* 275 243,250 861,650 1,104,900 International consultants* 0 0 0 0 Office facilities, equipment, vehicles and communications*
26,378 131,197 157,575
Travel* 21, 872 185,653 207,525 Total 275 291,500 1,178,500 1,470,000
*Details to be provided in Annex C.
G. DOES THE PROJECT INCLUDE A “NON-GRANT” INSTRUMENT? yes no
H. DESCRIBE THE BUDGETED M &E PLAN:
The following main project monitoring and evaluation activities will be carried out: (1) Measurement of means of verification for project progress and performance (baseline and impact analysis); (2) Annual project reporting, including project implementation review (PIR); (3) Tripartite review meetings; (4) Periodic status reporting; (5) Audits; (6) Mid-term external review; (7) Final external review; and, (8) Visits to field sites. These activities have been included in the budget under project management.
Type of M&E activity Responsible Parties Budget USD
Excluding project team staff time
Time frame
Inception Workshop and Report
Implementing Partner (National Project Director and National Project Coordinator)
UNDP CO
Indicative cost: $10,000
Within first two months of project start up
Measurement of Means of Verification of project results (baseline and end-of-project impact studies)
UNDP GEF RTA/ NPC will oversee the hiring of specific studies and institutions, and delegate responsibilities to relevant team members.
Indicative cost: $120,000
Start, mid and end of project (during evaluation cycle) and annually when required.
Measurement of Means of Verification for Project Progress on output and implementation
Oversight by National Project Coordinator
Project team
Indicative cost: $8,000 (to be determined more precisely) as part of the Annual Work Plan's preparation.
Annually prior to ARR/PIR and to the definition of annual work plans
APR/PIR NPD, NPC and Project team UNDP CO UNDP RTA UNDP EEG
Already included in the PMU cost
Annually
Periodic status/ progress reports
NPD, NPC and Project team Already included in the PMU cost
Quarterly
4
Type of M&E activity Responsible Parties Budget USD
Excluding project team staff time
Time frame
Mid-term Evaluation NPD, NPC UNDP CO UNDP RCU External Consultants (i.e. evaluation
team)
Indicative cost: $25,000
At the mid-point of project implementation.
Final Evaluation NPD, NPC UNDP CO UNDP RCU External Consultants (i.e. evaluation
team)
Indicative cost : $25,000
At least three months before the end of project implementation
Project Terminal Report NPD, NPC UNDP CO Consultant
None At least three months before the end of the project
Audit UNDP CO NPD, NPC and Project team
Indicative cost per year: $4,000
Yearly
Visits to field sites UNDP CO UNDP RCU (as appropriate) Government representatives
From IA fees and operational budget
Yearly
TOTAL indicative COST Excluding project team staff time and UNDP staff and travel expenses US$200,000
(3.8% of total GEF budget)
PART II: PROJECT JUSTIFICATION:
A. STATE THE ISSUE, HOW THE PROJECT SEEKS TO ADDRESS IT, AND THE EXPECTED GLOBAL
ENVIRONMENTAL BENEFITS TO BE DELIVERED:
Indian Railways has a total state monopoly on India's rail transport. It is one of the largest and busiest rail networks in the world. It has a network of about 63,273 km transported 18 million passengers and 2.18 million tonnes of freight daily in year 2007-08. The Indian Railway system is headed by the Indian Railways Board and managed through 16 Zones with operating Divisions. There are six production units engaged in manufacturing rolling stock, wheels and axles and other ancillary components to meet Railways requirements. Various IR-owned organizations, such as the Research, Designs and Standards Organization (RDSO), Indian Railways Institute of Electrical Engineering (IRIEEN) function as advisory, research and training centres for Indian Railways The electricity consumption of Indian Railways (IR) is around 2.2% of India’s total electricity consumption, around 15.6 billion kWh in 2009/10. Due to rapid electrifiction (replacement of diesel-fuelled traffic), power consumption might sore to 101 billion kWh by 2031/32. There is an enormous energy savings potential in the Indian Railways system, which up to now hardly has been tapped. Therefore, IR is about to initiate an energy efficient programme for traction and non-traction with a quantified target for non-traction of saving 10% of the total consumption in absolute terms, called Energy Efficiency and Conservation Programme (EECP). A number of initiatives has been planned, such as DC-to-AC conversion in selected zonal railways, energy-speed monitoring systems and driver-advice systems in locomotives and training of loco pilots on energy-efficient driving in traction operations, as well as replacing incandescent bulbs with CFLs and replacing inefficient fluorescent lamps in non-traction (buildings services). While such initiatives have been initiated and policy directives are issued, in general implementation faces a number of barriers, such as: (1) weak institutional arrangement and institutional capacity to promote and implement energy efficiency (EE) technologies and measures; (2) lack of in-house technical information on existing EE options and opportunities, and of technical

5
skills to implement them; (3) lack of proper incentives to favor the adoption and implementation of EE measures; (4) limited number of EE technologies and measures tested and available in India, and (5) lack of adequate resources to adopt and implement energy efficiency technologies and measures or replace obsolete technologies and high investment costs among other barriers. For example, Zonal and Division managers tend to focus on organizing the passenger and freight transport effectively, rather than on containing operational cost. In fact, decision-making on capital cost (e.g. investment in EE equipment) is separated from the operational cost account (i.e. paying recurrent expenses, such as the electricity bills). At central level, procurement decisions are guided by the principle of competitiveness of primarily prices rather than energy efficiency considerations. There is lack of awareness at unit manager level on EE; while technical staff members are aware but may lack knowledge about the latest state-of-the art EE technologies. The project will remove the identified barriers to energy efficiency in Indian Railways, through a comprehensive and integrated approach that will focus on (detailed in the table below)
Institutional capacity development and technical training; Implementation of already proven and low-risk EE technologies and measures; Pilot demonstration of EE technologies and measures; Monitoring and evaluation and knowledge dissemination.
Table 1: Overview of barriers to energy efficiency in Railways

6
Barrier Measures supported by the project to address the identified barriers (1) Institutional barriers - Lack of an EE
Corporate Policy The project will support the creation of a Centre of Excellence (COE) within IR which will be responsible for (i) promoting and coordinating EE activities within IR; (ii) providing technical support and advice on EE technologies and measures, including trainings; and (iii) collecting and disseminating information on EE technologies and measures (Output 1.2).
- Lack of institutional set-up to promote and monitor EE measures
- Lack of adequate capacity within training and testing facilities
The project will support existing training institutes in upgrading/strengthening their capacity for delivering trainings and conducting tests on EE (Output 1.3).
- Lack of consideration for EE measures and energy conservation practices in standard specifications for the purchase of material and equipment
The project will support the creation of a Centre of Excellence (COE) which will be responsible, among other tasks, to collect and disseminate information on EE technologies. One of the tasks of the COE will be the review and development of improved EE specifications for technologies, installation, testing, and operation and maintenance procedures, and of audit manuals/guidelines on EE for specific railway operations (Output 1.2). Within the COE, a Technology Information Resource and Facilitation Desk (TIRFAD) will be established to disseminate information on EE technologies and measures to equipment vendors (Output 1.2).
Information and capacity barriers - Insufficient
information/awareness among IR officials and staff about existing EE measures
The project will support the creation of a Centre of Excellence (COE) which will be responsible, among other tasks, to collect and disseminate information on EE technologies and measures (Output 1.2). One of the tasks of COE will be to assess the existing EE technologies adopted by different units of the IR, and come-up with a list of priority technologies to be implemented in IR (Output 2.1). The COE will also develop and implement energy audit procedures for each railway operation to identify energy intensive departments and benchmarks for EE, and produce audit manuals for IR staff to monitor the key parameters of EE (Output 2.2). Finally, some of the activities that the project will support are the creation of a web-based portal for the dissemination of information of EE technologies and measures, benchmarks, training material and best practices to IR staff (Output 1.2), and the production of publications, leaflets, reports, and newsletters to disseminate the information and lessons learnt through the implementation of the project (Output 4.1).
- Lack of proper technical skills and capacity among IR staff to assess, test and implement EE technologies and measures
The project will support existing training institutes in developing and delivering trainings on EE technologies and best practices (Output 1.3). The project will in addition support the implementation of already proven EE technologies and measures to build confidence and capacity among IR staff to adopt and implement EE technologies (Output 2.3).
(2) Incentive barriers - Lack of incentives to
staff to implement EE measures
The project will support (i) the review of existing incentive and award schemes, both within and outside India, (ii) the development of suitable incentive schemes to encourage the adoption and implementation of EE measures, and (iii) the institutionalization of the incentive schemes, if successful (Output 2.4).
- Lack of incentives to vendors and manufacturers to develop/retail EE products
The project will indirectly provide incentives to vendors and manufactures to develop/retail EE products by (a) providing technical assistance to manufactures, vendors, importers, and new entrepreneurs to design and produce EE equipments (Output 2.3), and (b) supporting the implementation of already proven EE technologies and measures (Output 2.3).
(3) Technology barriers - Limited adoption of
proven EE technologies abroad
The project will support (a) the interaction of IR staff with ‘units of excellence’ of railways systems of other countries to identify/familiarize with other countries’ EE best practices (Output 1.1); (b) the development and implementation of training plans on EE best practices (Output 1.3); and (c) the piloting and testing of selected energy
7
To strengthen the institutional capacity of IR system for mainstreaming EE issues, a Centre of Excellence (COE) is planned under the Railways Board, as resource and support centre for the zonal and production units of IR and various autonomous organizations. Activities of the COE will be to (a) identify and review the existing technologies as compared to the leading technologies of the developed countries or elsewhere, (b) interact with world’s leading institutions and manufacturers, (c) assess and identify gaps regarding EE technologies and measures application in IR, (d) take appropriate steps to develop improved EE-friendly ‘material & workmanship’ (M&W) specifications to induct the technologies, installation, testing and maintenance procedures, (e) to develop audit manuals for all railway operations (traction and non-traction), (f) assist existing training institutions (within and outside Indian Railways) in providing training to staff at various levels on EE techniques and measures, and (g) provide guidance to various Zonal production and other IR units on the implementation and cost-effectiveness of EE measures and technologies. The project will support the establishment of the COE. Initially, the Project Management Unit will function as proto-COE (PMU-COE), which will be institutionalized within IR during the course of the project to ensure sustainability. The project will furthermore support the PMU-COE in providing guidance to trainers to develop requisite training module and to in-house and external testing houses on measurement and calibration of EE equipment of Indian Railways. Information on EE measures will be disseminated through an EE-dedicated web portal to IR staff and for general awareness. COE’s Technology Information Resource & Facilitation Desk (TIRFAD) will disseminate the information to industry sector for vendor development, adaptation and implementation interaction with equipment and product providers in India. The project will facilitate pilot implementation and demonstration of EE technology and measures in various units of IR. Being implemented monitored and promoted, these would then be replicated through IR’s own operations. Thus, knowledge sharing and learning is an important component of the project. International and national best practices on specific railway operations will be documented, while the project’s experiences and lesson learned will be documented and disseminated within IR and to other stakeholders. The international best practices will be shared with relevant IR staff through regular training courses. Once the EE programme is underway within IR, specific incentive schemes will be institutionalized to encourage measures and initiatives that lead to energy conservation. These incentives could be either in cash or in kind and would be instituted across different levels. Incentive scheme will be enhanced to include awards/rewards to individual employees (i.e. rolling trophy and public recognition) for identifying innovative ideas that result in energy efficiency. Details of such a scheme will be developed at the beginning of the project.
B. DESCRIBE THE CONSISTENCY OF THE PROJECT WITH NATIONAL AND/OR REGIONAL
PRIORITIES/PLANS:
With the introduction of the Energy Conservation (EC) Act 2001, the Government of India in recent years has been promoting energy efficiency in different industrial sectors. Under the EC Act, Indian Railways (IR) has been listed as a so-called ‘designated consumer’, which implies that IR needs to initiate an energy efficiency programme. Therefore Indian Railways (IR) is developing a long-term Energy Efficiency and Conservation Program (EECP) (2010-2032). The Program aims at progressively introducing a number of energy efficiency technologies and measures in the railways system. The objective of this Program is to save 10% of the electricity consumption in absolute terms by 2032, in line with the targets of national initiatives on energy conservation and climate change. The Railways Minister has committed to energy efficiency and GHG reduction in the railways system and this commitment has been extended to this project by means of a USD 21 million co-financing letter.
efficiency technologies and measures that have proven to be successful abroad, but have not yet been tested in India, to check their applicability in India (Output 3.1).
- Lack of specific R&D focused on EE
The project will not directly support activities aiming at addressing this specific barrier.
8
C. DESCRIBE THE CONSISTENCY OF THE PROJECT WITH GEF STRATEGIES AND STRATEGIC PROGRAMS:
The proposed project is in line with the GEF objective of the Operational Program 5, i.e. “to promote energy-efficient technologies and practices in industrial production and manufacturing processes” and the related Strategic Program 2 (SP-2) “Promoting energy efficiency in the industrial sector”.
D. JUSTIFY THE TYPE OF FINANCING SUPPORT PROVIDED WITH THE GEF RESOURCES:
Without the support from GEF, Indian Railways would continue implementing some EE initiatives in accordance with the Energy Conservation Act and IR’s EECP, but in practice at quite a low pace due to the prevailing barriers mentioned in the previous section. In the absence of the project’s interventions, the EECP will not be fully implemented. Consequently the level of energy consumption per passenger or freight per kilometre will remain the same as in the baseline scenario due to the slow or no uptake of new of emerging technologies and practices. Division managers will remain ignorant of the potential of EE and information dissemination on EE practices will remain hampered, if no well-structured demonstration of best practices and monitoring of energy and financial savings. Institutional capacity to implement innovative EE measures will remain limited and fragmented over the various zones and division of Indian Railways. As in a vicious circle, this will also fail to provide incentives for equipment vendors in India to adopt more energy-efficient designs and products for the railways sector.
E. OUTLINE THE COORDINATION WITH OTHER RELATED INITIATIVES:
This project has been selected under the ‘umbrella EE programme’ Programmatic Framework Project for Energy Efficiency in India (GEF project 3538) and has thus been prioritized by India’s Bureau of Energy Efficiency (BEE) and Department of Economic Affairs (DEA). Five projects on energy efficiency are proposed under this program: (i) Energy Efficiency Improvements in commercial Buildings (UNDP); (ii) Chillers Energy Efficiency Project (World Bank); (iii) Financing Energy Efficiency in Small and Medium Enterprises (World Bank); (iv) Promoting Energy Efficiency and Renewable Energy in Selected SME Clusters in India (UNIDO); and, (v) Improving Energy Efficiency in the Indian Railways System (UNDP).
F. DISCUSS THE VALUE-ADDED OF GEF INVOLVEMENT IN THE PROJECT DEMONSTRATED THROUGH
INCREMENTAL REASONING :
Baseline scenario
Indian Railways has in the past carried out few initiatives on energy efficiency in accordance with the Energy Conservation Act, and policy directives are periodically issued to promote the adoption of energy efficiency measures. However, the implementation of such initiatives and measures has been rather ad-hoc (i.e. based on the good will of sensitive officers) and uncoordinated. In general, the uptake of energy efficiency technologies and measures has been rather slow. To promote the adoption of energy efficiency technologies and measures in a more comprehensive and effective way, Indian Railways is developing a long-term Energy Efficiency and Conservation Program (EECP) (2010/11-2031/32) with the objective of saving 10% of the total electricity consumption in absolute terms by 2032. However, considering the pace with which energy efficiency measures have been implemented in the past, there is an inherent risk that the implementation of the EECP would also be slow. During project preparation a number of barriers have been identified as being responsible for low absorption rate of energy efficiency technologies and measures (ref. Section 3.3 of UNDP ProDoc for more details). Unless these barriers are addressed, it is likely that the implementation of the EECP would also be slow.
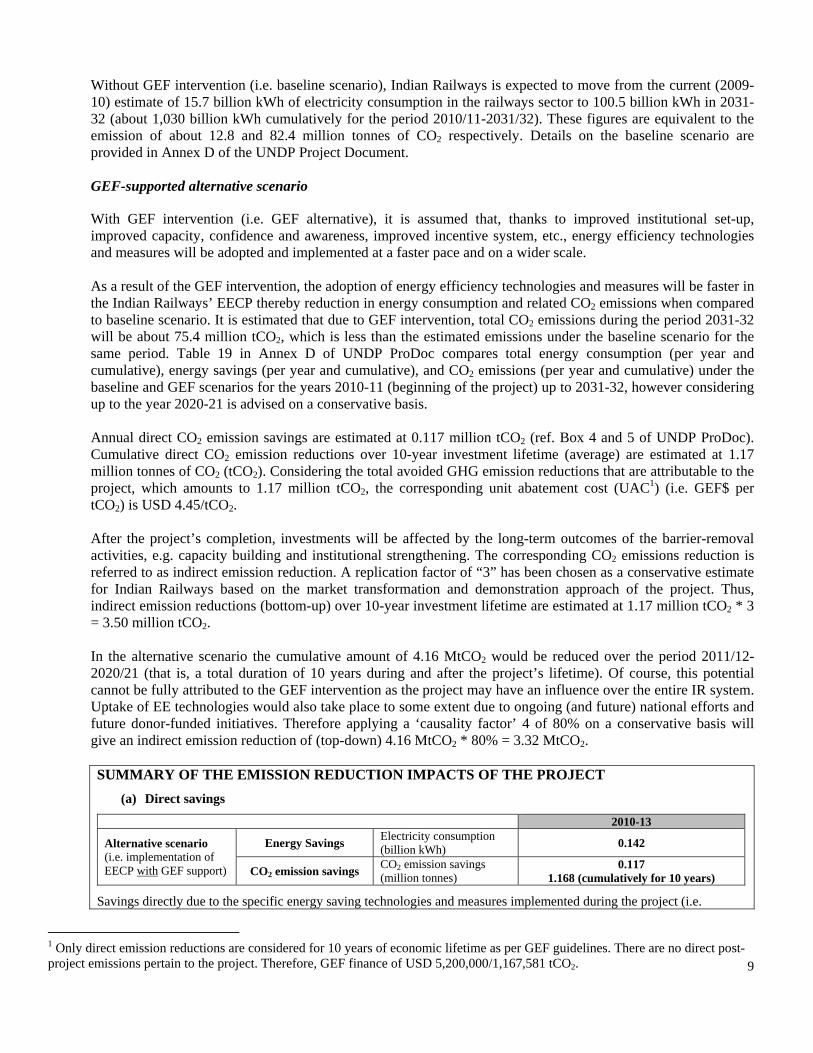
9
Without GEF intervention (i.e. baseline scenario), Indian Railways is expected to move from the current (2009-10) estimate of 15.7 billion kWh of electricity consumption in the railways sector to 100.5 billion kWh in 2031-32 (about 1,030 billion kWh cumulatively for the period 2010/11-2031/32). These figures are equivalent to the emission of about 12.8 and 82.4 million tonnes of CO2 respectively. Details on the baseline scenario are provided in Annex D of the UNDP Project Document. GEF-supported alternative scenario
With GEF intervention (i.e. GEF alternative), it is assumed that, thanks to improved institutional set-up, improved capacity, confidence and awareness, improved incentive system, etc., energy efficiency technologies and measures will be adopted and implemented at a faster pace and on a wider scale. As a result of the GEF intervention, the adoption of energy efficiency technologies and measures will be faster in the Indian Railways’ EECP thereby reduction in energy consumption and related CO2 emissions when compared to baseline scenario. It is estimated that due to GEF intervention, total CO2 emissions during the period 2031-32 will be about 75.4 million tCO2, which is less than the estimated emissions under the baseline scenario for the same period. Table 19 in Annex D of UNDP ProDoc compares total energy consumption (per year and cumulative), energy savings (per year and cumulative), and CO2 emissions (per year and cumulative) under the baseline and GEF scenarios for the years 2010-11 (beginning of the project) up to 2031-32, however considering up to the year 2020-21 is advised on a conservative basis. Annual direct CO2 emission savings are estimated at 0.117 million tCO2 (ref. Box 4 and 5 of UNDP ProDoc). Cumulative direct CO2 emission reductions over 10-year investment lifetime (average) are estimated at 1.17 million tonnes of CO2 (tCO2). Considering the total avoided GHG emission reductions that are attributable to the project, which amounts to 1.17 million tCO2, the corresponding unit abatement cost (UAC1) (i.e. GEF$ per tCO2) is USD 4.45/tCO2. After the project’s completion, investments will be affected by the long-term outcomes of the barrier-removal activities, e.g. capacity building and institutional strengthening. The corresponding CO2 emissions reduction is referred to as indirect emission reduction. A replication factor of “3” has been chosen as a conservative estimate for Indian Railways based on the market transformation and demonstration approach of the project. Thus, indirect emission reductions (bottom-up) over 10-year investment lifetime are estimated at 1.17 million tCO2 * 3 = 3.50 million tCO2. In the alternative scenario the cumulative amount of 4.16 MtCO2 would be reduced over the period 2011/12-2020/21 (that is, a total duration of 10 years during and after the project’s lifetime). Of course, this potential cannot be fully attributed to the GEF intervention as the project may have an influence over the entire IR system. Uptake of EE technologies would also take place to some extent due to ongoing (and future) national efforts and future donor-funded initiatives. Therefore applying a ‘causality factor’ 4 of 80% on a conservative basis will give an indirect emission reduction of (top-down) 4.16 MtCO2 * 80% = 3.32 MtCO2. SUMMARY OF THE EMISSION REDUCTION IMPACTS OF THE PROJECT
(a) Direct savings
2010-13
Alternative scenario (i.e. implementation of EECP with GEF support)
Energy Savings Electricity consumption (billion kWh) 0.142
CO2 emission savings CO2 emission savings (million tonnes)
0.117 1.168 (cumulatively for 10 years)
Savings directly due to the specific energy saving technologies and measures implemented during the project (i.e.
1 Only direct emission reductions are considered for 10 years of economic lifetime as per GEF guidelines. There are no direct post-project emissions pertain to the project. Therefore, GEF finance of USD 5,200,000/1,167,581 tCO2.
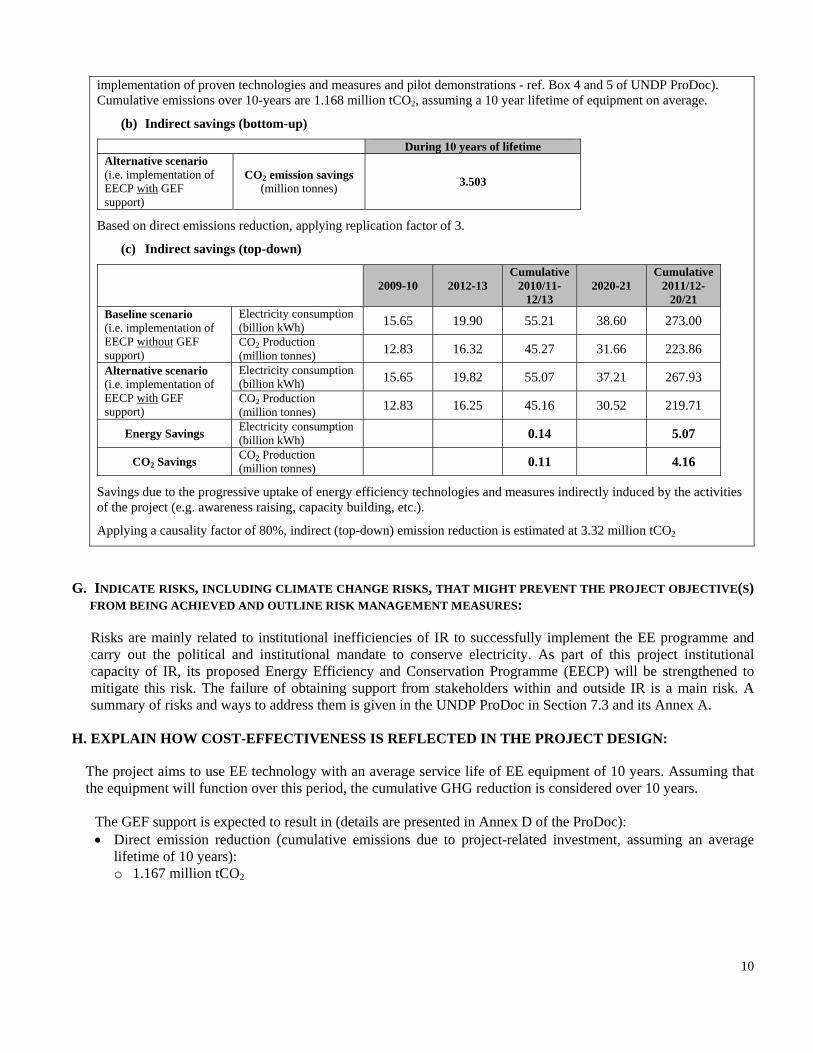
10
implementation of proven technologies and measures and pilot demonstrations - ref. Box 4 and 5 of UNDP ProDoc). Cumulative emissions over 10-years are 1.168 million tCO2, assuming a 10 year lifetime of equipment on average.
(b) Indirect savings (bottom-up)
During 10 years of lifetime Alternative scenario (i.e. implementation of EECP with GEF support)
CO2 emission savings (million tonnes) 3.503
Based on direct emissions reduction, applying replication factor of 3.
(c) Indirect savings (top-down)
2009-10 2012-13 Cumulative
2010/11-12/13
2020-21 Cumulative
2011/12-20/21
Baseline scenario (i.e. implementation of EECP without GEF support)
Electricity consumption (billion kWh) 15.65 19.90 55.21 38.60 273.00
CO2 Production (million tonnes) 12.83 16.32 45.27 31.66 223.86
Alternative scenario (i.e. implementation of EECP with GEF support)
Electricity consumption (billion kWh) 15.65 19.82 55.07 37.21 267.93
CO2 Production (million tonnes) 12.83 16.25 45.16 30.52 219.71
Energy Savings Electricity consumption (billion kWh) 0.14 5.07
CO2 Savings CO2 Production (million tonnes) 0.11 4.16
Savings due to the progressive uptake of energy efficiency technologies and measures indirectly induced by the activities of the project (e.g. awareness raising, capacity building, etc.).
Applying a causality factor of 80%, indirect (top-down) emission reduction is estimated at 3.32 million tCO2
G. INDICATE RISKS, INCLUDING CLIMATE CHANGE RISKS, THAT MIGHT PREVENT THE PROJECT OBJECTIVE(S)
FROM BEING ACHIEVED AND OUTLINE RISK MANAGEMENT MEASURES:
Risks are mainly related to institutional inefficiencies of IR to successfully implement the EE programme and carry out the political and institutional mandate to conserve electricity. As part of this project institutional capacity of IR, its proposed Energy Efficiency and Conservation Programme (EECP) will be strengthened to mitigate this risk. The failure of obtaining support from stakeholders within and outside IR is a main risk. A summary of risks and ways to address them is given in the UNDP ProDoc in Section 7.3 and its Annex A.
H. EXPLAIN HOW COST-EFFECTIVENESS IS REFLECTED IN THE PROJECT DESIGN:
The project aims to use EE technology with an average service life of EE equipment of 10 years. Assuming that the equipment will function over this period, the cumulative GHG reduction is considered over 10 years.
The GEF support is expected to result in (details are presented in Annex D of the ProDoc): Direct emission reduction (cumulative emissions due to project-related investment, assuming an average
lifetime of 10 years): o 1.167 million tCO2

11
o Considering the total avoided GHG emission reductions that are attributable to the project, which amounts to 1.17 million tCO2, the corresponding unit abatement cost (UAC2) (i.e. GEF$ per tCO2) is USD 4.45/tCO2.
Indirect emission reduction, estimated at ranging from: o 3.50 million tCO2 (bottom-up) o 3.32 million tCO2 (top-down)
PART III: INSTITUTIONAL COORDINATION AND SUPPORT
A. INSTITUTIONAL ARRANGEMENTS:
No other GEF agencies are involved in the proposed project . The project will be coordinated with other projects overall “Programmatic Framework Project for Energy Efficiency in India” (GEF project 3538). Five projects on energy efficiency are proposed under this programme: (i) Energy Efficiency Improvements in commercial Buildings (UNDP); (ii) Chillers Energy Efficiency Project (World Bank); (iii) Financing Energy Efficiency in Small and Medium Enterprises (World Bank); (iv) Promoting Energy Efficiency and Renewable Energy in Selected SME Clusters in India (UNIDO); and, (v) Improving Energy Efficiency in the Indian Railways System (UNDP).
B. PROJECT IMPLEMENTATION ARRANGEMENTS:
Indian Railways is the Implementing Partner for the project. Project is planned to be implemented through a Project Management Unit which will transform into a Centre of Excellence (COE). Later institutionalized within IR to identify the needs of EE on Indian Railways, promote best practices and EE technologies to the various IR zonal, production and other units. Also develop specifications and code of practices for implementation of EE measures. Details on project management as well as project monitoring and evaluation are provided in Sections 12 and 13 of the accompanying UNDP ProDoc.
PART IV: EXPLAIN THE ALIGNMENT OF PROJECT DESIGN WITH THE ORIGINAL PIF:
During the PPG phase, consultations with the different Railway divisions, more clarity was obtained of the energy efficiency technologies and measures. A detailed cost analysis was also performed for the implementation of proven and pilot demonstration of energy efficiency technologies and measures. This had subsequently led to a change in related outputs and related budget allocation. The overall contribution of GEF and co-financing will remain the same. Apart from these changes re-positioning, re-budgeting and editing the text of the various outputs in the project framework, there is no major re-alignment from the original project design as presented in the PIF.
Table 2: Overview of changes from PIF to ProDoc
Expected Outputs Rationale for Changes in PIF
Outputs/Activities in the ProDoc GEF-Approved PIF Project Document Component 1. Institutional Capacity Development and Technical Training
Component 1. Institutional capacity development and technical training
No change
1.1 At least 1000 Railway technical staff (officers, supervisors, engineers) trained 1.2 Testing House staff trained for
1.1 Documented energy efficiency (EE) best practices (measures and technologies) and defined EE benchmarks for
Reorganized the outputs in a sequential manner and rephrased the outputs. Change in budget: There is a slight reduction
2 Only direct emission reductions are considered for 10 years of economic lifetime as per GEF guidelines. There are no direct post-project emissions pertain to the project. Therefore, GEF finance of USD 5,200,000/1,167,581 tCO2.

12
Expected Outputs Rationale for Changes in PIF Outputs/Activities in the ProDoc GEF-Approved PIF Project Document
measurement and calibration of the equipments used in railways 1.3 Support the Center of Excellence
railways systems 1.2 Established and supported Centre of Excellence (COE) 1.3 Trained and qualified staff members of the relevant IR departments capable of implementing EE technologies, measures, and best practices
in the total budget for this component when compared to the amount mentioned in PIF.
Component 2. Implement. of EE technologies and measures
Component 2. Implementation of proven energy efficiency technologies and measures
Rephrased based on the clarity obtained during the PPG phase. Now priority is given for the implementation of proven energy efficiency technologies and measures.
2.1 Information on technology status and best operating practices compiled for Lighting, EE Pump, Power Devices, Green Building, HVAC, DG Set, Sensors and Automatic Metering of Energy 2.2 Prepare and implement energy audit procedures for each railway operation e.g., production unit, traction Substations, Workshop, Production Unit, Maintenance depot and Buildings 2.3 Cost/ benefit’ analyses for priority technologies/ measures conducted 2.4 Railway’s internal incentives scheme for implementing EE tech/ measures created and implemented
2.1 Documented detailed information on available EE technologies and measures 2.2 Developed and implemented energy audit procedures 2.3 Completed implementation of ready and proven technologies and measures 2.4 Developed and implemented incentive schemes
During the PPG phase, extensive consultations were conducted with different divisions of Indian Railways for selecting the energy efficiency technologies and measures. Based on the analysis, ready and proven energy efficiency technologies and measures are selected. Then a detailed analysis was conducted on the cost details of these technologies and measures. Therefore based on the clarity of interventions, changed the outputs accordingly under this component in the ProDoc. Change in budget: Subsequently to reflect the above changes (more clarity on the cost details of the interventions); there is an increase in total budget. GEF funds allocated in the ProDoc are slightly higher than previously anticipated in the PIF.
Component 3. Pilot demonstration of EE technologies and measures
Component 3. Pilot demonstration of energy efficiency technologies and measures
Rephrased
3.1 Piloting and Demonstrating tech./ measures in Testing House, EE Rolling Stock, Static installation, Workshop and Production Facilities
3.1 Completed demonstration of EE technologies and measures
Based on the clarity obtained during PPG phase, some of these of technologies and/or measures changed. Change in budget: Some of this budget mentioned in the PIF is now shifted to implement the ready and proven technologies. Thus the funds allocated in ProDoc are nearly half when compared to the amount anticipated in the PIF.
Component 4. Knowledge sharing and learning
Component 4. Information and knowledge sharing
Rephrased
4.1 Identify international best practice from Japan, Germany France and others 4.2 Facilitate dissemination of knowledge between the Center of Excellence and similar institutes abroad
4.1 Collected lessons learned and developed knowledge sharing products 4.2 Developed post-project action plan for DOE
Change in the output: As most of these best practices are, to certain extent, sourced through secondary information. More focus/attention is given in the ProDoc towards collecting and dissemination of the lessons learned from the implementation of ready and proven technologies and/or
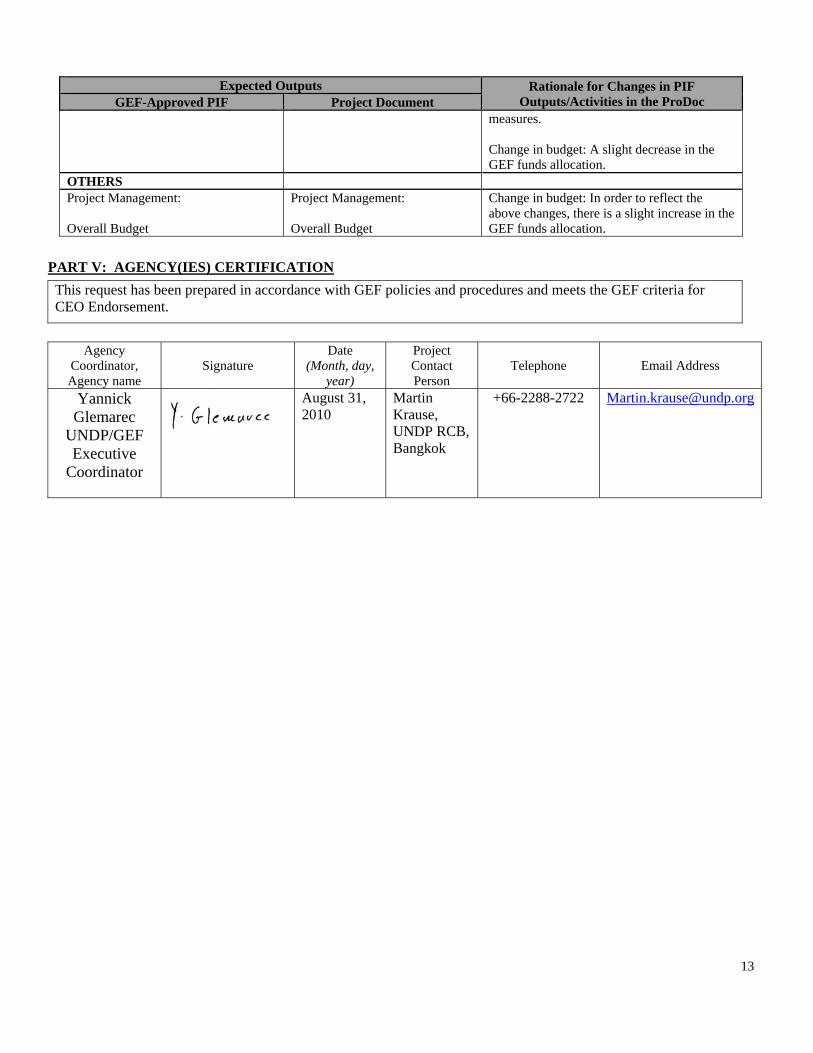
13
Expected Outputs Rationale for Changes in PIF Outputs/Activities in the ProDoc GEF-Approved PIF Project Document
measures. Change in budget: A slight decrease in the GEF funds allocation.
OTHERS Project Management: Overall Budget
Project Management: Overall Budget
Change in budget: In order to reflect the above changes, there is a slight increase in the GEF funds allocation.
PART V: AGENCY(IES) CERTIFICATION
This request has been prepared in accordance with GEF policies and procedures and meets the GEF criteria for CEO Endorsement.
Agency
Coordinator, Agency name
Signature
Date (Month, day,
year)
Project Contact Person
Telephone
Email Address
Yannick Glemarec
UNDP/GEF Executive
Coordinator
August 31, 2010
Martin Krause, UNDP RCB, Bangkok
+66-2288-2722 [email protected]

14
ANNEX A: PROJECT RESULTS FRAMEWORK Applicable GEF Strategic Objective and Program: Strategic Programme 2 (SP-2): Promoting Energy Efficiency in the Industrial sector Applicable GEF Expected Outcomes: Increased deployment of energy efficient technologies and practices Applicable GEF Outcome Indicators: (a) amount of energy saved (b) tonnes of CO2 avoided, (c) number of energy efficient technologies and measures promoted
Table 3: Project Planning Matrix (PPM)
Strategy Objectively Verifiable Indicators Means of Gauging Success/Source
of verification Assumptions
Indicator Baseline Targets Project Goal: Reduction of GHG emissions in the Indian Railways System (IRS)
Cumulative emission reductions3 achieved in the IRS by EOP4 (million t CO2)
0 0.117 M&E reports of the pilot/model projects and documents available with IRS.
Timely execution of planned activities planned with adequate resource mobilization
Efficient and quality measurement & recording systems are available
Field units of IR extend the support in desired manner and effectively implement the identified EE measures
Project Objective Removal of key barriers that prevent the wide adoption of energy efficiency technologies and measures in the IRS
Total direct energy savings5 by EOP (billion kWh)
0 0.142 See Annex D Energy bills verified by IR and
technical reports
Timely implementation of all identified measures
IR zonal, division and other unit managers are willing to give EE importance in their investment decisions
Strategy Objectively Verifiable Indicators Means of Gauging Success/Source of verification
Assumptions
Indicator Baseline Targets Component 1: Institutional capacity development and technical training6 Outcome 1.1: Strengthened IR institutional capacity
Status report of targeted EE technologies / measures, its availability in India/abroad and gap analysis for its implementation
0 1 Status report Letter of appointment of head and
staff Office space allocated
Managers and technical staff are willing to benefit from training and supporting materials
Subjected to the availability of the funds
3 Total direct emission reductions (from year 3 of the project i.e. final year) 4 The use of words “End of Project (EOP)” and “Year 3” are interchangeably used, which means the same 5 Total direct energy savings (from year 3 of the project i.e. final year) 6 The objective and all outcomes monitored annually in the APR/PIR, according to the suggested list of indicators.
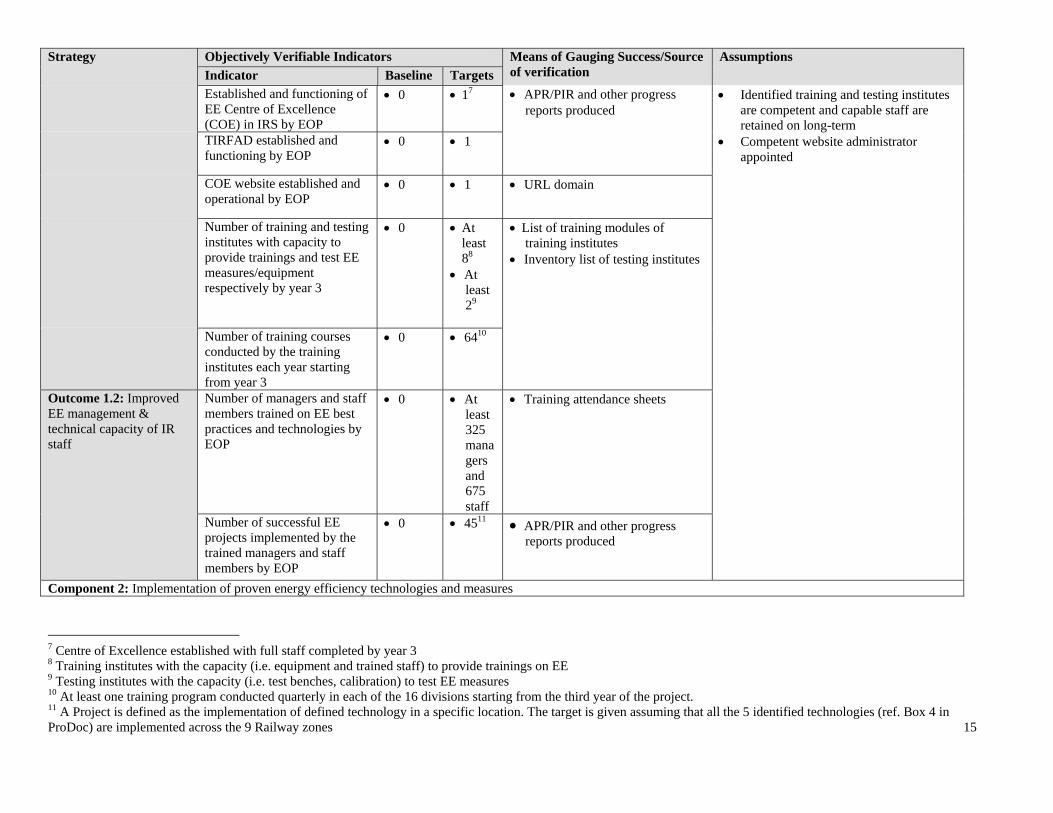
15
Strategy Objectively Verifiable Indicators Means of Gauging Success/Source of verification
Assumptions
Indicator Baseline Targets Established and functioning of EE Centre of Excellence (COE) in IRS by EOP
0 17 APR/PIR and other progress reports produced
Identified training and testing institutes are competent and capable staff are retained on long-term
Competent website administrator appointed
TIRFAD established and functioning by EOP
0 1
COE website established and operational by EOP
0 1 URL domain
Number of training and testing institutes with capacity to provide trainings and test EE measures/equipment respectively by year 3
0 At least 88
At least 29
List of training modules of training institutes
Inventory list of testing institutes
Number of training courses conducted by the training institutes each year starting from year 3
0 6410
Outcome 1.2: Improved EE management & technical capacity of IR staff
Number of managers and staff members trained on EE best practices and technologies by EOP
0 At least 325 managers and 675 staff
Training attendance sheets
Number of successful EE projects implemented by the trained managers and staff members by EOP
0 4511 APR/PIR and other progress reports produced
Component 2: Implementation of proven energy efficiency technologies and measures
7 Centre of Excellence established with full staff completed by year 3 8 Training institutes with the capacity (i.e. equipment and trained staff) to provide trainings on EE 9 Testing institutes with the capacity (i.e. test benches, calibration) to test EE measures 10 At least one training program conducted quarterly in each of the 16 divisions starting from the third year of the project. 11 A Project is defined as the implementation of defined technology in a specific location. The target is given assuming that all the 5 identified technologies (ref. Box 4 in ProDoc) are implemented across the 9 Railway zones
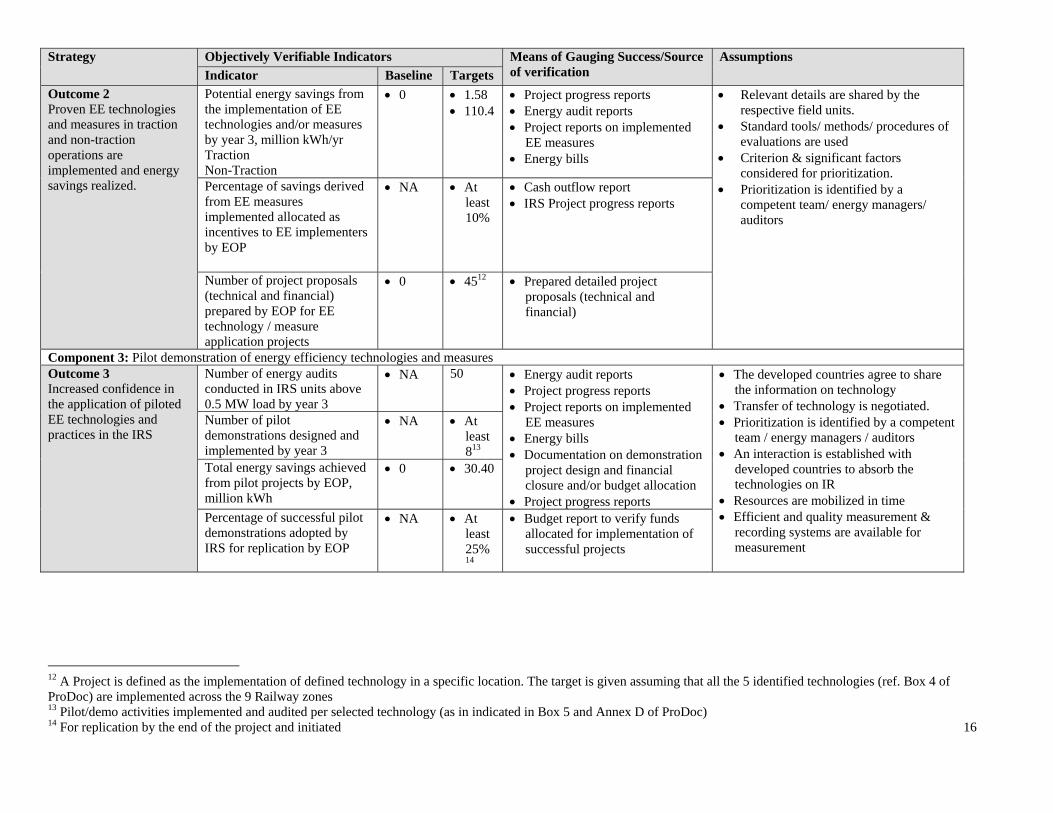
16
Strategy Objectively Verifiable Indicators Means of Gauging Success/Source of verification
Assumptions
Indicator Baseline Targets
Outcome 2 Proven EE technologies and measures in traction and non-traction operations are implemented and energy savings realized.
Potential energy savings from the implementation of EE technologies and/or measures by year 3, million kWh/yr Traction Non-Traction
0
1.58 110.4
Project progress reports Energy audit reports Project reports on implemented
EE measures Energy bills
Relevant details are shared by the respective field units.
Standard tools/ methods/ procedures of evaluations are used
Criterion & significant factors considered for prioritization.
Prioritization is identified by a competent team/ energy managers/ auditors
Percentage of savings derived from EE measures implemented allocated as incentives to EE implementers by EOP
NA At least 10%
Cash outflow report IRS Project progress reports
Number of project proposals (technical and financial) prepared by EOP for EE technology / measure application projects
0 4512 Prepared detailed project proposals (technical and financial)
Component 3: Pilot demonstration of energy efficiency technologies and measures Outcome 3 Increased confidence in the application of piloted EE technologies and practices in the IRS
Number of energy audits conducted in IRS units above 0.5 MW load by year 3
NA 50 Energy audit reports Project progress reports Project reports on implemented
EE measures Energy bills Documentation on demonstration
project design and financial closure and/or budget allocation
Project progress reports
The developed countries agree to share the information on technology
Transfer of technology is negotiated. Prioritization is identified by a competent
team / energy managers / auditors An interaction is established with
developed countries to absorb the technologies on IR
Resources are mobilized in time Efficient and quality measurement &
recording systems are available for measurement
Number of pilot demonstrations designed and implemented by year 3
NA At least 813
Total energy savings achieved from pilot projects by EOP, million kWh
0 30.40
Percentage of successful pilot demonstrations adopted by IRS for replication by EOP
NA At least 25%14
Budget report to verify funds allocated for implementation of successful projects
12 A Project is defined as the implementation of defined technology in a specific location. The target is given assuming that all the 5 identified technologies (ref. Box 4 of ProDoc) are implemented across the 9 Railway zones 13 Pilot/demo activities implemented and audited per selected technology (as in indicated in Box 5 and Annex D of ProDoc) 14 For replication by the end of the project and initiated

17
Strategy Objectively Verifiable Indicators Means of Gauging Success/Source of verification
Assumptions
Indicator Baseline Targets Based on energy audits, number of EE technologies and measures identified as feasible for implementation (planned and budgeted) by year 3
NA At least 515
Documentation on demonstration project design and financial closure and/or budget allocation
Project implementation progress reports
Component 4: Information and knowledge sharing Outcome 4 Information and knowledge on EE technologies and measures are widely available and accessible for IRS divisions and their affiliates
Average number of visitors visiting the web portal each year starting year 2
NA 24,000
Web portal counter
Captured all the information, updated knowledge and documented the results
The web portal is created and operational
TIRFAD is created and operational
Number of sets of knowledge sharing products (KSPs) developed and disseminated by EOP
NA 1316 Annual report
Number of awareness campaigns conducted per division per year starting year 3
0 55217 Annual report
Number of IRS divisions that are actively participating in IRS EE programs by EOP
0 68 Annual report at the divisional level
Number of vendors registering with TIRFAD each year starting year 3 (i.e. from 2013)
NA About 318
TIRFAD registration log
Cumulative number of vendors attending TIRFAD campaigns by the EOP
0 At least 3919
15 Pilots design for implementation as per selected technology and/or measure (as in indicated in Box 4 and Annex D of ProDoc) 16 At least one leaflet/booklet for each technology or a measure that will be demonstrated will be produced. This information is included in a regular (project) newsletter and also uploaded onto the web. 17 At least 2 campaigns per division per year conducted by the end of the project (i.e. 68 divisions + 16 zonal headquarters + 1 railways + IRIEEN + IDSO + 5 production units x 3 years) over 16 zonal headquarters 18 Per successful pilot technology register with TIRFAD 19 At least three vendors per technology (13 numbers)

18
ANNEX B: RESPONSES TO PROJECT REVIEWS (from GEF Secretariat and GEF Agencies, and Responses to Comments from Council at work program inclusion and the Convention Secretariat and STAP at PIF) RESPONSES TO GEFSEC COMMENTS (16 FEBRUARY 2011)
Comments and Responses Reference
COMMENTS ON CEO ENDORSEMENT (FSP)
Question 19: [08- Feb-11] The issue is not yet properly addressed. It was explained that "based on a detailed analysis of the anticipated cost for the management of the project, a total amount of roundabout US$1,470,000 was estimated." Hence "US $1,470,000 can be maintained in total. However as GEF funding and cofinancing for the whole project is $5,200,000 and $21,000,000 respectively, GEF funding for project management should be round $ 290,000(= 1,470,000 x 5,200,000/26,200,000). Response: [08-Feb-11] As suggested, the GEF funding for project management has been adjusted. Accordingly, the co-financing share of the project management cost has been increased to balance the required total project management cost of US$ 1,470,000. The revised details could be seen from the table below.
Budget Items Person weeks
GEF Amount
($)
Co-financing
($)
Project management
Total ($) Local consultants and staff
275 243,250 861,650 1,104,900
Office facilities, equipment
26,378 131,197 157,575
Travel 21,872 185,653 207,525 Total 291,500 1,178,500 1,470,000
CER, Part I, Table A, p 2 & Table F, p 3. and ProDoc, section 11, Table 13B, p 50
RESPONSES TO GEFSEC COMMENTS (20 JANUARY 2011)
Comments and Responses Reference COMMENTS ON CEO ENDORSEMENT (FSP) Question 19: [19- Nov-10]The total amount for the project management was significantly increased from the budget originally proposed (from $1.47 million to $2.62 million), which is not acceptable. Please keep the same level of the total amount as originally proposed ($1,470,000) and revise the GEF amount instead of cofinancing. The resources remaining can be used for the other components.
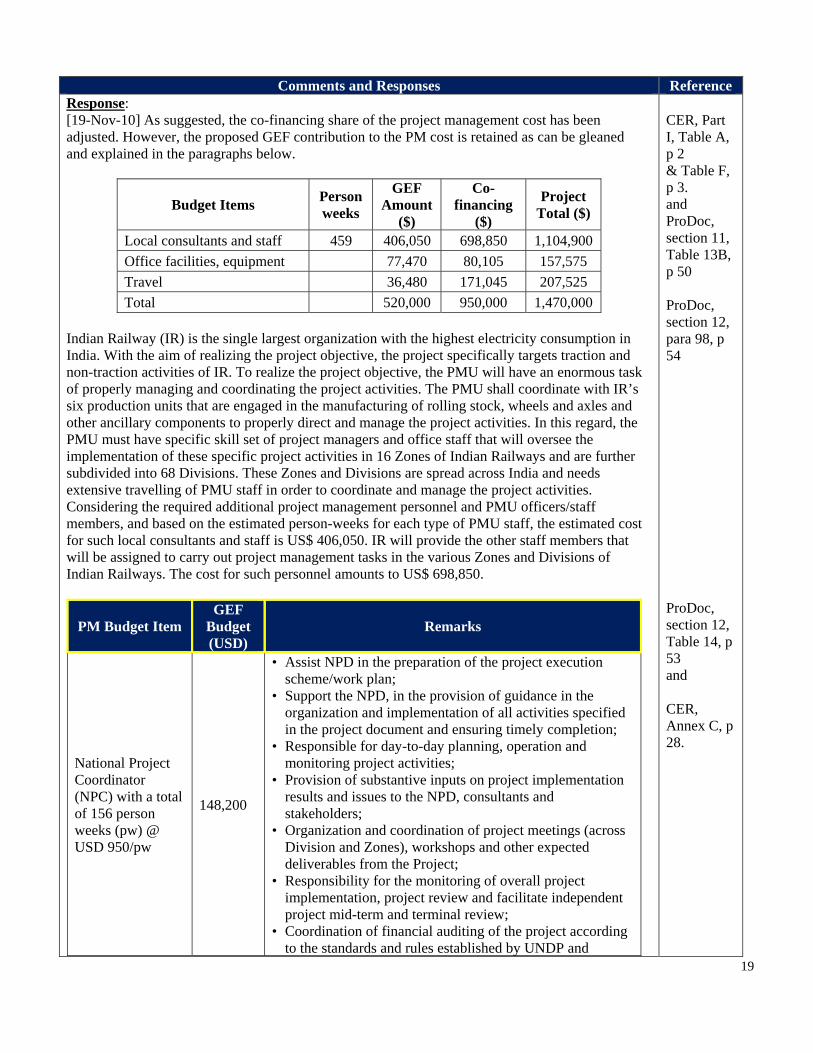
19
Comments and Responses Reference Response: [19-Nov-10] As suggested, the co-financing share of the project management cost has been adjusted. However, the proposed GEF contribution to the PM cost is retained as can be gleaned and explained in the paragraphs below.
Budget Items Person weeks
GEF Amount
($)
Co-financing
($)
Project Total ($)
Local consultants and staff 459 406,050 698,850 1,104,900
Office facilities, equipment 77,470 80,105 157,575
Travel 36,480 171,045 207,525
Total 520,000 950,000 1,470,000
Indian Railway (IR) is the single largest organization with the highest electricity consumption in India. With the aim of realizing the project objective, the project specifically targets traction and non-traction activities of IR. To realize the project objective, the PMU will have an enormous task of properly managing and coordinating the project activities. The PMU shall coordinate with IR’s six production units that are engaged in the manufacturing of rolling stock, wheels and axles and other ancillary components to properly direct and manage the project activities. In this regard, the PMU must have specific skill set of project managers and office staff that will oversee the implementation of these specific project activities in 16 Zones of Indian Railways and are further subdivided into 68 Divisions. These Zones and Divisions are spread across India and needs extensive travelling of PMU staff in order to coordinate and manage the project activities. Considering the required additional project management personnel and PMU officers/staff members, and based on the estimated person-weeks for each type of PMU staff, the estimated cost for such local consultants and staff is US$ 406,050. IR will provide the other staff members that will be assigned to carry out project management tasks in the various Zones and Divisions of Indian Railways. The cost for such personnel amounts to US$ 698,850.
PM Budget Item GEF
Budget (USD)
Remarks
National Project Coordinator (NPC) with a total of 156 person weeks (pw) @ USD 950/pw
148,200
• Assist NPD in the preparation of the project execution scheme/work plan;
• Support the NPD, in the provision of guidance in the organization and implementation of all activities specified in the project document and ensuring timely completion;
• Responsible for day-to-day planning, operation and monitoring project activities;
• Provision of substantive inputs on project implementation results and issues to the NPD, consultants and stakeholders;
• Organization and coordination of project meetings (across Division and Zones), workshops and other expected deliverables from the Project;
• Responsibility for the monitoring of overall project implementation, project review and facilitate independent project mid-term and terminal review;
• Coordination of financial auditing of the project according to the standards and rules established by UNDP and
CER, Part I, Table A, p 2 & Table F, p 3. and ProDoc, section 11, Table 13B, p 50 ProDoc, section 12, para 98, p 54 ProDoc, section 12, Table 14, p 53 and CER, Annex C, p 28.
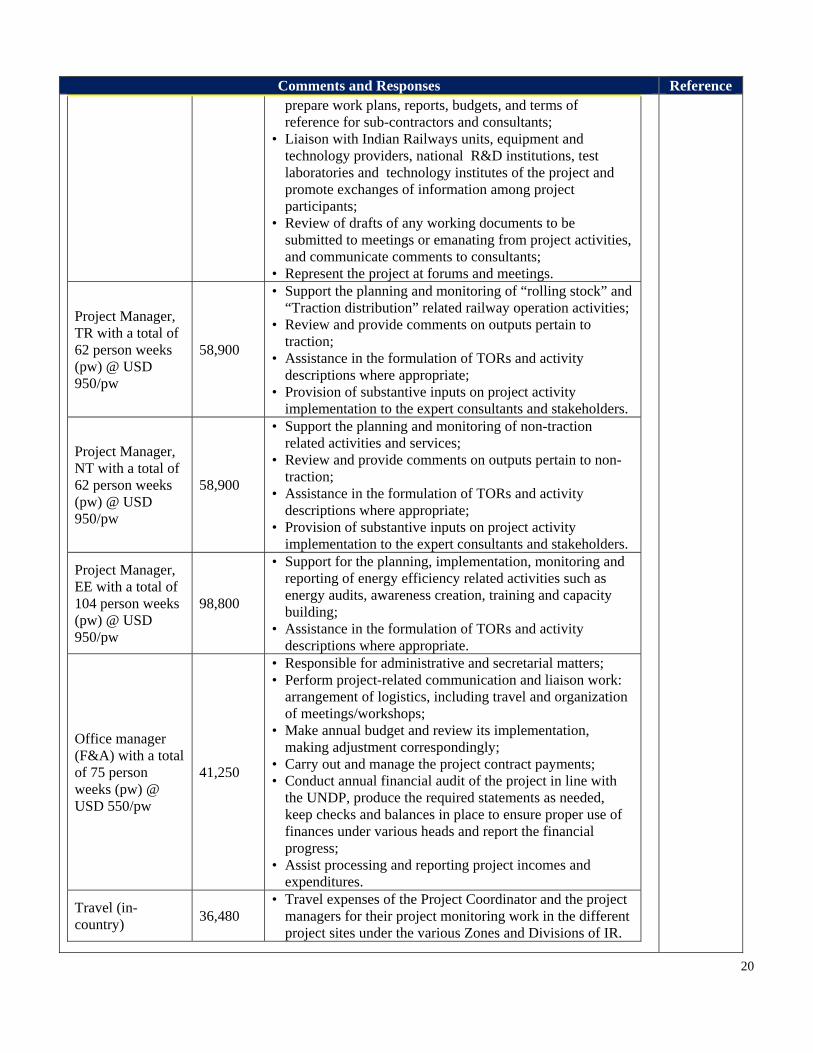
20
Comments and Responses Reference prepare work plans, reports, budgets, and terms of reference for sub-contractors and consultants;
• Liaison with Indian Railways units, equipment and technology providers, national R&D institutions, test laboratories and technology institutes of the project and promote exchanges of information among project participants;
• Review of drafts of any working documents to be submitted to meetings or emanating from project activities, and communicate comments to consultants;
• Represent the project at forums and meetings.
Project Manager, TR with a total of 62 person weeks (pw) @ USD 950/pw
58,900
• Support the planning and monitoring of “rolling stock” and “Traction distribution” related railway operation activities;
• Review and provide comments on outputs pertain to traction;
• Assistance in the formulation of TORs and activity descriptions where appropriate;
• Provision of substantive inputs on project activity implementation to the expert consultants and stakeholders.
Project Manager, NT with a total of 62 person weeks (pw) @ USD 950/pw
58,900
• Support the planning and monitoring of non-traction related activities and services;
• Review and provide comments on outputs pertain to non-traction;
• Assistance in the formulation of TORs and activity descriptions where appropriate;
• Provision of substantive inputs on project activity implementation to the expert consultants and stakeholders.
Project Manager, EE with a total of 104 person weeks (pw) @ USD 950/pw
98,800
• Support for the planning, implementation, monitoring and reporting of energy efficiency related activities such as energy audits, awareness creation, training and capacity building;
• Assistance in the formulation of TORs and activity descriptions where appropriate.
Office manager (F&A) with a total of 75 person weeks (pw) @ USD 550/pw
41,250
• Responsible for administrative and secretarial matters; • Perform project-related communication and liaison work:
arrangement of logistics, including travel and organization of meetings/workshops;
• Make annual budget and review its implementation, making adjustment correspondingly;
• Carry out and manage the project contract payments; • Conduct annual financial audit of the project in line with
the UNDP, produce the required statements as needed, keep checks and balances in place to ensure proper use of finances under various heads and report the financial progress;
• Assist processing and reporting project incomes and expenditures.
Travel (in-country)
36,480 • Travel expenses of the Project Coordinator and the project
managers for their project monitoring work in the different project sites under the various Zones and Divisions of IR.
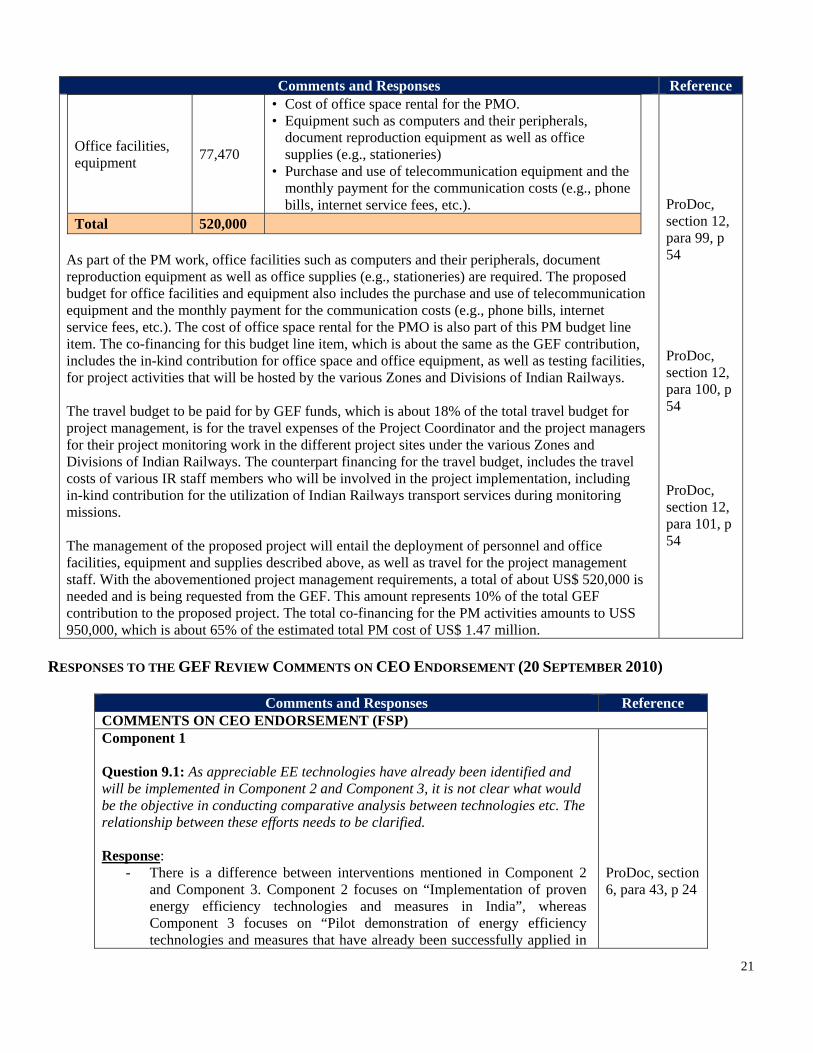
21
Comments and Responses Reference
Office facilities, equipment
77,470
• Cost of office space rental for the PMO. • Equipment such as computers and their peripherals,
document reproduction equipment as well as office supplies (e.g., stationeries)
• Purchase and use of telecommunication equipment and the monthly payment for the communication costs (e.g., phone bills, internet service fees, etc.).
Total 520,000
As part of the PM work, office facilities such as computers and their peripherals, document reproduction equipment as well as office supplies (e.g., stationeries) are required. The proposed budget for office facilities and equipment also includes the purchase and use of telecommunication equipment and the monthly payment for the communication costs (e.g., phone bills, internet service fees, etc.). The cost of office space rental for the PMO is also part of this PM budget line item. The co-financing for this budget line item, which is about the same as the GEF contribution, includes the in-kind contribution for office space and office equipment, as well as testing facilities, for project activities that will be hosted by the various Zones and Divisions of Indian Railways. The travel budget to be paid for by GEF funds, which is about 18% of the total travel budget for project management, is for the travel expenses of the Project Coordinator and the project managers for their project monitoring work in the different project sites under the various Zones and Divisions of Indian Railways. The counterpart financing for the travel budget, includes the travel costs of various IR staff members who will be involved in the project implementation, including in-kind contribution for the utilization of Indian Railways transport services during monitoring missions. The management of the proposed project will entail the deployment of personnel and office facilities, equipment and supplies described above, as well as travel for the project management staff. With the abovementioned project management requirements, a total of about US$ 520,000 is needed and is being requested from the GEF. This amount represents 10% of the total GEF contribution to the proposed project. The total co-financing for the PM activities amounts to USS 950,000, which is about 65% of the estimated total PM cost of US$ 1.47 million.
ProDoc, section 12, para 99, p 54 ProDoc, section 12, para 100, p 54 ProDoc, section 12, para 101, p 54
RESPONSES TO THE GEF REVIEW COMMENTS ON CEO ENDORSEMENT (20 SEPTEMBER 2010)
Comments and Responses Reference
COMMENTS ON CEO ENDORSEMENT (FSP) Component 1 Question 9.1: As appreciable EE technologies have already been identified and will be implemented in Component 2 and Component 3, it is not clear what would be the objective in conducting comparative analysis between technologies etc. The relationship between these efforts needs to be clarified. Response:
- There is a difference between interventions mentioned in Component 2 and Component 3. Component 2 focuses on “Implementation of proven energy efficiency technologies and measures in India”, whereas Component 3 focuses on “Pilot demonstration of energy efficiency technologies and measures that have already been successfully applied in
ProDoc, section 6, para 43, p 24

22
Comments and Responses Reference developed countries but have not yet been successfully demonstrated in India”. The objective of conducting a comparative analysis is to assess the efficacy and the compatibility of energy efficiency technologies applied and practiced in developed countries to the Indian context. This also helps to achieve interaction with entities in industrialized countries that have expertise in EE technology applications in railway systems.
Question 9.2: As EE benchmark will be defined, it needs to be applied in certain situations and monitored. Response:
- Agree. The defined EE benchmarks will certainly be applied and the Technology Information Resource Facilitation Desk (TIRFAD) that will be established during the project implementation will play a key role. EE benchmark will be applied first within different divisions of the Indian Railways Systems (IRS). The information on energy efficiency technologies, measures, and benchmarks will then be documented and disseminated to the Indian Railway divisions and production units, suppliers and the various associations within each operating zones and divisions of the company through the web portal. The established benchmarks will be monitored through the conduct of energy audits and revised based on the best energy efficiency achieved in the field units.
ProDoc, section 6, para 44, p 24 & ProDoc, section 6, para 53 and 57, p 28
Component 2 and Component 3 Question 9.3: Please specify that both Component 2 and Component 3 have investment component in table A Response:
- Corrected as suggested. Question 9.4: As for the Component 2 will implement proven technologies, the key is how to disseminate and deploy these technologies in wider scale in IR context rather than just demonstrating these technologies. Specific strategies need to be developed and implemented for each technology for that purpose. Audit procedures and incentive schemes should have close linkage to these technologies to be deployed. (Audits procedures needs to be designed to lead to proper actions.) In addition, it needs to be secured that regulatory/ policy frameworks will be put in place if it is found necessary to enforce them. Response:
- As mentioned above, TIRFAD will play a key role in the information dissemination of proven energy efficiency technologies, measures, and benchmarks to the Indian Railway divisions and production units, suppliers and the various associations within each operating zones and divisions of the company. Also, information gathered and processed will be placed in the web portal for effective dissemination. Having recognized the importance of energy audits, the activities that will be carried out to produce Output 2.2 are geared towards developing and implementing energy audit procedures for railways operation. Similarly, the activities that are designed to deliver Output 2.4 are meant to develop and implement an incentive scheme to provide incentives to Indian Railways
CER, Table A, p 1 ProDoc, section 6, para 51 and 52, p 27 & ProDoc, section 6, para 60, p 29
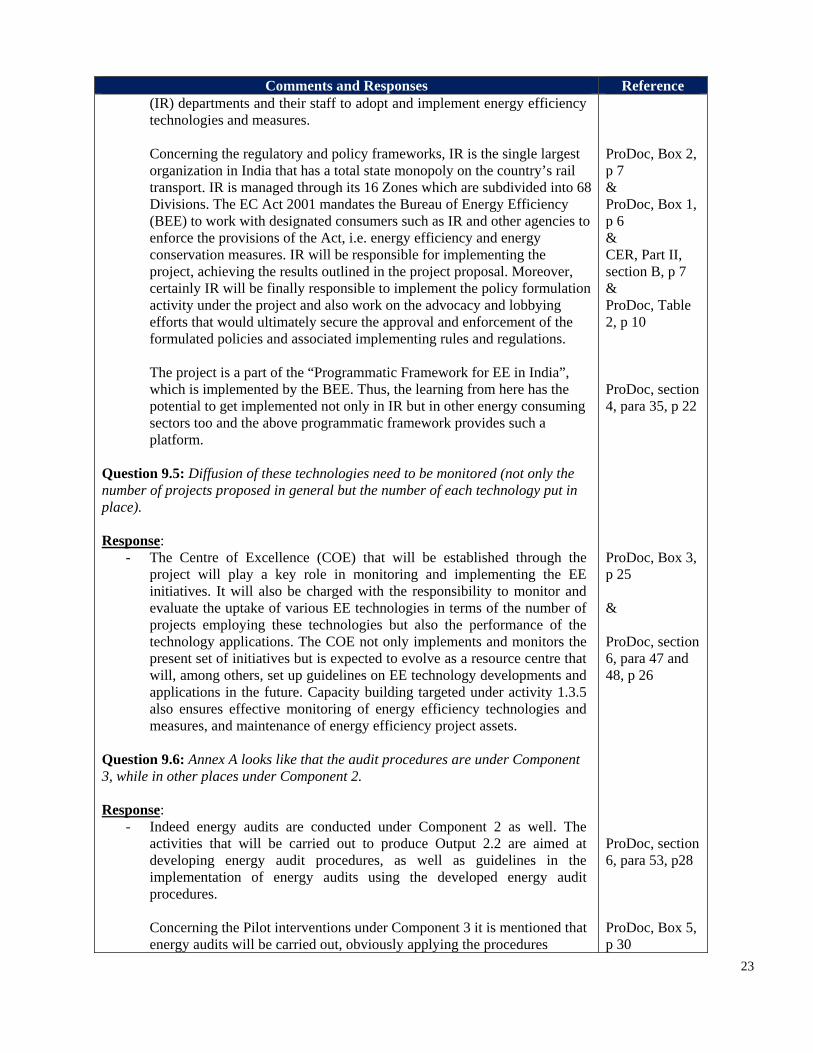
23
Comments and Responses Reference (IR) departments and their staff to adopt and implement energy efficiency technologies and measures. Concerning the regulatory and policy frameworks, IR is the single largest organization in India that has a total state monopoly on the country’s rail transport. IR is managed through its 16 Zones which are subdivided into 68 Divisions. The EC Act 2001 mandates the Bureau of Energy Efficiency (BEE) to work with designated consumers such as IR and other agencies to enforce the provisions of the Act, i.e. energy efficiency and energy conservation measures. IR will be responsible for implementing the project, achieving the results outlined in the project proposal. Moreover, certainly IR will be finally responsible to implement the policy formulation activity under the project and also work on the advocacy and lobbying efforts that would ultimately secure the approval and enforcement of the formulated policies and associated implementing rules and regulations. The project is a part of the “Programmatic Framework for EE in India”, which is implemented by the BEE. Thus, the learning from here has the potential to get implemented not only in IR but in other energy consuming sectors too and the above programmatic framework provides such a platform.
Question 9.5: Diffusion of these technologies need to be monitored (not only the number of projects proposed in general but the number of each technology put in place). Response:
- The Centre of Excellence (COE) that will be established through the project will play a key role in monitoring and implementing the EE initiatives. It will also be charged with the responsibility to monitor and evaluate the uptake of various EE technologies in terms of the number of projects employing these technologies but also the performance of the technology applications. The COE not only implements and monitors the present set of initiatives but is expected to evolve as a resource centre that will, among others, set up guidelines on EE technology developments and applications in the future. Capacity building targeted under activity 1.3.5 also ensures effective monitoring of energy efficiency technologies and measures, and maintenance of energy efficiency project assets.
Question 9.6: Annex A looks like that the audit procedures are under Component 3, while in other places under Component 2. Response:
- Indeed energy audits are conducted under Component 2 as well. The activities that will be carried out to produce Output 2.2 are aimed at developing energy audit procedures, as well as guidelines in the implementation of energy audits using the developed energy audit procedures. Concerning the Pilot interventions under Component 3 it is mentioned that energy audits will be carried out, obviously applying the procedures
ProDoc, Box 2, p 7 & ProDoc, Box 1, p 6 & CER, Part II, section B, p 7 & ProDoc, Table 2, p 10 ProDoc, section 4, para 35, p 22 ProDoc, Box 3, p 25 & ProDoc, section 6, para 47 and 48, p 26 ProDoc, section 6, para 53, p28 ProDoc, Box 5, p 30
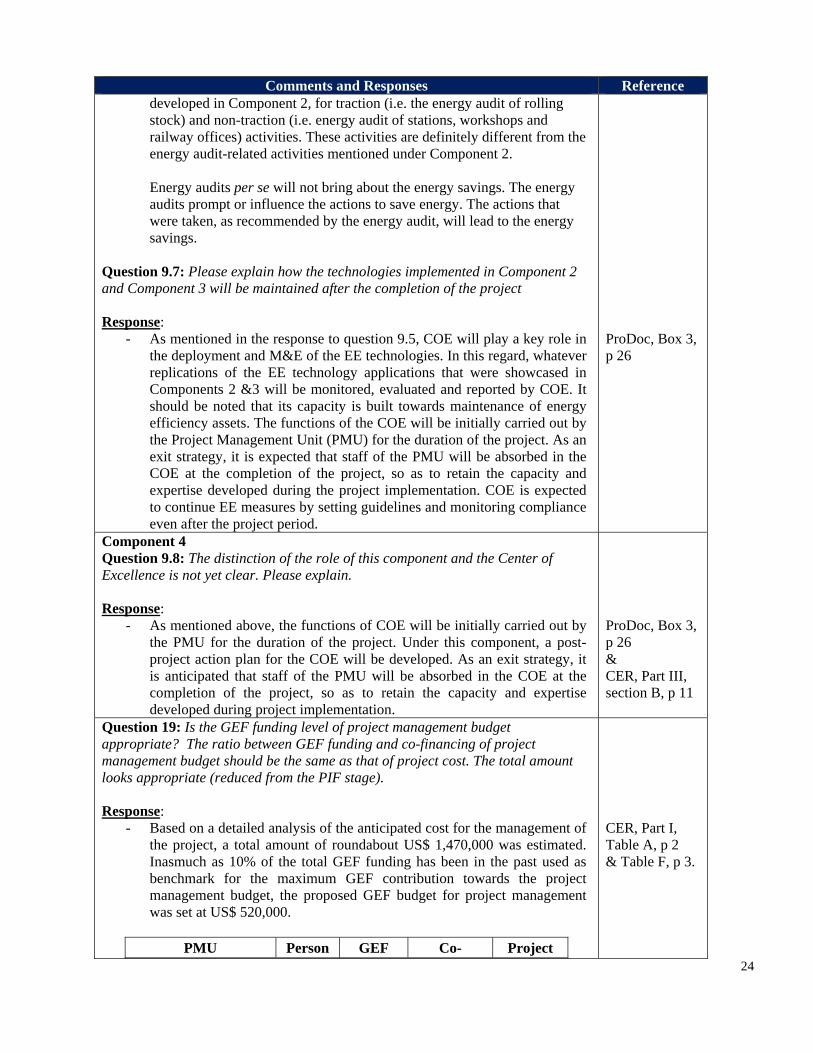
24
Comments and Responses Reference developed in Component 2, for traction (i.e. the energy audit of rolling stock) and non-traction (i.e. energy audit of stations, workshops and railway offices) activities. These activities are definitely different from the energy audit-related activities mentioned under Component 2. Energy audits per se will not bring about the energy savings. The energy audits prompt or influence the actions to save energy. The actions that were taken, as recommended by the energy audit, will lead to the energy savings.
Question 9.7: Please explain how the technologies implemented in Component 2 and Component 3 will be maintained after the completion of the project Response:
- As mentioned in the response to question 9.5, COE will play a key role in the deployment and M&E of the EE technologies. In this regard, whatever replications of the EE technology applications that were showcased in Components 2 &3 will be monitored, evaluated and reported by COE. It should be noted that its capacity is built towards maintenance of energy efficiency assets. The functions of the COE will be initially carried out by the Project Management Unit (PMU) for the duration of the project. As an exit strategy, it is expected that staff of the PMU will be absorbed in the COE at the completion of the project, so as to retain the capacity and expertise developed during the project implementation. COE is expected to continue EE measures by setting guidelines and monitoring compliance even after the project period.
ProDoc, Box 3, p 26
Component 4 Question 9.8: The distinction of the role of this component and the Center of Excellence is not yet clear. Please explain. Response:
- As mentioned above, the functions of COE will be initially carried out by the PMU for the duration of the project. Under this component, a post-project action plan for the COE will be developed. As an exit strategy, it is anticipated that staff of the PMU will be absorbed in the COE at the completion of the project, so as to retain the capacity and expertise developed during project implementation.
ProDoc, Box 3, p 26 & CER, Part III, section B, p 11
Question 19: Is the GEF funding level of project management budget appropriate? The ratio between GEF funding and co-financing of project management budget should be the same as that of project cost. The total amount looks appropriate (reduced from the PIF stage). Response:
- Based on a detailed analysis of the anticipated cost for the management of the project, a total amount of roundabout US$ 1,470,000 was estimated. Inasmuch as 10% of the total GEF funding has been in the past used as benchmark for the maximum GEF contribution towards the project management budget, the proposed GEF budget for project management was set at US$ 520,000.
PMU Person GEF Co- Project
CER, Part I, Table A, p 2 & Table F, p 3.

25
Comments and Responses Reference weeks (GEF)
Amount ($)
financing ($)
Total ($)
Local consultants and staff
459 406,050 698,850 1,104,900
International consultants Office facilities, equipment
77,470 1,230,105 1,307,575
Travel 36,480 171,045 207,525
Total 520,000 2,100,000 2,620,000
- The corresponding co-financing share to the project management cost has also been adjusted to US$ 2,100,000, in order to match the 10% of the GEF. Bulk of this co-financing is from the project management costs of the various co-financed EE technology application demonstrations that have been subsumed into this project.
STAP Comments on PIF (30th November 2008) [STAP makes the following recommendations for consideration during project development] and UNDP Response
Comment & Response Reference Comment 1: Scientific Criteria for Technological Interventions: There are a number of potential technological interventions available on the market, some of which are referred to in the PIF, such as: mass reduction, aerodynamics and friction modifications, space utilization, reduction of conversion losses, introduction of direct injection technologies in diesel combustion engines, regenerative breaking, high-speed passenger trains and etc. It is desirable to conduct an analysis using scientific criteria, based on Energy Conservation Potential, Benefit-Cost Analysis, Mitigation Potential (tCO2), Cost-Effectiveness ($/tCO2), etc., to identify and rank the technological interventions. Response: Certainly it is necessary to conduct the analysis based on scientific criteria. Indian Railways has done first hand analysis on energy conservation technologies and measures which is identified based on national and international data e.g. such as available from the International Union of Railways Companies (UIC). These are also listed in the publication of Energy Conservation in Indian Railways by the Ministry of Railways in March 2009. However during the PPG phase a thorough analysis was conducted in selecting the technologies and measures by involving all divisional staff and come up with all the possible technologies and measures listed in the section 3.2 of UNDP ProDoc. Among these identified technologies, only few technologies have been chosen based on the criteria detailed in the section 4.3 of UNDP ProDoc. This criterion also includes the
ProDoc: Sec 3, Table 3, Para 18, p 13 & Sec 4, Table 6, p 20 & Table 7, p 21

26
Comment & Response Reference implementability of a technology and/or measure at the Zonal level as well. Comment 2: Barrier Analysis: The project has identified three barriers namely; weak institutional arrangement, lack of in-house technical skill and lack of economic incentives for promoting energy efficiency in Railways. There could be other barriers as well. Thus, it is suggested to carry out a scientific analysis of barriers to rank and prioritise the barriers, to enable effective targeting of the measures to overcome the barriers. Response: During the PPG phase, the technology options and barriers to their implementation were discussed during a one day workshop with representatives from various zonal, production and R&D units of Indian Railways as well as by the national consultant in private consultations. The barriers identified are mainly those relating to institutional, information and capacity, as well as some incentive, technology, and financial barriers. Based on this, the project proponents have included a detailed analysis of the barriers which are now described in the UNDP ProDoc.
ProDoc: Sec 3, Table 4, Para 20, p 14
Comment 3: Risks and Mitigation Measures: A detailed analysis of the risks and potential mitigation measures would enable the project authorities to be better prepared to overcome the risks. The financial / incremental cost risks need to be addressed. The risks involved in scaling up energy efficiency program beyond the pilot project needs to be assessed. Response: A list of risks and mitigation options are prepared and presented in the Annex A of the ProDoc. Without GEF intervention (i.e. baseline scenario), Indian Railways is expected to move from the current (2009-10) estimate of 15.7 billion kWh of electricity consumption in the railways sector to 100.5 billion kWh in 2031-32 (about 1,030 billion kWh cumulatively for the period 2010/11-2031/32). However, with the GEF intervention, energy savings in terms of reduced electricity consumption will be 142 million kWh per year. To promote the adoption of energy efficiency technologies and measures in a more comprehensive and effective way, the project is supporting Indian Railways’ Energy Efficiency and Conservation Program (EECP) (2010/11-2031/32). It is assumed that there will be an improved capacity, confidence and awareness, improved incentive system, etc. so that energy efficiency technologies and measures will be adopted and implemented at a faster pace and on a wider scale.
ProDoc: Annex A, Table 16, p 61 ProDoc: Sec 8, p 35 and p 36
GEFSEC Review Sheet Comments on PIF and UNDP Response (February 4, 2008) 2. Has the operational focal point endorsed the project? The OFP endorsed the Programmatic Framework for EE in India, which includes this PIF, for a total of $40m. It does not specify the amount for this PIF. The total amount associated with this PIF is unclear and inconsistent. Table A indicates $6m for the project, but Table B gives $5.3m for the project, $100k for PPG, and $600k for the agency fee. The figures in Table B simply do not add up (to $6m), and the agency fee was calculated incorrectly

27
UNDP Response: This has been corrected in tables A and B. In line with the EE Programmatic framework the requested amounts are 5,200,000 + 100,000 for project preparation. The agency fee is 530,000 which makes a total of 5,830,000. 4. Does the Agency have a comparative advantage for the project? It is not known that UNDP has any comparative advantage in this field. There is no discussion in Section H. UNDP Response: The project supports institutional strengthening of Indian Railways and a suite of technical assistance activities to implement IR’s energy efficiency programme. UNDP’s comparative advantage is that it has adequate experience in technical assistance, capacity building and institutional strengthening on energy efficiency issues at various levels and of different stakeholders both in India and globally. 8. Is the project design sound, its framework consistent sufficiently clear The project objective is to introduce EE technologies and measures in the India Railways system. Given this objective, the basic project framework appears reasonable. The substantive components are: 1. Institutional CB and technical training 2. Implementation of EE technologies and measures 3. Knowledge sharing and learning Component 1 mentions project support for the Centre of Excellence. Please provide more information on what this entails. UNDP Response: To strengthen the institutional system within IR for addressing EE issues, a Centre of Excellence is planned. The role of this Centre will be to develop energy audit manuals for all railway operations, provide training to staff at various levels on EE techniques and measures, provide guidance to testing houses on measurement and calibration of equipments used in IR, etc. The project will focus on institutional capacity development and technical training to develop and operate the Centre of Excellence. Component 2 involves both TA and demonstration (i.e., investment -- please indicate both in Table A). It would be helpful to better define the scope of each, especially the demonstration part, including the budget (GEF and cofinancing). It may be helfpful to break them down into two separate components. UNDP Response: This component has been split in two separate components defining the scope of each in response to this comment. Activity 2.4 involves internal incentives scheme for implementing EE measures. This seems critical in the Indian IR context. It may be useful to look into this issue in a broader context under institutional development of Component 1. UNDP Response: A paragraph has been inserted in Part A as follows: Once the Energy Efficiency programme is underway within IR, specific incentive schemes would be institutionalized to encourage measures and initiatives that lead to energy conservation. These incentives could be either in cash or kind and would be instituted across different levels, viz, Zonal level to individual employee level. Details of such a scheme will be developed at the beginning of the project. Component 3 mentions identification of international best practices from Japan, Germany, and France. Are there not any within the IR system? The two activities identified under this component focus only on international cooperation, instead of internal dissemination. Please clarify. If internal dissemination will be considered, what will be its scope, beyond the demonstration and TA activities mentioned in Components 1 and 2?

28
UNDP Response: Energy Efficiency is a relatively new concept for IR. No good practice is available from within the company hence the need to learn from other railway operators. The Centre of Excellence will be the liaison with oversees partners (to learn and share lessons) but will also lead in disseminating successful EE measures and technologies internally within IR. 11. Is the proposed project likely to be cost-effective? Section E mentions, under incremental reasoning, estimated energy savings of 374m KWh or 314,813 tons of CO2. What is the time frame? What is the basis for this estimate? Section G states that the project will reduce approximately 95k tons of CO2 a year. What is the basis for this estimate? From the above numbers, the potential for energy savings and CO2 emission reduction does not appear to be very significant. UNDP Response: Estimation of emission reductions has been revised in line with the new methodology. Based on IR projections total electricity consumption of IR will be 15,6 billion kwh in 2009 (of which 12,5b is from traction operations and 3,1b from non-traction). With a successful implementation of GEF supported EE measures and technologies the energy saving potential is estimated at approx. 15m kwh/year which results in direct CO2 reductions of 14,850 t/CO2 in the first year (15,000 MWh x 0,99 = 14,850). Considering a time span of 20 years calculations are as follows: an annual growth of electricity consumption of 5,5% and a penetration rate that increases from 2% in the first year to 80% by year 16 the cumulative energy savings are 15,6m MWh which results in savings of 15,444,000 t/CO2. 17. Is the GEF funding level of project management budget appropriate? The GEF funding for PM in Table A is $600k, or 10% of $6m. This seems too high for this type of project. In fact, if the GEF amount for the project is $5.3m as indicated in Table B, this would even exceed 10%. The amount of co-financing for PM seems to be set at 10% or $3m. Is this realistic? UNDP Response: The management budget has been reduced to 460k which is less than 9% of the GEF budget. Co-financing amounts have also been revised. Total co-financing is USD 21,150,000 million of which approx. 2 million is set aside for the EE Centre of Excellence which is managing this project as a part of managing the EE programme of IR . 19. Is the indicative co-financing adequate for the project? Indicative co-financing includes $20m cash and $10m inkind contribution from the government (IR). If these numbers are realistic, it begs the question on the costeffectiveness of this project, given the limited scope of energy savings. How much energy/electricity can be expected from this project? Can they justify IR committing $20-30m to this project? UNDP Response: IR is committing USD 21,150,000 million to this project which is a co-financing ratio of approx. 1:4. The scope of energy savings have been revised according to the new methodology and savings are significant (please see response to previous comment #11).

29
ANNEX C: CONSULTANTS TO BE HIRED FOR THE PROJECT USING GEF RESOURCES
# Position Titles USD per person
per week
Estimated person* weeks
TASKS TO BE PERFORMED
Project Management Unit (PMU) – national consultants
1 National Project Coordinator (NPC)
950 93
Assist NPD in the preparation of the project execution scheme/work plan;
Support the NPD, in the provision of guidance in the organization and implementation of all activities specified in the project document and ensuring timely completion;
Responsible for day-to-day planning, operation and monitoring project activities;
Provision of substantive inputs on project implementation results and issues to the NPD, consultants and stakeholders;
Organization and coordination of project meetings (across Division and Zones), workshops and other expected deliverables from the Project;
Responsibility for the monitoring of overall project implementation, project review and facilitate independent project mid-term and terminal review;
Coordination of financial auditing of the project according to the standards and rules established by UNDP and prepare work plans, reports, budgets, and terms of reference for sub-contractors and consultants;
Liaison with Indian Railways units, equipment and technology providers, national R&D institutions, test laboratories and technology institutes of the project and promote exchanges of information among project participants;
Review of drafts of any working documents to be submitted to meetings or emanating from project activities, and communicate comments to consultants;
Represent the project at forums and meetings.
2 Project Manager, Traction (TR)
950 37
Support the planning and monitoring of “rolling stock” and “Traction distribution” related railway operation activities;
Review and provide comments on outputs pertain to traction; Assistance in the formulation of TORs and activity descriptions
where appropriate; Provision of substantive inputs on project activity implementation to
the expert consultants and stakeholders.
3 Project Manager, Non Traction (NT) Services
950 37
Support the planning and monitoring of non-traction related activities and services;
Review and provide comments on outputs pertain to non-traction; Assistance in the formulation of TORs and activity descriptions
where appropriate; Provision of substantive inputs on project activity implementation to
the expert consultants and stakeholders.
4 Project Manager Energy Efficiency (EE)
950 63
Support for the planning, implementation, monitoring and reporting of energy efficiency related activities such as energy audits, awareness creation, training and capacity building;
Assistance in the formulation of TORs and activity descriptions where appropriate.
5 Office Manager(s), Administration and Finance
550 45 Responsible for administrative and secretarial matters; Perform project-related communication and liaison work:
arrangement of logistics, including travel and organization of

30
meetings/workshops; Make annual budget and review its implementation, making
adjustment correspondingly; Carry out and manage the project contract payments; Conduct annual financial audit of the project in line with the UNDP,
produce the required statements as needed, keep checks and balances in place to ensure proper use of finances under various heads and report the financial progress;
Assist processing and reporting project incomes and expenditures. Total 275
# Position Titles USD per person
per week
Estimated person* weeks
TASKS TO BE PERFORMED
Technical Assistance – national consultants
1
Railway Operation expert(s) on Rolling Stock (RS/TRD),
950 94.00
Support PMU: o Capacity assessment, & technical Training-related EE measures
and technologies. Capacity & Training gap analysis, identification of potential technology & measure related with RS &TRD operations (Outcome 1)
o Implementation of RS-related EE measures and technologies. gap analysis, benchmarking, development of M&W specifications for potential technology & measure related with RS operations
o Implementation of Traction & Distribution operations related EE measures and technologies. Gap analysis, benchmarking, development of M&W specifications for potential technology & measure related with Traction & Distribution operations (Outcome 2)
o Implementation of EE pilot demonstration activities (Outcome 3) o Knowledge sharing of EE measures and technologies related
with RS &TRD operations
2
Railway Operation expert(s), Buildings Services (BS),
950 93.50
Support PMU: o Capacity assessment, & technical Training-related EE measures
and technologies. Capacity & Training gap analysis, identification of potential technology & measure related with BS operations (Outcome 1)
o Implementation of BS operations related EE measures and technologies; gap analysis, benchmarking, development of M&W specifications for potential technology & measure related with BS operations (Outcome 2)
o Implementation of EE pilot demonstration activities (Outcome 3) o Knowledge sharing of EE measures and technologies related
with BS operations (Outcome 4)
3
Energy Efficiency in Railways Operations, expert(s)
950 58.50
Support to PMU: o Capacity assessment, & technical Training-related EE measures
and technologies. Capacity & Training gap analysis, identification of potential technology & measure. Identification and evaluation of alternatives for the for sustainable EE program (Outcome 1)
o Identification and evaluation of alternatives for the harmonization and mutual recognition of the Indian EE program and similar international programs (in particular in Asian countries); Support GOI in the implementation of harmonization activities; Collect and analyze Railways policies and regulations; consulting with local stakeholders; Gap analysis, benchmarking for Energy efficiency and performance criterion for M&W specifications for

31
# Position Titles USD per person
per week
Estimated person* weeks
TASKS TO BE PERFORMED
potential technology & measure (Outcome 2); o Implementation of EE pilot demonstration activities (Outcome 3) o Knowledge sharing of EE measures and technologies related
with BS operations (Outcome 4)
4 Experts – RS,
550 195.00
Evaluation of options & recommendation on EE; Collect and analyze Railways policies and regulations; consulting with local stakeholders; Gap analysis, identification of capacity development needs for energy efficiency and performance criterion for potential technology & measure; Identification of training need, Documentation & dissemination of Information (Outcome 1);
Evaluation of options & recommendation on incentives for EE; Collect and analyze Railways policies and regulations; consulting with local stakeholders; Gap analysis, benchmarking for energy efficiency and performance criterion for M&W specifications for potential technology & measure; Documentation & dissemination of Information (Outcome 2);
Implementation of EE pilot demonstration activities; Organizing, implementation of pilot projects and evaluation thereof related with Rolling stock operation (Outcome 3);
Identification of EE technologies, Learning, knowledge sharing and dissemination of Information on potential EE technology & measures with Railway personnel, Manufacturer & vendors for development and implementation on sustainable basis and setting a road map for post functioning for RS (Outputs 4.1 and 4.2)
5 Experts- TRD,
550 253.50
Evaluation of options & recommendation on EE; Collect and analyze Railways policies and regulations; consulting with local stakeholders; Gap analysis, identification of capacity development & Training needs for energy efficiency and performance criterion for potential technology & measure; Identification of training need, Documentation & dissemination of Information (Outcome 1);
Evaluation of options & recommendation of incentives for EE; Collect and analyze Indian Railways policies and regulations; consulting with local stakeholders; Gap analysis, benchmarking for energy efficiency and performance criterion for M&W specifications for potential technology & measure
Implementation of EE pilot demonstration activities Organizing, implementation of pilot projects and evaluation thereof related with Traction & Distribution (Output 3.1)
Identification of EE technologies, Learning, knowledge sharing and dissemination of Information on potential EE technology & measures with Railway personnel, Manufacturer & vendors for development and implementation on sustainable basis and setting a road map for post functioning for TRD (Outcome 4)
6 Experts - BS,
550 195.00
Evaluation of options & recommendation on EE; Collect and analyze Railways policies and regulations; consulting with local stakeholders; Gap analysis, identification of capacity development & Training needs for energy efficiency and performance criterion for potential technology & measure; Identification of training need, Documentation & dissemination of Information (Outcome 1);
Evaluation of options & recommendation of incentives for EE; Collect and analyze Railways policies and regulations; consulting with local stakeholders; Gap analysis, benchmarking for Energy efficiency and performance criterion for M&W specifications for potential technology & measure (Outcome 2);
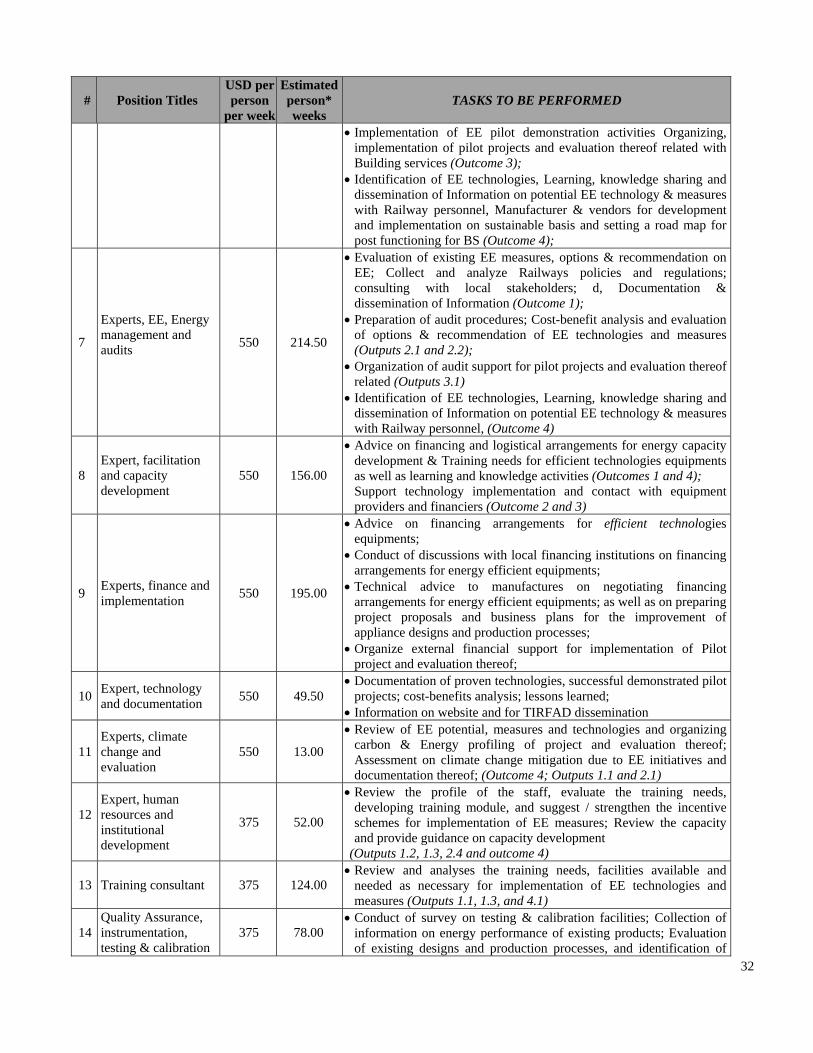
32
# Position Titles USD per person
per week
Estimated person* weeks
TASKS TO BE PERFORMED
Implementation of EE pilot demonstration activities Organizing, implementation of pilot projects and evaluation thereof related with Building services (Outcome 3);
Identification of EE technologies, Learning, knowledge sharing and dissemination of Information on potential EE technology & measures with Railway personnel, Manufacturer & vendors for development and implementation on sustainable basis and setting a road map for post functioning for BS (Outcome 4);
7
Experts, EE, Energy management and audits
550 214.50
Evaluation of existing EE measures, options & recommendation on EE; Collect and analyze Railways policies and regulations; consulting with local stakeholders; d, Documentation & dissemination of Information (Outcome 1);
Preparation of audit procedures; Cost-benefit analysis and evaluation of options & recommendation of EE technologies and measures (Outputs 2.1 and 2.2);
Organization of audit support for pilot projects and evaluation thereof related (Outputs 3.1)
Identification of EE technologies, Learning, knowledge sharing and dissemination of Information on potential EE technology & measures with Railway personnel, (Outcome 4)
8 Expert, facilitation and capacity development
550 156.00
Advice on financing and logistical arrangements for energy capacity development & Training needs for efficient technologies equipments as well as learning and knowledge activities (Outcomes 1 and 4); Support technology implementation and contact with equipment providers and financiers (Outcome 2 and 3)
9 Experts, finance and implementation
550 195.00
Advice on financing arrangements for efficient technologies equipments;
Conduct of discussions with local financing institutions on financing arrangements for energy efficient equipments;
Technical advice to manufactures on negotiating financing arrangements for energy efficient equipments; as well as on preparing project proposals and business plans for the improvement of appliance designs and production processes;
Organize external financial support for implementation of Pilot project and evaluation thereof;
10 Expert, technology and documentation
550 49.50 Documentation of proven technologies, successful demonstrated pilot
projects; cost-benefits analysis; lessons learned; Information on website and for TIRFAD dissemination
11 Experts, climate change and evaluation
550 13.00
Review of EE potential, measures and technologies and organizing carbon & Energy profiling of project and evaluation thereof; Assessment on climate change mitigation due to EE initiatives and documentation thereof; (Outcome 4; Outputs 1.1 and 2.1)
12
Expert, human resources and institutional development
375 52.00
Review the profile of the staff, evaluate the training needs, developing training module, and suggest / strengthen the incentive schemes for implementation of EE measures; Review the capacity and provide guidance on capacity development
(Outputs 1.2, 1.3, 2.4 and outcome 4)
13 Training consultant 375 124.00 Review and analyses the training needs, facilities available and
needed as necessary for implementation of EE technologies and measures (Outputs 1.1, 1.3, and 4.1)
14 Quality Assurance, instrumentation, testing & calibration
375 78.00 Conduct of survey on testing & calibration facilities; Collection of
information on energy performance of existing products; Evaluation of existing designs and production processes, and identification of

33
# Position Titles USD per person
per week
Estimated person* weeks
TASKS TO BE PERFORMED
consultant opportunities for improvements; Provision of technical guidance for the improvement of testing and calibration facilities (Outputs 1.3 2.2, 2.3, 3.1)
15 Procurement and implementation
375 52.00
Review of existing procurement policies and regulations. Identification and analysis of legal and financial issues regarding an eventual scheme for the procurement of energy efficient equipments by Railways ; Assistance to vendors and manufacturers
16 IT & infrastructure; web portal
375 104.00
Development of Information web portal for sharing of knowledge; Development of technology information resource and facilitation Desk(TIRFAD), Dissemination of information to the manufacturers and vendors (Outputs 1.1, 1.3, 2.3, 4.1)
17 Energy metering and auditing; energy and GHG estimation
375 65.00 Conduct of survey on metering & monitoring facilities; Provision of technical guidance for the improvement of metering &
monitoring facilities
18 Other consultants 550 130.00 Provide complementary support for and/or actual implementation of
the projects public outreach, workshops and seminars presenters, market monitoring and other related activities
19 Office assistants 275 392.73 Arrangement of logistics, including travel and organization of
meetings/workshops on-site and in the various zones; translation services
Total 2,515.23

34
# Position Titles
USD per person
per week
Estimated person* weeks
TASKS TO BE PERFORMED
Technical Assistance – international consultants
1
Senior technical advisor (STA), EE training & Institutional support COE
3,000 19.5
Review the training gap analysis, develop strategy and draw the training program to implement the EE measures; Assist at selected trainings
2 STA, Traction and EE
3,000 58.5 Guidance on EE implementation in Traction (TR) in general
support for implementation of EE pilot demonstration activities related with Rolling stock & Traction power distribution
3 STA, Non-traction and EE
3,000 58.5 Guidance on EE implementation in Non-Traction (NT), in
particular building services, and support for implementation of EE pilot demonstration activities
4 STA, EE implementation
3,000 58.5
Guidance on EE implementation, monitoring and verification of EE performance;
Evaluation and assessment of technologies and measures implemented in Outcomes 2 and 3
5
Experts, communication and knowledge sharing
3,000 39.0
Preparing a knowledge sharing & learning module for imparting training to Railway staff, and for qualitative information on web info portal as well for TIRFAD related with activities of Traction, non-traction utilities and services, as well as for with energy efficiency, interaction with leading centers of Excellence of developed countries; Preparing a knowledge sharing & learning module for imparting training to Railway staff, and for qualitative information on web info portal as well for TIRFAD related
6 Experts, project evaluation and impact analysis
3,000 19.5 Mid-term and final evaluation Evaluation and assessment of project Climate change mitigation
outcome and compilation of learning and project closure.
Other consultants 3,000 52.0 Provide complementary support for and/or actual implementation
of the projects public outreach, workshops and seminars presenters, market monitoring and other related activities
Total 3,000 306.0

35
ANNEX D: STATUS OF IMPLEMENTATION OF PROJECT PREPARATION ACTIVITIES AND THE USE OF FUNDS
A. EXPLAIN IF THE PPG OBJECTIVE HAS BEEN ACHIEVED THROUGH THE PPG ACTIVITIES
UNDERTAKEN. In January 2008, UNDP submitted the PIF and PPG request to the GEF Secretariat, which was cleared by the GEF CEO in October 2008. In 2009, the services of an international and national consultant were hired, supported by the PPG grant, to advise on the development of the project and elaborate the necessary documentation for GEF submission through UNDP. As a main achievement of the PPG phase, the final versions of the Request for the CEO Endorsement/Approval and the UNDP/EF Project Document are submitted in July 2010 to the GEF Secretariat. Overall the PPG Exercise has achieved this objective.
B. DESCRIBE IF ANY FINDINGS THAT MIGHT AFFECT THE PROJECT DESIGN OR ANY CONCERNS ON
PROJECT IMPLEMENTATION. N/A
C. PROVIDE DETAILED FUNDING AMOUNT OF THE PPG ACTIVITIES AND THEIR IMPLEMENTATION
STATUS IN THE TABLE BELOW:
Project Preparation Activities Approved
Implementation
Status
GEF Amount ($) Co-
financing ($)
Amount Approved
Amount Spent
To-date
Amount Committed
Uncommitted Amount*
Collection and analysis of information on the energy consumption within various operations in IR
Completed 25,000 35,500 - 40,000
Consultation with international experts on various aspects including best practices in energy conservation measures in railway operations
Completed 30,000 2,920 16,580 - 60,000
Discussion with railways staff at various levels on their training needs and trainers at COE
Completed 25,000 11,219 13,781 - 50,000
Developing project proposal
Completed 20,000 20,000 -
Total 100,000 49,639 50,361 - 150,000 * Uncommitted amount should be returned to the GEF Trust Fund. Please indicate expected date of refund transaction to Trustee.

Review date: February 07, 2011 1
GEF SECRETARIAT REVIEW FOR FULL/MEDIUM-SIZED PROJECTS1 ________________________________________________________________________________________________________________________ Country/Region: India Project Title: India: IND Improving Energy Efficiency in the Indian Railway System - under the Programmatic Framework for Energy Efficiency GEFSEC Project ID: 3554 GEF Agency Project ID: 4044 (UNDP) GEF Agency: UNDP GEF Focal Area (s): Climate Change GEF-4 Strategic Program (s): CC-2; Anticipated Project Financing ($): PPG: $100,000 GEF Project Allocation: $5,200,000 Co-financing:$21,000,000 Total Project Cost:$26,300,000 PIF Approval Date: October 08, 2008 Anticipated Work Program Inclusion: January 27, 2009 Program Manager: Osamu Mizuno GEF Agency Contact Person: _________________________________________________________________________________________________________________________
Review Criteria
Questions
Secretariat Comment at PIF/Work Program Inclusion 2
Secretariat Comment At CEO Endorsement(FSP)/Approval (MSP)
Eligibility
1. Is the participating country eligible? Yes. 2. If there is a non-grant instrument in the
project, check if project document includes a calendar of reflows and provide comments, if any.
3. Has the operational focal point endorsed the project?
The OFP endorsed the Programmatic Framework for EE in India, which includes this PIF, for a total of $40m. It does not specify the amount for this PIF. The total amount associated with this PIF is unclear and inconsistent. Table A indicates $6m for the project, but Table B gives $5.3m for the project, $100k for PPG, and $600k for the agency fee. The figures in Table B simply do not add up (to $6m), and the agency fee was calculated incorrectly. OM, 10/06 The OFP endorsement letter was resent and
A new endorsement letter of OFP dated as of August 30, 2010 was attached with specific amount of $5.83million for this project.
1 Some questions here are to be answered only at PIF or CEO endorsement. Please do not answer if the field is blocked with gray. 2 Work Program Inclusion (WPI) applies to FSPs only. Submission of PIF of FSPs will simultaneously be considered for WPI. For MSPs, once the PIF is approved by CEO, next step will be to continue project preparation until the project is ready for CEO approval.

Review date: February 07, 2011 2
now the total is $33. Still no specific amount provided. Table A was revised appropriately and there is no inconsistency found in the revised PIF.
4. Which GEF Strategic Objective/ Program does the project fit into?
CC-SP2: Industrial EE
5. Does the Agency have a comparative advantage for the project?
It is not known that UNDP has any comparative advantage in this field. There is no discussion in Section H. OM, 10/06 Short explanations are given.
Resource Availability
6. Is the proposed GEF Grant (including the Agency fee) within the resources available for (if appropriate):
The RAF allocation? The PIFs being submitted under the EE Program would exceed 50% of India's RAF. OM, 10/06 The PIF is now under review during the second half of GEF-4.
The focal areas? Yes. Strategic objectives? NA Strategic program? NA
Project Design
7. Will the project deliver tangible global environmental benefits?
Likely.
8. Is the global environmental benefit measurable?
Yes. It is explained.
9. Is the project design sound, its framework consistent & sufficiently clear (in particular for the outputs)?
The project objective is to introduce EE technologies and measures in the India Railways system. Given this objective, the basic project framework appears reasonable. The substantive components are: 1. Institutional CB and technical training 2. Implementation of EE technologies and measures 3. Knowledge sharing and learning
Basically yes. But the following questions need to be addressed. Component 1 (1) As appreciable EE technologies have already been identified and will be implemented in Component 2 and Component 3, it is not clear what would be the objective in conducting comparative analysis between technologies etc. The
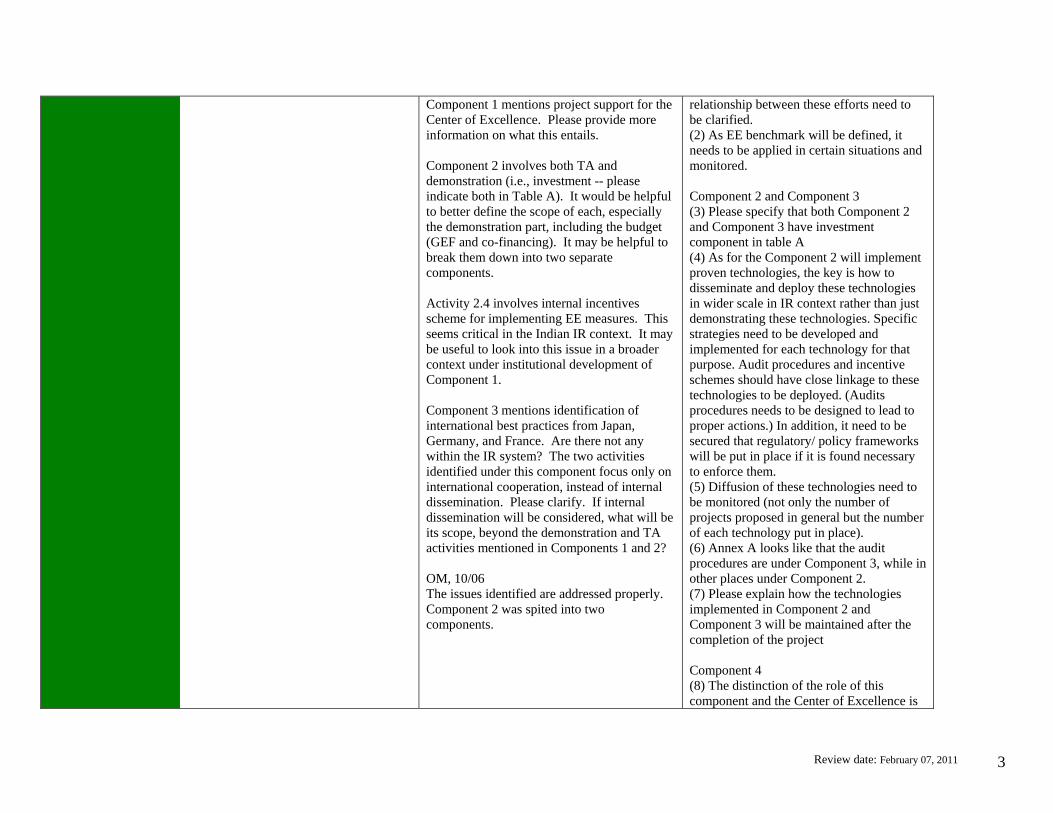
Review date: February 07, 2011 3
Component 1 mentions project support for the Center of Excellence. Please provide more information on what this entails. Component 2 involves both TA and demonstration (i.e., investment -- please indicate both in Table A). It would be helpful to better define the scope of each, especially the demonstration part, including the budget (GEF and co-financing). It may be helpful to break them down into two separate components. Activity 2.4 involves internal incentives scheme for implementing EE measures. This seems critical in the Indian IR context. It may be useful to look into this issue in a broader context under institutional development of Component 1. Component 3 mentions identification of international best practices from Japan, Germany, and France. Are there not any within the IR system? The two activities identified under this component focus only on international cooperation, instead of internal dissemination. Please clarify. If internal dissemination will be considered, what will be its scope, beyond the demonstration and TA activities mentioned in Components 1 and 2? OM, 10/06 The issues identified are addressed properly. Component 2 was spited into two components.
relationship between these efforts need to be clarified. (2) As EE benchmark will be defined, it needs to be applied in certain situations and monitored. Component 2 and Component 3 (3) Please specify that both Component 2 and Component 3 have investment component in table A (4) As for the Component 2 will implement proven technologies, the key is how to disseminate and deploy these technologies in wider scale in IR context rather than just demonstrating these technologies. Specific strategies need to be developed and implemented for each technology for that purpose. Audit procedures and incentive schemes should have close linkage to these technologies to be deployed. (Audits procedures needs to be designed to lead to proper actions.) In addition, it need to be secured that regulatory/ policy frameworks will be put in place if it is found necessary to enforce them. (5) Diffusion of these technologies need to be monitored (not only the number of projects proposed in general but the number of each technology put in place). (6) Annex A looks like that the audit procedures are under Component 3, while in other places under Component 2. (7) Please explain how the technologies implemented in Component 2 and Component 3 will be maintained after the completion of the project Component 4 (8) The distinction of the role of this component and the Center of Excellence is

Review date: February 07, 2011 4
not yet clear. Please explain. 11/19/2010 All the issues pointed out are addressed or well explained.
10. Is the project consistent with the recipient country’s national priorities and policies?
Yes. Under the Energy Conservation Action, IR has been listed as a "designated consumer". Both IR and the Ministry of Railways are committed to EE.
Yes.
11. Is the project consistent and properly coordinated with other related initiatives in the country or in the region?
This is the first program to support the IR EE program in rail operations. OM, 10/06 This project is under the Programmatic Framework for Energy Efficiency. The coordination under the Framework needs to be explained by the time of CEO endorsement.
The coordination under the Programmatic Framework for Energy Efficiency is explained.
12. Is the proposed project likely to be cost-effective?
Section E mentions, under incremental reasoning, estimated energy savings of 374m KWh or 314,813 tons of CO2. What is the time frame? What is the basis for this estimate? Section G states that the project will reduce approximately 95k tons of CO2 a year. What is the basis for this estimate? From the above numbers, the potential for energy savings and CO2 emission reduction does not appear to be very significant. OM, 10/06 Estimation of emission reductions has been revised in lie with the new methodology. In the new calculation, it is about 15.4million CO2 savings. It can be acceptable as a cost-effective project.
13. Has the cost-effectiveness sufficiently been demonstrated in project design?
Yes.

Review date: February 07, 2011 5
14. Is the project structure sufficiently close to what was presented at PIF?
Yes.
15. Does the project take into account potential major risks, including the consequences of climate change and includes sufficient risk mitigation measures?
The key risk identified is institutional inefficiencies of IR. It is important that the project look into specific mitigation measures and institute them as part of the project intervention strategy and activities. This is expected by CEO endorsement. OM, 10/06 Risks to implement this project itself successfully also need to be identified and addressed by the time of CEO endorsement.
Yes.
Justification for GEF Grant
16. Is the value-added of GEF involvement in the project clearly demonstrated through incremental reasoning?
Discussed. Discussed.
17. Is the type of financing provided by GEF, as well as its level of concessionality, appropriate?
18. How would the proposed project outcomes and global environmental benefits be affected if GEF does not invest?
It is clearly explained.
19. Is the GEF funding level of project management budget appropriate?
The GEF funding for PM in Table A is $600k, or 10% of $6m. This seems too high for this type of project. In fact, if the GEF amount for the project is $5.3m as indicated in Table B, this would even exceed 10%. The amount of co-financing for PM seems to be set at 10% or $3m. Is this realistic? OM, 10/06 The management budget has been reduced to 460k which is less than 9% of the GEF budget. Co- financing amount was also revised.
No. the ratio between GEF funding and cofinancing of project management budget should be the same as that of project cost. The total amount looks appropriate (reduced from the PIF stage). 11/19/2010 The total amount for the project management was significantly increased from the budget originally proposed (from $1.47 million to $2.62 million), which is not acceptable. Please keep the same level of the total amount as originally proposed ($1,470,000) and revise the GEF amount

Review date: February 07, 2011 6
instead of cofinancing. the resources remaining can be used for the other components. 2/8/2011 The issue is not yet properly addressed. It was explained that "based on a detailed analysis of the anticipated cost for the management of the project, a total amount of roundabout US$1,470,000 was estimated." Hence "US $1,470,000 can be maintained in total. However as GEF funding and cofinancing for the whole project is $5,200,000 and $21,000,000 respectively, GEF funding for project management should be round $ 290,000(= 1,470,000 x 5,200,000/26,200,000).
20. Is the GEF funding level of other cost items (consultants, travel, etc.) appropriate?
21. Is the indicative co-financing adequate for the project?
Indicative co-financing includes $20m cash and $10m in-kind contribution from the government (IR). If these numbers are realistic, it begs the question on the cost-effectiveness of this project, given the limited scope of energy savings. How much energy/electricity can be expected from this project? Can they justify IR committing $20-30m to this project? OM, 10/06 The total cost and CO2 savings are revised properly. It is now acceptable.
22. Are the confirmed co-financing amounts adequate for each project component?
Yes.

Review date: February 07, 2011 7
23. Has the Tracking Tool3 been included with information for all relevant indicators?
Yes. But see comments on item 9 as well. 11/19/2010 The comments on item 9 were addressed.
24. Does the proposal include a budgeted M&E Plan that monitors and measures results with indicators and targets?
See comments on item 9 as well. 11/19/2010 The comments on item 9 were addressed.
Secretariat’s Response to various comments from:
STAP The comments from STAP were properly addressed.
Convention Secretariat Agencies’ response to GEFSEC comments
Agencies’ response to Council comments
Secretariat Decisions
Recommendation at PIF
25. Is PIF clearance being recommended?
PIF clearance is not recommended for the April 2008 WP. PIF clearance may be considered for future WPs if/after the issues raised in this review have been adequately addressed. OM, 10/06 PM recommends CEO PIF clearance for WPI.
26. Items worth noting at CEO Endorsement.
Recommendation at CEO Endorsement
27. Is CEO Endorsement being recommended?
Please address the issues identified before resubmission. 11/19/2010 Not at this stage. Please revise the budgetary arrangement (project
3 At present, Tracking Tools apply to Biodiversity projects only. Tracking Tools for other focal areas are currently being developed.
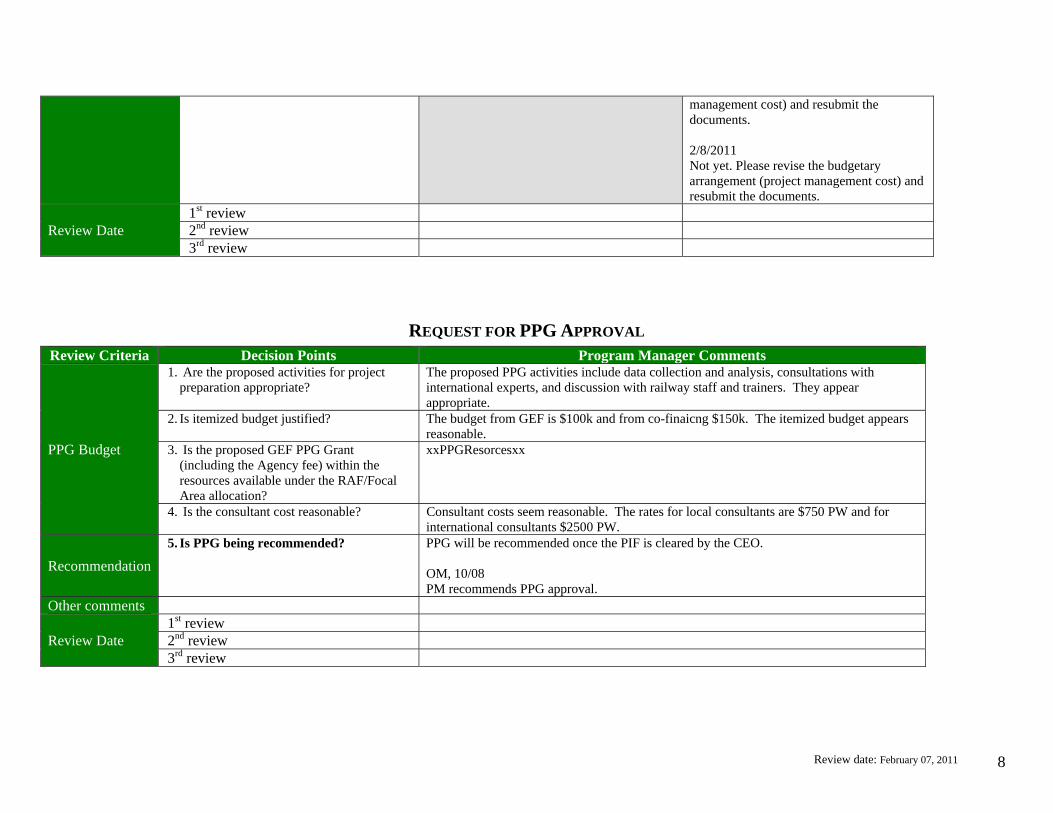
Review date: February 07, 2011 8
management cost) and resubmit the documents. 2/8/2011 Not yet. Please revise the budgetary arrangement (project management cost) and resubmit the documents.
Review Date 1st review
2nd review
3rd review
REQUEST FOR PPG APPROVAL Review Criteria Decision Points Program Manager Comments
PPG Budget
1. Are the proposed activities for project preparation appropriate?
The proposed PPG activities include data collection and analysis, consultations with international experts, and discussion with railway staff and trainers. They appear appropriate.
2. Is itemized budget justified? The budget from GEF is $100k and from co-finaicng $150k. The itemized budget appears reasonable.
3. Is the proposed GEF PPG Grant (including the Agency fee) within the resources available under the RAF/Focal Area allocation?
xxPPGResorcesxx
4. Is the consultant cost reasonable? Consultant costs seem reasonable. The rates for local consultants are $750 PW and for international consultants $2500 PW.
Recommendation
5. Is PPG being recommended? PPG will be recommended once the PIF is cleared by the CEO. OM, 10/08 PM recommends PPG approval.
Other comments
Review Date 1st review
2nd review
3rd review

Review date: February 07, 2011 9
wb21049 C:\Users\wb21049\Documents\Visual Studio 2008\WebSites\WebSite9\LetterTemplates\ReviewSheetforGEFProject.rtf 8/28/2009 4:16:00 PM