Embed Size (px)
Citation preview

IMPROVING DROUGHT DETECTION IN THE CAROLINAS:
EVALUATION OF LOCAL, STATE, AND FEDERAL
DROUGHT INDICATORS
by
Hope Mizzell
Bachelor of Science in Geography
University of South Carolina, 1993
Master of Science in Geography
University of South Carolina, 1999
Submitted in Partial Fulfillment of the Requirements
for the Degree of Doctor of Philosophy in the
Department of Geography
College of Arts and Sciences
University of South Carolina
2008
________________________
Major Professor
Chairman, Examining Committee
_________________________ ________________________
Committee Member Committee Member
________________________ ________________________
Committee Member Dean of The Graduate School

ii
ACKNOWLEDGEMENTS
Many people have helped and encouraged me throughout my educational journey
and I’m forever grateful. I express my deepest gratitude and appreciation to Dr. Greg
Carbone for persevering as my advisor, mentor, and friend for 18 years. I’m always
amazed by your patience, your outstanding ability to teach, and your devotion to your
students. Thank you for your unwavering faith and confidence in my abilities and in me.
The members of my dissertation committee, Kirstin Dow, Cary Mock, and Dan
Tufford generously gave their time and expertise to better my work. I thank them for
their contribution and I’m thankful for the relationship we now have. I admire each of
you for your wealth of knowledge and I thank you for your dedication.
I extend my appreciation to Duke Energy, Alcoa Power Generating Inc, and the
City of Rock Hill for sharing your data and expertise. My sincere gratitude goes to my
friend Ann Nolte for her support and editorial guidance. Your contributions to my
dissertation are invaluable. Thank you to my friends at the State Climatology Office for
graciously taking on extra work in my absence to make this possible. I’m so fortunate to
work with each of you.
Words can’t possibly express my thanks to my DNR family (past and present)
especially Alfred “Freddy” Vang, Steve de Kozlowski, Danny Johnson, and Milt Brown.
This would not have been possible without your support. Each of you has helped shape
me into the person I am today. I want to say a special thanks to Mr. Vang. You have

iii
influenced my life in so many ways, through your passion for protecting South Carolina’s
water resources to your dedication to your staff and co-workers. Thank you for always
believing in me.
I am indebted to my parents for instilling in me the determination and discipline
to do whatever I dream and for your unconditional love and efforts to make sure my life
had every chance for happiness. My father, who showed me the true value of hard-work
and family devotion. My mother, gone now for 12 years, but her unconditional love is
always with me. Through her life and her death she inspired me to live, enjoy, and make
the most out of every day.
Betsy, my dearest friend, you have experienced the peaks and valleys in many of
my life’s adventures. For your constant support, encouragement, and amazing friendship
I am truly grateful. Your cheers and laughter have kept me working through the toughest
times. Your friendship brings so much joy to my life.
To my husband and partner, Tony, I express my deepest love and appreciation. I
truly couldn’t have done this without you. You endured too many years of my relentless
stress. You believed in me and lifted me through the endless periods of self-doubt.
Thank you for your love, devotion and sacrifices. I’m so blessed by our amazing life
together.
To my children, I love you more than words can express. Your smiles and hugs
are my inspiration. Dream high, never settle, and live life to the fullest.
To all my friends and family, it is only through your love and support did I have
the courage and strength to make this dream come true.
God has blessed me in so many ways.

iv
ABSTRACT
Persistent drought and increased water demand require that comprehensive
drought planning, based on accurate drought indicators, guide future water resource
management. Yet, drought indicators are often the weakest components of drought plans
because drought affects different sectors at different time scales, making it difficult to
define and measure. This research evaluates the spatial and temporal distribution of
drought intensity and frequency as detected by South Carolina’s state drought indicators
and the recently defined Federal Energy Regulatory Commission’s Low Inflow Protocol
indicators for the Catawba-Wateree and Yadkin-Pee Dee River Basins. The dissertation
connects indicators based on scientific justification with operational relevancy by
evaluating water systems’ and power company’s vulnerability to drought, their
understanding of drought indicators, and their identification of indicator characteristics
that provide the most effective drought response.
Indicator discrepancies were identified and several major recommendations
emerge from the research. First, statistical inconsistencies exist between the drought
classes defined by the S.C. Drought Response Act regulations; these can be resolved by
transforming the indicators from raw values to percentiles. Second, discrepancies in
drought detection based on the LIP indicators were most acute during the drought
recovery phase and for the Catawba-Wateree River Basin LIP, which is dependent on a
recovery of all indicators to initiate a stage downgrade. Recommendations include

v
shortening the streamflow average and replacing the U.S. Drought Monitor with the
Standardized Precipitation Index. The addition of a recovery condition based on storage
recovery should also be considered.
The research identified that water systems and power companies value both local
and state drought indicators, however, they have higher expectations and depend more
heavily on their local indicators. Drought indicator(s) need to be multi-dimensional as
indicator effectiveness is based on drought detection and indicator accessibility. The
study implements the National Integrated Drought Information System initiative that calls
for integrated drought research at relevant spatial scales to facilitate proactive decisions.
The research results can be used to improve planning and coordination within and
between levels of government and water users to help reduce society’s vulnerabilities to
drought and ensure sustainable water to meet growing demands.

vi
TABLE OF CONTENTS
Acknowledgements……………………………………………………………… ii
Abstract ……………………………………………………………………….… iv
List of Tables …………………………………………………………………... viii
List of Figures ………………………………………………………………….. xi
Chapter 1 Introduction ………………………………………………….…. 1
Chapter 2 Literature Review ………………………………………………. 7
2.1 Drought Indicators ……………………………………………… 7
2.11 Palmer Drought Index ………………………………….. 8
2.12 Palmer Hydrologic Index and Z Index ………………… 10
2.13 Crop Moisture Index …………………………………… 11
2.14 Standardized Precipitation Index ………………………. 12
2.15 Keetch Byram Drought Index ………………………….. 13
2.16 U.S. Drought Monitor ………………………………….. 13
2.17 Streamflow, Reservoir Storage, Groundwater …………. 15
2.2 Evolution of State and Federal Drought Management …………. 17
2.21 History of Drought in South Carolina and
the progression of S.C. Drought Management ………… 18
2.22 Local Drought Response Ordinances and Plans ……….. 22
2.23 Federal Drought Response …………………………….. 23
2.24 Federal Energy Regulatory Commission Licenses …….. 24
Chapter 3 Evaluation of State Drought Indicators ………………………….. 27
3.1 Data and Methodology………………………………………….. 28
3.2 State Indicator Results …………………………………………. 32

vii
Chapter 4 Evaluation of Local Drought Indicators ………………………... 47
4.1 Local Drought Indicator Case Study:
Data and Methodology ………………………………..………… 47
4.2 Duke Energy’s Low Inflow Protocol
Indicator Comparison …………………………………………... 57
4.3 Duke Energy’s Low Inflow Protocol Comparison to
South Carolina State Indicators …………………………….….. 67
4.4 Alcoa Yadkin and Progress Energy’s
Low Inflow Protocol Comparison………………………………. 72
4.41 Alcoa Yadkin and Progress Energy’s Low Inflow
Protocol Indicator Comparison to Duke Energy’s Low
Inflow Protocol Indicators………………………………. 74
4.5 City of Rock Hill’s Drought Indicator Comparison ……………. 79
4.6 Evaluate Using Percentiles to Improve Drought Detection …….. 84
4.61 Results ……………………………………………………… 88
Chapter 5 Drought Indicator Survey ……………………………………….. 97
5.1 Water System Survey Results …………………………………... 99
5.11 Water system’s reconstruction of the
1998-2002 drought impacts ……………………………. 115
5.2 Power Company Survey Results ……………………………….. 125
5.21 Power Company’s reconstruction of the
1998-2002 drought impacts ……………………………. 129
5.3 Survey Implications and Future Research ……………………… 131
Chapter 6 Conclusions ……………………………………………………… 134
List of References ………………………………………………………………. 140
Appendix ……………………………………………………………………….. 145

viii
LIST OF TABLES
Table 3.1 State level indicators designated by regulation.…………………….........28
Table 3.2 Percent frequencies for state drought indicators in Oconee
County, SC. ………………………………………………………..…….34
Table 3.3 Percent frequencies for state drought indicators in Charleston
County, SC……………………………………………………………….40
Table 3.4 Percent frequencies for state drought indicators in Florence
County, SC……………………………………………………………….41
Table 3.5 Chi-square statistic and (p-values) for the indicator frequency distribution
(extreme/severe, moderate, incipient, no drought) comparison between
counties (p≤0.05)……………………….………………………………..42
Table 3.6 Chi-square statistic and (p-values) for the frequency distribution
(extreme/severe, moderate, incipient, no drought) comparison between
indicators for Oconee County (p≤0.05).…………………………………44
Table 4.11 Local-level drought indicators for Duke Energy………………………...48
Table 4.12 Local-level drought indicators for Alcoa Yadkin / Progress Energy…….51
Table 4.21 Percent frequency of drought for Duke LIP indicators…………………..59
Table 4.22 Duke’s LIP indicator drought stages, June 2007 – April 2008…………..65
Table 4.23 Streamflow 6-month averages and values expressed as percentages of
long-term average, January 2007 – April 2008…………………………66
Table 4.31 Percent frequency of drought occurrence based on Duke’s LIP indicators
and selected state indicators, April 2000 – April 2008: a) Duke’s LIP
storage, State’s SPI6, SPI9 and SPI12, b) Duke’s LIP streamflow,
Duke’s LIP DM, State streamflow and State DM……………………….70
Table 4.32 Chi-square statistic and (p-values) for the comparison of the frequency
distributions of drought levels (LIP Stage 2 to Stage 4, LIP Stage 1,

ix
Stage 0, No Drought) between indicators for Catawba-Wateree Basin….72
Table 4.33 Chi-square statistic and (p-values) for the comparison of the frequency
distributions of drought levels (LIP Stage 2 to Stage 4 and State Severe
to Extreme, LIP Stage 1 and State Moderate, LIP Stage 0 and State
Incipient, and No Drought) between indicators for Catawba-Wateree
Basin and State Indicators (p≤0.05)…………….…………….………...72
Table 4.41 Percent frequency of drought for Alcoa/Progress
Energy LIP indicators……………………………………………………74
Table 4.51 City of Rock Hill’s previous ordinance drought indicators……………...81
Table 4.52 Percent frequency of drought occurrence based on City of Rock’s
old ordinance lake elevation indicator compared to Duke’s LIP
indicators…………………………………………………………………83
Table 4.61 SPI-6 month spatial comparison of monthly drought occurrence
between basin, county and HUCs, April 2000 – April 2008…………….87
Table 4.62 Percent frequency of drought occurrence, April 2000 – April 2008,
for SPI 6-Month, SPI 9-Month, Blend 1, Blend 2, Dukes’ storage,
Duke’s 6-month streamflow, Duke’s 3-month average DM…………….90
Table 4.63 SPI 6-month, SPI 9-month, Blend 1, Blend 2 drought stages
compared to LIP storage, LIP 6-month streamflow, 3-month
average DM stages, January 2002 – April 2003…………………............92
Table 4.64 SPI 6-month, SPI 9-month, Blend 1, Blend 2 drought stages
compared to LIP Storage, LIP 6-month streamflow, 3-month
average DM stages, August 2006 – April 2008………………………….94
Table 5.00 Survey response rate……………………………………………………..99
Table 5.12 Average scores for state and local drought indicator
characteristic…………………………………………………................103
Table 5.13 Importance of indicator characteristics to water systems. ……………..106
Table 5.14 Average ranking for each drought indicator characteristic for all
systems and subdivided by system-size………………………………...107
Table 5.15 Average ranking for each drought indicator characteristic for all
systems and subdivided by system-source……………………………...109

x
Table 5.21 Power company responses and average numerical scores for state
and local drought indicator characteristics……………………………..126
Table 5.22 Power company rankings for each drought indicator
characteristic……………………………………………………………127

xi
LIST OF FIGURES
Figures 3.1 Percent frequencies for drought and wet severity levels (a) Palmer
Drought Severity Index, (b) Standardized Precipitation Index (1-, 3-, 6-,
9-, 12-month), (c) Crop Moisture Index, (d) streamflow, groundwater,
Keetch Byram Drought Index, (e) U.S. Drought Monitor……………….36
Figure 4.11 Catawba Wateree Basin (Source: Duke Energy) ………………………..49
Figure 4.12 Yadkin Pee Dee Basin (Source: SC Department of Natural Resources)...50
Figure 4.21 Duke’s LIP indicators April 2000 – December 2001……………………60
Figure 4.22 Duke’s LIP indicators January 2002 – December 2003..………………..61
Figure 4.23 Duke’s LIP indicators January 2004 – December 2005…………………62
Figure 4.24 Duke’s LIP indicators January 2006 – April 2008………………………64
Figure 4.41 Alcoa/Progress Energy LIP Indicator Stage Comparison,
May 2002 – May 2003 ………………………………………………….77
Figure 4.42 Alcoa/Progress Energy LIP Indicator Stage Comparison,
August 2007 – April 2008 ……………………………………………....78
Figure 5.11 Summary of Indicator Type Used by Water Systems, N=43 ………….100
Figure 5.12 Importance of indicator characteristics to water systems………………104
Figure 5.13 Number of water systems that ranked each category…………………..108
Figure 5.14 Drought indicator consistency with alternative water providers
summarized by system size.……………………………….....................113
Figure 5.15 Drought indicator consistency with upstream water systems summarized
by system size…………………………………………………………..115
Figure 5.16 Percentage of water systems experiencing drought impacts, 2000-2001:
a) 2000, b) 2001………………………………………………………...118
xii
Figure 5.17 Percentage of the state in the highest level of drought based on the S.C.
Drought Response Committee’s declarations compared to the percentage
of water systems experiencing drought impacts during 2000-2001……119
Figure 5.18 Percentage of water systems experiencing drought impacts, 2002-2003:
a) 2002, b) 2003………………………………………………………...120
Figure 5.19 Percentage of the state in the highest level of drought based on the S.C.
Drought Response Committee’s declarations compared to the percentage
of water systems experiencing drought impacts during 2002-2003……121
Figure 5.20 Percentage of water systems experiencing drought impacts,
2004-2006: a) 2004, b) 2005, c) 2006…………………………………122
Figure 5.21 Percentage of the state in the highest level of drought based on the S.C.
Drought Response Committee’s declarations compared to the percentage
of water systems experiencing drought impacts during 2004-2006……123
Figure 5.22 Severity of drought impacts experienced by power companies, 2000-2003:
a) 2000-2001, b) 2002-2003...………………………………………….130

1
CHAPTER 1 INTRODUCTION
Over the last decade, as South Carolina endured two record multi-year droughts,
it became clear that the sustainability of the state’s water resources could no longer be
taken for granted. These extreme events were a necessary “springboard” to elevate the
public’s awareness and capture decision makers’ attention to the challenges associated
with managing South Carolina’s water resources. Well-publicized, major natural hazard
events usually stimulate stakeholder interest and increase the public’s acceptance of
policy changes. The droughts brought about changes in how the state’s water resources
are managed and reinforced the need for improved coordination and planning within and
between levels of government and water users.
As the drought response program evolved since the late 1970s, South Carolina
experienced many of the institutional, political and budgetary constraints common to the
drought planning process. The State’s shift to more integrated drought planning and
response occurred after twenty years of successes and failures in drought planning and
policy implementation. A common, positive thread in the program is the State Drought
Response Committee, which is composed of local and state representatives who must
evaluate drought indicators and triggers to determine if action beyond the scope of local
response is needed. One of the major shifts to improve the state’s drought management
has been the analysis of drought indicators, the development of drought triggers, and the
corresponding management responses at both the state and local level.

2
At the local level, water users, such as water systems, industries, and power
generation facilities, are responsible for maintaining drought management plans and
response policies that are integrated between connected systems and the state’s plan. The
foundation of local drought management plans and policies relies on system-specific
drought indicators, identification of alternative water supplies, and public education.
Each plan designates drought indicators specific to the system that can be used separate
from, or in conjunction with, state-level drought triggers. System-specific drought
indicators include information such as reservoir levels, streamflow, number of days of
supply remaining, and average daily use. The state uses more traditional indices such as
the Palmer Drought Severity Index (PDSI) (Palmer, 1965) and Standardized Precipitation
Index (SPI) (McKee et al., 1993) for state level declarations.
Beyond South Carolina’s push for improved drought indicators and triggers there
are examples of this trend at the federal and national levels. Many of the nation’s
hydropower dams are undergoing relicensing by the Federal Energy Regulatory
Commission (FERC). In order to meet FERC’s requirements, the hydropower companies
must develop Low Inflow Protocols (LIP) as a part of their new license. Many of the
current licenses have been in place since the 1950s and the inclusion of drought
indicators and LIPs is a major milestone for future drought mitigation given the 30- to
50- year duration of each license. The LIP provides procedures for how the hydro-
projects will be operated by the licensee and how other water users should respond during
periods when insufficient water flows into the project reservoirs to meet normal needs
(Catawba-Wateree Project, Comprehensive Relicensing Agreement, October 2006;
Yadkin Hydroelectric Project, February 2007).

3
Designating indicators to detect drought conditions and triggers to activate the
appropriate response is the backbone for improved drought mitigation to reduce drought
impacts (Hrezo et al., 1986; Fisher and Palmer, 1997; Steinemann et al., 2005; Palmer et
al., 2002). However, the complexity of drought makes determining the drought
indicators and triggers difficult. Droughts may be characterized in many different ways
(Wilhite and Glantz, 1985) and no single indicator serves as an adequate national
standard to characterize the damage potential of drought the way the Saffir-Simpson
Scale measures hurricane intensity, or the Fujita scale relates to tornado destruction.
Instead, decision makers typically rely on multiple triggers from a long list of indicators.
While multiple drought indicators improve detection, many stakeholders (e.g., water
resource managers) do not know which indicators and trigger values to use. Decision
makers often consider using multiple indicators without realizing their spatial and
temporal inconsistencies (Steinemann et al., 2005; Karl et al., 1987; Guttman et al.,
1992). Decision makers may use indicators that lack a consistent long-term record or one
that can be reconstructed and be reliably generated in the future (Steinemann et al., 2005,
Keyantash and Dracup, 2002). While South Carolina’s drought response program is
proactive in having state and local level drought indicators, many of the indicators are
being developed without scientific justification.
The purpose of this research is to determine which drought indicators are most
effective in enhancing South Carolina’s state and local drought mitigation policies. The
study will demonstrate the importance of developing and testing drought indicators. It
will also assess the effectiveness of using an integrated planning approach by evaluating
the spatial and temporal distribution of drought intensity and frequency as indicated by

4
federal, state, and local indicators. This will be accomplished through four research
objectives.
1. Determine the statistical consistency among state indicators and
drought categories.
The first objective evaluates the correlation between state-level drought indicators
(Table 3.1) used by the S.C. Drought Response Committee for official drought
stage determination. The frequency of occurrence within each threshold trigger
level will reveal any inconsistencies between indicators and serve to better
understand the duration and probability of drought occurrence.
2. Identify inconsistencies between multiple indicators used in local
drought plans.
Frequency distributions were computed to determine probabilities of drought
occurrence for local drought indicators used in the Catawba-Wateree and Yadkin-
Pee Dee LIP (Table 4.11 and 4.12). The importance of indicator consistency
among local water systems within each basin was demonstrated by analyzing
indicators for the City of Rock Hill, South Carolina.
3. Evaluate use of indicator percentiles comparison as a method to
improve drought detection.
The research will test whether transforming indicators to percentiles and then
combining the multiple indices using blends or weights to create a new, blended
drought index is an efficient and alternative approach for improving drought
detection. Specifically, the research will determine whether drought detection in
the Catawba-Wateree river basin can be improved by using a single or blended

5
drought index to replace the U.S. Drought Monitor. Subjective criteria based on
communication with Duke Energy and the Catawba-Wateree Drought
Management Advisory Group is used to evaluate indicator performance.
4. Determine what state and local indicator characteristics make an
effective drought indicator for water system and power generation
management needs.
A survey, as well as extensive interactions with water managers and
stakeholders during the 1998-2002 and 2007-2008 droughts, was used to evaluate
the effectiveness of state and local drought indicators. The emphasis of the
previous objectives focused on the scientific justification of drought indicators.
Objective 4 provides the link between the scientific justification and operational
relevancy of the indicators. The survey also provides a manager’s reconstruction
of the historic sequence of the 1998-2002 drought to better understand their
ability to tolerate drought. The survey results and correspondence with water
users and decision makers were used to verify which indicator(s) meet the user’s
needs and more closely detect the drought impacts on their operations.
The research will provide scientific and operational information to consider in
evaluating whether changes should be made to the drought indicators listed in the South
Carolina Drought Response Act regulations, and those recently implemented in the FERC
Low Inflow Protocols (LIP) for the Catawba-Wateree and Yadkin-Pee Dee river basins.
Indicator research, such as that conducted for this study, is listed as a primary agenda
item for evaluation by the FERC LIP Drought Management Groups that meet annually.
The research results will also be useful as South Carolina Electric and Gas Company

6
begins relicensing and LIP development for their hydropower dam in the Saluda basin.
The research implements key components of the National Integrated Drought Information
System federal initiative that calls for integrated drought research and information at
relevant spatial scales to facilitate proactive decisions. Finally, the research will serve as
a reference tool showing how indicators can be integrated between water systems, power
generating facilities, and state level plans to improve drought response.
The research background, methodology, results, and conclusions are presented in
six chapters. The first chapter serves as an introduction to the research questions focused
on developing effective drought indicators that enhance state and local drought mitigation
policies. Chapter 2 reviews existing literature on the advantages and limitations of the
different drought indicators and the evolution of state and federal drought management.
Chapter 3 examines the statistical consistency between the seven state drought indicators
and stages. Chapter 4 investigates the diagnostic accuracy of the multiple indicators
specified in the local FERC LIPs for the Catawba-Wateree and Yadkin Pee Dee river
basins. This chapter also evaluates other potential local indicators, or blends of
indicators, and stresses the importance of indicator consistency between the FERC
licensee and local water systems in the basins. Chapter 5 provides the link between the
scientific justification and operational relevancy of the indicators, summarizing the water
system and power company survey results. The survey reveals those characteristic(s) that
make an effective drought indicator(s) by meeting the user’s management needs.
Chapter 6 summarizes the research by providing implications and recommendations for
improving drought management in South Carolina.

7
CHAPTER 2 LITERATURE REVIEW
2.1 Drought Indicators
Drought affects a wide variety of sectors across divergent time scales, making it
difficult to define and measure. Various quantitative measures of drought have been
developed to respond to the needs of different disciplines and regions. The terms
“measure” or “indicator” are often used to describe those variables that characterize
drought. Drought triggers are the thresholds of the measures or indicators used to
activate the several levels of response. Typical indicators are based on meteorological
and hydrological variables such as precipitation, temperature, evaporation, soil moisture,
streamflow, reservoir storage, and groundwater levels. In many cases, several variables
have been combined to form a drought index such as the computation of the Palmer
Drought Severity Index that includes rainfall, temperature, evapotranspiration, and soil
moisture (Palmer, 1965). As the list of indicators grows, so does the confusion over
which indicator or combination of indicators should be used by decision makers. A new
product is available from the Climate Prediction Center that blends or weights several
indices for short and long-term intervals at climate divisions in the U.S. (Svoboda et al.,
2002). This blended drought index is used by the U.S. Drought Monitor authors, but
there is minimal literature available on the blended index or its creation.
Recent advancements have been made in the implementation of more
sophisticated models that better represent the complex hydrologic cycle designed for

8
large-scale applications. For example, there is growing interest in the operational use of
the Variable Infiltration Capacity (VIC) macroscale hydrologic model that has been
tested across multiple basins in the United States and globally (Cherkauer, K.A, et al.,
2003). Such process-oriented approaches for detecting drought are used less commonly
in local, state and federal drought plans because of their computational complexity and
input data requirements. Models such as VIC are not currently used in S.C. state and
local drought plans.
The most common drought indices include the Palmer Drought Severity Index
(PDSI), the Palmer Hydrologic Index (PHDI), the Palmer Z-Index (Z index), the Crop
Moisture Index (CMI), the Standardized Precipitation Index (SPI), the Keetch-Byram
Drought Index (KBDI), Surface Water Supply Index (SWSI), Percent of Normal Rainfall,
and the U.S. Drought Monitor. Drought indices derived from streamflow data as well as
reservoir storage and groundwater levels also serve as useful indicators of water
shortages. Additional local indicators often used by water systems include days of supply
remaining and use greater than certain benchmarks. The indices and indicators evaluated
as part of this research are discussed in more detail in the sections below.
2.11 Palmer Drought Severity Index
Of the variety of definitions and drought measures developed, the Palmer Drought
Severity Index (PDSI) has been the most widely used and heavily relied on in the United
States (Alley, 1984; Karl et al., 1987; Guttman et al., 1992). For example, the PDSI was
used as the sole trigger for South Carolina’s drought legislation (South Carolina Drought
Response Act, 1985) and related triggered response from its inception in 1985 until its
amendment in 2000 (South Carolina Drought Response Act, 2000). Amendments in the

9
revised South Carolina Drought Response Act of 2000, however, list the Palmer Drought
Severity Index as well as the Crop Moisture Index, Standardized Precipitation Index, U.S
Drought Monitor, streamflow and aquifer levels as quantified indices that may be used
for drought stage evaluation.
The PDSI is calculated based on precipitation and temperature data, as well as the
local available water content of the soil. Despite many of the referenced limitations
(assumptions used in water balance calculations and the empirical nature of some of the
standardizing coefficients) of the PDSI it generally proved to be sufficient in detecting
drought in South Carolina from the mid-1980s until early 2000 when additional
indicators became more widely available resulting in amendments to the S.C. Drought
Response Act. The PDSI’s primary drawback is inability detecting agricultural droughts
that often occur in South Carolina with one to two month rainfall deficits during the
growing season. Some literature references the PDSI’s skill in indicating the physical
severity of drought on the soil (Gutmann, 1998) making it useful for monitoring
agricultural impacts (Hayes et al., 1999) yet the index’s long-term memory has proved to
be insufficient for detecting short-term severe droughts that can devastate South Carolina
crops.
South Carolina decision makers have also experienced the PDSI’s limitations in
detecting hydrologic drought (Karl, 1986; Alley, 1984). Since the PDSI is a
meteorological drought index, as the weather changes from dry or wet to near normal, the
PDSI will transition back to normal despite the fact that lakes, rivers, and reservoirs may
still be quite low. For example, during the record drought of 1998-2002, the PDSI value
was below –3 for South Carolina climate division 3 for nine consecutive months with a

10
value of –3.81 in September 2002. Heavy rains during September and October forced a
recovery of the PDSI to near normal, 0.34, for October. The near normal PDSI
classification obscured the hydrologic drought that continued for the area. Ironically,
according to Karl et al. (1987), the preferred time for ending severe drought as indicated
by the PDSI in South Carolina from one month of rainfall is early fall.
The spatial inconsistency of the index referenced in the literature (e.g., Wells et
al., 2004; Guttman et al., 1992; Alley, 1984) is less of a problem for South Carolina since
the humid, subtropical climate pattern dominates statewide from the mountains to the
coast. Concerns in the literature over the spatial comparability occur more when analysis
is made across different climate regimes such as semiarid compared to sub-humid and
humid (Guttman et al., 1992). Efforts have been made to overcome the limitations of the
original PDSI by adjusting the calculations (Wells et. al., 2004; NCDC, 1994; Heim,
2005). Fewer studies have been conducted on intrastate spatial inconsistency of the
PDSI. This study will provide a detailed examination of the spatial consistency of the
different severity levels for all the commonly-used drought indices in the region.
2.12 Palmer Hydrologic Index and Z index
The Palmer Hydrologic Index (PHDI) and the Z index have been used less
frequently by decision-makers in the Carolinas, but the PHDI is one indicator being
considered for inclusion in the FERC LIP for the Catawba-Wateree and Yadkin-Pee Dee
river basins. The PHDI is used to assess longer-term moisture anomalies that affect
streamflow, groundwater, and reservoir storage. The PHDI responds more slowly to
changing conditions than the PDSI. Several articles outline the differences between the
PHDI and PDSI (Karl, 1987; Karl, 1986; Alley, 1984). Another index introduced by

11
Palmer is the Z index (Palmer, 1965). The Palmer Z index is a measure of an individual
month’s wetness and dryness. The value of Z is regarded as the “moisture anomaly
index” (Karl, 1986). The Z index can be used to show how wet or dry it was during a
single month without regard to recent precipitation trends.
2.13 Crop Moisture Index
The Crop Moisture Index (CMI) measures short-term drought on a weekly scale
to quantify drought's impacts on agriculture during the growing season. It was developed
by Palmer (1968) from procedures within the calculation of the PDSI. The CMI responds
more rapidly than the Palmer Index and can change considerably from week to week, so
it is more effective in calculating short-term abnormal dryness or wetness affecting
agriculture. The CMI has been extensively used by the South Carolina Drought
Response Committee and is listed as a drought indicator in the South Carolina drought
act regulations. It’s rapid week-to-week changes, however, can be confusing for
agriculture decision-makers. The CMI responds drastically from heavy rainfall events
such as the change in 1998 from –4.01, or extreme drought, to –0.84, incipient drought,
in one week due to tropical rains across South Carolina from tropical system Earl. While
the storm’s five inches of rain quickly alleviated the extreme drought conditions,
according to the CMI, the true agricultural drought disaster was not relieved. Most of the
rainfall ran off and the federal government classified the entire growing season as an
agricultural disaster (U.S. Agriculture Secretary Disaster Declaration, 1998).
Agricultural decision makers consistently face challenges using precipitation or
index data at the climate division level. Their requests to the federal government for
disaster declarations are based at the county level and require climate and drought data at

12
a similar or smaller resolution. The rainfall and drought index data often must be
supplemented with radar-estimated rainfall deficits that provide the higher resolution
spatial coverage (Eubanks, personal communication, 2005).
2.14 Standardized Precipitation Index
McKee et al. (1993) designed the Standardized Precipitation Index (SPI) to
quantify precipitation deficits for multiple time scales (1 month SPI, 3 month SPI, etc.),
realizing that droughts of different duration impact different sectors. For example, soil
moisture conditions respond to precipitation anomalies on a much shorter time scale than
groundwater or streamflow (Hayes et al., 1999) and therefore require different indicators,
or, as is the case with the SPI, an indicator for multiple time scales. The SPI is based on
precipitation alone and is basically the number of standard deviations that the observed
value would deviate from the long-term mean for a normally distributed, random
variable.
Several articles compare the PDSI and SPI (Gutman, 1998; Hayes et al., 1999).
The SPI’s multiple timescale depiction of drought is considered a primary advantage over
other drought indicators. Another primary advantage of the SPI compared to the PDSI is
the SPI’s normal distribution. The frequency of the extreme and severe drought
classifications for any location and any timescale is spatially consistent (Hayes et al.,
1999; Gutman, 1998). However, this means that the SPI cannot be used as a tool to
identify areas that are more prone to drought.
Steinemann et al. (2005) also illustrate that equal categorical intervals have
differing probabilities of occurrence. For example, the probability difference between –
1.0 and –1.5 (9.1 percent) is not the same as the probability difference between –1.5 and

13
–2.0 (4.4 percent). Another recent article by Wu et al. (2005) cautions that discrepancies
may occur between SPI values using different historical time periods (1931-1960, 1971-
2000, 1894-2000) if the gamma distributions of precipitation are different. The SPI is
listed as a drought indicator in the South Carolina Drought Response Act regulations;
however, the regulations do not specify which SPI time interval should be used.
Traditionally, the 3-month, 6-month and 9-month SPI is presented at the South Carolina
Drought Response Committee meetings.
2.15 Keetch Byram Drought Index
Keetch and Byram (1968) designed a drought index specifically for fire potential
assessment. The Keetch Byram Drought Index (KBDI) is calculated based on mean
annual precipitation, maximum temperature, and the last 24 hours of rainfall. The KBDI
assumes soil saturation with eight inches of precipitation. At any point along the scale, 0
to 800, the index number indicates the amount of net rainfall that is required to reduce the
index to zero, or saturation. Reduction in drought occurs only when rainfall exceeds 0.20
inch (Janis et al., 2002). There is a limited amount of literature discussing the advantages
and disadvantages of the KBDI. Haines et al. (1976) state a primary advantage is the
ease of computation that provides a continuous record that is updated daily. A
disadvantage outlined by Haines et al. (1976) is that wind and humidity are major factors
contributing to fire danger, but these are not included in the KBDI computation. These
factors are significant in South Carolina and other parts of the Southeast.
2.16 U.S Drought Monitor
One of the newest drought monitoring tools is the U.S. Drought Monitor (DM).
The DM is produced weekly by agencies within the National Oceanic and Atmospheric

14
Administration, the U.S. Department of Agriculture, and the National Drought Mitigation
Center. Rather than an index with a set calculation, the DM is a product that incorporates
quantitative indicators or weather data with input from local, state, regional, and federal
experts (Svoboda et al., 2002). Svoboda et al. (2002) explain that the DM was intended
to be the “Fujita” or “Saffir-Simpson” type classification system for drought. Drought
magnitude is classified into five levels: D0 (abnormally dry) to D4 (exceptional drought).
The DM also attempts to depict drought impact types by giving a label A, W, or F for
Agriculture, Water/Hydrologic, and Fire respectively. The DM uses a percentile
approach in determining the thresholds for each severity level, all data are considered
with reference to their historical frequency of occurrence. While percentiles guide the
product development, subjective adjustments based on local impacts are considered. The
local adjustments are generally considered a benefit to the process; however, since the
DM is not a straightforward calculation historical values can not be regenerated because
the local input is not available. Only available since 1999, the DM is a rather new tool
and cannot be extended back in time to make comparisons with more traditional drought
indicators and to recreate values during significant historical droughts. Many leaders in
drought mitigation and monitoring emphasize that decision makers should use an
indicator that has a consistent long-term record or one that can be reconstructed and
generated reliably in the future (Steineman et al., 2005; Keyantash and Dracup, 2002).
The literature stresses the importance of testing the statistical consistency among
indicators (Steinemann et al., 2005).
The DM has gained popularity among the media and state and local officials. It
should be evaluated for spatial and temporal consistency before it is used as an official

15
indicator. The short historical period (1999-2008) limits performance of these
comparisons. Currently, the DM is listed as one of three triggers in the relicensing LIP
for the Catawba-Wateree and Yadkin Pee Dee river basins. One goal of this research is
to assist the licensee for these basins with the spatial and temporal evaluation of their
proposed license-specific drought indicators and other potential drought indicators, or
blends of indicators.
2.17 Streamflow, Reservoir, Groundwater Levels
Hydrologic indicators of drought are typically reservoir storage, streamflow
levels, and groundwater supply. Reservoir storage elevations are generally easy to
measure, but operating curves may complicate assessment of drought conditions (Wilhite
et al., 2005). Another drawback in using reservoir levels is lack of data and shorter
records. A mechanism to quantify reservoir storage, however, is a typical indicator for
local-level drought planning and is the primary indicator for the hydroelectric LIPs for
the Catawba-Wateree and Yadkin-Pee Dee river basins.
Streamflow is also often used as a drought indicator. Dracup et al. (1980) suggest
streamflow can be related to the total moisture of a basin since it is a function of soil
moisture, groundwater levels, runoff, and precipitation. Streamflow measurements,
however, have various limitations. Base flow or mean flow over some period (e.g., 14-
day, monthly) should be used to average out runoff crests (Dracup et al., 1980; Heim,
2002). Small streams may respond more quickly to short periods of dryness or heavy
downpours, large streams may react more slowly to the onset of drought, and streamflow
can be strongly influenced by basin characteristics and manmade development.

16
The U.S. Geological Survey, in cooperation with other agencies, operates and
maintains a network of stream gages across each state. In addition to the challenges of
using weather station point data for spatial interpolation, further limitations arise in using
streamflow data from a point location to represent the entire drainage basin. The point
data from two different streams cannot be extrapolated like weather station data across
counties because of the variation in basin characteristics. It is common practice,
however, to assume the point data can represent drought conditions upstream from the
station. The major assumption is that the runoff measured at the streamflow-gaging
station is the result of basin-wide conditions.
Groundwater is particularly important for some public water supply systems in
the Coastal Plain. The City of Sumter is the largest public water system in South
Carolina that relies solely on groundwater (South Carolina State Water Plan, 2004). The
South Carolina Drought Response Act supporting regulations list streamflow and aquifer
levels as drought indicators (Table 3.1). Aquifer elevation or groundwater drawdown can
be a useful drought indicator, but is usually limited by a poor understanding of the aquifer
stratigraphy, recharge rates, and other factors that may influence the levels, such as
agricultural, municipal, and industrial pumping. Static water levels in wells are a primary
drought indicator by public water systems that depend on groundwater. There has been
significant opposition to the use of groundwater as a drought indicator across South
Carolina although it is important to individual systems. The argument is that the decline
in water levels in confined aquifers can be a result of pumping and long-term
groundwater withdrawals, rather than drought, making this a potentially misleading
indicator in some locations.

17
Groundwater levels are usually the slowest to respond to drought, generally
following soil moisture and streams decline. Groundwater levels are also the slowest to
recover from drought. Deep groundwater is recharged from the shallow aquifers, which
act as reservoirs from which groundwater can percolate slowly downward. As a result,
they are buffered from short-term droughts and only show an effect during extended dry
periods. During the record drought of 1998-2002 and again in 2007-2008, groundwater
levels in shallow and deep aquifers across the Carolinas dropped to record lows. Pumps
in municipal and domestic wells had to be lowered, wells had to be deepened, and in
some instances, new wells had to be drilled. Gellici et al. (2004) documents the historical
decline in streamflow to new record lows during late summer 2002. Downstream flows
also measured lower than upstream flows, the reverse of what normally occurs in these
streams. Without interference from water withdrawers, this phenomenon can be only
interpreted that the streams were losing flow to the lower groundwater table (Badr, A.W.,
personal communication, 2008). The impact of the 1998-2002 drought on groundwater
levels alleviated some of the opposition in South Carolina to using groundwater as a
drought indicator. Duke Energy has listed groundwater levels as indicators for recovery
out of their FERC LIP drought stages on the Catawba-Wateree river basin.
2.2 Evolution of State and Federal Drought Management
Interest in drought planning has increased over the past 30 years. Like many
states, the evolution of South Carolina’s drought planning has occurred through trial and
error in response to increasing drought impacts. The incorporation of drought planning in
the Federal Energy Regulatory Commission’s hydropower relicensing over the past
decade has resulted in additional improvements to the State’s drought response.

18
2.21 History of S.C. Drought and the Progression of S.C. Drought Management
Historically, droughts have had severe, adverse impacts on the people and
economy of South Carolina. Drought impacts are diverse, causing a ripple effect through
the economy (Wilhite, 1993). Periods of dry weather have occurred in each decade since
1818 (National Water Summary 1988-1989 Hydrologic Events and Floods and Droughts,
1991). The earliest records of drought indicate that some streams in South Carolina went
dry in 1818, and fish in smaller streams died from lack of water in 1848. The most
damaging droughts in recent history occurred in 19541, 1986
1, 1998-2002
2, and 2007-
20083 (National Water Summary 1988-1989 Hydrologic Events and Floods and
Droughts, 19911; Gellici et al., 2004
2; South Carolina Department of Natural Resources
On-line Archived Drought Status, 20083). Less severe droughts were reported in 1988
1,
19902, 1993
2, and 1995
2 (National Water Summary 1988-1989 Hydrologic Events and
Floods and Droughts, 19911; South Carolina Climate, 2003
2).
Adverse impacts to the people and economy were made especially clear during
the droughts of 1998-2002 and 2007-2008 that affected agriculture, forestry, tourism,
power generation, public water supply, and fisheries. The economic costs associated with
these droughts will likely surpass any other drought in South Carolina’s history (de
Kozlowski, S., personal communication, 2008). During the past 50 years, droughts have
caused South Carolina’s third highest economic loss resulting from a natural hazard,
surpassed only by Hurricane Hugo and flooding (South Carolina State Hazard Mitigation
Plan, 2004).
The state began to examine drought impacts and occurrences in 1978 while most
of the United States was experiencing severe drought conditions (Rouse et al., 1985).

19
Several plans and laws have been considered and/or established to monitor, manage, and
conserve the state’s water resources during drought periods in the best interest of all
South Carolinians. South Carolina recognized the need to formalize a drought plan by
passing the South Carolina Drought Response Act in 1985. South Carolina is unique in
dealing with drought management through legislation and its associated regulations
(Knutson and Hayes, 2001).
South Carolina’s drought response differs from that of other southeastern states,
owing primarily to the creation and existence of the Drought Response Act. Like many
other states, South Carolina has a Drought Response Plan and a State Water Plan. While
the plans consist of detailed actions and responses, they are only recommendations and
not actual, enforceable laws. Through experience, South Carolina’s decision makers
learned that when dealing with an issue as controversial as restricting water use, it is
necessary to have legislation with mandated actions.
In 1985, South Carolina’s first drought law was adopted. This act was amended
in 2000 to implement guidelines set forth in the 1998 State Water Plan. These guidelines
included using multiple indicators to trigger drought response, adjusting drought
management areas to correspond with the State’s four major river basins, restructuring
local drought committees, and clarifying existing procedures to identify and address
water shortages. Since the record drought of 1998-2002 the S.C. Department of Natural
Resources (SCDNR) revised the State Water Plan (2004), publishing a second edition
that reflects the lessons learned during the drought. The Drought Response Act has yet to
be amended and brought in line with recommendations in the revised State Water Plan.
Other possible amendments may address policy shortfalls witnessed during the 1998-

20
2002 and 2007-2008 drought. One of the act’s major shortfalls is the lack of regulation
requiring private water systems, power generating facilities, and industries to develop
drought plans. The current regulation requires the development and implementation of
drought ordinances and plans by public water systems only.
South Carolina’s drought law addresses a limited set of possible actions. During
the original creation of the law and the amendment process, organizations and agencies
lobbied against sections of the act restricting to their operations. For instance,
agriculture-related groups believe that agriculture should be considered an essential water
user and, therefore, should not be subject to water-use curtailment. Their argument is
based on people’s need for food to survive, thus making agriculture essential. The
legislature agreed in 2000 that agriculture could not be excluded from the jurisdiction of
the drought law, however, due to increased pressure from the agriculture community the
law was revised in 2005. This amendment was opposed by representatives of water
systems based on the argument that every sector could argue that it is an essential user of
water - such as the need for power generation facilities. The surprising, unanimous vote
from the S.C. General Assembly in favor of less stringent requirements on agriculture is
some indication of the consistent political power of the agricultural community despite
the limited number of farmers and acres under cultivation in the state. In other states,
such as Georgia, the agriculture industry has successfully lobbied for programs that pay
farmers not to irrigate during drought and that establish stronger incentives for private
investment in water conservation.
The S.C. Department of Health and Environmental Control (SCDHEC), S.C.
Chapter of the American Water Works Association (SCAWWA), and industrial

21
representatives opposed several amendments that were included in the 2000 S.C. Drought
Response Act, but a comprise was finally reached. SCDHEC is responsible for enforcing
federal and state environmental laws and regulations, and for issuing permits, licenses,
and certifications for activities that may affect the environment. Their primary concern
was the possible conflict between their Groundwater Use and Reporting Act and the
Drought Response Act. They wanted to exclude the use of declining water levels in
confined aquifers as an indicator of drought because such declines can result from
pumping and long-term groundwater withdrawals, not drought. SCAWWA represents
public water supply systems in the state. Their concern was with the overall authority of
the original Drought Response Act. Businesses may lose revenue when a drought
declaration is made by the state on a regional basis, placing mandatory water restrictions
on users and water system operators who have stored water for such shortfalls.
The S.C. General Assembly, like other policy makers, faces the challenge of
managing natural resources for multiple benefits. This challenge includes considering the
implications of their decisions on several economic sectors. In trying to reduce risk and
arrive at optimal decisions, policy makers often depend on science to shape and support
the policy. During the 2000 amendment process, the SCDNR was able to answer the
questions and concerns of the S.C. General Assembly and other interested groups by
justifying the amendments to the drought policy with scientific documentation.
The documentation was based on multidisciplinary research by a team consisting
of climatologists, hydrologists, and soil scientists. Science incorporating different
disciplines usually provides diverse forms of data and perspectives (Mizzell and
Lakshmi, 2004). An integration of the diverse information into products that explicitly

22
considered the factors relevant to the drought policy and that were discernible by the
General Assembly guided the process. It also required cooperation and open
communication between the scientists and the policy makers. The S.C. General
Assembly would not have approved the amendments to the Drought Act (owing to the
controversial nature of droughts and water rights) without the provided scientific
documentation coupled with the state’s ongoing severe drought. Stakeholders, policy-
makers, and state government will face these challenges again as more changes to the
Drought Act are needed.
2.22 Local Drought Response Ordinances and Plans
The passage of the South Carolina Drought Response Act of 2000 provided the
opportunity to implement a new model drought mitigation plan and response ordinance
for public water systems. The Act requires that all municipalities, counties, public service
districts, special purpose districts, and commissions of public works engaged in the
business or activity of supplying water for any purpose, develop, and implement drought
response ordinances or plans. The ordinances and plans must be consistent with the State
Drought Response Plan.
The State Drought Response Plan includes a model water system ordinance and
plan. In order to support implementation, the models were developed by the SCDNR,
SCDHEC, and the S.C. Water Utility Council (SCWUC). SCWUC is composed of the
state’s most proactive water systems. These groups worked together to ensure that the
model not only represented the best interests of the state, but also was applicable for
water system management. Regulatory policies that are developed without the input of
the primary stakeholder lead to distrust and opposition to the overall process. Including

23
the SCWUC made it easier to convince the water systems that developing the drought
plan and response ordinance was a legitimate and necessary task and not just another
policy imposed by bureaucrats who have no experience in operating a water system.
The model consists of a section devoted to drought planning and a section
outlining the ordinance requirements. The Drought Management Plan requires the
designation of a water system drought response representative; description of the water
system layout, water sources, capacities, and yields; identification of water system -
specific drought or water shortage indicators; documentation of cooperative agreements
and alternative water supply sources; description of pre-drought planning efforts; and a
description of capital planning and investment for system reliability and demand
forecasting. The Drought Response Ordinance outlines the actions to be taken at each
level of drought (moderate, severe, and extreme), the requirements for rationing, the
enforcement of restrictions, and the process of requesting a variance.
2.23 Federal Drought Response
In 1998, the U.S. Congress passed the National Drought Policy Act,
recommending that the nation would benefit from a national drought policy based on
preparedness and mitigation to reduce the need for emergency relief (Motha, 2000). The
National Drought Preparedness Act of 2003 was introduced in both the U.S. House and
Senate to develop a comprehensive national drought policy that statutorily authorizes a
lead federal agency for drought and delineates the roles and responsibilities for
coordinating and integrating federal assistance for droughts. In 2006, the National
Integrated Drought Information System Act (NIDIS) (Western Governors’ Association,
2004) was introduced by the U.S. Congress and signed by the President. A goal of

24
NIDIS is to foster and support coordination to ensure the most effective drought research
efforts to benefit decision makers and NIDIS users. This project implements the federal
initiatives calling for cohesive and collaborative interactions at national, regional, and
local levels.
2.24 Federal Energy Regulatory Commission Licenses
The Federal Power Act gives the Federal Energy Regulatory Commission (FERC)
the exclusive authority to issue licenses to construct, operate, and maintain certain non-
federal hydropower projects. The FERC regulates hydroelectric power projects under
other statutes including the Public Utility Regulatory Policies Act, Electric Consumers
Protection Act of 1986, and the Energy Policy Act of 1992. The FERC licenses more
than 1,700 non-federal public dams used for hydroelectric power generation with dams
located in 44 states and in Puerto Rico. Twenty-five percent of the licenses are up for
renewal before 2020 (http://www.ferc.gov/industries/hydropower/gen-info/licensing.asp).
The license process has changed over the past 50 years with emphasis shifting
away from a license focused solely on generating electricity from hydropower to a
balance between producing electricity and its impact on the environment. The
relicensing process addresses not only the generation of electricity, but also the natural
resources that may be affected by a project's operation. With 200 dams or projects up for
renewal over the next 15 years, four in South Carolina alone (Catawba-Wateree, Yadkin-
Pee Dee, Saluda, and Keowee), resource agencies and conservation groups have a once-
in-a-lifetime opportunity to work with hydropower operators to slow shoreline
development, improve fish habitat, enhance river recreation, and enhance management
plans that will shape the river management for the next 30 to 50 years.

25
During the height of the 1998-2002 drought, FERC initiated drought management
workshops to exchange information on drought and discuss FERC hydropower responses
to drought conditions. In 2002, the first workshop was held in Atlanta, Georgia and
targeted licensee and stakeholders in the Southeast who were suffering from the multi-
year, severe drought. The goals of the workshops were to gain a better understanding of
drought indicators that may be useful to implement earlier responses to drought
conditions involving FERC hydropower projects and to identify ways to improve and
maintain coordination and cooperation among licensees, agencies, stakeholders, and
FERC during drought events. The workshop was an important step toward the
recognition of drought mitigation during this federal-mandated process. This is another
example of the shift in the license process that began in the early 1980s to better balance
relicensing hydropower to produce electricity with environmental interests.
The evolution of the drought plans, or LIPs, in the Yadkin-Pee Dee and Catawba-
Wateree river basins demonstrates the need to create an LIP that has “diagnostic accuracy
of the trigger points and the effectiveness with which the licensee and the water users
work together to implement their required actions.” Duke Energy, the licensee in the
Catawba-Wateree river basin, and the state resource agencies realized the indicators and
trigger points must be determined scientifically and evaluated historically. Duke Energy
provided funding to the State Climate Offices of South Carolina and North Carolina to
assist in the identification of appropriate triggers through development of an online
Dynamic Drought Index Tool (DDIT) (Carbone et al., 2008) and research components
from this research that evaluate the indicators and methodology used to create a higher
resolution drought indicator database based on percentiles rather than raw index values.

26
In order to ensure continuous improvement regarding the LIP and its
implementation throughout the term of the new license, the Catawba-Wateree Drought
Management Advisory Group (CWDMAG) will conduct periodic re-evaluations and
modifications. The DMAG will use research findings and experience with the 2006-2008
drought to determine whether adjustments to the drought indicators currently listed in the
license are needed. The re-evaluations provide some flexibility for changes during the
30- to 50- year duration of the license.
In summary, the process of planning for drought has evolved at all levels over the
past few decades. Increasing drought impacts and concerns for future water availability
presents new challenges for stakeholders and policy-makers. In South Carolina,
amendments to the S.C. Drought Response Act in 2000, increase in local drought
planning, and the relicensing of several hydro-power projects has resulted in significant
improvements to the State’s drought response. Despite this, detecting drought and its
impacts continues to present a daunting task. Single indicators often prove to be
inadequate in detecting the onset, duration and recovery from drought especially for
diverse sectors. Additional challenges occur when users combine multiple indicators in
drought management plans without understanding the spatial and temporal consistency
and the direct relevance of the indicators in meeting their needs.

27
CHAPTER 3 EVALUATION OF STATE DROUGHT INDICATORS
While South Carolina’s drought response program is proactive in having state and
local level drought indicators, many are being developed without scientific justification.
One of this dissertation’s goals is to determine whether statistical inconsistencies exist
among state-defined drought indicators and categories. The S.C. Drought Response
Committee relies primarily on seven drought indicators defined in the S.C. Drought
Response Act’s supporting regulations (Table 3.1) to declare four levels of drought:
incipient, moderate, severe, and extreme. South Carolina uses seven indicators because
droughts can be characterized in many different ways (Wilhite and Glantz, 1985) and no
single indicator serves as an adequate national standard to characterize drought. The
seven indicators were selected to detect drought severity at varying time scales and to
characterize drought for different sectors. The Crop Moisture Index, for example, is used
to detect short-term drought periods that impact soil moisture for agriculture. The Crop
Moisture Index would not be a useful indicator for detecting hydrologic droughts, which
usually occur on a longer time-scale.
Inconsistencies in the frequency of drought occurrence as determined by each
indicator cause confusion for the S.C. Drought Response Committee and all water users.
This analysis will compare the frequencies of drought events that fall into each drought
level for each indicator in Table 3.1. If the indicators are consistent they should have

28
similar frequencies. This evaluation will compare statistical properties of probability
distributions using the two-way chi-square test.
Table 3.1 State level indicators designated by regulation.
Drought
Indicator
Incipient Moderate Severe Extreme
PDSI1 -0.50 to -1.49 -1.50 to -2.99 -3.00 to –3.99 < -4.00
SPI2 0.00 to -0.99 -1.00 to -1.49 -1.50 to –1.99 < -2.00
DM3 DO D1 D2 D3
CMI4 0.00 to -1.49 -1.50 to -2.99 -3.00 to –3.99 < -4.00
KBDI5 300 to 399 400 to 499 500 to 699 > 700
Streamflow Average daily
streamflow
111%-120% of
the 5% monthly
flow for 2
consecutive
weeks
Average daily
streamflow
101%-110% of
the 5% monthly
flow for 2
consecutive
weeks
Average daily
streamflow is
between 5%
monthly flow
and 90% of the
5% monthly
flow for 2
consecutive
weeks
Average daily
streamflow less
than 90% of the
5% monthly
flow for 2
consecutive
weeks
Groundwater Groundwater
levels from the
surface are
between the
80% to 90%
range
Groundwater
levels from the
surface are
between the
90% to 95%
range
Groundwater
levels from the
surface are
between the
95% to 98%
range
Groundwater
levels from the
surface are
between the
98% to 100%
range
1PDSI =Palmer Drought Severity Index,
2SPI=Standard Precipitation Index,
3DM=U.S. Drought Monitor,
4CMI=Crop Moisture Index,
5KBDI=Keetch Byram Drought Index.
3.1 Data and Methodology
The data source for this analysis is the Carolinas Dynamic Drought Index Tool
(DDIT) (Carbone et al., 2008; Rhee, 2007). This drought monitoring tool was developed
to improve drought monitoring in the Carolinas by providing a single application to
access drought indicators at a higher resolution. Users may select raw indicator values or

29
percentile occurrence. Using the percentiles, the user may also weight multiple indices to
create a blended index. The DDIT computes monthly Palmer Drought Severity Index
(PDSI), Palmer Hydrologic Index (PHDI), Palmer Z index (Z Index), Standardized
Precipitation Index (SPI 1-, 3-, 6-, 9-, 12-month) and precipitation totals (1-, 3, 6-, 12-,
24-, 60-month) for over 200 weather stations in the Carolinas. The Crop Moisture Index
data are computed weekly and the Keetch-Byram Forest Fire Drought Index is computed
daily. The DDIT also provides streamflow averages (7-day,14-day, 1-month, 3-month, 6-
month, 24-month) at U.S Geological Society (USGS) gage locations in the region. Only
stations and gages with over 30 years of data and less than 20 percent missing data were
included. The data are interpolated to a 4-kilometer grid using inverse distance
weighting at a 4-kilometer resolution for the period 1950-2008. Since the indices are
computed for point locations and then interpolated to a grid, the index values can be
spatially aggregated based on the user specifications, such as by county or hydrologic
units. The DDIT also gives the user the ability to transform all indicators to a scale based
on percentiles, which will be evaluated in Chapter 4. The interpolated database of raw
indicator values and percentiles can be retrieved through a graphical user interface.
For the state indicator analysis, the DDIT application was used to extract drought
indicator data at the county and basin scale for the period 1951-2008. The application
will also be used to evaluate indicators expressed as percentiles. Other data sources, such
as indicator data received from Duke Power, Alcoa Yadkin and Progress Energy, and the
City of Rock Hill, are described specifically within methodologies in Chapter 4.
Percent frequency distributions of each state drought indicator used by the S.C.
Drought Response Committee (Table 3.1) were calculated using data retrieved from the

30
DDIT and U.S Drought Monitor (http://www.drought.unl.edu/dm/about.html). The S.C.
Drought Response Act’s supporting regulations do not define corresponding levels of
wetness; however, equivalent thresholds for wet periods are defined elsewhere and are
provided for some indicators in order to show the full distribution of the data. For
example, extreme droughts are defined by the PDSI when values are less than –4.
Extreme wet periods for the PDSI were defined when values were greater than +4.
Frequency distributions for the “wet periods” were not defined for the KBDI, streamflow,
and groundwater.
The data were analyzed for 660 months included in the period 1951-2005 for the
PDSI, 1-month SPI, 3-month SPI, 6-month SPI, 9-month SPI, and 12- month SPI.
Evaluation also included the 2,860 weekly data values for the period 1951-2005 for the
CMI and the 20,089 daily values of the KBDI. The highest DM drought level for each
county was extracted from a database provided by the National Drought Mitigation
Center for 312 weekly values for the period 2000 – 2005.
The interpolated indicator data were spatially averaged by county for all variables,
excluding streamflow and groundwater. Streamflow- and groundwater- drought levels
are based on percent frequency of occurrence and therefore are consistent spatially.
Three counties, Oconee, Florence, and Charleston, were selected for analysis to represent
different geographic regions in South Carolina. The S.C. Drought Response Committee
does not use the groundwater declaration thresholds defined by the S.C. Drought
Response Act’s supporting regulations. The regulations define groundwater threshold
based on static water levels in the aquifer compared to the predevelopment level of an
aquifer for two consecutive months. The Committee uses general USGS groundwater

31
duration plots and data. The groundwater ranges for each drought level, defined in Table
3.1 are also based on percent frequency of occurrence and are consistent between spatial
units.
The chi-square test was selected for the statistical analysis since it is a
nonparametric test commonly used to examine differences between categorical variables.
For this analysis, the chi-square test is used to estimate the independence of the drought
indicators categorized by drought occurrence (extreme/severe, moderate, incipient, and
normal). Chi-square must be calculated on actual count data, not substituting
percentages, so frequency of occurrence was analyzed. The test is not valid for small
samples (general rule is fewer than five), so the extreme and severe categories were
combined. Adjustments were made to the weekly CMI values and daily KBDI values to
express them as monthly equivalent values. The DM frequency of occurrence for 2000 –
2005 was extrapolated to represent drought frequencies for the period from 1951-2008.
However, the values are not representative of drought conditions throughout the period of
record since severe drought was common from 2000-2005. The null hypothesis for the
chi-square test is that no difference exists between the indicators. The degrees of freedom
are df=(# of rows - 1)(# of columns - 1) or df= (4-1)(2-1)= 3. Based on the confidence
level 0.05, the critical value is 7.82. These results must be considered within the
independence assumption of the chi-square test. While each drought index is calculated
uniquely, several rely on similar underlying data.

32
3.2 State Indicator Results
The percent frequencies for state drought indicators in Oconee County are
displayed in Table 3.2. Figures 3.1 a-e displays the frequency plots of the indicators
showing inconsistencies between the occurrence frequency for most stages of drought.
The occurrences of drought based on the SPI indicators (3-month, 6- month, 9-month and
12- month) are generally consistent as expected based on the standardized computation
that is normalized with respect to location and in time (Mckee et al., 1993). The
inconsistencies between most indicators are greatest from the moderate drought level to
the moderate wet level and less for severe and extreme drought and wet categories,
except for the CMI and streamflow. The CMI and streamflow are most inconsistent with
the other indicators at the severe and extreme levels.
The DM will be discussed separately from all other indicators due to its
significant inconsistencies for all drought levels. These inconsistencies may be attributed
to the shorter duration of analysis from 2000-2005 when most of South Carolina
experienced some level of drought for extended periods of time.
The frequency of occurrence in extreme drought is consistent between all
indicators (0.76 percent to 2 percent) except the CMI (0 percent), KBDI (0.05 percent),
and streamflow (4.49 percent). Based on the range of levels defined in the S.C. Drought
Response Act’s supporting regulations for streamflow, extreme drought will occur more
often than severe, moderate, or incipient droughts. For example, extreme drought occurs
anytime the flows are 90 percent of the 5 percent monthly flow or less which would be a
4.49 percent occurrence. Severe drought occurs anytime the flows are between the 5
percent monthly flow and 90 percent of the 5 percent monthly flow, which would only be

33
a 0.45 percent occurrence. For all other indicators, extreme drought occurs the least
often, as expected based on the highest severity level and defined ranges. The frequency
of severe droughts (2.27 percent to 5.15 percent) is consistent among all indicators except
for CMI and streamflow (0.17 percent and 0.45 percent). The frequency of moderate
droughts is consistent between the SPI indicators (7.58 percent to 10.78 percent) and
KBDI (7.28 percent). The frequency of moderate droughts based on the PDSI is much
higher with a 19.24 percent occurrence. Moderate droughts occur less often based on the
KBDI (5 percent), CMI (2 percent), and streamflow (0.45 percent). Incipient drought
occurrence is consistent between the CMI (11.82 percent), KBDI (11.06 percent), and
groundwater (10 percent). The SPI indicators are relatively consistent among each other
(33.03 percent to 37.42 percent), however, incipient droughts occur 4.39 percent more
often using the 1-month SPI than the 12-month SPI. This is equivalent to 29 more
months in incipient drought. Based on the PDSI, incipient drought occurs 16.97 percent
while based on streamflow only 0.45 percent.
The DM is generally not consistent with other indicators for each level of
drought; however, it has only been in existence since 2000. It was in the early stages of
development in late 1999 so these data were not incorporated. For the period analyzed,
2000-2005, South Carolina experienced extended periods of severe and extreme
droughts. The DM frequency analysis indicates the highest occurrence of extreme
droughts for all indicators (13.78 percent). Severe and moderate droughts each occurred
17.95 percent. Incipient droughts occurred 7.05 percent.

34
Table 3.2 Percent frequencies for state drought indicators in
Oconee County, SC.
Drought Level
DM1 KBDI
2 Streamflow Groundwater
313 Weekly
Values
%
20,089 Daily
Values
%
Based on predefined percentiles
%
Extreme Drought 13.78 0.05 4.49 2.00
Severe Drought 17.95 3.90 0.45 3.00
Moderate Drought 17.95 7.28 0.45 5.00
Incipient Drought 7.05 11.06 0.45 10.00
No Drought 43.27 77.70 94.16 80.00
1DM=U.S. Drought Monitor
2KBDI=Keetch Byram Drought Index
3PDSI =Palmer Drought Severity Index
4SPI=Standard Precipitation Index (1-, 3-, 6-, 9-, 12-month)
5CMI=Crop Moisture Index
Figures 3.1 a-e graphically display the frequency distribution based on the defined
ranges for each indicator in the S.C. Drought Response Act regulations. The graphs
Drought Level
PDSI3 SPI1
4 SPI3
4 SPI6
4 SPI9
4 SPI12
4 CMI
5
660 Monthly Values
%
2,860
Weekly
Values
%
Extreme Drought 0.76 1.21 1.06 1.67 1.52 0.76 0.00
Severe Drought 5.15 3.64 3.18 2.27 3.48 4.70 0.17
Moderate Drought 19.24 7.58 9.85 10.76 9.39 8.33 2.06
Incipient Drought 16.97 37.42 36.67 35.45 33.03 33.64 11.82
Normal 18.48 0.00 0.00 0.00 0.00 0.00 0.00
Incipient Wet 20.15 36.67 35.00 35.76 39.09 39.24 41.67
Moderate Wet 16.36 9.24 8.94 10.00 9.70 9.39 29.90
Severe Wet 2.73 3.18 4.85 3.94 3.03 3.33 8.67
Extreme Wet 0.15 1.06 0.45 0.15 0.76 0.61 5.70

35
show the variable distributions. For SPI, CMI and streamflow, the variation is in part due
to the range of drought categories specified in the regulations. However, for variables
such as the PDSI, literature demonstrates that the time series distribution is skewed
(Wells et al., 2004). The SPI time-series indicators should be normally distributed
because of calculation.
Figure 3.1a shows the frequency distribution of the PDSI. The distribution of the
data ranges from 16 percent to 20 percent for moderate droughts, incipient drought,
normal, incipient wet periods, and moderate wet periods. Severe and extreme drought
and wet periods occur less than 5 percent. Figure 3.1b provides the frequency
distribution of the 1-month SPI, 3-month SPI, 6-month SPI, 9-month SPI, and 12-month
SPI. The SPI indicators are relatively consistent for all drought levels, with the largest
difference, 4.39 percent, between SPI-1month and SPI-12 month during incipient
droughts. Since the SC Drought Response Act designates that incipient drought begins at
0.00 for the SPI and CMI, there is no range for normal conditions assuming the same
range of values is implied for wet periods. Figure 3.1c displays the Crop Moisture Index
frequency distribution, which has the second lowest occurrence of drought, 14.06
percent, of all indicators. This is due to the index computation, which is focused on
detecting drought severity during the growing season months and automatically returns to
normal conditions during the winter months with or without rainfall. Streamflow has the
lowest occurrence of all drought levels combined, 5.84 percent, due to the specified
ranges in the S.C. Drought Response Act regulations (Figure 3.1d). Figure 3.1d also
displays the frequency distribution of the KBDI and groundwater. The occurrence of all
levels of drought based on groundwater is 20 percent. The KBDI indicates drought 22.3

36
percent of the time. The DM frequency distribution (Figure 3.1e) shows some level of
drought, 56.73 percent, with the highest occurrence of extreme and severe droughts,
13.78 percent and 17.95 percent, respectively.
Figures 3.1 Percent frequencies for drought and wet severity levels (a) Palmer
Drought Severity Index, (b) Standardized Precipitation Index (1-, 3-,
6-, 9-, 12-month), (c) Crop Moisture Index, (d) streamflow,
groundwater, Keetch Byram Drought Index, (e) U.S. Drought
Monitor.
(a) Palmer Drought Severity Index
0
5
10
15
20
25
30
35
40
45
Extreme
Drought
Severe
Drought
Moderate
Drought
Incipient
Drought
Normal Incipient
Wet
Moderate
Wet
Severe
Wet
Extreme
Wet
Drought Severity Levels
Fre
qu
en
cy (
%)

37
(b) Standardized Precipitation Index (1-, 3-, 6-, 9-, 12-month)
(c) Crop Moisture Index
0
5
10
15
20
25
30
35
40
45
Extreme
Drought
Severe
Drought
Moderate
Drought
Incipient
Drought
Normal Incipient
Wet
Moderate
Wet
Severe
Wet
Extreme
Wet
Drought Severity Levels
Fre
qu
en
cy (
%)
SPI1 SPI3 SPI6 SPI9 SPI12
0
5
10
15
20
25
30
35
40
45
Extreme
Drought
Severe
Drought
Moderate
Drought
Incipient
Drought
Normal Incipient
Wet
Moderate
Wet
Severe
Wet
Extreme
Wet
Drought Severity Levels
Fre
qu
en
cy (
%)

38
(d) Streamflow, Groundwater (secondary y-axis),
Keetch Byram Drought Index (secondary y-axis)
(e) U.S. Drought Monitor
The comparison of the drought level occurrence data for Charleston (Table 3.3)
and Florence (Table 3.4) illustrates that the county indicator differences were not unique
to Oconee County. For example, the DM has the largest percent frequency of extreme
0
5
10
15
20
25
30
35
40
45
Extreme
Drought
Severe
Drought
Moderate Incipient No
DroughtDrought Severity Levels
Fre
qu
en
cy (
%)
0
10
20
30
40
50
60
70
80
90
100
Fre
qu
en
cy (
%)
Streamflow Groundwater KBDI
0
5
10
15
20
25
30
35
40
45
Extreme
Drought
Severe
Drought
Moderate
Drought
Incipient
Drought
No Drought
Drought Severity Levels
Fre
qu
en
cy (
%)
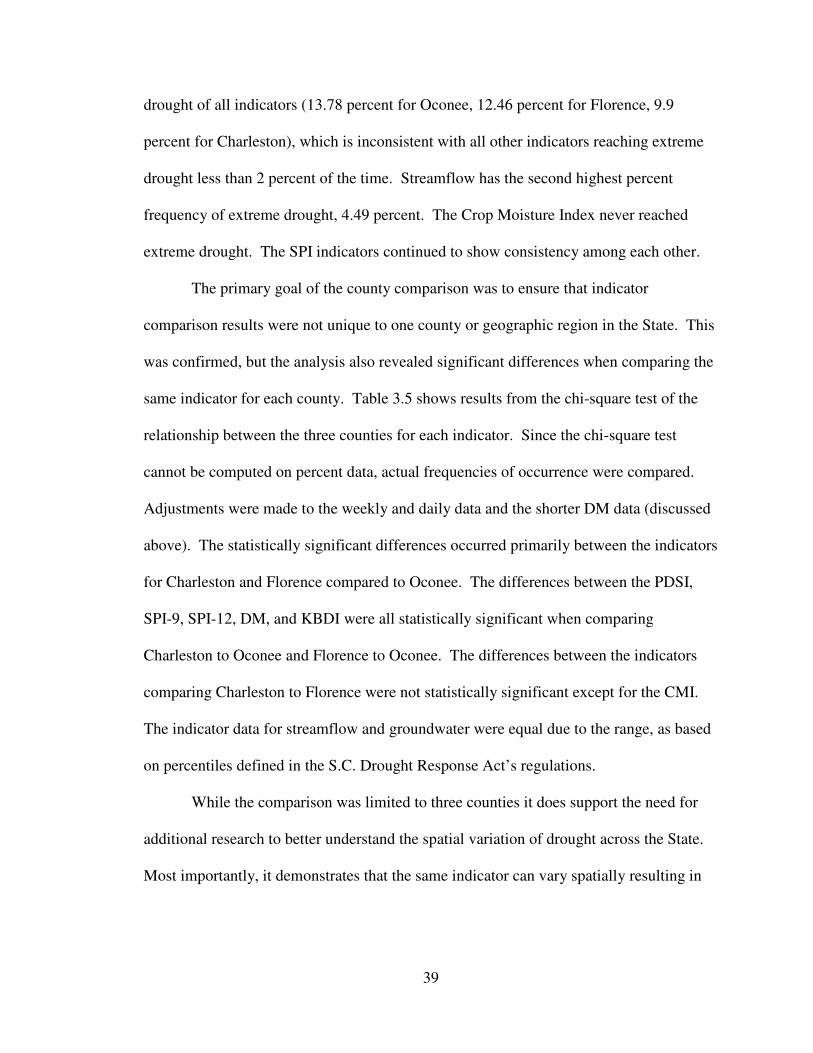
39
drought of all indicators (13.78 percent for Oconee, 12.46 percent for Florence, 9.9
percent for Charleston), which is inconsistent with all other indicators reaching extreme
drought less than 2 percent of the time. Streamflow has the second highest percent
frequency of extreme drought, 4.49 percent. The Crop Moisture Index never reached
extreme drought. The SPI indicators continued to show consistency among each other.
The primary goal of the county comparison was to ensure that indicator
comparison results were not unique to one county or geographic region in the State. This
was confirmed, but the analysis also revealed significant differences when comparing the
same indicator for each county. Table 3.5 shows results from the chi-square test of the
relationship between the three counties for each indicator. Since the chi-square test
cannot be computed on percent data, actual frequencies of occurrence were compared.
Adjustments were made to the weekly and daily data and the shorter DM data (discussed
above). The statistically significant differences occurred primarily between the indicators
for Charleston and Florence compared to Oconee. The differences between the PDSI,
SPI-9, SPI-12, DM, and KBDI were all statistically significant when comparing
Charleston to Oconee and Florence to Oconee. The differences between the indicators
comparing Charleston to Florence were not statistically significant except for the CMI.
The indicator data for streamflow and groundwater were equal due to the range, as based
on percentiles defined in the S.C. Drought Response Act’s regulations.
While the comparison was limited to three counties it does support the need for
additional research to better understand the spatial variation of drought across the State.
Most importantly, it demonstrates that the same indicator can vary spatially resulting in

40
additional challenges for decision-makers. An indicator may provide different detection
of drought for different regions of the State.
Table 3.3 Percent frequencies for state drought indicators in Charleston
County, SC.
Drought Level
DM1 KBDI
2 Streamflow Groundwater
313 Weekly
Values
20,089 Daily
Values
Based on predefined
percentiles
Extreme Drought 9.90 0.00 4.49 2.00
Severe Drought 7.35 1.95 0.45 3.00
Moderate Drought 8.95 7.78 0.45 5.00
Incipient Drought 24.92 16.70 0.45 10.00
No Drought 48.88 73.58 94.16 80.00
1DM=U.S. Drought Monitor
2KBDI=Keetch Byram Drought Index
3PDSI =Palmer Drought Severity Index
4SPI=Standard Precipitation Index (1-, 3-, 6-, 9-, 12-month)
5CMI=Crop Moisture Index
Drought Level
PDSI3 SPI1
4 SPI3
4 SPI6
4 SPI9
4 SPI12
4 CMI
5
660 Monthly Values 2,860
Weekly
Values
Extreme Drought 0.45 0.76 0.91 0.76 1.52 1.36 0.00
Severe Drought 3.48 2.88 3.48 3.33 3.18 3.18 0.14
Moderate Drought 22.12 9.09 8.64 8.03 5.61 5.91 2.48
Incipient Drought 22.73 37.73 36.67 40.91 43.44 43.33 19.69
Normal 16.52 0.00 0.00 0.00 0.00 0.00 0.00
Incipient Wet 16.21 36.97 38.18 35.30 33.64 33.33 52.41
Moderate Wet 13.94 7.73 7.88 7.12 8.79 7.58 19.41
Severe Wet 3.33 3.94 3.48 3.79 3.48 5.15 3.88
Extreme Wet 1.21 0.91 0.76 0.76 0.45 0.15 1.99

41
Table 3.4 Percent frequencies for state drought indicators in
Florence County, SC.
Drought Level
USDM1 KBDI
2 Streamflow Groundwater
313 Weekly
Values
20,089 Daily
Values
Based on predefined
percentiles
Extreme Drought 12.46 0.00 4.49 2.00
Severe Drought 4.49 3.39 0.45 3.00
Moderate Drought 9.57 8.62 0.45 5.00
Incipient Drought 28.75 17.11 0.45 10.00
No Drought 44.73 70.87 94.16 80.00
1DM=U.S. Drought Monitor
2KBDI=Keetch Byram Drought Index
3PDSI =Palmer Drought Severity Index
4SPI=Standard Precipitation Index (1-, 3-, 6-, 9-, 12-month)
5CMI=Crop Moisture Index
Drought Level
PDSI3 SPI1
4 SPI3
4 SPI6
4 SPI9
4 SPI12
4 CMI
5
660 Monthly Values 2,860
Weekly
Values
Extreme Drought 1.06 1.06 0.76 0.80 1.06 0.76 0.00
Severe Drought 1.97 2.42 3.33 3.20 3.18 2.42 0.35
Moderate Drought 18.48 10.00 9.70 8.15 5.76 7.33 2.52
Incipient Drought 23.03 36.97 37.33 40.70 41.95 41.61 18.71
Normal 16.06 0.00 0.00 0.00 0.00 0.00 0.00
Incipient Wet 18.18 35.91 34.39 33.23 34.97 34.99 56.40
Moderate Wet 17.88 9.39 11.21 9.40 7.52 7.62 18.25
Severe Wet 2.12 3.18 1.92 3.88 4.60 4.19 2.73
Extreme Wet 1.21 1.06 1.36 0.61 0.45 0.61 1.05

42
Table 3.5 Chi-square statistic and (p-values) for the indicator frequency
distribution (extreme/severe, moderate, incipient, no drought)
comparison between counties (p ≤ 0.05).

43
A chi-square test was used to estimate the independence of the drought indicators
categorized by drought occurrence (extreme/severe, moderate, incipient, and normal).
Table 3.6 displays the chi-square statistic and p-value for the comparison between
indicators for Oconee County. The null hypothesis was rejected for most of the indicator
comparisons, which indicates statistically significant differences exist between indicators.
This test is interpreted to mean the frequency of drought based on the four levels
(extreme/severe, moderate, incipient, no drought) depends on the indicator. The
difference between the SPI-1, SPI-3, SPI-6, SPI-9, and SPI-12 data were not statistically
different (p>0.05) as expected by the indicator computation (McKee, 1993). The
difference between the KBDI and groundwater indices was not statistically significant
(chi-square statistic 4.28, p=0.243); however, there is no relationship in the indicator
computation. The KBDI was developed to detect forest-fire potential. Groundwater is a
trigger used to detect longer-term hydrologic droughts.

44
Statistically Significant
Indicator PDSI SPI1 SPI3 SPI6 SPI9 SPI12
PDSI 88.60 (0.00) 74.16 (0.00) 65.41 (0.00) 58.58 (0.00) 66.51 (0.00)
SPI 1 88.60 (0.00) 2.32 (0.57) 4.63 (0.20) 3.49 (0.32) 2.18 (0.54)
SPI3 74.16 (0.00) 2.32 (0.57) 0.50 (0.92) 2.45 (0.48) 3.42 (0.33)
SPI6 65.41 (0.00) 4.63 (0.20) 0.50 (0.92) 2.48 (0.498) 4.44 (0.22)
SPI9 58.58 (0.00) 3.49 (0.32) 2.45 (0.48) 2.48 (0.48) 0.59 (0.90)
SPI12 66.51 (0.00) 2.18 (0.54) 3.42 (0.33) 4.44 (0.228) 0.59 (0.90)
CMI 168.81(0.00) 199.22 (0.00) 207.77 (0.00) 202.59 (0.00) 179.60 (0.00) 179.54 (0.00)
KBDI 65.66(0.00) 134.4 (0.00) 135.48 (0.00) 129.09 (0.00) 106.91 (0.00) 109.38 (0.00)
Streamflow 279.04(0.00) 368.3 (0.00) 328.7 (0.00) 378.22 (0.00) 340.27 (0.00) 337.47 (0.00)
Groundwater 91.04 (0.00) 153.34 (0.00) 159.74 (0.00) 155.00 (0.00) 127.65 (0.00) 127.57 (0.00)
USDM 158.05 (0.00) 298.4 (0.00) 289.09 (0.00) 283.03 (0.00) 263.09 (0.00) 266.34 (0.00)
Indicator CMI KBDI Streamflow Groundwater USDM
PDSI 168.81(0.00) 65.66(0.00) 279.04(0.00) 91.04 (0.00) 158.05 (0.00)
SPI 1 199.22 (0.00) 134.4 (0.00) 368.3 (0.00) 153.34 (0.00) 298.40 (0.00)
SPI3 207.77 (0.00) 135.48 (0.00) 328.7 (0.00) 159.74 (0.00) 289.09 (0.00)
SPI6 202.59 (0.00) 129.09 (0.00) 378.22 (0.00) 155.00 (0.00) 283.03 (0.00)
SPI9 179.60 (0.00) 106.91 (0.00) 340.27 (0.00) 127.65 (0.00) 263.09 (0.00)
SPI12 179.54 (0.00) 109.38 (0.00) 337.47 (0.00) 127.57 (0.00) 266.34 (0.00)
CMI 44.66 (0.00) 109.13 (0.00) 40.19 (0.00) 390.17 (0.00)
KBDI 44.66 (0.00) 115.29 (0.00) 4.18 (0.24) 243.77 (0.00)
Streamflow 109.13 (0.00) 115.29 (0.00) 90.00 (0.00) 401.67 (0.00)
Groundwater 40.19 (0.00) 4.18 (0.24) 90.00 (0.00) 252.72 (0.00)
USDM 390.17 (0.00) 243.77 (0.00) 401.67 (0.00) 252.72 (0.00)
Table 3.6 Chi-square statistic and (p-values) for the frequency distribution
(extreme/severe, moderate, incipient, no drought) comparison
between indicators for Oconee County (p≤0.05).
The inconsistencies among many of the indicators can primarily be attributed to
the inconsistencies in the drought level ranges defined by the S.C. Drought Response
Act’s regulations. Based on the ranges defined for the SPI and CMI, normal conditions
never occur because incipient conditions begin at 0 to –0.99 for the SPI and 0 to –1.49 for
the CMI. This is different and inconsistent with ranges of drought and normal periods
defined by the Climate Prediction Center, the National Climatic Data Center, and the

45
National Drought Mitigation Center. Since there is no documentation explaining the
selection of ranges defined in the S.C. Drought Response Act’s regulations, it may be
inferred that normal conditions or no drought conditions begin at zero through the
positive values of the indicators. For the PDSI, normal or no drought conditions begin at
–0.5 and higher. The normal range for the other indicators (streamflow, DM, KBDI, and
groundwater) can not be compared to the PDSI, SPI, and CMI. This is because there is
no range for wet conditions so all other non-drought periods are defined as no drought.
The frequency range for all non-drought events for the KBDI and groundwater is
consistent with each other with normal conditions occurring 77.71% to 80% respectively.
Normal conditions based on streamflow occur the majority of the time or 94.16%.
The consistencies that do occur between certain indicators, such as the KBDI and
groundwater, are not based on similarities in calculation nor should these indicators be
used interchangeably for detection of drought. The KBDI was developed specifically for
fire potential assessment, assuming eight inches of precipitation means saturated fuel
moisture conditions. Since groundwater and streamflow are based on percentiles,
comparisons could be made if the percentile ranges were equal or similar. Streamflow is
considered to be in drought six percent of the time compared to 20 percent based on
groundwater.
The results clearly demonstrate the inconsistency in drought frequency using the
ranges defined in the S.C. Drought Response Act’s regulations. The S.C Drought
Response Committee should redefine the ranges for each indicator or use indicator

46
percentiles. A possible solution for using multiple and often statistically inconsistent
indicators is to transform all indicators to percentiles (Steinemann et al., 2005). This will
be examined in more detail in Chapter 4.

47
CHAPTER 4 EVALUATION OF LOCAL DROUGHT INDICATORS
4.1 Local Drought Indicator Case Studies: Data and Methodology
The evolution and implementation of the drought plans or Low Inflow Protocols
(LIPs) in the Yadkin-Pee Dee and Catawba-Wateree FERC licenses demonstrated the
need for additional research on drought indicator validation. The LIPs were new to the
relicensing process for the two basins and the identification of drought indicators and
trigger points presented challenges to the licensee (Duke Energy, Alcoa-Yadkin, and
Progress Energy) and the stakeholders. As stated in both LIPs, the success of the LIP
depends on the diagnostic accuracy of the trigger points and the effectiveness with which
the licensee and the water users work together to implement their required actions
(Catawba-Wateree Project, Comprehensive Relicensing Agreement, October 2006;
Yadkin Hydroelectric Project, February 2007). The 2007-2008 severe drought brought to
the forefront additional challenges in determining drought indicators that effectively
detect drought onset and recovery. The second objective of this research involves
specific case study evaluations of local drought indicators used by Duke Energy and
Alcoa-Yadkin/Progress Energy in their LIPs (Table 4.11, Table 4.12). The research
identifies scientific and operational inconsistencies between the LIP indicators.

48
Table 4.11 Local-level drought indicators for Duke Energy.
System
Name Source Stage 01 Stage 1
1 Stage 2
1 Stage 3
1 Stage 4
1
Duke
Energy
11 Catawba-
Wateree
Lakes
Storage index (SI) based on combined storage in all lakes.
Ratio of Remaining Useable Storage to Total Usable Storage
(TSI).
90%<SI
<100% TSI
75%TSI<SI
<=90% TSI
57% TSI <
SI<=75%
TSI
42% TSI<
SI<=57%TSI
SI<=42%
TSI
US Drought Monitor Three-Month Numeric Average
>=0 >=1 >=2 >=3 =4
Streamflow 6-month averages expressed as percentages of
long-term average.2
<= 85% <= 78% <= 65% <= 55% <= 40%
Wells Groundwater Recovery Levels1
Langtree
Peninsula
18.21 22.21 23.61 24.91 Not
Required
b/c Only
Used for
Recovery
Linville 2.04 2.11 2.19 2.74
Glen Alpine 7.69 8.32 9.03 10.01
1 Stage 0 is triggered when any two of the three indicators are reached. Stages 1- 4 are
triggered when storage index reaches trigger and one of the other two are reached.
Recovery from each stage occurs when all indicators have returned to a lower level.
Specified groundwater levels must also return to lower level before a stage declaration
can be lowered.
2 Streamflow gages: South Fork Catawba River at Lowell; Catawba River near Pleasant
Gardens; Johns River at Arneys Store; and Rocky Creek at Great Falls.
The mainstem river of the Catawba-Wateree Basin is regulated by a series of
eleven hydroelectric dams (Figure 4.11). The reservoirs formed by these dams are
commonly referred to as the Catawba-Wateree chain lakes. All dams are owned by Duke
Energy and were created to generate electricity. Duke Energy’s FERC license to operate
the dams on the Catawba River expires in 2008. The original license was issued by the
FERC in 1958 as Duke Energy was building the eleventh and largest reservoir on the

49
Catawba River, Lake Norman. While the new license officially goes into effect in 2008,
Duke and the stakeholders have voluntarily operated under the new LIP since 2006 in
response to a significant drought.
Figure 4.11 Catawba-Wateree Basin (Source: Duke Energy)
Alcoa-Yadkin (Alcoa) is relicensing its four hydroelectric stations on the Yadkin-
Pee Dee River (Figure 4.12). The current license was granted in 1958 and expires in
2008. The four reservoirs are High Rock, Tuckertown, Narrows (Badin Lake), and Falls.
Progress Energy Carolinas, Inc., also known as Carolina Power & Light, a subsidiary of
Progress Energy, owns and operates the Yadkin-Pee Dee River Project, located on the
Yadkin-Pee Dee River in North Carolina with dams at Tillery and Blewett Falls (Figure
4.12). Alcoa/ Progress Energy also have voluntarily followed guidance from the new LIP
since 2006 in response to the drought.

50
Figure 4.12 Yadkin-Pee Dee Basin (Source: S.C. Department of Natural Resources)
While the indicators and triggers for Duke Energy, Alcoa, and Progress Energy’s
LIPs are included in their new license, the LIP provides for revisions that must occur no
less than every five years to ensure continuous improvement of the LIP and its
implementation. Specifically mentioned is the substitution of a regional drought monitor
for the U.S. Drought Monitor, which requires research focused on testing and improving
drought indicators.
The indicators currently listed in the LIPs (Table 4.11, Table 4.12) are reservoir
storage index, rolling streamflow averages (6-month averages for Duke, 3-month
averages for Alcoa and Progress Energy), and the U.S. Drought Monitor. While both
▲ Alcoa Yadkin
▲ Progress Energy

51
LIPs use a lake storage indicator, streamflow, and the U.S. Drought Monitor they differ
in their computations and triggers.
Table 4.12 Local-level drought indicators for Alcoa Yadkin and Progress Energy.
System
Name Source Stage 01 Stage 1
1 Stage 2
1 Stage 3
1 Stage 4
1
Alcoa/
Progress
Energy
6
Yadkin-
Pee Dee
Lakes
Normal Minimum Elevation (NME) is the elevation of a
reservoir (ft) that defines the bottom of the reservoir’s Normal
Operating Range
<NME
minus 0.5ft
< NME
minus 1 ft.
< NME
minus 2 ft.
< NME
minus 3 ft.
< ½ of
(NME
minus
Critical
Reservoir
Water
Elevation)
Or
<NME and
either of the
other two
indicators
have been
reached
US Drought Monitor Three-Month Numeric Average
>=0 >=1 >=2 >=3 =4
Stream Gage Three-Month Rolling Average as a percent of the
Historical Average 2
< 48% < 41% < 35% < 30% < 30%
1 Stage 0 is triggered when High Rock Reservoir water elevation is below the NME
minus 0.5 ft or High Rock Reservoir water elevation is below its NME and either of the
two other indicators have reached Stage 0. Stage 1 – Stage 4 are triggered when High
Rock Reservoir elevation reaches the trigger and one of the other two are reached.
2 Streamflow gages: Yadkin River at Yadkin College, South Yadkin River near
Mocksville, Abbotts Creek at Lexington, Rocky River near Norwood.
Duke’s storage indicator is based on a ratio of the remaining useable storage to
the total useable storage. These indicators are based on the project’s total volume of
water for all lakes in the system (Catawba-Wateree Project, Comprehensive Relicensing

52
Agreement, 2006). The streamflow indicator is computed by taking the sum of the actual
rolling six-month average streamflow at four designated USGS gages as a percentage of
the period of record rolling six-month average streamflows for that period. The period of
record began in 1985 when all four gages were operational. The U.S. Drought Monitor
designation ranges from D0 to D4 as of the last day of a month. The basin is assigned a
numeric value for that month equal to the highest U.S. Drought Monitor designation (e.g.
D0=0, D1=1, D2=2, D3=3 and D4=4) for any part of the Catawba-Wateree River Basin
draining to Lake Wateree. Months with no drought designation are assigned a numeric
value of negative one (-1). A rolling average of the numeric values of the current month
and previous two months is calculated. Three groundwater wells were selected for the
recovery phase. Two of the wells were from the USGS network and one from the North
Carolina Department of Natural Resources
(http://www.ncwater.org/Data_and_Modeling/Ground_Water_Databases/). The specific
stage levels for each well are defined in the LIP. According to the LIP, Stage 3 equals
the period of low record water level for each well, Stage 2 is the 10th
percentile, Stage 1
is the 25th
percentile, and Stage 0 is the 50th
percentile.
The Alcoa/Progress Energy storage indicator is based on the normal minimum
elevation (NME) for High Rock Lake, which is the elevation of the reservoir (ft.) that
defines the bottom of the reservoir’s normal operating range. In contrast to Duke, the
Alcoa/Progress system has six lakes, but only High Rock elevation is used for the storage
indicator. The streamflow LIP indicator uses daily flow for four designated USGS
stream gages to calculate a monthly average flow for the period of record 1974 through
2003. The Abbotts Creek gage began in 1988; therefore, the historical average for this
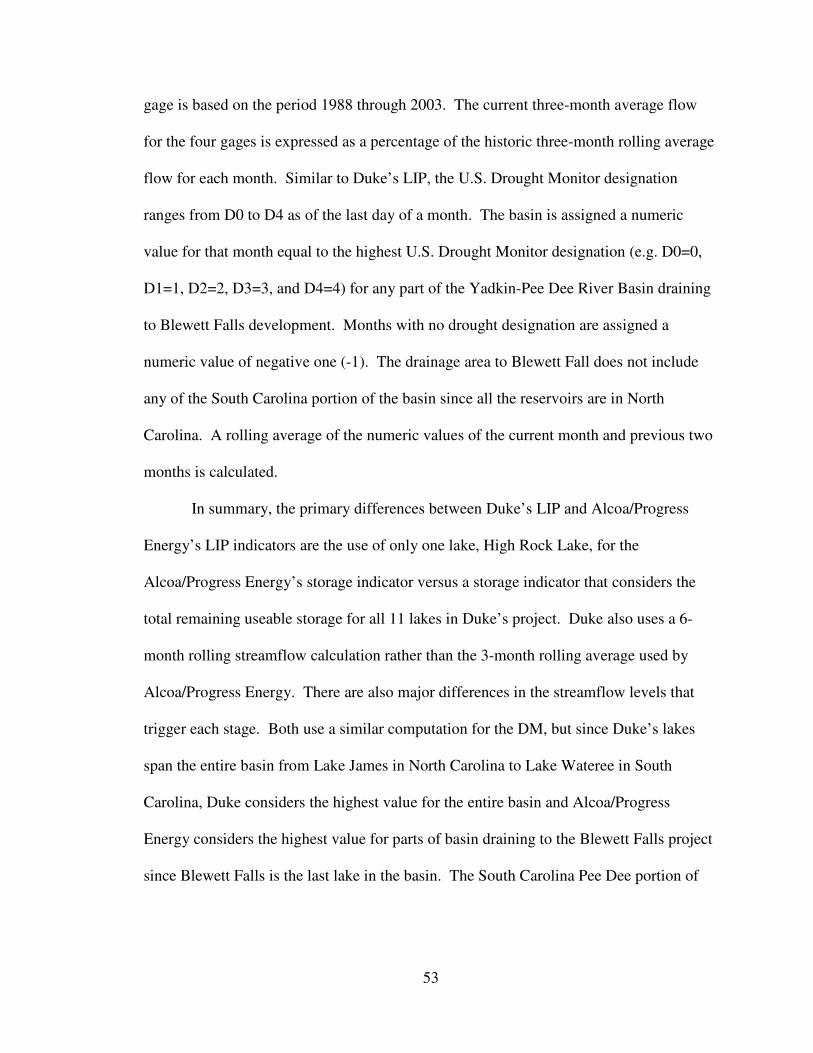
53
gage is based on the period 1988 through 2003. The current three-month average flow
for the four gages is expressed as a percentage of the historic three-month rolling average
flow for each month. Similar to Duke’s LIP, the U.S. Drought Monitor designation
ranges from D0 to D4 as of the last day of a month. The basin is assigned a numeric
value for that month equal to the highest U.S. Drought Monitor designation (e.g. D0=0,
D1=1, D2=2, D3=3, and D4=4) for any part of the Yadkin-Pee Dee River Basin draining
to Blewett Falls development. Months with no drought designation are assigned a
numeric value of negative one (-1). The drainage area to Blewett Fall does not include
any of the South Carolina portion of the basin since all the reservoirs are in North
Carolina. A rolling average of the numeric values of the current month and previous two
months is calculated.
In summary, the primary differences between Duke’s LIP and Alcoa/Progress
Energy’s LIP indicators are the use of only one lake, High Rock Lake, for the
Alcoa/Progress Energy’s storage indicator versus a storage indicator that considers the
total remaining useable storage for all 11 lakes in Duke’s project. Duke also uses a 6-
month rolling streamflow calculation rather than the 3-month rolling average used by
Alcoa/Progress Energy. There are also major differences in the streamflow levels that
trigger each stage. Both use a similar computation for the DM, but since Duke’s lakes
span the entire basin from Lake James in North Carolina to Lake Wateree in South
Carolina, Duke considers the highest value for the entire basin and Alcoa/Progress
Energy considers the highest value for parts of basin draining to the Blewett Falls project
since Blewett Falls is the last lake in the basin. The South Carolina Pee Dee portion of

54
the basin contains no lakes. Duke also uses groundwater indicators in the recovery phase
of the LIP and Alcoa/Progress does not.
Differences exist in how each stage is reached between the LIPs. Duke’s Stage 0
is declared when any two of the three indicators are reached. However, Stages 1- 4 are
triggered when the storage index reaches a trigger point and one of the other two
indicators are reached. Duke’s recovery from each stage occurs when all indicators have
returned to a lower level. Specified groundwater levels must also return to a lesser
drought level before a stage declaration can be lowered. In Alcoa/Progress Energy’s LIP,
Stage 0 is declared if the High Rock reservoir water elevation is below the normal
minimum elevation minus 0.5 ft, or if the High Rock Reservoir water elevation is below
its NME and either the DM three-month numeric average or the three-month rolling
streamflow average has reached the Stage 0 trigger. Similar to Duke’s LIP,
Alcoa/Progress Energy’s Stages 1- 4 are triggered when the storage index (High Rock
Elevation ) reaches the trigger and one of the other two are reached. The recovery
triggers between Duke’s LIP and Alcoa/Progress Energy also differ. Duke’s designations
cannot recover without a lowered stage by all three indicators plus a recovery by the
groundwater gages. The Alcoa/Progress Energy recovery from the LIP is triggered by
any of the three conditions.
Condition 1: All three triggers associated with a lower numbered LIP Stage are
met.
Condition 2: High Rock Reservoir water elevations return to at or above the NME
plus 2.5 ft.

55
Condition 3: High Rock Reservoir water elevations return to at or above the NME
for two consecutive weeks.
According to Marshall Olson, Environmental and Natural Resources Manager, Alcoa
Power Generating, Inc. (APGI), “When APGI considered how to best recover from the
LIP they needed to consider a range of possible inflow conditions from a very rapid to a
very slow recovery. Historically, the recovery from a drought is often a high
precipitation event that fills High Rock Reservoir quickly. What APGI wanted to avoid
in a recovery is to be in a drought stage that limits releases and then, within a short period
of time, have to spill to avoid overtopping the dam. The recovery Condition 1 is for a
slow recovery and may proceed one or more drought stages at a time. Recovery
Conditions 2 and 3 will apply during a rapid recovery and the LIP is discontinued so that
APGI can manage the higher inflows to avoid spilling as much a possible.”
Questions have been raised as to the effectiveness of the proposed indicators in
both LIPs due to conditions experienced in the most recent drought that began in 2007
and was ongoing in spring 2008. The original concerns expressed by resource agencies
as the indicators were being developed in 2005-2006 focused on the use of the U.S.
Drought Monitor. The concerns were that the DM was not intended for smaller scale
drought detection at the basin or sub-basin level. Other concerns involved the
subjectivity of the DM introduced by the different DM authors and local input into the
weekly indicator. The 2007-2008 drought raised additional questions about the
streamflow indicator, especially for the Catawba-Wateree Basin. Some resource agencies
and water systems have expressed concern that the 6-month streamflow covers too long

56
of an historical period. Duke Energy also lists groundwater level trigger points that must
be attained before each recovery stage is reached. Three wells are currently listed with an
adequate period of record. Additional concerns exist that groundwater should not be
included as an indicator. Groundwater is not listed as an indicator in Alcoa/Progress
Energy’s LIP.
In order to evaluate the LIP indicators (Table 4.11, Table 4.12) frequency
distributions were computed and analyzed. Duke Energy and Alcoa/Progress Energy
make the stage declaration on the first day of each month using indicator data from the
last day of the previous month or months in the case of streamflow and the DM. For
example, the DM value for the end of March 2008 is averaged with the January and
February 2008 DM to result in a three-month average value. This value ending in March
2008 is then considered for the April 1, 2008 declaration. For historical analysis, it is
important to understand that the data ended in March, but the official declaration is
entered for the next month’s stage. The period analyzed for each indicator was:
• Duke’s Storage Indicator: November 1985-April 2008 for 270 monthly values and
April 2000- April 2008 for 97 values,
• Duke’s Streamflow 6-Month Rolling Average: November 1985-April 2008 for
270 monthly values and April 2000-April 2008 for 97 values,
• Duke’s U.S. Drought Monitor Three-Month Numeric Average: April 2000- April
2008 for 97 values,
• Duke’s Groundwater gages: April 2001-April 2008 for 85 values,
• Alcoa/Progress Energy High Rock Elevation Storage Indicator: December 1996-
April 2008 for 137 monthly values and April 2000-April 2008 for 97 values,

57
• Alcoa/Progress Energy Streamflow 3-Month Rolling Average: December 1996-
April 2008 for 137 monthly values and April 2000-April 2008 for 97 values, and
• Alcoa/Progress Energy U.S. Drought Monitor Three-Month Numeric Average:
April 2000-April 2008 for 97 values.
Data availability for the DM limited one study period from April 2000 to April
2008. Storage and streamflow were evaluated for longer periods based on available data
for each basin. The frequency of occurrence within each threshold trigger level is
analyzed to identify scientific inconsistencies among the indicators within each LIP,
between the LIPs for both basins and between the State-level drought indicators
discussed in Chapter 3. A chi-square statistical test was used to evaluate the statistical
significance of the differences.
4.2 Duke Energy’s Low Inflow Protocol Indicator Comparison
The percent frequency of drought occurrence for Duke’s LIP indicators is
displayed in Table 4.21. The percent frequency of occurrence for the storage indicator
and streamflow was computed for the extended period from November 1985 – April
2008 and for the most recent period April 2000 – April 2008 (the period of record for the
DM). Certain caveats should be associated with the data from April 2000 to July 2006.
The LIP did not exist during that period, thus the releases and management of the lakes
did not follow the LIP guidelines. Water conservation measures and downstream release
requirements were not implemented, so the storage levels may be different than if the LIP
were being followed.
Based on the storage indicator for the two time periods no major difference was
found between the percent frequency of drought. The greatest difference was

58
approximately four percent for stage 2 and stage 0. The storage in the lakes is highly
dependent on Duke’s releases from the hydropower dams. Duke hydropower operators
confirmed that similar management strategies from 1985 until the new LIP was initiated
in August 2006 explain the similarities in the storage drought stage frequency of
occurrence between the two periods 1985 to 2008 and 2000 to 2008. Steamflow had
larger differences in the percent frequency of occurrence between the two time periods
with stage 4 occuring almost ten percent more often during the period April 2000 – April
2008. Stage 3, based on streamflow, occurred six percent more often during the recent
period with normal conditions occurring only 40.21 percent versus 56.30 percent during
November 1985 to April 2008. The increased percent frequency of Stage 3 and 4 and the
decreased occurrence of normal periods is consistent given the extended drought
conditions experienced in the basin over the past decade.
A comparison among the indicators for the period April 2000 – April 2008 shows
inconsistencies in the percent frequency of occurrence between each indicator. The
storage indicator never reached Stage 4 and only one percent of the time reached Stage 3.
Whereas, streamflow reached Stage 4, 15.46 percent, and Stage 3, 19.58 percent. The
DM reached Stage 4, 5.15 percent, and Stage 3, 14.43 percent of the time. The difference
in percent occurrence between the indicators for Stage 1 is less. The 4.12 percent
occurrence of Stage 0 drought by streamflow is inconsistent with the other indicators and
can, in part, be attributed to the smaller range of possible values. Streamflow reaches a
Stage 0 drought when the average flow is between 78.1 percent and 85 percent whereas
Stage 1 is reached when the average flow is between 65.1 percent and 78 percent.
Normal conditions occur 55 percent of the time based on the storage indicator, 40 percent

59
based on streamflow and 32 percent based on the DM. The fewer occurrences of drought
in general, and especially the lower occurrences of the higher drought levels by the
storage indicator, is consistent with Duke’s planning. According to their LIP, after Stage
0 the storage indicator must reach a higher level before the official stage is upgraded.
Streamflow and the DM cannot trigger an upgrade beyond Stage 0 without confirmation
by the storage indicator that the level of drought has increased. The higher frequencies of
streamflow and DM, however, do impact the stages during recovery. This is examined
more closely in Figures 4.21- 4.25, which display the indicator stages by month from
April 2000 to April 2008.
Table 4.21 Percent frequency of drought for Duke LIP indicators.
Drought
Level
Storage Storage Streamflow Streamflow DM
11/85-4/08 4/00-4/08 11/85-4/08 4/00-4/08 4/00-4/08
Stage 4 0.00 0.00 5.90 15.46 5.15
Stage 3 0.37 1.03 14.39 19.58 14.43
Stage 2 3.70 7.21 8.86 10.31 16.49
Stage 1 15.19 15.46 9.23 10.31 15.46
Stage 0 25.56 21.60 5.54 4.12 16.49
No Drought 55.19 54.63 56.09 40.12 31.96
Figures 4.21 to Figure 4.25 show the stages by month and give the overall LIP
stage recreated for the dates April 2000 to July 2006. The overall Stage value (labeled
Stage) was computed based on indicator criteria listed in the LIP. For example, if the LIP
had been in existence in November 2000, the storage indicator was at Stage 1, streamflow
at Stage 3,and the DM at Stage 2. Since the LIP is primarily driven by the storage
indicator going into drought the official stage would have been Stage 1. Starting in
August 2006, Duke began voluntarily following the LIP, so actual LIP values were used
for this period, August 2006-April 2008. For the period April 2000 to July 2006, water

60
conservation measures and downstream release requirements based on the new LIP were
not implemented; therefore, certain stage declarations based on storage may have been
different than if the LIP were being followed.
Figure 4.21 shows the monthly indicator stages for April 2000 to December 2001.
Streamflow and the DM were in some level of drought for all months. Groundwater
values were not available until April 2001, but from April 2001 to December 2001
groundwater was also in some stage of drought. The storage indicator was in drought for
all but six months. The official LIP stage would have been in Stage 1 starting in August
2000 through October 2001 even though in February 2001 the storage indicator returned
to normal and stayed at normal until May 2001. While storage levels returned to normal,
the official LIP remained in Stage 1 because streamflow, DM and groundwater had not
returned to a lower level.
Figure 4.21 Duke’s LIP indicators April 2000 – December 2001.
-2
-1
0
1
2
3
4
5
Apr-
00
May-0
0
Jun-0
0
Jul-00
Aug-0
0
Sep-0
0
Oct-
00
Nov-0
0
Dec-0
0
Jan-0
1
Feb-0
1
Mar-
01
Apr-
01
May-0
1
Jun-0
1
Jul-01
Aug-0
1
Sep-0
1
Oct-
01
Nov-0
1
Dec-0
1
Sta
ge
April 2000-December 2001
LIP Stage Storage Stage Streamflow Stage DM Stage GW Stage

61
Figure 4.22 shows the indicator levels from January 2002-December 2003. The
official LIP stage for this period would have been at Stage 2 from January 2002 through
December 2002. The storage indicator returned to normal from February 2002 to June
2002, but streamflow, the DM, and groundwater remained at the higher stages. The
storage index dropped to Stage 2 in September and returned to normal in December 2002.
The other indicators were slower to respond to the above normal rainfall that was
reported in the later months of 2002. The official stage would not have been downgraded
to no drought until May 2003 (five months after the storage indicator returned to normal)
when all other indicators recovered (groundwater and the DM were the last to recover).
-2
-1
0
1
2
3
4
5
Jan-0
2
Mar-
02
May-0
2
Jul-02
Sep-0
2
Nov-0
2
Jan-0
3
Mar-
03
May-0
3
Jul-03
Sep-0
3
Nov-0
3
Sta
ge
January 2002-December 2003
LIP Stage Storage Stage Streamflow Stage DM Stage GW Stage
Figure 4.22 Duke’s LIP indicators January 2002 – December 2003.

62
Figure 4.23 displays the indicators from January 2004 – December 2005.
Starting in June 2004, the official stage was Stage 0 because of streamflow and
groundwater while the storage indicator was still normal. Only at Stage 0 can the
declaration occur without the storage indicator in combination with the other indicators.
By September 2004, the storage indicator reached Stage 1, with no support from the other
indicators so the stage remained at Stage 0. All indicators and the official stage returned
to normal by December 2004. The storage indicator reached Stage 1 in October 2005,
however, since streamflow and the DM remained at normal levels, the official stage
remained at Stage 0. Storage quickly returned to normal by November 2005, proving the
indicators worked as they should: complimenting each other and providing the user with
guidance to avoid moving in and out of drought stages too frequently.
Figure 4.23 Duke’s LIP indicators January 2004 – December 2005.
-2
-1
0
1
2
3
4
5
Jan-0
4
Mar-
04
May-0
4
Jul-04
Sep-0
4
Nov-0
4
Jan-0
5
Mar-
05
May-0
5
Jul-05
Sep-0
5
Nov-0
5
Sta
ge
January 2004-December 2005
LIP Stage Storage Stage Streamflow Stage DM Stage GW Stage

63
Figure 4.24 provides the indicators from January 2006 – April 2008. Beginning
in August 2006, the indicator values are actual LIP stages (rather than estimated) under
which Duke and its stakeholders managed water in the basin during the worst drought
conditions on record. Table 4.22 highlights the indicator stage levels by month as the
drought intensified from June 2007 through April 2008.
The official LIP stage entered Stage 0 in June 2007 due to the storage indicator
and the DM. Streamflow reflected normal conditions primarily due to the 6-month
streamflow averages that included above normal flows in early 2007 (Table 4.23).
Streamflow reached D0 in July 2007. This one-month difference does not seem
significant, however, conditions rapidly deteriorated in summer 2007. The official stage
dropped almost one stage each month starting in July 2007 reaching Stage 3 by mid-
October 2007. By August 2007, all indicators were reflecting Stage 1, and by September
all indicators were at Stage 2. Streamflow increased to Stage 3 by October with the
storage index and DM hovering in Stage 2. Storage reached Stage 3 by mid- October
2007 with the DM and streamflow at Stage 3. The official stage was upgraded for the
first time to Stage 3 since the LIP implementation. The LIP calls for indicator evaluation
and stage changes on the first day of the month, based on conditions at the end of the
previous month, but due to the rapid intensification of the drought during fall 2007, Duke
and the stakeholders agreed to make stage changes as needed based on indicator
guidance.
Heavy rains in December 2007 started storage recovery, with the storage stage
improving to Stage 2. However, the LIP requires that all indicators recover to lower
levels before the official stage can be downgraded. Winter rains helped the storage

64
indicator recover to normal levels by February 2008, but the DM and streamflow
remained at Stage 4. Streamflow and the DM remained in Stage 4 in March 2008. By
April 2008, streamflow and the DM kept the official declaration at Stage 3, even though
the storage index returned to normal in February. Some stakeholders expressed concern
during the LIP indicator development that groundwater would hold the stage at higher
levels due to the lag in recovery, however, during late 2007-early 2008, both streamflow
and DM were at an elevated stage. Groundwater was also at a higher stage compared to
storage (only by one stage in April), but was not the only indicator holding the LIP from
recovery to a lower stage as expected.
-2
-1
0
1
2
3
4
5
Jan-0
6
Mar-
06
May-0
6
Jul-06
Sep-0
6
Nov-0
6
Jan-0
7
Mar-
07
May-0
7
Jul-07
Sep-0
7
Nov-0
7
Jan-0
8
Mar-
08
Sta
ge
January 2006-April 2008
LIP Stage Storage Stage Streamflow Stage DM Stage GW Stage
Figure 4.24 Duke’s LIP indicators January 2006 – April 2008.

65
Table 4.22 Duke’s LIP indicator drought stages, June 2007 – April 2008.
Jun. 2007 Jul. 2007 Aug. 2007 Sept. 2007
Drought Stage Drought Stage Drought Stage Drought Stage
0 1 2 3 4 0 1 2 3 4 0 1 2 3 4 0 1 2 3 4
Storage
DM
Streamflow
Groundwater
Feb. 2008 Mar. 2008 Apr. 2008
0 1 2 3 4 0 1 2 3 4 0 1 2 3 4
Storage
DM
Streamflow
Groundwater
* Due to the rapid intensification of the drought during fall 2007 Duke and the
stakeholders agreed to make stage changes as needed based on indicator guidance.
Oct. 2007 Mid-Oct.
2007*
Dec. 2007 Jan. 2008
0 1 2 3 4 0 1 2 3 4 0 1 2 3 4 0 1 2 3 4
Storage
DM
Streamflow
Groundwater

66
Table 4.23 Streamflow 6-month averages and values expressed as percentages of
long-term average, January 2007 – April 2008.
Actual 6-month Rolling
Streamflow Expressed as
Percent of Long-term Average
Rolling 6-Month Streamflow
January 2007 126
February 2007 118
March 2007 126
April 2007 103
May 2007 100
June 2007 89
July 2007 82
August 2007 67
September 2007 64
October 2007 46
November 2007 39
December 2007 34
January 2008 32
February 2008 30
March 2008 34
April 2008 41
In summary, the storage indicator was at a lower stage since December 2007, but,
due to the streamflow and DM, the official LIP operated under a Stage 3 declaration.
This caused significant concern by water systems in the basin since Stage 3 requires
mandatory water restrictions. During the winter, the mandatory restrictions were not
difficult to manage, however, as spring progressed more citizens and landscape
companies pressured water systems to relax their mandatory restrictions. The water
systems also experienced financial burdens due to the water restrictions on their
customers and some water systems proposed water rate increases. The complaint was
that as the lakes were at normal elevations, the Stage 3 water restrictions were difficult to
justify. The indicator analysis shows that both 6-month streamflow and the DM (Figure

67
4.24 and Table 4.22) held the declaration at Stage 3. Through the entire period analyzed,
April 2000 – April 2008, for 39 out of the 97 months (42 percent) the official LIP stage
was higher than the storage indicator due to streamflow or DM higher stages. The
official LIP stage was higher than the storage indicator due to groundwater only three
times. Only six times out of 97 months was the storage indicator at a higher drought
stage (Stage 0 and Stage 1) than the official stage, reaching Stage 1 only once (October
2005). Moving forward from April 2008, without consistent above normal streamflows,
the 6-month rolling streamflow will be slow to recover (Table 4.23). Higher streamflow
values are needed to cancel out the low flows from the late 2007 – early 2008 periods.
While the drought stage indicated by the storage index differs from streamflow,
the DM, and groundwater 42 percent of the time, Duke personnel and stakeholders
believe that multiple indicators provide better detection of drought onset and recovery.
The strength of using multiple indicators, in spite of their inherent differences, is that they
collectively improve detection and response. Results from the research show that the
appropriate lead-time is met with the indicators, but the recovery time is probably
insufficient. Duke and the stakeholders agreed to continue following the LIP despite
concerns over the 2008 conditions, noting that changing course and revising the LIP
during the drought may cause more confusion. Information from this study will be
presented to the Catawba-Wateree Drought Management Group for their next LIP
revision.
4.3 Duke Energy’s Low Inflow Protocol Comparison with
South Carolina’s State Indicators
This section will compare the drought frequency based on State and LIP
indicators. Table 4.31 provides the percent frequency of drought based on Duke’s LIP

68
indicators and selected state indicators for York County. York County was selected since
its drought frequency among the State indicators was consistent with other counties in the
South Carolina portion of the Catawba-Wateree basin. Table 4.31 displays results for
Duke’s Storage LIP, the State’s SPI 9-month and SPI 12-month, Duke’s LIP 6-month
Streamflow, Duke’s LIP 3-month DM, State Streamflow and State DM. The SPI-6
month (SPI6), SPI 9-month (SPI9), and SPI-12 month (SPI12) were selected for
comparison since longer-term indicators spanning 6 to 12 months are often used for
hydrologic drought depiction. The data were analyzed for the period April 2000 – April
2008. This shorter study period was selected based on the DM’s period of record.
Direct comparisons between the LIP and State indicators are difficult since
Duke’s LIP has five levels of drought (Stage 0, 1, 2, 3, 4) and the State only has four
(incipient, moderate, severe, and extreme). The S.C. Drought Response Committee
compares the indicators by assuming incipient is closest to Stage 0, moderate to Stage 1,
severe to Stage 2, extreme to Stage 3, or a combination of Stage 3 and Stage 4.
Discrepancies between the LIP and State indicator drought designation can also be
expected given the differences in the indicator estimating period and trigger level ranges.
The State analyzes streamflow over a 14-day period while the LIP averages over
six months. According to the state-defined streamflow trigger, extreme drought
conditions occur 4.49 percent of the time, with severe to incipient drought each occurring
only 0.45 percent. Normal conditions would therefore occur 94.16 percent of the time.
Based on the values estimated from April 2000 to April 2008, the 6-month streamflow
LIP indicator was in a Stage 3 drought 15 percent more often than the streamflow
reached extreme drought based on the state trigger. Combining LIP Stage 3 and Stage 4

69
percent drought occurrence, the 6-month streamflow indicator was in drought 31percent
more often that the state-defined extreme level. The LIP 6-month streamflow reached
Stage 1 and 2 almost 10 percent more often than it would have based on the State’s
definition. The LIP also indicates that normal conditions occurred 40 percent compared
to the State designated 94 percent.
Despite the differences in the spatial and temporal averaging of the State and LIP
DM, there was less than a 5 percent difference between their drought frequencies. The
State uses the monthly DM values and the LIP computes a 3-month average DM at the
end of each month. The LIP DM had a slightly higher frequency of occurrence for all
levels except Stage 2 compared to the State severe level. Combining Stage 3 and Stage 4
of the LIP, resulted in less than a 2 percent difference with the frequency of extreme
drought based on the State.
The attempt to relate the SPI 6-month, SPI 9-month and SPI 12-month to Duke’s
LIP Storage Indicator revealed that the SPI calculations were in all stages of drought
more often as compared to the LIP storage indicator. The greatest difference between the
storage frequencies and the SPI frequencies occurred at Stage 0 (incipient drought) and
for months with no drought. The SPI values reached incipient (or Stage 0 based on LIP)
13 percent to 16 percent more often than the storage indicator. Based on the storage
indicator, months with no drought designation occurred 55 percent of the time, whereas,
months with no drought based on the SPI calculations occurred only 19 percent to 25
percent of the time. The frequency of months with no drought designation based on the
SPI values for April 2000 – April 2008 is much less than for the extended period (1951-
2005) due to prolonged drought over the past decade. The frequency of months with no

70
drought designation from 1951-2005 occurred 48 percent to 55 percent of the time. One
goal of the research is to evaluate which indicator could be used as an alternative to the
DM in the LIP. A more detailed comparison of the SPI values and other indicators will
be discussed in Section 4.4.
Table 4.31 Percent frequency of drought occurrence based on Duke’s LIP
indicators and selected state indicators, April 2000 – April 2008: a)
Duke’s LIP storage, State’s SPI6, SPI9 and SPI12, b) Duke’s LIP
streamflow, Duke’s LIP DM, State streamflow and State DM.
Duke LIP
Stages
Storage State Drought
Stages
State SPI61 State SPI9
1 State SPI12
1
4/00-4/08 4/00-4/08
Stage 4 0.00
Stage 3 1.03 Extreme 2.06 4.12 6.19
Stage 2 7.22 Severe 11.34 16.49 13.40
Stage 1 15.46 Moderate 25.77 19.59 25.77
Stage 0 21.65 Incipient 35.05 38.14 35.05
No Drought 54.64 No Drought 25.77 21.65 19.59 1SPI=Standardardized Precipitation Index ( 6-, 9-, 12-month)
a) Duke’s LIP Storage, State’s SPI6, SPI9, and SPI12
Duke LIP
Stages
Duke LIP
Streamflow
Duke
DM2
State
Drought
Stages
State
Streamflow
State DM2
4/00-4/08 4/00-4/08 Based on
Percentiles
4/00-4/08
Stage 4 15.46 5.15
Stage 3 19.59 14.43 Extreme 4.49 17.83
Stage 2 10.31 16.49 Severe 0.45 21.45
Stage 1 10.31 15.46 Moderate 0.45 12.53
Stage 0 4.12 16.49 Incipient 0.45 13.01
No
Drought 40.21 31.96 No Drought 94.16 35.18 2
U.S. Drought Monitor
b) Duke’s LIP Streamflow, Duke’s LIP DM, State Streamflow, and State DM.
The chi-square test was used to estimate the independence of the Duke LIP
drought indicators categorized by drought occurrence (Stage 2-Stage 4, Stage 1, Stage 0,
and No Drought). Stage 2, Stage 3 and Stage 4 were combined into one drought

71
category. Table 4.32 displays the chi-square statistic and p-value for the comparison
between Duke’s LIP indicators (Storage Index, 6-month Streamflow, 3-month average
DM). The null hypothesis was rejected between all the indicators indicating there are
statistically significant differences between the storage index, streamflow, and the DM.
The p-values were very low, providing strong evidence for rejecting the null hypothesis.
The chi-square test was also used to estimate the independence of Duke’s LIP
drought indicators and State indicators. Duke’s LIP indicators were categorized by
drought occurrence in four levels; Stage 2 to Stage 4, Stage 1, Stage 0, and No Drought.
State indicators were categorized by Severe to Extreme, Moderate, Incipient, and No
Drought. The levels were combined since the chi-square test is not valid for small
samples (fewer than five). Frequency of occurrence rather than percentages was
analyzed since the chi-square must be calculated on actual count data. Table 4.33
displays the chi-square statistic and p-values for the comparison between Duke’s LIP
indicators (Storage Index, 6-month Streamflow, 3-month Average DM) and the state
indicators (SPI6-month, SPI9-month, SPI 12-month, State 14-day streamflow, and State
DM). The null hypothesis that there was no difference between the indicators was
rejected in most comparisons. The difference between Duke’s LIP storage index and all
the State indicators was statistically significant with very low p-values. The null
hypothesis was accepted for the comparison of LIP streamflow to State DM and between
the LIP DM and State DM, indicating no statistical difference. The statistical consistency
between the LIP 3-month average DM and State’s monthly DM may be attributed to the
persistent drought during the study period, April 2000-April 2008, with minimal month-
to-month changes in drought levels.

72
Table 4.32 Chi-square statistic and (p-values) for the comparison of the
frequency distributions of drought levels (LIP Stage 2 to Stage 4, LIP
Stage 1, Stage 0, No Drought) between indicators for Catawba-
Wateree Basin (p≤0.05).
LIP Indicators Storage Streamflow DM1
Storage 39.61 (0.00) 23.39 (0.00)
Streamflow 39.61 (0.00) 10.12 (0.00)
DM 23.39 (0.00) 10.12 (0.00) 1
U.S. Drought Monitor
Table 4.33 Chi-square statistic and (p-values) for the comparison of the frequency
distributions of drought levels (LIP Stage 2 to Stage 4 and State Severe
to Extreme, LIP Stage 1 and State Moderate, LIP Stage 0 and State
Incipient, and No Drought) between indicators for Catawba-Wateree
Basin and State indicators (p≤0.05).
State SPI 61 State SPI 9
1 State SPI 12
1 State
Streamflow
State DM2
LIP
Storage
16.81 (0.00) 23.87 (0.00) 22.76 (0.00) 44.44 (0.00) 25.93 (0.00)
LIP
Streamflow
50.03 (0.00) 43.75 (0.00) 46.93 (0.00) 64.14 (0.00) 5.72 (0.13)
LIP DM 19.71 (0.00) 14.80 (0.00) 16.60 (0.00) 81.09 (0.00) 0.91 (0.82) 1SPI=Standard Precipitation Index ( 6-, 9-, 12-month)
2 U.S. Drought Monitor
4.4 Alcoa Yadkin and Progress Energy’s Low Inflow Protocol
Indicator Comparison
The percent drought frequency for each of Alcoa/Progress Energy’s LIP
indicators is displayed in Table 4.41. The drought frequencies for the storage indicator
and streamflow were computed for the extended period from December 1996 – April
2008 and for the most recent period April 2000 – April 2008 (the period of record for the
Statistically Significant
Statistically Significant

73
DM). Similar to Duke’s LIP there are some caveats with Alcoa/Progress Energy’s
storage data before the LIP was implemented in 2006. Prior to 2006, Alcoa/Progress and
other water withdrawers were not following the LIP guidelines so the releases and
withdrawals from the system may have been different resulting in different drought
stages.
A major difference between the storage indicator drought frequency for the two
time periods did not occur. Streamflow had a larger difference in the frequency of
drought between the two time periods, but primarily only for Stage 1 and no drought
periods. Based on the LIP stage definitions, streamflow reaches Stage 3 and Stage 4
when the three-month average expressed as a percent of the long-term average is less
than 30 percent. This means that the overall LIP Stage 4 declaration is driven by the
storage and DM trigger levels. The overall increased percent frequency of drought is
consistent given the extended drought conditions experienced in the region over the past
decade.
The indicator comparison for the period April 2000 – April 2008 shows
inconsistencies in the percent frequency of drought occurrence between each of
Alcoa/Progress Energy’s indicators. The DM was the least consistent indicator compared
to streamflow and storage with a much higher frequency of drought occurrence for all
stages except Stage 1. The percent frequency of months with no drought was 67 percent
based on the storage indicator, 64 percent based on streamflow, but only 34 percent based
on the DM.

74
Table 4.41 Percent frequency of drought for Alcoa/Progress Energy LIP
indicators.
Drought
Level
Storage Storage Streamflow Streamflow DM1
12/96-4/08 4/00-4/08 12/96-4/08 4/00-4/08 4/00-4/08
Stage 4 2.21 3.09 5.15
Stage 3 11.03 9.28 3.68 5.15 12.37
Stage 2 5.15 5.15 3.68 5.15 14.43
Stage 1 6.62 7.22 11.76 16.49 16.49
Stage 0 5.88 8.25 7.35 9.28 17.53
No Drought 69.12 67.01 73.53 63.92 34.02 1 U.S. Drought Monitor
The chi-square test was used to analyze the actual occurrences of drought in each
category of Alcoa/Progress Energy’s LIP. Stage 3 and Stage 4 were combined since
Stage 4 has no separate criteria based on streamflow. The chi-square statistic and p values
indicate no difference in the occurrence of drought based on storage and streamflow (chi-
square 6.53 and p-value 0.163). A statistically significant difference did occur between
the storage indicator and the DM (chi-square 25.83 and p-value 0) and between the
streamflow and DM (chi-square 30.45 and p-value 0). The indication that there is no
statistical difference between the storage indicator and the streamflow indicator is based
on frequency in each drought category; this does not guarantee consistency between
stages each month. This will be explained following a comparison of drought occurrence
based on Alcoa/Progress Energy’s LIP indicators and Duke’s LIP indicators.
4.41 Alcoa Yadkin and Progress Energy’s Low Inflow Protocol indicators
compared with Duke Energy’s Low Inflow Protocol indicators.
Distinct differences are found between the frequency of drought based on
Alcoa/Progress Energy’s LIP indicators (Table 4.41) and Duke’s LIP indicators (Table
4.31). The greatest differences are for streamflow and storage since each power company
computes these indicators differently. Both use a 3-month average of the DM. Based

75
solely on the DM for the study period, April 2000 – April 2008, droughts occurred
somewhat more often in the Catawba-Wateree River Basin (29 percent occurrence of
months with no drought designation compared to 34 percent in the Yadkin-Pee Dee River
Basin).
The storage indicator from Alcoa/Progress Energy’s LIP had a higher occurrence
of Stages 3 and 4, but a lower occurrence of the earlier stages (Stage 0 to Stage 2). Stage
4 has never occurred based on Duke’s storage indicator whereas Stage 4 occurred 3.09
percent based on Alcoa/Progress Energy’s storage indicator. Stage 3 drought also
occurred more often (8 percent) based on Alcoa/Progress Energy’s storage indicator.
However, Stage 1 and Stage 0 occurred 8 percent to 13 percent less often based on
Alcoa/Progress Energy’s LIP.
The detection of drought via streamflow had the greatest difference between the
two LIP indicators. The 3-month streamflow triggered Stage 3 and Stage 4 thirty percent
less often than Duke’s 6-month streamflow indicator. This large difference may be
attributed to the differences in the 6-month versus 3-month values, but also because
Alcoa/Progress Energy does not have separate streamflow criteria for Stage 3 and Stage
4. For stages 2, 3, and 4, Alcoa/Progress Energy’s 3-month streamflow triggered drought
less often. Alcoa/Progress Energy’s storage and streamflow indicators indicated a higher
frequency of months with no drought compared to Duke’s storage and streamflow
indicators.
The analysis of the monthly drought stages according to each of Alcoa/Progress
Energy’s LIP indicators will be discussed below. The discussion focuses on two periods,
May 2002 to May 2003 and August 2007 to April 2008. The period May 2002 – May

76
2003 was selected since the stage reached the highest level during that time, Stage 4. The
period January 2007 to March 2008 is discussed since the LIP was followed according to
the new license to deal with the serious drought.
Table 4.42 shows the monthly drought level and gives the overall LIP stage
recreated for the dates May 2002 to May 2003. The official LIP quickly progressed from
Stage 1 in May 2002 to Stage 4 by August 2002. Through the entire period, only one
month, September 2002, showed the storage, streamflow, and DM depicting the same
level of drought. The largest discrepancies between the indicator stages occurred during
recovery from the drought. Leading up to the Stage 4 declaration in August 2002, either
the DM or streamflow supported the storage indicator detection of a higher level. The
LIP requires the storage indicator and only one of the other indicators in order to trigger
the next level. During the recovery from drought, to lower the drought level all
indicators must indicate a lower stage or High Rock storage has to return to the LIP-
specified levels.
Streamflow and storage indicated a much faster recovery from the drought than
the DM. The DM kept the official declaration at a higher stage than indicated by storage
and streamflow from October 2002 through February 2003. Storage and streamflow
indicated no drought by December 2002, but the DM kept the official LIP at Stage 2. By
March 2003, the recovery criterion relating to the elevation of High Rock storage (2.5
feet above the normal minimum elevation) was reached and the LIP was discontinued
even though the DM still indicated Stage 0. The DM did not recover to a no drought
declaration until May 2003.
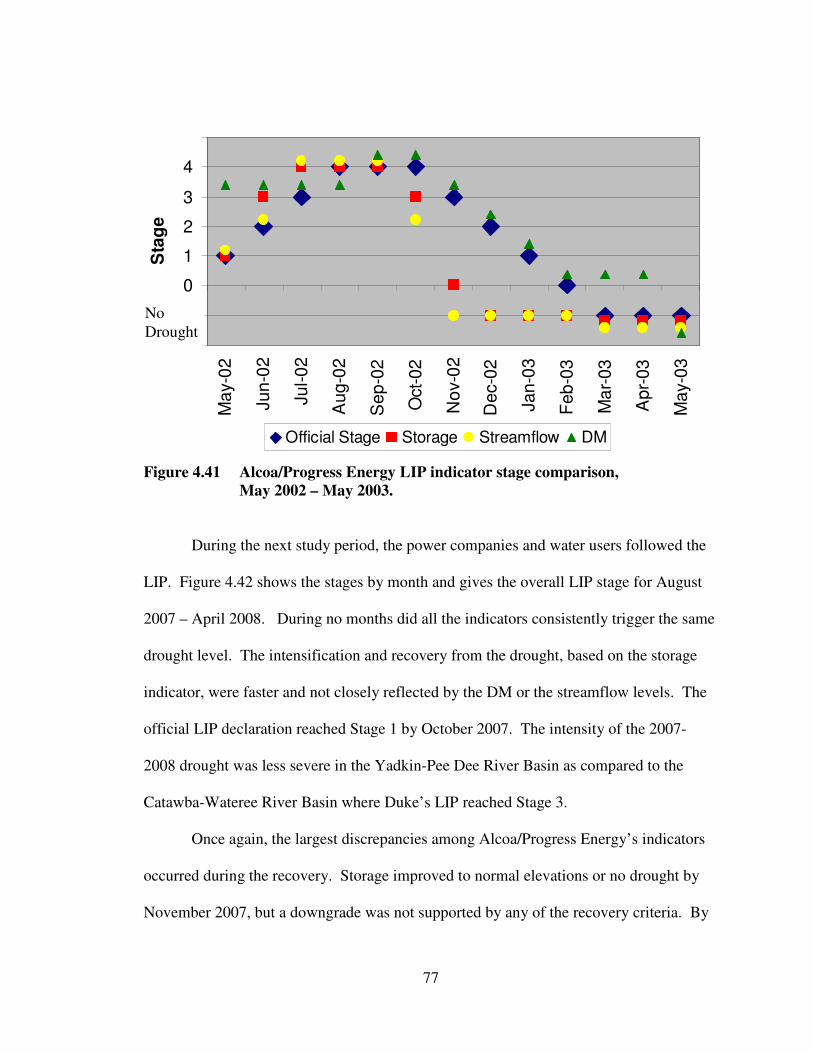
77
Figure 4.41 Alcoa/Progress Energy LIP indicator stage comparison,
May 2002 – May 2003.
During the next study period, the power companies and water users followed the
LIP. Figure 4.42 shows the stages by month and gives the overall LIP stage for August
2007 – April 2008. During no months did all the indicators consistently trigger the same
drought level. The intensification and recovery from the drought, based on the storage
indicator, were faster and not closely reflected by the DM or the streamflow levels. The
official LIP declaration reached Stage 1 by October 2007. The intensity of the 2007-
2008 drought was less severe in the Yadkin-Pee Dee River Basin as compared to the
Catawba-Wateree River Basin where Duke’s LIP reached Stage 3.
Once again, the largest discrepancies among Alcoa/Progress Energy’s indicators
occurred during the recovery. Storage improved to normal elevations or no drought by
November 2007, but a downgrade was not supported by any of the recovery criteria. By
-2
-1
0
1
2
3
4
5
Ma
y-0
2
Ju
n-0
2
Ju
l-0
2
Au
g-0
2
Se
p-0
2
Oct-
02
No
v-0
2
De
c-0
2
Ja
n-0
3
Fe
b-0
3
Ma
r-0
3
Ap
r-0
3
Ma
y-0
3
Sta
ge
Official Stage Storage Streamflow DM
No
Drought

78
December 2007, the official stage was downgraded to no drought and the LIP
discontinued because High Rock’s elevation recovered to 2.5 feet above the normal
minimum level. Streamflow and the DM continued to reflect Stage 1 or higher drought
conditions. Streamflow primarily remained at Stage 1 through the end of the study
period (April 2008); however, the DM remained in Stage 3 and Stage 4 drought. The
High Rock storage indicator returned to normal in November 2007, while five months
later, the DM and streamflow were still in drought. The DM is most inconsistent in
comparison to the storage indicator with the DM showing a Stage 4 or Stage 3 while
storage had recovered to normal elevations.
Figure 4.42 Alcoa/Progress Energy LIP indicator stage comparison,
August 2007 – April 2008.
Duke and Alcoa/Progress Energy experienced similar inconsistencies between the
indicators. Alcoa/Progress Energy has not faced the same challenges as Duke Energy
-2
-1
0
1
2
3
4
5
Au
g-0
7
Se
p-0
7
Oct-
07
No
v-0
7
De
c-0
7
Ja
n-0
8
Fe
b-0
8
Ma
r-0
8
Ap
r-0
8
Sta
ge
Official Stage Storage Streamflow DM
No
Drought

79
because they have the recovery criteria that allow a downgrade if their storage recovers
above the normal minimum elevation. The 3-month streamflow indicator for
Alcoa/Progress Energy also proved to be more consistent with the storage indicator than
the 6-month streamflow indicator for Duke. In the May 2002 to May 2003 period
discussed, the Alcoa/Progress Energy’s 3-month streamflow recovered to a no drought
classification one month before Storage. During the August 2007 – April 2008, the 3-
month streamflow was less consistent with storage, but was at a lower stage than the DM.
Stakeholders and system operators in the Yadkin-Pee Dee Basin confirm that the two
additional recovery criteria, based on storage in Alcoa/Progress Energy’s LIP, have
provided them with a more accurate representation of the drought’s true impact on their
system and compensated for the inconsistency in the indicators based on 3-month
streamflow and the 3-month average DM.
4.5 City of Rock Hill’s Drought Indicator Comparison
The City of Rock Hill pumps source water from Lake Wylie, one of the Catawba-
Wateree chain of reservoirs, in the northeast portion of York County. The distribution
system serves residential, commercial, and industrial public water customers inside the
corporate city limits of Rock Hill and certain customers adjacent to, but outside, the
corporate limits. Their wholesale customers include the Town of Fort Mill and York
County. As of 2002, the City of Rock Hill served approximately 23,552 customers.
Since the City of Rock Hill draws water from the Catawba-Wateree River Basin they are
expected to follow guidelines set forth in Duke Energy’s LIP.
The City of Rock Hill changed their local drought plan and related drought
indicators in early 2008 to comply with response requirements and the drought indicators

80
provided in the LIP for the Catawba-Wateree River Basin. The City of Rock Hill is one
of over 20 water withdrawers that must comply with the LIP. All water withdrawers who
signed the relicensing agreement or joined the Catawba-Wateree Water Management
Group are expected to follow the LIP and other licensing requirements. This suggests
that consistent drought indicators require integrating local drought plans with the LIPs.
In turn, these indicators trigger uniform response strategies that can be jointly applied to
mitigate drought impacts on water supply in the river basin.
The City of Rock Hill’s previous ordinance had two indicators used for triggering
three levels of drought (moderate or phase 1, severe or phase 2, and extreme, phase 3).
The indicators included the water filter plant’s average daily treatment capacity expressed
as a percent of S.C. Department of Health and Environmental Control’s permitted
capacity and the elevation of Lake Wylie (Table 4.51). Their revised ordinance uses
indicators listed in the LIP and meets the response requirements (i.e, water conservation
goals) required by both the LIP and South Carolina’s model local drought management
plan and response ordinance.

81
Table 4.51 City of Rock Hill’s previous ordinance drought indicators.
System
Name Source Moderate Severe Extreme
City of Rock
Hill
Lake Wylie 1. Avg. daily
treatment
capacity is 80%
of permitted
capacity.*
1. Avg. daily
treatment
capacity is 85%
of permitted
capacity.*
1. Avg. daily
treatment
capacity is 90%
of permitted
capacity.*
2. Lake Wylie
elevation is 95
ft
2. Lake Wylie
elevation is 90 ft
2. Lake Wylie
elevation is 85 ft.
*The average daily treatment capacity indicator was not available for this analysis.
This analysis compares the frequency of drought severity based on the City of
Rock Hill’s lake elevation indicator in their former ordinance with the new indicators
listed in the LIP (LIP Storage, 6-month streamflow and 3-month average DM). A more
common practice in South Carolina is for water systems to use their individual lake
elevation and an additional indicator such as daily use. However, even if the water
system’s intake is on one lake, the new LIP, especially in the Catawba-Wateree river
basin, encourages them to use a storage indicator that reflects storage upstream or for the
entire basin.
The percent frequency comparison displayed in Table 4.52 for the period April
2000 to April 2008 shows the large differences between the City of Rock Hill’s previous
Lake Wylie elevation indicator and the new LIP indicators. Based on the elevation
indicator used in their old ordinance, extreme and severe drought did not occur during the
study period. The percent frequency of moderate droughts was 10.64 percent. A side
analysis of the period of record daily data for Lake Wylie, 1951-2008, indicates that the
elevation has never dropped below the extreme defined level of 85 feet and only twice

82
did the elevation drop to or below the 90 feet severe drought trigger. On January 7,
1958, the elevation dropped to 89.6 ft., and on April 8, 1957, the elevation dropped to 90
ft. These dates coincide with another lengthy and serious drought that plagued the state.
The chi-square statistics comparing Lake Wylie elevations to the LIP indicators show that
the differences are statistically significant with p values at or less than 0.00.
Table 4.52 compares the percent frequency of drought based on the City of Rock
Hill’s old ordinance indicators, the overall LIP stage, and the individual LIP indicators
(storage, 6-month streamflow and LIP) for the period April 2000 – April 2008. Based on
the old ordinance, the City of Rock Hill only experienced drought 11 percent of the time,
whereas, based on the LIP, the river basin was in some level of drought 71 percent of the
time. A comparison of Lake Wylie’s elevation triggers compared to the LIP storage
indicator shows major differences. The differences can be attributed to using one lake
elevation compared to a combination of lake storage and to the triggers established for
the indicators. Based on the City of Rock’s Hill old ordinance, droughts would rarely be
triggered. However, based on the new LIP indicators, the City of Rock Hill is in each
stage of drought more often and for the first time reached severe and even extreme
drought levels (Stage 3 of the LIP is equivalent to the extreme level based on State
drought levels).
The City of Rock Hill’s water system managers indicate that education is key to
helping their customers understand the new drought criteria and the increased frequency
of drought based on their new ordinance. As expected, the majority of their customers
are most concerned with reaching Stage 3, which requires mandatory water conservation,
and during 2007-2008, required a complete ban on outdoor watering. Most water system

83
managers in the Catawba-Wateree River Basin emphasize the importance of a
coordinated response and are members of the Catawba-Wateree Drought Management
Advisory Group (CWDMAG), which helps facilitate the basin-wide response.
Table 4.52 Percent frequency of drought occurrence based on City of Rock
Hill’s old ordinance lake elevation indicator compared to Duke’s LIP
Indicators.
Rock Hill’s
Previous
Drought
Levels
Lake Wylie
Elevation
Duke’s
LIP
LIP
Overall
Stage
Storage Streamflow DM
4/00-4/08 Drought
Levels
4/00-4/08 4/00-4/08
Stage 4 0 0.0 15.5 5.2
Extreme 0 Stage 3 6.2 1.0 19.6 14.4
Severe 0 Stage 2 16.5 7.2 10.3 15.5
Moderate 10.6 Stage 1 26.8 15.6 10.3 16.5
Incipient Not defined Stage 0 21.7 21.6 4.1 15.5
No
Drought
89.4 No
Drought
28.9 54.6 40.2 33.0
The majority of the water systems in the Catawba-Wateree River Basin brought
their local drought plans in line with the LIP, and they were quickly tested during the
2007-2008 drought. Marilyn Lineberger, Duke Energy spokesperson, stated that
“Working together and implementing the LIP helped protect drinking water, electricity,
and water for jobs.” as the drought persisted (Lineberger, personal communication,
2008). In other South Carolina basins with LIPs in place, less collaboration and
integration of drought plans occurs. This one case study demonstrates the discrepancies
in drought stage declarations and corresponding actions that can occur when indicators
are inconsistent. These results can also be used by Duke Energy and SCE&G to illustrate
84
the importance of indicator consistency as they develop LIPs for the Saluda and Keowee
hydropower projects.
4.6 Evaluate use of indicator percentiles comparison as a method to improve drought
detection.
The fourth objective of the study is to evaluate expressing indicators within a
probabilistic framework by transforming indicators to percentiles and then combining the
multiple indices using blends or weights to create a new blended drought index, a
strategy used by the U.S. Drought Monitor authors (Svoboda et al., 2002) and of specific
interest for LIPs. A possible solution for using multiple and often statistically
inconsistent indicators is to transform all indicators to percentiles (Steinemann et al.,
2005). This can be accomplished using an empirical cumulative distribution function.
Drought plan triggers can then be based on percentiles rather than raw indicator values.
The decision maker can relate triggers to the concept of return periods or probabilities of
occurrence and the trigger values associated with each drought level would be
statistically consistent. For example, an extreme drought could be equivalent to the 2nd
percentile rather than –4.0 for the PDSI and –2.0 for the SPI.
Once all indicators are based on percentiles, they can be weighted and combined
to create a blended index, a technique used by the U.S. Drought Monitor authors. Few
references in the literature demonstrate or evaluate the effectiveness of this approach.
This research evaluates a blend of various indicator percentiles for the Catawba-Wateree
River Basin for the period April 2000 to April 2008. The study period is once again
limited to one of shorter duration to coincide with the available data for the DM. The
data from January 2008 to April 2008 are preliminary since the original weather station

85
data and streamflow data have not undergone quality control by the National Climatic
Data Center and the United States Geological Survey. The cumulative frequency
distribution of the blends will be compared to the storage indicator, 6-month streamflow,
and 3-month average DM indicators currently listed in Duke’s LIP to determine if any
blend or individual indicator is a feasible replacement index.
As discussed, questions have been raised as to the effectiveness of the proposed
indicators in the LIP due to conditions experienced in the most recent drought that began
in 2006 and is ongoing through June 2008. Stakeholders in the Catawba-Wateree River
Basin have expressed concern with the inconsistencies between the LIP indicators. The
storage indicator has been at a lower stage since December 2007, but due to the 6-month
streamflow average and DM the official LIP is operating under a Stage 3 declaration.
The Stage 3 mandatory water restrictions are causing financial difficulties for many water
systems and landscape companies. The complaint has been that with the lakes at normal
elevations or higher, it is difficult to explain the Stage 3 restrictions to water system
customers. The indicator analysis shows that it is not just the 6-month streamflow
holding the declaration at Stage 3, but also the DM.
The original concerns expressed by resource agencies as the indicators were being
developed focused on the use of the DM. The DM was not intended for smaller scale
drought detection at the basin or sub-basin level. Other concerns revolved around the
subjectivity of the DM introduced by the different DM authors and local input into the
weekly indicator.
This research reports the difference in drought stage declarations among Duke
Energy’s storage indicator, 6-month average streamflow, 3-month average DM, and four

86
indicators retrieved from the DDIT application. These indicators include the SPI 6-
month, SPI 9-month, and two blended indicators. The first blended index was based on
the weights and indicators used by the DM authors. The blended index uses weights and
blends that consist of 27 percent Palmer Hydrologic Index, 22 percent 24-month
precipitation, 22 percent 12-month precipitation, 17 percent 6-month precipitation, and
12 percent 60-month precipitation (Blend 1). The long-term blended indicator used by
the U.S. DM authors includes a Climate Prediction Center soil moisture value. This
indicator is not available using the DDIT Application and is only available in real-time
map format. The 10 percent weight for this index was distributed equally among the five
other indicators (e.g. bringing 25 percent Palmer Hydrologic Index to 27 percent). The
second blended indicator was 30 percent 6-month SPI, 40 percent 9-month SPI, and 30
percent 12-month precipitation (Blend 2). Blend 2 indicators were selected to capture the
longer-term scale measurements needed for detecting hydrologic droughts. Several trial
comparisons of different percentages were conducted.
Five stages of drought and no drought periods were defined to correspond with
the five stages of drought in the LIP (Stage 4, Stage 3, Stage 2, Stage 1, and Stage 0).
The percentile ranges correspond to the those used by the DM:
• 0 to 2 percentile = Stage 4
• 3 to 5 percentile = Stage 3
• 6 to 10 percentile = Stage 2
• 11 to 20 percentile = Stage 1
• 21 to 30 percentile = Stage 0

87
Since the Catawba-Wateree River Basin covers 12 counties and four USGS
hydrologic units (HUCs) a pre-test was performed to determine how the indicator data
should be spatially averaged to best represent the entire basin. The DDIT application
provides the flexibility needed to spatially average the indicator data by numerous spatial
units such as counties, 8-digit HUCs, climate divisions, or basin-wide averages. The
application computes station indicator values and interpolates on a four km by four km
grid. This gridded-data can then be spatially averaged by different units. A chi-square
test was used to determine if the differences in the drought stages according to the SPI 6-
month and SPI-9 month were statistically different computed by county, 8-digit HUCs or
basin-wide data. The basin-wide data were compared to county data for York and
Chester Counties and to averages for three HUCS (Upper Catawba, Lower Catawba, and
Wateree). Table 4.61 shows the SPI-6 month spatial comparison between basin, county,
and HUC. The chi-square and corresponding p values show no statistically significant
difference when comparing the SPI 6-month and SPI 9-month by county, HUCs or basin-
wide. Therefore, to best represent the conditions throughout the Catawba-Wateree River
Basin the basin-wide averages were analyzed.
Table 4.61 SPI-6 month spatial comparison of monthly drought occurrence
between basin, county and HUCs, April 2000-April 2008.
Basin-
Wide
York
Chester
Upper
Catawba
HUC
Lower
Catawba
HUC
Wateree
HUC
Stage 4 0 0 1 0 2 1
Stage 3 1 5 3 1 3 3
Stage 2 9 7 6 8 7 3
Stage 1 17 23 22 18 20 16
Stage 0 16 10 12 11 11 15

88
The chi-square test for independence was used to analyze the basin-wide
Catawba- Wateree River frequency of drought occurrence in four drought categories
(Stage3 and Stage 4 combined, Stage 2, Stage 1, and Stage 0) and for months with no
drought. The analysis compared Duke Energy’s storage indicator, Duke Energy’ 6-
month streamflow indicator, and the SPI 6-month, SPI 9-month, Blend 1, and Blend 2.
The null hypothesis is that there is no difference in the frequency of drought based on the
five categories (including months with no drought).
The primary purpose of this objective is to determine whether the SPI 6-month,
SPI 9-month, Blend 1, or Blend 2 is a viable indicator for replacing the DM in Duke’s
LIP. The analysis also investigated whether using multiple indicators weighted together
to create a blended indicator improves drought detection over using a single indicator.
The subjective criteria used to evaluate the performance of the indicators are based on
communication with Duke Energy and the Catawba-Wateree Drought Management
Advisory Group. The criteria include:
• The frequency of drought occurrence by stage is more closely related to the
storage indicator.
• The lead-time entering drought and the recovery from drought are adequate and
more closely in-line with the storage indicator.
4.61 Results
The results of the percent frequency of drought comparison between the SPI 6-
Month, SPI 9-Month, Blend 1, Blend 2, and Dukes’ LIP indicators are presented in Table
4.62. Based solely on percent frequency of Stage 2, Stage 3, and Stage 4 drought

89
occurrence, the Blend 2 indicator is most closely related to the storage indicator. The
frequency of drought for the other three indicators was more closely related to the storage
indicator than the LIP 3-month DM. The DM is in Stage 3 or Stage 4 drought 28 percent
more often than the storage indicator. A comparison of Stage 1 and Stage 0 drought
occurrence reveals that the SPI 6-Month, SPI 9-Month, Blend 1, and Blend 2 all are in
Stage 1 more often than the storage indicator, but the reverse is true for Stage 0.
According to the storage indicator, 54.63 percent of months have no drought. The SPI 6-
Month, SPI 9-Month, Blend 1, and Blend 2 were all similar to the Storage indicator with
percent frequency of no drought ranging from 45 percent to 51 percent.
The chi-square test and corresponding p-value show that the null hypothesis could
be rejected and there is a significant difference in the frequency of drought based on the
different indicators. Statistical differences occurred between the SPI 6-Month, SPI 9-
Month, Blend 1, and Blend 2 compared to the LIP 6-month average streamflow and LIP
3-month DM. Most importantly, the null hypothesis of no difference in drought
frequency was accepted when comparing the SPI 6-Month, Blend 1, and Blend 2 to the
storage indicator. The p-value for the comparisons to the storage indicator was 0.532 for
the SPI 6-month, 0.268 for Blend 1, and 0.373 for Blend 2. The p-value for the
comparison of the SPI-9 month drought frequency to the storage indicator was 0.055
which indicates a statistical difference. The chi-square is only testing a statistical
relationship between the indicators based on the frequency of drought in the five
categories and does not guarantee that drought levels occur during the same months.

90
Table 4.62 Percent frequency of drought occurrence, April 2000 – April 2008, for
SPI 6-Month, SPI 9-Month, Blend 1, Blend 2, Dukes’ Storage, Duke’s
6-month streamflow, Duke’s 3-month average DM.
Drought
Level
Storage Streamflow1 DM
2 SPI6
3 SPI9
3 Blend 1
4 Blend 2
5
Stage 4 0.0 15.5 5.2 0.0 0.0 0.0 0.0
Stage 3 1.0 19.6 14.4 2.1 4.1 2.1 1.0
Stage 2 7.2 10.3 16.5 11.3 12.4 12.4 10.3
Stage 1 15.5 10.3 15.5 21.7 24.7 21.7 24.7
Stage 0 21.6 4.1 16.5 19.6 10.3 12.4 14.4
No Drought 54.6 40.2 32.0 45.4 48.5 51.6 49.5 1Streamflow = 6-month rolling streamflow expressed as percent of long-term
average rolling 6-month streamflow
2 U.S. Drought Monitor
3SPI=Standard Precipitation Index ( 6-, 9- month)
4Blend 1=27% Palmer Hydrologic Index, 22% 24-month precipitation, 22% 12-month
precipitation, 17% 6-month precipitation, and 12% 60-month precipitation 5Blend 2=30% 6-month SPI, 40% 9-month SPI, and 30% 12-month precipitation
Table 4.63 and Table 4.64 provide the direct stage comparison by month for the
indicators under evaluation for two serious drought periods: January 2002 to May 2003
and January 2007 to April 2008. The primary purpose is to determine whether the SPI 6-
month, SPI 9-month, Blend 1, or Blend 2 are suitable and reliable replacements for the
DM for use in Duke Energy’s LIP. The overall LIP stage depends on storage in addition
to either the 6-month streamflow or 3-month DM to advance from D0 to higher stages;
for recovery, all indicators must show a lower stage, including groundwater. The LIP
was not in place until 2006 so prior stages are estimated based on indicators. The
discussion will focus on transition months between higher and lower stages. Since the
official stage can’t be upgraded from D0 to higher levels without a combination of
storage and one other indicator, the replacement indicator should not be repeatedly lower
than the storage, which would result in a delayed stage and corresponding response.
Similarly, recovery requires an indication of a lowered stage by all indicators including

91
groundwater. Groundwater stages were not included in the graphs since they are only
considered during recovery. Inconsistent and delayed recovery designations also impact
response, causing confusion for stakeholders and users in the basin.
Leading into the significant summer drought of 2002, the SPI 6-month, SPI 9-
month, Blend 1, and Blend 2 were all higher than storage (Table 4.63). Similar to the
DM and streamflow, these indicators were one to two drought levels higher than the stage
based on storage for each month. During the recovery period from the drought that began
in November 2002, the SPI 6-month, SPI 9-month, Blend 1, and Blend 2 all provided a
more rapid response to the improving drought conditions. Under the current LIP, the
official stage would have remained in Stage 2 until December 2002 due to the LIP
streamflow and the LIP DM indicators. The SPI 6-month, SPI 9-month and Blend 2
recovered somewhat faster than storage, but were generally consistent with the storage
stage by indicating no drought by December 2002. Blend 1 returned to normal in January
2003. The LIP streamflow did not return to normal until March 2003. The DM returned
to normal in May 2003, five months later than the storage. Any of the evaluation
indicators were more consistent with the LIP storage on recovery than the LIP
streamflow and DM.

92
Table 4.63 SPI 6-month, SPI 9-month, Blend 1, and Blend 2 drought stages
compared to LIP storage, LIP 6-month streamflow, 3-month average
DM stages, January 2002 – April 2003.
Storage DM Streamflow SPI6 SPI9 Blend 1 Blend 2
Jan-02 1 2 4 1 2 2 2
Feb-02 2 4 1 1 2 1
Mar-02 3 4 2 1 2 1
Apr-02 3 3 2 1 2 2
May-02 3 3 2 2 2 2
Jun-02 3 3 1 2 2 1
Jul-02 1 3 3 2 3 2 2
Aug-02 1 3 4 3 3 3 3
Sep-02 2 4 4 2 2 3 2
Oct-02 2 4 4 1 1 2 1
Nov-02 1 3 4 1 1 0
Dec-02 2 3 0
Jan-03 1 1
Feb-03 0 1
Mar-03 0
Apr-03 0
Higher Stage than Storage Lower Stage than Storage
The next comparison focuses on the 2006 to 2008 drought period. Beginning in
August 2006, the LIP was voluntarily followed by Duke Energy and the Catawba-
Wateree Drought Management Advisory Group (CWDMAG) so Table 4.64 reflects the
actual stages for storage, streamflow, and the DM. The official LIP was upgraded to
Stage 1 in May 2006. Even though storage recovered to Stage 0 in June 2002 the official
LIP was not downgraded to Stage 0 until January 2007 because groundwater had not
recovered to the lower stage. Groundwater indicators kept the official stage at 0 for six
additional months after all indicators had recovered. Water systems and users in the
basin expressed minimal complaints since Stage 0 does not require any major actions and
is considered a drought “watch” phase. Most water users supported the Stage 0

93
designation stating that until groundwater recovers all stakeholders should monitor the
conditions.
By summer 2007, another extended dry period began, with the storage indicator
reaching Stage 1 by August 2007. Stage 1 was supported by streamflow and the DM.
Conditions rapidly deteriorated in the basin with an increase to Stage 2 in September
2007, supported by storage, streamflow, and the DM. Once again, only the SPI 6-month
was at Stage 2. Stage 3 was reached in mid-October (Table 4.64 reflects Stage 3 in
November 2007 since it only shows monthly stages) supported by storage, streamflow,
and the DM. The official stage changes are made at the first of each month according to
the LIP; however, because storage was dropping quickly an exception was made, and in
mid-October 2007 the official stage was upgraded to Stage 3. The CWDMAG and Duke
Energy wanted to be proactive since all conditions indicated the drought was intensifying
rapidly. The SPI 6-month was the most consistent indicator with the storage indicator in
detecting the drought levels during the onset and intensification of the drought during late
summer and early fall 2007. The SPI 9-month was in lower stages than the storage
indicator from June to September 2007, but did reflect the same stages (Stage 2 and Stage
3) in October and November 2007. Blend 1 and Blend 2 never reached Stage 3 during
the 2007-2008 drought period.
Storage recovered to Stage 2 in December 2007, Stage 1 in January 2008, and to
normal by February 2008 due to beneficial winter rains. The streamflow and the DM
were much slower to reflect improvement, remaining in Stage 3 through April 2008 (end
of this study period). Groundwater remained at Stage 3 until March 2008 and was at
Stage 2 in April 2008. The SPI 6-month recovered to Stage 1 by January 2008 and to

94
Stage 0 in April 2008. All replacement indicators had a faster recovery than streamflow
and the DM.
Table 4.64 SPI 6-month, SPI 9-month, Blend 1, and Blend 2 drought stages
compared to LIP Storage, LIP 6-month streamflow, 3-month average
DM stages, August 2006 – April 2008.
Storage DM Streamflow SPI6 SPI9 Blend 1 Blend 2
Aug 06 0 1 3 1 0 0 1
Sep 06 0 0 2 0
Oct 06 0 0 1 0
Nov 06
Dec 06
Jan-07
Feb-07
Mar-07
Apr-07
May-07 0 0
Jun-07 0 1 0 0
Jul-07 0 1 0 1 0
Aug-07 1 1 1 1 0 0 0
Sep-07 2 2 2 2 1 1 1
Oct-07 2 2 3 3 2 1 2
Nov-07 3 3 4 2 3 1 2
Dec-07 2 3 4 2 3 2 2
Jan-08 1 4 4 1 2 2 2
Feb-08 4 4 1 2 2 2
Mar-08 4 4 1 2 2 1
Apr-08 3 3 0 2 1 1
Higher Stage than Storage Lower Stage than Storage
The inconsistency between the current LIP indicators during Winter 2007 and
Spring 2008 resulted in confusion and complaints by water systems and users in the
basin. Water systems complained that the Stage 3 LIP confused their customers since the
lakes returned to target elevations in February 2008. Stage 3 requires mandatory water
restrictions that limit outdoor watering to no more than one day a week for most water
systems. It also prohibits car washing, using water for ornamental fountains, and filling
new swimming pools. The landscape industry requested that restrictions be lowered

95
based on the premise that the lake elevation(s) had returned to normal levels. The
CWDMAG agreed it would cause more confusion to change the LIP indicators and
required responses while the drought was ongoing. The changes will be considered after
the drought has ended and further indicator evaluations are conducted.
The CWDMAG conducted regular meetings to better understand the indicator
levels and to encourage consistent response as required by the LIP. Stakeholders in the
basin agree that the overall success of the mandatory restrictions may be attributed to
consistent stage declarations and response. For many water systems, their local drought
ordinance implementation required approval by either a board, commission, or
county/town/city council. This can be a major political battle, however, due to the LIP
and consistent response by small and large water systems, the political road-blocks were
mostly avoided. Many smaller water systems emphasize that having the largest water
system in the basin, Charlotte-Mecklenburg Utility Department, leading the effort was a
major advantage.
The study period was limited, but did cover two significant drought episodes.
The evaluation of the SPI 6-month, SPI 9-month, Blend 1, and Blend 2 indicators showed
some promising alternatives to replacing the DM in the LIPs. All were generally more
consistent with the storage indicator during the recovery phases providing shorter lag-
time. Blend 1 and Blend 2 did not perform as well as SPI 6-month or SPI 9-month in
comparison to the storage indicator, suggesting that transforming indicators to percentiles
and then combining the multiple indices using blends or weights did not improve drought
detection over the use of single indicators. Converting the single indicators to percentiles
(SPI 6-month and SPI 9-month) did improve drought detection both during the onset and

96
recovery as compared to the 3-month DM. Additional blends could be tested in future
research to confirm these results.
The CWDMAG also should consider shortening the 6-month streamflow average
to avoid the slower recovery experienced during spring 2008. The 3-month streamflow
indicator was more consistent with the storage indicator used by Alcoa/Progress Energy
for the Yadkin-Pee Dee River Basin LIP. Another component of Alcoa/Progress
Energy’s LIP that proved to be successful was the recovery criteria based on their storage
indicator (High Rock Lake) returning to a certain elevation which automatically cancels
the LIP regardless of the other indicators’ stages. Since the storage elevation is a key
indicator for determining water availability in LIP river basins adding a recovery
condition based solely on storage should be investigated by the CWDMAG and other
entities developing LIPs in South Carolina. The recovery from the LIP should consider
both a slow recovery, where all indicators must reach a lower level before the stage is
lowered, to a more rapid recovery that accounts for the storage recovering to a certain
elevation for a user-determined time period.
In summary, this research provides some possible solutions for reducing the
scientific and operational inconsistencies found among the LIP indicators. The City of
Rock Hill indicator analysis demonstrates the importance of indicator consistency to
achieve basin-wide response. Lastly, the study found that transforming indicators to
percentiles and then combining the multiple indices using blends or weights did not
improve drought detection in the Catawba-Wateree basin over the use of single
indicators.
97
CHAPTER 5 DROUGHT INDICATOR SURVEY
The emphasis in the previous chapters focused on the scientific validation of
drought indicators. This research objective concerns the link between the scientific
justification for and operational relevancy of drought indicators and drought detection. A
survey was conducted to evaluate which drought indicator characteristics met the needs
of water systems and power companies in S.C. The survey results provide insight into
their understanding of state and local drought indicators. Based on their responses, an
analysis was undertaken to determine whether water systems and power companies look
for different qualities in state versus local drought indicators. Lastly, the survey asks the
managers to reconstruct the historic sequence of the 1998-2002 drought impacts to better
understand their ability to tolerate drought. The survey results and correspondence with
water users and decision makers will be used to verify which indicator(s) meet the user’s
needs and more closely detect the drought impacts on their operations.
The discussion proceeds by first providing a background on survey development,
population surveyed, and response rate. A signed-rank test was used to determine the
statistical significance of the survey data. The survey results are presented in two
sections. Section 5.1 uncovers water system manager’s understanding of drought
indicators and what characteristics make a more effective indicator. The study also
analyzes whether system size and water source influence the system manager’s
identification of effective indicator characteristics. This is followed by a subsection
summarizing their reconstruction and perception of the 1998-2002 drought impacts.

98
Section 5.2 provides a unique analysis of drought indicator comprehension and needs by
all four power companies in South Carolina. Their reconstruction of the 1998-2002
drought is presented to better understand their vulnerability to drought. Lastly, section
5.3 presents implications of the research for improving S.C.’s drought response.
The survey was pretested and revised based on input from four water system
managers and one retired power company hydropower manager. The survey followed
the University of South Carolina’s Institutional Review Board requirements. The full
survey and example cover letter are included in Appendix 1. The input and guidance
from the pretest were instrumental in making the survey more focused and
understandable for the water system managers/operators and power company
representatives.
The survey was mailed to 108 water systems and four power companies. The 108
water systems were randomly selected from a database of water systems provided by the
S.C. Department of Health and Environmental Control (SCDHEC). SCDHEC’s database
included 298 “federally-defined community water systems.” The random selection was
stratified by county and population served by the water system. The U.S. Environmental
Protection Agency defines small systems as serving less than 3,300, medium systems
serve 3,301-10,000, and large systems serve populations over 10,000. One system from
each size category (small, medium, and large) per county was selected. Since all counties
did not have small, medium, and large systems, the total survey per category size was 36.
The original database from SCDHEC included 154 small systems, 75 medium systems,
and 69 large systems.

99
The first survey mail-out yielded less than a 20 percent response. A follow-up
survey was sent followed by a reminder postcard. A total of 47 surveys were received
from 43 water systems and four from power companies. Table 5 provides a summary of
the survey response. The survey results are summarized for all respondents and analyzed
based on system size and system source. Results from the power companies were
analyzed and summarized separately. The system source was derived from a survey
question on whether their water source was a lake, river, or groundwater. The water
system source was a lake for 12 systems, a river for 13, groundwater for 16, and two
systems did not answer. The power companies listed lakes and rivers as their source.
Table 5.0 Survey response rate.
Mailed Received Response Rate
Small Water Systems 36 11 31%
Medium Water Systems 36 10 28%
Large Water Systems 36 22 61%
Power Companies 4 4 100%
Total 112 47 42%
5.1 Water System Survey Results
Question 1: What drought indicator(s) does your system use?
The percentage of water systems using state, local, or a combination of both as
their drought indicator are presented in Figure 5.11. Only 26 percent of the water
systems stated they use a combination of state and local indicators. This is an
unexpectedly low number considering the S.C. Drought Mitigation Plan and Model
Ordinance issued by the SCDNR pursuant to the S.C. Drought Response Act’s supporting
regulations (revised in 2001) recommends water systems use a combination of the state
level declaration and local indicators. Sixty percent of the systems responded they use

100
either single or multiple local drought indicators. The sixteen percent that stated they use
a single local level indicator use lake levels, well levels, average daily usage for specific
number of days, or salinity levels. The reliance on local level indicators has increased
over the past decade as a result of SCDNR’s Model Drought Mitigation Plan and
Response Ordinance initiated in 2002. All South Carolina water systems had to revise
their plan and ordinance to comply with the model. A key goal of the new model was for
water systems to develop system-specific drought indicators that would be used in
conjunction with the state-level declarations. During discussions since the survey’s
completion, water systems stated that persistent drought over the past decade has further
demonstrated the importance of local indicators in the drought planning process.
5%
9%
26%
16%
44%
None
State
State and Local Indicators
Single Local Indicators
Multiple Local Indicators
Figure 5.11 Summary of Indicator Type Used by Water Systems, N=43.
Indicators

101
Question 2: How important is it to your system that drought indicators meet the
following criteria. If you use both State and Local drought indicators please
designate criteria for each. Choose Not Applicable if you only use indicators specific
to your system. (Circle 1 for Not Important, 2 for Somewhat Important, 3 for
Important, 4 for Very Important and 5 for Not Applicable)
Questions two and three focus on determining which drought indicator
characteristics are most important for local and state drought indicators. The drought
characteristics include whether the drought indicator captures the impact of extreme
drought conditions, their ability to understand how the indicator is computed, whether
there is easy access to the indicator data, if the indicator is widely publicized, and if the
indicator provides appropriate lead time before entering each drought stage. Two of the
characteristics were selected since they relate directly to the indicator’s depiction of
drought (“having the indicator capture the impact of extreme drought conditions” and the
“ability of the indicator to provide appropriate lead time before entering each drought
stage”). The remaining characteristics were selected to investigate the importance of
indicator computation, visibility, and accessibility. In question two, if both state and
local drought indicators were used they were requested to identify criteria for each. Even
if a water system did not respond in question one that they use state indicators their
results were still included since they may refer to the state indicators without using them
in their official drought ordinance and plan.
In order to summarize the results of question two, the numerical equivalent score
for each importance rating was averaged for each state and local indicator characteristic
and provided in Table 5.12. The “5” response for not-applicable was not included in the
averages. Since the data were not normally distributed the non-parametric signed rank
test was used to evaluate the null hypothesis that the median difference between the

102
observations is zero. The average scores for local and state indicators were between 3.0
and 3.9 with no single characteristic standing out as the most important. A score of 3
means important and a score of 4 means very important. The difference between the
average scores for all state drought indicator characteristics ranged from 3.0 to 3.4.
Water systems generally agreed that the three most important state drought indicator
characteristics are having the drought indicator “capture the impact of the extreme
event”, “providing the appropriate lead-time before entering drought”, and having the
state “indicator widely publicized”. The “ability to understand how the indicator is
computed” received the lowest average score of 3. However, according to the signed
rank test the differences between the state indicators are not statistically significant
(p≤0.05).
The local indicator analysis of the importance ratings revealed that two
characteristics received a statistically higher average score than the state indicators, the
“ability to understand how the indicator is computed” and having “easy access to the
indicator data”. Almost all the systems agreed that having the indicator “capture the
impact of the extreme event” and “having easy access to the indicator data” were the
most important local drought indicator characteristic. Both were statistically more
important than all other local characteristics. In contrast to the state indicator responses,
having the local “indicator widely publicized” received the lowest average score (3.2).

103
Table 5.12 Average scores for state and local drought indicator characteristic.
Captures
impact of
extreme
drought
conditions
Ability to
understand
how
indicator is
computed
Easy access
to indicator
data
Indicator is
widely
publicized
Provides
appropriate
lead time
before entering
drought stage
All
Systems
Average
Score
N=40 N=42 N=40 N=41 N=39 N=41 N=39 N=43 N=40 N=41
State Local State Local State Local State Local State Local
3.4 3.9 3.0 3.5 3.2 3.8 3.4 3.2 3.4 3.5
The results were also summarized by counting the number of importance ratings
for each state and local drought indicator characteristic (Figure 5.12). These results also
showed that all characteristics for local indicators received more “very important” ratings
than state indicators except having the “indicator widely publicized” which received
almost equal numbers of “very important” ratings. Consistent with the results in Table
5.12, the highest number of systems gave the “very important” rating to the characteristic
“capturing the impact of the extreme drought condition” (22 for state and 31 for local).
Four systems responded that all the indicators were “non-applicable.” Two of these were
small systems that responded in question one that they did not have drought indicators.
The other two were large systems - one whose source is a lake and the other depends on
groundwater. The remaining “non-applicable” responses were primarily from systems
that only use state level indicators.

104
Figure 5.12 Importance of indicator characteristics to water systems.
A key discovery is that all indicator characteristics appear to be important or very
important for many of the water systems. Only three systems responded that any of the
characteristics were not important. Based on question two there are some similarities and
only subtle differences between the drought indicator qualities water systems look for in
state versus local indicators. Water system owners believe that having the drought
indicator “capture the extreme event” is most important for both state and local
indicators. However, they also need the state indicator to “provide appropriate lead-time
before entering drought stage” and be “widely publicized.” Local operators are less
concerned that they have “easy access to the state indicator data”, or the “ability to
understand state indicator calculations”, but it is important they have “access to the local
7
6
22
8
3
31
8
8
18
9
7
12
21
8
8
11
14
10
6
27
9
4
13
17
9
6
11
16
9
6
10
19
8
6
23
10
0
1
2
3
4
5Not
Important
Somewhat
Important
Important
Very
Important
NA or
No Answer
State Local State Local State Local State Local
Capture
impact of
extreme
drought
Provides
appropriate
lead-time
before
entering
drought
Indicator is
widely
publicized
Easy
access to
indicator
data
Ability to
understand
how
indicator is
computed
State Local

105
indicator data” and “understand local indicator calculations.” So even though access to
the state level indicator data is less important, they do believe the indicator needs to be
“widely publicized.” But it is less important that a local indicator be publicized. Based
on dialogue with water system operators, publicizing the declaration level is more
important than publicizing the raw indicator data. They believe it is less important that
the local indicators are “widely publicized” as compared to the other local indicator
characteristics. Based on discussions with water system operators, many believe the raw
local indicators such as lake or well levels may not be helpful to their customers and
provision of numerical values will cause confusion. These results demonstrate that
drought indicators must meet a wide array of needs, and those needs vary among water
systems.
Question 3: Please rank the relative importance of these drought indicator
characteristics on a scale from 1 to 5 with 5 being most important. This question
builds on question 2 to help us understand your priorities better. (Each number
should be used only once.)
Question three further examines the importance of drought characteristics by
asking respondents to rank each characteristic on a scale from one to five (five being the
most important.) In question two, the respondent could select the same importance level
for all characteristics (i.e., select each as important), but in question three they are asked
to rank the characteristics from least (1) to most important (5). Seven out of the 43
respondents were excluded from this question’s analysis due to an incomplete response or
incorrect interpretation of the question. Table 5.14 displays the results from question
three for all systems and subdivided according to size. The number indicates an average
of system rankings. The results based on all systems indicate that “providing appropriate

106
lead-time before entering drought” is the most important drought characteristic (3.5).
However, having the drought “indicator widely publicized” and also “capturing the
impact of the extreme drought” received similar scores of 3.3 and 3.2 respectively. The
“ability to understand how the indicator is computed” was the least important. This was
the only characteristic that was statistically different than other indicators receiving the
lowest average score of 2.6. This characteristic was statistically different than “having
the indicator widely publicized” and the characteristic “providing appropriate lead time
before entering drought stage.”
Figure 5.13 provides a closer look at the number of systems that ranked each
category in question three. For example, twelve systems ranked “providing appropriate
lead-time before entering drought” as the most important. The least important
characteristic based on results from all systems is the ability of the user to “understand
how the indicator is computed” with a score of 94. Eleven respondents ranked it as the
lowest (value of 1). Only five systems ranked it as the highest (value of 5). Figure 5.13
shows a difference among systems on what are the most important drought
characteristics. Another interesting result was that only five water systems rated the
indicator’s “ability to capture the extreme event as most important”, but 13 rated it as the
second most important characteristic.
The subdivision by system size did uncover that size may be a factor in a water
system’s opinion of what characteristic(s) makes an effective drought indicator, however,
the differences were not statistically significant. Large systems surveyed indicated that
having the “indicators widely publicized” is most important (3.6), whereas small systems
responded this was one of the least important characteristics (2.9). For medium systems,

107
having the “indicators widely publicized” was tied with “providing appropriate lead-
time” as most important. “Providing appropriate lead-time before entering drought” was
either the most important or second most important characteristic regardless of size.
Medium and small systems do appear to be more interested in the “ability to understand
how indicators are computed,” while large systems rated this characteristic as the least
important.
Table 5.14 Average ranking for each drought indicator characteristic for all
systems and subdivided by system-size.
# of
Systems
*
Captures
impact of
extreme
drought
conditions
Ability to
understand
how
indicator
is
computed
Easy
access
to
indicator
data
Indicator
is widely
publicized
Provides
appropriate
lead time
before
entering
drought
stage
All 36 3.2 2.6 2.9 3.3 3.5
Large
Systems 17 3.2 2.2 3.2 3.6 3.4
Medium
Systems 10 2.9 3.0 2.7 3.2 3.2
Small
Systems 8 3.4 3.1 2.8 2.9 3.9
* 3 large systems excluded because of incorrect interpretation of the question
* 3 small and 2 large systems did not respond to question

108
5
13
8
4
6
5
7
4
9
11
7
5
9
9
6
11
5
6
10
4
12
8
7
3
6
0
1
2
3
4
55
4
3
2
1
Figure 5.13 Number of systems that ranked each category.
It also appears that water system source may be a factor that influences a water
system’s classification of indicator characteristic importance (Table 5.1), but the
differences are not statistically significant. The greatest difference is the system’s
“ability to understand how the indicator is computed.” Groundwater systems indicated
this was one of the most important characteristics while river and lake systems stated it
was one of their least important. Systems with a lake(s) as the source responded that
having “easy access to the indicator data” was most important. Groundwater systems
ranked it as least important. Overall for groundwater systems there was minimal
difference between the rankings for four of the five characteristics. Different
characteristics were identified as the most important by the 13 groundwater systems
resulting in the close average scores. Lake and river systems tend to have more of a
consensus within each group as to the one or two most important characteristics and,
likewise, the least important.
Captures
impact of
extreme
drought
conditions
Ability to
understand
how
indicator
is
computed
Easy
access to
indicator
Indicator
is widely
publicized
Provides
appropriate
lead time
before
entering
drought

109
Table 5.15 Average ranking for each drought indicator characteristic for all
systems and subdivided by system-source.
# of
Systems
*
Captures
impact of
extreme
drought
conditions
Ability to
understand
how
indicator is
computed
Easy
access to
indicator
data
Indicator is
widely
publicized
Provides
appropriate
lead time
before
entering
drought
stage
Lake
Systems 9 3.5 2.6 3.8 3.2 3.0
River
Systems 12 3.0 2.1 2.8 3.8 4.2
Ground-
water
Systems 13 3.1 3.2 2.5 3.1 3.2
* 3 lake systems, 1 river system, and 3
groundwater systems excluded b/c of answer
In summary, results from question two and three provide insight into how water
systems perceive the importance of drought indicator characteristics. The overall results,
including those subdivided by size and water source, demonstrate qualitative differences
among water systems on which drought characteristics are most important. No single
characteristic stands out as the most important among all water systems. In general, most
water systems believe the three most important drought characteristics are “providing
appropriate lead-time before entering drought stages,” “capturing the impact of the
extreme drought,” and the “indicator being widely publicized.” Many of the results,
however, are not statistically significant. Overall, most water systems surveyed selected
the “ability to understand how the indicator is computed” as the least important
characteristic.

110
Survey results demonstrate that water systems value both local and state drought
indicators, but, they have higher expectations and depend more heavily on their local
indicators. They want both the state and local indicators to capture the extreme drought
conditions, but they are less interested in understanding how the state indicators are
computed and having access to the state indicator data. They do, however, want the state
indicators widely publicized.
System-size and system source influenced the water systems’ opinion of what
characteristic(s) makes an effective drought indicator. Large and medium systems
indicated that having the “indicators widely publicized” is most important, whereas small
systems believed it to be least important. Medium and small systems were more
interested in the “ability to understand how indicators are computed,” while large systems
rate it as least important. Groundwater systems also are interested in the ability to
understand how indicators are computed. River and lake systems stated this was one of
their least important characteristics.
Another goal of the survey was to determine whether drought indicator
consistency between water systems and their alternative water providers (Question 6) and
consistency with upstream systems is a measure of drought planning effectiveness
(Question 7). The SCDNR urges water systems in the model S.C. Drought Management
Plan and Response Ordinance to have “cooperative agreements with alternative water
supply sources” to strengthen conservation efforts. Currently, systems that share water
have contracts that control the amount of water distributed between systems, but the
contracts don’t usually contain stipulations that reduce water amounts based on drought
severity and its impacts. Water system drought plans have response actions for the

111
system’s domestic users, but often do not for their contractual and wholesale customers.
Evaluations of water system local drought plans does not clearly demonstrate that water
systems have consistent plans and whether they believe integrated agreements are
important for effective drought planning.
While not specified in the model S.C. Drought Management Plan and Response
Ordinance, drought plan consistency with upstream users is encouraged by SCDNR.
Upstream users often control the flow of the river through releases from their dams or by
the amount of water they take from the river itself. Rivers are often the primary source
for downstream surface water users either directly or by feeding into downstream
reservoirs. This is a complicated process since many of the state’s rivers have multiple
reservoirs controlled by different users.
Question 6: How important is it to your system that your drought indicators are
consistent with drought indicators used by your alternative water providers? (Circle
either not important, somewhat important, important, very important, don’t know
or not applicable)
The results from question six are presented in Figure 5.14. Almost one-third of
systems surveyed said that drought indicator consistency with alternative water system
providers was not applicable. Two are river-based systems, six have a lake as their
source and six depend on groundwater. A review of their local drought plans available
on the SDNR Drought Management Plan and Response Ordinance Inventory website
(https://www.dnr.sc.gov/pls/drought/drought_survey_search) found that many of these
systems have no alternative providers and responded accordingly. For three systems, the
“not applicable” response is inconsistent with their local drought plans that state that
water conservation agreements with wholesale customers are needed and being
negotiated. It is unclear whether the conservation agreements would include consistent
112
indicators. Three systems have cooperative agreements with wholesale customers with
no plans to incorporate drought provisions in the agreements. Four of the systems did not
provide a system name so their local drought plan could not be reviewed.
Only two of the systems surveyed did not know whether indicator consistency
with alternative water providers is important. The remaining small systems (six) believe
indicator consistency with alternative providers is important or very important. The
sample size is reduced when the systems that responded “not applicable” are removed
from the comparisons. These responses were not included in the percentage comparisons
discussed below. Fewer of the large and medium systems believe indicator consistency
with alternative providers is important or very important (57 percent to 60 percent
respectively). System-source does seem to influence the results, but it should be noted
the survey size is small, especially for lake systems, after removing the “not applicable”
systems from the sample size. Of the six lake systems remaining, 83 percent responded
that indicator consistency with alternative water providers is important or very important.
Fifty percent of the river systems (five out of 10) and 67 percent of the groundwater
systems believe it is important or very important. Despite the S.C. Drought Management
Plan and Response Ordinance’s emphasis on “cooperative agreements with alternative
water providers,” many water systems don’t believe indicator consistency with
alternative water providers is important. Small systems and those using lakes as their
source-water do think it is important. There was no overlap between the small systems
and lake-based system responses. In many cases, the small system’s response can be
attributed to their dependence on alternative water providers as their primary water
source. In summary, indicator consistency with alternative water providers is a measure

113
4
of effectiveness for drought planning for some systems. There is not a clear consensus
among all water systems that this characteristic is important and the survey responses and
the local drought plans are somewhat inconsistent.
Figure 5.14 Drought indicator consistency with alternative water providers
summarized by system size. N=22 large systems, 10 medium, 10 small.
Question 7: How important is it to your system that your drought indicators are
consistent with drought indicators used by upstream systems? (Circle either not
important, somewhat important, important, very important, don’t know or not
applicable)
Question seven in the survey addressed the importance of drought indicator
consistency with upstream water systems and whether this is a measure of drought
planning effectiveness. The results are presented in Figure 5.15. Twelve systems or 28
percent responded it was not applicable. Seven of these were groundwater systems.
Unfortunately, this was a significant percentage of the medium and small systems
surveyed. One large, groundwater system responded they didn’t know. Six systems, (14
0%
10%
20%
30%
40%
50%
60%
70%
80%
90%
100%
Not
Applicable
Don't
Know
Not
Important
Some-
w hat
Important
Important Very
Important
Large Medium Small
7
3
1
4
2
4 3
3
3
1
5
5
1
1
Not
Applicable
Don't
Know
Not
Important
Some-
what
Important
Important Very
Important
Large Medium Small

114
percent), which were mostly all large providers (three groundwater systems, two lake
systems, and one river system), responded that indicator consistency with upstream water
systems was not important. Sixty-two percent of the remaining systems stated that
drought indicator consistency with upstream water systems is important or very
important.
System-size appears to influence the evaluation. The medium systems think
indicator consistency with upstream systems is important or very important (83 percent)
while only 61percent of the large systems and 40 percent of the small systems responded
as such. The sample size was only six for the medium systems. Two medium systems
are part of the basin-wide drought planning associated with the Low Inflow Protocols that
requires consistent drought indicators between upstream and downstream users.
System-source also appears to be a factor with 82 percent of river-based systems
responding that indicator consistency with upstream systems is important or very
important. This is expected since river-based systems are the most vulnerable to an
upstream user’s control of river flows. Only 37 percent of groundwater systems think
indicator consistency with upstream users is important. This is also expected since their
groundwater source does not depend on river flows. Approximately half of the lake
systems (55 percent) think indicator consistency with upstream water users is important.
Only one of the medium-sized systems retrieved their water from a river so there was no
overlap in this comparison.
In summary, indicator consistency with upstream water systems is a measure of
effectiveness for drought planning primarily for some surface water systems. There does
not seem to be a consensus among all water systems that it is important.

115
0%
10%
20%
30%
40%
50%
60%
70%
80%
90%
100%
Not
Applicable
Don't
Know
Not
Important
Some-
what
Important
Important Very
Important
Large Medium Small
5
4
1
3
1
1
3
1
3
4
12
2
754
Figure 5.15 Drought indicator consistency with upstream water systems
summarized by system size. N=22 large systems, 10 medium, 10 small.
5.11 Water system’s reconstruction of the 1998-2002 drought impacts
The purpose of question four is to determine the severity of drought experienced
by water systems during and coming out of the 1998-2002 drought. These assessments
are then compared to the historic sequences of drought (based on the S.C. Drought
Response Committee’s official declaration) to better understand the water systems’
vulnerability to drought impacts and the duration and severity of their impacts compared
to the Committee’s declaration. The survey dates begin in 2000 rather than 1998 when
the record drought began because the survey pre-test and development proved it was
difficult for respondents to specifically designate conditions for each month going back
more than five to seven years. Additional uncertainty and resulting biases should be

116
considered in interpreting the responses for earlier years. The average number of systems
responding that they did not know increased from 7 percent in 2006 to 23 percect in
2000. The survey was issued in March 2007, therefore it did not capture the 2007-2008
drought.
Question 4: For the years 2000-2006, or the periods you confidently remember,
please indicate which months your system was impacted by drought. Draw a line
through the drought-free months. Place an I for Incipient, M for Moderate, S for
Severe, or E for Extreme in each date block for the severity of drought your system
experienced. If you Don’t Know, mark the month DK.
Figures 5.16, 5.18, and 5.20 display the percentage of systems that experienced
the different levels of drought severity impacts for the period 2000-2001. Twelve out of
the 43 systems, or 28 percent, designated that their system never experienced drought
conditions during any month for the study period. At least one system in every month
did designate some level of drought. According to the S.C. Drought Response
Committee, the drought officially began during the summer 1998 and ended in April
2003; however, other brief drought periods were designated in 2004 and 2006. Figures
5.17, 5.19, and 5.21 display the percentage of the state in the highest level of drought
based on the S.C. Drought Response Committee’s declarations compared to the
percentage of water systems experiencing drought impacts. The drought was upgraded
and downgraded by the S.C. Drought Response Committee on numerous occasions, with
it reaching severe in 1999 and again in 2002. In July of 2002, the committee upgraded
the status to extreme, the highest level of drought according to the S.C. Drought
Response Act. The only years without some level of declaration by the committee were
2003 and 2005.
117
During early 2000, most of the systems (70 percent to 77 percent) indicated they
did not experience drought impacts (Figure 5.16). The official drought declaration by the
S.C. Drought Response Committee was in the first stage of drought, or incipient, through
April 2000 for most of the state (Figure 5.17). The Committee upgraded the state
declaration in May 2000 for parts of state. A moderate declaration remained in effect for
most of the state through 2000. As summer 2000 approached, more water systems
indicated they were experiencing moderate to severe conditions, but the percentage of
systems was still relatively low. During the study period, the trend was for a greater
number of water systems to experience higher levels of drought impacts during the
summer and early fall months when demand and evaporation are higher. Throughout
most of 2001, especially May to September, fewer systems experienced drought impacts
compared to 2000; however, by November 2001, one system indicated it was
experiencing extreme drought impacts.

118
Figure 5.16 Percentage of water systems experiencing drought impacts, 2000-
2001: a) 2000, b) 2001.
77 72 72 70 58 56
4
58 53 56 63 65 67
0
1
2
3
4
5
Dec-05 Feb-06 Mar-06 May-06 Jul-06 Aug-06 Oct-06 Dec-06
Extreme
Severe
Moderate
Incipient
No Drought
Jan Feb Mar Apr May Jun Jul Aug Sep Oct Nov Dec
a) 2000
77 72 72 72 65 65
4
74 67 72 70 70 72
0
1
2
3
4
5
Dec-05 Feb-06 Mar-06 May-06 Jul-06 Aug-06 Oct-06 Dec-06
Extreme
Severe
Moderate
Incipient
No Drought
Jan Feb Mar Apr May Jun Jul Aug Sep Oct Nov Dec
b) 2001

119
Figure 5.17 Percentage of the state in the highest level of drought based on the
S.C. Drought Response Committee’s declarations compared to the
percentage of water systems experiencing drought impacts during
2000-2001.
Based on the majority of actual drought indicators, the S.C. Drought Response
Committee declarations and results from the survey, summer 2002 was the height of the
drought with 40 percent of the water systems surveyed indicating some level of drought
(Figure 5.18). The official state declaration (Figure 5.19) reached severe by June 2002
and extreme, the highest level of drought, in July 2002 (for most of the state). The
number of water systems experiencing drought impacts increased throughout 2002 and
by August five systems were experiencing extreme drought impacts, seven experiencing
severe, and five experiencing incipient to moderate impacts.
According to actual indicator data, discussion with water systems, and survey
interpretation, 2003 was the year most sectors recovered from the 1998-2002 record
drought. There was no state declaration in place after April 2003. Survey results indicate
0
10
20
30
40
50
60
70
80
90
100
Ja
n-0
0
Fe
b-0
0
Ma
r-0
0
Ap
r-0
0
Ma
y-0
0
Ju
n-0
0
Ju
l-0
0
Au
g-0
0
Se
p-0
0
Oct-
00
No
v-0
0
De
c-0
0
Ja
n-0
1
Fe
b-0
1
Ma
r-0
1
Ap
r-0
1
Ma
y-0
1
Ju
n-0
1
Ju
l-0
1
Au
g-0
1
Se
p-0
1
Oct-
01
No
v-0
1
De
c-0
1
Pe
rce
nt
% of State in Incipient
% Water Systems in Drought
% of State in Moderate % of State in Extreme
% of State in Severe

120
a small percentage of the water systems continued to experience drought impacts through
December. For all months from January 2003 through December 2006, 70 percent of the
systems designated they were not in drought.
Figure 5.18 Percentage of water systems experiencing drought impacts, 2002-
2003: a) 2002, b) 2003.
77 72 70 63 51
4
49 44 44 58 72 77 77
0
1
2
3
4
5
Dec-05 Feb-06 Mar-06 May-06 Jul-06 Aug-06 Oct-06 Dec-06
Extreme
Severe
Moderate
Incipient
No Drought
Jan Feb Mar Apr May Jun Jul Aug Sep Oct Nov Dec a) 2002
77 77 77 77 74 81 84
5
84 86 81 81 81
0
1
2
3
4
5
Dec-05 Feb-06 Mar-06 May-06 Jul-06 Aug-06 Oct-06 Dec-06Jan Feb Mar Apr May Jun Jul Aug Sep Oct Nov Dec
Extreme
Severe
Moderate
Incipient
No Drought
b) 2003

121
Figure 5.19 Percentage of the state in the highest level of drought based on the
S.C. Drought Response Committee’s declarations compared to the
percentage of water systems experiencing drought impacts during
2002-2003.
Figure 5.20 shows that by 2004, only a few water systems experienced drought
impacts. The number of systems experiencing drought impacts increased slightly during
the summer months. The official state declaration was upgraded to incipient for one
month: June 2004 (Figure 5.21). During 2005, the lowest number of water systems
indicated drought impacts, with only one to three systems experiencing incipient or
moderate drought during any month. No state declaration occurred during 2005. By
summer 2006, a few more water systems stated they experienced drought impacts, but
these numbers decreased by late fall. The state declaration was upgraded to incipient in
August 2006 and to moderate in September 2006, but only for less than 35 percent of the
state.
0
10
20
30
40
50
60
70
80
90
100
Jan-0
2
Feb-0
2
Mar-
02
Apr-
02
May-0
2
Jun-0
2
Jul-02
Aug-0
2
Sep-0
2
Oct-
02
Nov-0
2
Dec-0
2
Jan-0
3
Feb-0
3
Mar-
03
Apr-
03
May-0
3
Jun-0
3
Jul-03
Aug-0
3
Sep-0
3
Oct-
03
Nov-0
3
Dec-0
3
Pe
rce
nt
% of State in Incipient
% Water Systems in Drought
% of State in Moderate % of State in Extreme
% of State in Severe

122
Figure 5.20 Percentage of water systems experiencing drought impacts, 2004-
2006: a) 2004, b) 2005, c) 2006.
84 84 84 77 74
3
74 77 79 79 84 86 86
0
1
2
3
4
5
Dec-05 Feb-06 Mar-06 May-06 Jul-06 Aug-06 Oct-06 Dec-06Jan Feb Mar Apr May Jun Jul Aug Sep Oct Nov Dec
Extreme
Severe
Moderate
Incipient
No Drought
a) 2004
88 88 86
3
84 84 86 84 84 84 86 88 88
0
1
2
3
4
5
Dec-05 Feb-06 Mar-06 May-06 Jul-06 Aug-06 Oct-06 Dec-06Jan Feb Mar Apr May Jun Jul Aug Sep Oct Nov Dec
Extreme
Severe
Moderate
Incipient
No
Drought
b) 2005
88 88 86 81
3
74 77 77 79 79 79 84 84
0
1
2
3
4
5
Dec-05 Feb-06 Mar-06 May-06 Jul-06 Aug-06 Oct-06 Dec-06Jan Feb Mar Apr May Jun Jul Aug Sep Oct Nov Dec
Extreme
Severe
Moderate
Incipient
No
Drought
c) 2006
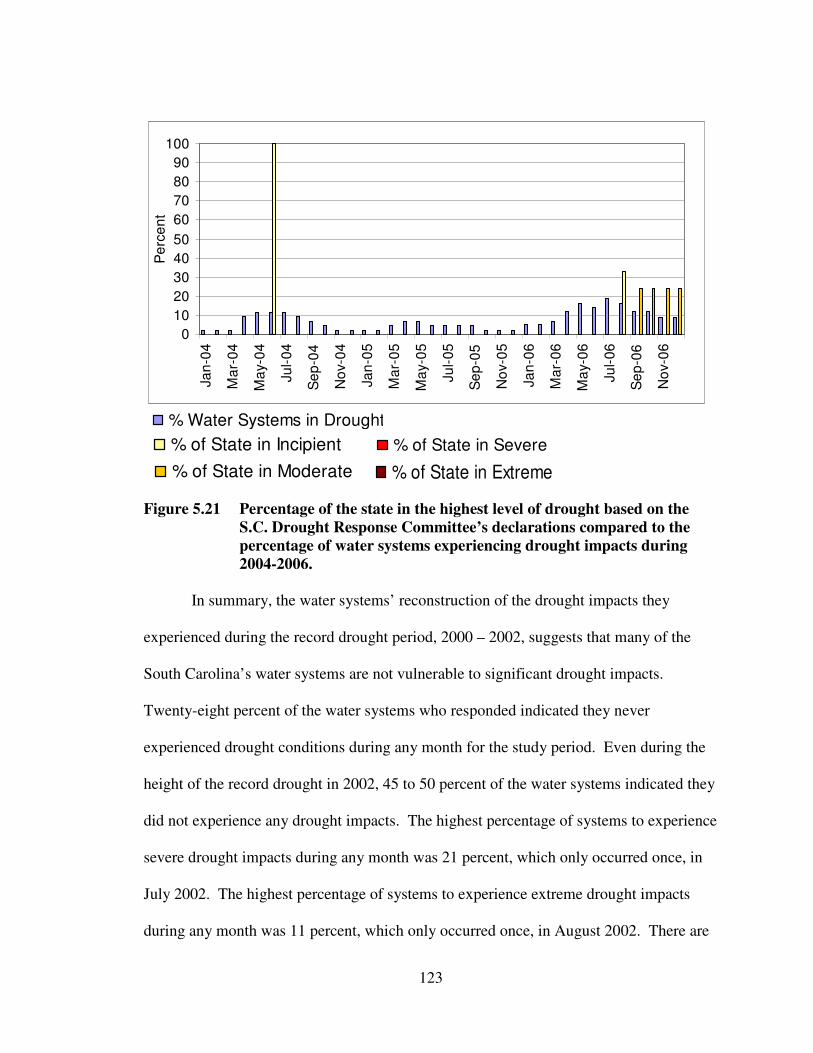
123
Figure 5.21 Percentage of the state in the highest level of drought based on the
S.C. Drought Response Committee’s declarations compared to the
percentage of water systems experiencing drought impacts during
2004-2006.
In summary, the water systems’ reconstruction of the drought impacts they
experienced during the record drought period, 2000 – 2002, suggests that many of the
South Carolina’s water systems are not vulnerable to significant drought impacts.
Twenty-eight percent of the water systems who responded indicated they never
experienced drought conditions during any month for the study period. Even during the
height of the record drought in 2002, 45 to 50 percent of the water systems indicated they
did not experience any drought impacts. The highest percentage of systems to experience
severe drought impacts during any month was 21 percent, which only occurred once, in
July 2002. The highest percentage of systems to experience extreme drought impacts
during any month was 11 percent, which only occurred once, in August 2002. There are
0
10
20
30
40
50
60
70
80
90
100
Ja
n-0
4
Ma
r-0
4
Ma
y-0
4
Ju
l-0
4
Se
p-0
4
No
v-0
4
Ja
n-0
5
Ma
r-0
5
Ma
y-0
5
Ju
l-0
5
Se
p-0
5
No
v-0
5
Ja
n-0
6
Ma
r-0
6
Ma
y-0
6
Ju
l-0
6
Se
p-0
6
No
v-0
6
Pe
rce
nt
% of State in Incipient
% Water Systems in Drought
% of State in Moderate % of State in Extreme
% of State in Severe

124
limitations to the survey data that should be considered. The results were limited to a
small subset of South Carolina water systems and it is difficult for water systems to
confidently and accurately recollect impacts on their system beyond one to three years.
The research results were, however, consistent with research conducted by Dow et. al.
(2007) on S.C. public water system vulnerability to climate hazards. Only 38 percent of
the systems they surveyed responded that they had experienced a drought emergency
during the five years prior to 2000.
Results from this research suggest that state level declarations do not always
represent the drought impacts experienced by most of South Carolina’s water systems.
The state declarations are usually at a higher severity level and tend to have a longer
duration than individual water system declarations. This is because the S.C. Drought
Response Committee’s declarations consider drought impacts on multiple sectors, i.e.
industry, electric power generation, agriculture, and forestry, with some sectors
experiencing slower long-term drought implications and others sensitive to short-term
changes. According to its chairman, the S.C. Drought Response Committee follows the
guidance of key drought indicators and the input of local representatives from four
drought management areas, but they make a conscious effort to avoid invoking and
revoking stages too frequently (de Kozlowski, personal communication, 2008). If
drought stages and associated management responses change too frequently, the
declarations will lack credibility and create confusion. De Kozlowski (2008) emphasized
that South Carolina’s drought response is based on the S.C. Drought Response Act,
which supports a two-tiered approach. The Committee’s declaration serves as a broad,
overarching representation of drought conditions in specific geographic areas of the state.

125
However, actual mitigation of drought impacts is conducted through planning and actions
at the local level by water systems, power companies, and industry. Results from the
survey and state declaration comparison further exemplify the importance of local
drought planning with system-specific drought indicators that are scientifically justified
and operationally relevant, but meet the operational needs of the user.
5.2 Power Company Survey Results
The following discussion focuses on results from the four power companies:
Santee Cooper, South Carolina Electric and Gas, Progress Energy, and Duke Energy.
Their names are omitted from the results and replaced with System 1 to System 4 (not in
the order listed above).
Question 1: What drought indicator(s) does your system use?
The power companies use local indicators provided in their Low Inflow Protocols.
Two companies stated they also consider the S.C. State Drought Committee’s
Declarations.
Question 2: How important is it to your system that drought indicators meet the
following criteria. If you use both State and Local drought indicators please
designate criteria for each. Choose Not Applicable if you only use indicators specific
to your system. (Circle 1 for Not Important, 2 for Somewhat Important, 3 for
Important, 4 for Very Important and 5 for Not Applicable).
Table 5.21 summarizes results from question 2 displaying power company
responses and their average numerical scores for each state and local drought indicator
characteristic. In general, power companies strongly believe that local indicators should
meet all five drought characteristics. The characteristic “having the local indicator
widely publicized” received an average score less than four. Some of the power

126
companies were less concerned that the state indicators meet the different criteria,
however, the differences were not statistically significant.
Among the different state indicator characteristics none of the averages were
statistically significant. The small sample size contributed to this as did categorical data.
The “ability to understand how the state indicators are computed” received the lowest
average rating (2.5) and “capturing the impact of the extreme event” (3.3) and “having
the state indicator widely publicized” received the highest average scores (3.5). One
power company designated in the “other criteria comment” field that having state and
local indicators correlate well with each other was important.
Table 5.21 Power company responses and average numerical scores for state and
local drought indicator characteristics.
Question 3: Please rank the relative importance of these drought indicator
characteristics on a scale from 1 to 5 with 5 being most important. This question
builds on question 2 to help us understand your priorities better. (Each number
should be used only once.)
Question three examined the importance of each drought characteristic by asking
power companies to rank them on a scale from one to five (five being the most important)
Captures
impact of
extreme
drought
conditions
Ability to
understand
how
indicator is
computed
Easy access
to indicator
data
Indicator is
widely
publicized
Provides
appropriate
lead time
before
entering
drought stage
System
Name
State Local State Local State Local State Local State Local
System 1 3 4 2 4 4 4 3 3 2 4
System 2 2 4 2 4 2 4 3 4 3 4
System 3 4 4 4 4 4 4 3 4 4 4
System 4 4 4 2 4 2 4 3 3 3 4
Average
Scores 3.3 4 2.5 4 3 4 3 3.5 3 4

127
using each number only once. There is little consensus on the most important
characteristic with three out of the four power companies selecting different
characteristics as most important (Table 5.22). Two rated having the indicator “provide
appropriate lead-time before entering drought” as the most important. System 2 rated the
“ability to understand how the indicator is computed” as most important. System 4 rated
“capturing the impact of the extreme drought” as most important. “Having the indicator
widely publicized” received the lowest average score (1.8) with three systems rating it as
least important; one system stated it was the second most important. The differences were
not statistically significant.
Table 5.22 Power company rankings for each drought indicator characteristic.
Some similarities between power companies and water systems become apparent
based on question 2 and question 3. Both groups are more interested in local indicators
than state indicators and having those indicators meet most or all of the criteria listed,
power companies more so than water systems. The high expectations of power
companies that the local drought indicators be multi-dimensional is probably influenced
by their recent experience in developing drought indicators for their Low Inflow
System
Name
Captures
impact of
extreme
drought
conditions
Ability to
understand
how
indicator
is
computed
Easy
access to
indicator
data
Indicator
is widely
publicized
Provides
appropriate
lead time
before
entering
drought stage
System 1 2 3 4 1 5
System 2 2 5 4 1 3
System 3 3 1 2 4 5
System 4 5 2 3 1 4
Average
Scores
3 2.8 3.3 1.8 4.3

128
Protocols. Their indicators were quickly tested during the severe drought of 2007-2008,
so most have witnessed the importance of indicators and also have experienced the
necessity of using multi-indicators to effectively trigger drought.
Power companies and water systems are less interested in understanding how
either the state or local indicators are computed compared to the importance of the other
characteristics. “Providing appropriate lead-time before entering drought” and “capturing
the extreme event” both received high scores for water systems and power companies,
indicating they are perceived as being important to very important. However, power
companies seem much less concerned the local drought indicators are “widely
publicized” as compared to the water systems. Follow-up discussion with power
company representatives confirmed that they believe having the Stage declaration and
required response publicized is very important, but not necessarily the individual
indicators that support the declaration.
Question 6: How important is it to your system that your drought indicators are
consistent with drought indicators used by your alternative water providers? (Circle
either not important, somewhat important, important, very important, don’t know
or not applicable)
The question was not relevant to power companies since it focused on the
importance of drought indicator consistency with alternative water providers.
Question 7: How important is it to your system that your drought indicators are
consistent with drought indicators used by upstream systems? (Circle either not
important, somewhat important, important, very important, don’t know or not
applicable)
Question 7 was especially relevant to power companies since their Low Inflow
Protocols emphasize consistent basin-wide drought planning. All four responded that it

129
was important or very important to have drought indicator consistency with upstream
water systems.
5. 21 Power Company’s reconstruction of the 1998-2002 drought impacts
Question 4: For the years 2000-2006, or the periods you confidently remember,
please indicate which months your system was impacted by drought. Draw a line
through the drought-free months. Place an I for Incipient, M for Moderate, S for
Severe, or E for Extreme in each date block for the severity of drought your system
experienced. If you Don’t Know, mark the month DK.
Figure 5.22 presents the power companies’ reconstruction of the drought severity
impacts to their operations during and coming out of the record drought of 1998-2002 for
the period 2000-2003. Errors may be introduced in the earlier years due to the duration
of time that has passed since 2000. None of the systems responded that they did not
know what drought impacts were experienced during the earlier years, but two companies
did not know what drought impacts they experienced in 2004 and 2005. Another
potential caveat to the data is that one company stated they experienced severe drought
impacts from January 2000 through December 2003, followed by a response that they
didn’t know the impacts during 2004-2005.
Beginning in May 2000 through 2001, most power companies indicated they
experienced moderate to severe impacts. One company’s response was surprisingly
different indicating the greatest impacts (extreme designation) from July 2000 to
December 2000. Most systems continued to experience moderate to severe conditions
into 2002, but by August 2002 all experienced severe conditions. The summer of 2002 is
considered to be the height of the record drought of 1998-2002. Above normal rainfall in
fall 2002 helped relieve conditions, and the state declaration was downgraded to incipient
in November 2002 and then to no drought by April 2003. Two of the power companies
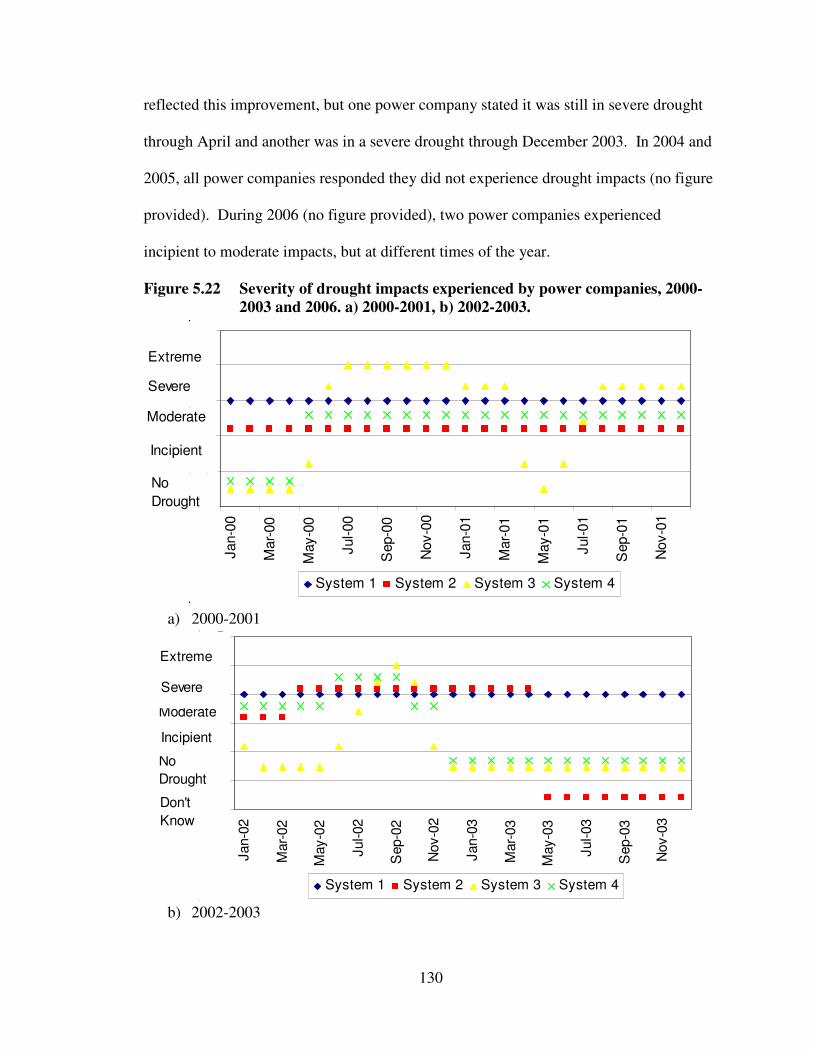
130
0
1
2
3
4
5
Jan-0
0
Mar-
00
May-0
0
Jul-00
Sep-0
0
Nov-0
0
Jan-0
1
Mar-
01
May-0
1
Jul-01
Sep-0
1
Nov-0
1
System 1 System 2 System 3 System 4
No
Drought
Moderate
Severe
Extreme
Incipient
reflected this improvement, but one power company stated it was still in severe drought
through April and another was in a severe drought through December 2003. In 2004 and
2005, all power companies responded they did not experience drought impacts (no figure
provided). During 2006 (no figure provided), two power companies experienced
incipient to moderate impacts, but at different times of the year.
Figure 5.22 Severity of drought impacts experienced by power companies, 2000-
2003 and 2006. a) 2000-2001, b) 2002-2003.
a) 2000-2001
b) 2002-2003
-1
0
1
2
3
4
5
Jan-0
2
Mar-
02
May-0
2
Jul-02
Sep-0
2
Nov-0
2
Jan-0
3
Mar-
03
May-0
3
Jul-03
Sep-0
3
Nov-0
3
System 1 System 2 System 3 System 4
No
Drought
Moderate
Severe
Extreme
Incipient
Don't
Know

131
The power companies’ reconstruction of the 2000 – 2006 study period was
different from the reconstruction by water systems. According to the survey results,
power companies are impacted more by drought with the impacts lasting longer. All
power companies indicated they experienced severe drought conditions on several
occasions whereas only 21percent of the water systems surveyed stated they ever
experienced severe drought. Only one power company stated they experienced extreme
drought conditions; these impacts lasted six months during 2000 and again for one month
in September 2002. The 2000 extreme impacts were not consistent with conditions
experienced by water systems nor with the state’s moderate declaration that was in place.
5.3 Survey Implications and Future Research
The survey reflects the challenge that drought affects a wide variety of sectors
across diverging time scales, making it difficult to define and measure. The survey
results demonstrate that water systems and power companies value local and state
drought indicators, however, they tend to have higher expectations and depend more
heavily on their local indicators. They need the drought indicator(s) to be multi-
dimensional, but have differing opinions on which characteristics comprise the most
effective drought indicator.
In general, two of the more important characteristics relate directly to the
indicator’s depiction of drought; “having the indicator capture the impact of the extreme
drought” conditions and the “ability of the indicator to provide appropriate lead-time
before entering drought.” Based on results from the drought reconstruction and from a
review of water system local drought plans and power company LIPs, lead-time
differences are based on system-size, system-source, drainage area, and natural and man-

132
made demands on the system. Some systems can transition in and out of stages at bi-
weekly time scales. Whereas, other systems need one month or longer lead-times.
Additional research is needed to more closely determine these influences.
Many water systems don’t believe indicator consistency with alternative water
providers is important. A higher consensus exists among small systems and those using
lakes as their source-water that consistency with alternative water providers is important.
There is less of a consensus among water systems that indicator consistency and
consistent drought planning is important between upstream and downstream systems.
Even though the sample size is small, system-size and source do seem to influence
response, so additional research using a larger sample size would be valuable in affirming
and expanding the analysis.
The water systems’ reconstruction of the drought impacts they experienced during
the record drought period, 2000 – 2002, suggests that many of the South Carolina’s water
systems are not vulnerable to significant drought impacts. Twenty-eight percent of the
water systems who responded indicated they never experienced drought conditions
during any month for the study period. Even during the height of the record drought in
2002, 45 – 50 percent of the water systems indicated they did not experience any drought
impacts. Survey results suggest that power companies are impacted more by drought
with the impacts lasting longer. All power companies indicated they experienced severe
drought conditions on several occasions. Additional research should be conducted on a
larger subset of water systems. Since this survey did not include a reconstruction of the
2007-2008 drought a follow-up survey could be conducted for confirmation and

133
comparison. The survey ideally should be conducted immediately following the drought
since the respondents memory can be biased over time.

134
CHAPTER 6 CONCLUSION
The persistent drought that impacted South Carolina over the past decade brought
to the forefront many water management issues that can no longer be ignored. Ensuring
sustainable water resources to meet the growing demand requires better management of
existing supplies. The drought reinforced the need for improved coordination and
planning within and between levels of government and water users. The value of
preparing for, detecting, and responding to drought conditions has increased in
importance and prominence not only in South Carolina, but nationally.
The backbone of the drought planning process is the identification of drought
indicators that link the drought conditions to the responses. Determining the drought
indicators and triggers, however, is no easy task given the complexity of drought.
Drought affects a wide variety of sectors across divergent time scales, making it difficult
to define and measure. This research enhanced South Carolina’s drought response by
evaluating the spatial and temporal distribution of drought intensity and frequency as
indicated by South Carolina’s state indicators and the recently defined FERC Low Inflow
Protocol (LIP) indicators for the Catawba-Wateree and Yadkin-Pee Dee basin. Indicator
discrepancies were identified and recommendations provided for improving the
indicators at both the state level and in the LIP. The study addressed the link between the
indicator scientific justification and operational relevancy by evaluating water systems’
and power company’s vulnerability to drought, their understanding of drought indicators,
and which drought indicator characteristics provide the most effective drought response.

135
This research adds to the limited literature on developing drought indicators.
Similar research has been conducted on drought indicators and plans for the
Apalachicola-Chattahoochee-Flint river basin, (Steinemann, A., 2003), Seattle,
Washington, (Fisher et al., 1997), and for the State of Georgia, (Palmer et al., 2002;
Steinemann et al., 2006). This research provides the first detailed drought indicator
analysis for South Carolina and for the newly formed FERC LIP’s for the Catawba-
Wateree and Yadkin-Pee Dee river basins. The research also benefits from the inclusion
of survey information from 43 water systems and the four major power companies in
South Carolina. The study implements key components of the National Integrated
Drought Information System federal initiative that calls for integrated drought research
and information at relevant spatial scales to facilitate proactive decisions.
The analysis identified significant discrepancies between the state indicators
detection of drought. Several state indicators suggest South Carolina is in some level of
drought 50 to 60 percent of the time while others show drought impacting the state only
20 percent of the time. Based on the streamflow triggers, the state’s streams are in
drought only 6 percent of the time. The inconsistencies among many of the indicators
can be attributed to the inconsistencies in the drought level ranges defined by the S.C.
Drought Response Act’s regulations. These inconsistencies create confusion for the S.C.
Drought Response Committee and S.C. water users. The S.C. Drought Response
Committee should consider revising the trigger levels. The research confirmed
recommendations by Steinemann (2005) that transforming indicators to percentiles is a
viable solution for using multiple and often statistically inconsistent indicators. The
triggers could be based on percentiles rather than raw indicator values. The decision

136
maker can relate triggers to the concept of return periods or probabilities of occurrence
and the trigger values associated with each drought level would be consistent.
The evolution and implementation of the drought plans or LIPs in the Yadkin-
Pee Dee and Catawba-Wateree FERC licenses identified or demonstrated the need for
additional research on drought indicator validation. The LIPs were new to the relicensing
process for the two basins and the identification of drought indicators and trigger points
presented challenges to the licensee (Duke Energy, Alcoa Yadkin, and Progress Energy)
and the stakeholders. Additional questions have been raised as to the effectiveness of the
proposed indicators in the LIP, due to conditions experienced in the most recent drought
that began in 2006 and is ongoing through June 2008. These research results show
significant discrepancies between the LIP indicators especially during the drought
recovery phase. These discrepancies cause the greatest challenge for the stakeholders in
the Catawba-Wateree basin since their LIP can not be downgraded until all indicators,
including groundwater levels, reflect a lower drought stage.
Suggestions based on this research include shortening the 6-month streamflow
average in Duke’s LIP to avoid the slower recovery. The Catawba-Wateree Drought
Management Advisory Group should investigate using the SPI 6-month indicator or the
SPI 9-month indicator as a possible replacement for the 3-month average DM in the LIP.
Transforming indicators to percentiles and then combining the multiple indices using
blends or weights did not improve drought detection over the use of single indicators.
Duke should also consider adding a recovery condition based on the storage returning to
a certain elevation which would automatically lower or cancel the LIP regardless of the
other indicator’s stages. Since the storage elevation is a key indicator for determining

137
water availability in LIP river basins, adding a recovery condition based solely on storage
should be investigated by Duke, CWDMAG and other entities developing LIPs in South
Carolina. The recovery from the LIP should consider both a slow recovery where all
indicators must reach a lower level before the stage is lowered to a more rapid recovery
that accounts for the storage recovering to a certain elevation for a user-determined time
period. Stakeholders and system operators in the Yadkin-Pee Dee Basin confirm that the
two additional recovery criteria based on storage in Alcoa/Progress Energy’s LIP
provided them with a more accurate representation of the drought’s true impact on their
system and compensated for the inconsistency in the indicators based on 3-month
streamflow and the 3-month average DM.
A key contribution of the study was the survey’s identification of water systems’
and power company’s vulnerability to drought, their understanding of drought indicators,
and which drought indicator characteristics provide the most effective drought response.
The survey results demonstrate that water systems and power companies value local and
state drought indicators, however, they have higher expectations and depend more
heavily on their local indicators. They need the drought indicator(s) to be multi-
dimensional, but have differing opinions on which characteristics comprise the most
effective drought indicator. In general, two of the more important characteristics relate
directly to the indicator’s depiction of drought; “having the indicator capture the impact
of the extreme drought” conditions and the “ability of the indicator to provide appropriate
lead-time before entering drought.”
Despite the S.C. Drought Management Plan and Response Ordinance’s emphasis
on “cooperative agreements with alternative water providers” some water systems don’t

138
believe indicator consistency with alternative water providers is important. There is also
less consensus among water systems that indicator consistency and consistent drought
planning is important between upstream and downstream systems. Additional education
is needed to demonstrate the importance. A possible model that could be followed for
building consensus among drought plans is the FERC LIP for the Catawba-Wateree river
basin. Numerous water systems, agencies and stakeholders from two states, and the
power company worked together to develop a drought plan with consistent drought
indicators that has been implemented and enforced by the majority of the water systems
in the basin. Even though there are concerns over the indicators, the protocol includes a
mechanism for making future enhancements and the overall basin-wide drought response
has been successful.
Results from the survey suggest that state level declarations do not always
represent the drought impacts experienced by many of South Carolina’s water systems.
The state declarations are usually at a higher severity level and tend to have a longer
duration than individual water system declarations. The S.C. Drought Response
Committee’s declaration considers the drought impact on multiple sectors, with some
sectors experiencing slower long-term drought implications and others that are sensitive
to short-term changes. Results from the survey and state declaration comparison further
exemplify the importance of local drought planning with system-specific drought
indicators that are scientifically justified, but meet the operational needs of the user.
Additional research should be conducted on a larger subset of water systems. Since this
survey did not include a reconstruction of the 2007-2008 drought, a follow-up survey
could be conducted for confirmation and comparison.

139
Central to the discipline of geography, this research implements techniques to
better investigate hazards due to climate and hydroclimate variability (Gaile, G., and
Willmott, C., 2003). The research contributes to the literature focused on understanding
physical and spatial characteristics of drought and resulting impacts. The engagement of
users through the survey and additional dialogue helps bridge the gap between the
physical aspects of drought and resource management. The research also demonstrates
the challenges underlying effective decision support (Dow, K. and G. Carbone, 2007).
The research results can be used to improve planning and coordination within and
between levels of government and water users to help reduce society’s vulnerabilities to
drought and ensure sustainable water to meet growing demands.

140
REFERENCES
Alley, W. (1984), The Palmer Drought Severity Index: limitations and assumptions,
Journal of Climate and Applied Meteorology, 23, 1100-1109.
Badr, A.W. (2008), South Carolina Department of Natural Resources, Personal
Communication.
Carbone, G.J., and K. Dow (2005), Water resources management and drought forecasts in
South Carolina, Journal of American Water Resources Association, 41, 145-155.
Carbone, G.J., J. Rhee, H.P. Mizzell, and R. Boyles (2008), A Regional–Scale Drought
Monitoring Tool for the Carolinas, Bulletin of American Meteorological Society,
89(1), 20-28.
Catawba-Wateree Project, Federal Energy Regulatory Commission No. 2232 (2006),
Comprehensive Relicensing Agreement.
Cherkauer, K. A., L. C. Bowling, and D. P. Lettenmaier (2003), Variable infiltration
capacity cold land process model updates, Global and Planetary Change, 38, 151-
159.
Climate Prediction Center (2002), Palmer and Crop Moisture Indices,
http://www.cpc.ncep.noaa.gov/products/analysis_monitoring/cdus/
palmer_drought/index.html
Cook, E.R., M.A. Kablack, and G.C. Jacoby (1988), The 1986 Drought in the
Southeastern United States; how rare an event was it? Journal of Geophysical
Research, 93(D11), 14257-14260.
De Kozlowski, S. (2008), South Carolina Department of Natural Resources, Personal
Communication.
Dow, K., and G. Carbone (2007), Climate Science and Decision Making, Geography
Compass, 1(3), 302–324.
Dow, K., R. O’Connor, B. Yarnal, G. Carbone, and C. Jocoy (2007), Why worry?
Community water system managers’ perceptions of climate vulnerability, Global
Environmental Change, 17, 228–237.

141
Dracup, J.A., K.S. Lee, and E.G. Paulson, Jr. (1980), On the Definition of Droughts,
Water Resources Research, 16(2), 297-302.
Eubanks, M. (2005), South Carolina Farm Bureau, Personal Communication.
Fisher,S., and R.N. Palmer (1997), Managing Water Supplies During Drought: Triggers
for Operational Responses, Water Resources Update, 3(108), 14-31.
Haines, D.A, and V.J. Johnson, W.A. Main (1976), An Assessment of Three Measures of
Long-term Moisture Deficiency Before Critical Fire Periods, U.S. Government
Printing Office, 1976-669-587/ 159 Region No. 6.
Hayes M.J., M.D. Svoboda, D.A. Wilhite, and O.V. Vanyarkho (1999), Monitoring the
1996 Drought Using the Standardized Precipitation Index, Bulletin of the
American Meteorological Society, 80(3), 429-438.
Heim, R.R. (2005), Computing the Monthly Palmer Drought Index on a Weekly Basis: A
Case Study Comparing Data Estimation Techniques, Geophysical Research
Letters, 32 (L06401).
Heim, R.R. (2002), A Review of Twentieth-Century Drought Indices Used in the United
States, Bulletin of the American Meteorological Society, 83(8), 1149-1165.
Heim, R.R.; S.E. Stephens; K.G. Gleason, and J.H. Lawrimore (2002), Drought
Monitoring Activities in NCDC’s Climate Monitoring Branch; 13th
Conference on
Applied Climatology, Portland, Oregon.
Hrezo, M.S., P.G. Bridgeman, and W.R. Walker (1986), Managing Droughts Through
Trigger Mechanisms, Journal of American Water Works, 46-51.
Gaile, G., and C. Wilmott (2003), Geography in America at the Dawn of the 21st Century,
Oxford University Press, 1-43.
Glantz, M., and W. Degefu (1990), Drought Issues of the 1990s, Proceedings of the
Second World Climate Conference, 253-263.
Gellici, J.A., M. Kiuchi, S.L. Harwell, and A.W. Badr (2004), Hydrologic Effects of the
June 1998-August 2002 Drought in South Carolina, South Carolina Department
of Natural Resources Open File Report, Columbia, S.C.
Guttman, N.B., J.R. Wallis, and J.M. Hosking (1992), Spatial Comparability of the
Palmer Drought Severity Index, Water Resources Bulletin, 28(6), 1111-1119.
Guttman, N.B. (1998), Comparing the Palmer Drought Index and the Standardized
Precipitation Index, Journal of the American Water Resources Association, 34(1),
113-121.

142
Guttman, N., and R. Quayle (1996), A historical perspective of U.S. climate
divisions, Bulletin of the American Meteorological Society, 77(2), 293–304.
Janis, M.J., M. Johnson, and G. Forthun (2002), Near Real-Time Mapping of the Keetch-
Byram Drought Index in the Southeastern United States, International Journal of
Wildland Fire, 11(4), 281 – 289.
Karl, T.R. (1986), The Sensitivity of the Palmer Drought Severity Index and Palmer’s Z-
Index to Their Calibration Coefficients Including Potential Evapotranspiration,
Journal of Climate and Applied Meteorology, 25, 77-86.
Karl, T.R., F. Quinlan, and D.S. Ezell (1987), Drought Termination and Amelioration: Its
Climatological Probability, Journal of Climate and Applied Meteorology, 26,
1198-1209.
Keetch J., and G. Byram (1968), A Drought Index for Forest Fire Control, Research
Paper SE-38, Asheville, N.C.: U.S. Department of Agriculture, Forest Service,
Southeastern Forest Experiment Station, 32 pp. (Revised 1988).
Keyantash, J., and J. Dracup (2002), The Quantification of Drought: An Evaluation of
Drought Indices, Bulletin of the American Meteorological Society, 83(8), 1167-
1180.
Knutson, C., and M.J. Hayes (2001), South Carolina Drought Mitigation and
Response Assessment: 1998-2000, Drought, Natural Hazards Research and
Applications Information Center Quick Response Report #136.
Lineberger M. (2008), Duke Energy spokesperson, Personal Communication.
McKee, T.B., N.J. Doesken, and J. Kleist (1993), The relationship of drought frequency
and duration of time scales. Eighth Conference on Applied Climatology,
American Meteorological Society, Jan 17-23, 1993, Anaheim CA, 179-186.
Mizzell H., and V. Lakshmi (2004), American Geophysical Union, Water: Science,
Policy, and Management, edited by R. Lawford, D. Fort, H. Hartmann, and S.
Eden, Water Resources Monograph Series, 16.
Motha, R. (2000), Recommendations on Drought Monitoring by the U.S. National
Drought Policy Commission, Proceedings of an Expert Group Meeting,
September 5-7, 2000, Lisbon, Portugal. Eds: D.A. Wilhite, M.V.K. Sivakumar
and D. A. Wood.
National Water Summary 1988-1989 - Hydrologic Events and Floods and
Droughts (1991), 2375, United States Geological Survey, United States
Government Printing Office, Denver, Colorodo.

143
NCDC (1994), Time Bias Corrected Divisional Temperature-Precipitation-Drought
Index. Documentation for dataset TD-9640. Available from DBMB, NCDC,
NOAA, Federal Building, 37 Battery Park Ave. Asheville, NC 28801-2733.
12pp.
Olson, M. (2008), Alcoa Power Generating, Inc., Personal Communication.
Palmer, W.C. (1965), Meteorological Drought. Research Paper No. 45, U.S. Department
of Commerce Weather Bureau, Washington, D.C.
Palmer, W.C. (1968), Keeping track of crop moisture conditions, nationwide: The new
Crop Moisture Index, Weatherwise, 21, 156–161.
Palmer, R.N., S.L. Kutzing, and A. Steinemann (2002). Developing Drought Triggers and
Drought Responses: An Application in Georgia. Proceeding of the World Water
and Environmental Resources Congress, ASCE, Roanoke, Virginia, May 19-22.
Rhee, J. (2007), A Regional Drought Monitoring System for the Carolinas, Ph.D.
Dissertation, Department of Geography, University of South Carolina.
Rhee, J., and G. J. Carbone (2007), A comparison of weekly monitoring methods of the
Palmer Drought Index, Journal of Climate, 20, 6033–6044.
Rouse, R. R., M. Perry, J. Purvis, and A. Zupan (1985), South Carolina Drought
Response Plan, AR-18, South Carolina Water Resources Commission.
South Carolina Climate (2003), South Carolina Department of Natural Resources,
http://www.dnr.sc.gov/climate/sco/ClimateData/cli_sc_climate.php#drought.
South Carolina Drought Response Act of 1985, South Carolina Code of Laws, 1985.
South Carolina Drought Response Act of 2000, South Carolina Code of Laws, 2000.
South Carolina Department of Natural Resources On-line Archived Drought Status,
http://www.dnr.sc.gov/climate/sco/Drought/drought_press_release.php, 2008
South Carolina State Hazard Mitigation Plan (2004), South Carolina Emergency
Management Division, Columbia, S.C.
South Carolina Water Plan – second edition (2004), South Carolina Department of
Natural Resources, Columbia, S.C.
Steinemann, A. (2003), Drought Triggers: A stochastic Approach to Evaluation.
Journal of the American Water Resources Association, 39(5), 1217-1234.

144
Steinemann, A.; M. Hayes, and L. Cavalcanti (2005), Drought Indicators and Triggers,
Drought and Water Crises; Science, Technology, and Management Issues, edited
by D. Wilhite, Marcel Dekker, NY, 72-90.
Steinemann, A., and L. Cavalcanti (2006), Developing Multiple Indicators and Triggers
for Drought Plans, ASCE Journal of Water Resources Planning and Management,
132(3), 164-174.
Svoboda, M., D. LeComte, M. Hayes, R. Heim, K. Gleason, J. Angel, B. Rippey, R.
Tinker, M. Palecki, D. Stooksbury, D. Miskus, and S. Stephens (2002), The
Drought Monitor, Bulletin of the American Meteorological Society, 83(8), 1149-
1165.
U.S. Agriculture Secretary Disaster Declaration, U.S. Department of Agriculture, 1998.
Wells, N., S. Goodard, M.J. Hayes (2004), A Self-Calibrated Palmer Drought Severity
Index, Journal of Climate, 17, 2335-2350.
Western Governors Assocation (2004), Creating a Drought Early Warning System for the
21st Century: The National Integrated Drought Information System (NIDIS),
Denver, Colorado.
Wilhite, D.A., M.J. Hayes, and C. Knutson (2005), Drought Preparedness Planning:
Building Institutional Capacity, Drought and Water Crises; Science, Technology,
and Management Issues, edited by D. Wilhite, Marcel Dekker, NY., 94-134.
Wilhite, D.A. (1993), The Enigma of Drought, in Drought Assessment, Management, and
Planning, Theory and Case Studies, edited by D. A. Wilhite, Kluwer Academic
Publishers, Nowell, M.A., 3-15.
Wilhite, D.A. (1993), Planning for Drought: A Methodolody, in Drought Assessment,
Management, and Planning, Theory and Case Studies, edited by D. A. Wilhite,
Kluwer Academic Publishers, Nowell, M.A., 97-108.
Wilhite, D.A. and M.H. Glantz (1985), Understanding the Drought Phenomenon: The
Role of Definitions, Water International, 10, 111-120.
Wu, H., M.J. Hayes, D.A. Wilhite, and M.D. Svoboda (2005), The Effect of the Length
of Record on the Standardized Precipitation Index Calculation, International
Journal of Climatology, 25, 502-520.
Yadkin Hydroelectric Project (2007), Federal Energy Regulatory Commission No. 2197,
Relicensing Settlement Agreement.

146
March 11, 2007
Water System or Power Generating System Point of Contact
Address
City, State, Zip Code
This survey is being conducted as part of my dissertation work on South Carolina’s Drought
Planning Process. I’m a Ph.D. student at the University of South Carolina. I also work as the
State Climatologist for South Carolina, which has given me the privilege to work with many of
you over the past fourteen years. I’ve spent the majority of both my work and school career
focusing on research and methods to improve South Carolina’s response to drought. The purpose
of the survey is to gain a better understanding of what makes an effective drought indicator and
which indicators represent the drought’s true impacts on water resources.
Drought impacts are difficult to quantify because drought episodes can be devastating for one
sector, but less severe for others. As the demand for water continues to increase, decision-makers
and stakeholders are realizing the importance of planning for drought. Effective drought planning
depends on indicators and triggers that characterize drought conditions and guide drought
responses. The goal of this survey and my research is to identify what makes an effective drought
indicator through scientific evaluation of the indices in combination with a better understanding
of water user needs and drought tolerance. Your system as well as the State will benefit by
having a better understanding of which drought indicators consistently trigger appropriate
drought phases, provide adequate indication of drought severity, and thus yield the greatest
decision-making value.
Please complete the survey and return it using the enclosed self-addressed envelope by April 18,
2007. My research and data analysis will focus on group responses rather than results from
individual surveys. You are not asked to indicate your name or the company’s name in order to
keep the information anonymous. However, if you are willing to share this information please
enter it on the last page. This will allow me to compare your responses to numerical drought data
for your area. By completing and returning the survey you are indicating your consent for the
information to be used in the research. Thank you for your participation in this survey and for
your efforts to insure that South Carolina has adequate supplies of quality water on a sustained
basis.
Sincerely,
Hope Mizzell,
Ph.D. Candidate
University of South Carolina -Department of Geography
Callcott - 709 Bull Street
Columbia, SC 29208
Phone: 803-530-5793
Participation in this
survey is completely
voluntary and you
may terminate your
participation at
anytime.

147
Drought Monitoring Survey
1.) What drought indicator(s) does your system use?
______________________________________________________________________________
______________________________________________________________________________
2.) How important is it to your system that drought indicators meet the following criteria. If
you use both State and Local drought indicators please designate criteria for each. Choose
Not Applicable if you only use indicators specific to your system. (Please circle the number
for each criteria)
Examples of Indicators used by the State Drought Management Committee in Drought
Declarations include: Palmer Drought Severity Index, U.S. Drought Monitor, Keetch Byram
Drought Index
Examples of Local or System Specific Indicators include: Reservoir Elevation, Streamflow,
Number of Days Supply Remaining. Your system may use other indicators including those used
by the State Drought Management Committee. Please use the indicators specified in your
system’s drought management plan to answer questions on local indicators below.
Other Criteria: ___________________________________________________________
_________________________________________________________________________
Capture the
impact of
extreme drought
conditions
Your ability to
understand how
the indicator is
computed
Easy to access the
indicator data
Drought indicator
is widely
publicized
Provides
appropriate lead
time before
entering drought
stage
Not
Important
1
Somewhat
Important
2
Important
3
Very
Important
4
Not
Applicable
5
State Indicators 1 2 3 4 5
Local Indicators 1 2 3 4 5
State Indicators 1 2 3 4 5
Local Indicators 1 2 3 4 5
State Indicators 1 2 3 4 5
Local Indicators 1 2 3 4 5
State Indicators 1 2 3 4 5
Local Indicators 1 2 3 4 5
State Indicators 1 2 3 4 5
Local Indicators 1 2 3 4 5

148
3. Please rank the relative importance of these drought indicator characteristics on a
scale from 1 to 5 with 5 being most important. This question builds on question 2 to help
us understand your priorities better. (Each number should be used only once.)
Capture the impact of extreme events ______________
Your ability to understand how the index is computed ______________
Easy to access the indicator data ______________
Drought indicator is widely publicized ______________
Provides appropriate lead time before entering drought stage ______________
4.) For the years 2000-2006, or the periods you confidently remember, please indicate which
months your system was impacted by drought. For the years that you remember, please
draw a line through the drought-free months. Place an I, M, S, or E in each date block for
the severity of drought your system experienced. If you Don’t Know, mark the month DK.
I=Incipient M=Moderate S=Severe E=Extreme DK=Don’t know
(Drought beginning) Impacts Impacts Impacts
Draw a line through months without drought
For Example
January February March April May June
DK ----------- ----------- ----------- --------- I
July August September October November December
M S I ----------- ------------ DK
2006
January February March April May June
July August September October November December
2005
January February March April May June
July August September October November December
2004
January February March April May June
July August September October November December

149
2003
January February March April May June
July August September October November December
2002
January February March April May June
July August September October November December
2001
January February March April May June
July August September October November December
2000
January February March April May June
July August September October November December
5.) List other periods and the drought severity level when your system experienced drought
impacts. Please indicate months and years, e.g. July-Sept/1986 (as far back as you can
confidently identify them):
______________________________________________________________________________
______________________________________________________________________________
6.) How important is it to your system that your drought indicators are consistent with
drought indicators used by your alternative water providers? (Please circle)
7.) How important is it to your system that your drought indicators are consistent with
drought indicators used by upstream systems? (Please circle)
8.) System Primary Water Source(s) (please circle):
Lake River Groundwater Well
Number of people served (please circle if applicable): <3,300 3,301-10,000 >10,001
Name of System (optional) ____________________________________
Not
Important
Very
Important Somewhat
Important
Important
Don’t know Not
Applicable
Not
Important
Very
Important Somewhat
Important
Important
Don’t know
Not
Applicable
Thank You