Embed Size (px)
Citation preview
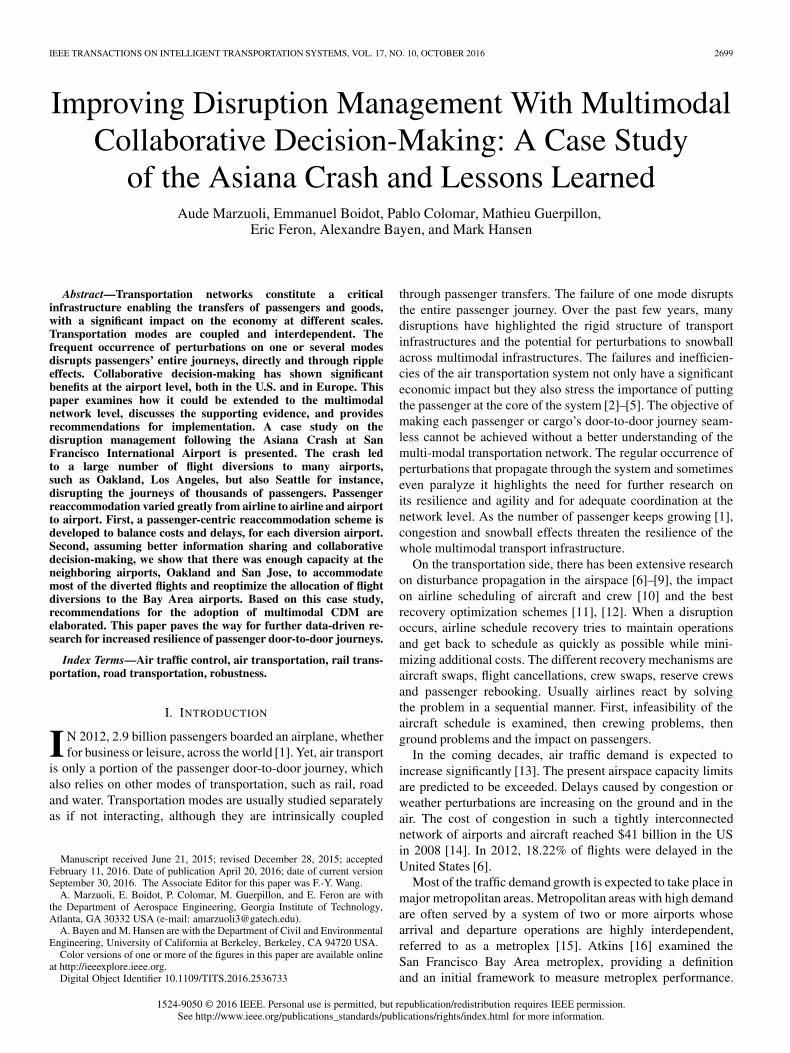
IEEE TRANSACTIONS ON INTELLIGENT TRANSPORTATION SYSTEMS, VOL. 17, NO. 10, OCTOBER 2016 2699
Improving Disruption Management With MultimodalCollaborative Decision-Making: A Case Study
of the Asiana Crash and Lessons LearnedAude Marzuoli, Emmanuel Boidot, Pablo Colomar, Mathieu Guerpillon,
Eric Feron, Alexandre Bayen, and Mark Hansen
Abstract—Transportation networks constitute a criticalinfrastructure enabling the transfers of passengers and goods,with a significant impact on the economy at different scales.Transportation modes are coupled and interdependent. Thefrequent occurrence of perturbations on one or several modesdisrupts passengers’ entire journeys, directly and through rippleeffects. Collaborative decision-making has shown significantbenefits at the airport level, both in the U.S. and in Europe. Thispaper examines how it could be extended to the multimodalnetwork level, discusses the supporting evidence, and providesrecommendations for implementation. A case study on thedisruption management following the Asiana Crash at SanFrancisco International Airport is presented. The crash ledto a large number of flight diversions to many airports,such as Oakland, Los Angeles, but also Seattle for instance,disrupting the journeys of thousands of passengers. Passengerreaccommodation varied greatly from airline to airline and airportto airport. First, a passenger-centric reaccommodation scheme isdeveloped to balance costs and delays, for each diversion airport.Second, assuming better information sharing and collaborativedecision-making, we show that there was enough capacity at theneighboring airports, Oakland and San Jose, to accommodatemost of the diverted flights and reoptimize the allocation of flightdiversions to the Bay Area airports. Based on this case study,recommendations for the adoption of multimodal CDM areelaborated. This paper paves the way for further data-driven re-search for increased resilience of passenger door-to-door journeys.
Index Terms—Air traffic control, air transportation, rail trans-portation, road transportation, robustness.
I. INTRODUCTION
IN 2012, 2.9 billion passengers boarded an airplane, whetherfor business or leisure, across the world [1]. Yet, air transport
is only a portion of the passenger door-to-door journey, whichalso relies on other modes of transportation, such as rail, roadand water. Transportation modes are usually studied separatelyas if not interacting, although they are intrinsically coupled
Manuscript received June 21, 2015; revised December 28, 2015; acceptedFebruary 11, 2016. Date of publication April 20, 2016; date of current versionSeptember 30, 2016. The Associate Editor for this paper was F.-Y. Wang.
A. Marzuoli, E. Boidot, P. Colomar, M. Guerpillon, and E. Feron are withthe Department of Aerospace Engineering, Georgia Institute of Technology,Atlanta, GA 30332 USA (e-mail: [email protected]).
A. Bayen and M. Hansen are with the Department of Civil and EnvironmentalEngineering, University of California at Berkeley, Berkeley, CA 94720 USA.
Color versions of one or more of the figures in this paper are available onlineat http://ieeexplore.ieee.org.
Digital Object Identifier 10.1109/TITS.2016.2536733
through passenger transfers. The failure of one mode disruptsthe entire passenger journey. Over the past few years, manydisruptions have highlighted the rigid structure of transportinfrastructures and the potential for perturbations to snowballacross multimodal infrastructures. The failures and inefficien-cies of the air transportation system not only have a significanteconomic impact but they also stress the importance of puttingthe passenger at the core of the system [2]–[5]. The objective ofmaking each passenger or cargo’s door-to-door journey seam-less cannot be achieved without a better understanding of themulti-modal transportation network. The regular occurrence ofperturbations that propagate through the system and sometimeseven paralyze it highlights the need for further research onits resilience and agility and for adequate coordination at thenetwork level. As the number of passenger keeps growing [1],congestion and snowball effects threaten the resilience of thewhole multimodal transport infrastructure.
On the transportation side, there has been extensive researchon disturbance propagation in the airspace [6]–[9], the impacton airline scheduling of aircraft and crew [10] and the bestrecovery optimization schemes [11], [12]. When a disruptionoccurs, airline schedule recovery tries to maintain operationsand get back to schedule as quickly as possible while mini-mizing additional costs. The different recovery mechanisms areaircraft swaps, flight cancellations, crew swaps, reserve crewsand passenger rebooking. Usually airlines react by solvingthe problem in a sequential manner. First, infeasibility of theaircraft schedule is examined, then crewing problems, thenground problems and the impact on passengers.
In the coming decades, air traffic demand is expected toincrease significantly [13]. The present airspace capacity limitsare predicted to be exceeded. Delays caused by congestion orweather perturbations are increasing on the ground and in theair. The cost of congestion in such a tightly interconnectednetwork of airports and aircraft reached $41 billion in the USin 2008 [14]. In 2012, 18.22% of flights were delayed in theUnited States [6].
Most of the traffic demand growth is expected to take place inmajor metropolitan areas. Metropolitan areas with high demandare often served by a system of two or more airports whosearrival and departure operations are highly interdependent,referred to as a metroplex [15]. Atkins [16] examined theSan Francisco Bay Area metroplex, providing a definitionand an initial framework to measure metroplex performance.
1524-9050 © 2016 IEEE. Personal use is permitted, but republication/redistribution requires IEEE permission.See http://www.ieee.org/publications_standards/publications/rights/index.html for more information.
2700 IEEE TRANSACTIONS ON INTELLIGENT TRANSPORTATION SYSTEMS, VOL. 17, NO. 10, OCTOBER 2016
Clarke et al. [17], [18] identified six types of interdependenciesbetween traffic flows in a metroplex based on observations.Li et al. [19] studied the metroplex operational interdepen-dencies, resulting from sharing limited common resources inairspace, such as common fixes, flight paths, airspace volumesand downstream restrictions. DeLaurentis [20] evaluated a con-cept of flexible operations at a metroplex to optimize the use ofcommon resources.
In 1991, the FAA’s Air Traffic Management Office com-missioned an analysis to measure the effects of the airlines’flight-substitution process on the efficacy of ground-delay pro-grams (GDPs) [21]. The FADE (FAA Airlines Data Exchange)project aimed at the development of operational procedures anddecision support tools for implementing and managing GDPs.However, the CDM philosophy and principles can and shouldbe applied to a much broader class of problems in air trafficmanagement. Prototype GDP operations started in 1998 at SanFrancisco and Newark airports [22]. The collaboration betweengovernment and industry was born out of the FAA’s needfor real-time operational information from the airlines and theairlines’ desire to gain more control over their operations duringa GDP [23]. Burgain et al. [24] developed a CollaborativeVirtual Queue (CVQ), which uses virtual queuing to keepaircraft away from runway queues and enable last-minute flightswapping. Gupta [25] built an integrated system, SARDA-CDM, for improving surface operations by metering departingaircraft. Three needs led to the creation of CDM and are stillat the heart of the concept today: the need for a shared globalpicture of predicted capacity and demand for various airspaceresources, leading to common situational awareness and sup-ported by appropriate information sharing; the need for real-time models that predict the impact of potential control actionsand user decisions, supported by data from all stakeholders; theneed for collaborative resource allocation tools, mechanismsand procedures.
Over the past few years, severe weather perturbations haveparalyzed the transportation system. On the European side,the eruption of the islandic volcano in 2010 had the longestand biggest economic impact on aviation [26], with more than100,000 flights canceled. Bolic et al. offer recommendationsto better address such large disruptions, stressing the needfor better information exchanges between all the stakeholders.Zhang [27] develops a framework to reduce passenger “disu-tility,” to help airlines recover schedule more promptly, and toassist traffic flow managers to utilize scarce resources more effi-ciently and equitably. When there is a significant capacity short-fall, airlines with hub-and-spoke networks could incorporateground transport modes into their operations. Such intermodal-ism triggered by disruptions was reported by Evans regardingContinental Airlines at Newark [28]. Real-time intermodalismincludes the substitution of flights by ground transportation and,when the hub is part of a regional airport system, the use ofinter-airport ground transport to enable diversion of flights toalternate airports, while limiting the impact on airlines.
Recently, a shift towards passenger-centric metrics in airtransportation, as opposed to flight-centric, has been promoted,after the disproportionate impact of airside disruptions onpassenger door-to-door journeys was highlighted [29]–[32].
Flight delays do not accurately reflect the delays imposed uponpassengers’ full multi-modal itinerary. The growing interest tomeasure ATM performance calls for metrics that reflect thepassenger’s experience. Cook and al. [29] design propagation-centric and passenger-centric performance metrics, and com-pare them with existing flight-centric metrics. In [30],Bratu et al. calculate passenger delay using monthly data froma major airline operating a hub-and-spoke network. They showthat disrupted passengers, whose journey was interrupted bya capacity reduction, are only 3% of the total passengers, butsuffer 39% of the total passenger delay. Wang [31] showed thathigh passenger trip delays are disproportionately generated bycanceled flights and missed connections. 17% of routes, or 9 ofthe busiest 35 airports, cause 50% of total passenger trip delays.Congestion, flight delay, load factor, flight cancellation timeand airline cooperation policy are the most significant factorsaffecting total passenger trip delay.
The goal of this paper is to examine how Multimodal Collab-orative Decision Making can support better crisis managementat the network level, from passenger-centric and flight-centricperspectives. This paper tackles mitigation strategies followingthe Asiana Crash, both for passengers and for flights. Section IIbriefly describes the impact of the crash on operations andon passengers. In Section III, flight diversions are introduced,from an airline and an Air Traffic Management perspective.Flight diversions are rare events, but they are harder to recoverfrom than cancellations for instance. The Asiana crash was astriking example of massive flight diversions because of anunexpected airport closure. In Section IV, a passenger-centricoptimization is proposed to analyze the reaccommodation, viabus or aircraft, of passengers diverted to airports within rea-sonable drive distance of San Francisco. In Section V, a flight-centric optimization model examines how remaining capacityat Bay Area airports may have played a role in diversions ofSFO-bound flights to far away airports. Section VI providesrecommendations for improved crisis management. Finally,Section VII draws the conclusions of the paper and suggestsfuture research paths.
II. THE IMPACT OF THE ASIANA CRASH
A. Impact on Operations
First let us briefly summarize the events leading to the Asianacrash at San Francisco International airport (SFO). SFO isthe seventh busiest airport in the United States, with about400,000 movements and 45 million passengers per year. OnJuly 6th, 2013, the weather was good, the winds were light. Theinstrument landing system vertical guidance (glide slope) onrunway 28L was, as scheduled, out of service. At 11:28 A.M.,Asiana Airlines Flight 214, a Boeing 777-200 ER aircraft,crashed just short of runway 28L’s threshold at SFO. Of the307 people aboard, 3 died, 181 others were injured. The ac-cident investigation submission [33] states that “the probablecause of this accident was the flight crew’s failure to monitorand maintain a minimum airspeed during a final approach,resulting in a deviation below the intended glide path and animpact with terrain.”
MARZUOLI et al.: DISRUPTION MANAGEMENT WITH MULTIMODAL COLLABORATIVE DECISION-MAKING 2701
The crash resulted in a five hour total closure of the runwaysat the airport. By 3:30 P.M. PDT, the two runways perpendicularto 28L were reopened; runway 10L/28R (parallel to the runwayof the accident) remained closed for more than 24 hours. Theaccident runway, 10R/28L, reopened on July 12. This crash isa powerful example of node failure leading to ripple effectson several networks. Indeed, an airport is a node for the airtransportation network, for the road network because of easyhighway access and for the transit network, with a BART (BayArea Rapid Transit) station in the Bay Area.
The work presented is based upon publicly available datafrom the Bureau of Transportation Statistics (BTS) that areprimarily used to evaluate airline on-time performance andETMS data, that provides aircraft radar latitude and longitudeevery one minute.
The crash led to the closure of SFO and, even after theairport reopened, its capacity was reduced significantly. Thecrash led to cancellations, diversions and delays at SFO, andimpacted the rest of the airspace with ripple effects. Over fourdays, more than 660 flights to SFO and 580 flights from SFOairport had either been canceled or diverted. Diversions mostlyoccurred on Saturday as well as on Sunday. The proportion ofdomestic diversions is high: 74 arrival flights, that is 17% ofarrival flights to SFO, were diverted on Saturday. There werealso 180 cancellations of arrival flights, and 231 cancellationsof departure flights from SFO on Saturday. On Sunday, thesituation improved a little, with still 30 arrival flights to SFOand 30 departure flights from SFO diverted. According to theBTS, 0.2% of domestic flights were diverted in 2013, and it is asteady number since 2004. Operations were worse on Tuesday,July 9th than on Monday, July 8th. Moreover, due to the closureof the crash runway, runway capacity was still significantlyreduced, leading to many cancellations. There are very fewdiversions after Sunday. This is to be expected since diversionsare usually tactical operations. Cancellations and delays dueto the crash at SFO propagated through the airspace and theripple effect lasted several days. To analyze this propagationphenomenon, the tail numbers of all aircraft involved withflights canceled at departure or arrival to SFO airport fromJuly 6th to July 9th were tracked. On the day of the crash, thepropagation of cancellations due to the Asiana crash accountsfor more than 85% of all cancellations in the entire US airspace,more than 50% on Sunday and more than 25% on Monday andTuesday. Over the four days, the Asiana crash led to more than49% of all cancellations in the US.
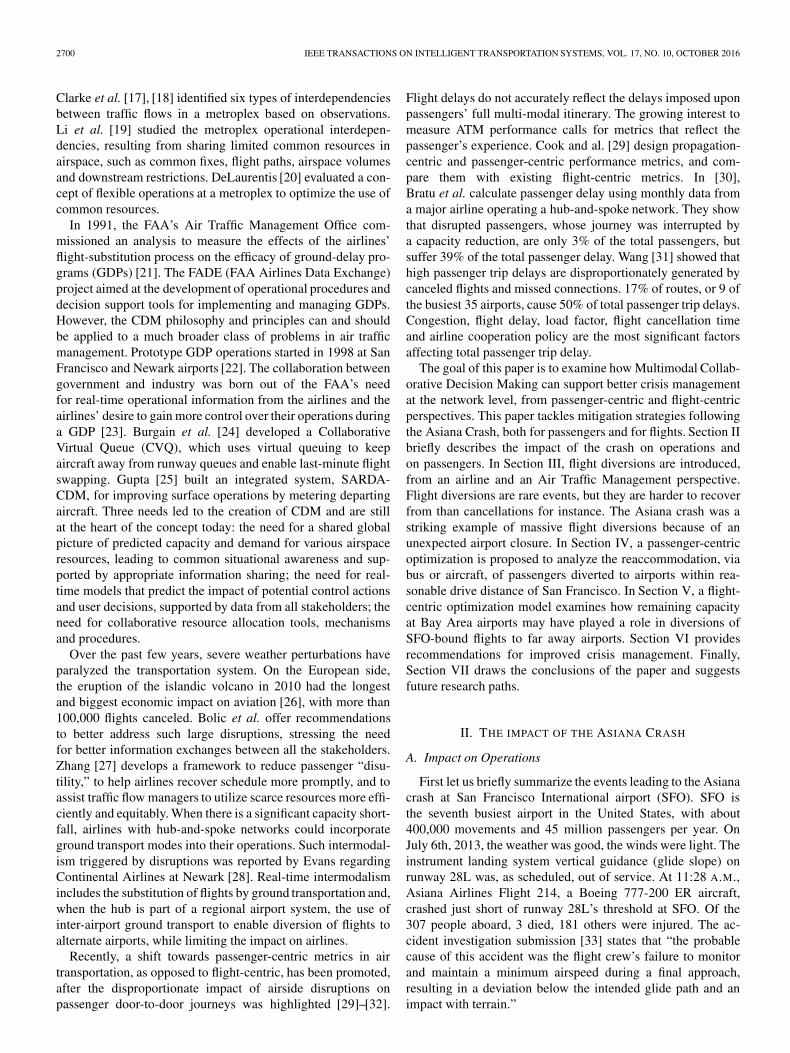
The major carrier flights were diverted to a number ofairports. The other Bay Area airports, Oakland (OAK) andSan Jose (SJC) accommodated most flights, from Saturday toTuesday. Several other airports, as far as Denver (DEN), LosAngeles (LAX) and Las Vegas (LAS), received many divertedflights on the crash day. Fig. 1 displays the estimated number ofdiverted passengers. 9,770 domestic passengers were divertedthe 6th of July, 4,260 on the 7th and approximately 1,470on the 8th and 9th of July. Only 21% of these passengerscould reach SFO, their final destination, with the same flight.The news showed how the disruption left most of the divertedpassengers unattended and uninformed, waiting for the airlinerepresentatives to figure out how to reaccomodate them on the
Fig. 1. Percentages of domestic flights diverted to different airports fromJuly 6th to July 9th 2013.
spot. Twitter quickly started to be the most updated channel ofinformation for passengers. In the ETMS data, we found 25 ad-ditional diversions, by analyzing the trajectories of internationalflights scheduled to arrive at SFO but landing elsewhere. Thesediverted flights landed in Vancouver (YVR), Calgary (YYC),SEA, LAX, SMF, LAS, OAK and SJC.
Most stakeholders only have access to a partial view ofthe crisis and, in most cases, for only one mode of transport.Following the Asiana crash, if the main stakeholders had hadaccess to real-time data feeds of reliable traffic data via collab-orative decision making, it is likely that the recovery processcould have been more efficient. Our work therefore focuseson optimization of aircraft operations and diverted passengerreaccommodation. At the present stage, only hypotheses canbe drawn when it comes to how diverted passengers wholanded sometimes several hundred miles from their destinationairport actually made it to their final destination. Social media,such as Twitter, provides pieces of information suggesting thatthe treatment of passengers and the crisis management variedgreatly from airport to airport and from airline to airline.
B. Impact on Passengers
Twitter proved particularly useful to access information ondiversions and their management depending on the airportsthe diverted flights landed at. It also provides a passenger-centric view of the crisis, which is rarely taken into accountwhile analyzing the air transportation performance under crises.When it comes to timing, tweets provide a means to access spe-cific information about diverted passengers. Such informationwas otherwise very unlikely to resurface with usual internetsearches because the large news coverage flooded the internetwith similar summaries of events but little precision on thetiming of events.
Many passengers were diverted to airports where their airlineoperates at low frequency. For instance, at the Virgin Americacounter of Seattle Tacoma International Airport on the 6th ofJuly, [34] customer-service representatives collected travelers’
2702 IEEE TRANSACTIONS ON INTELLIGENT TRANSPORTATION SYSTEMS, VOL. 17, NO. 10, OCTOBER 2016
names and phone numbers so the airline could rebook or cancelflights without the people standing in line. Passengers wereadvised that the quickest option to get home would be torebook through another carrier and obtain a refund, as “thesoonest flights on Virgin America will be Monday or Tuesday.”Although notified that waiting times could reach the two days,passengers argued they had no extra money to purchase newflights and be refunded later.
CBS news reports [35] how in Sacramento, located less than100 miles from SFO, people waited for hours uninformed,queueing around help desks and waiting for airline represen-tatives to inform about the rerouting options. CBS News inter-viewed passengers who said: “We were not even aware of whathad happened until someone on the flight was able to turn on thecell phone,” “Our carrier had no information whatsoever. Wewere booted off the plane and with no direction whatsoever.”Such witness accounts support the fact that airlines had nosystematic rerouting scheme for such disruptive situation.
On July 6th, Salt Lake City International Airport (SLC)absorbed most of the international flights, instead of SJC orOAK. SLC was the closest airport with an international customcapable of processing international flights diverted, as OAK andSJC had no such facilities ready. However, some internationalflights could not be diverted to international hubs such as Seattleor Phoenix, due to low fuel reserves. Therefore, some of themwere forced to land in Sacramento, which is not equippedin terms of customs, forcing the custom officers to enter theaircraft to proceed with the security checks in situ. Othercustoms issues were reported in Oakland.
The LAX Airport Operations Center stated on July 6th:“Three international flights that diverted to LAX and deplanedtheir passengers have all left LAX and busing their passengersto SFO. Airlines that cancelled flights between LAX and SFOare making arrangements for their passengers, including: re-booking passengers on future flights, adding special flights ifaircraft are available, busing passengers to SFO, putting uppassengers in airport-area hotels, asking passengers to returnto LAX tomorrow, etc. Tomorrow’s (Sunday’s) flights betweenLAX and SFO are heavily booked due to the combination ofholiday weekend and peak summer travel, so it is expected theairlines will require one to two days to catch up on the backlogof cancelled flights” [35]. “Transportation to San Franciscofor passengers diverted to Sacramento (SMF) depends on theairline. Delta Airlines arranged taxi and shuttle services forpassengers to get to San Francisco after their planes wereforced to land in SMF. US Airways passengers were loadedon to shuttle buses at SMF to be taken to San Francisco. (. . .)United Airlines did not have a definitive plan in place to helppassengers who were diverted to SMF. SMF has a Customsarea at the airport, but has limited space” [36]. “Additionalstaff was brought in to help accommodate the more than 1,000passengers that were diverted to SMF after the plane crash inSan Francisco. Officials say they had to bring in extra staffto accommodate all those passengers that were landing at thesame time. It was a mad rush as staff scrambled to get everyoneto where they needed to go” [37]. Many more issues arosewhen flights were diverted to airports in which their carrier doesnot operate. For instance, a SFO-bound United Airlines flight
from Seattle was diverted to Oakland. Local news reporters[38] interviewed passengers, who reported that “United has nosupport here. They sent a dislocation team, but basically whatthey keep saying is: “You’re dislocated.” “Many passengerswere diverted to airports where their airline operates at lowfrequency.
Regarding how airports handled flight diversions, San Joseairport stated [39]: “SJC handled 25 flight diversions includingtwo international flights while SFO was closed to all operations.Airport Operations staff handled the majority of duties directlyassociated with the diversions—the complex logistics of locat-ing arriving aircraft at the terminal or at remote locations, andclosing taxiways to allow for aircraft parking (. . .) Thirteen ofthe diverted flights were accommodated at the terminals; theremaining eight deplaned at the North Cargo Area where morethan 500 passengers were bused from the airfield to the termi-nal. (. . .) In addition to Airport staff, many airport contractorsassisted with the additional traffic Saturday including FirstAlarm, Shuttleport and Taxi San Jose (which saw a 100 percentincrease in business). (. . .) The airlines serving SFO contin-ued with “planned” diversions throughout Sunday (15 flights)and Monday (5 flights). The advance notice makes the planneddiversions much easier to handle from an operational perspec-tive and provides better service to airline customers.”
The lack or the little amount of information delivered byairlines, added to the highly booked situation of the holidayweek-end, created additional crisis situations in the divertedairports. At that point, a few airlines decided to implementinter-modal operational measures by placing buses and taxisto reroute their passengers. However this solution was imple-mented in a non-collaborative, case-to-case fashion and resultedin wide discrepancies in the treatment of passengers affected bythe same situation.
III. FLIGHT DIVERSIONS
According to an FAA official [40], “Thunderstorms are re-sponsible for the majority of aircraft diversions each year. (. .)Diversion flights are a rare occurrence. But when this does hap-pen, we need to make the information available to help airlines,controllers and airport operators decide the optimal airport fora diversion.” Jenkins et al. [41] describe disruptions as follows:“Diversions are an expensive, chronic, and disruptive elementof flight operations, costing at least $300 MM annually for UScarriers for domestic flights alone. (. .) A diversion is not asingle, discrete event but rather a set of cascading actions thatcause severe disruptions to airline schedules, major costs, andsignificant passenger frustration and ill will. Diversion costs canrange from $15,000 for a narrow-body domestic flight, to over$100,000 for a wide-body international flight.”
A. Airline Policy
Most airlines indicate on their websites how diversions arehandled and what the consequences may be for passengers.Even for non-refundable tickets, airlines usually are supposedto refund ancillary fees. Delta Airlines stipulates in its contractthat “in the event of flight cancellation, diversion, delays of

MARZUOLI et al.: DISRUPTION MANAGEMENT WITH MULTIMODAL COLLABORATIVE DECISION-MAKING 2703
greater than 90 minutes, or delays that will cause a passenger tomiss connections, Delta will (at passenger’s request) cancel theremaining ticket and refund the unused portion of the ticket.”
US Airways indicates on its website that “When a flightis diverted to an alternate airport and cancelled, the pilots orflight attendants will advise the customers of the reason forthe diversion. The customers may need to remain onboard.(. . .) Some irregular operations may require landing at alternateairports, with bus service to the final destination. It is acceptableto allow a customer to leave directly from an alternate airportwithout requiring him/her to travel to the final destination. (. .)When a flight (aircraft) is diverted to a city served by USAirways or codeshare partner, and canceled (meaning it willnot eventually reach its final destination), the customer servicerepresentatives in that city will reaccommodate customers oneither the next available US Airways flight or the next avail-able flight via another carrier. (. . .) When a flight (aircraft) isdiverted and then canceled in a city not served by US Airwaysor a codeshare partner, the customer service manager in USAirways’ Operations Control Center will make arrangementswith other carriers and/or hotel accommodations. Once theflight attendants receive word from the flight deck, they willcommunicate to the customers the reason for the diversion,the estimated time of departure and/or accommodations. Ifthe flight is canceled, subject to availability, passengers willbe reaccommodated via another airline. The flight attendantsand flight crew will be the US Airways representatives for thecustomers. (. . .) When alternate transportation is unavailableuntil the following day and overnight accommodations arerequired, the flight attendants and flight crew will communicateto the passengers which expenses US Airways will pay. Thefollowing is a list of what US Airways will pay for providingthe cancellation is due to anything other than weather: hotelroom; ground transportation; passengers without baggage willbe reimbursed upon presentation of receipts for reasonableincidentals such as toiletries needed until they are reunited withtheir baggage.”
B. FAA Rules
The FAA diversion recovery plan provides details on thechain of command in such events: “A diversion is a flight that isrequired to land at other than its original destination for reasonsbeyond the control of the pilot/company, e.g., periods of signifi-cant weather. Diversion recovery is an initiative orchestrated bythe ATCSCC (Air Traffic Control System Command Center)and system users to minimize the impact of system disruption.Diversion recovery will be utilized during and after periodsof significant weather or other phenomena that have adverselyimpacted the system resulting in flight diversions. The goal ofthe diversion recovery initiative is to ensure that flights, whichhave already been penalized by having to divert to anotherairport, do not receive additional penalties or delays. Flightsidentified for diversion recovery must receive priority handlingover other flights from their point of departure.
Diversion flights are identified by having “DVRSN” in theRemarks section of the flight plan, or the user inputs theinformation into the Diversion Recovery Tool (DRT).
The ATCSCC must: implement diversion recovery; transmitan advisory to inform both field facilities and users that adiversion recovery initiative has been implemented and theDRT has been activated; adjust the initiative as necessary tomeet changing conditions; transmit an advisory when the DRThas been deactivated.
The ARTCCs (Air Route Traffic Control Center) must: im-plement diversion recovery as directed by the ATCSCC; notifythe ATCSCC if they do not intend to use the DRT. In suchcases, the ATCSCC must send the Center a general messagewith the information, every 60 minutes until diversion recoveryis no longer in effect; provide expeditious handling in returningto the system those flights identified by the ATCSCC/DRT asdiversion flights; forward user diversion recovery requests totowers and TRACONs.
Towers and TRACONs must: provide expeditious handlingin returning to the system those flights identified by theARTCC/DRT as diversion flights; notify the overlying ARTCCTMU if they will utilize the DRT.”
C. IATA Diversions Management
A representative of IATA summarized the criteria for se-lecting airports where diverted flights land as follows: Safetyof Flight, Airspace or Airport Restrictions, Overflight autho-rization, Landing authorization, Immigration, Customs, Air-port Services, Crew considerations, Service recovery options,Schedule recovery options. More precisely, the Safety of Flightincludes choosing the emergency airport (nearest available andnearest suitable), evaluating the fuel remaining and gettingthe alternate approved. The primary objectives are to safelyland and support the aircraft. The diversion airport is selectedbased on the following criteria: approved alternate; weatherat diversion airport; airport services company, maintenance,fuel; aircraft servicing—tow bar, air stairs, main deck loader,ground power, air conditioning, parking; passenger handlingfacilities, Customs and Immigration, food, accommodations;other scheduled service.
It should be best prepared to handle the aircraft, service thecustomer, return the flight to original destination. The crewaspects are also taken into account, such as on-duty times, thelegal to finish limitations, the accommodations, the replacementcrew availability and the crew pairing disruptions. Regardingservice recovery, passenger disruption is examined regardingthe delay to final destination, the 3 hour tarmac rules and theCustoms and Immigration requirements, onward connections,company re-schedule options, and re-booking schedule options.
IV. PASSENGER MULTIMODAL REROUTING FROM
AIRPORTS WHERE THE DIVERTED FLIGHTS LANDED
This section studies how multimodal rerouting of passengerscould have helped in the recovery process.
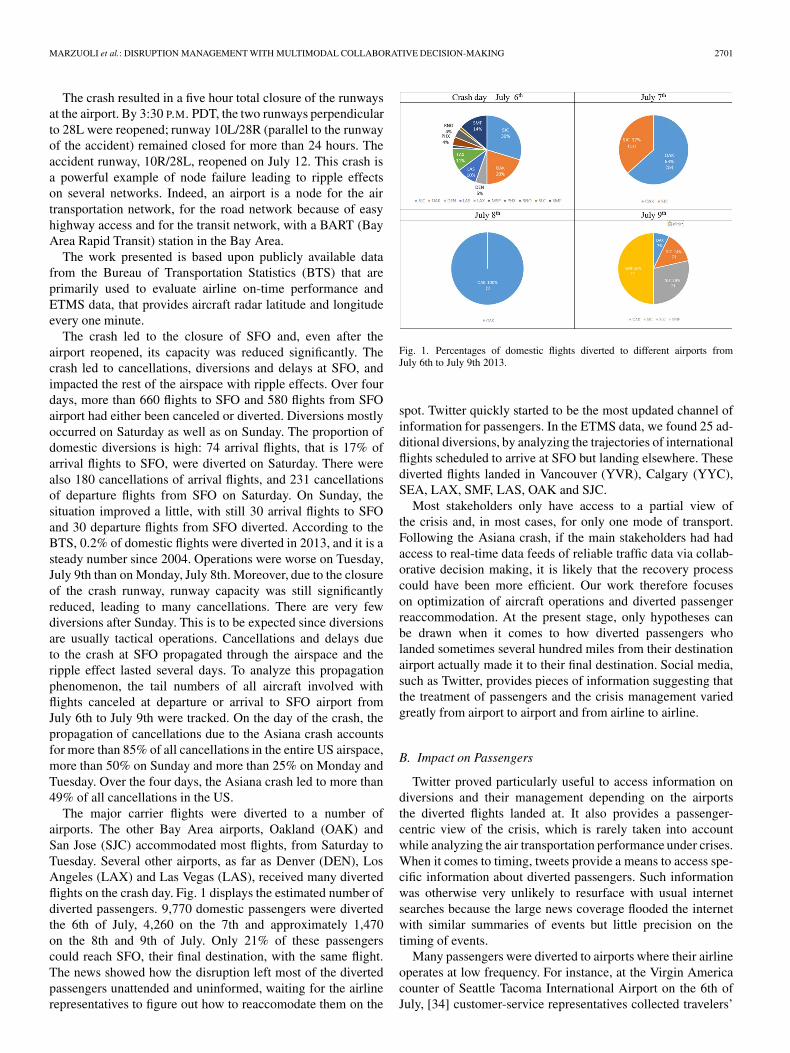
Hansen and Zhang [27] conducted a study on bus chartercompanies’ response to service inter-modal service requests.To evaluate how promptly charter companies could respondto service requests, they conducted a telephone survey forten randomly picked charter companies for six regions in the

2704 IEEE TRANSACTIONS ON INTELLIGENT TRANSPORTATION SYSTEMS, VOL. 17, NO. 10, OCTOBER 2016
Fig. 2. Intermodal service times reported by Hansen and Zhang.
US: San Francisco, Los Angeles, New York, Chicago, Miamiand Texas. All of the regions are supposed to have a chartercompanies’ offer comparable, if not bigger, to San Francisco.They constructed a scenario motivating an urgent request fora motor coach service at an airport, and asked for a motorcoach that could accommodate at least 30 passengers and theirpersonal belongings and be available for at least 6 hours. Theirresults are shown in Fig. 2 and show that buses can be madeavailable at most airports in less than four hours.
After the Asiana crash, and considering the airports that wel-comed most flight diversions, the airports from which a completeinter-modal substitution is feasible are: Sacramento Interna-tional Airport (SMF) (100 miles from SFO); Reno Tahoe In-ternational Airport (RNO) (230 miles from SFO); Los AngelesInternational Airport (LAX) (390 miles from SFO); Las VegasMcCarran International Airport (LAS) (565 miles from SFO).
The Department of Transportation proposes an approach tomeasure the hourly values of travel time for aviation passen-gers. These values are used by the FAA, and are not to beupdated for changes in price levels. The present analysis studyonly examines what could have been the best case scenario, inhindsight, based on the data recorded for this disruption.
A. Model Formulation
1) Nomenclature Used in the Model: Let us define the inputsets as follows:
• A = a1, a2, . . . , a4 be the set of diverted airports (RNO,SMF, LAS, LAX).
• F = f1, f2, . . . , fn be the set of departure flights from thediverted airports to the Bay Area (SFO, OAK, SJC).
• Γ = t1, t2, . . . , tT the set of discrete time periods.• P = p1, p2, . . . , pP the set of diverted passengers.• A = g1, g2, . . . , gMaxAircraft the set of aircraft available
to charter in the diverted airport.• B = b1, b2, . . . , bMaxBuses the set of available buses for
inter-modal substitution in the diverted airport.
Input time and delay variables:
• ADTaf : Actual departure time of flight f from diverted
airport a.• ADivATa
p: Actual arrival time of passenger p at the di-verted airport a.
• BDTOAK,BDTSJC,BDTa: Bus driving time from OAKto SFO, from SJC to SFO and from the diverted airport ato SFO.
• FlightTimea: Flight time from diverted airport a to SFO.
Input capacity variables:
• Seatsaf is the number of seats left on maintained flight f .• CapAircraftg is the passenger capacity of chartered
flight g.• CapBus is the passenger capacity of any bus.
Input cost coefficients:
• CostCharter: Cost of chartering a new aircraft [$/ hour ·passenger].
• CostBV: Cost of bus reaccommodation [$/passenger].• CostP: Passenger delay cost per time unit [$/ hour ·
passenger].
Other input coefficients:
• βWait: Weight coefficient for passenger waiting time.• βTransp: Weight coefficient for passenger reaccommoda-
tion time.• MinloadBus: Minimum passenger load (percentage) to
allow a bus to depart.• MinloadCharter: Minimum passenger load (percentage)
to allow an aircraft to depart.• TimeFactor: Conversion factor used to convert time peri-
ods into minutes. 15 minutes time intervals are chosen.• MaxBusesa: Maximum number of buses available at di-
verted airport a.• MaxAircrafta: Maximum number of aircraft available to
be chartered at diverted airport a.
Input binary variables: OAKaf = 1 if the destination of
departure flight f from diverted airport a is OAK, OAKaf = 0
otherwise. SJCaf = 1 if the destination of departure flight f
from diverted airport a is SJC, SJCaf = 0 otherwise.
Output binary variables:The first type of output binary variables are Squeezetp,f,a,
Substtp,b,a and Chartertp,g,a. These three variables assignpassengers to one of the three possible rerouting options:Squeezetp,f,a = 1 if passenger p is squeezed into flight f depart-ing from diverted airport a in time interval t; Substtp,b,a = 1 ifpassenger p is rerouted with motor coach b from diverted airporta in time interval t; AChartertp,g,a = 1 if passenger p is reroutedwith chartered flight g from diverted airport a in time interval t.
The second type of output binary variables are DTBustb,a andDTChartertg,a, indicating when a bus or an chartered aircraftleaves diverted airport a. DTBustb,a = 1 if bus b departs in timeperiod t; DTChartertg,a = 1 if chartered aircraft g departs intime period t.
2) Model Input Data: The input data for the mathematicalprogramming is the following:
• Set of diverted passengers to the airport of study.• Set of departure flights F from the diverted airport to
SFO, OAK or SJC.• Number of passengers booked and capacity of each
flight f .• Scheduled and actual departure and arrival times of each
flight f .
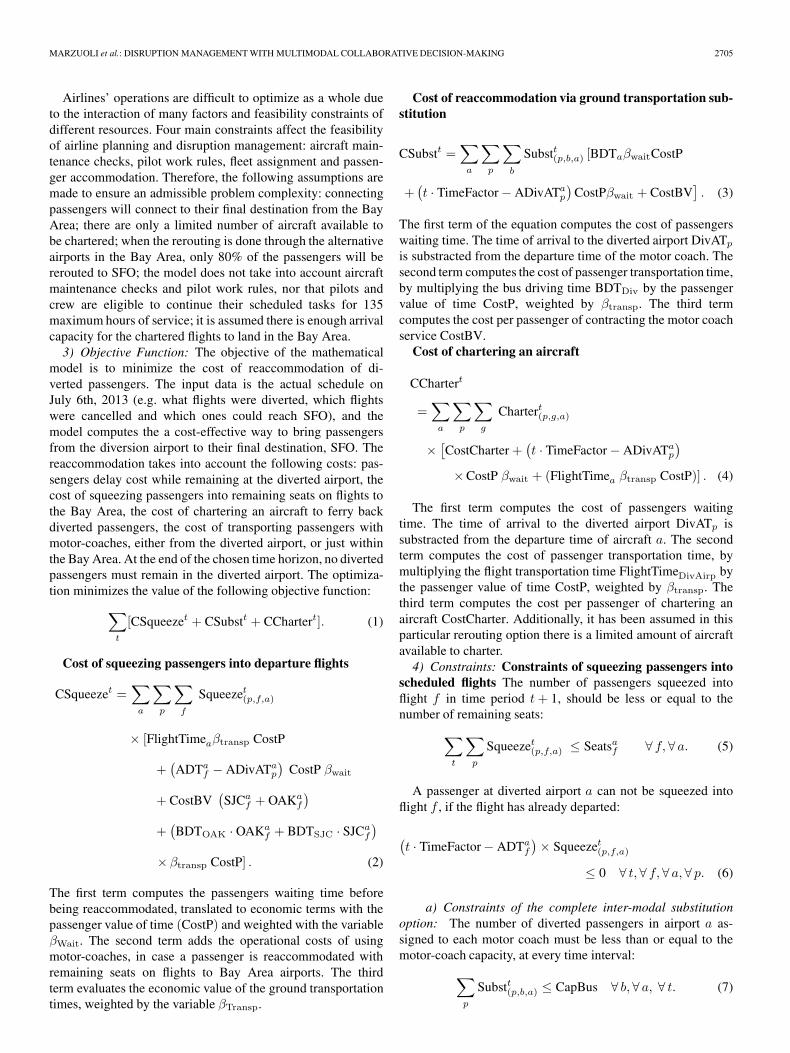
MARZUOLI et al.: DISRUPTION MANAGEMENT WITH MULTIMODAL COLLABORATIVE DECISION-MAKING 2705
Airlines’ operations are difficult to optimize as a whole dueto the interaction of many factors and feasibility constraints ofdifferent resources. Four main constraints affect the feasibilityof airline planning and disruption management: aircraft main-tenance checks, pilot work rules, fleet assignment and passen-ger accommodation. Therefore, the following assumptions aremade to ensure an admissible problem complexity: connectingpassengers will connect to their final destination from the BayArea; there are only a limited number of aircraft available tobe chartered; when the rerouting is done through the alternativeairports in the Bay Area, only 80% of the passengers will bererouted to SFO; the model does not take into account aircraftmaintenance checks and pilot work rules, nor that pilots andcrew are eligible to continue their scheduled tasks for 135maximum hours of service; it is assumed there is enough arrivalcapacity for the chartered flights to land in the Bay Area.
3) Objective Function: The objective of the mathematicalmodel is to minimize the cost of reaccommodation of di-verted passengers. The input data is the actual schedule onJuly 6th, 2013 (e.g. what flights were diverted, which flightswere cancelled and which ones could reach SFO), and themodel computes the a cost-effective way to bring passengersfrom the diversion airport to their final destination, SFO. Thereaccommodation takes into account the following costs: pas-sengers delay cost while remaining at the diverted airport, thecost of squeezing passengers into remaining seats on flights tothe Bay Area, the cost of chartering an aircraft to ferry backdiverted passengers, the cost of transporting passengers withmotor-coaches, either from the diverted airport, or just withinthe Bay Area. At the end of the chosen time horizon, no divertedpassengers must remain in the diverted airport. The optimiza-tion minimizes the value of the following objective function:
∑t
[CSqueezet + CSubstt + CChartert]. (1)
Cost of squeezing passengers into departure flights
CSqueezet =∑a
∑p
∑f
Squeezet(p,f,a)
× [FlightTimeaβtransp CostP
+(ADTa
f − ADivATap
)CostP βwait
+ CostBV(SJCa
f + OAKaf
)
+(BDTOAK · OAKa
f + BDTSJC · SJCaf
)
× βtransp CostP] . (2)
The first term computes the passengers waiting time beforebeing reaccommodated, translated to economic terms with thepassenger value of time (CostP) and weighted with the variableβWait. The second term adds the operational costs of usingmotor-coaches, in case a passenger is reaccommodated withremaining seats on flights to Bay Area airports. The thirdterm evaluates the economic value of the ground transportationtimes, weighted by the variable βTransp.
Cost of reaccommodation via ground transportation sub-stitution
CSubstt =∑a
∑p
∑b
Substt(p,b,a) [BDTaβwaitCostP
+(t · TimeFactor − ADivATa
p
)CostPβwait + CostBV
]. (3)
The first term of the equation computes the cost of passengerswaiting time. The time of arrival to the diverted airport DivATp
is substracted from the departure time of the motor coach. Thesecond term computes the cost of passenger transportation time,by multiplying the bus driving time BDTDiv by the passengervalue of time CostP, weighted by βtransp. The third termcomputes the cost per passenger of contracting the motor coachservice CostBV.
Cost of chartering an aircraft
CChartert
=∑a
∑p
∑g
Chartert(p,g,a)
×[CostCharter +
(t · TimeFactor − ADivATa
p
)
×CostP βwait + (FlightTimea βtransp CostP)] . (4)
The first term computes the cost of passengers waitingtime. The time of arrival to the diverted airport DivATp issubstracted from the departure time of aircraft a. The secondterm computes the cost of passenger transportation time, bymultiplying the flight transportation time FlightTimeDivAirp bythe passenger value of time CostP, weighted by βtransp. Thethird term computes the cost per passenger of chartering anaircraft CostCharter. Additionally, it has been assumed in thisparticular rerouting option there is a limited amount of aircraftavailable to charter.
4) Constraints: Constraints of squeezing passengers intoscheduled flights The number of passengers squeezed intoflight f in time period t+ 1, should be less or equal to thenumber of remaining seats:
∑t
∑p
Squeezet(p,f,a) ≤ Seatsaf ∀ f, ∀ a. (5)
A passenger at diverted airport a can not be squeezed intoflight f , if the flight has already departed:
(t · TimeFactor − ADTa
f
)× Squeezet(p,f,a)
≤ 0 ∀ t, ∀ f, ∀ a, ∀ p. (6)
a) Constraints of the complete inter-modal substitutionoption: The number of diverted passengers in airport a as-signed to each motor coach must be less than or equal to themotor-coach capacity, at every time interval:
∑p
Substt(p,b,a) ≤ CapBus ∀ b, ∀ a, ∀ t. (7)

2706 IEEE TRANSACTIONS ON INTELLIGENT TRANSPORTATION SYSTEMS, VOL. 17, NO. 10, OCTOBER 2016
The bus b and the passengers leaving with this bus leave atthe same time:
DTBustb,a ≥ Substt(p,b,a) ∀ p, ∀ b, ∀ a, ∀ t. (8)
The motor coach b contracted for inter-modal substitution canonly depart if it is filled up to a minimum bus load
If DTBustb,a ≥ 1, then∑p
Substt(p,b,a) ≥ MinloadBus
· CapBus ∀ p, ∀ b, ∀ a, ∀ t. (9)
The motor coach b can only depart once from airport a:
∑t
DTBustb,a ≤ 1 ∀ b, ∀ a, ∀ t. (10)
Constraints corresponding to chartering a new aircraft tofly to one of the Bay Area airports
The number of passengers assigned to a new chartered air-craft g must be less than the aircraft remaining capacity, at everytime slot:
∑p
Chartert(p,g,a) ≤ CapAircraftg ∀ g, ∀ a, ∀ t. (11)
The chartered aircraft g and the passengers leaving with thisaircraft leave at the same time:
DTChartertg,a ≥ Chartert(p,g,a) ∀ p, ∀ g, ∀ a, ∀ t. (12)
An chartered aircraft g can only depart if it is filled up to aminimum aircraft load
If DTChartertg,a ≥ 1, then∑p
Chartert(p,g,a)
≥ MinloadAc · CapAc ∀ p, ∀ g, ∀ a, ∀ t. (13)
This conditional constraint is transformed into a pair of linearconstraints with auxiliary variables.
An chartered aircraft g can only depart once:
∑t
DTChartertg,a ≤ 1 ∀ g, ∀ a. (14)
Passenger conservation constraintsEach passenger must be assigned to one of three rerouting
options during the time horizon considered
∑t
⎡⎣∑
f
Squeezet(p,f,a) +∑b
Substt(p,b,a)
+∑g
Chartert(p,g,a)
⎤⎦ = 1 ∀ p, ∀ a. (15)
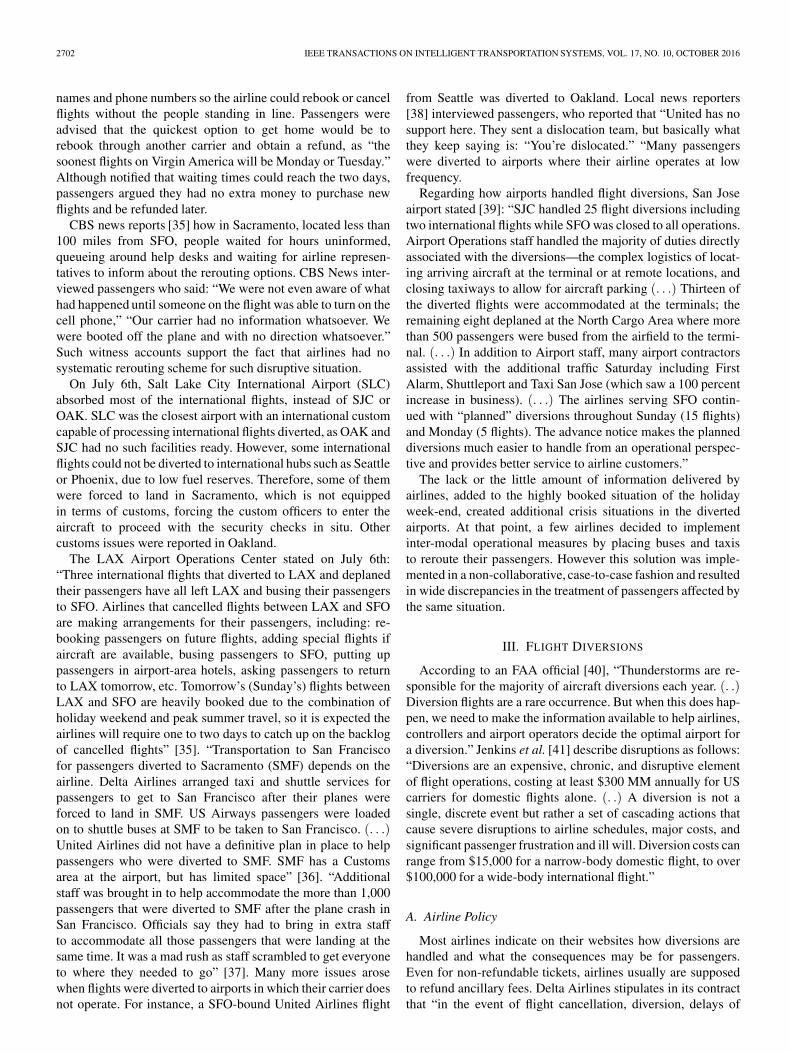
Fig. 3. Reaccommodation of diverted passengers on remaining seats in flightsthat reached the Bay Area, regardless of their original carrier.
Passengers can only be assigned to a rerouting option 30minutes after landing in the diverted airport:
∀ a, ∀ p, ∀ t, ∀ f, ∀ b, ∀ g
[t · TimeFactor − (30 + ActualDivATp,a)]
×(
Squeezedt(p,f,a) + Substt(p,b,a) + Chartert(p,g,a))
≥ 0.
(16)
B. Optimization Results
1) Baseline for Study—Reaccommodation of PassengersUnder a Unimodal Scenario (Flying Only): The best case real-life scenario for most diverted passengers is to be rebookedon flights to the Bay Area (SFO, OAK, SJC) that were notcancelled, on July 6th (crash day) and the following days,regardless of their original carrier. From passenger tweets, wedo know that some airlines provided shuttles to the Bay Area ina few diverted airports, but most of them did not. Moreover, ifwe consider that a passenger can only be reaccommodated onlater flights operated by his or her original carrier, passengerswho landed in airports where the carrier does not operate wouldnot have been rebooked. American Airlines policy indicatesthat, under special circumstances, passengers may be rebookedon another carrier. Fig. 3 shows how long it would have takenfor all passengers to be rebooked depending on the airportthey were diverted to: RNO welcomed about 230 passengers,who would have been rebooked by Monday morning, July 8th;SMF welcomed about 600 passengers, who would have beenrebooked by Monday evening, July 8th; LAX welcomed about1030 passengers, who would have been rebooked by Tuesdaymorning, July 9th; LAS welcomed about 670 passengers, whowould have been rebooked by Tuesday morning, July 9th.Moreover, fewer than 300 passengers would have reached theBay Area before Monday, July 8th at noon, that is, less than48 hours after the crash. This means most passengers’ expensesprobably included two hotel nights, and two full days of meals.This cost incurred is not included in the optimization modelproposed, but adds to the benefits of multimodal reroutingdescribed below.
MARZUOLI et al.: DISRUPTION MANAGEMENT WITH MULTIMODAL COLLABORATIVE DECISION-MAKING 2707
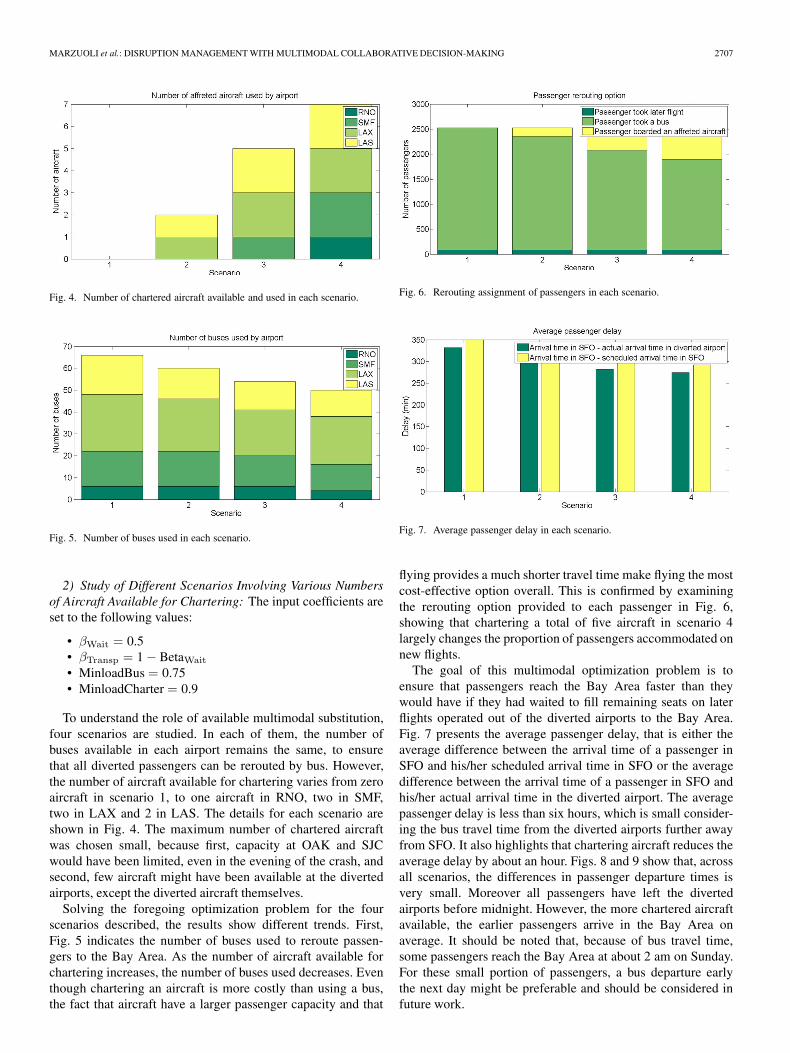
Fig. 4. Number of chartered aircraft available and used in each scenario.
Fig. 5. Number of buses used in each scenario.
2) Study of Different Scenarios Involving Various Numbersof Aircraft Available for Chartering: The input coefficients areset to the following values:
• βWait = 0.5• βTransp = 1 − BetaWait
• MinloadBus = 0.75• MinloadCharter = 0.9
To understand the role of available multimodal substitution,four scenarios are studied. In each of them, the number ofbuses available in each airport remains the same, to ensurethat all diverted passengers can be rerouted by bus. However,the number of aircraft available for chartering varies from zeroaircraft in scenario 1, to one aircraft in RNO, two in SMF,two in LAX and 2 in LAS. The details for each scenario areshown in Fig. 4. The maximum number of chartered aircraftwas chosen small, because first, capacity at OAK and SJCwould have been limited, even in the evening of the crash, andsecond, few aircraft might have been available at the divertedairports, except the diverted aircraft themselves.
Solving the foregoing optimization problem for the fourscenarios described, the results show different trends. First,Fig. 5 indicates the number of buses used to reroute passen-gers to the Bay Area. As the number of aircraft available forchartering increases, the number of buses used decreases. Eventhough chartering an aircraft is more costly than using a bus,the fact that aircraft have a larger passenger capacity and that
Fig. 6. Rerouting assignment of passengers in each scenario.
Fig. 7. Average passenger delay in each scenario.
flying provides a much shorter travel time make flying the mostcost-effective option overall. This is confirmed by examiningthe rerouting option provided to each passenger in Fig. 6,showing that chartering a total of five aircraft in scenario 4largely changes the proportion of passengers accommodated onnew flights.
The goal of this multimodal optimization problem is toensure that passengers reach the Bay Area faster than theywould have if they had waited to fill remaining seats on laterflights operated out of the diverted airports to the Bay Area.Fig. 7 presents the average passenger delay, that is either theaverage difference between the arrival time of a passenger inSFO and his/her scheduled arrival time in SFO or the averagedifference between the arrival time of a passenger in SFO andhis/her actual arrival time in the diverted airport. The averagepassenger delay is less than six hours, which is small consider-ing the bus travel time from the diverted airports further awayfrom SFO. It also highlights that chartering aircraft reduces theaverage delay by about an hour. Figs. 8 and 9 show that, acrossall scenarios, the differences in passenger departure times isvery small. Moreover all passengers have left the divertedairports before midnight. However, the more chartered aircraftavailable, the earlier passengers arrive in the Bay Area onaverage. It should be noted that, because of bus travel time,some passengers reach the Bay Area at about 2 am on Sunday.For these small portion of passengers, a bus departure earlythe next day might be preferable and should be considered infuture work.

2708 IEEE TRANSACTIONS ON INTELLIGENT TRANSPORTATION SYSTEMS, VOL. 17, NO. 10, OCTOBER 2016
Fig. 8. Cumulative number of passengers by departure time from the divertedairport, for each scenario.
Fig. 9. Cumulative number of passengers by arrival time in the Bay Area, foreach scenario.
Fig. 10. Objective value for each value of βwait.
3) Sensitivity Analysis on βwait: We want to understand theweighting in the objective function depending on whether weattach more importance to the delay suffered by passengersor the cost incurred by reaccommodating them on aircraft orbuses. Therefore we consider scenario 4 from the previousexample, with one chartered aircraft available in RNO, twoin SMF, two in LAX and 2 in LAS, is tested for βwait = 0.3,βwait = 0.4, βwait = 0.5, βwait = 0.6, βwait = 0.7.
Fig. 10 shows that the objective value decreases as βwait
increases. This is intuitive since the optimization model forcesall passengers to be rerouted. Second, in Fig. 11, the number
Fig. 11. Number of buses used for each value of βwait.
Fig. 12. Average passenger delay for each value of βwait.
of buses used by airport increases with βwait, while the numberof chartered aircraft used remains constant and the number ofpassengers reaccommodated on buses remains the same. Thismeans that the load in each bus decreases, the optimization isno longer trying to fill buses to their maximum capacity butonly to fill them to their minimum capacity before letting themdepart. Finally, Fig. 12 indicates that the influence of βwait onpassenger delay is limited.
V. METROPLEX GATE ASSIGNMENT
In the foregoing section, we studied how to better reac-commodate diverted passengers.1 We wonder if it could havebeen possible to land more diverted flights in the Bay Area,under metroplex operations, with real-time shared informationbetween all stakeholders and collaborative decision making. Ina metroplex environment, neighboring airports could dynami-cally act as reliever airports to SFO. Therefore, we first examinethe situation, the remaining capacities at OAK and SJC, thedomestic and international diverted flights, and then propose areoptimization scheme.
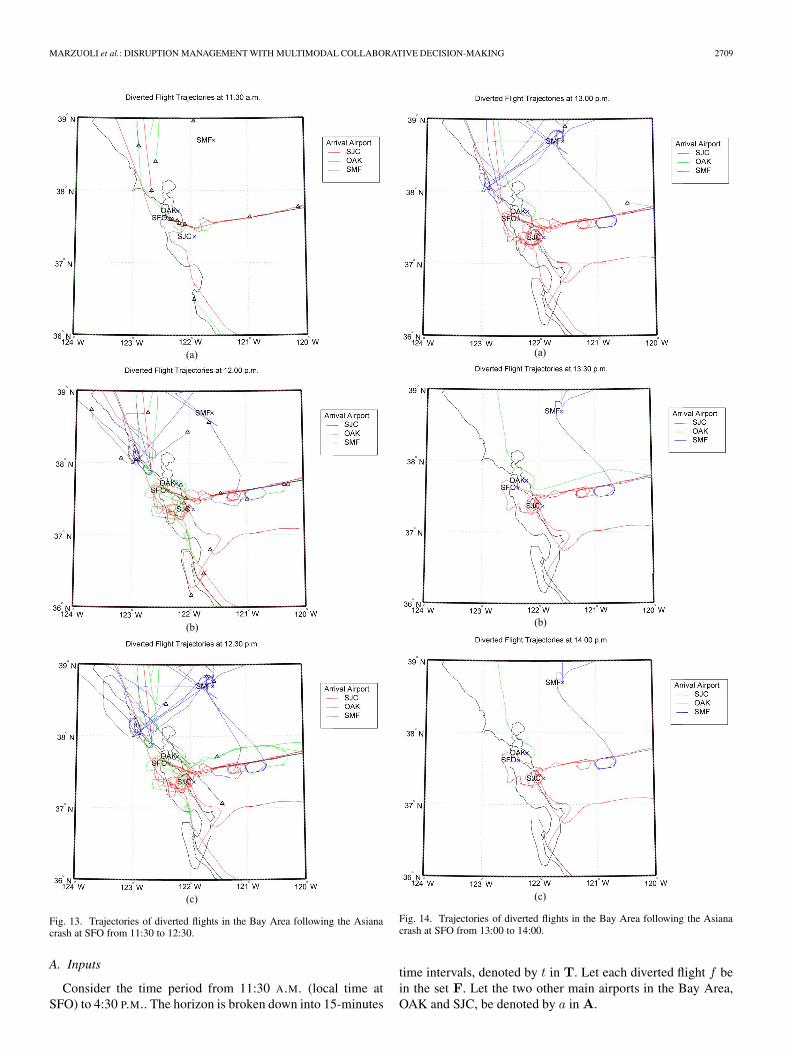
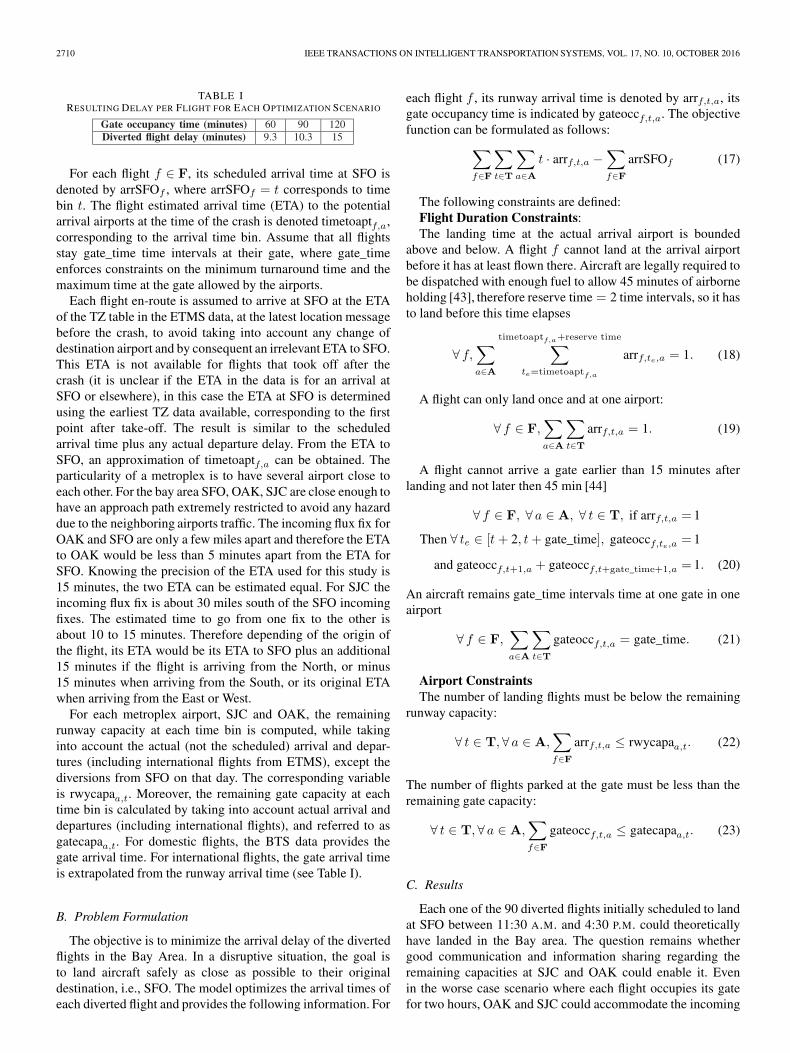
Trajectories of diverted flights arriving in the Bay Area in thehours following the crash are displayed in Figs. 13 and 14, andshow the unusual number of holding patterns and reroutings inthe air, so that the flights can land at SJC or OAK.
1Part of this research was previously published by the authors at the AIAAInfotech Conference [42].
MARZUOLI et al.: DISRUPTION MANAGEMENT WITH MULTIMODAL COLLABORATIVE DECISION-MAKING 2709
Fig. 13. Trajectories of diverted flights in the Bay Area following the Asianacrash at SFO from 11:30 to 12:30.
A. Inputs
Consider the time period from 11:30 A.M. (local time atSFO) to 4:30 P.M.. The horizon is broken down into 15-minutes
Fig. 14. Trajectories of diverted flights in the Bay Area following the Asianacrash at SFO from 13:00 to 14:00.
time intervals, denoted by t in T. Let each diverted flight f bein the set F. Let the two other main airports in the Bay Area,OAK and SJC, be denoted by a in A.
2710 IEEE TRANSACTIONS ON INTELLIGENT TRANSPORTATION SYSTEMS, VOL. 17, NO. 10, OCTOBER 2016
TABLE IRESULTING DELAY PER FLIGHT FOR EACH OPTIMIZATION SCENARIO
For each flight f ∈ F, its scheduled arrival time at SFO isdenoted by arrSFOf , where arrSFOf = t corresponds to timebin t. The flight estimated arrival time (ETA) to the potentialarrival airports at the time of the crash is denoted timetoaptf,a,corresponding to the arrival time bin. Assume that all flightsstay gate_time time intervals at their gate, where gate_timeenforces constraints on the minimum turnaround time and themaximum time at the gate allowed by the airports.
Each flight en-route is assumed to arrive at SFO at the ETAof the TZ table in the ETMS data, at the latest location messagebefore the crash, to avoid taking into account any change ofdestination airport and by consequent an irrelevant ETA to SFO.This ETA is not available for flights that took off after thecrash (it is unclear if the ETA in the data is for an arrival atSFO or elsewhere), in this case the ETA at SFO is determinedusing the earliest TZ data available, corresponding to the firstpoint after take-off. The result is similar to the scheduledarrival time plus any actual departure delay. From the ETA toSFO, an approximation of timetoaptf,a can be obtained. Theparticularity of a metroplex is to have several airport close toeach other. For the bay area SFO, OAK, SJC are close enough tohave an approach path extremely restricted to avoid any hazarddue to the neighboring airports traffic. The incoming flux fix forOAK and SFO are only a few miles apart and therefore the ETAto OAK would be less than 5 minutes apart from the ETA forSFO. Knowing the precision of the ETA used for this study is15 minutes, the two ETA can be estimated equal. For SJC theincoming flux fix is about 30 miles south of the SFO incomingfixes. The estimated time to go from one fix to the other isabout 10 to 15 minutes. Therefore depending of the origin ofthe flight, its ETA would be its ETA to SFO plus an additional15 minutes if the flight is arriving from the North, or minus15 minutes when arriving from the South, or its original ETAwhen arriving from the East or West.
For each metroplex airport, SJC and OAK, the remainingrunway capacity at each time bin is computed, while takinginto account the actual (not the scheduled) arrival and depar-tures (including international flights from ETMS), except thediversions from SFO on that day. The corresponding variableis rwycapaa,t. Moreover, the remaining gate capacity at eachtime bin is calculated by taking into account actual arrival anddepartures (including international flights), and referred to asgatecapaa,t. For domestic flights, the BTS data provides thegate arrival time. For international flights, the gate arrival timeis extrapolated from the runway arrival time (see Table I).
B. Problem Formulation
The objective is to minimize the arrival delay of the divertedflights in the Bay Area. In a disruptive situation, the goal isto land aircraft safely as close as possible to their originaldestination, i.e., SFO. The model optimizes the arrival times ofeach diverted flight and provides the following information. For
each flight f , its runway arrival time is denoted by arrf,t,a, itsgate occupancy time is indicated by gateoccf,t,a. The objectivefunction can be formulated as follows:
∑f∈F
∑t∈T
∑a∈A
t · arrf,t,a −∑f∈F
arrSFOf (17)
The following constraints are defined:Flight Duration Constraints:The landing time at the actual arrival airport is bounded
above and below. A flight f cannot land at the arrival airportbefore it has at least flown there. Aircraft are legally required tobe dispatched with enough fuel to allow 45 minutes of airborneholding [43], therefore reserve time = 2 time intervals, so it hasto land before this time elapses
∀ f,∑a∈A
timetoaptf,a+reserve time∑te=timetoaptf,a
arrf,te,a = 1. (18)
A flight can only land once and at one airport:
∀ f ∈ F,∑a∈A
∑t∈T
arrf,t,a = 1. (19)
A flight cannot arrive a gate earlier than 15 minutes afterlanding and not later then 45 min [44]
∀ f ∈ F, ∀ a ∈ A, ∀ t ∈ T, if arrf,t,a = 1
Then ∀ te ∈ [t+ 2, t+ gate_time], gateoccf,te,a = 1
and gateoccf,t+1,a + gateoccf,t+gate_time+1,a = 1. (20)
An aircraft remains gate_time intervals time at one gate in oneairport
∀ f ∈ F,∑a∈A
∑t∈T
gateoccf,t,a = gate_time. (21)
Airport ConstraintsThe number of landing flights must be below the remaining
runway capacity:
∀ t ∈ T, ∀ a ∈ A,∑f∈F
arrf,t,a ≤ rwycapaa,t. (22)
The number of flights parked at the gate must be less than theremaining gate capacity:
∀ t ∈ T, ∀ a ∈ A,∑f∈F
gateoccf,t,a ≤ gatecapaa,t. (23)
C. Results
Each one of the 90 diverted flights initially scheduled to landat SFO between 11:30 A.M. and 4:30 P.M. could theoreticallyhave landed in the Bay area. The question remains whethergood communication and information sharing regarding theremaining capacities at SJC and OAK could enable it. Evenin the worse case scenario where each flight occupies its gatefor two hours, OAK and SJC could accommodate the incoming

MARZUOLI et al.: DISRUPTION MANAGEMENT WITH MULTIMODAL COLLABORATIVE DECISION-MAKING 2711
Fig. 15. Runway Occupancy at SJC and OAK for each scenario. (a) Runwayoccupancy for gate_time = 60 min. (b) Runway occupancy for gate_time =90 min. (c) Runway occupancy for gate_time = 120 min.
traffic, while keeping airborne flight delay relatively low andwithin safety limits.
Fig. 15 shows the runway capacity is stressed right after thecrash, between 11:30 A.M. and 11:45 A.M.. However, even atits peak, the runway occupancy remains below 90% of capacity.The second peak is visible for the scenario with 120 minutesof gate time, and shows a short saturation of gate occupancy atboth SJC and OAK, which leads to a temporary and manageableincrease in airborne holding. The gate occupancy level reachesits limit for two scenarios and for the last scenario, the peak
Fig. 16. Gate Occupancy at SJC and OAK for each scenario. (a) Gate Occu-pancy for gate_time = 60 min; (b) Gate Occupancy for gate_time = 90 min;(c) Gate Occupancy when gate_time = 120 min.
occupancy reached is 90% (see Fig. 16). Summarizing it all,most diversions, if not all, with some uncertainty margin, couldhave landed in the Bay Area.
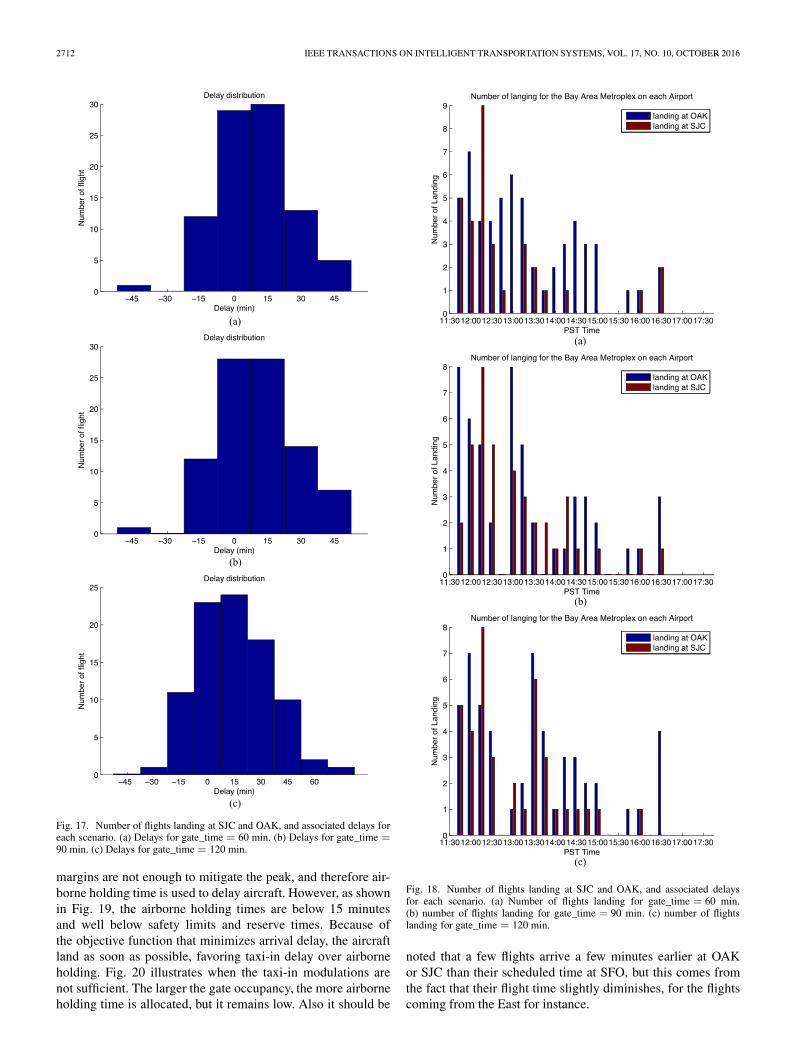
The repartition of diverted flights at SJC and OAK is similar,and balance each other, as illustrated in Figs. 17 and 18. Thelarger the gate time enforced, the more balanced the repar-tition is. A noticeable fact is that no flights lands between12:30 P.M. and 12:45 P.M. because all gates are full in the nexttime interval. Since the limit in gate occupancy lasts more than30 minutes in the second and third scenarios, the taxi-in time
2712 IEEE TRANSACTIONS ON INTELLIGENT TRANSPORTATION SYSTEMS, VOL. 17, NO. 10, OCTOBER 2016
Fig. 17. Number of flights landing at SJC and OAK, and associated delays foreach scenario. (a) Delays for gate_time = 60 min. (b) Delays for gate_time =90 min. (c) Delays for gate_time = 120 min.
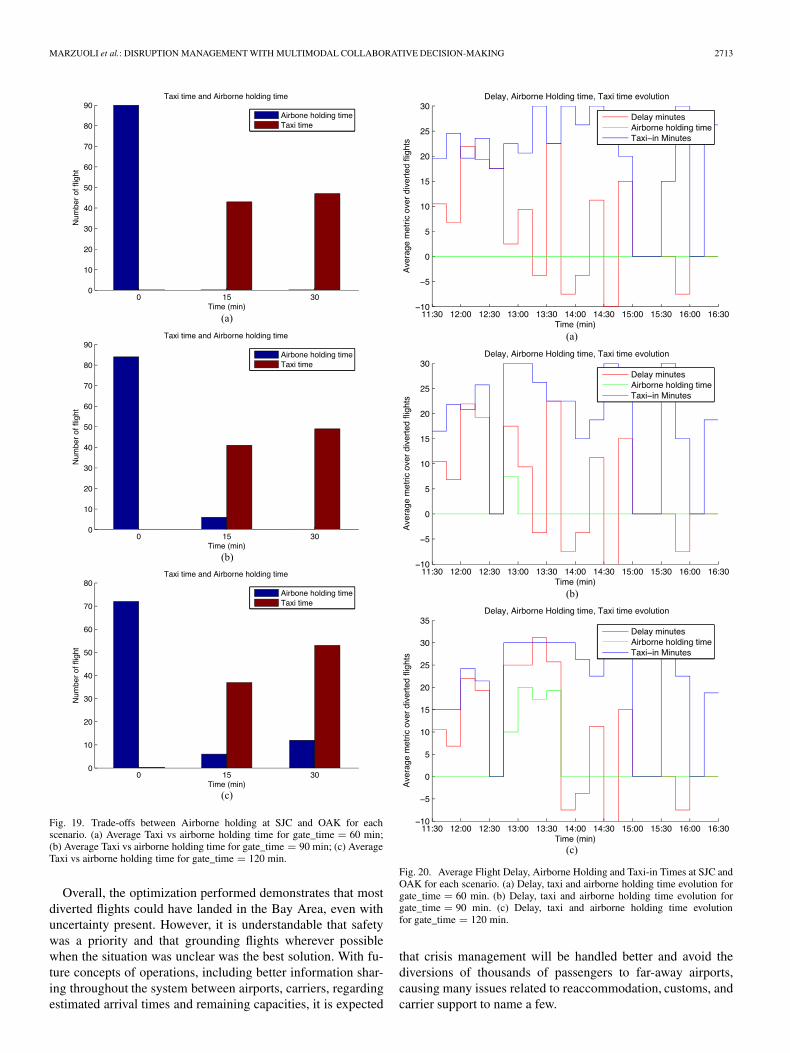
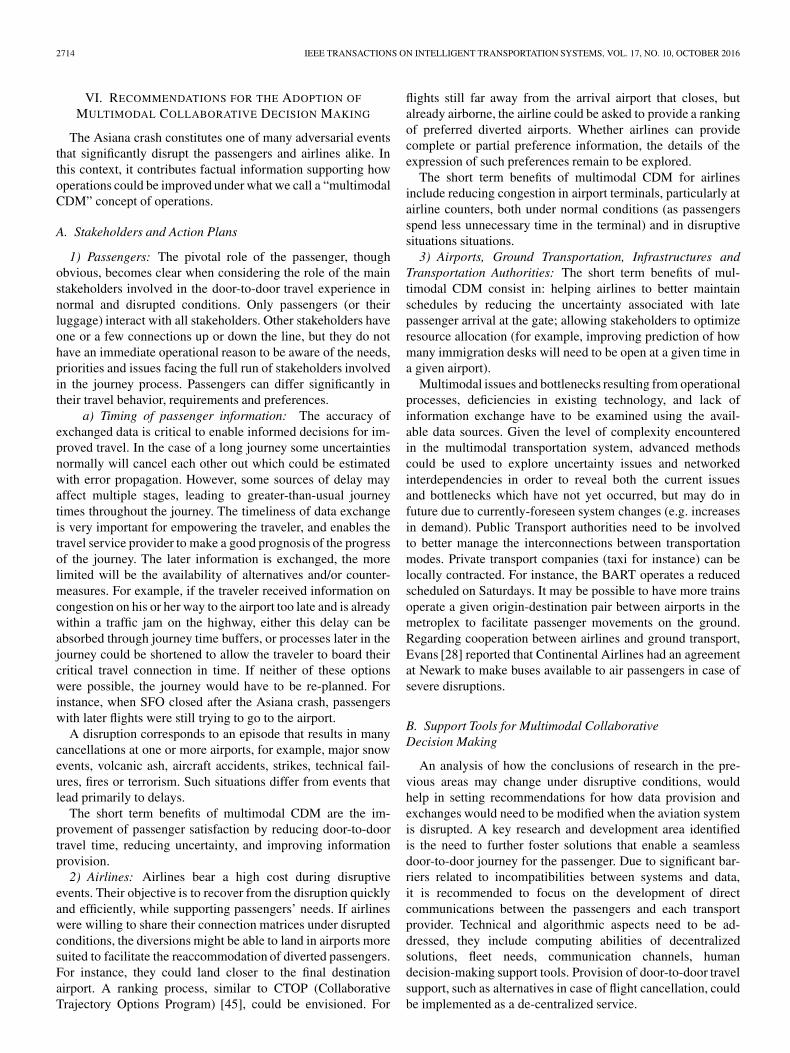
margins are not enough to mitigate the peak, and therefore air-borne holding time is used to delay aircraft. However, as shownin Fig. 19, the airborne holding times are below 15 minutesand well below safety limits and reserve times. Because ofthe objective function that minimizes arrival delay, the aircraftland as soon as possible, favoring taxi-in delay over airborneholding. Fig. 20 illustrates when the taxi-in modulations arenot sufficient. The larger the gate occupancy, the more airborneholding time is allocated, but it remains low. Also it should be
Fig. 18. Number of flights landing at SJC and OAK, and associated delaysfor each scenario. (a) Number of flights landing for gate_time = 60 min.(b) number of flights landing for gate_time = 90 min. (c) number of flightslanding for gate_time = 120 min.
noted that a few flights arrive a few minutes earlier at OAKor SJC than their scheduled time at SFO, but this comes fromthe fact that their flight time slightly diminishes, for the flightscoming from the East for instance.
MARZUOLI et al.: DISRUPTION MANAGEMENT WITH MULTIMODAL COLLABORATIVE DECISION-MAKING 2713
Fig. 19. Trade-offs between Airborne holding at SJC and OAK for eachscenario. (a) Average Taxi vs airborne holding time for gate_time = 60 min;(b) Average Taxi vs airborne holding time for gate_time = 90 min; (c) AverageTaxi vs airborne holding time for gate_time = 120 min.
Overall, the optimization performed demonstrates that mostdiverted flights could have landed in the Bay Area, even withuncertainty present. However, it is understandable that safetywas a priority and that grounding flights wherever possiblewhen the situation was unclear was the best solution. With fu-ture concepts of operations, including better information shar-ing throughout the system between airports, carriers, regardingestimated arrival times and remaining capacities, it is expected
Fig. 20. Average Flight Delay, Airborne Holding and Taxi-in Times at SJC andOAK for each scenario. (a) Delay, taxi and airborne holding time evolution forgate_time = 60 min. (b) Delay, taxi and airborne holding time evolution forgate_time = 90 min. (c) Delay, taxi and airborne holding time evolutionfor gate_time = 120 min.
that crisis management will be handled better and avoid thediversions of thousands of passengers to far-away airports,causing many issues related to reaccommodation, customs, andcarrier support to name a few.
2714 IEEE TRANSACTIONS ON INTELLIGENT TRANSPORTATION SYSTEMS, VOL. 17, NO. 10, OCTOBER 2016
VI. RECOMMENDATIONS FOR THE ADOPTION OF
MULTIMODAL COLLABORATIVE DECISION MAKING
The Asiana crash constitutes one of many adversarial eventsthat significantly disrupt the passengers and airlines alike. Inthis context, it contributes factual information supporting howoperations could be improved under what we call a “multimodalCDM” concept of operations.
A. Stakeholders and Action Plans
1) Passengers: The pivotal role of the passenger, thoughobvious, becomes clear when considering the role of the mainstakeholders involved in the door-to-door travel experience innormal and disrupted conditions. Only passengers (or theirluggage) interact with all stakeholders. Other stakeholders haveone or a few connections up or down the line, but they do nothave an immediate operational reason to be aware of the needs,priorities and issues facing the full run of stakeholders involvedin the journey process. Passengers can differ significantly intheir travel behavior, requirements and preferences.
a) Timing of passenger information: The accuracy ofexchanged data is critical to enable informed decisions for im-proved travel. In the case of a long journey some uncertaintiesnormally will cancel each other out which could be estimatedwith error propagation. However, some sources of delay mayaffect multiple stages, leading to greater-than-usual journeytimes throughout the journey. The timeliness of data exchangeis very important for empowering the traveler, and enables thetravel service provider to make a good prognosis of the progressof the journey. The later information is exchanged, the morelimited will be the availability of alternatives and/or counter-measures. For example, if the traveler received information oncongestion on his or her way to the airport too late and is alreadywithin a traffic jam on the highway, either this delay can beabsorbed through journey time buffers, or processes later in thejourney could be shortened to allow the traveler to board theircritical travel connection in time. If neither of these optionswere possible, the journey would have to be re-planned. Forinstance, when SFO closed after the Asiana crash, passengerswith later flights were still trying to go to the airport.
A disruption corresponds to an episode that results in manycancellations at one or more airports, for example, major snowevents, volcanic ash, aircraft accidents, strikes, technical fail-ures, fires or terrorism. Such situations differ from events thatlead primarily to delays.
The short term benefits of multimodal CDM are the im-provement of passenger satisfaction by reducing door-to-doortravel time, reducing uncertainty, and improving informationprovision.
2) Airlines: Airlines bear a high cost during disruptiveevents. Their objective is to recover from the disruption quicklyand efficiently, while supporting passengers’ needs. If airlineswere willing to share their connection matrices under disruptedconditions, the diversions might be able to land in airports moresuited to facilitate the reaccommodation of diverted passengers.For instance, they could land closer to the final destinationairport. A ranking process, similar to CTOP (CollaborativeTrajectory Options Program) [45], could be envisioned. For
flights still far away from the arrival airport that closes, butalready airborne, the airline could be asked to provide a rankingof preferred diverted airports. Whether airlines can providecomplete or partial preference information, the details of theexpression of such preferences remain to be explored.
The short term benefits of multimodal CDM for airlinesinclude reducing congestion in airport terminals, particularly atairline counters, both under normal conditions (as passengersspend less unnecessary time in the terminal) and in disruptivesituations situations.
3) Airports, Ground Transportation, Infrastructures andTransportation Authorities: The short term benefits of mul-timodal CDM consist in: helping airlines to better maintainschedules by reducing the uncertainty associated with latepassenger arrival at the gate; allowing stakeholders to optimizeresource allocation (for example, improving prediction of howmany immigration desks will need to be open at a given time ina given airport).
Multimodal issues and bottlenecks resulting from operationalprocesses, deficiencies in existing technology, and lack ofinformation exchange have to be examined using the avail-able data sources. Given the level of complexity encounteredin the multimodal transportation system, advanced methodscould be used to explore uncertainty issues and networkedinterdependencies in order to reveal both the current issuesand bottlenecks which have not yet occurred, but may do infuture due to currently-foreseen system changes (e.g. increasesin demand). Public Transport authorities need to be involvedto better manage the interconnections between transportationmodes. Private transport companies (taxi for instance) can belocally contracted. For instance, the BART operates a reducedscheduled on Saturdays. It may be possible to have more trainsoperate a given origin-destination pair between airports in themetroplex to facilitate passenger movements on the ground.Regarding cooperation between airlines and ground transport,Evans [28] reported that Continental Airlines had an agreementat Newark to make buses available to air passengers in case ofsevere disruptions.
B. Support Tools for Multimodal CollaborativeDecision Making
An analysis of how the conclusions of research in the pre-vious areas may change under disruptive conditions, wouldhelp in setting recommendations for how data provision andexchanges would need to be modified when the aviation systemis disrupted. A key research and development area identifiedis the need to further foster solutions that enable a seamlessdoor-to-door journey for the passenger. Due to significant bar-riers related to incompatibilities between systems and data,it is recommended to focus on the development of directcommunications between the passengers and each transportprovider. Technical and algorithmic aspects need to be ad-dressed, they include computing abilities of decentralizedsolutions, fleet needs, communication channels, humandecision-making support tools. Provision of door-to-door travelsupport, such as alternatives in case of flight cancellation, couldbe implemented as a de-centralized service.
MARZUOLI et al.: DISRUPTION MANAGEMENT WITH MULTIMODAL COLLABORATIVE DECISION-MAKING 2715
1) Information Sharing: According to SITA Air TransportIT review [46], “the air transport industry is shifting towards anew era of continuous engagement. (. . .) it is creating risingdemand for more relevant services and giving airlines andairports opportunities to offer passengers enhanced personal-ization.” This SITA survey indicates that “airlines” sights areset on providing a real-time service experience, targeted at theirpassengers’ journeys, via smartphone apps: 65% of airlinesplan to do this by the end of 2017, up from 13% today. Highon the airport agenda are updates on wait-times and localtraffic issues: 18% offer them today, with another 55% makingplans for this service.” Moreover, in the recovery process,“[passengers] are expecting airlines and airports to providea personal alert and response when flights are canceled ordelayed.” Smartphones and other communication technologiesopen up a myriad of opportunities to provide disruption man-agement services to passengers. The use of new technologies isbecoming more and more commonplace in case of unexpectedevents: “A third of airports are able to provide real-time infor-mation to passenger mobiles in the event of disruption, witha further third doing so by 2017.” The continuous provisionof information to the passenger is facilitated by the fact that“almost every passenger (97%) carries a smartphone, tablet orlaptop.”
Recent events such as the Asiana Crash and the ensuingmultimodal ripple effects clearly illustrated the fragility of thesystem, the costs associated with not reacting effectively andhence the need of coordination. The FAA, the EC, Eurocontroland others have responded positively to mitigate disruptiveevents and spread the CDM concept but more could be done,such as: delivery protocols that enable levels of filtered alert in-formation to be passed through the network; a web “dashboard”of status information to which stakeholders could contribute,which provides real-time information to all stakeholders re-questing access. For instance, CDG website provides real-timeon-time performance reports to anyone in the air transportationindustry that previously requested an account. Airlines acrossthe world use it to monitor their flights and evaluate if theirpassengers are likely to make their connections; the establish-ment of intelligence/alert units that can capture non-operationalfeatures such as meteorological or security data and make themavailable to the network.
The identification of existing data availability, technologyand data flows is necessary. To accurately evaluate perfor-mance, the available data from many data sources and reportingmethods needs to be understood as a whole. Unless givenincentives or provided with potential benefits, stakeholders areconcerned that by sharing their data they are submitting them-selves to open comparison with competitors. Data provision andanalysis could also be a way to enable multimodal ticketing,which could help significantly streamline multimodal journeys.
The duality between competition and cooperation can be anobstacle to multimodal CDM. The proposed concept involvesinformation exchange between various stakeholders who maybe competing. The different data sources, their availability,and aspects of confidentiality have to be investigated. A trade-off between the performance of the solution of a multimodalnetwork optimization and constraints in data provision shouldbe established. Antitrust concerns should be addressed as well.
2) Resource Allocation: Several limits to passenger reac-commodation need to be addressed. The capacity of other airservices to provide spare seats for passengers from canceledflights is a key factor affecting recovery from crisis events. Innormal operations, airlines try to maximize their load factors.In crisis events, however, faster recovery is aided by lower loadfactors on subsequent flights. Putting passengers on groundtransport is feasible only if there are enough seats at suitabletimes. The ability of ground transportation providers to supportstranded passengers varies greatly by location. Several limita-tions may arise, including lack of spare rolling stock, staff avail-ability and training for the routes needed, and infrastructurelimits. Multimodal CDM could be decomposed into options,with several multimodal touch points, such as the BART stationat OAK airport. In the context of metroplex operations underdisruptions, playbooks could be developed, to provide structureand guidance. Cases such as a sudden and unforeseeable airportclosure could be addressed.
Zhang et al. proposed a Regional Ground Delay Program(Regional GDP) [47]. When a hub airport located in a regionalairport system encounters a severe airside capacity reduction,air traffic flow managers could not only evaluate the imbalanceof traffic demand and terminal capacity at the hub airport butalso excess capacity at other airports in the same region, as-suming that airlines could incorporate ground modes into theirdisruption management and use ground vehicles to transportpassengers and crew members between original scheduled anddiverted airports. The case study of the Asiana Crash suggeststhat a regional GDP, including LAX, LAS, SMF and RNO air-ports, may have helped mitigate the disruption. The feasibilityof multimodal CDM could be facilitated through the existingand successful initiatives constituted by GDPs and CDM.
Moreover, mathematical models, supported by the appro-priate data sources and processes, and feeding into decision-support tools, need to be developed, for different timehorizons, from strategic to tactical planning. Algorithms sup-porting distributed multimodal optimization with reasonablecomputational times and robust margins need to be studied andimplemented.
3) Decision Making: Multimodal collaborative DecisionMaking necessarily involves multiple stakeholders. The sys-temic nature of aviation means that those stakeholders areinternational as well as national and local. In the case of theAsiana crash, not only was SFO airport involved and all entitiesdealing with airport closure and passenger evacuation, but alsothe California Highway Patrol, Taxi Companies operating outof SJC and OAK, custom and border representatives at anyairport where flight diversions landed, to name a few. Similarly,working together, these organizations can enhance the passen-ger experience in normal as well as disrupted conditions. Thekey to delivering effective multimodal CDM is communication.Communication is a means to an end: it will help improvedecision-making, and the data sharing will support the use ofdecentralized optimization models. The structure of the deci-sion space for all stakeholders needs to be better understood.There could be a pre-established metroplex playbook indicatingwhich stakeholder to involve at which stage of the decisionprocess. Real-time, tactical and strategic decision-making mayrequire the involvement of different stakeholders. Efficiency,
2716 IEEE TRANSACTIONS ON INTELLIGENT TRANSPORTATION SYSTEMS, VOL. 17, NO. 10, OCTOBER 2016
whether cost efficiency or time efficiency for instance, ofthe decision-making aims at making the passenger journeyseamless or recovering from a disruption as fast as possible.Multimodal CDM could also be tied to SWIM (System WideInformation Management), in the sense that it would provide abroad base information management system including passen-gers and local transportation networks.
The timing of decisions on the Air Traffic Control side couldbe investigated. By comparing the initial flight plan and thetrajectories followed by diverted aircraft, the timing of thediversions could be retrieved. More might be uncovered onthe tactical traffic control aspects for the entire airspace.
VII. CONCLUSION
The present paper aimed at making the case for the extensionof Collaborative Decision Making to the Multimodal Networklevel. It tackled, in hindsight, how the disruption caused by theAsiana Crash could have been better managed, at the systemlevel. The consequences of the crash may have been bettermitigated, for both the stakeholders and passengers, had Multi-modal Network CDM been in place. Two optimization modelswere developed to improve the crisis management following thecrash. The passenger-centric optimization aimed at balancingcost and delays with a multimodal reaccommodation schemefrom each diversion airport. It showed that multimodal col-laboration to reroute passengers could have helped passengerswithin an 8-hour bus drive radius reach the Bay Area on thecrash day, instead of waiting up to several days for flightsin diverted airports. The flight-centric optimization aimed atallocating flight diversions to SJC and OAK while balancingrunway and gate capacity, and minimizing flight delays. Itshowed that there was potentially more capacity at SJC andOAK to accommodate more diverted flights on the crash day,which could have mitigated many of the ripple effects for bothpassengers, airlines and airports. One of the main obstacles tooptimal capacity utilization in crises is information sharing andcollaborative decision making between all stakeholders. Thiswould improve the performance of the air transportation systemboth from a flight-centric and a passenger-centric perspective.Then recommendations were elaborated to expand CDM to themultimodal network level and highlighted the expected benefitsfor all stakeholders and passengers.
The higher-level goal of this paper is to foster a better under-standing of multimodal transportation to increase its resilienceand facilitate the passenger door-to-door journey. This researchcan provide the first experimental basis upon which severalsystem engineering methods could be applied to improve theentire passenger journey.
REFERENCES
[1] Annual Passenger Total Approaches 3 Billion, International Civil AviationOrganization (ICAO), Montreal, QC, Canada, 2012.
[2] Flightpath 2050—Europe’s Vision for Aviation (Report of the High LevelGroup on Aviation Research), European Commission, Brussels, Belgium,2011. Accessed on: Jul. 18, 2014. [Online]. Available: http://ec.europa.eu/transport/modes/air/doc/flightpath2050.pdf
[3] White Paper: Roadmap to a Single European Transport Area—Towardsa Competitive and Resource Efficient Transport System, European Com-mission, Brussels, Belgium, 2011. [Online]. Available: http://ec.europa.eu/transport/themes/strategies/2011_white_paper_en.htm
[4] World Economic Forum, “Connected world: Transforming travel,transportation and supply chains,” Cologny, Switzerland, 2013. [Online].
Available: http://www3.weforum.org/docs/WEF_MO_ConnectedWorld_Report_2013.pdf
[5] Smart Travel: Unlocking Economic Growth and Development ThroughTravel Facilitation, World Economic Forum, Cologny, Switzerland,2014. [Online]. Available: http://www3.weforum.org/docs/GAC/2014/WEF_GAC_TravelTourism_SmartTravel_WhitePaper_2014.pdf
[6] Airline On-Time Statistics and Delay Causes, U.S. Department of Trans-portation, Washington, DC, USA, 2009. [Online]. Available: http://www.transtats.bts.gov/ot_delay/ot_delaycause1.asp
[7] A. Mukherjee, M. Ball, and B. Subramanian, “Models for estimatingmonthly delays and cancellations in the NAS,” presented at the NEXTORNational Airspace System Performance Metrics Conf., Pacific Grove, CA,USA, 2006.
[8] N. Pyrgiotis, K. Malone, and A. Odoni, “Modelling delay propagationwithin an airport network,” Transp. Res. C, Emerging Technol., vol. 27,pp. 60–75, Feb. 2011.
[9] N. Nayak, “Estimation of the impact of single airport and multi-airportsystem delay on the National Airspace System using multivariate simulta-neous models,” Ph.D. dissertation, Dept. Civil Environ. Eng., Univ. SouthFlorida, Tampa, FL, USA, 2012.
[10] S. AhmadBeygi, A. Cohn, Y. Guan, and P. Belobaba, “Analysis of thepotential for delay propagation in passenger airline networks,” J. AirTransp. Manage., vol. 14, no. 5, pp. 221–236, Sep. 2008.
[11] N. Jafari and S. Hessameddin Zegordi, “Simultaneous recovery model foraircraft and passengers,” J. Franklin Inst., vol. 348, no. 7, pp. 1638–1655,Sep. 2011.
[12] J. D. Petersen, G. Sölveling, J.-P. Clarke, E. L. Johnson, and S. Shebalov,“An optimization approach to airline integrated recovery,” Transp. Sci.,vol. 46, no. 4, pp. 482–500, Nov. 2012.
[13] NextGen Implementation Plan 2015, Federal Aviation Administration,Washington, DC, USA. Accessed on: Apr. 6, 2016. [Online].Available: https://www.faa.gov/nextgen/media/NextGen_Implementation_Plan-2015.pdf
[14] C. Schumer and C. Maloney, Your Flight has Been Delayed Again: FlightDelays Cost Passengers, Airlines, and the US Economy Billions,” TheU.S. Senate Joint Economic Committee, Washington, DC, USA, 2008.
[15] Concept of Operations for the Next Generation Air Transportation Sys-tem, vol. 3, Joint Planning and Development Office, Washington, DC,USA, 2007.
[16] S. Atkins, “Observation and measurement of metroplex phenomena,” inProc. IEEE/AIAA 27th DASC, 2008, pp. 3.E.2-1–3.E.2-15.
[17] L. Ren et al., “Contrast and comparison of metroplex operations, pre-sented at the 9th AIAA Aviation Technology, Integration, OperationsConf., Hilton Head, SC, USA, 2009, Paper AIAA 2009-7134.
[18] J.-P. Clarke et al., “Evaluating concepts for metroplex operations,” pre-sented at the AIAA Aviation, Technology, Integration, Operations Conf.,Fort Worth, TX, USA, 2010, Paper AIAA 2010-9249.
[19] L. Li, J. W. Park, and J.-P. Clarke, “A simulation-based method for es-timating metroplex efficiency,” in Proc. IEEE/AIAA 30th DASC, 2011,pp. 2E4-1–2E4-10.
[20] D. DeLaurentis, S. Landry, D. Sun, F. Wieland, and A. Tyagi, “A conceptfor flexible operations and optimized traffic into metroplex regions,” Nat.Aeron. Space Admin., Langley Res. Center, Hampton, VA, USA, NASACR-2011-217302, 2011.
[21] M. Wambsganss, “Collaborative decision making through dynamic infor-mation transfer,” Air Traffic Control Quart., vol. 4, no. 2, pp. 107–123,1996.
[22] K. Chang et al., “Enhancements to the FAA ground-delay program undercollaborative decision making,” Interfaces, vol. 31, no. 1, pp. 57–76,Jan./Feb. 2001.
[23] M. O. Ball, C.-Y. Chen, R. Hoffman, and T. Vossen, “Collaborativedecision making in air traffic management: current and future researchdirections,” in New Concepts and Methods in Air Traffic Management.Berlin, Germany: Springer-Verlag, 2001, pp. 17–30.
[24] P. Burgain, E. Feron, and J.-P. Clarke, “Collaborative virtual queue:Benefit analysis of a collaborative decision making concept appliedto congested airport departure operations,” Air Traffic Control Quart.,vol. 17, no. 2, pp. 195–222, 2009.
[25] G. Gupta, W. Malik, and Y. C. Jung, “An integrated collaborative de-cision making and tactical advisory concept for airport surface opera-tions management,” presented at the 12th AIAA Aviation Technology,Integration, Operations Conf., Indianapolis, IN, USA, 2012, Paper AIAA2012-5651.
[26] T. Bolic and Z. Sivcev, “Eruption of Eyjafjallajökull in Iceland: Experi-ence of European air traffic management,” Transp. Res. Rec., no. 2214,pp. 136–143, 2011.
[27] Y. Zhang and M. Hansen, “Real-time intermodal substitution: Strategyfor airline recovery from schedule perturbation and for mitigation ofairport congestion,” Transp. Res. Rec., J. Transp. Res. Board, no. 2052,pp. 90–99, 2008.

MARZUOLI et al.: DISRUPTION MANAGEMENT WITH MULTIMODAL COLLABORATIVE DECISION-MAKING 2717
[28] A. D. Evans, “Responses to airport delays: A system study of newark inter-national airport,” Ph.D. dissertation, Dept. Aerospace Eng. MIT,Cambridge, MA, USA, 2002.
[29] A. Cook, G. Tanner, S. Cristóbal, and M. Zanin, “Passenger-orientedenhanced metrics,” presented at the 2nd SESAR Innovation Days,Braunschweig, Germany, Nov. 27–29, 2012.
[30] S. Bratu and C. Barnhart, “Flight operations recovery: New approachesconsidering passenger recovery,” J. Sched., vol. 9, no. 3, pp. 279–298,Jun. 2006.
[31] D. Wang, “Methods for analysis of passenger trip performance in a com-plex networked transportation system,” Ph.D. dissertation, Dept. Syst.Eng. Oper. Res., George Mason Univ., Fairfax, VA, USA, 2007.
[32] M. Ball, “Analysis of passenger delays: Developing a passenger delaymetric,” presented at the NEXTOR National Airspace System Perfor-mance Metrics Conf., Pacific Grove, CA, USA, 2006.
[33] National Transportation Safety Board, “Public hearing final transcript,investigation of the Asiana Airlines Flight 214 landing accident atSan Francisco International Airport, California, July 6, 2013,” Washington,DC, USA, 2014. [Online]. Available: http://dms.ntsb.gov/pubdms/search/document.cfm?docID=413233&docketID=55433&mkey=87395
[34] San Francisco Crash Sends Ripple Effect to Seattle, King 5 News, Seattle,WA, USA, 2013. [Online]. Available: http://www.king5.com/story/tech/science/aerospace/2014/08/04/13272742/
[35] Some Flights Scheduled to Land at SFO Diverted to LAX. [On-line]. Available: http://losangeles.cbslocal.com/2013/07/06/some-flights-scheduled-to-land-at-sfo-diverted-to-lax/.UdilzcAoKEM.twitter
[36] Flights Forced to Land at Sacramento Airport After SFO Shuts Down.[Online]. Available: http://www.news10.net/story/local/2013/07/06/4755695/
[37] “Domestic and international flights diverted to Sacramento following SanFrancisco plane crash,” CBS Sacramento, Sacramento, CA, USA, 2013.
[38] E. K. Dan Nakaso and B. Newman, “SFO crash causes chaos inCalifornia skies,” Willits News, Willits, CA, USA, 2013. [Online].Available: http://www.willitsnews.com/ci_23610546/sfo-crash-causes-chaos-california-skies
[39] Aircraft Diversions at SJC Due to Asiana Accident at SFO. [Online].Available: http://www.piersystem.com/external/content/document/1914/1841923/1/07-09-13AIRPORT.PDF
[40] T. D. Larsen, “A behavioral framework for managing massive airline flightdisruptions through crisis management, organization development, and or-ganization learning,” M.S. thesis, Dept. Manage., Eng., Aerosp., Transp.,Univ. Maryland Univ. College, Upper Marlboro, MD, USA, 2013.
[41] Jenkins and Cotton, “Improving airline profitability through better es-timated times of arrival and terminal area flight information: A betteranalysis of PASSUR,” PASSUR Aerospace, Stamford, CT, USA, 2002.[Online]. Available: http://www.passur.com
[42] A. Marzuoli et al., “Multimodality in a metroplex environment: A casestudy in the San Francisco Bay area,” presented at the AIAA Infotech@ Aerospace, AIAA SciTech, Kissimmee, FL, USA, 2015, Paper AIAA2015-1571.
[43] C. Quinn and R. E. Zelenka, “ATC/air carrier collaborative arrival plan-ning,” in Proc. 2nd USA/Europe Air Traffic Manage. Semin., 1998,pp. 1–4.
[44] S. H. Kim and E. Feron, “Impact of gate assignment on departuremetering,” IEEE Trans. Intell. Transp. Syst., vol. 15, no. 2, pp. 699–709,Apr. 2014.
[45] A. Kim and M. Hansen, “A framework for the assessment of collabo-rative en route resource allocation strategies,” Transp. Res. C, EmergingTechnol., vol. 33, pp. 324–339, Aug. 2013.
[46] SITA, “Ready for the connected traveler, Air Transp. IT Rev., no. 1,pp. 1–40, 2015. [Online]. Available: http://www.sita.aero/content/Air-Transport-IT-Review-Issue-1-2015
[47] Y. Zhang and M. Hansen, “Regional gdp—extending ground delay pro-grams to regional airport systems,” in Proc. 8th USA/Europe Air TrafficManage. Res. Develop. Semin., Napa, CA, USA, 2009, p. 6.
Aude Marzuoli received French EngineeringDiploma from Supelec in 2012 and the Master’sand Ph.D. degrees in aerospace engineeringfrom Georgia Institute of Technology, Atlanta,GA, USA, in 2012 and 2015, respectively. Shepreviously worked with NASA Ames, SESAR JointUndertaking, and the French National School ofAviation.
Emmanuel Boidot received the Master’s degrees incomputer science and in aerospace engineering fromGeorgia Institute of Technology, and the Master’sdegree in electrical engineering and computer sci-ence from Supelec in 2011. He is currently workingtoward the Ph.D. degree in aerospace engineeringwith Georgia Institute of Technology. His researchinterests include robotics, game theory, networks,and air transportation.
Pablo Colomar received the Master’s degree inindustrial engineering from Polytechnic Universityof Catalonia in 2014 and the Master’s degree inmechanical engineering and management from Tech-nische Universitat Munchen in 2015.
Mathieu Guerpillon received the Master’s degreein aerospace engineering from Georgia Institute ofTechnology and the French Engineering Diplomafrom Supelec in 2014.
Eric Feron received the B.S., M.S. and Ph.D. de-grees from Ecole Polytechnique, France, Ecole Nor-male Superieure, France and Stanford University,U.S. Since 2005, he has been the Dutton-DucoffeProfessor of Aerospace Software Engineering,Georgia Institute of Technology. From 1993 to 2005,he was with the Department of Aeronautics andAstronautics, Massachusetts Institute of Technol-ogy. His interests include the fundamental conceptsof control systems, optimization and computer sci-ence to address important problems in aerospace
engineering, such as aerobatic control of unmanned aerial vehicles, multi-agent operations, air traffic control systems, and aerospace software systemcertification.
Alexandre Bayen received the Engineering degreein applied mathematics from Ecole Polytechnique,France, in 1998; the M.S. degree in aeronauticsand astronautics from Stanford University in 1999;and the Ph.D. degree in aeronautics and astronauticsfrom Stanford University in 2003. He was a Visit-ing Researcher with NASA Ames Research Centerfrom 2000 to 2003. In 2004, he worked as a Re-search Director of the Autonomous Navigation Lab-oratory at Laboratoire de Recherches Balistiques etAerodynamiques, (Ministere de la Defense, Vernon,
France), where he holds the rank of Major. He is currently an Associate Chan-cellor Professor, and has been the Director of the Institute for TransportationStudies (ITS) since 2014.
Mark Hansen received the Bachelor of Arts degreein physics and philosophy from Yale University in1980 and the Master’s degree in city planning andthe Ph.D. degree in transportation engineering fromUC Berkeley in 1984 and 1988, respectively. Heis the codirector of National Center for Excellencein Aviation Operations Research (NEXTOR). Hisresearch interests include transportation economics,policy and planning, air transportation, and publictransportation.