Embed Size (px)
Citation preview

1
Improving digital infrastructure for a
better connected Thailand
2
Economies across the globe are going digital fast
The Global GDP forecast 2017
140 countries have developed national
broadband plan strategy or policy - ITU
Industry 4.0
Internet Plus
Advanced
Manufacturing 2.0 Digital Canada 150
Smart Digital Malaysia
Nigeria National
Broadband Strategy
Connected
Argentina
Economies are setting policies to
encourage ICT investment
Singapore Smart Nation Digital Thailand
2.7
2.6
2.4
2.8
2.9 3.0 2.9
2014 2015 2016 2017 2018 2019 2020
Global GDP Growth Rate
Source: IMF, percentage change (market exchange rates)
3
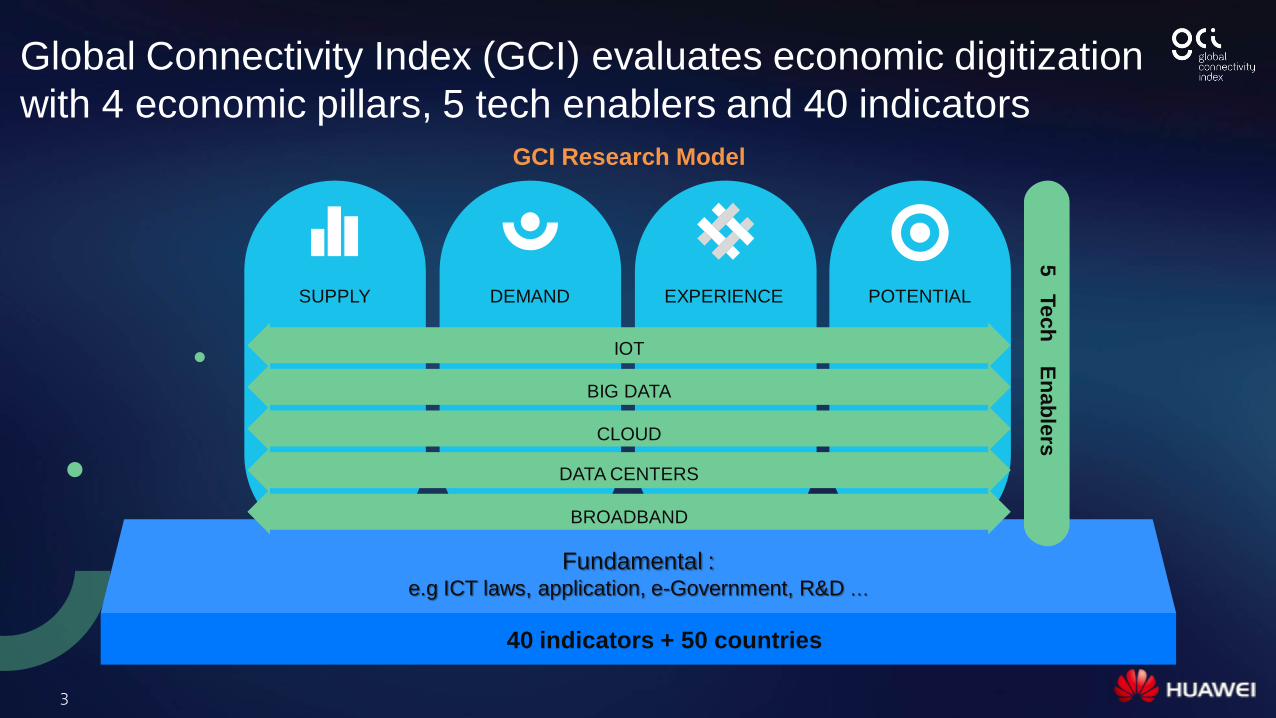
Global Connectivity Index (GCI) evaluates economic digitization
with 4 economic pillars, 5 tech enablers and 40 indicators
SUPPLY DEMAND EXPERIENCE POTENTIAL
Fundamental : e.g ICT laws, application, e-Government, R&D …
GCI Research Model
IOT
BIG DATA
CLOUD
DATA CENTERS
BROADBAND
5 T
ech
En
ab
lers
40 indicators + 50 countries
4
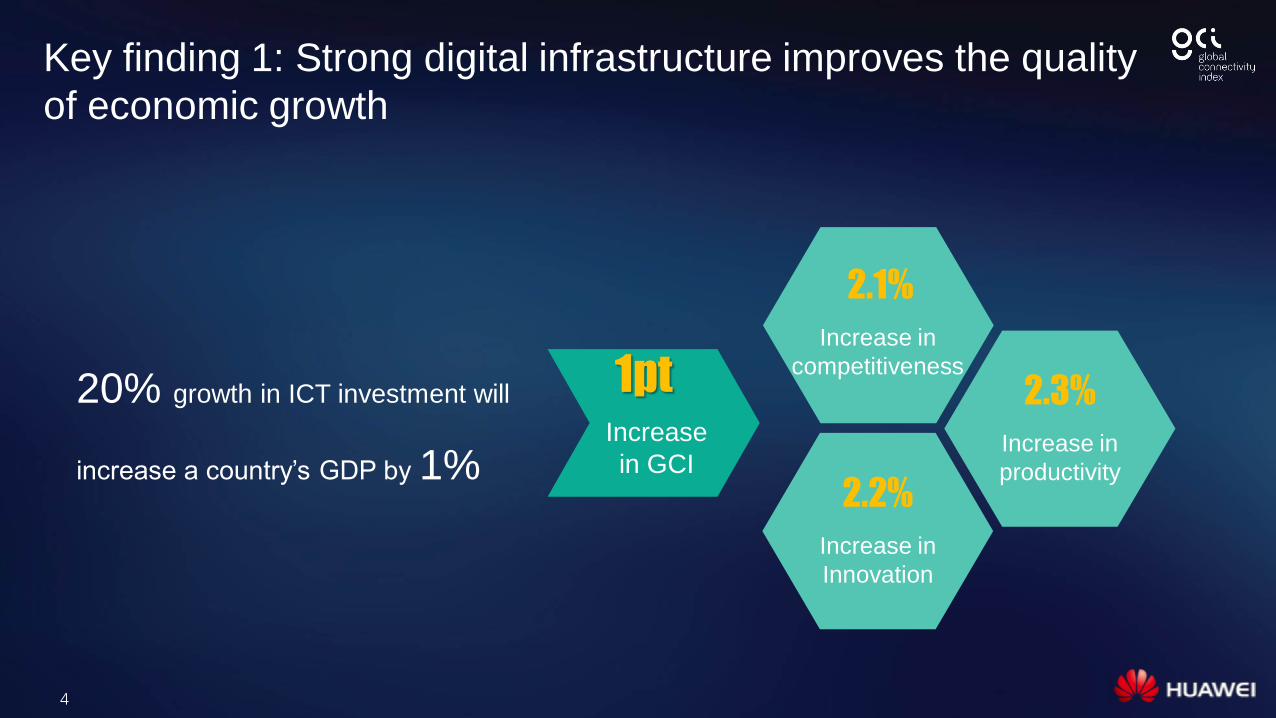
Key finding 1: Strong digital infrastructure improves the quality
of economic growth
1pt Increase
in GCI
2.1%
Increase in
competitiveness
2.2%
Increase in
Innovation
2.3%
Increase in
productivity
20% growth in ICT investment will
increase a country’s GDP by 1%
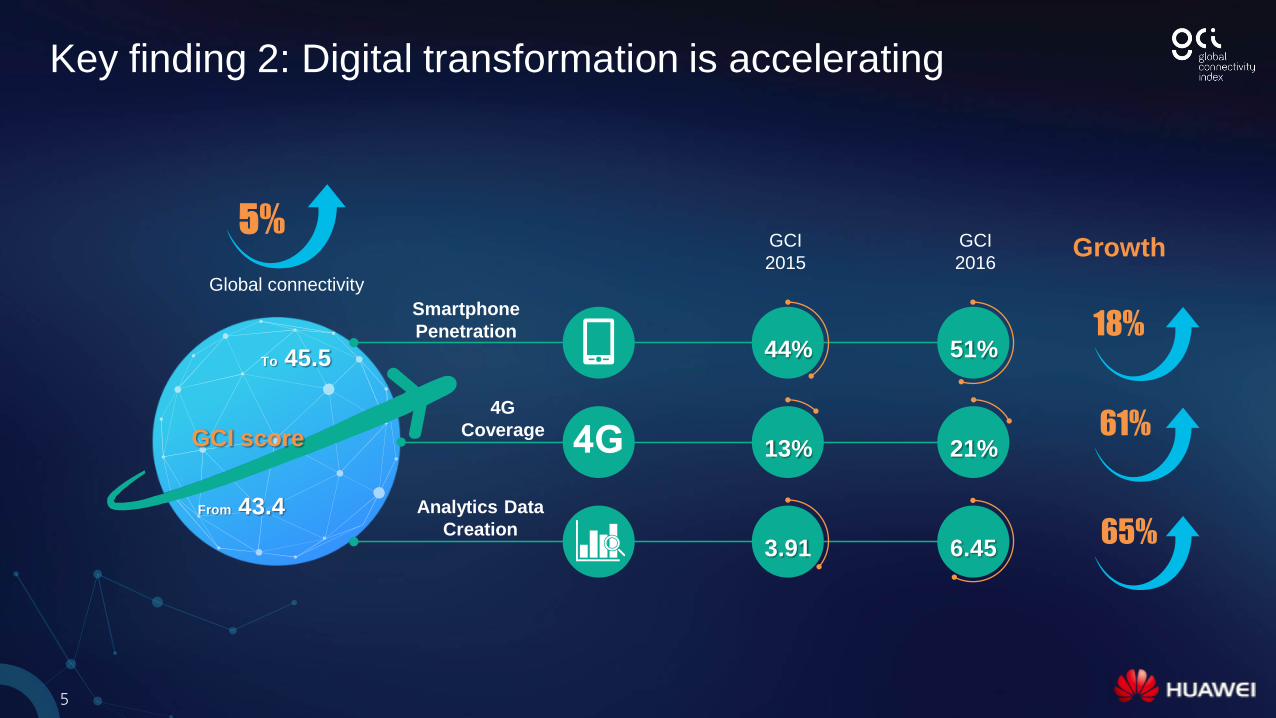
5
Key finding 2: Digital transformation is accelerating
51%
6.45
18%
61%
65%
GCI
2016 Growth GCI
2015
Smartphone
Penetration
4G
Coverage
Analytics Data
Creation
44%
13%
3.91
21% GCI score
From 43.4
To 45.5
Global connectivity
5%
6
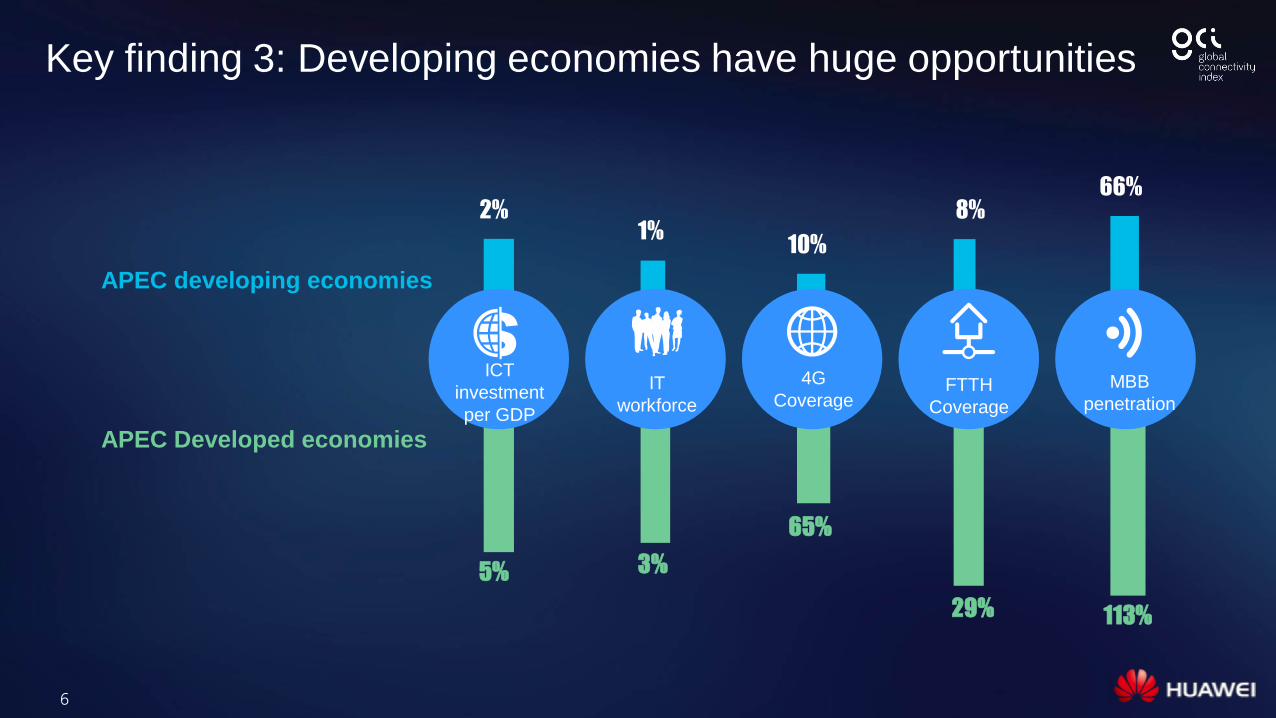
Key finding 3: Developing economies have huge opportunities
APEC developing economies
ICT
investment
per GDP
IT
workforce FTTH
Coverage
MBB
penetration
2% 1%
10%
8% 66%
5% 3%
65%
29% 113%
APEC Developed economies
4G
Coverage
7
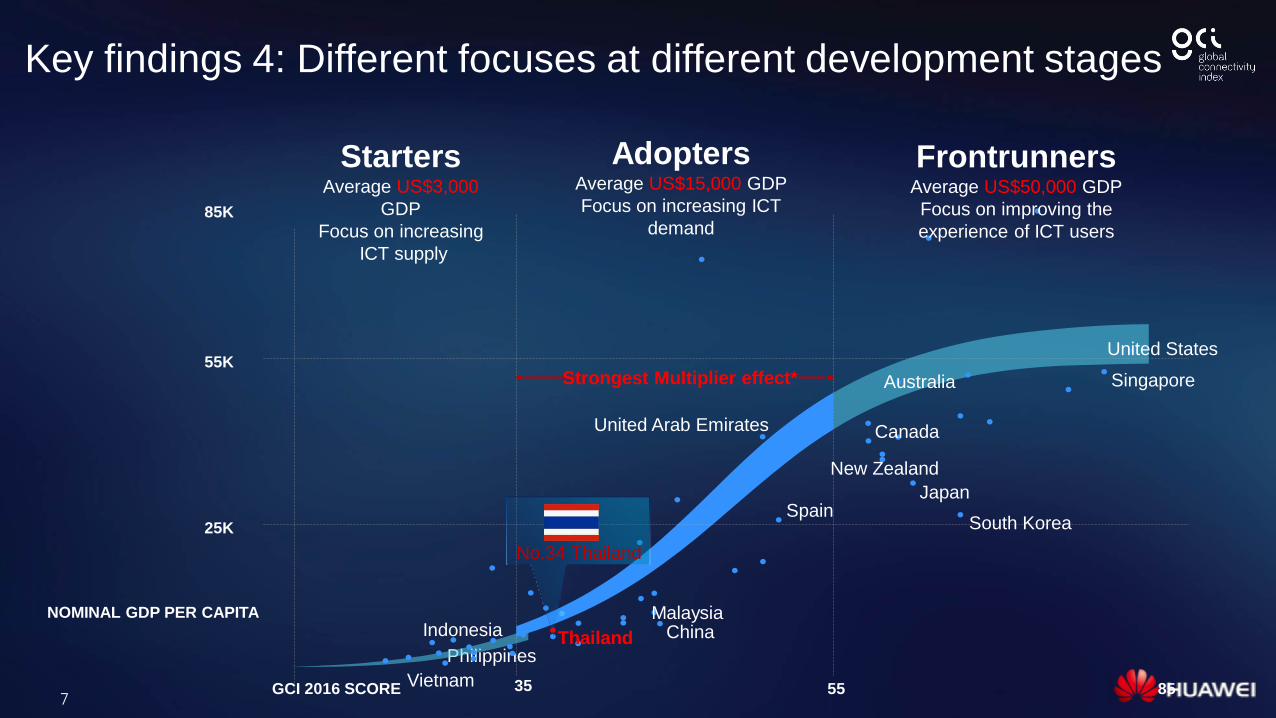
Key findings 4: Different focuses at different development stages
85K
55K
25K
GCI 2016 SCORE
NOMINAL GDP PER CAPITA
35 55 85 Vietnam
Philippines
Indonesia Thailand China Malaysia
South Korea
Japan
New Zealand
Canada
Australia Singapore
United States
Strongest Multiplier effect*
Starters Average US$3,000
GDP
Focus on increasing
ICT supply
Adopters Average US$15,000 GDP
Focus on increasing ICT
demand
Frontrunners Average US$50,000 GDP
Focus on improving the
experience of ICT users
No.34 Thailand
Spain
United Arab Emirates
8
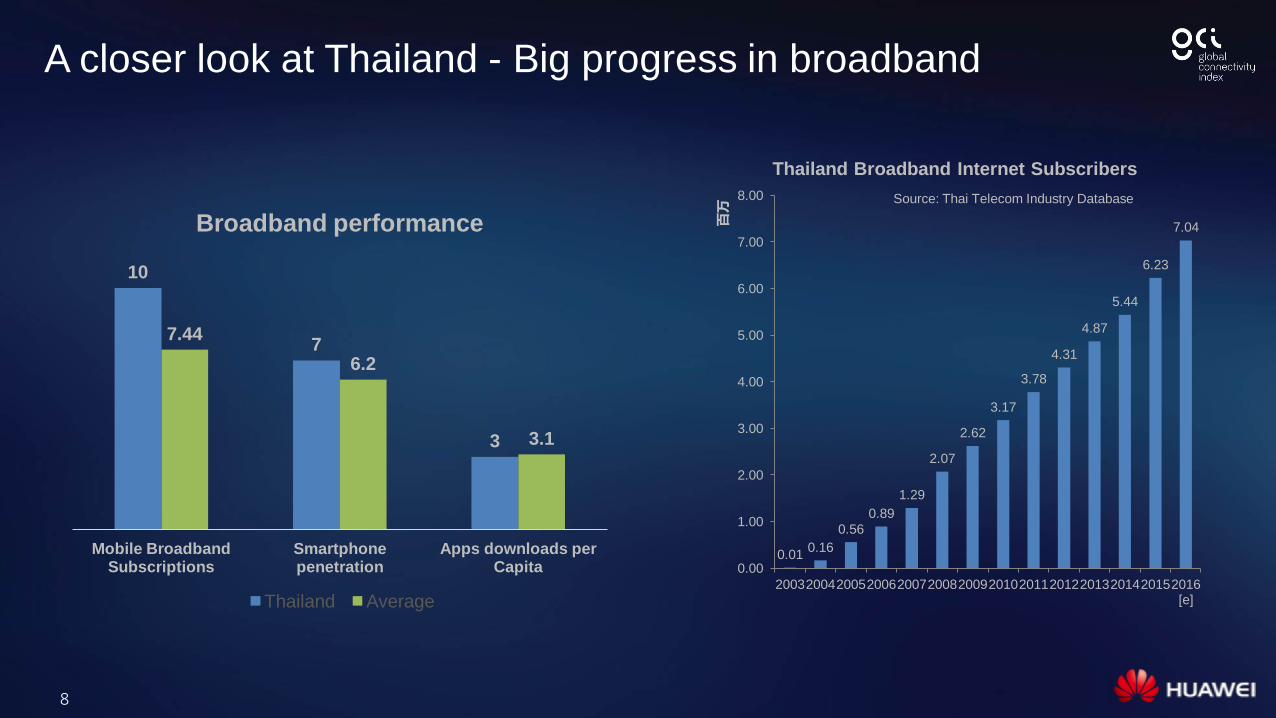
A closer look at Thailand - Big progress in broadband
10
7
3
7.44
6.2
3.1
Mobile Broadband Subscriptions
Smartphone penetration
Apps downloads per Capita
Broadband performance
Thailand Average
0.01 0.16
0.56
0.89
1.29
2.07
2.62
3.17
3.78
4.31
4.87
5.44
6.23
7.04
0.00
1.00
2.00
3.00
4.00
5.00
6.00
7.00
8.00
2003 2004 2005 2006 2007 2008 2009 2010 2011 2012 2013 2014 2015 2016 [e]
百万
Thailand Broadband Internet Subscribers
Source: Thai Telecom Industry Database
9
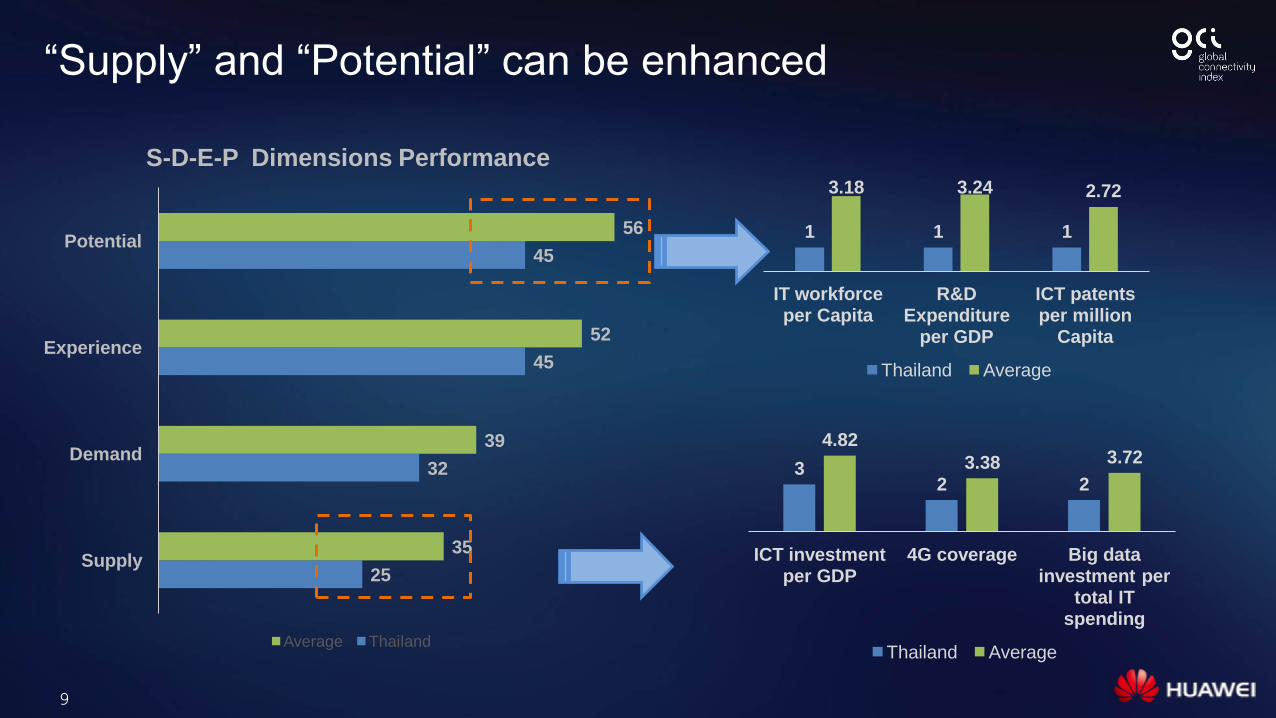
“Supply” and “Potential” can be enhanced
25
32
45
45
35
39
52
56
Supply
Demand
Experience
Potential
S-D-E-P Dimensions Performance
Average Thailand
1 1 1
3.18 3.24 2.72
IT workforce per Capita
R&D Expenditure
per GDP
ICT patents per million
Capita
Thailand Average
3 2 2
4.82
3.38 3.72
ICT investment per GDP
4G coverage Big data investment per
total IT spending
Thailand Average
10
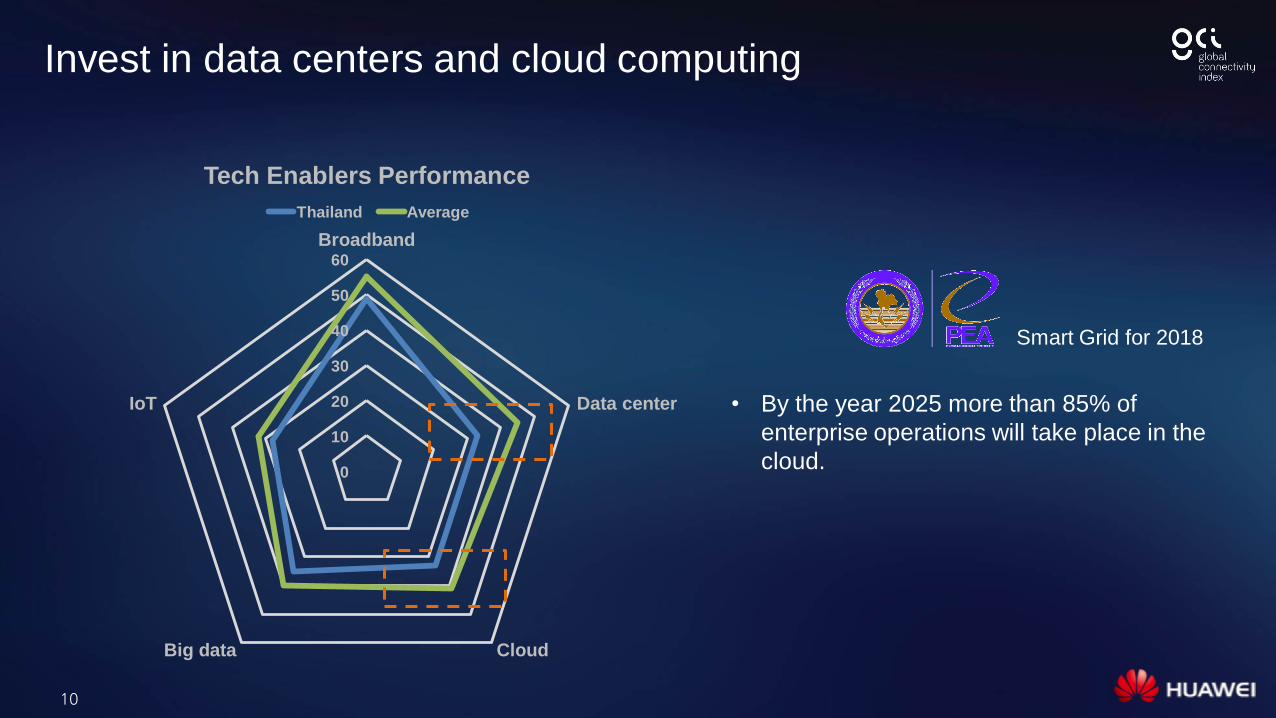
Invest in data centers and cloud computing
0
10
20
30
40
50
60
Broadband
Data center
Cloud Big data
IoT
Tech Enablers Performance
Thailand Average
Smart Grid for 2018
• By the year 2025 more than 85% of
enterprise operations will take place in the
cloud.
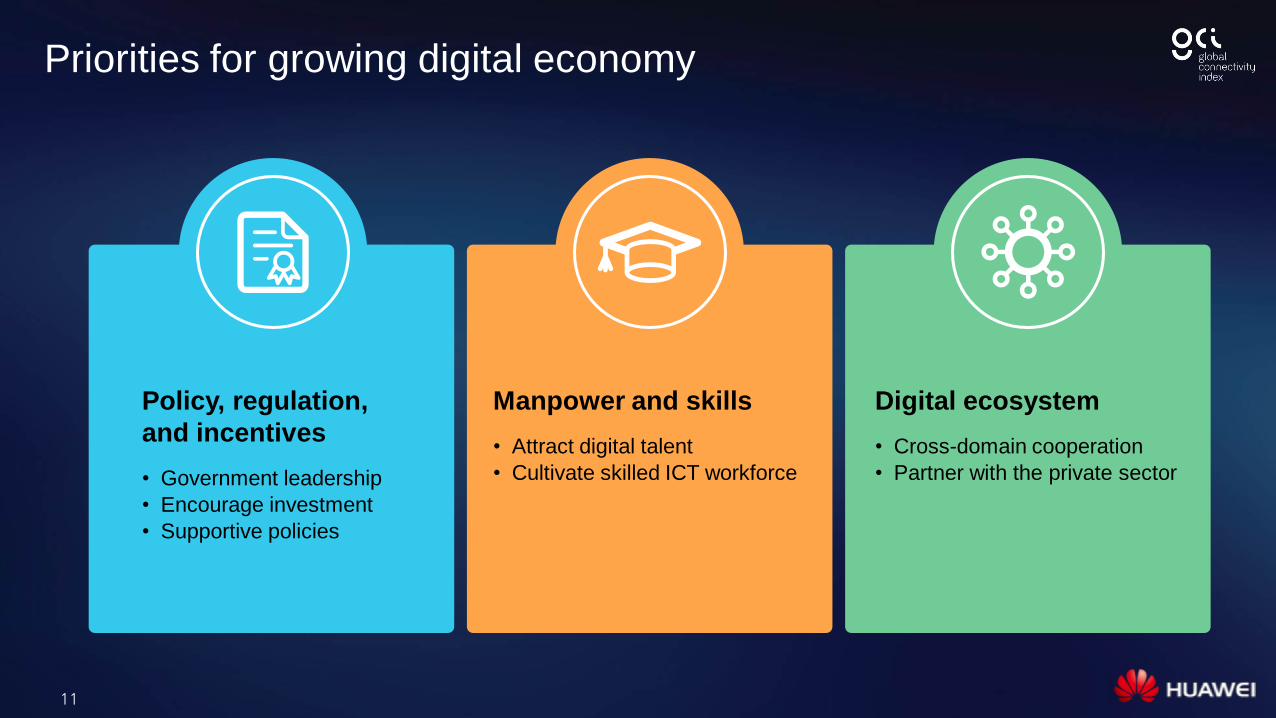
11
Policy, regulation,
and incentives
• Government leadership
• Encourage investment
• Supportive policies
Manpower and skills
• Attract digital talent
• Cultivate skilled ICT workforce
Digital ecosystem
• Cross-domain cooperation
• Partner with the private sector
Priorities for growing digital economy

Copyright©2016 Huawei Technologies Co., Ltd. All Rights Reserved.
The information in this document may contain predictive statements including, without limitation, statements regarding the future financial
and operating results, future product portfolio, new technology, etc. There are a number of factors that could cause actual results and
developments to differ materially from those expressed or implied in the predictive statements. Therefore, such information is provided for
reference purpose only and constitutes neither an offer nor an acceptance. Huawei may change the information at any time without notice.
Thank you
www.huawei.com/gci
13
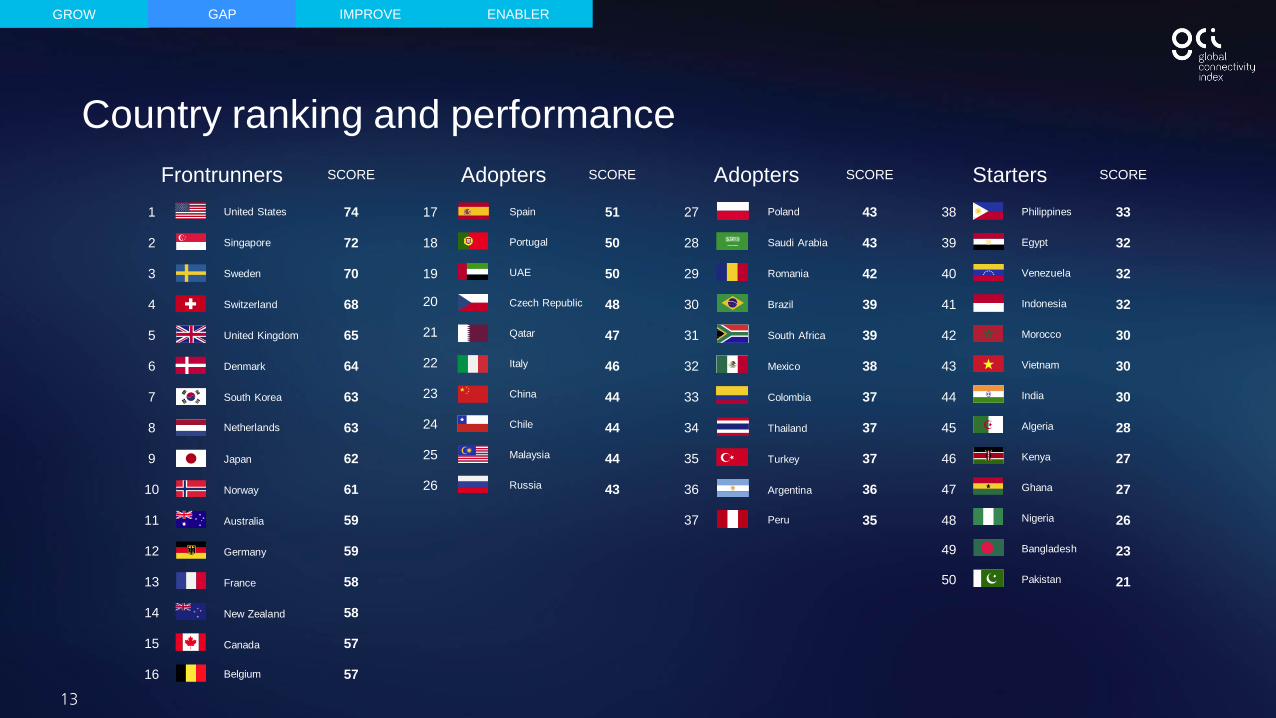
Country ranking and performance
GROW GAP IMPROVE ENABLER
Frontrunners SCORE
1
2
3
4
5
6
7
8
9
10
11
12
13
14
15
16
United States
Singapore
Sweden
Switzerland
United Kingdom
Denmark
South Korea
Netherlands
Japan
Norway
Australia
Germany
France
New Zealand
Canada
Belgium
74
72
70
68
65
64
63
63
62
61
59
59
58
58
57
57
Adopters SCORE
17
18
19
20
21
22
23
24
25
26
Spain
Portugal
UAE
Czech Republic
Qatar
Italy
China
Chile
Malaysia
Russia
51
50
50
48
47
46
44
44
44
43
Adopters SCORE
27
28
29
30
31
32
33
34
35
36
37
Poland
Saudi Arabia
Romania
Brazil
South Africa
Mexico
Colombia
Thailand
Turkey
Argentina
Peru
43
43
42
39
39
38
37
37
37
36
35
Starters SCORE
38
39
40
41
42
43
44
45
46
47
48
49
50
Philippines
Egypt
Venezuela
Indonesia
Morocco
Vietnam
India
Algeria
Kenya
Ghana
Nigeria
Bangladesh
Pakistan
33
32
32
32
30
30
30
28
27
27
26
23
21