Embed Size (px)
Citation preview
S T U D E N T L E A R N I N G O B J E C T I V E S
After completing this chapter, you will be able to answer the following questions:
1. What are the different types of decisions, and how does the decision-making process work?
2. How do business intelligence and business analytics support decision making?
3. How do information systems help people working in a group make decisions more efficiently?
4. What are the business benefits of using intelligent techniques in decision making and knowledge management?
5. What types of systems are used for enterprise-wide knowledge management and knowledge work, and how do they provide value for businesses?
Improving Decision Making and Managing
Knowledge 10C H A P T E R
330
ISB
N1-269-41688-X
Essentials of Management Information Systems, Tenth Edition, by Kenneth C. Laudon and Jane P. Laudon. Published by Prentice Hall. Copyright © 2013 by Pearson Education, Inc.

331
CHAPTER OUTLINE
Chapter-Opening Case: What to Sell? What Price to Charge? Ask the Data
10.1 Decision Making and Information Systems
10.2 Business Intelligence in the Enterprise
10.3 Intelligent Systems for Decision Support
10.4 Systems for Managing Knowledge
Business Problem-Solving Case: Zynga Wins with Business Intelligence
WHAT TO SELL? WHAT PRICE TO CHARGE? ASK THE DATA
What's the best way to get a discount on your morning coffee at Starbucks? If you live in Manhattan, you could get up an hour early and take the subway downtown to Brooklyn. A single expresso is 10 cents cheaper than in your neighborhood, as are a caffè latte and slice of lemon pound cake. But a muffin runs 10 cents more uptown in Marble Hill, and all Pike Place Roast cost $1.70 no matter where you live.
Starbucks is one of many retailers using sophisticated software to analyze—store by store and item by item—how demand responds to changes in price. What customers are willing to pay for certain items depends very much on the neighborhood or even the region of the country where they live. Shoppers in certain locations are willing to pay more.
The Duane Reade drugstore chain, recently purchased by Walgreens, is also adept at adjusting prices. Software analyzing sales patterns found that parents of newborn babies are not as price-sensitive as those with toddlers, so the company was able to raise prices on diapers for newborn infants without losing sales. The chain’s information
© joingate, 2011, iStockPhoto LP.
ISB
N1-
269-
4168
8-X
Essentials of Management Information Systems, Tenth Edition, by Kenneth C. Laudon and Jane P. Laudon. Published by Prentice Hall. Copyright © 2013 by Pearson Education, Inc.
332 Part III: Key System Applications for the Digital Age
systems also showed how to adjust pricing based on location. Shoppers at the Duane Reade store near 86th Street and Lexington Avenue pay 20 cents more for a box of Kleenex and 50 cents more for a bottle of Pepto-Bismol than customers in Harlem.
Business analytics software such as that used by Duane Reade typically analyzes patterns in sales data to create a “pricing profile.” How much of a difference does this knowledge make? Lots. 1-800-Flowers, which sells flowers and gift baskets online, has used analytics software from SAS Inc. to tweak its online storefront and marketing activities. The software helped the company quickly record and analyze buyer profiles to help improve targeting of its product, determine what “specials” to offer, and plan sales and marketing strategies based on an understanding of real customer needs. The company is able to quickly change prices and offerings on its Web site, often every hour. In the first half of 2010, 1-800-Flowers used more finely targeted Web pages and e-mail promotions to improve the conversion rate of Web site browsers to buyers by 20 percent.
Sources: “1-800 Flowers.com Customer Connection Blooms with SAS Business Analytics,” http://www.sas.com, accessed April 17, 2011; Anne Kadet, “Price-Point Politics,” Wall Street Journal, July 24, 2010; Steve Lohr, “A Data Explosion Remakes Retailing,” Wall Street Journal, July 28, 2010.
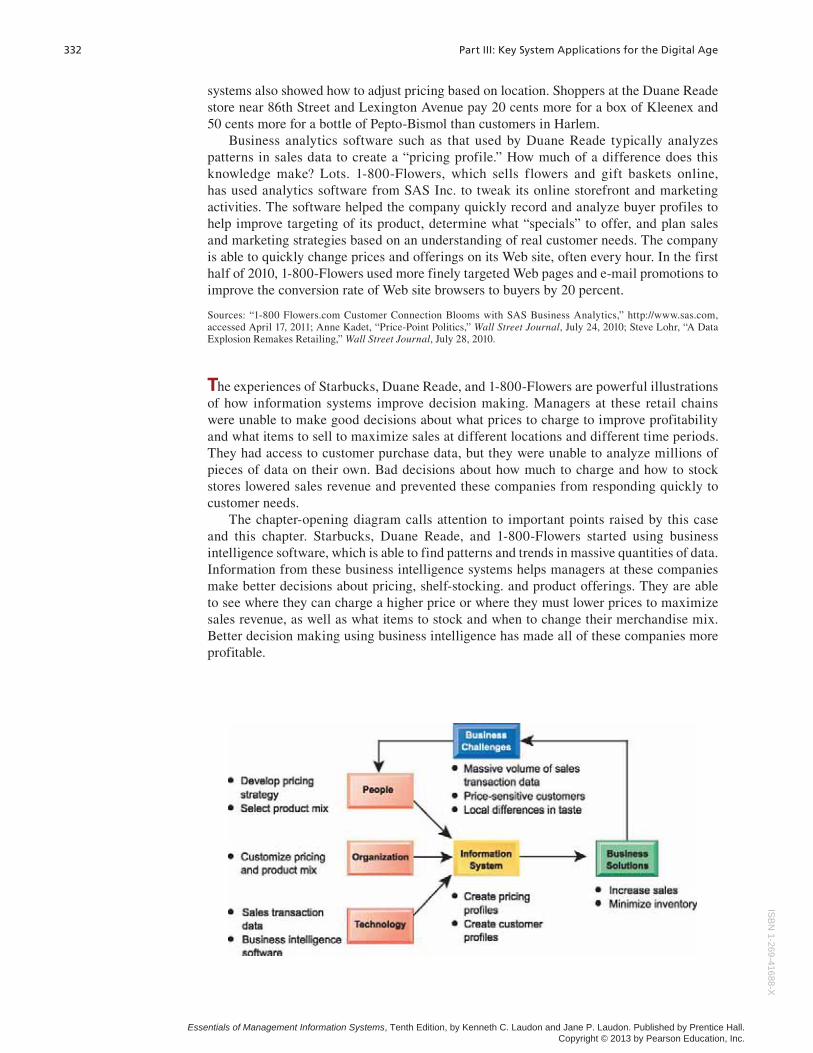
The experiences of Starbucks, Duane Reade, and 1-800-Flowers are powerful illustrations of how information systems improve decision making. Managers at these retail chains were unable to make good decisions about what prices to charge to improve profitability and what items to sell to maximize sales at different locations and different time periods. They had access to customer purchase data, but they were unable to analyze millions of pieces of data on their own. Bad decisions about how much to charge and how to stock stores lowered sales revenue and prevented these companies from responding quickly to customer needs.
The chapter-opening diagram calls attention to important points raised by this case and this chapter. Starbucks, Duane Reade, and 1-800-Flowers started using business intelligence software, which is able to find patterns and trends in massive quantities of data. Information from these business intelligence systems helps managers at these companies make better decisions about pricing, shelf-stocking. and product offerings. They are able to see where they can charge a higher price or where they must lower prices to maximize sales revenue, as well as what items to stock and when to change their merchandise mix. Better decision making using business intelligence has made all of these companies more profitable.
ISB
N1-269-41688-X
Essentials of Management Information Systems, Tenth Edition, by Kenneth C. Laudon and Jane P. Laudon. Published by Prentice Hall. Copyright © 2013 by Pearson Education, Inc.
Chapter 10: Improving Decision Making and Managing Knowledge 333
10.1 Decision Making and Information Systems
One of the main contributions of information systems has been to improve decision making, both for individuals and groups. Decision making in businesses used to be limited to management. Today, lower-level employees are responsible for some of these decisions, as information systems make information available to lower levels of the business. But what do we mean by better decision making? How does decision making take place in businesses and other organizations? Let’s take a closer look.
BUSINESS VALUE OF IMPROVED DECISION MAKING
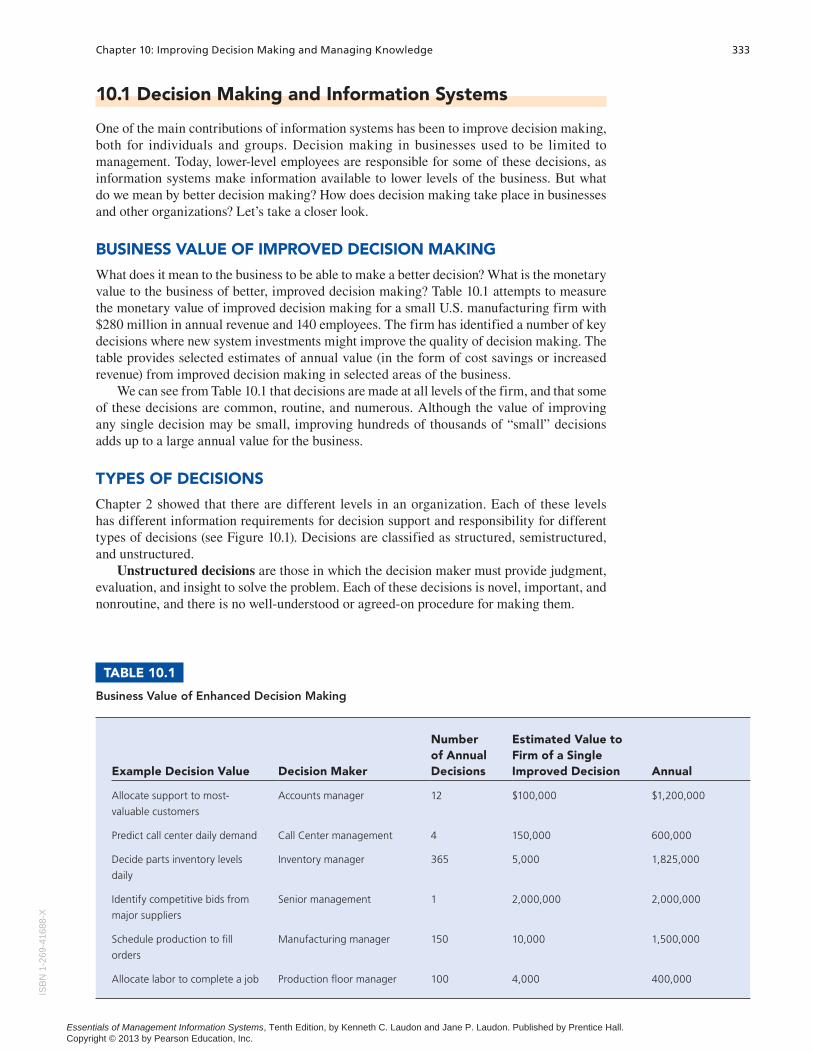
What does it mean to the business to be able to make a better decision? What is the monetary value to the business of better, improved decision making? Table 10.1 attempts to measure the monetary value of improved decision making for a small U.S. manufacturing firm with $280 million in annual revenue and 140 employees. The firm has identified a number of key decisions where new system investments might improve the quality of decision making. The table provides selected estimates of annual value (in the form of cost savings or increased revenue) from improved decision making in selected areas of the business.
We can see from Table 10.1 that decisions are made at all levels of the firm, and that some of these decisions are common, routine, and numerous. Although the value of improving any single decision may be small, improving hundreds of thousands of “small” decisions adds up to a large annual value for the business.
TYPES OF DECISIONS
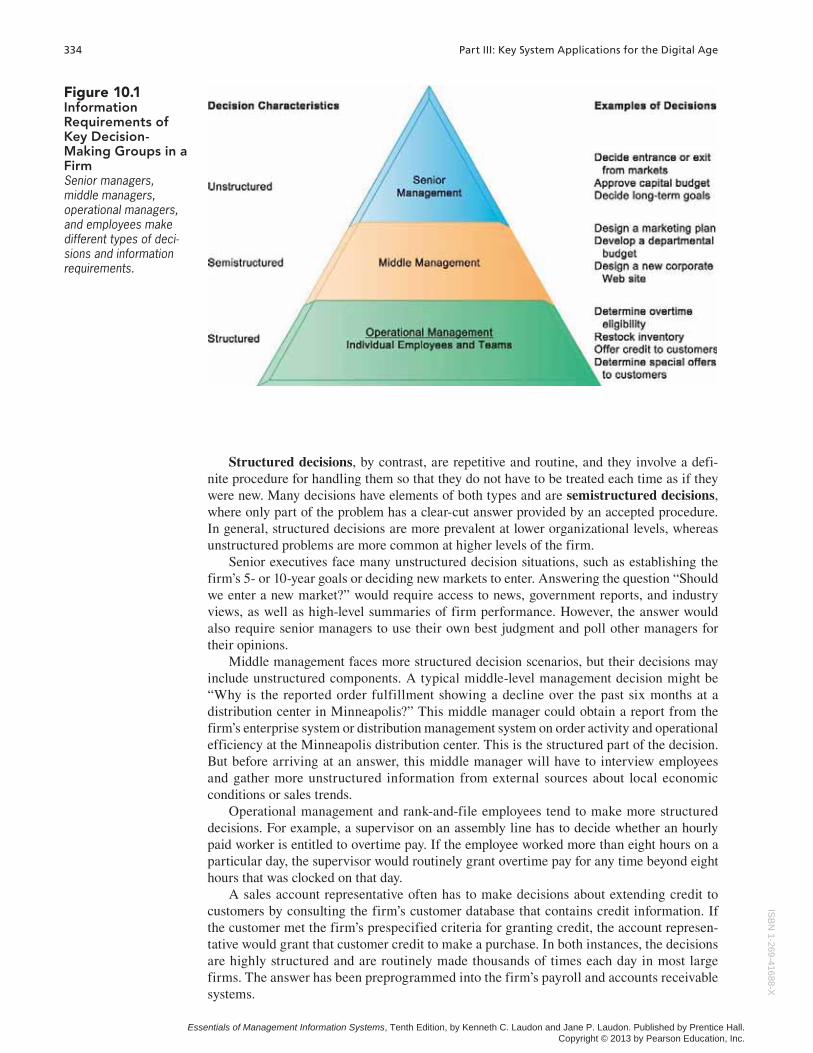
Chapter 2 showed that there are different levels in an organization. Each of these levels has different information requirements for decision support and responsibility for different types of decisions (see Figure 10.1). Decisions are classified as structured, semistructured, and unstructured.
Unstructured decisions are those in which the decision maker must provide judgment, evaluation, and insight to solve the problem. Each of these decisions is novel, important, and nonroutine, and there is no well-understood or agreed-on procedure for making them.
TABLE 10.1
Business Value of Enhanced Decision Making
Example Decision Value Decision Maker
Number of Annual Decisions
Estimated Value to Firm of a Single Improved Decision Annual
Allocate support to most-
valuable customers
Accounts manager 12 $100,000 $1,200,000
Predict call center daily demand Call Center management 4 150,000 600,000
Decide parts inventory levels
daily
Inventory manager 365 5,000 1,825,000
Identify competitive bids from
major suppliers
Senior management 1 2,000,000 2,000,000
Schedule production to fi ll
orders
Manufacturing manager 150 10,000 1,500,000
Allocate labor to complete a job Production fl oor manager 100 4,000 400,000
ISB
N1-
269-
4168
8-X
Essentials of Management Information Systems, Tenth Edition, by Kenneth C. Laudon and Jane P. Laudon. Published by Prentice Hall. Copyright © 2013 by Pearson Education, Inc.
334 Part III: Key System Applications for the Digital Age
Structured decisions, by contrast, are repetitive and routine, and they involve a defi-nite procedure for handling them so that they do not have to be treated each time as if they were new. Many decisions have elements of both types and are semistructured decisions, where only part of the problem has a clear-cut answer provided by an accepted procedure. In general, structured decisions are more prevalent at lower organizational levels, whereas unstructured problems are more common at higher levels of the firm.
Senior executives face many unstructured decision situations, such as establishing the firm’s 5- or 10-year goals or deciding new markets to enter. Answering the question “Should we enter a new market?” would require access to news, government reports, and industry views, as well as high-level summaries of firm performance. However, the answer would also require senior managers to use their own best judgment and poll other managers for their opinions.
Middle management faces more structured decision scenarios, but their decisions may include unstructured components. A typical middle-level management decision might be “Why is the reported order fulfillment showing a decline over the past six months at a distribution center in Minneapolis?” This middle manager could obtain a report from the firm’s enterprise system or distribution management system on order activity and operational efficiency at the Minneapolis distribution center. This is the structured part of the decision. But before arriving at an answer, this middle manager will have to interview employees and gather more unstructured information from external sources about local economic conditions or sales trends.
Operational management and rank-and-file employees tend to make more structured decisions. For example, a supervisor on an assembly line has to decide whether an hourly paid worker is entitled to overtime pay. If the employee worked more than eight hours on a particular day, the supervisor would routinely grant overtime pay for any time beyond eight hours that was clocked on that day.
A sales account representative often has to make decisions about extending credit to customers by consulting the firm’s customer database that contains credit information. If the customer met the firm’s prespecified criteria for granting credit, the account represen-tative would grant that customer credit to make a purchase. In both instances, the decisions are highly structured and are routinely made thousands of times each day in most large firms. The answer has been preprogrammed into the firm’s payroll and accounts receivable systems.
Figure 10.1 Information Requirements of Key Decision-Making Groups in a FirmSenior managers, middle managers, operational managers, and employees make different types of deci-sions and information requirements.
ISB
N1-269-41688-X
Essentials of Management Information Systems, Tenth Edition, by Kenneth C. Laudon and Jane P. Laudon. Published by Prentice Hall. Copyright © 2013 by Pearson Education, Inc.
Chapter 10: Improving Decision Making and Managing Knowledge 335
THE DECISION-MAKING PROCESS
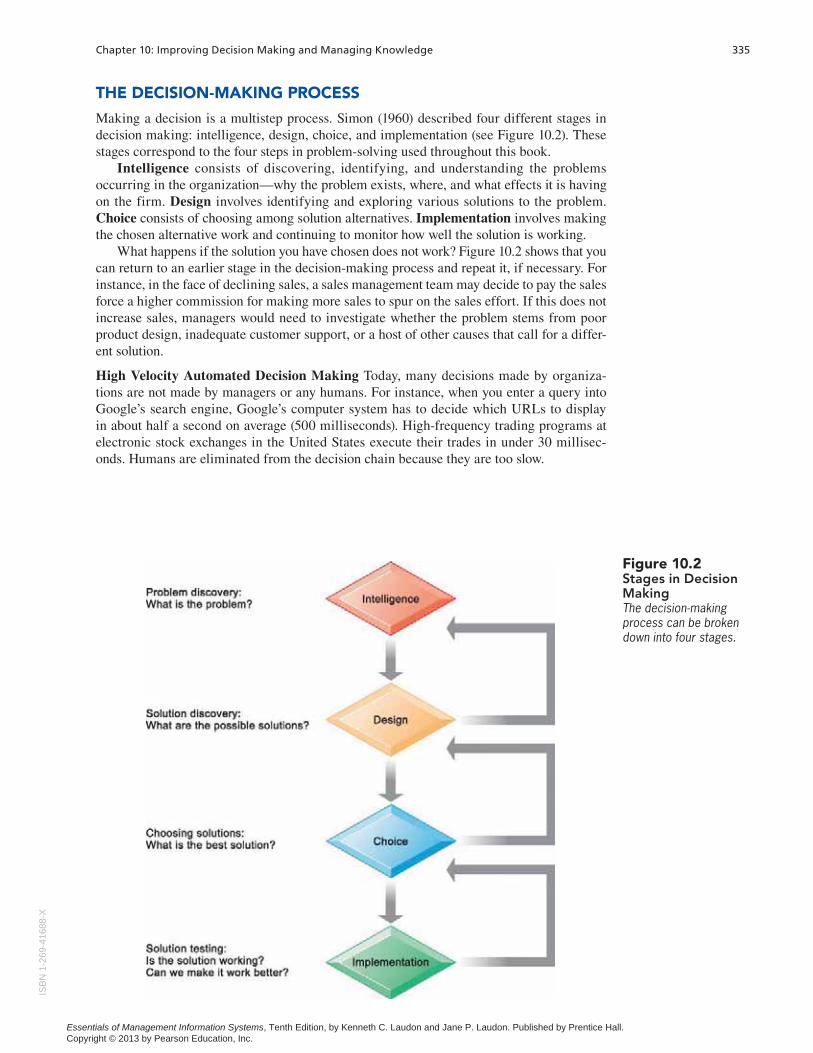
Making a decision is a multistep process. Simon (1960) described four different stages in decision making: intelligence, design, choice, and implementation (see Figure 10.2). These stages correspond to the four steps in problem-solving used throughout this book.
Intelligence consists of discovering, identifying, and understanding the problems occurring in the organization—why the problem exists, where, and what effects it is having on the firm. Design involves identifying and exploring various solutions to the problem. Choice consists of choosing among solution alternatives. Implementation involves making the chosen alternative work and continuing to monitor how well the solution is working.
What happens if the solution you have chosen does not work? Figure 10.2 shows that you can return to an earlier stage in the decision-making process and repeat it, if necessary. For instance, in the face of declining sales, a sales management team may decide to pay the sales force a higher commission for making more sales to spur on the sales effort. If this does not increase sales, managers would need to investigate whether the problem stems from poor product design, inadequate customer support, or a host of other causes that call for a differ-ent solution.
High Velocity Automated Decision Making Today, many decisions made by organiza-tions are not made by managers or any humans. For instance, when you enter a query into Google’s search engine, Google’s computer system has to decide which URLs to display in about half a second on average (500 milliseconds). High-frequency trading programs at electronic stock exchanges in the United States execute their trades in under 30 millisec-onds. Humans are eliminated from the decision chain because they are too slow.
Figure 10.2 Stages in Decision MakingThe decision-making process can be broken down into four stages.
ISB
N1-
269-
4168
8-X
Essentials of Management Information Systems, Tenth Edition, by Kenneth C. Laudon and Jane P. Laudon. Published by Prentice Hall. Copyright © 2013 by Pearson Education, Inc.
336 Part III: Key System Applications for the Digital Age
In these high-speed automated decisions, the intelligence, design, choice, and imple-mentation parts of the decision-making process are captured by computer algorithms that precisely define the steps to be followed to produce a decision. The people who wrote the software identified the problem, designed a method for finding a solution, defined a range of acceptable solutions, and implemented the solution. In these situations, organizations are making decisions faster than what managers can monitor or control, and great care needs to be taken to ensure the proper operation of these systems to prevent significant harm.
QUALITY OF DECISIONS AND DECISION MAKING
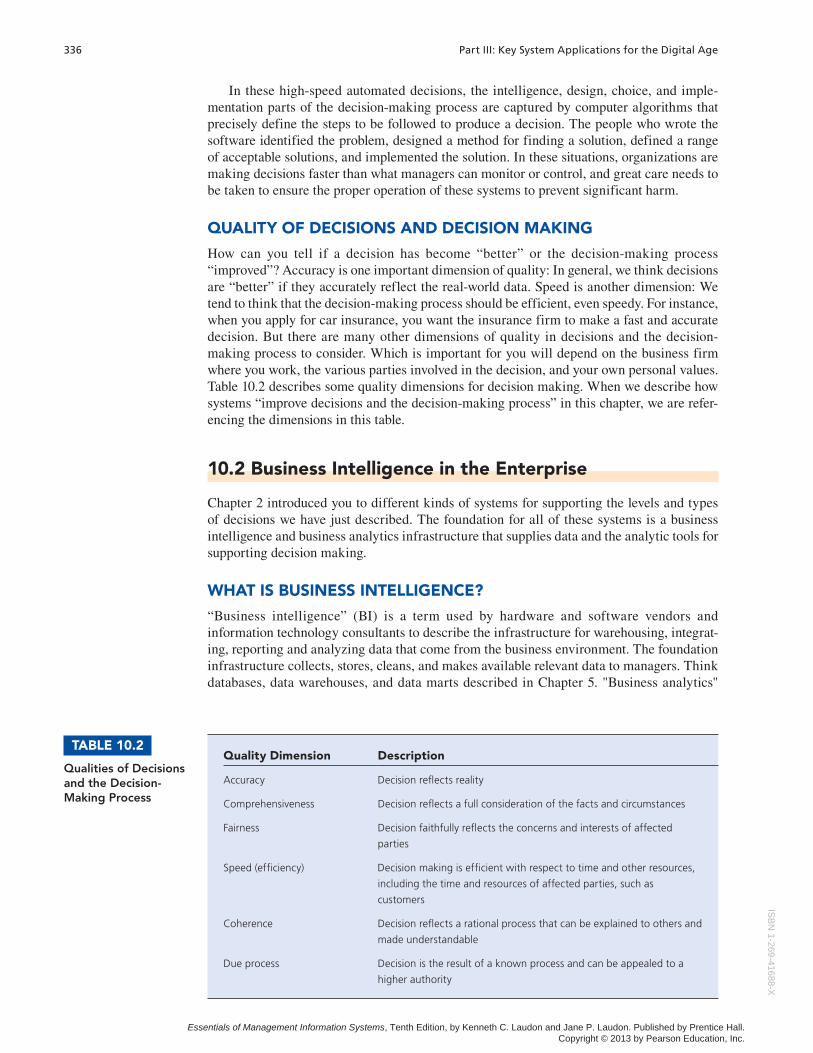
How can you tell if a decision has become “better” or the decision-making process “improved”? Accuracy is one important dimension of quality: In general, we think decisions are “better” if they accurately reflect the real-world data. Speed is another dimension: We tend to think that the decision-making process should be efficient, even speedy. For instance, when you apply for car insurance, you want the insurance firm to make a fast and accurate decision. But there are many other dimensions of quality in decisions and the decision-making process to consider. Which is important for you will depend on the business firm where you work, the various parties involved in the decision, and your own personal values. Table 10.2 describes some quality dimensions for decision making. When we describe how systems “improve decisions and the decision-making process” in this chapter, we are refer-encing the dimensions in this table.
10.2 Business Intelligence in the Enterprise
Chapter 2 introduced you to different kinds of systems for supporting the levels and types of decisions we have just described. The foundation for all of these systems is a business intelligence and business analytics infrastructure that supplies data and the analytic tools for supporting decision making.
WHAT IS BUSINESS INTELLIGENCE?
“Business intelligence” (BI) is a term used by hardware and software vendors and information technology consultants to describe the infrastructure for warehousing, integrat-ing, reporting and analyzing data that come from the business environment. The foundation infrastructure collects, stores, cleans, and makes available relevant data to managers. Think databases, data warehouses, and data marts described in Chapter 5. "Business analytics"
TABLE 10.2
Qualities of Decisions and the Decision-Making Process
Quality Dimension Description
Accuracy Decision refl ects reality
Comprehensiveness Decision refl ects a full consideration of the facts and circumstances
Fairness Decision faithfully refl ects the concerns and interests of affected
parties
Speed (effi ciency) Decision making is effi cient with respect to time and other resources,
including the time and resources of affected parties, such as
customers
Coherence Decision refl ects a rational process that can be explained to others and
made understandable
Due process Decision is the result of a known process and can be appealed to a
higher authority
ISB
N1-269-41688-X
Essentials of Management Information Systems, Tenth Edition, by Kenneth C. Laudon and Jane P. Laudon. Published by Prentice Hall. Copyright © 2013 by Pearson Education, Inc.
Chapter 10: Improving Decision Making and Managing Knowledge 337
(BA) is also a vendor-defined term that focuses more on tools and techniques for analyzing and understanding data. Think OLAP, statistics, models, and data mining, which we also introduced in Chapter 5.
Business intelligence and analytics are essentially about integrating all the information streams produced by a firm into a single, coherent enterprise wide set of data, and then using modeling, statistical analysis and data mining tools to make sense out of all these data so managers can make better decisions and better plans. The companies described in the chapter-opening case are using business intelligence applications to make some very fine-grained decisions about what items to sell and what prices to charge for these items based on customer demographics and geographic location, as well as how to target sales and marketing campaigns to individual customers.
It is important to remember that business intelligence and analytics are products defined by technology vendors and consulting firms. They consist of hardware and software suites sold primarily by large system vendors to very large Fortune 500 firms. The largest five providers of these products are SAP, Oracle, IBM, SAS Institute, and Microsoft. The size of the BI and BA marketplace reached $10.5 billion in 2010 and is expected to grow at over 20 percent annually, making business intelligence one of the fastest growing segments of the U.S. software market (Gartner, 2011).
THE BUSINESS INTELLIGENCE ENVIRONMENT
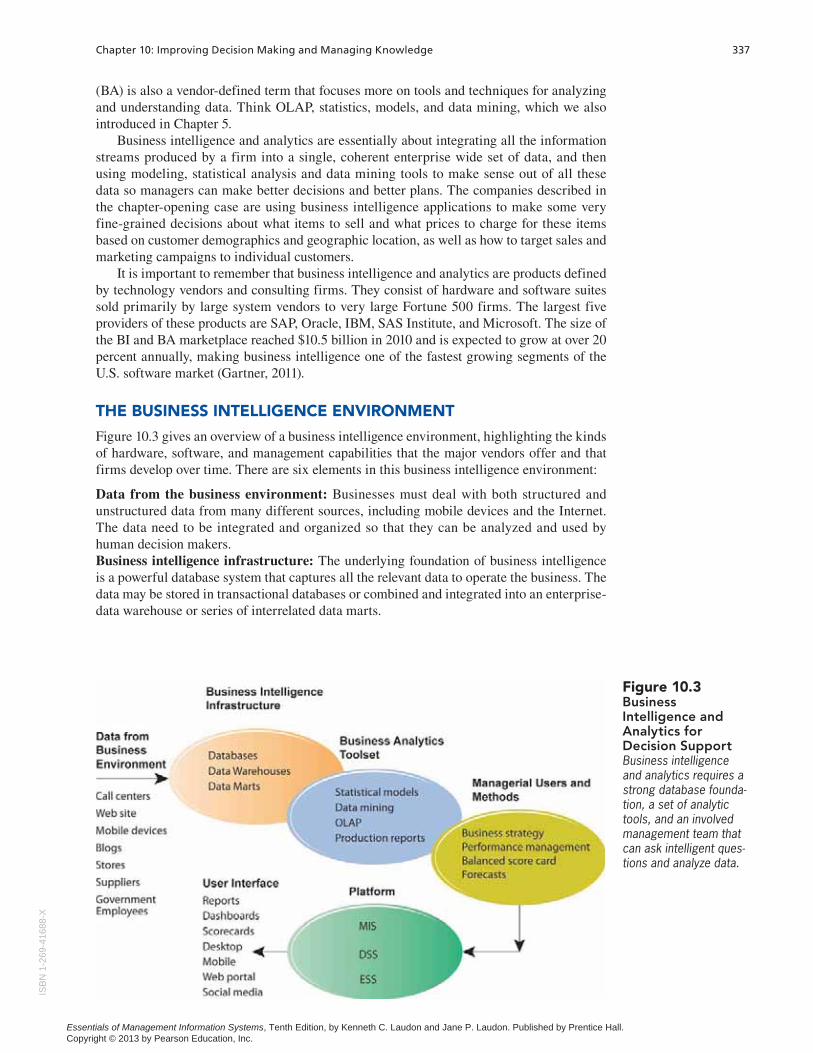
Figure 10.3 gives an overview of a business intelligence environment, highlighting the kinds of hardware, software, and management capabilities that the major vendors offer and that firms develop over time. There are six elements in this business intelligence environment:
Data from the business environment: Businesses must deal with both structured and unstructured data from many different sources, including mobile devices and the Internet. The data need to be integrated and organized so that they can be analyzed and used by human decision makers.Business intelligence infrastructure: The underlying foundation of business intelligence is a powerful database system that captures all the relevant data to operate the business. The data may be stored in transactional databases or combined and integrated into an enterprise-data warehouse or series of interrelated data marts.
Figure 10.3 Business Intelligence and Analytics for Decision Support Business intelligence and analytics requires a strong database founda-tion, a set of analytic tools, and an involved management team that can ask intelligent ques-tions and analyze data.
ISB
N1-
269-
4168
8-X
Essentials of Management Information Systems, Tenth Edition, by Kenneth C. Laudon and Jane P. Laudon. Published by Prentice Hall. Copyright © 2013 by Pearson Education, Inc.
338 Part III: Key System Applications for the Digital Age
Business analytics toolset: A set of software tools are used to analyze data and produce reports, respond to questions posed by managers, and track the progress of the business using key indicators of performance. Managerial users and methods: Business intelligence hardware and software are only as intelligent as the human beings who use them. Managers impose order on the analysis of data using a variety of managerial methods that define strategic business goals and specify how progress will be measured. These include business performance management and balanced scorecard approaches that focus on key performance indicators, with special atten-tion to competitors. Delivery platform—MIS, DSS, ESS: The results from business intelligence and analytics are delivered to managers and employees in a variety of ways, depending on what they need to know to perform their job. MIS, DSS, and ESS, which we introduced in Chapter 2, deliver information and knowledge to different people and levels in the firm—operational employees, middle managers, and senior executives. In the past, all these systems could not share data and operated as independent systems. Today, one suite of hardware and software tools in the form of a business intelligence and analytics package is able to integrate all this information and bring it to managers’ desktop or mobile platforms. User Interface: Business people are no longer tied to their desks and desktops. They often learn quicker from a visual representation of data than from a dry report with columns and rows of information. Today's business analytics software suites emphasize visual techniques such as dashboards and scorecards. They also are able to deliver reports on BlackBerrys, iPhones, and other mobile handhelds as well as on the firm's Web portal. BA software is adding capabilities to post information on Twitter, Facebook, or internal social media to support decision making in an online, group setting rather than in a face-to-face meeting.
BUSINESS INTELLIGENCE AND ANALYTICS CAPABILITIES
Business intelligence and analytics promise to deliver correct, nearly real-time information to decision makers, and the analytic tools help them quickly understand the information and take action. There are five analytic functionalities that BI systems deliver to achieve these ends:
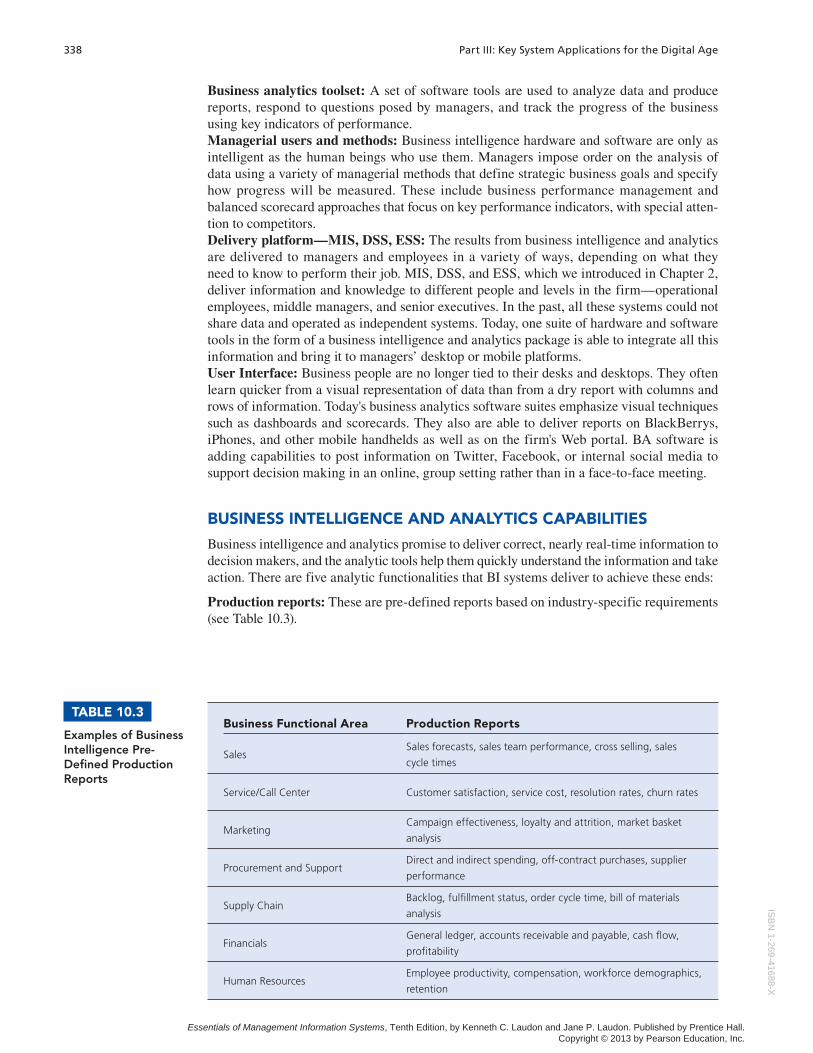
Production reports: These are pre-defined reports based on industry-specific requirements (see Table 10.3).
TABLE 10.3
Examples of Business Intelligence Pre-Defined Production Reports
Business Functional Area Production Reports
Sales Sales forecasts, sales team performance, cross selling, sales
cycle times
Service/Call Center Customer satisfaction, service cost, resolution rates, churn rates
MarketingCampaign effectiveness, loyalty and attrition, market basket
analysis
Procurement and SupportDirect and indirect spending, off-contract purchases, supplier
performance
Supply ChainBacklog, fulfi llment status, order cycle time, bill of materials
analysis
Financials General ledger, accounts receivable and payable, cash fl ow,
profi tability
Human ResourcesEmployee productivity, compensation, workforce demographics,
retention
ISB
N1-269-41688-X
Essentials of Management Information Systems, Tenth Edition, by Kenneth C. Laudon and Jane P. Laudon. Published by Prentice Hall. Copyright © 2013 by Pearson Education, Inc.
Chapter 10: Improving Decision Making and Managing Knowledge 339
Parameterized reports: Users enter several parameters as in a pivot table to filter data and isolate impacts of parameters. For instance, you might want to enter region and time of day to understand how sales of a product vary by region and time. If you were Starbucks, you might find that customers in the eastern United States buy most of their coffee in the morn-ing, whereas in the northwest customers buy coffee throughout the day. This finding might lead to different marketing and ad campaigns in each region. (See the discussion of pivot tables later in this section.)Dashboards/Scorecards: These are visual tools for presenting performance data defined by users.Ad hoc query/search/ report creation: These allow users to create their own reports based on queries and searches.Drill down: This is the ability to move from a high level summary to a more detailed view.Forecasts, scenarios, models: These include capabilities for linear forecasting, “what if” scenario analysis, and analyzing data using standard statistical tools.
Production ReportsThe most widely used output of a BI suite of tools is pre-packaged production reports. Table 10.3 illustrates some common pre-defined reports from Oracle's BI suite of tools.
Predictive AnalyticsPredictive analytics, which we introduced in Chapter 5, are being built into business intelligence applications for sales, marketing, finance, fraud detection, and health care. Predictive analytics use statistical analysis and other techniques to extract information from data and use it to predict future trends and behavior patterns.
One of the most established business applications of predictive analytics is predicting response to direct marketing campaigns. By identifying customers less likely to respond, companies are able to lower their marketing and sales costs by bypassing this group and focusing their resources on customers who have been identified as more promising. For example, Capital One conducts more than 30,000 experiments each year using different interest rates, incentives, direct mail packaging, and other variables to identify the best potential customers for targeting its credit card offers. These people are most likely to sign up for credit cards and to pay back Capital One for the balances they ring up in their credit card accounts. Predictive analytics have also helped credit card companies identify customers who are at risk for leaving, and churn modeling is another popular predictive analytics application.
Predictive analytics are helping companies understand other customer-related behaviors. FedEx is using SAS Institute’s Enterprise Miner and predictive analytic tools to develop models that predict how customers will respond to price changes and new services, which customers are most at risk of switching to competitors, and how much revenue will be generated by new storefront or drop-box locations. The accuracy rate of the predictive analytics system ranges from 65 to 90 percent. FedEx is now starting to use predictive ana-lytics in call centers to help customer service representatives identify customers with the highest levels of dissatisfaction and take the necessary steps to make them happy.
Data Visualization, Visual Analytics, and Geographic Information SystemsBy presenting data in visual form, data visualization and visual analytics tools help users see patterns and relationships in large amounts of data that would be difficult to discern if the data were presented as traditional lists of text or numbers. Data are presented in the form of rich graphs, charts, dashboards, and maps. People become more engaged when they can filter information that is presented visually and develop insights on their own.
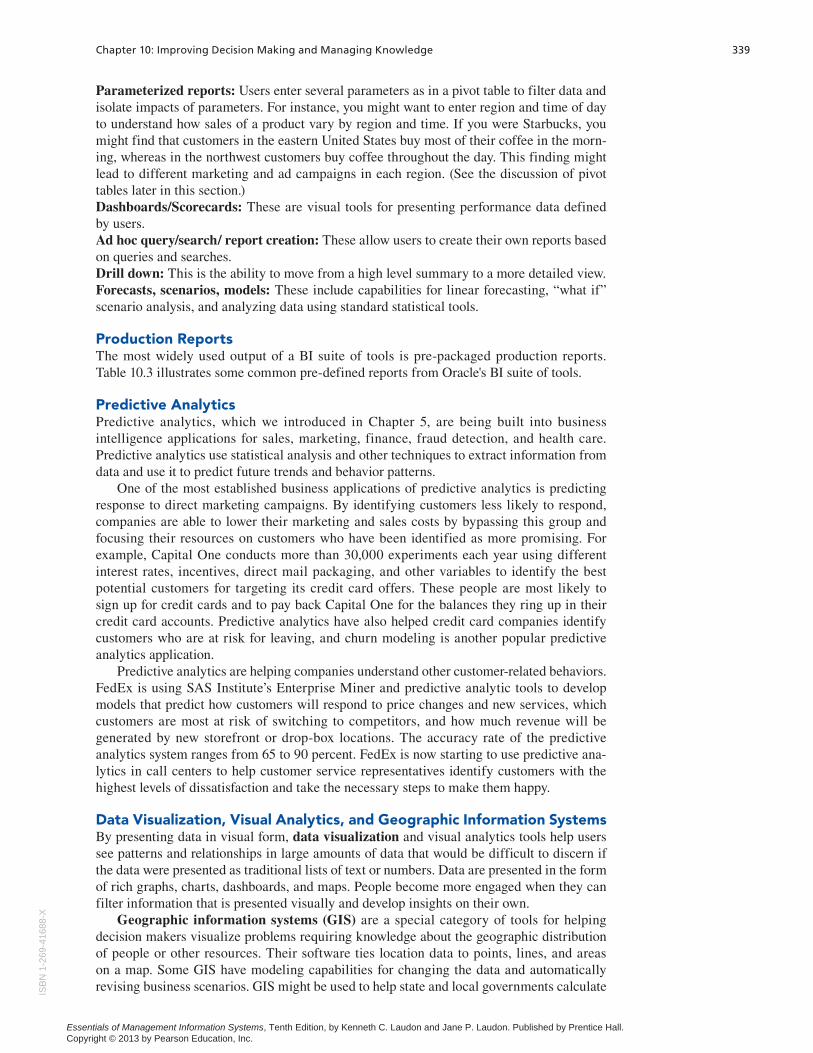
Geographic information systems (GIS) are a special category of tools for helping decision makers visualize problems requiring knowledge about the geographic distribution of people or other resources. Their software ties location data to points, lines, and areas on a map. Some GIS have modeling capabilities for changing the data and automatically revising business scenarios. GIS might be used to help state and local governments calculate IS
BN
1-26
9-41
688-
X
Essentials of Management Information Systems, Tenth Edition, by Kenneth C. Laudon and Jane P. Laudon. Published by Prentice Hall. Copyright © 2013 by Pearson Education, Inc.
340 Part III: Key System Applications for the Digital Age
response times to natural disasters and other emergencies or to help banks identify the best location for installing new branches or ATM terminals.
For example, Columbia, South Carolina-based First Citizens Bank uses GIS software from MapInfo to determine which markets to focus on for retaining customers and which to focus on for acquiring new customers. MapInfo also lets the bank drill down into details at the individual branch level and individualize goals for each branch. Each branch is able to see whether the greatest revenue opportunities are from mining its database of existing customers or from finding new customers.
BUSINESS INTELLIGENCE USERS
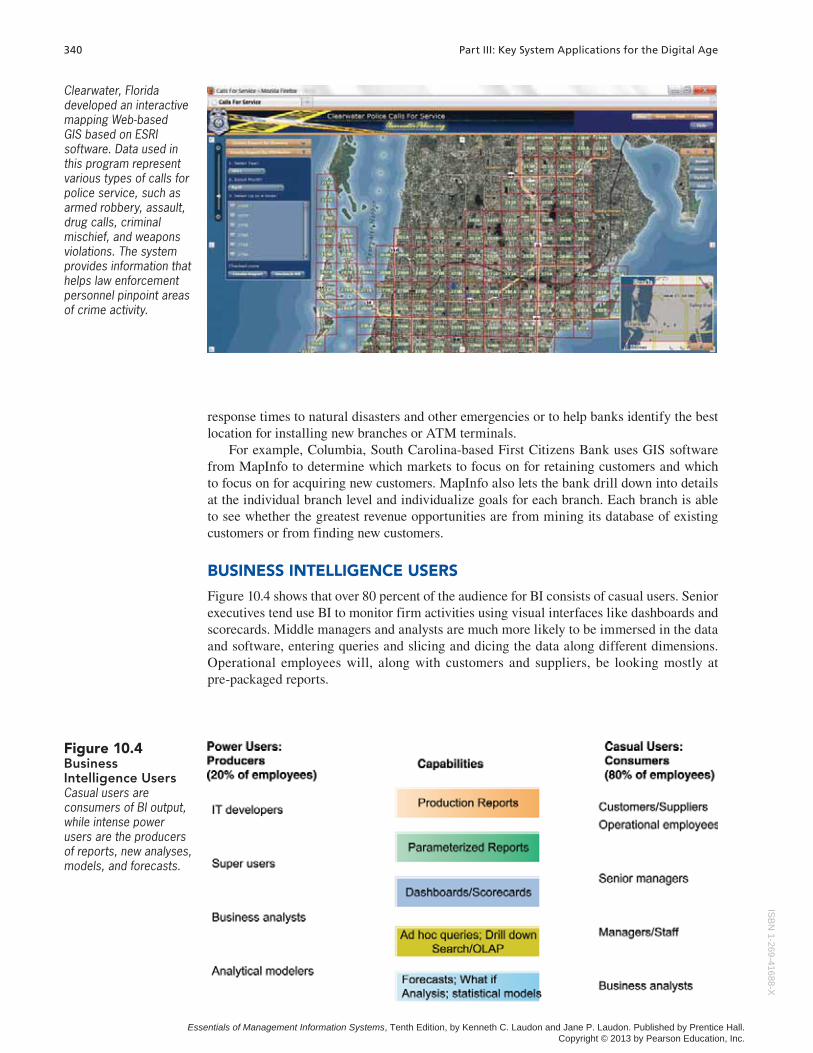
Figure 10.4 shows that over 80 percent of the audience for BI consists of casual users. Senior executives tend use BI to monitor firm activities using visual interfaces like dashboards and scorecards. Middle managers and analysts are much more likely to be immersed in the data and software, entering queries and slicing and dicing the data along different dimensions. Operational employees will, along with customers and suppliers, be looking mostly at pre-packaged reports.
Figure 10.4 Business Intelligence UsersCasual users are consumers of BI output, while intense power users are the producers of reports, new analyses, models, and forecasts.
Clearwater, Florida developed an interactive mapping Web-based GIS based on ESRI software. Data used in this program represent various types of calls for police service, such as armed robbery, assault, drug calls, criminal mischief, and weapons violations. The system provides information that helps law enforcement personnel pinpoint areas of crime activity.
ISB
N1-269-41688-X
Essentials of Management Information Systems, Tenth Edition, by Kenneth C. Laudon and Jane P. Laudon. Published by Prentice Hall. Copyright © 2013 by Pearson Education, Inc.
Chapter 10: Improving Decision Making and Managing Knowledge 341
Support for Semistructured DecisionsMany BI pre-packaged production reports are MIS reports supporting structured decision making for operational and middle managers. We described operational and middle man-agement, and the systems they use, in Chapter 2. However, some managers are “super users” and keen business analysts who want to create their own reports, and use more sophisticated analytics and models to find patterns in data, to model alternative business scenarios, or to test specific hypotheses. Decision-support systems (DSS) are the BI delivery platform for this category of users, with the ability to support semistructured decision making.
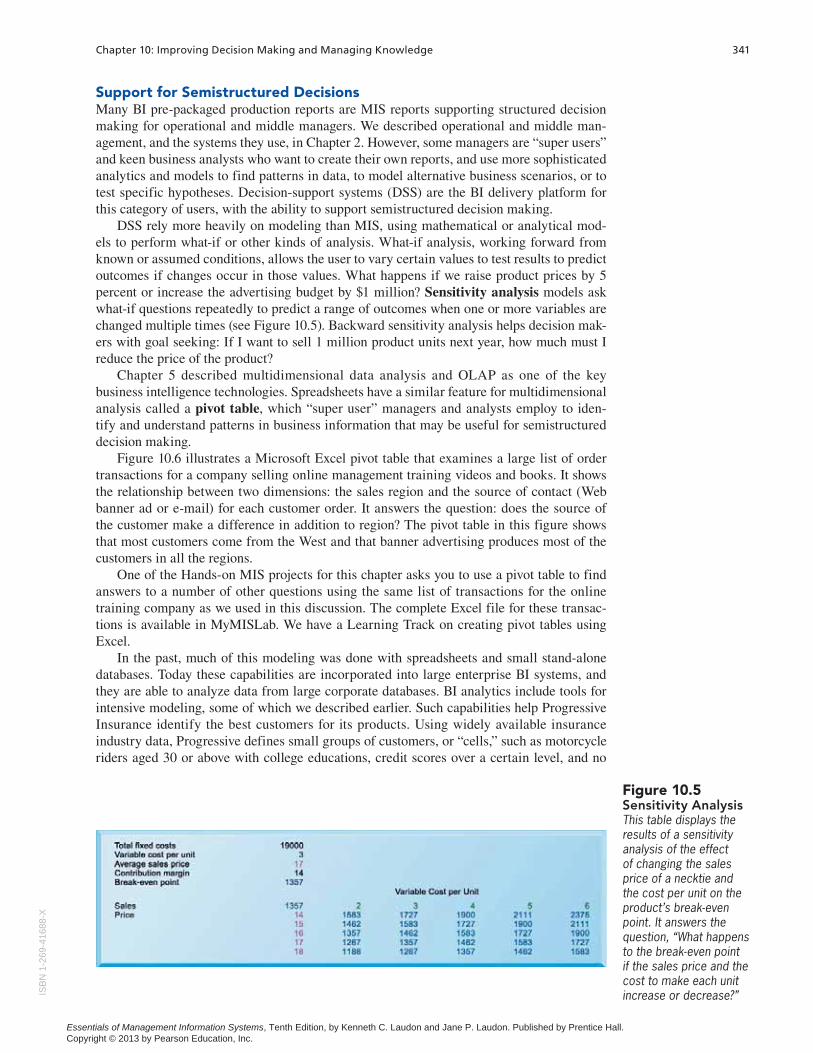
DSS rely more heavily on modeling than MIS, using mathematical or analytical mod-els to perform what-if or other kinds of analysis. What-if analysis, working forward from known or assumed conditions, allows the user to vary certain values to test results to predict outcomes if changes occur in those values. What happens if we raise product prices by 5 percent or increase the advertising budget by $1 million? Sensitivity analysis models ask what-if questions repeatedly to predict a range of outcomes when one or more variables are changed multiple times (see Figure 10.5). Backward sensitivity analysis helps decision mak-ers with goal seeking: If I want to sell 1 million product units next year, how much must I reduce the price of the product?
Chapter 5 described multidimensional data analysis and OLAP as one of the key business intelligence technologies. Spreadsheets have a similar feature for multidimensional analysis called a pivot table, which “super user” managers and analysts employ to iden-tify and understand patterns in business information that may be useful for semistructured decision making.
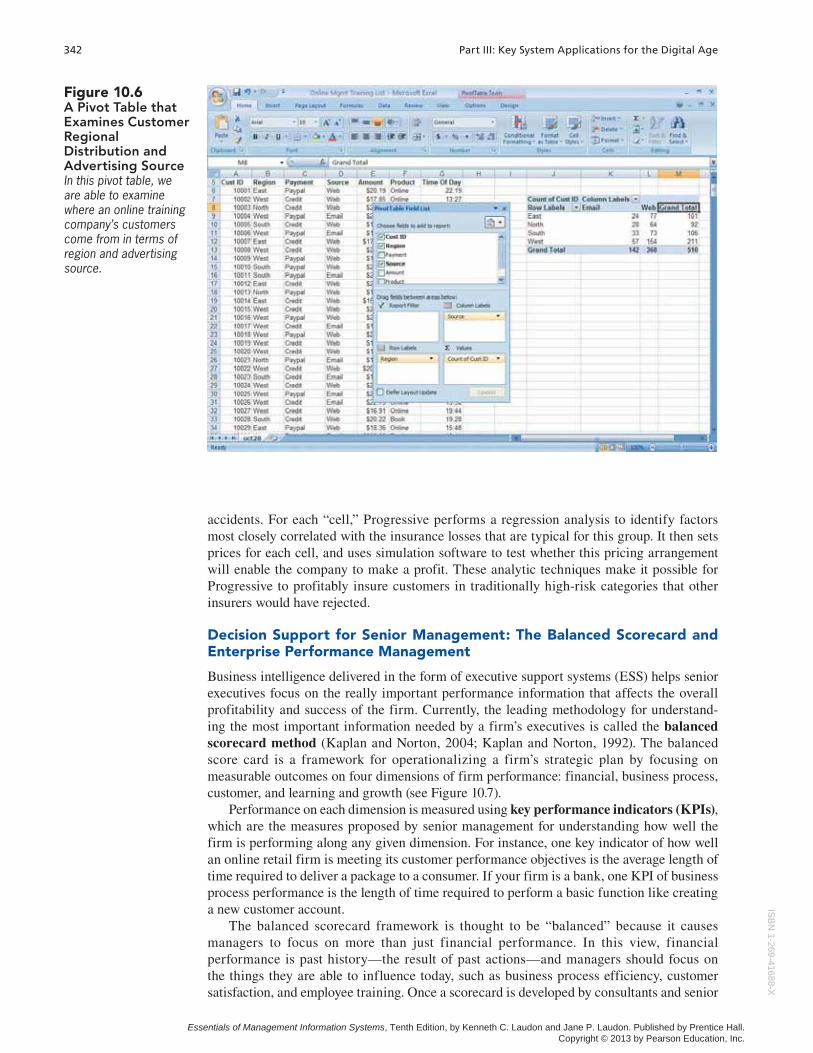
Figure 10.6 illustrates a Microsoft Excel pivot table that examines a large list of order transactions for a company selling online management training videos and books. It shows the relationship between two dimensions: the sales region and the source of contact (Web banner ad or e-mail) for each customer order. It answers the question: does the source of the customer make a difference in addition to region? The pivot table in this figure shows that most customers come from the West and that banner advertising produces most of the customers in all the regions.
One of the Hands-on MIS projects for this chapter asks you to use a pivot table to find answers to a number of other questions using the same list of transactions for the online training company as we used in this discussion. The complete Excel file for these transac-tions is available in MyMISLab. We have a Learning Track on creating pivot tables using Excel.
In the past, much of this modeling was done with spreadsheets and small stand-alone databases. Today these capabilities are incorporated into large enterprise BI systems, and they are able to analyze data from large corporate databases. BI analytics include tools for intensive modeling, some of which we described earlier. Such capabilities help Progressive Insurance identify the best customers for its products. Using widely available insurance industry data, Progressive defines small groups of customers, or “cells,” such as motorcycle riders aged 30 or above with college educations, credit scores over a certain level, and no
Figure 10.5 Sensitivity AnalysisThis table displays the results of a sensitivity analysis of the effect of changing the sales price of a necktie and the cost per unit on the product’s break-even point. It answers the question, “What happens to the break-even point if the sales price and the cost to make each unit increase or decrease?”IS
BN
1-26
9-41
688-
X
Essentials of Management Information Systems, Tenth Edition, by Kenneth C. Laudon and Jane P. Laudon. Published by Prentice Hall. Copyright © 2013 by Pearson Education, Inc.
342 Part III: Key System Applications for the Digital Age
accidents. For each “cell,” Progressive performs a regression analysis to identify factors most closely correlated with the insurance losses that are typical for this group. It then sets prices for each cell, and uses simulation software to test whether this pricing arrangement will enable the company to make a profit. These analytic techniques make it possible for Progressive to profitably insure customers in traditionally high-risk categories that other insurers would have rejected.
Decision Support for Senior Management: The Balanced Scorecard and Enterprise Performance Management
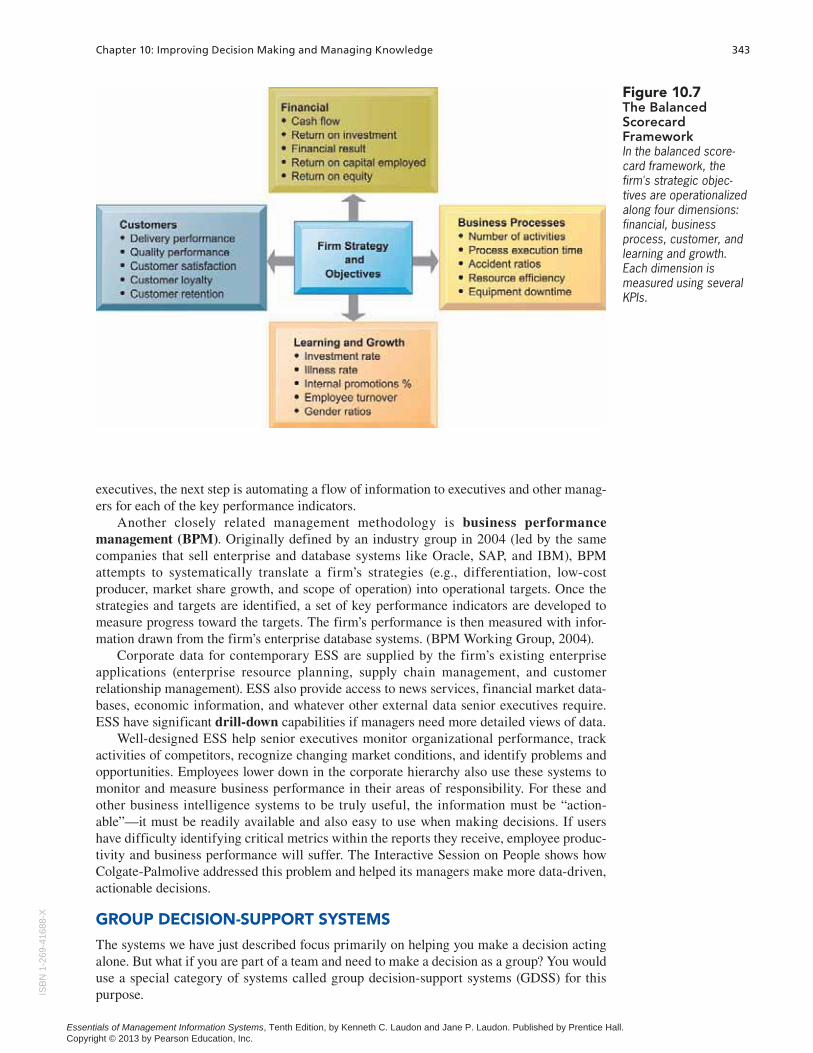
Business intelligence delivered in the form of executive support systems (ESS) helps senior executives focus on the really important performance information that affects the overall profitability and success of the firm. Currently, the leading methodology for understand-ing the most important information needed by a firm’s executives is called the balanced scorecard method (Kaplan and Norton, 2004; Kaplan and Norton, 1992). The balanced score card is a framework for operationalizing a firm’s strategic plan by focusing on measurable outcomes on four dimensions of firm performance: financial, business process, customer, and learning and growth (see Figure 10.7).
Performance on each dimension is measured using key performance indicators (KPIs), which are the measures proposed by senior management for understanding how well the firm is performing along any given dimension. For instance, one key indicator of how well an online retail firm is meeting its customer performance objectives is the average length of time required to deliver a package to a consumer. If your firm is a bank, one KPI of business process performance is the length of time required to perform a basic function like creating a new customer account.
The balanced scorecard framework is thought to be “balanced” because it causes managers to focus on more than just financial performance. In this view, financial performance is past history—the result of past actions—and managers should focus on the things they are able to influence today, such as business process efficiency, customer satisfaction, and employee training. Once a scorecard is developed by consultants and senior
Figure 10.6 A Pivot Table that Examines Customer Regional Distribution and Advertising Source In this pivot table, we are able to examine where an online training company’s customers come from in terms of region and advertising source.
ISB
N1-269-41688-X
Essentials of Management Information Systems, Tenth Edition, by Kenneth C. Laudon and Jane P. Laudon. Published by Prentice Hall. Copyright © 2013 by Pearson Education, Inc.
Chapter 10: Improving Decision Making and Managing Knowledge 343
executives, the next step is automating a flow of information to executives and other manag-ers for each of the key performance indicators.
Another closely related management methodology is business performance management (BPM). Originally defined by an industry group in 2004 (led by the same companies that sell enterprise and database systems like Oracle, SAP, and IBM), BPM attempts to systematically translate a firm’s strategies (e.g., differentiation, low-cost producer, market share growth, and scope of operation) into operational targets. Once the strategies and targets are identified, a set of key performance indicators are developed to measure progress toward the targets. The firm’s performance is then measured with infor-mation drawn from the firm’s enterprise database systems. (BPM Working Group, 2004).
Corporate data for contemporary ESS are supplied by the firm’s existing enterprise applications (enterprise resource planning, supply chain management, and customer relationship management). ESS also provide access to news services, financial market data-bases, economic information, and whatever other external data senior executives require. ESS have significant drill-down capabilities if managers need more detailed views of data.
Well-designed ESS help senior executives monitor organizational performance, track activities of competitors, recognize changing market conditions, and identify problems and opportunities. Employees lower down in the corporate hierarchy also use these systems to monitor and measure business performance in their areas of responsibility. For these and other business intelligence systems to be truly useful, the information must be “action-able”—it must be readily available and also easy to use when making decisions. If users have difficulty identifying critical metrics within the reports they receive, employee produc-tivity and business performance will suffer. The Interactive Session on People shows how Colgate-Palmolive addressed this problem and helped its managers make more data-driven, actionable decisions.
GROUP DECISION-SUPPORT SYSTEMS
The systems we have just described focus primarily on helping you make a decision acting alone. But what if you are part of a team and need to make a decision as a group? You would use a special category of systems called group decision-support systems (GDSS) for this purpose.
Figure 10.7 The Balanced Scorecard Framework In the balanced score-card framework, the firm's strategic objec-tives are operationalized along four dimensions: financial, business process, customer, and learning and growth. Each dimension is measured using several KPIs.
ISB
N1-
269-
4168
8-X
Essentials of Management Information Systems, Tenth Edition, by Kenneth C. Laudon and Jane P. Laudon. Published by Prentice Hall. Copyright © 2013 by Pearson Education, Inc.
344 Part III: Key System Applications for the Digital Age
INTERACTIVE SESSION: PEOPLE Colgate-Palmolive Keeps Managers Smiling with Executive Dashboards
Colgate-Palmolive Company is the second largest consumer products company in the world, and its products are marketed in over 200 countries and territories. The company had 39,000 employees worldwide and $16 billion in annual revenue in 2010. Colgate has been keeping people smiling and clean around the world, with more than three-quarters of its sales in recent years coming from outside the United States. Colgate’s brands in oral products, soap, and pet food, are global names, including Colgate, Palmolive, Mennen, Softsoap, Irish Spring, Sorriso, Kolynos, Elmex, Tom’s of Maine, Ajax, Axion, Fabuloso, Soupline, and Suavitel, as well as Hill’s Science Diet and Hill’s Prescription Diet.
The secret to continued growth and stability for the past two decades has been Colgate’s ability to move its brands offshore to Latin America, Europe and Asia. In the past, Colgate divided the world into geographic regions: Latin American, Europe, Asia, and North America. Each region had its own infor-mation systems. As long as the regions did not need to share resources or information, this patchwork system worked, more or less. This all changed as global operations became more integrated and senior management needed to oversee and coordinate these operations more closely.
Colgate had been a global SAP user since the early 1990s, but it was running five separate ERP systems to serve its different geographic regions. Over a period of time, disparities in the data developed between different geographic regions, and between the data used at the corporate level and the data used by an individual region or business unit. The data were constantly changing. For example, every time a sales report was run, it showed different numbers for orders and shipments. Colgate wanted more usable data to drive business decisions and all of its managers and business units worldwide to work with the same version of the data.
Colgate chose to solve this problem by creating a single global data repository using SAP NetWeaver Business Warehouse, SAP’s analytical, reporting and data warehousing solution. Colgate’s regional ERP systems feed their data to the warehouse, where the data are standardized and formatted for enter-prise-wide reporting and analysis. This eliminates differences in data across the enterprise.
One of the outputs of the warehouse for senior managers is a daily HTML table showing a series of financial and operational metrics for the day compared to the previous month and quarter. The data the executives see are exactly the same as what their peers in all Colgate regions and business units see.
However, the data were not being used by enough employees in their decision making to have an impact on business benefits. Colgate’s power users had no trouble using the reporting and analytical tools provided by the warehouse, and they were satisfied with the matrix reports from the system. Colgate’s senior managers and other casual users, on the other hand, did not feel comfortable running ad hoc reports or drilling down into the layers of data to answer questions the data brought to light. They did not have much time to spend developing reports, and the standard reports produced for them by the warehouse lacked navigation and drill-down capabilities. Tables had no color coding, so users could only interpret the data by scrutinizing the numbers in the table.
Eventually Colgate’s senior managers and other casual users began requesting deeper access to the warehouse data in a more timely and user-friendly format. They wanted reports that were easier to run where the data could be interpreted faster. Senior management requested customizable, real-time dashboards that could be more easily used to drive performance improvement.
Colgate’s information systems specialists then implemented SAP NetWeaver BW Accelerator to speed up data loads and improve user perception and adoption, and they implemented SAP Business Objects Web Intelligence to build customized reports. SAP Business Objects Web Intelligence provides a powerful, intuitive interface that enables business ana-lysts and non-technical business professionals to ask spontaneous questions about their data. Casual busi-ness users can use simple drag-and-drop techniques to access data sources and create interactive reports that drill, slice, and format information based on their needs. Tools for cutting-edge visualization allow end users to view two- and three-dimensional charts and hone in on specific areas of focus.
Colgate started using SAP’s Business Objects tools to build user-friendly dashboards, and quickly created dashboard prototypes for management to review. Using drop-down menus, sliders, and editable labels and colors, the information systems staff was able to create customized dashboards that simplified the pre-sentation of complex business data to suit different types of employees. Once management approved the dashboard design, the dashboards were populated with production data. Now Colgate’s senior managers are running the dashboards to monitor the business from a high level.
Employee training was essential to the dashboards’ success. Members of Colgate’s global information
344 Part III: Key System Applications for the Digital AgeIS
BN
1-269-41688-X
Essentials of Management Information Systems, Tenth Edition, by Kenneth C. Laudon and Jane P. Laudon. Published by Prentice Hall. Copyright © 2013 by Pearson Education, Inc.
Chapter 10: Improving Decision Making and Managing Knowledge 345
systems development team created customized courses for Colgate’s 65 business intelligence experts and ran the classroom training. The training identified people who could be used as resources for develop-ing the reporting tools. When word spread about the dashboards’ capabilities, Colgate’s power users signed up for the classes as well.
For Colgate, better reporting tools that can support different kinds of users have greatly expanded the use of business intelligence throughout the company. Currently, about 4,000 users interact with Colgate’s SAP systems daily, but this number is expected to expand to 15,000 or 20,000 users in the future. People who are accustomed to seeing reports stuffed with
numbers are finding that they can use the informa-tion presented in dashboards to make faster deci-sions. For example, managers can determine positive or negative financial conditions by simply looking for where dashboard reports use the color green, which reflects improvements in Colgate’s financial position. Executives who formerly relied on other people to obtain their custom reports and data are able to access the information on their own. They can see real data from the system much more easily and quickly.
Sources: David Hannon, “Colgate-Palmolive Empowers Senior Leaders with
Executive Dashboards,” SAP InsiderPROFILES, April-June 2011; “See Your
Business Clearly,” SAP, 2010; and “Placing Relevant Business Content within
Business User Reach,” SAP, 2011.
1. Describe the different types of business intelligence users at Colgate-Palmolive.
2. Describe the “people” issues that were affecting Colgate’s ability to use business intelligence.
3. What people, organization, and technology factors had to be addressed in providing business intelligence capabilities for each type of user?
4. What kind of decisions does Colgate’s new business intelligence capability support? Give three examples. What is their potential business impact?
Visit Colgate-Palmolive’s Web site to access its annual report. Based on this report, describe two or three dashboards that might be appropriate for senior management.
CASE STUDY QUESTIONS MIS IN ACTION
Chapter 10: Improving Decision Making and Managing Knowledge 345
A group decision-support system (GDSS) is an interactive computer-based system for facilitating the solution of unstructured problems by a set of decision makers working together as a group in the same location or in different locations. Groupware and Web-based tools for videoconferencing and electronic meetings described earlier in this text support some group decision processes, but their focus is primarily on communi-cation. GDSS, however, provide tools and technologies geared explicitly toward group decision making.
GDSS-guided meetings take place in conference rooms with special hardware and software tools to facilitate group decision making. The hardware includes computer and networking equipment, overhead projectors, and display screens. Special electronic meeting software collects, documents, ranks, edits, and stores the ideas offered in a decision-making meeting. The more elaborate GDSS use a professional facilitator and support staff. The facilitator selects the software tools and helps organize and run the meeting.
A sophisticated GDSS provides each attendee with a dedicated desktop computer under that person’s individual control. No one will be able to see what individuals do on their computers until those participants are ready to share information. Their input is transmit-ted over a network to a central server that stores information generated by the meeting and makes it available to all on the meeting network. Data can also be projected on a large screen in the meeting room.IS
BN
1-26
9-41
688-
X
Essentials of Management Information Systems, Tenth Edition, by Kenneth C. Laudon and Jane P. Laudon. Published by Prentice Hall. Copyright © 2013 by Pearson Education, Inc.
346 Part III: Key System Applications for the Digital Age
GDSS make it possible to increase meeting size while at the same time increasing productivity because individuals contribute simultaneously rather than one at a time. A GDSS promotes a collaborative atmosphere by guaranteeing contributors’ anonymity so that attendees can focus on evaluating the ideas themselves without fear of personally being criticized or of having their ideas rejected based on the contributor. GDSS software tools follow structured methods for organizing and evaluating ideas and for preserving the results of meetings, enabling nonattendees to locate needed information after the meeting. The effectiveness of GDSS depends on the nature of the problem and the group and on how well a meeting is planned and conducted.
10.3 Intelligent Systems for Decision Support
Decision making is also enhanced by intelligent techniques and knowledge management systems. Intelligent techniques consist of expert systems, case-based reasoning, genetic algorithms, neural networks, fuzzy logic, and intelligent agents. These techniques are based on artificial intelligence (AI) technology, which consists of computer-based systems (both hardware and software) that attempt to emulate human behavior and thought patterns. Intelligent techniques aid decision makers by capturing individual and collective knowledge, discovering patterns and behaviors in very large quantities of data, and generating solutions to problems that are too large and complex for human beings to solve on their own.
Knowledge management systems, which we introduced in Chapter 2, and knowledge work systems provide tools for knowledge discovery, communication, and collaboration that make knowledge more easily available to decision makers and integrate it into the business processes of the firm.
EXPERT SYSTEMS
What if employees in your firm had to make decisions that required some special knowledge, such as how to formulate a fast-drying sealing compound or how to diagnose and repair a malfunctioning diesel engine, but all the people with that expertise had left the firm? Expert systems are one type of decision-making aid that could help you out. An expert system captures human expertise in a limited domain of knowledge as a set of rules in a software system that can be used by others in the organization. These systems typically perform a limited number of tasks that can be performed by professionals in a few minutes or hours, such as diagnosing a malfunctioning machine or determining whether to grant credit for a loan. They are useful in decision-making situations where expertise is expensive or in short supply.
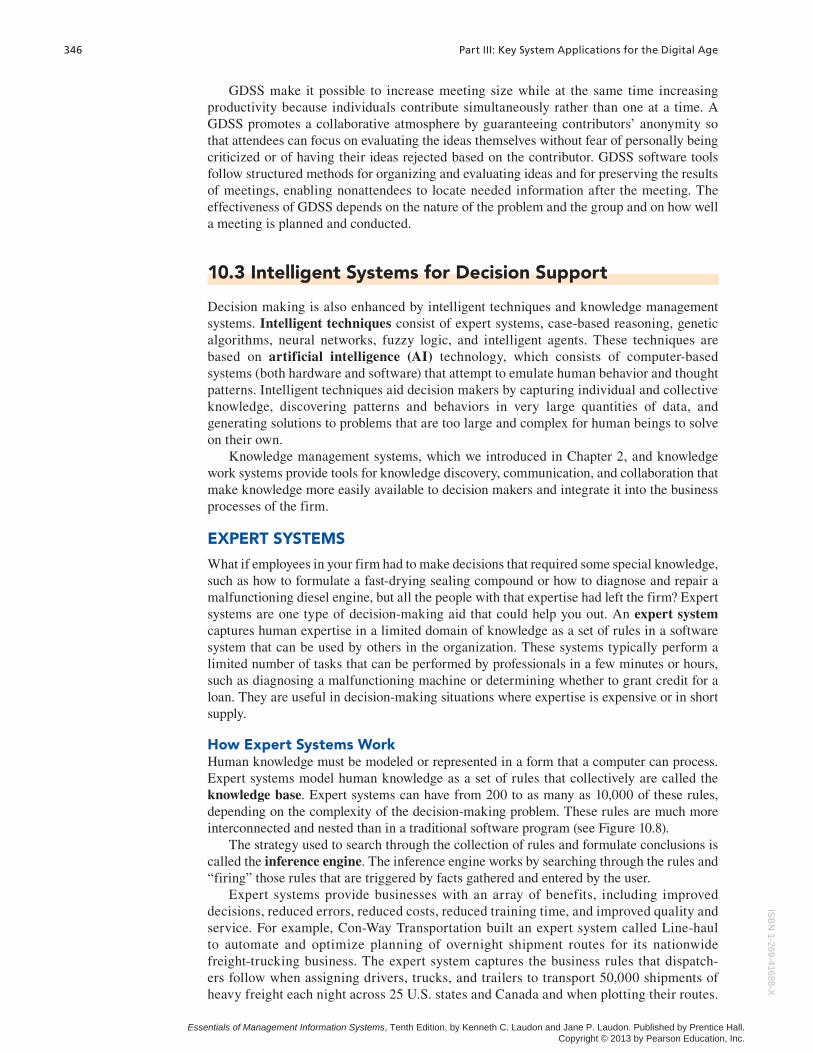
How Expert Systems WorkHuman knowledge must be modeled or represented in a form that a computer can process. Expert systems model human knowledge as a set of rules that collectively are called the knowledge base. Expert systems can have from 200 to as many as 10,000 of these rules, depending on the complexity of the decision-making problem. These rules are much more interconnected and nested than in a traditional software program (see Figure 10.8).
The strategy used to search through the collection of rules and formulate conclusions is called the inference engine. The inference engine works by searching through the rules and “firing” those rules that are triggered by facts gathered and entered by the user.
Expert systems provide businesses with an array of benefits, including improved decisions, reduced errors, reduced costs, reduced training time, and improved quality and service. For example, Con-Way Transportation built an expert system called Line-haul to automate and optimize planning of overnight shipment routes for its nationwide freight-trucking business. The expert system captures the business rules that dispatch-ers follow when assigning drivers, trucks, and trailers to transport 50,000 shipments of heavy freight each night across 25 U.S. states and Canada and when plotting their routes.
ISB
N1-269-41688-X
Essentials of Management Information Systems, Tenth Edition, by Kenneth C. Laudon and Jane P. Laudon. Published by Prentice Hall. Copyright © 2013 by Pearson Education, Inc.
Chapter 10: Improving Decision Making and Managing Knowledge 347
Line-haul runs on a Sun platform and uses data on daily customer shipment requests, available drivers, trucks, trailer space, and weight stored in an Oracle database. The expert system uses thousands of rules and 100,000 lines of program code written in C++ to crunch the numbers and create optimum routing plans for 95 percent of daily freight shipments. Con-Way dispatchers tweak the routing plan provided by the expert system and relay final routing specifications to field personnel responsible for packing the trail-ers for their nighttime runs. Con-Way recouped its $3 million investment in the system within two years by reducing the number of drivers, packing more freight per trailer, and reducing damage from rehandling. The system also reduces dispatchers’ arduous nightly tasks.
Although expert systems lack the robust and general intelligence of human beings, they can provide benefits to organizations if their limitations are well understood. Only certain classes of problems can be solved using expert systems. Virtually all successful expert systems deal with problems of classification in which there are relatively few alternative outcomes and in which these possible outcomes are all known in advance. Expert systems are much less useful for dealing with unstructured problems typically encountered by managers.
CASE-BASED REASONING
Expert systems primarily capture the knowledge of individual experts, but organizations also have collective knowledge and expertise that they have built up over the years. This
Figure 10.8 Rules in an Expert SystemAn expert system contains a set of rules to be followed when used. The rules are interconnected, the number of outcomes is known in advance and is limited, there are multiple paths to the same outcome, and the system can consider multiple rules at a single time. The rules illustrated are for a simple credit-granting expert system.
ISB
N1-
269-
4168
8-X
Essentials of Management Information Systems, Tenth Edition, by Kenneth C. Laudon and Jane P. Laudon. Published by Prentice Hall. Copyright © 2013 by Pearson Education, Inc.
348 Part III: Key System Applications for the Digital Age
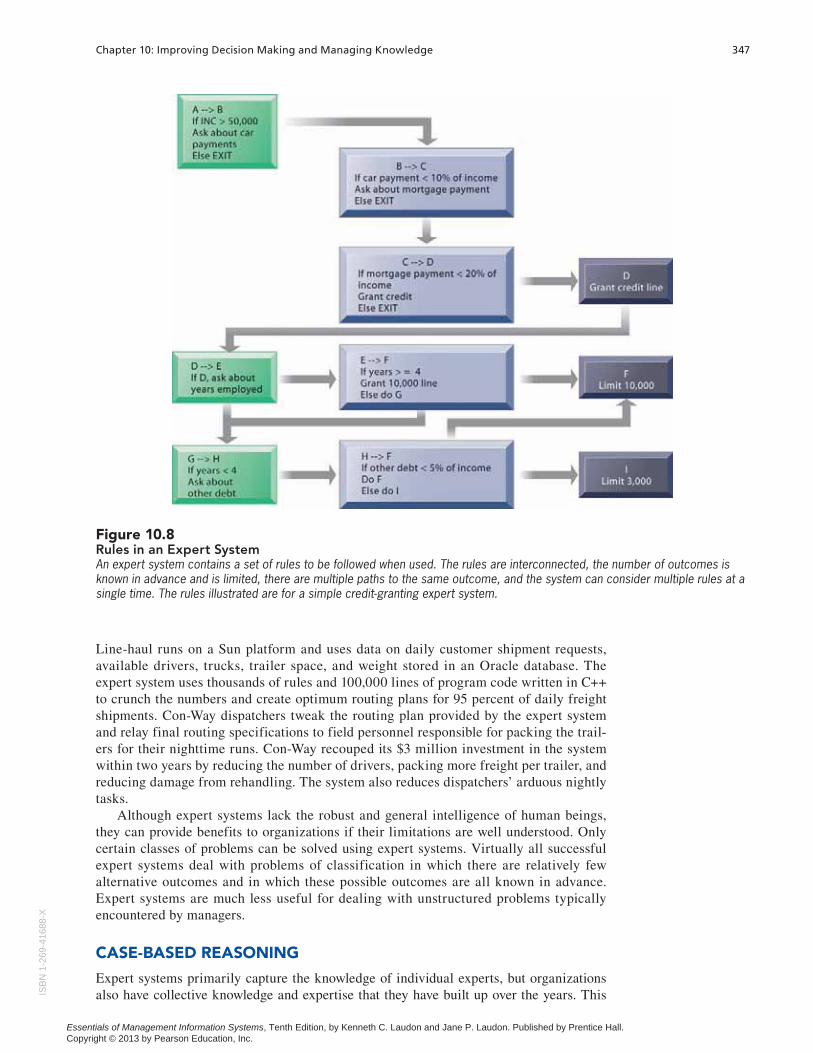
organizational knowledge can be captured and stored using case-based reasoning. In case-based reasoning (CBR), knowledge and past experiences of human specialists are represented as cases and stored in a database for later retrieval when the user encounters a new case with similar parameters. The system searches for stored cases with problem characteristics similar to the new one, finds the closest fit, and applies the solutions of the old case to the new case. Successful solutions are tagged to the new case and both are stored together with the other cases in the knowledge base. Unsuccessful solutions also are appended to the case database along with explanations as to why the solutions did not work (see Figure 10.9).
You’ll find case-based reasoning in diagnostic systems in medicine or customer support where users can retrieve past cases whose characteristics are similar to the new case. The system suggests a solution or diagnosis based on the best-matching retrieved case.
FUZZY LOGIC SYSTEMS
Most people do not think in terms of traditional IF-THEN rules or precise numbers. Humans tend to categorize things imprecisely, using rules for making decisions that may have many shades of meaning. For example, a man or a woman may be strong or intelligent. A company may be large, medium, or small in size. Temperature may be hot, cold, cool, or warm. These categories represent a range of values.
Fuzzy logic is a rule-based technology that represents such imprecision by creating rules that use approximate or subjective values. It describes a particular phenomenon or process linguistically and then represents that description in a small number of flexible rules.
Let’s look at the way fuzzy logic would represent various temperatures in a computer application to control room temperature automatically. The terms (known as membership
Figure 10.9 How Case-Based Reasoning WorksCase-based reasoning represents knowledge as a database of past cases and their solutions. The system uses a six-step process to generate solutions to new problems encountered by the user.
ISB
N1-269-41688-X
Essentials of Management Information Systems, Tenth Edition, by Kenneth C. Laudon and Jane P. Laudon. Published by Prentice Hall. Copyright © 2013 by Pearson Education, Inc.
Chapter 10: Improving Decision Making and Managing Knowledge 349
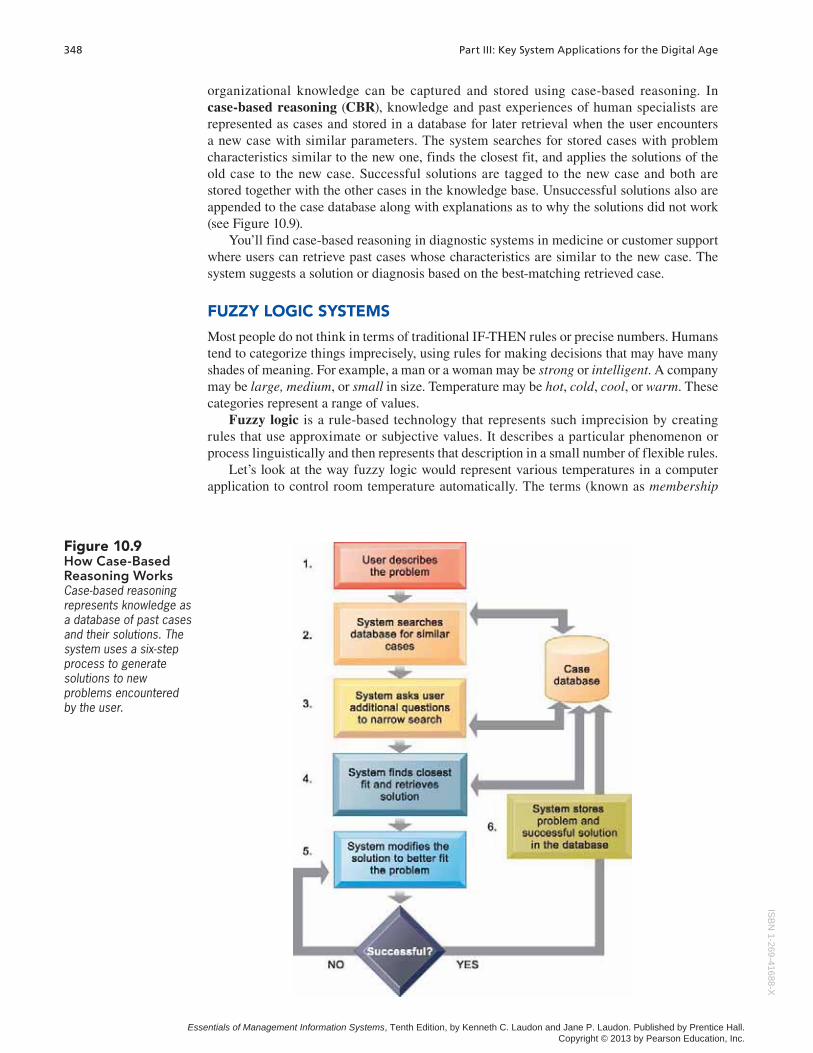
functions) are imprecisely defined so that, for example, in Figure 10.10, cool is between 45 degrees and 70 degrees, although the temperature is most clearly cool between about 60 degrees and 67 degrees. Note that cool is overlapped by cold or norm. To control the room environment using this logic, the programmer would develop similarly imprecise definitions for humidity and other factors, such as outdoor wind and temperature. The rules might include one that says, “If the temperature is cool or cold and the humidity is low while the outdoor wind is high and the outdoor temperature is low, raise the heat and humidity in the room.” The computer would combine the membership function readings in a weighted manner and, using all the rules, raise and lower the temperature and humidity.
Fuzzy logic provides solutions to problems requiring expertise that is difficult to represent in the form of crisp IF-THEN rules. In Japan, Sendai’s subway system uses fuzzy logic controls to accelerate so smoothly that standing passengers need not hold on. Fuzzy logic allows incremental changes in inputs to produce smooth changes in outputs instead of discontinuous ones, making it useful for consumer electronics and engineering applications.
NEURAL NETWORKS
Neural networks are used for solving complex, poorly understood problems for which large amounts of data have been collected. They find patterns and relationships in massive amounts of data that would be too complicated and difficult for a human being to analyze. Neural networks discover this knowledge by using hardware and software that parallel the processing patterns of the biological or human brain. Neural networks “learn” patterns from large quantities of data by sifting through data, searching for relationships, building models, and correcting over and over again the model’s own mistakes.
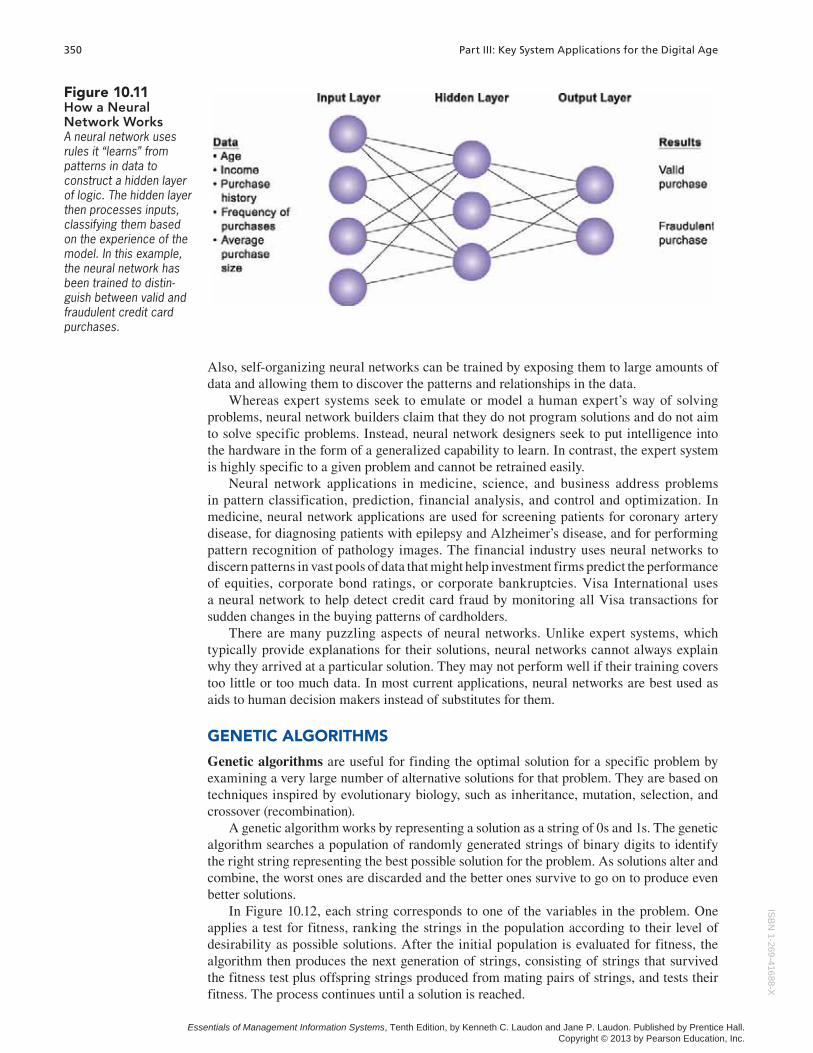
A neural network has a large number of sensing and processing nodes that continuously interact with each other. Figure 10.11 represents one type of neural network comprising an input layer, a hidden processing layer, and an output layer. Humans “train” the network by feeding it a set of training data for which the inputs produce a known set of outputs or conclusions. This helps the computer learn the correct solution by example. As the computer is fed more data, each case is compared with the known outcome. If it differs, a correction is calculated and applied to the nodes in the hidden processing layer. These steps are repeated until a condition, such as corrections being less than a certain amount, is reached. The neural network in Figure 10.11 has learned how to identify a fraudulent credit card purchase.
Figure 10.10 Fuzzy Logic for Temperature ControlThe membership functions for the input called “temperature” are in the logic of the thermostat to control the room temperature. Membership functions help translate linguistic expressions, such as warm, into numbers that the computer can manipulate.IS
BN
1-26
9-41
688-
X
Essentials of Management Information Systems, Tenth Edition, by Kenneth C. Laudon and Jane P. Laudon. Published by Prentice Hall. Copyright © 2013 by Pearson Education, Inc.
350 Part III: Key System Applications for the Digital Age
Also, self-organizing neural networks can be trained by exposing them to large amounts of data and allowing them to discover the patterns and relationships in the data.
Whereas expert systems seek to emulate or model a human expert’s way of solving problems, neural network builders claim that they do not program solutions and do not aim to solve specific problems. Instead, neural network designers seek to put intelligence into the hardware in the form of a generalized capability to learn. In contrast, the expert system is highly specific to a given problem and cannot be retrained easily.
Neural network applications in medicine, science, and business address problems in pattern classification, prediction, financial analysis, and control and optimization. In medicine, neural network applications are used for screening patients for coronary artery disease, for diagnosing patients with epilepsy and Alzheimer’s disease, and for performing pattern recognition of pathology images. The financial industry uses neural networks to discern patterns in vast pools of data that might help investment firms predict the performance of equities, corporate bond ratings, or corporate bankruptcies. Visa International uses a neural network to help detect credit card fraud by monitoring all Visa transactions for sudden changes in the buying patterns of cardholders.
There are many puzzling aspects of neural networks. Unlike expert systems, which typically provide explanations for their solutions, neural networks cannot always explain why they arrived at a particular solution. They may not perform well if their training covers too little or too much data. In most current applications, neural networks are best used as aids to human decision makers instead of substitutes for them.
GENETIC ALGORITHMS
Genetic algorithms are useful for finding the optimal solution for a specific problem by examining a very large number of alternative solutions for that problem. They are based on techniques inspired by evolutionary biology, such as inheritance, mutation, selection, and crossover (recombination).
A genetic algorithm works by representing a solution as a string of 0s and 1s. The genetic algorithm searches a population of randomly generated strings of binary digits to identify the right string representing the best possible solution for the problem. As solutions alter and combine, the worst ones are discarded and the better ones survive to go on to produce even better solutions.
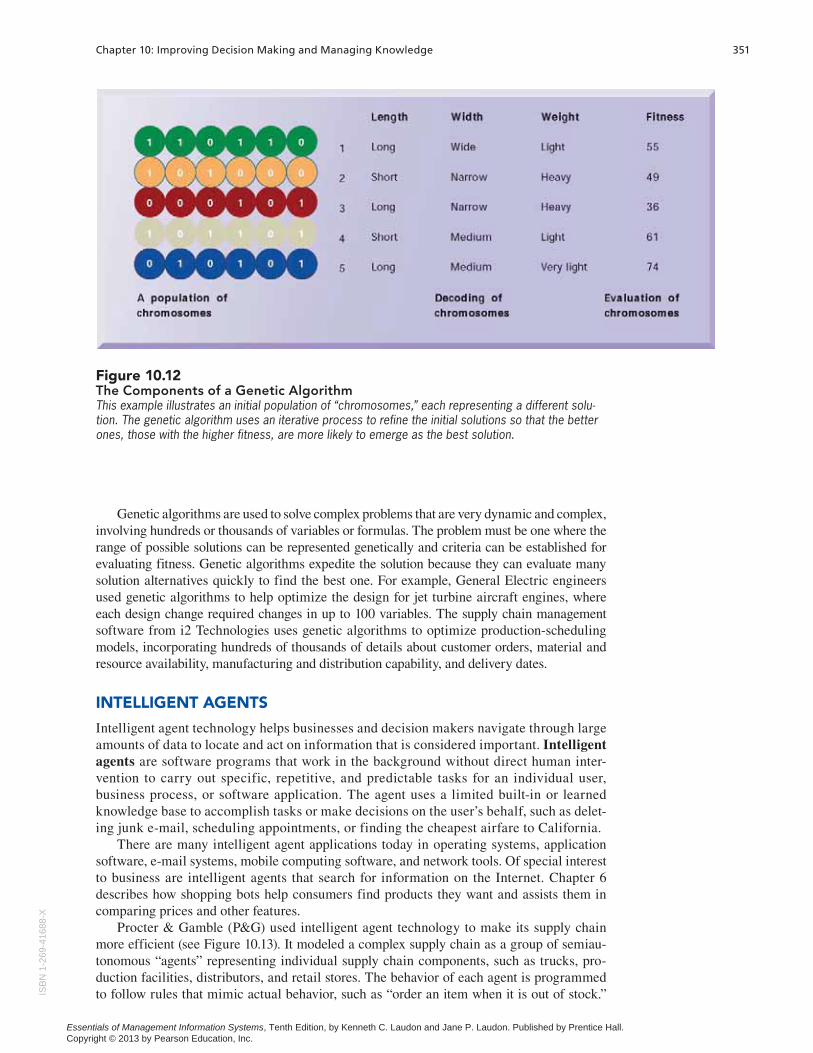
In Figure 10.12, each string corresponds to one of the variables in the problem. One applies a test for fitness, ranking the strings in the population according to their level of desirability as possible solutions. After the initial population is evaluated for fitness, the algorithm then produces the next generation of strings, consisting of strings that survived the fitness test plus offspring strings produced from mating pairs of strings, and tests their fitness. The process continues until a solution is reached.
Figure 10.11 How a Neural Network WorksA neural network uses rules it “learns” from patterns in data to construct a hidden layer of logic. The hidden layer then processes inputs, classifying them based on the experience of the model. In this example, the neural network has been trained to distin-guish between valid and fraudulent credit card purchases.
ISB
N1-269-41688-X
Essentials of Management Information Systems, Tenth Edition, by Kenneth C. Laudon and Jane P. Laudon. Published by Prentice Hall. Copyright © 2013 by Pearson Education, Inc.
Chapter 10: Improving Decision Making and Managing Knowledge 351
Genetic algorithms are used to solve complex problems that are very dynamic and complex, involving hundreds or thousands of variables or formulas. The problem must be one where the range of possible solutions can be represented genetically and criteria can be established for evaluating fitness. Genetic algorithms expedite the solution because they can evaluate many solution alternatives quickly to find the best one. For example, General Electric engineers used genetic algorithms to help optimize the design for jet turbine aircraft engines, where each design change required changes in up to 100 variables. The supply chain management software from i2 Technologies uses genetic algorithms to optimize production-scheduling models, incorporating hundreds of thousands of details about customer orders, material and resource availability, manufacturing and distribution capability, and delivery dates.
INTELLIGENT AGENTS
Intelligent agent technology helps businesses and decision makers navigate through large amounts of data to locate and act on information that is considered important. Intelligent agents are software programs that work in the background without direct human inter-vention to carry out specific, repetitive, and predictable tasks for an individual user, business process, or software application. The agent uses a limited built-in or learned knowledge base to accomplish tasks or make decisions on the user’s behalf, such as delet-ing junk e-mail, scheduling appointments, or finding the cheapest airfare to California.
There are many intelligent agent applications today in operating systems, application software, e-mail systems, mobile computing software, and network tools. Of special interest to business are intelligent agents that search for information on the Internet. Chapter 6 describes how shopping bots help consumers find products they want and assists them in comparing prices and other features.
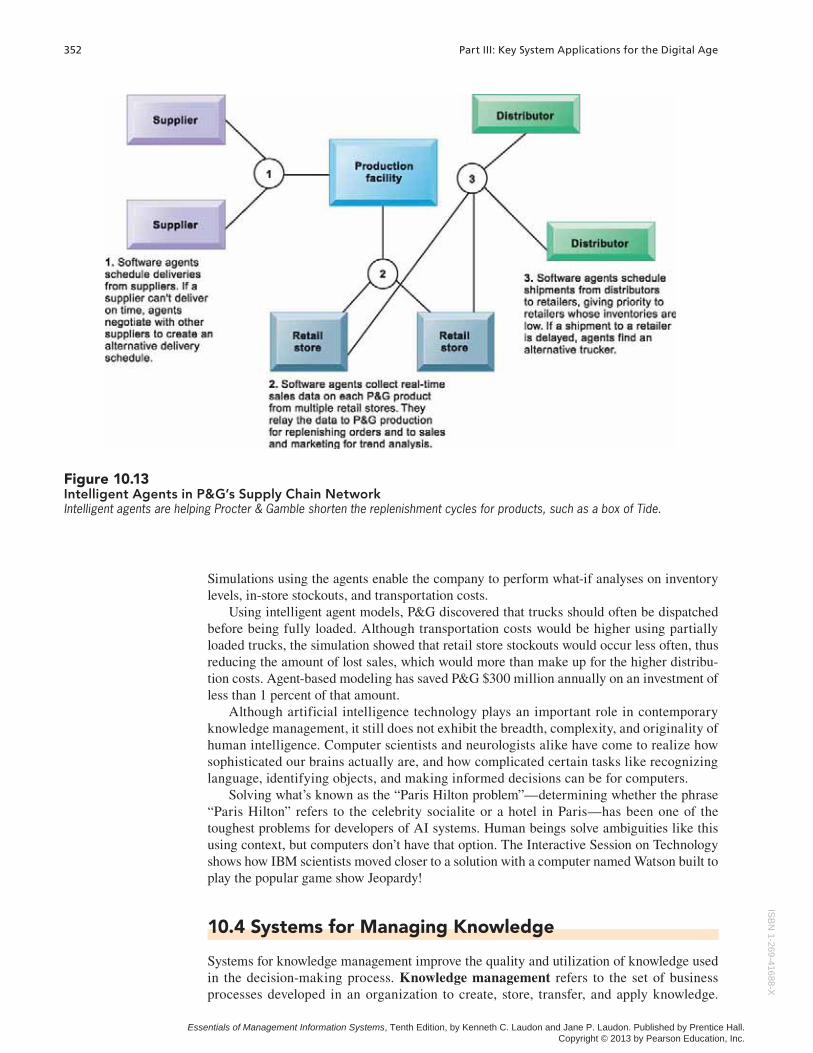
Procter & Gamble (P&G) used intelligent agent technology to make its supply chain more efficient (see Figure 10.13). It modeled a complex supply chain as a group of semiau-tonomous “agents” representing individual supply chain components, such as trucks, pro-duction facilities, distributors, and retail stores. The behavior of each agent is programmed to follow rules that mimic actual behavior, such as “order an item when it is out of stock.”
Figure 10.12 The Components of a Genetic AlgorithmThis example illustrates an initial population of “chromosomes,” each representing a different solu-tion. The genetic algorithm uses an iterative process to refine the initial solutions so that the better ones, those with the higher fitness, are more likely to emerge as the best solution.
ISB
N1-
269-
4168
8-X
Essentials of Management Information Systems, Tenth Edition, by Kenneth C. Laudon and Jane P. Laudon. Published by Prentice Hall. Copyright © 2013 by Pearson Education, Inc.
352 Part III: Key System Applications for the Digital Age
Simulations using the agents enable the company to perform what-if analyses on inventory levels, in-store stockouts, and transportation costs.
Using intelligent agent models, P&G discovered that trucks should often be dispatched before being fully loaded. Although transportation costs would be higher using partially loaded trucks, the simulation showed that retail store stockouts would occur less often, thus reducing the amount of lost sales, which would more than make up for the higher distribu-tion costs. Agent-based modeling has saved P&G $300 million annually on an investment of less than 1 percent of that amount.
Although artificial intelligence technology plays an important role in contemporary knowledge management, it still does not exhibit the breadth, complexity, and originality of human intelligence. Computer scientists and neurologists alike have come to realize how sophisticated our brains actually are, and how complicated certain tasks like recognizing language, identifying objects, and making informed decisions can be for computers.
Solving what’s known as the “Paris Hilton problem”—determining whether the phrase “Paris Hilton” refers to the celebrity socialite or a hotel in Paris—has been one of the toughest problems for developers of AI systems. Human beings solve ambiguities like this using context, but computers don’t have that option. The Interactive Session on Technology shows how IBM scientists moved closer to a solution with a computer named Watson built to play the popular game show Jeopardy!
10.4 Systems for Managing Knowledge
Systems for knowledge management improve the quality and utilization of knowledge used in the decision-making process. Knowledge management refers to the set of business processes developed in an organization to create, store, transfer, and apply knowledge.
Figure 10.13Intelligent Agents in P&G’s Supply Chain NetworkIntelligent agents are helping Procter & Gamble shorten the replenishment cycles for products, such as a box of Tide.
ISB
N1-269-41688-X
Essentials of Management Information Systems, Tenth Edition, by Kenneth C. Laudon and Jane P. Laudon. Published by Prentice Hall. Copyright © 2013 by Pearson Education, Inc.
Chapter 10: Improving Decision Making and Managing Knowledge 353
INTERACTIVE SESSION: TECHNOLOGY IBM’s Watson: Can Computers Replace Humans?
In February 2011, an IBM computer named Watson took on the two most-decorated champions of the game show Jeopardy, Ken Jennings and Brad Rutter. Watson, which was named after IBM’s founder, Thomas J. Watson, won handily.
Watson’s achievement represents a milestone in the ability of computers to process and interpret human language. The goal of the IBM team, a group of 25 researchers led by Dr. David Ferrucci, was to develop a more effective set of techniques that computers can use to process “natural language”—language that human beings instinctively use, not language specially formatted to be understood by computers. Watson had to go far beyond responding to simple commands, or receiving only specific, pre-defined inputs. Jeopardy questions are renowned for their wordplay, hidden meanings, and tricky puns, and can deal with practically any subject matter. For computers, language processing doesn’t get much harder.
Watson’s performance on the show was far from perfect. The computer blundered on a Final Jeopardy question with the category “U.S. Cities,” where it selected Toronto as its response. Sometimes, the answers in a category do not directly correspond with the title of the category, so Watson didn’t assume, as the human players did, that the answer had to be a city in the United States. Nevertheless, Watson overcame that flub to win convincingly, finishing with over $77,000 to about $20,000 apiece for its human opponents.
The hardware required for Watson to work so quickly and accurately was staggeringly powerful. Watson consists of 10 racks of IBM POWER 750 servers running Linux, uses 15 terabytes of RAM and 2,880 processor cores (equivalent to 6,000 top-end home com-puters), and operates at 80 teraflops. Watson needed this amount of power to quickly scan its enormous database of information, including information from the Internet. The team downloaded over 10 million documents, including encyclopedias and Wikipedia, the Internet Movie Database (IMDB), and the entire archive of the New York Times. All of the data sat in Watson’s primary memory, as opposed to a much slower hard drive, so that Watson could find the data it needed within three seconds. The Watson project took 20 IBM engineers three years to build at an $18 million labor cost, and an estimated $1 million in equipment.
Watson is able to learn from its mistakes as well as its successes. To solve a typical problem, Watson tries many of the thousands of algorithms that the team has programmed it to use. The algorithms evalu-ate the language used in each clue, gather information about the important people and places mentioned in
the clue, and generate hundreds of solutions. Human beings don’t need to take such a formal approach to generate the solutions that fit a question best, but Watson compensates for this with superior computing power and speed. If a certain algorithm works to solve a problem, Watson remembers what type of question it was and the algorithm it used to get the right answer. In this way, Watson improves at answering questions over time. Watson also learns another way—the team gave Watson thousands of old Jeopardy questions to process. Watson analyzed both questions and answers to determine patterns or similarities between clues, and using these patterns, it assigns varying degrees of confidence to the answers it gives.
Watson was able to correctly answer only a small fraction of the questions it was given at first, but machine learning allowed Watson to continue improving, first growing closer to Jeopardy contestant level, and then finally reaching the Jeopardy champion level of Jennings and Rutter. Similar machine learning techniques are used in computer models that predict weather, likes and dislikes from online retailers like Amazon.com, and speech recognition to develop more accurate predictions, recommendations, and speech processing.
IBM believes future applications for Watson are numerous and wide-ranging in medicine, financial services, or any industry where sifting through large amounts of data to answer questions is important. In September 2011, health insurer WellPoint Inc., with 34.2 million members, enlisted Watson to help it choose among treatment options and medicines. The WellPoint application will combine data from three sources: a patient’s chart and electronic records main-tained by a physician or hospital, the insurance compa-ny’s history of medicines and treatments, and Watson’s huge library of textbooks and medical journals. Watson should be able to process all of the data and answer a question in moments, providing several possible diagnoses or treatments, ranked in order of the com-puter’s confidence, along with the basis for its answer.
It’s unclear how effective Watson will actually be in this field, where the information available in medical journals and other sources is highly disor-ganized, often contradictory, and littered with typos and inconsistent naming conventions. When human doctors apply their understanding of disease to our bodies, it is based on knowledge of the literature, but also based on prior experience and good guesses. There’s no guarantee that Watson can overcome these obstacles, but if it can, it could dramatically increase efficiency and accuracy of medical diagnoses.
Chapter 10: Improving Decision Making and Managing Knowledge 353IS
BN
1-26
9-41
688-
X
Essentials of Management Information Systems, Tenth Edition, by Kenneth C. Laudon and Jane P. Laudon. Published by Prentice Hall. Copyright © 2013 by Pearson Education, Inc.
354 Part III: Key System Applications for the Digital Age
1. How powerful is Watson? Describe its technology. Why does it require so much powerful hardware?
2. How “intelligent” is Watson? What can it do? What can’t it do?
3. What kinds of problems is Watson able to solve?
4. Do you think Watson will be as useful in other disciplines as IBM hopes? Will it be beneficial to everyone? Explain your answer.
Visit the IBM Web site and search for information on Watson. Then answer the following questions:
1. Which industries or disciplines is IBM targeting with Watson?
2. What improvements is IBM hoping to make in Watson’s basic functionality?
3. Try to find video of Watson playing Jeopardy. What kinds of questions does it get wrong?
Watson’s ability to process natural language allows it to perform many jobs requiring factual knowledge and expertise. Jobs that involve answering questions or conducting transactions on the telephone are likely candidates for replacement. While hundreds of thousands of people who perform these jobs could be unemployed, many businesses could use Watson’s technology to increase efficiency and improve their bottom lines.
But does Watson really understand language or the answers it’s giving? Skeptics of artificial intelli-gence insist that it doesn’t. The IBM researchers who designed the system don’t disagree. But to the IBM team, that’s less important than the fact that Watson can even answer questions correctly as frequently as it does.
Let’s ask Watson: Take a stab at predicting your future impact! Watson is silent on this and other topics. As it turns out, Watson was not programmed to look into the future, or to have intentions, objectives, or feelings about the experience of being Watson.
Sources: Anna Wilde Mathews, “Wellpoint’s New Hire. What Is Watson?” Wall Street Journal, September 12, 2011; John Markoff, “A Fight to Win the Future:
Computers vs. Humans,” New York Times, February 14, 2011; John Markoff,
“Computer Wins on ‘Jeopardy!’: Trivial, It’s Not,” New York Times, February
16, 2011; “IBM’s Watson Heads From ‘Jeopardy!’ To Columbia University
Medical Center,” CBSNewYork.com, February 17, 2011; Stanley Fish, “What
Did Watson the Computer Do?” New York Times, February 21, 2011; Charles
Babcock, “Watson’s Jeopardy Win a Victory For Mankind,” InformationWeek,
February 24, 2011; Greg Lindsay,“Changing The Game: ‘How I Beat Watson
and Came Out a Different Player” and Stephen Baker, “The Programmer’s
Dilemma: Building a Jeopardy! Champion,” McKinsey Quarterly, February
2011.
CASE STUDY QUESTIONS MIS IN ACTION
354 Part III: Key System Applications for the Digital Age
Knowledge management increases the ability of the organization to learn from its environ-ment and to incorporate knowledge into its business processes and decision making.
Knowledge that is not shared and applied to the problems facing firms and managers does not add any value to the business. Knowing how to do things effectively and efficiently in ways that other organizations cannot duplicate is a major source of profit and competitive advantage. Why? Because the knowledge you generate about your own production processes, and about your customers, usually stays within your firm and cannot be sold or purchased on the open market. In this sense, self-generated business knowledge is a strategic resource and can provide strategic advantage. Businesses will operate less effectively and efficiently if this unique knowledge is not available for decision making and ongoing operations. There are two major types of knowledge management systems: enterprise-wide knowledge management systems and knowledge work systems.
ENTERPRISE-WIDE KNOWLEDGE MANAGEMENT SYSTEMS
Firms must deal with at least three kinds of knowledge. Some knowledge exists within the firm in the form of structured text documents (reports and presentations). Decision makers also need knowledge that is semistructured, such as e-mail, voice mail, chat room exchanges, videos, digital pictures, brochures, or bulletin board postings. In still other cases, there is no formal or digital information of any kind, and the knowledge resides in the heads of employees. Much of this knowledge is tacit knowledge and is rarely written down.
ISB
N1-269-41688-X
Essentials of Management Information Systems, Tenth Edition, by Kenneth C. Laudon and Jane P. Laudon. Published by Prentice Hall. Copyright © 2013 by Pearson Education, Inc.
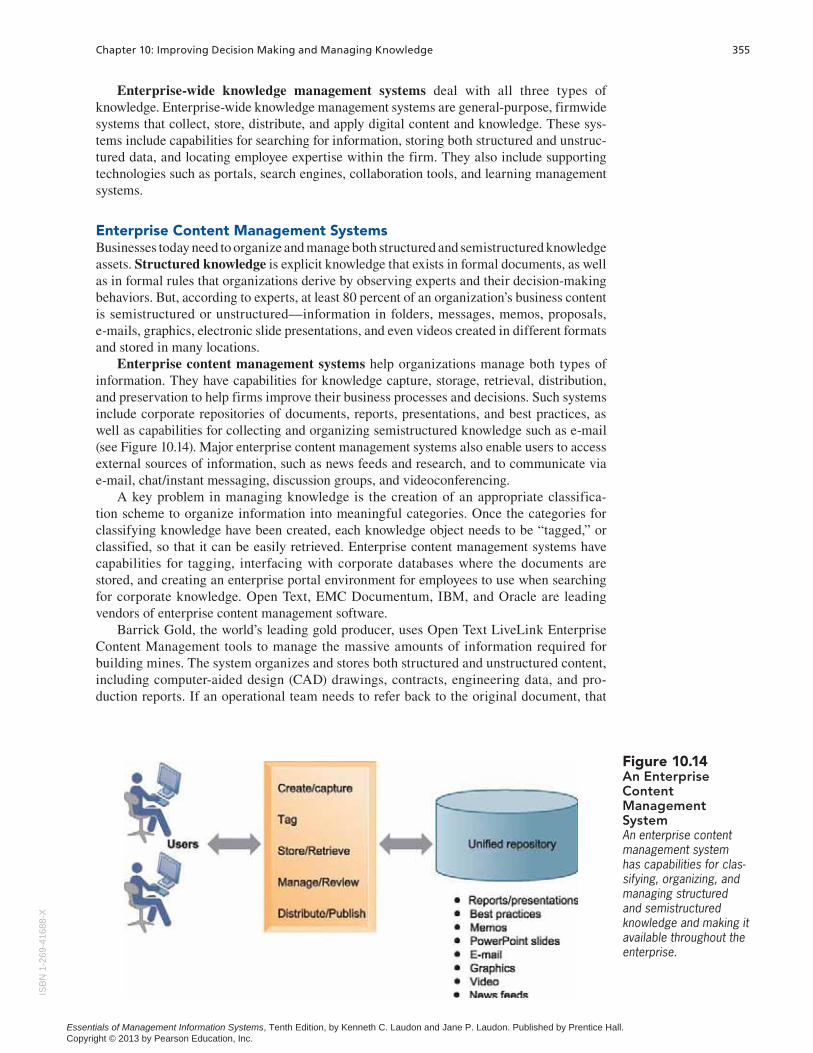
Chapter 10: Improving Decision Making and Managing Knowledge 355
Enterprise-wide knowledge management systems deal with all three types of knowledge. Enterprise-wide knowledge management systems are general-purpose, firmwide systems that collect, store, distribute, and apply digital content and knowledge. These sys-tems include capabilities for searching for information, storing both structured and unstruc-tured data, and locating employee expertise within the firm. They also include supporting technologies such as portals, search engines, collaboration tools, and learning management systems.
Enterprise Content Management SystemsBusinesses today need to organize and manage both structured and semistructured knowledge assets. Structured knowledge is explicit knowledge that exists in formal documents, as well as in formal rules that organizations derive by observing experts and their decision-making behaviors. But, according to experts, at least 80 percent of an organization’s business content is semistructured or unstructured—information in folders, messages, memos, proposals, e-mails, graphics, electronic slide presentations, and even videos created in different formats and stored in many locations.
Enterprise content management systems help organizations manage both types of information. They have capabilities for knowledge capture, storage, retrieval, distribution, and preservation to help firms improve their business processes and decisions. Such systems include corporate repositories of documents, reports, presentations, and best practices, as well as capabilities for collecting and organizing semistructured knowledge such as e-mail (see Figure 10.14). Major enterprise content management systems also enable users to access external sources of information, such as news feeds and research, and to communicate via e-mail, chat/instant messaging, discussion groups, and videoconferencing.
A key problem in managing knowledge is the creation of an appropriate classifica-tion scheme to organize information into meaningful categories. Once the categories for classifying knowledge have been created, each knowledge object needs to be “tagged,” or classified, so that it can be easily retrieved. Enterprise content management systems have capabilities for tagging, interfacing with corporate databases where the documents are stored, and creating an enterprise portal environment for employees to use when searching for corporate knowledge. Open Text, EMC Documentum, IBM, and Oracle are leading vendors of enterprise content management software.
Barrick Gold, the world’s leading gold producer, uses Open Text LiveLink Enterprise Content Management tools to manage the massive amounts of information required for building mines. The system organizes and stores both structured and unstructured content, including computer-aided design (CAD) drawings, contracts, engineering data, and pro-duction reports. If an operational team needs to refer back to the original document, that
Figure 10.14An Enterprise Content Management SystemAn enterprise content management system has capabilities for clas-sifying, organizing, and managing structured and semistructured knowledge and making it available throughout the enterprise.
ISB
N1-
269-
4168
8-X
Essentials of Management Information Systems, Tenth Edition, by Kenneth C. Laudon and Jane P. Laudon. Published by Prentice Hall. Copyright © 2013 by Pearson Education, Inc.
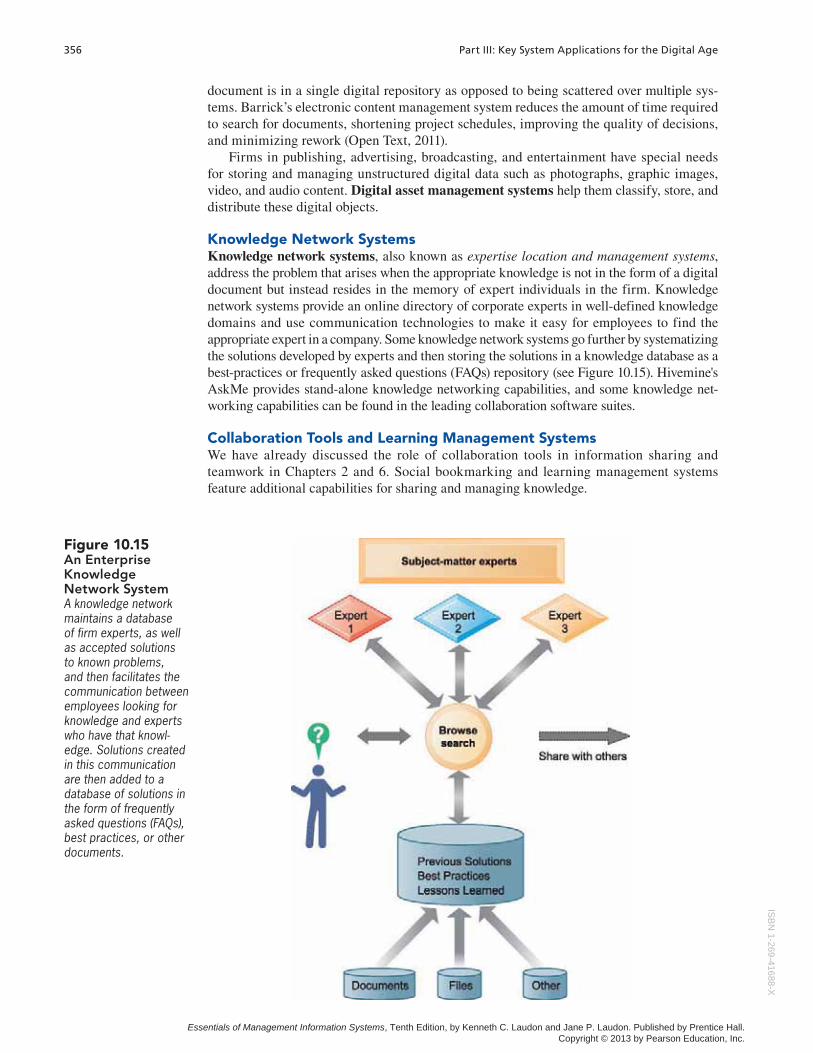
356 Part III: Key System Applications for the Digital Age
document is in a single digital repository as opposed to being scattered over multiple sys-tems. Barrick’s electronic content management system reduces the amount of time required to search for documents, shortening project schedules, improving the quality of decisions, and minimizing rework (Open Text, 2011).
Firms in publishing, advertising, broadcasting, and entertainment have special needs for storing and managing unstructured digital data such as photographs, graphic images, video, and audio content. Digital asset management systems help them classify, store, and distribute these digital objects.
Knowledge Network SystemsKnowledge network systems, also known as expertise location and management systems, address the problem that arises when the appropriate knowledge is not in the form of a digital document but instead resides in the memory of expert individuals in the firm. Knowledge network systems provide an online directory of corporate experts in well-defined knowledge domains and use communication technologies to make it easy for employees to find the appropriate expert in a company. Some knowledge network systems go further by systematizing the solutions developed by experts and then storing the solutions in a knowledge database as a best-practices or frequently asked questions (FAQs) repository (see Figure 10.15). Hivemine's AskMe provides stand-alone knowledge networking capabilities, and some knowledge net-working capabilities can be found in the leading collaboration software suites.
Collaboration Tools and Learning Management SystemsWe have already discussed the role of collaboration tools in information sharing and teamwork in Chapters 2 and 6. Social bookmarking and learning management systems feature additional capabilities for sharing and managing knowledge.
Figure 10.15An Enterprise Knowledge Network SystemA knowledge network maintains a database of firm experts, as well as accepted solutions to known problems, and then facilitates the communication between employees looking for knowledge and experts who have that knowl-edge. Solutions created in this communication are then added to a database of solutions in the form of frequently asked questions (FAQs), best practices, or other documents.
ISB
N1-269-41688-X
Essentials of Management Information Systems, Tenth Edition, by Kenneth C. Laudon and Jane P. Laudon. Published by Prentice Hall. Copyright © 2013 by Pearson Education, Inc.
Chapter 10: Improving Decision Making and Managing Knowledge 357
Social bookmarking makes it easier to search for and share information by allowing users to save their bookmarks to Web pages on a public Web site and tag these book-marks with keywords. These tags can be used to organize and search for the documents. Lists of tags can be shared with other people to help them find information of interest. The user- created taxonomies created for shared bookmarks and social tagging are called folksonomies. Delicious and Digg are two popular social bookmarking sites.
Suppose, for example, that you are on a corporate team researching wind power. If you did a Web search and found relevant Web pages on wind power, you would click on a bookmarking button on a social bookmarking site and create a tag identifying each Web document you found to link it to wind power. By clicking on the “tags” button at the social networking site, you would be able to see a list of all the tags you created and select the documents you need.
Companies need ways to keep track of and manage employee learning and to integrate it more fully into their knowledge management and other corporate systems. A learning management system (LMS) provides tools for the management, delivery, tracking, and assessment of various types of employee learning and training.
For example, the Whirlpool Corporation uses CERTPOINT’s learning management system to manage the registration, scheduling, reporting, and content for its training programs for 3,500 salespeople. The system helps Whirlpool tailor course content to the right audience, track the people who took courses and their scores, and compile metrics on employee performance.
KNOWLEDGE WORK SYSTEMS
The enterprise-wide knowledge systems we have just described provide a wide range of capabilities used by many, if not all, the workers and groups in an organization. Firms also have specialized systems for knowledge workers to help them create new knowledge for improving the firm’s business processes and decision making. Knowledge work systems (KWS) are specialized systems for engineers, scientists, and other knowledge workers that are designed to promote the creation of knowledge and to ensure that new knowledge and technical expertise are properly integrated into the business.
Requirements of Knowledge Work SystemsKnowledge work systems give knowledge workers the specialized tools they need, such as powerful graphics, analytical tools, and communications and document management. These systems require great computing power to handle the sophisticated graphics or complex calculations necessary for such knowledge workers as scientific researchers, product designers, and financial analysts. Because knowledge workers are so focused on knowledge in the external world, these systems also must give the worker quick and easy access to external databases. They typically feature user-friendly interfaces that enable users to perform needed tasks without having to spend a lot of time learning how to use the computer. Figure 10.16 summarizes the requirements of knowledge work systems.
Knowledge workstations often are designed and optimized for the specific tasks to be performed. Design engineers need graphics with enough power to handle three-dimensional CAD systems. However, financial analysts are more interested in access to a myriad of external databases and technology for efficiently storing and accessing massive amounts of financial data.
Examples of Knowledge Work SystemsMajor knowledge work applications include CAD systems (which we introduced in Chapter 3), virtual reality systems for simulation and modeling, and financial workstations.
Contemporary CAD systems are capable of generating realistic-looking three-dimen-sional graphic designs that can be rotated and viewed from all sides. Troy Lee Designs, which makes sports helmets, recently invested in CAD software that could create the IS
BN
1-26
9-41
688-
X
Essentials of Management Information Systems, Tenth Edition, by Kenneth C. Laudon and Jane P. Laudon. Published by Prentice Hall. Copyright © 2013 by Pearson Education, Inc.
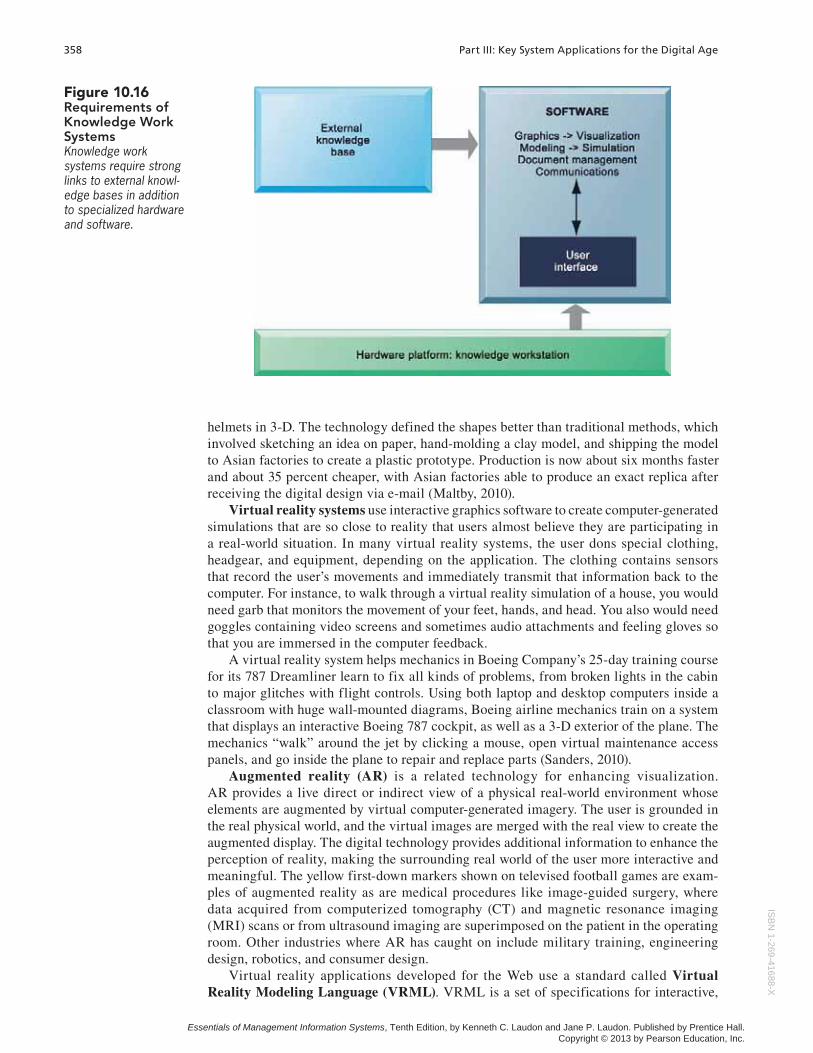
358 Part III: Key System Applications for the Digital Age
helmets in 3-D. The technology defined the shapes better than traditional methods, which involved sketching an idea on paper, hand-molding a clay model, and shipping the model to Asian factories to create a plastic prototype. Production is now about six months faster and about 35 percent cheaper, with Asian factories able to produce an exact replica after receiving the digital design via e-mail (Maltby, 2010).
Virtual reality systems use interactive graphics software to create computer- generated simulations that are so close to reality that users almost believe they are participating in a real-world situation. In many virtual reality systems, the user dons special clothing, headgear, and equipment, depending on the application. The clothing contains sensors that record the user’s movements and immediately transmit that information back to the computer. For instance, to walk through a virtual reality simulation of a house, you would need garb that monitors the movement of your feet, hands, and head. You also would need goggles containing video screens and sometimes audio attachments and feeling gloves so that you are immersed in the computer feedback.
A virtual reality system helps mechanics in Boeing Company’s 25-day training course for its 787 Dreamliner learn to fix all kinds of problems, from broken lights in the cabin to major glitches with flight controls. Using both laptop and desktop computers inside a classroom with huge wall-mounted diagrams, Boeing airline mechanics train on a system that displays an interactive Boeing 787 cockpit, as well as a 3-D exterior of the plane. The mechanics “walk” around the jet by clicking a mouse, open virtual maintenance access panels, and go inside the plane to repair and replace parts (Sanders, 2010).
Augmented reality (AR) is a related technology for enhancing visualization. AR provides a live direct or indirect view of a physical real-world environment whose elements are augmented by virtual computer-generated imagery. The user is grounded in the real physical world, and the virtual images are merged with the real view to create the augmented display. The digital technology provides additional information to enhance the perception of reality, making the surrounding real world of the user more interactive and meaningful. The yellow first-down markers shown on televised football games are exam-ples of augmented reality as are medical procedures like image-guided surgery, where data acquired from computerized tomography (CT) and magnetic resonance imaging (MRI) scans or from ultrasound imaging are superimposed on the patient in the operating room. Other industries where AR has caught on include military training, engineering design, robotics, and consumer design.
Virtual reality applications developed for the Web use a standard called Virtual Reality Modeling Language (VRML). VRML is a set of specifications for interactive,
Figure 10.16Requirements of Knowledge Work SystemsKnowledge work systems require strong links to external knowl-edge bases in addition to specialized hardware and software.
ISB
N1-269-41688-X
Essentials of Management Information Systems, Tenth Edition, by Kenneth C. Laudon and Jane P. Laudon. Published by Prentice Hall. Copyright © 2013 by Pearson Education, Inc.
Chapter 10: Improving Decision Making and Managing Knowledge 359
three-dimensional modeling on the World Wide Web that organizes multiple media types, including animation, images, and audio, to put users in a simulated real-world environ-ment. VRML is platform independent, operates over a desktop computer, and requires little bandwidth.
DuPont, the Wilmington, Delaware, chemical company, created a VRML application called HyperPlant, which enables users to access three-dimensional data over the Internet using Web browser software. Engineers can go through three-dimensional models as if they were physically walking through a plant, viewing objects at eye level. This level of detail reduces the number of mistakes they make during construction of oil rigs, oil plants, and other structures.
The financial industry is using specialized investment workstations to leverage the knowledge and time of its brokers, traders, and portfolio managers. Firms such as Merrill Lynch and UBS Financial Services have installed investment workstations that integrate a wide range of data from both internal and external sources, including contact management data, real-time and historical market data, and research reports. Previously, financial professionals had to spend considerable time accessing data from separate systems and piecing together the information they needed. By providing one-stop information faster and with fewer errors, the workstations streamline the entire investment process from stock selection to updating client records.
LEARNING TRACKS
The following Learning Tracks provide content relevant to topics covered in this chapter:
1. Building and Using Pivot Tables
2. How an Expert System Inference Engine Works
3. Challenges of Implementing and Using Knowledge Management Systems
4. Business Intelligence
Review Summary
1 What are the different types of decisions, and how does the decision-making process work? Decisions may be structured, semistructured, or unstructured, with
structured decisions clustering at the operational level of the organization and unstructured decisions at the strategic level. Decision making can be performed by individuals or groups and includes employees as well as operational, middle, and senior managers. There are four stages in decision making: intelligence, design, choice, and implementation.
2 How do business intelligence and business analytics support decision making? Business intelligence and analytics promise to deliver correct, nearly real-time
information to decision makers, and the analytic tools help them quickly understand the information and take action. A business intelligence environment consists of data from the business environment, the BI infrastructure, a BA toolset, managerial users and methods, a BI delivery platform (MIS, DSS, or ESS), and the user interface. There are six analytic functionalities that BI systems deliver to achieve these ends: pre-defined production reports, parameterized reports, dashboards and scorecards, ad hoc queries and searches, the ability to drill down to detailed views of data, and the ability to model scenarios and create forecasts.IS
BN
1-26
9-41
688-
X
Essentials of Management Information Systems, Tenth Edition, by Kenneth C. Laudon and Jane P. Laudon. Published by Prentice Hall. Copyright © 2013 by Pearson Education, Inc.
360 Part III: Key System Applications for the Digital Age
Management information systems (MIS) producing prepackaged production reports are typically used to support operational and middle management, whose decision making is fairly structured. For making unstructured decisions, analysts and “super users” employ decision-support systems (DSS) with powerful analytics and modeling tools, including spreadsheets and pivot tables. Senior executives making unstructured decisions use dashboards and visual interfaces displaying key performance information affecting the overall profitability, success, and strategy of the firm. The balanced scorecard and business performance management are two methodologies used in designing executive support systems (ESS).
3 How do information systems help people working in a group make decisions more efficiently? Group decision-support systems (GDSS) help people meeting together in a
group arrive at decisions more efficiently. GDSS feature special conference room facilities where participants contribute their ideas using networked computers and software tools for organizing ideas, gathering information, ranking and setting priorities, and documenting meeting sessions.
4 What are the business benefits of using intelligent techniques in decision making and knowledge management? Expert systems capture tacit knowledge from a limited
domain of human expertise and express that knowledge in the form of rules. The strategy to search through the knowledge base is called the inference engine. Case-based reasoning represents organizational knowledge as a database of cases that can be continually expanded and refined.
Fuzzy logic is a software technology for expressing knowledge in the form of rules that use approximate or subjective values. Neural networks consist of hardware and software that attempt to mimic the thought processes of the human brain. Neural networks are notable for their ability to learn without programming and to recognize patterns in massive amounts of data.
Genetic algorithms develop solutions to particular problems using genetically based processes, such as fitness, crossover, and mutation. Intelligent agents are software programs with built-in or learned knowledge bases that carry out specific, repetitive, and predictable tasks for an individual user, business process, or software application.
5 What types of systems are used for enterprise-wide knowledge management and knowledge work, and how do they provide value for businesses? Enterprise content
management systems feature databases and tools for organizing and storing structured documents and semistructured knowledge, such as e-mail or rich media. Knowledge network systems provide directories and tools for locating firm employees with special expertise who are important sources of tacit knowledge. Often these systems include group collabora-tion tools, portals to simplify information access, search tools, and tools for classifying information based on a taxonomy that is appropriate for the organization. Learning management systems provide tools for the management, delivery, tracking, and assessment of various types of employee learning and training.
Knowledge work systems (KWS) support the creation of new knowledge and its integration into the organization. KWS require easy access to an external knowledge base; powerful computer hardware that can support software with intensive graphics, analysis, document management, and communications capabilities; and a user-friendly interface. IS
BN
1-269-41688-X
Essentials of Management Information Systems, Tenth Edition, by Kenneth C. Laudon and Jane P. Laudon. Published by Prentice Hall. Copyright © 2013 by Pearson Education, Inc.
Chapter 10: Improving Decision Making and Managing Knowledge 361
Folksonomies, 357
Fuzzy logic, 348
Genetic algorithms, 350
Geographic information systems (GIS), 339
Group decision-support systems (GDSS), 345
Implementation, 335
Intelligence, 335
Inference engine, 346
Intelligent agents, 351
Intelligent techniques, 346
Investment workstations, 359
Key performance indicators (KPIs), 342
Knowledge base, 346
Knowledge management, 352
Knowledge network systems, 356
Knowledge work systems (KWS), 357
Learning management system (LMS), 357
Neural networks, 349
Pivot table, 341
Semistructured decisions, 334
Sensitivity analysis, 341
Social bookmarking, 357
Structured decisions, 334
Structured knowledge, 355
Tacit knowledge, 354
Unstructured decisions, 333
Virtual reality systems, 358
Virtual Reality Modeling Language (VRML), 358
Artificial intelligence (AI), 346
Augmented reality, 358
Balanced scorecard method, 342
Business performance management (BPM), 343
Case-based reasoning (CBR), 348
Choice, 335
Data visualization, 339
Design, 335
Digital asset management systems, 356
Drill down, 343
Enterprise content management systems, 355
Enterprise-wide knowledge management systems, 355
Key Terms
Review Questions
1. What are the different types of decisions and how does the decision-making process work?• List and describe the different decision-making levels and decision-making groups in
organizations, and their decision-making requirements.• Distinguish between an unstructured, semistructured, and structured decision.• List and describe the stages in decision making.
2. How do business intelligence and business analytics support decision making?• Define and describe business intelligence and business analytics.• List and describe the elements of a business intelligence environment.• List and describe the analytic functionalities provided by BI systems.• List each of the types of business intelligence users and describe the kinds of systems
that provide decision support for each type of user.• Define and describe the balanced scorecard method and business performance manage-
ment.
3. How do information systems help people working in a group make decisions more effi-ciently?• Define a group decision support system (GDSS), and explain how it works and how it
supports organizational decision making.
4. What are the business benefits of using intelligent techniques in decision making and knowledge management?• Define an expert system, describe how it works, and explain its value to business.
• Define case-based reasoning and explains how it differs from an expert system.
• Define a neural network, and describe how it works and how it benefits businesses.
• Define and describe fuzzy logic, genetic algorithms, and intelligent agents. Explain how each works and the kinds of problems for which each is suited.
ISB
N1-
269-
4168
8-X
Essentials of Management Information Systems, Tenth Edition, by Kenneth C. Laudon and Jane P. Laudon. Published by Prentice Hall. Copyright © 2013 by Pearson Education, Inc.
362 Part III: Key System Applications for the Digital Age
5. What types of systems are used for enterprise-wide knowledge management and knowl-edge work, and how do they provide value for businesses?• Define knowledge management and explain its value to businesses.
• Define and describe the various types of enterprise-wide knowledge systems and explain how they provide value for businesses.
• Define knowledge work systems and describe the generic requirements of these systems.
• Describe how the following systems support knowledge work: computer-aided design (CAD), virtual reality, and investment workstations.
Discussion Questions
1. If businesses used DSS, GDSS, and ESS more widely, would they make better deci-sions? Why or why not?
2. Describe various ways that knowledge management systems could help firms with sales and marketing or with manufacturing and production.
3. How much can business intelligence and business analytics help companies refine their business strategy? Explain your answer.
Hands-On MIS Projects
The projects in this section give you hands-on experience designing a knowledge portal, identifying opportunities for business intelligence, using a spreadsheet pivot table to analyze sales data, and using intelligent agents to research products for sale on the Web.
MANAGEMENT DECISION PROBLEMS
1. U.S. Pharma Corporation is headquartered in New Jersey but has research sites in Germany, France, the United Kingdom, Switzerland, and Australia. Research and development of new pharmaceuticals is key to ongoing profits, and U.S. Pharma researches and tests thousands of possible drugs. The company’s researchers need to share information with others within and outside the company, including the U.S. Food and Drug Administration, the World Health Organization, and the International Federation of Pharmaceutical Manufacturers & Associations. Also critical is access to health information sites, such as the U.S. National Library of Medicine and to industry conferences and professional journals. Design a knowledge portal for U.S. Pharma’s researchers. Include in your design specifications relevant internal systems and databases, external sources of information, and internal and external communication and collaboration tools. Design a home page for your portal.
2. Applebee’s is the largest casual dining chain in the world, with over 1,800 locations throughout the United States and 20 other countries. The menu features beef, chicken, and pork items, as well as burgers, pasta, and seafood. Applebee’s CEO wants to make the restaurant more profitable by developing menus that are tastier and contain more items that customers want and are willing to pay for despite rising costs for gasoline and agricultural products. How might business intelligence help management implement this strategy? What pieces of data would Applebee’s need to collect? What kinds of reports would be useful to help management make decisions on how to improve menus and profitability?
ISB
N1-269-41688-X
Essentials of Management Information Systems, Tenth Edition, by Kenneth C. Laudon and Jane P. Laudon. Published by Prentice Hall. Copyright © 2013 by Pearson Education, Inc.
Chapter 10: Improving Decision Making and Managing Knowledge 363
Video Cases
Video Cases and Instructional Videos illustrating some of the concepts in this chapter are available. Contact your instructor to access these videos.
Collaboration and Teamwork
Designing a University GDSSWith three or four of your classmates, identify several groups in your university that might benefit from a GDSS. Design a GDSS for one of those groups, describing its hardware, software, and people elements. If possible, use Google Sites to post links to Web pages, team communication announcements, and work assignments; to brainstorm; and to work collaboratively on project documents. Try to use Google Docs to develop a presentation of your findings for the class.
IMPROVING DECISION MAKING: USING PIVOT TABLES TO ANALYZE SALES DATA
Software skills: Pivot tablesBusiness skills: Analyzing sales data
This project gives you an opportunity to learn how to use Excel’s PivotTable functionality to analyze a database or data list. Use the data file for Online Management Training Inc. described earlier in the chapter. This is a list of the sales transactions at OMT for one day. You can find this spreadsheet file at MyMISLab. Use Excel’s PivotTable to help you answer the following questions:• Where are the average purchases higher? The answer might tell managers where to focus
marketing and sales resources, or pitch different messages to different regions.• What form of payment is the most common? The answer could be used to emphasize in
advertising the most preferred means of payment.• Are there any times of day when purchases are most common? Do people buy are
products while at work (likely during the day) or at home (likely in the evening)?• What’s the relationship between region, type of product purchased, and average sales
price?
We provide instructions on how to use Excel PivotTables in our Learning Tracks.
IMPROVING DECISION MAKING: USING INTELLIGENT AGENTS FOR COMPARISON SHOPPING
Software skills: Web browser and shopping bot softwareBusiness skills: Product evaluation and selection
This project will give you experience using shopping bots to search online for products, find product information, and find the best prices and vendors. Select a digital camera you might want to purchase, such as the Canon PowerShot S100 or the Olympus Stylus 7030. Visit MySimon (www.mysimon.com), BizRate.com (www.bizrate.com), and Google Product Search to do price comparisons for you. Evaluate these shopping sites in terms of their ease of use, number of offerings, speed in obtaining information, thoroughness of informa-tion offered about the product and seller, and price selection. Which site or sites would you use and why? Which camera would you select and why? How helpful were these sites for making your decision?
ISB
N1-
269-
4168
8-X
Essentials of Management Information Systems, Tenth Edition, by Kenneth C. Laudon and Jane P. Laudon. Published by Prentice Hall. Copyright © 2013 by Pearson Education, Inc.
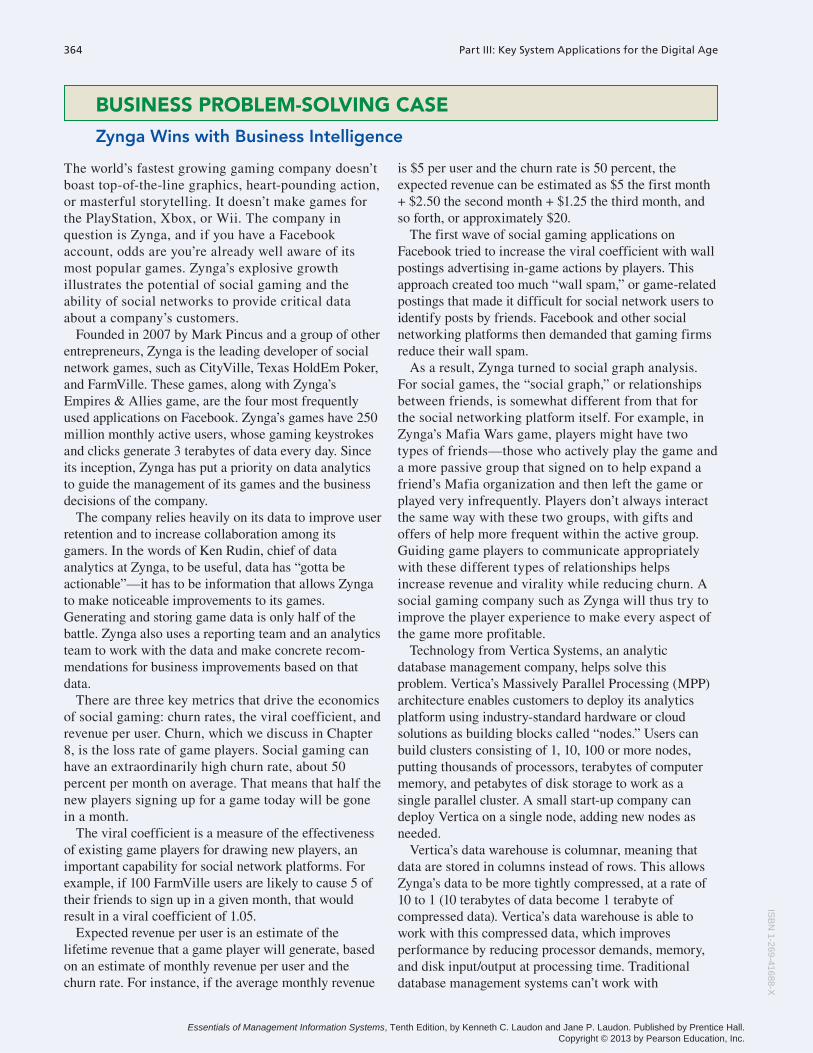
364 Part III: Key System Applications for the Digital Age
BUSINESS PROBLEM-SOLVING CASE
Zynga Wins with Business Intelligence
The world’s fastest growing gaming company doesn’t boast top-of-the-line graphics, heart-pounding action, or masterful storytelling. It doesn’t make games for the PlayStation, Xbox, or Wii. The company in question is Zynga, and if you have a Facebook account, odds are you’re already well aware of its most popular games. Zynga’s explosive growth illustrates the potential of social gaming and the ability of social networks to provide critical data about a company’s customers.
Founded in 2007 by Mark Pincus and a group of other entrepreneurs, Zynga is the leading developer of social network games, such as CityVille, Texas HoldEm Poker, and FarmVille. These games, along with Zynga’s Empires & Allies game, are the four most frequently used applications on Facebook. Zynga’s games have 250 million monthly active users, whose gaming keystrokes and clicks generate 3 terabytes of data every day. Since its inception, Zynga has put a priority on data analytics to guide the management of its games and the business decisions of the company.
The company relies heavily on its data to improve user retention and to increase collaboration among its gamers. In the words of Ken Rudin, chief of data analytics at Zynga, to be useful, data has “gotta be actionable”—it has to be information that allows Zynga to make noticeable improvements to its games. Generating and storing game data is only half of the battle. Zynga also uses a reporting team and an analytics team to work with the data and make concrete recom-mendations for business improvements based on that data.
There are three key metrics that drive the economics of social gaming: churn rates, the viral coefficient, and revenue per user. Churn, which we discuss in Chapter 8, is the loss rate of game players. Social gaming can have an extraordinarily high churn rate, about 50 percent per month on average. That means that half the new players signing up for a game today will be gone in a month.
The viral coefficient is a measure of the effectiveness of existing game players for drawing new players, an important capability for social network platforms. For example, if 100 FarmVille users are likely to cause 5 of their friends to sign up in a given month, that would result in a viral coefficient of 1.05.
Expected revenue per user is an estimate of the lifetime revenue that a game player will generate, based on an estimate of monthly revenue per user and the churn rate. For instance, if the average monthly revenue
is $5 per user and the churn rate is 50 percent, the expected revenue can be estimated as $5 the first month + $2.50 the second month + $1.25 the third month, and so forth, or approximately $20.
The first wave of social gaming applications on Facebook tried to increase the viral coefficient with wall postings advertising in-game actions by players. This approach created too much “wall spam,” or game-related postings that made it difficult for social network users to identify posts by friends. Facebook and other social networking platforms then demanded that gaming firms reduce their wall spam.
As a result, Zynga turned to social graph analysis. For social games, the “social graph,” or relationships between friends, is somewhat different from that for the social networking platform itself. For example, in Zynga’s Mafia Wars game, players might have two types of friends—those who actively play the game and a more passive group that signed on to help expand a friend’s Mafia organization and then left the game or played very infrequently. Players don’t always interact the same way with these two groups, with gifts and offers of help more frequent within the active group. Guiding game players to communicate appropriately with these different types of relationships helps increase revenue and virality while reducing churn. A social gaming company such as Zynga will thus try to improve the player experience to make every aspect of the game more profitable.
Technology from Vertica Systems, an analytic database management company, helps solve this problem. Vertica’s Massively Parallel Processing (MPP) architecture enables customers to deploy its analytics platform using industry-standard hardware or cloud solutions as building blocks called “nodes.” Users can build clusters consisting of 1, 10, 100 or more nodes, putting thousands of processors, terabytes of computer memory, and petabytes of disk storage to work as a single parallel cluster. A small start-up company can deploy Vertica on a single node, adding new nodes as needed.
Vertica’s data warehouse is columnar, meaning that data are stored in columns instead of rows. This allows Zynga’s data to be more tightly compressed, at a rate of 10 to 1 (10 terabytes of data become 1 terabyte of compressed data). Vertica’s data warehouse is able to work with this compressed data, which improves performance by reducing processor demands, memory, and disk input/output at processing time. Traditional database management systems can’t work with
364 Part III: Key System Applications for the Digital AgeIS
BN
1-269-41688-X
Essentials of Management Information Systems, Tenth Edition, by Kenneth C. Laudon and Jane P. Laudon. Published by Prentice Hall. Copyright © 2013 by Pearson Education, Inc.

Chapter 10: Improving Decision Making and Managing Knowledge 365
compressed data. As a result, Zynga achieves rates of performance that are 50 to 100 times faster than the data warehouses used by other companies.
Vertica software is also able to manipulate the database for social graph analysis, transposing all of an individual user’s interactions with other users into a single row, and it can do this quickly with database tables consisting of tens of billions of rows of data. Relational database platforms are unable to cope with the massive volume of data created by all the connections in a social graph.
Zynga’s social graph-related data are streamed in real time to a dedicated Vertica cluster where the graph is generated on a daily basis. Every night, the models resulting from this graph are fed back into its games for use the next day. With this business intelligence solution, Zynga has been able to improve the targeting of items such as gifts to effectively increase the level of interaction between active players while minimizing spam to passive players. Zynga is now in a position to identify groups of users with similar behavior or common paths for even more precise targeting of game-related promotions and activities.
Zynga’s revenue rose from $121 million in 2009 to $600 million and a $91 million dollar profit in 2010. Clearly, Zynga’s methods are working. Traditional game makers like Activision Blizzard and Electronic Arts are noting Zynga’s growth and success and have moved towards a similar business model. For example, Electronic Arts launched a free Facebook version of the classic game “The Sims.” The game now has 40 million active monthly players and was Facebook’s fastest growing app for much of 2011.
Zynga’s business model is to offer free games geared towards a larger, more casual gaming audience, and to generate revenue by selling “virtual goods” in game. The idea of virtual goods has been around for years, most notably in Second Life and other virtual worlds, where users can buy apparel and accessories for their in-game avatars. But Zynga’s attention to detail and ability to glean important information from countless terabytes of data generated daily by its users has set it apart. For example, product managers in Zynga’s FishVille Facebook game discovered that players bought a certain type of fish in game, the translucent anglerfish, more frequently than the rest. Zynga began offering fish similar to the anglerfish for about $3 apiece, and FishVille players responded by buying many more fish than usual. Analytics have also shown that Zynga’s gamers tend to buy more in-game goods when they are offered as limited-edition items. Zynga sells advertising, both in and around its games, but the vast majority of its revenue comes from its virtual goods sales.
Zynga also benefits from using Facebook as its game platform. When users install a Zynga application, they allow Zynga access to all of their profile information, including their names, genders, and lists of friends. Zynga then uses that information to determine what types of users are most likely to behave in certain ways. Zynga particularly hopes to determine which types of users are most likely to become “whales,” or big spenders that buy hundreds of dollars of virtual goods each month. Though only 5 percent of Zynga’s 150 million active users contribute to corporate revenue, that subset of users is so dedicated that they account for nearly all of the company’s earnings.
Zynga’s games make heavy use of Facebook’s social features. For example, in CityVille, users must find friends to fill fictional posts at their “City Hall” to successfully complete the structure. All of Zynga’s games have features like this, but Facebook hasn’t always fully supported all of Zynga’s efforts. Zynga’s Facebook apps were formerly able to send messages directly to Facebook members, but they disabled the feature after complaints that it was a form of spam. Still, if your friends use Zynga’s Facebook apps, chances are you’ve seen advertisements encouraging you to play as well in your News Feed.
Zynga’s success has disrupted the video game industry. Traditional video game companies begin with an idea for a game that they hope players will buy and enjoy, and then make the game. Zynga begins with a game, but then studies data to determine how its players play, what types of players are most active, and what virtual goods players buy. Then, Zynga uses the data to get players to play longer, tell more friends, and buy even more goods.
Not everybody is thrilled with Zynga’s data-driven approach to making games. Many game industry veterans believe Zynga’s games are overly simplistic and have many of the same game elements. The company has also been the target of several lawsuits alleging that Zynga copied other companies’ games. Even developers within Zynga have sometimes bristled at the company’s prioritization of data analysis over creativity in game design. Some question Zynga’s ability to prosper over the long term, saying it would be difficult for the company to create new games to replace old ones whose novelty is fading. Zynga’s busi-ness model also assumes Facebook will continue to operate in the same manner and that customers will continue to expect the same quality of games. That may not always be the case.
In other words, Zynga’s games lack artistry. But Zynga readily admits that its target audience is the segment of gamers that prefer casual games, and its goal is to make games that nearly anyone can play. Gamers that want a
ISB
N1-
269-
4168
8-X
Essentials of Management Information Systems, Tenth Edition, by Kenneth C. Laudon and Jane P. Laudon. Published by Prentice Hall. Copyright © 2013 by Pearson Education, Inc.

366 Part III: Key System Applications for the Digital Age
game requiring high levels of skill or sophisticated graphics can get their fix elsewhere. Zynga is using the measurability of Facebook activity to guide its game management, and this is helping the company create a finely tailored user experience that hasn’t been seen before in gaming. Zynga’s future is bright, but you can bet that they’ll be poring over the data to find out how to make it even brighter.
Sources: Nick Wingfield, “Virtual Products, Real Profits,” Wall Street Journal, September 9, 2011; “The Impact of Social Graphing Analysis on the Bottom
Line: How Zynga Performs Graph Analysis with the Vertica Analytics Platform,”
www.vertica.com, accessed October 1, 2011; and Jacquelyn Gavron, “Vertica: The
Analytics Behind all the Zynga Games,” ReadWrite Enterprise, July 18, 2011.
Case Study Questions 1. It has been said that Zynga is “an analytics company
masquerading as a games company.” Discuss the implications of this statement.
2. What role does business intelligence play in Zynga’s business model?
3. Give examples of three kinds of decisions supported by business intelligence at Zynga.
4. How much of a competitive advantage does business intelligence provide for Zynga? Explain.
5. What problems can business intelligence solve for Zynga? What problems can’t it solve?
ISB
N1-269-41688-X
Essentials of Management Information Systems, Tenth Edition, by Kenneth C. Laudon and Jane P. Laudon. Published by Prentice Hall. Copyright © 2013 by Pearson Education, Inc.