Embed Size (px)
Citation preview
Improving Data Quality
for Better Funding, Planning and Evidence
Based Decision Making
Maria Marin, CPA, CGA Business Advisor, CCAC, CTC &
CHC, Data Standards Unit, Health Data Branch, HSIMI,
MOHLTC
Cindy Sabo, CPA, CGA, MHA, Manager of Finance, South
East Grey CHC
Disclosure of Commercial Support
CFPC Conflict of Interest
Presenter Disclosure
Presenters: Maria Marin and Cindy Sabo
Relationships with commercial interests:
• Grants/Research Support: None
• Speakers Bureau/Honoraria: None
• Consulting Fees: None
• Other: None
Session Key Objectives
Understand the importance of reporting high-quality,
timely, accurate and consistent data
Understand how the Trial Balance submission data is
used
Understand how to analyze and improve your data
quality
3
AGENDA
• Section 1 –Background
• Section 2 - Key Statistical Reporting Requirements for
CHC sector
• Section 3 - Observations from the 2014/15 Q3 Trial
Balance Submission
• Section 4 - OHRS Resources
• Section 5 - CHC Comparative Reports 2014/15 Q3
• Section 6 – Questions
4
5
Background
Section 1
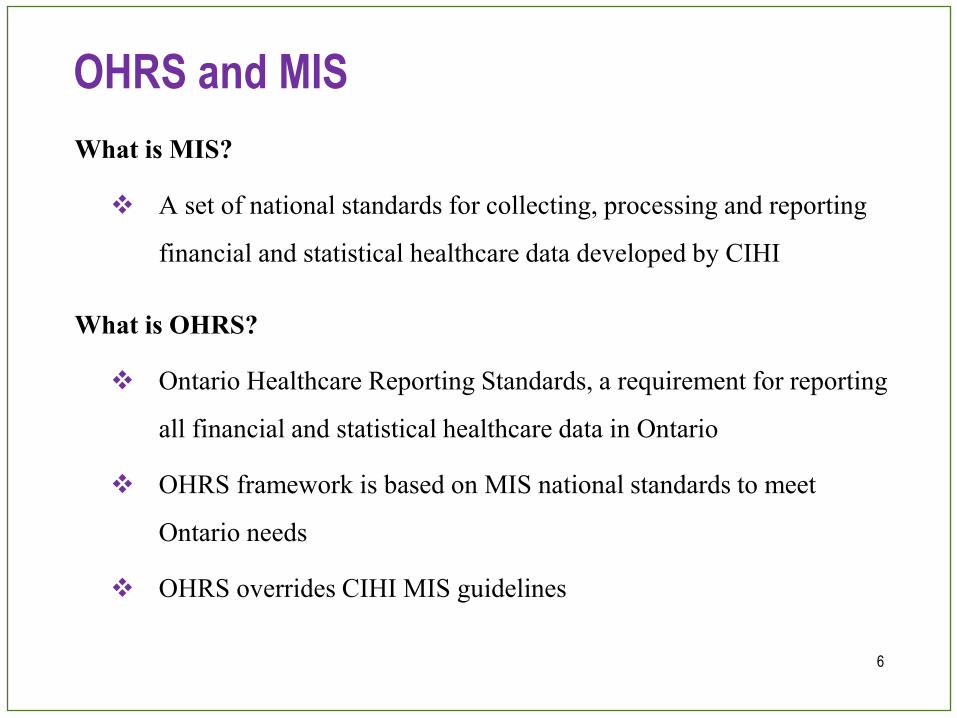
OHRS and MIS
What is MIS?
A set of national standards for collecting, processing and reporting
financial and statistical healthcare data developed by CIHI
What is OHRS?
Ontario Healthcare Reporting Standards, a requirement for reporting
all financial and statistical healthcare data in Ontario
OHRS framework is based on MIS national standards to meet
Ontario needs
OHRS overrides CIHI MIS guidelines
6
Benefits of Ontario Healthcare Reporting Standards (OHRS)
The availability of quality, standardized data across all healthcare sectors enables:
Evidence-based decision making
Equitable allocation of health care resources across and within healthcare sectors
Analysis and comparison of data across CHCs and other healthcare sectors
Development of benchmarks and performance indicators
Effective planning, analysis and resource allocation
Integrated reporting
7
Why is Health Data Important?
Health data is the backbone for:
• Funding
• Planning
• Decision making
• Utilization
• Trend analysis
• Resource allocation
Who Uses the Information?
Canadian Institute for Health Information (CIHI)
CIHI is a national organization whose mission is to coordinate the
development and maintenance of a comprehensive and integrated health
information system for Canada, and to provide and coordinate accurate and
timely information required to:
Establish sound health policy
Effectively manage the Canadian health system
Generate public awareness about factors affecting good health
Canadian provinces and jurisdictions submit their healthcare MIS financial and
statistical information to CIHI for inclusion in the Canadian MIS Database
(CMDB).
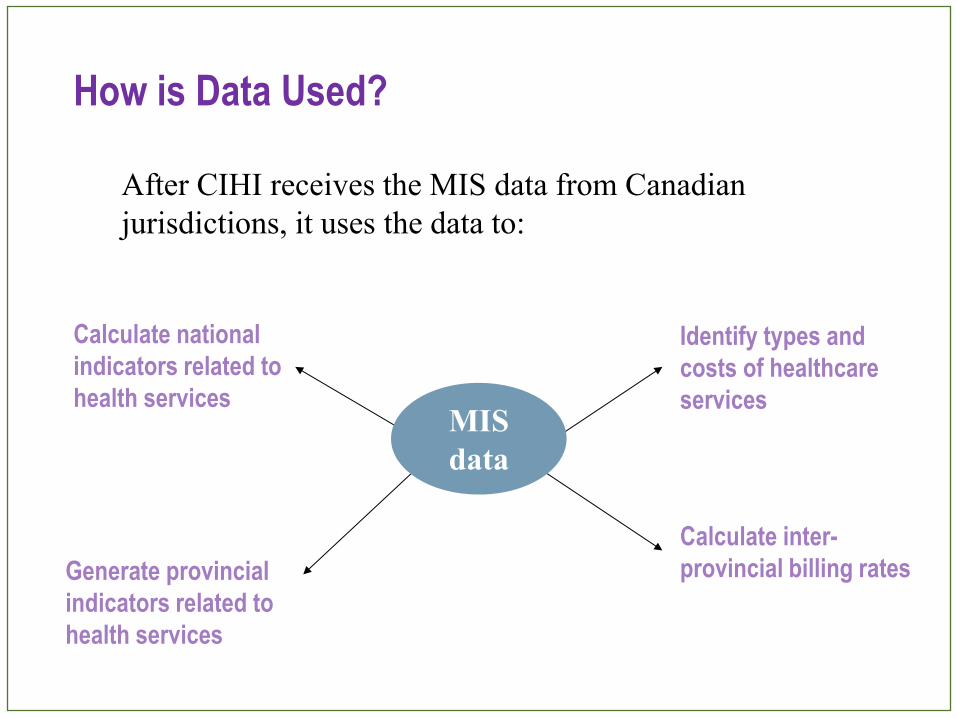
How is Data Used?
After CIHI receives the MIS data from Canadian
jurisdictions, it uses the data to:
Calculate national
indicators related to
health services
Generate provincial
indicators related to
health services
Identify types and
costs of healthcare
services
Calculate inter-
provincial billing rates
MIS
data
Ministry of Health and Long Term Care, LHINs and
Health Service Provider Organizations
Reports and tools created based on the data in the OHFS database assist the
health service provider organizations, Local Health Integration Networks
(LHINs), and the funding ministries in the review and planning of resources
The data is used for :
• Analysis, comparison and decision making processes
Data in OHFS can be used to :
• Generate reports and assist other resource outputs, such as:
• Online reports (e.g. data quality reports and/or comparative reports)
• Decision support tools (e.g. Healthcare Indicator Tool)
Many healthcare decisions can also be made based on OHRS
data:
• Staffing requirements
• Education and skill mix
• How to effectively meet defined client needs
• How to use the most efficient processes
• Identify the cost of service delivery
• How to maximize service delivery within fiscal restraints
• How to balance the costs of service delivery
How is Data Used Internally?
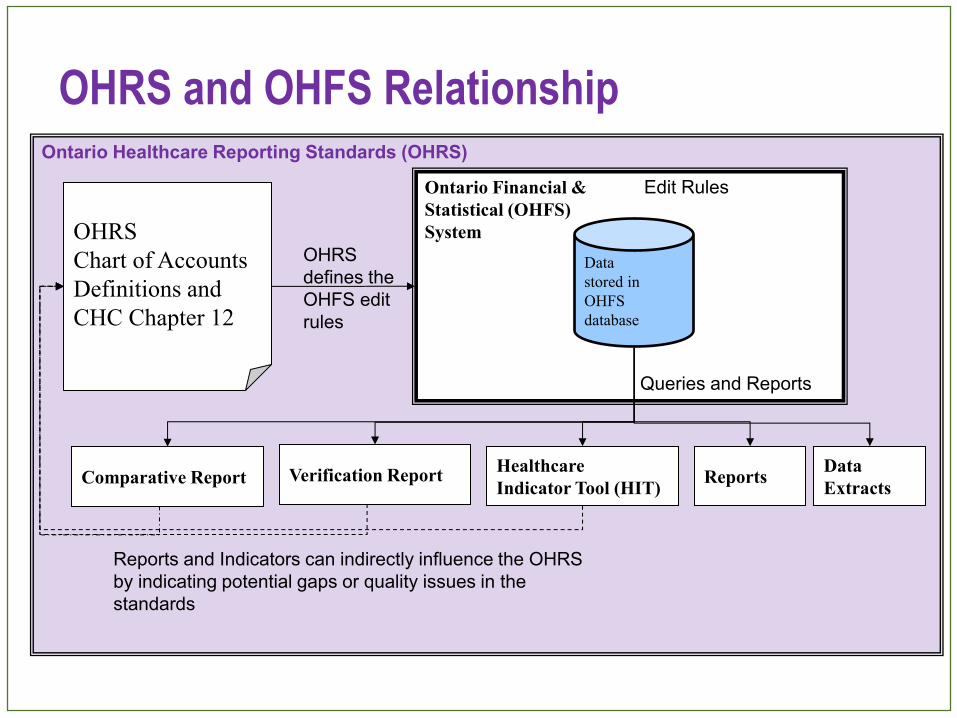
Ontario Healthcare Reporting Standards (OHRS)
OHRS and OHFS Relationship
OHRS
Chart of Accounts
Definitions and
CHC Chapter 12
Ontario Financial &
Statistical (OHFS)
System
Data
stored in
OHFS
database
Queries and Reports
Edit Rules
Healthcare
Indicator Tool (HIT) Reports Verification Report
Data
Extracts
OHRS
defines the
OHFS edit
rules
Comparative Report
Reports and Indicators can indirectly influence the OHRS
by indicating potential gaps or quality issues in the
standards
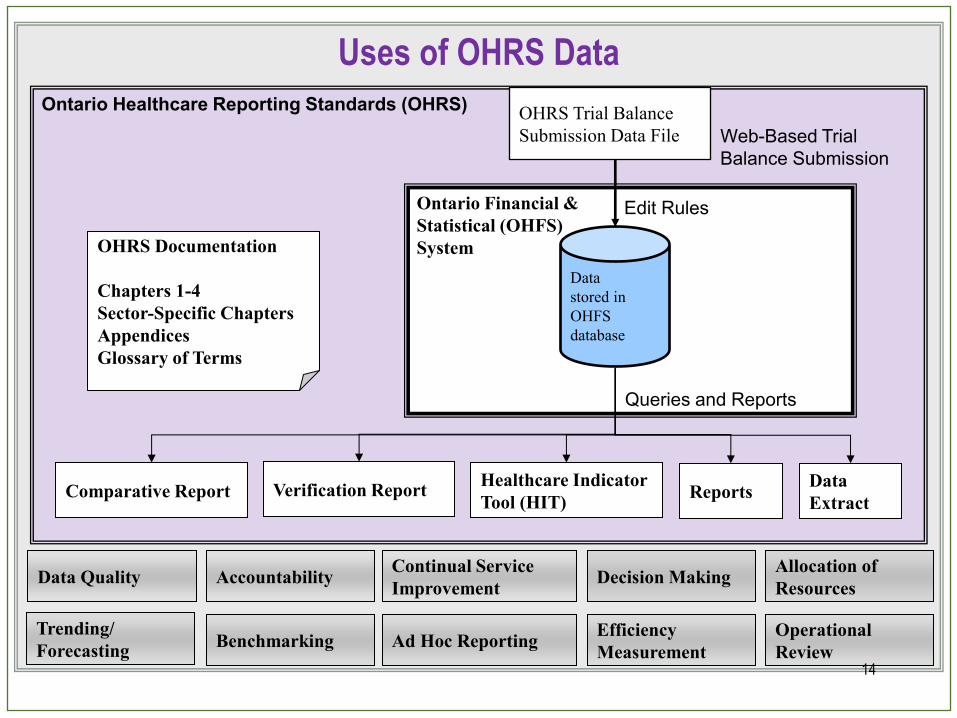
Uses of OHRS Data
Accountability Allocation of
Resources
Benchmarking Efficiency
Measurement Ad Hoc Reporting
Data Quality Decision Making
Operational
Review
Continual Service
Improvement
Ontario Healthcare Reporting Standards (OHRS)
OHRS Documentation
Chapters 1-4
Sector-Specific Chapters
Appendices
Glossary of Terms
Ontario Financial &
Statistical (OHFS)
System
Data
stored in
OHFS
database
Web-Based Trial
Balance Submission
Queries and Reports
Edit Rules
Healthcare Indicator
Tool (HIT) Reports Verification Report
Data
Extract
OHRS Trial Balance
Submission Data File
Comparative Report
Trending/
Forecasting 14
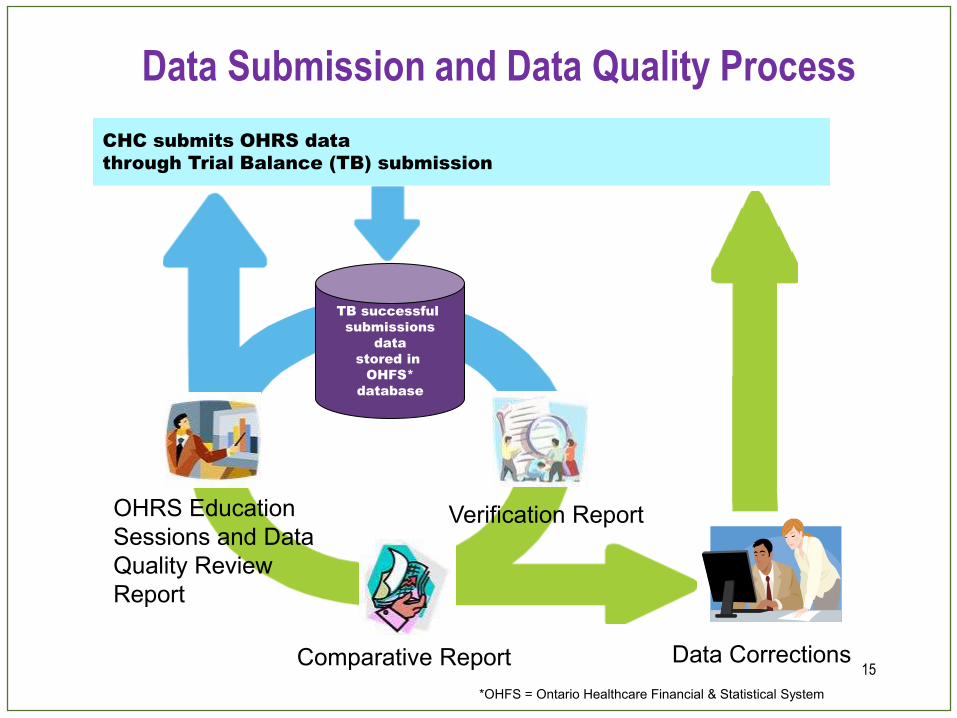
Data Submission and Data Quality Process
*OHFS = Ontario Healthcare Financial & Statistical System
Data Corrections
TB successful
submissions
data
stored in
OHFS*
database
Verification Report
Comparative Report
OHRS Education
Sessions and Data
Quality Review
Report
CHC submits OHRS data
through Trial Balance (TB) submission
15
16
Key Statistical Reporting Requirements for
CHC sector
Section 2
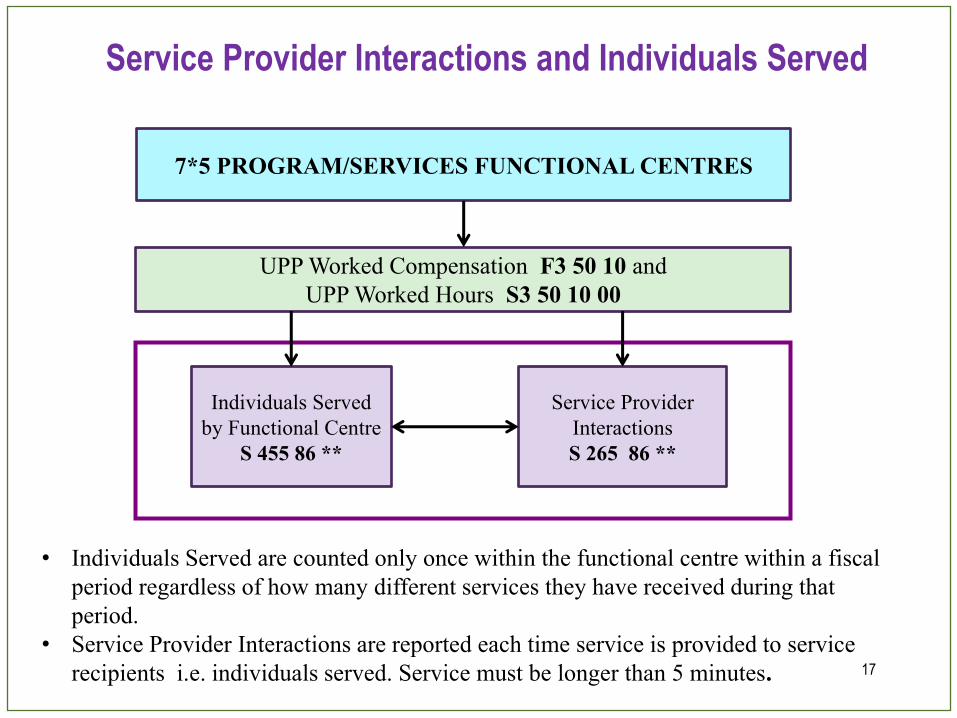
Service Provider Interactions and Individuals Served
7*5 PROGRAM/SERVICES FUNCTIONAL CENTRES
UPP Worked Compensation F3 50 10 and
UPP Worked Hours S3 50 10 00
Individuals Served
by Functional Centre
S 455 86 **
Service Provider
Interactions
S 265 86 **
• Individuals Served are counted only once within the functional centre within a fiscal
period regardless of how many different services they have received during that
period.
• Service Provider Interactions are reported each time service is provided to service
recipients i.e. individuals served. Service must be longer than 5 minutes. 17
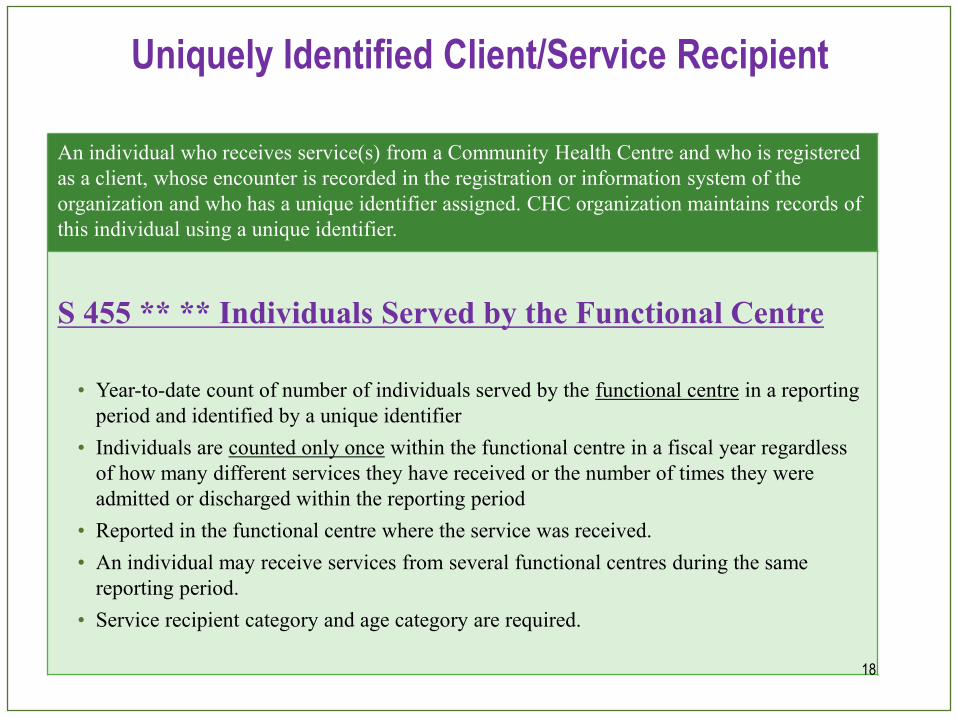
Uniquely Identified Client/Service Recipient
An individual who receives service(s) from a Community Health Centre and who is registered
as a client, whose encounter is recorded in the registration or information system of the
organization and who has a unique identifier assigned. CHC organization maintains records of
this individual using a unique identifier.
S 455 ** ** Individuals Served by the Functional Centre
• Year-to-date count of number of individuals served by the functional centre in a reporting
period and identified by a unique identifier
• Individuals are counted only once within the functional centre in a fiscal year regardless
of how many different services they have received or the number of times they were
admitted or discharged within the reporting period
• Reported in the functional centre where the service was received.
• An individual may receive services from several functional centres during the same
reporting period.
• Service recipient category and age category are required.
18
19
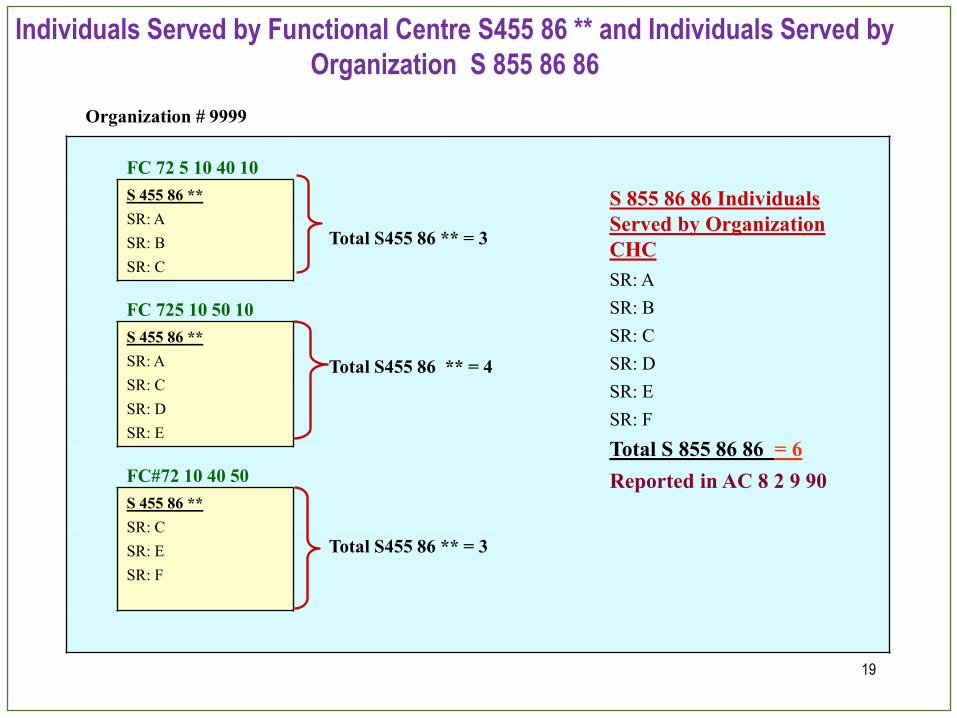
Individuals Served by Functional Centre S455 86 ** and Individuals Served by
Organization S 855 86 86
FC 72 5 10 40 10
S 455 86 **
SR: A
SR: B
SR: C
S 855 86 86 Individuals
Served by Organization
CHC
SR: A
SR: B
SR: C
SR: D
SR: E
SR: F
Total S 855 86 86 = 6
Reported in AC 8 2 9 90
Total S455 86 ** = 3
FC 725 10 50 10
S 455 86 **
SR: A
SR: C
SR: D
SR: E
Total S455 86 ** = 4
FC#72 10 40 50
S 455 86 **
SR: C
SR: E
SR: F
Total S455 86 ** = 3
Organization # 9999
20
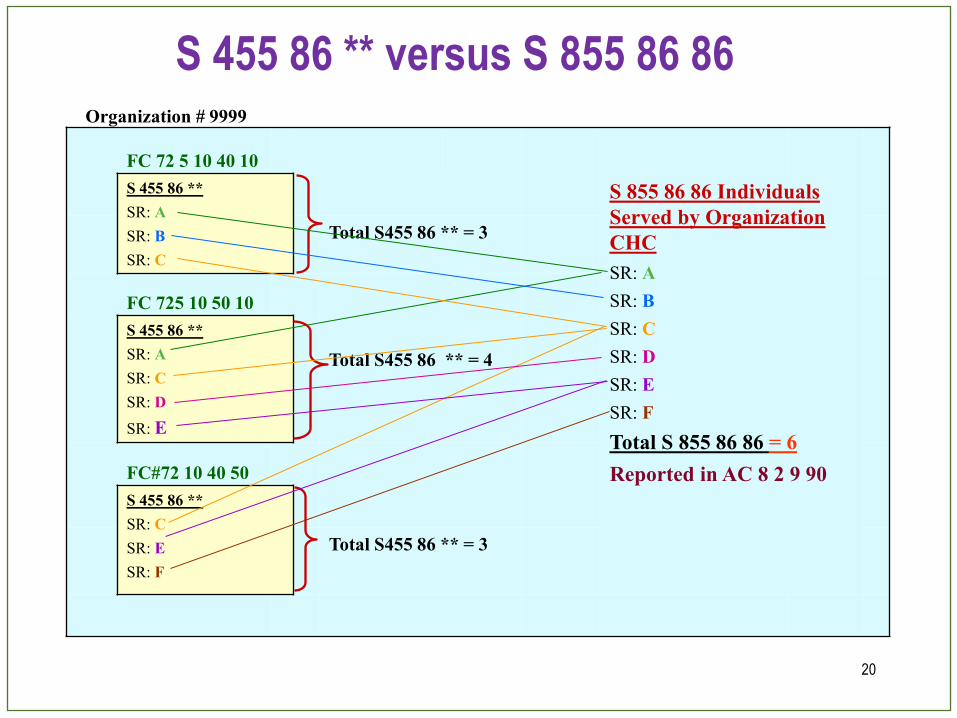
S 455 86 ** versus S 855 86 86
FC 72 5 10 40 10
S 455 86 **
SR: A
SR: B
SR: C
S 855 86 86 Individuals
Served by Organization
CHC
SR: A
SR: B
SR: C
SR: D
SR: E
SR: F
Total S 855 86 86 = 6
Reported in AC 8 2 9 90
Total S455 86 ** = 3
FC 725 10 50 10
S 455 86 **
SR: A
SR: C
SR: D
SR: E
Total S455 86 ** = 4
FC#72 10 40 50
S 455 86 **
SR: C
SR: E
SR: F
Total S455 86 ** = 3
Organization # 9999
21
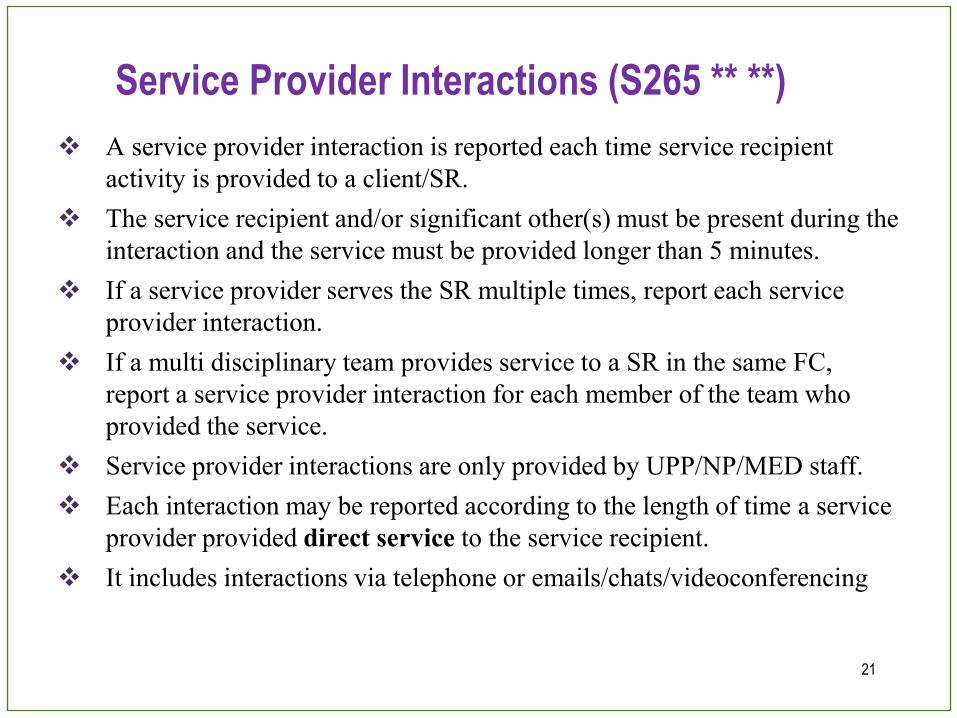
Service Provider Interactions (S265 ** **)
A service provider interaction is reported each time service recipient
activity is provided to a client/SR.
The service recipient and/or significant other(s) must be present during the
interaction and the service must be provided longer than 5 minutes.
If a service provider serves the SR multiple times, report each service
provider interaction.
If a multi disciplinary team provides service to a SR in the same FC,
report a service provider interaction for each member of the team who
provided the service.
Service provider interactions are only provided by UPP/NP/MED staff.
Each interaction may be reported according to the length of time a service
provider provided direct service to the service recipient.
It includes interactions via telephone or emails/chats/videoconferencing
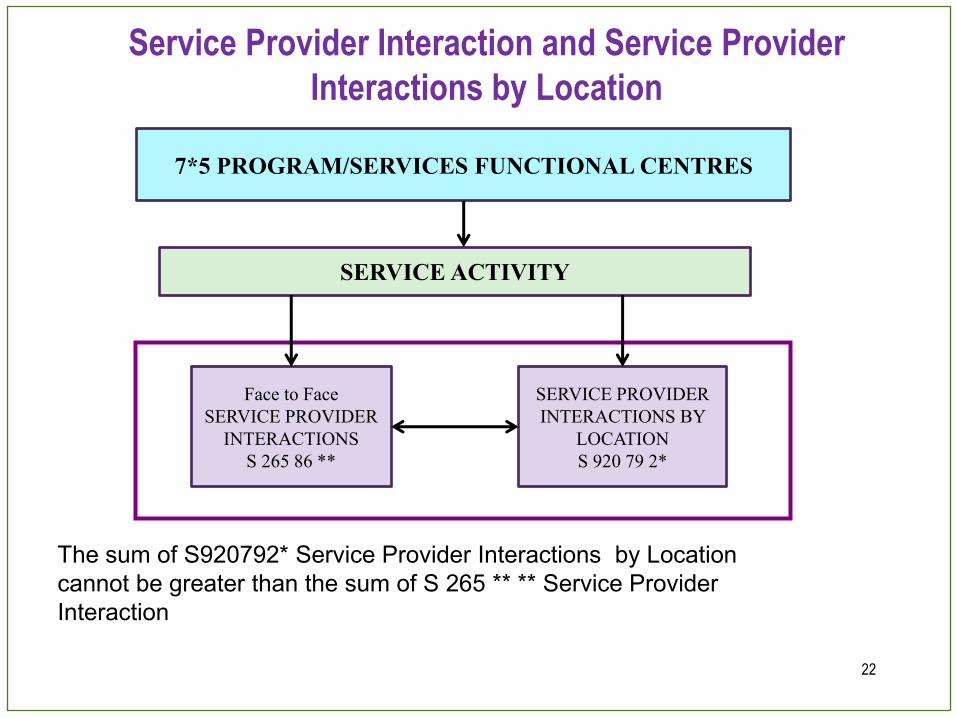
Service Provider Interaction and Service Provider
Interactions by Location
The sum of S920792* Service Provider Interactions by Location
cannot be greater than the sum of S 265 ** ** Service Provider
Interaction
7*5 PROGRAM/SERVICES FUNCTIONAL CENTRES
SERVICE ACTIVITY
Face to Face
SERVICE PROVIDER
INTERACTIONS
S 265 86 **
SERVICE PROVIDER
INTERACTIONS BY
LOCATION
S 920 79 2*
22
23
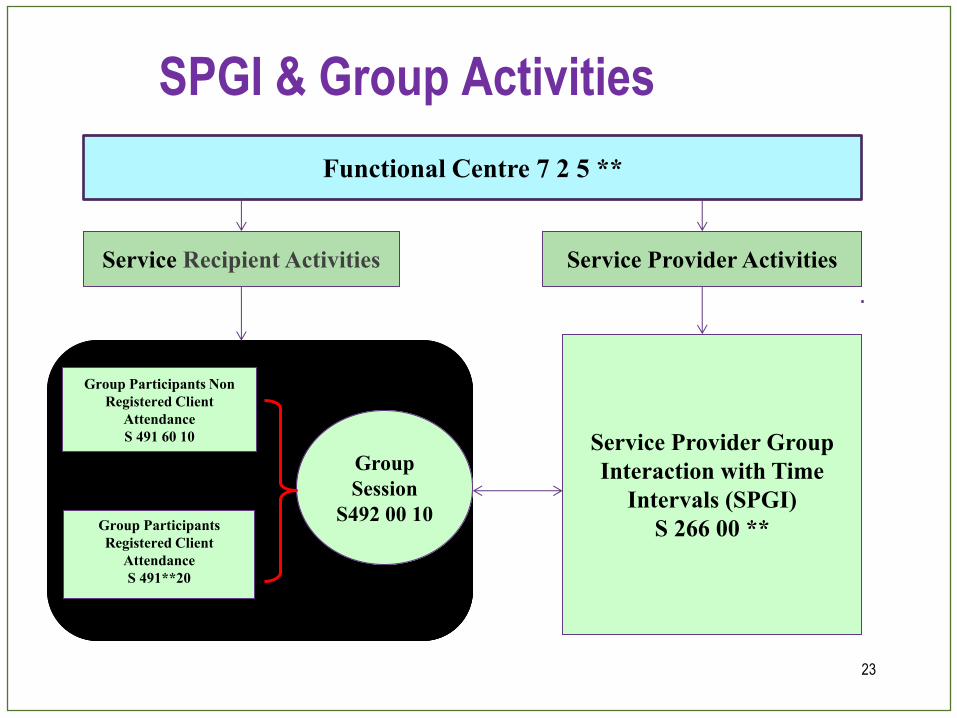
SPGI & Group Activities
Functional Centre 7 2 5 **
Service Recipient Activities Service Recipient Activities Service Provider Activities Service Provider Activities
Group Participants Non
Registered Client
Attendance
S 491 60 10
Group Participants Non
Registered Client
Attendance
S 491 60 10
Group Participants
Registered Client
Attendance
S 491**20
Group Participants
Registered Client
Attendance
S 491**20
Group
Session
S492 00 10
Group
Session
S492 00 10
Service Provider Group
Interaction with Time
Intervals (SPGI)
S 266 00 **
Service Provider Group
Interaction with Time
Intervals (SPGI)
S 266 00 **
24
Observations from the 2014/15 Q3
Trial Balance Submission
Section 3
Our Analysis is based on…
2014/2015 Q3 OHRS/MIS Trial Balance submission
Functional Centre 7 2 510 20 COM Clinic/Program
General Clinic
Fund Type 2 only
74 CHCs successfully passed the submission
73 CHCs submitted under 72 5 10 20 Clinic/Program
General Clinic functional centre
25
Most Common Errors
Reporting Individuals Served without reporting Service
Provider Interactions
Reporting Group Sessions without reporting Group
Participants Attendances and vice versa
Reporting Group Sessions and Group Participants
Attendances without reporting Service Provider Group
Interactions
Reporting Individuals Served by functional centre without
reporting Individuals Served by the organization
26
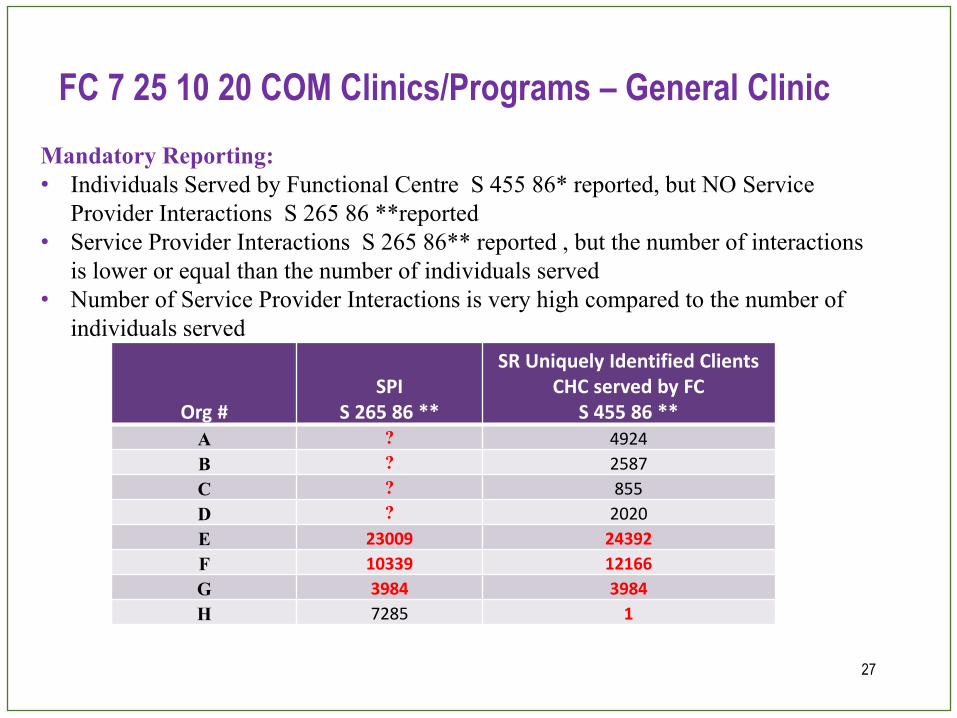
FC 7 25 10 20 COM Clinics/Programs – General Clinic
Org # SPI
S 265 86 **
SR Uniquely Identified Clients CHC served by FC
S 455 86 **
A ? 4924
B ? 2587
C ? 855
D ? 2020
E 23009 24392
F 10339 12166
G 3984 3984
H 7285 1
Mandatory Reporting:
• Individuals Served by Functional Centre S 455 86* reported, but NO Service
Provider Interactions S 265 86 **reported
• Service Provider Interactions S 265 86** reported , but the number of interactions
is lower or equal than the number of individuals served
• Number of Service Provider Interactions is very high compared to the number of
individuals served
27
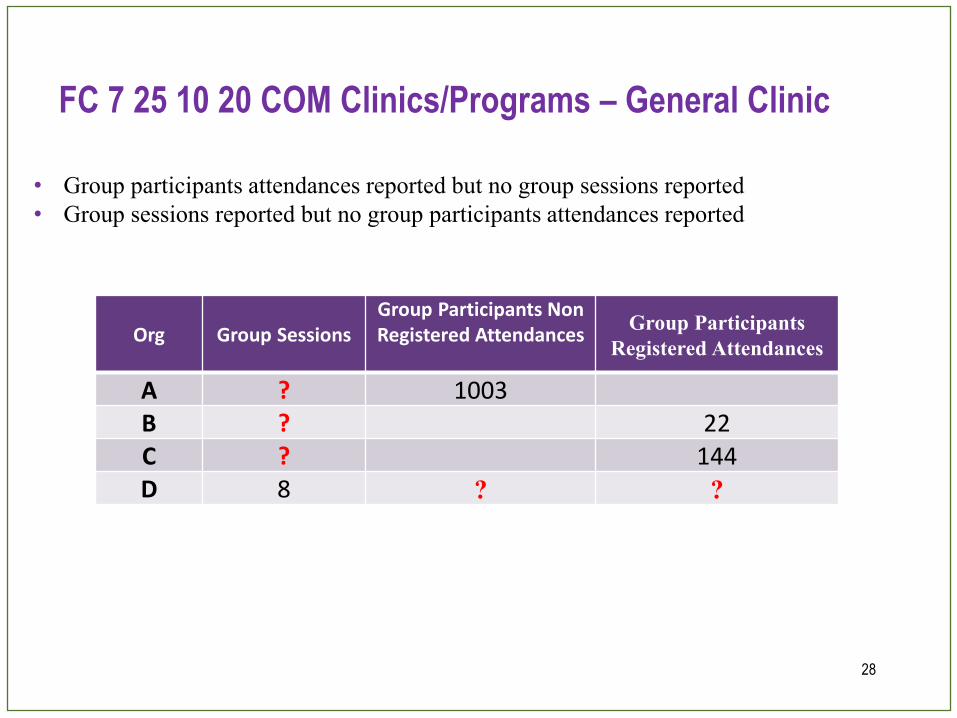
FC 7 25 10 20 COM Clinics/Programs – General Clinic
Org Group Sessions Group Participants Non Registered Attendances
Group Participants
Registered Attendances
A ? 1003 B ? 22 C ? 144 D 8 ? ?
• Group participants attendances reported but no group sessions reported
• Group sessions reported but no group participants attendances reported
28
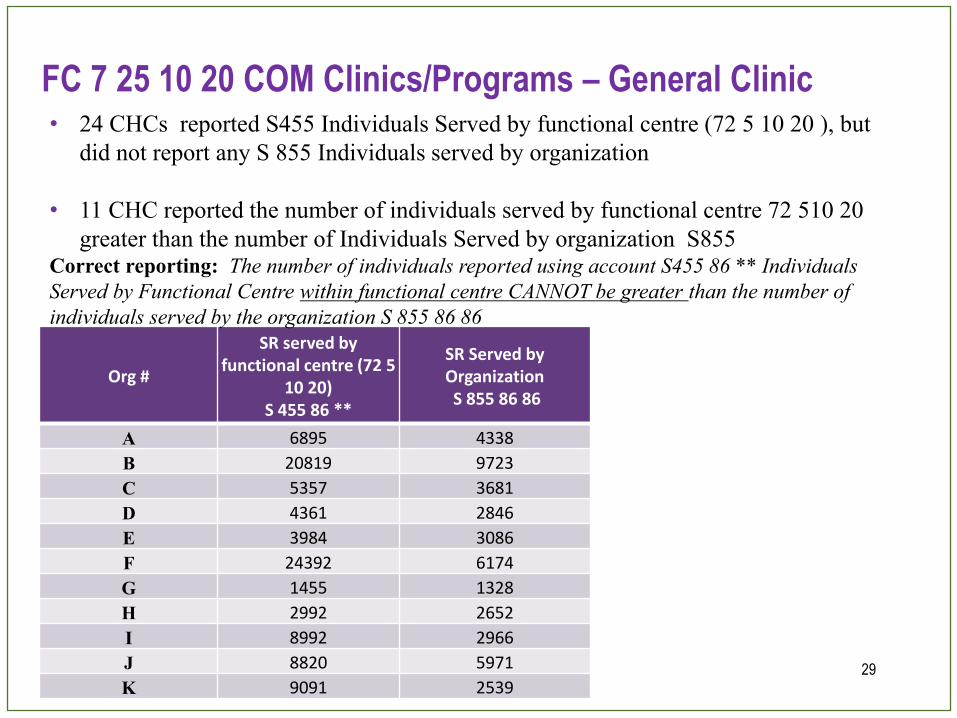
FC 7 25 10 20 COM Clinics/Programs – General Clinic
Org #
SR served by functional centre (72 5
10 20) S 455 86 **
SR Served by Organization S 855 86 86
A 6895 4338
B 20819 9723
C 5357 3681
D 4361 2846
E 3984 3086
F 24392 6174
G 1455 1328
H 2992 2652
I 8992 2966
J 8820 5971
K 9091 2539
• 24 CHCs reported S455 Individuals Served by functional centre (72 5 10 20 ), but
did not report any S 855 Individuals served by organization
• 11 CHC reported the number of individuals served by functional centre 72 510 20
greater than the number of Individuals Served by organization S855 Correct reporting: The number of individuals reported using account S455 86 ** Individuals
Served by Functional Centre within functional centre CANNOT be greater than the number of
individuals served by the organization S 855 86 86
29
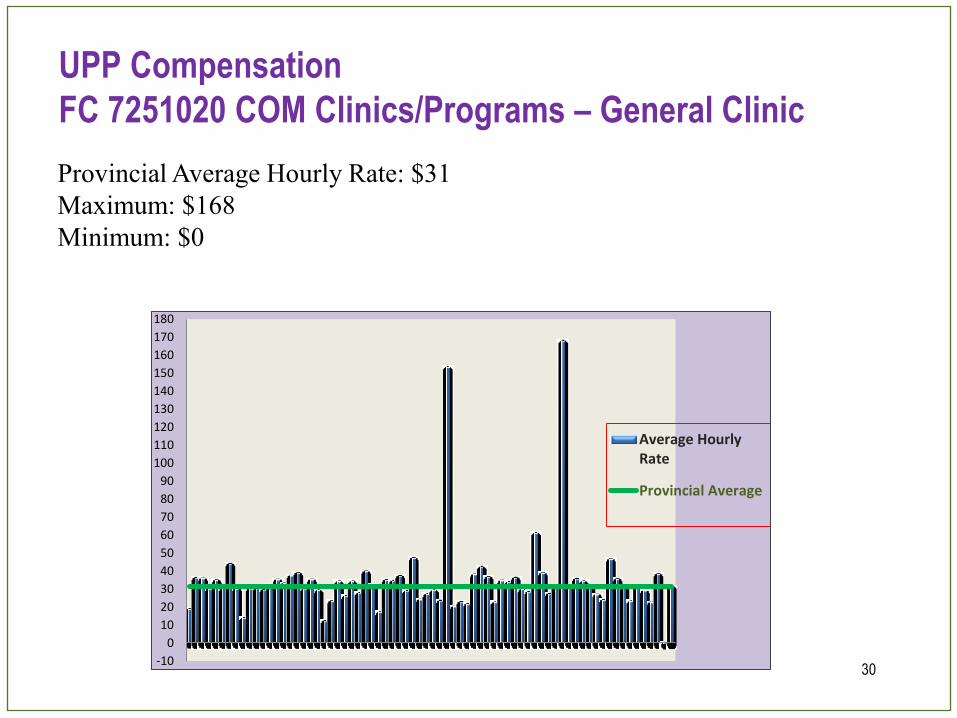
UPP Compensation
FC 7251020 COM Clinics/Programs – General Clinic
Provincial Average Hourly Rate: $31
Maximum: $168
Minimum: $0
-10
0
10
20
30
40
50
60
70
80
90
100
110
120
130
140
150
160
170
180
Average HourlyRate
Provincial Average
30
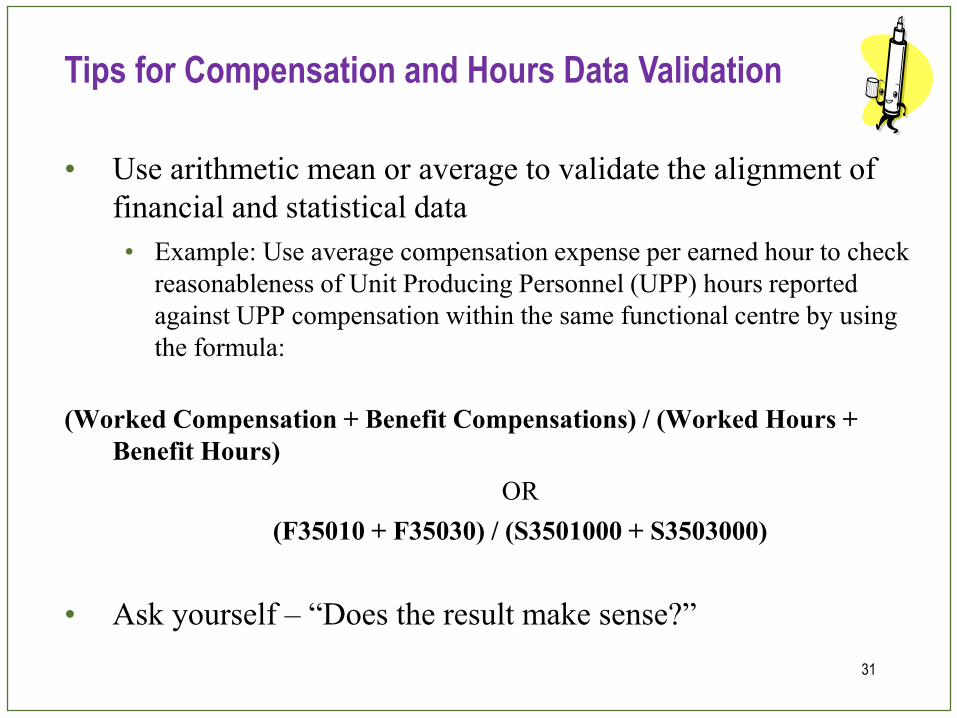
• Use arithmetic mean or average to validate the alignment of
financial and statistical data
• Example: Use average compensation expense per earned hour to check
reasonableness of Unit Producing Personnel (UPP) hours reported
against UPP compensation within the same functional centre by using
the formula:
(Worked Compensation + Benefit Compensations) / (Worked Hours +
Benefit Hours)
OR
(F35010 + F35030) / (S3501000 + S3503000)
• Ask yourself – “Does the result make sense?”
Tips for Compensation and Hours Data Validation
31
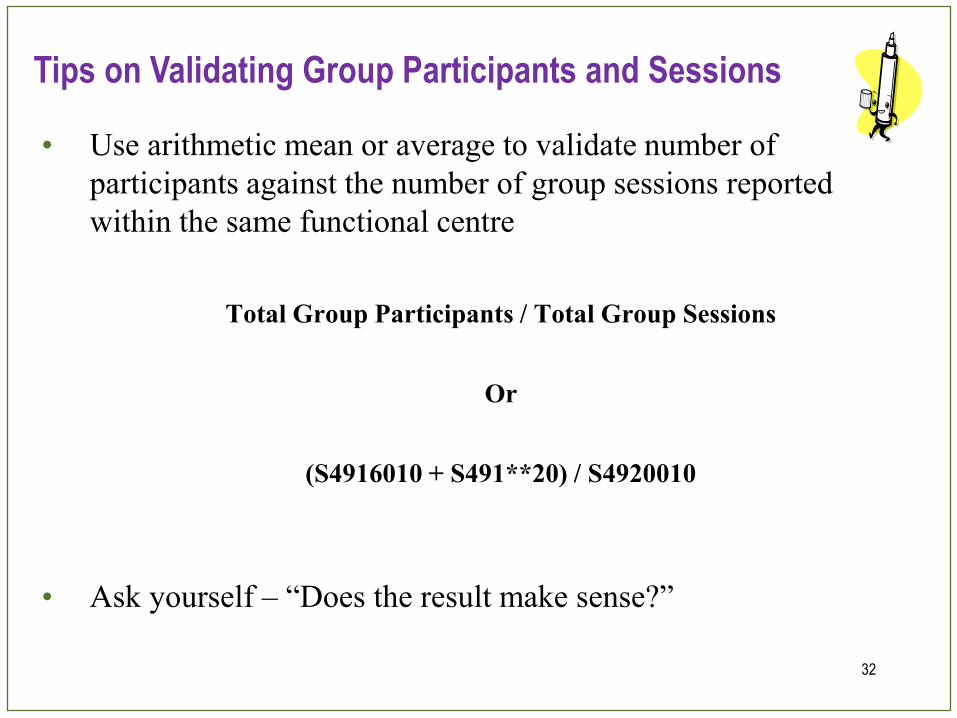
• Use arithmetic mean or average to validate number of
participants against the number of group sessions reported
within the same functional centre
Total Group Participants / Total Group Sessions
Or
(S4916010 + S491**20) / S4920010
• Ask yourself – “Does the result make sense?”
Tips on Validating Group Participants and Sessions
32
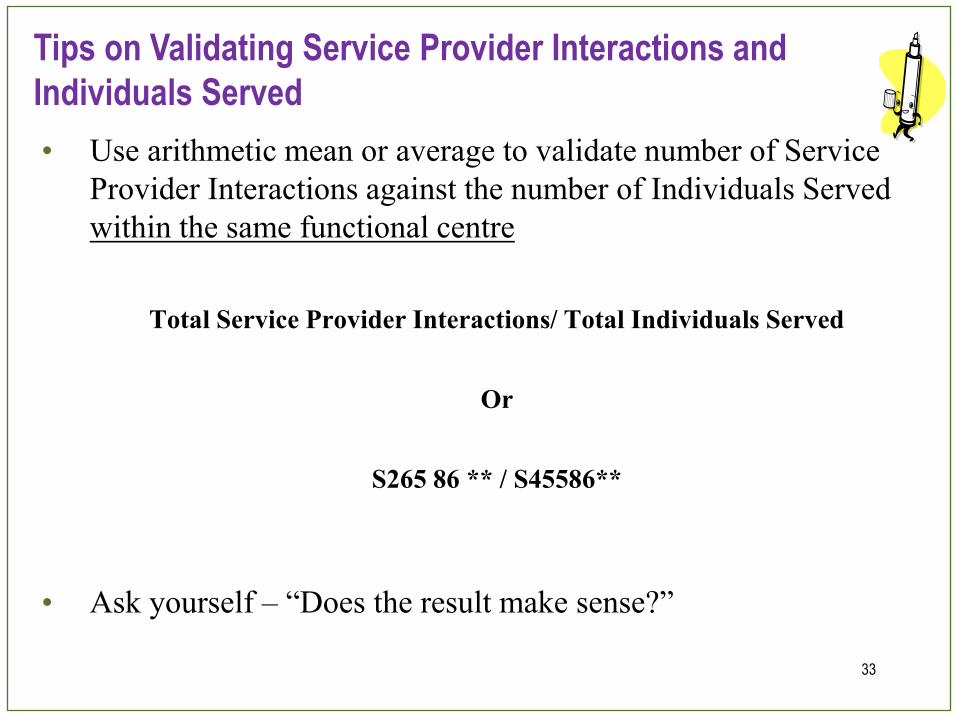
• Use arithmetic mean or average to validate number of Service
Provider Interactions against the number of Individuals Served
within the same functional centre
Total Service Provider Interactions/ Total Individuals Served
Or
S265 86 ** / S45586**
• Ask yourself – “Does the result make sense?”
Tips on Validating Service Provider Interactions and
Individuals Served
33
Improving Data Quality – Checklist
Before your Trial Balance submission:
Ensure the proper CHC-specific functional centres are used
Report all mandatory statistics as per OHRS Chapter 12 and CHC reference card
Follow the reporting rules to submit financial data at the proper level of detail
Report statistics using the proper service recipient codes and age categories
Ensure the valid combination and account numbers are used
Review the Verification Report after you receive the green happy face
34

35
OHRS Resources
Section 4
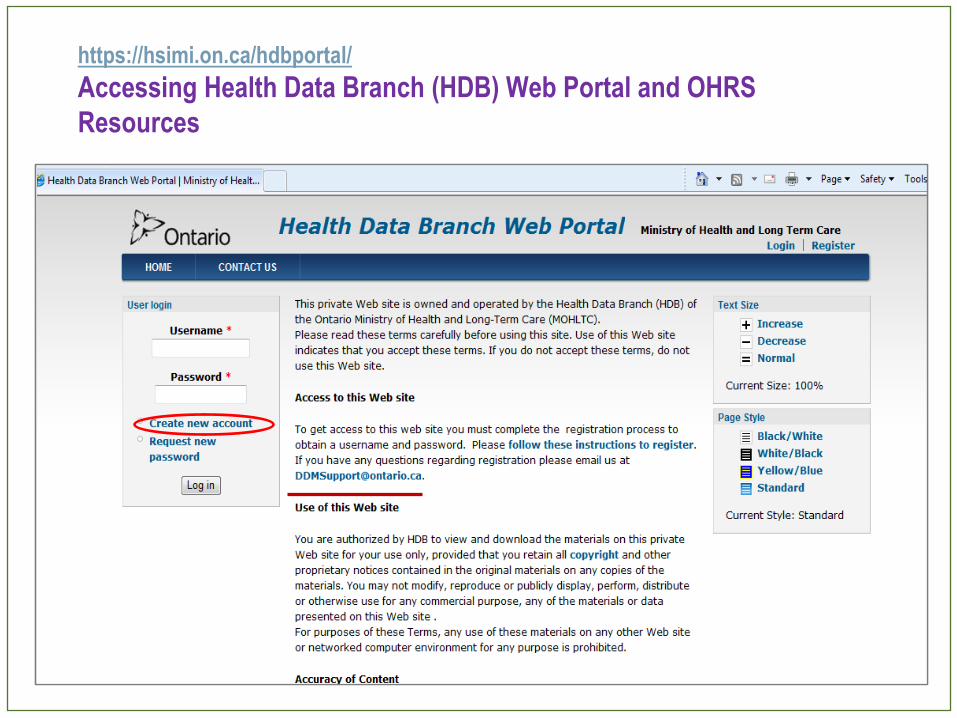
https://hsimi.on.ca/hdbportal/
Accessing Health Data Branch (HDB) Web Portal and OHRS
Resources
36
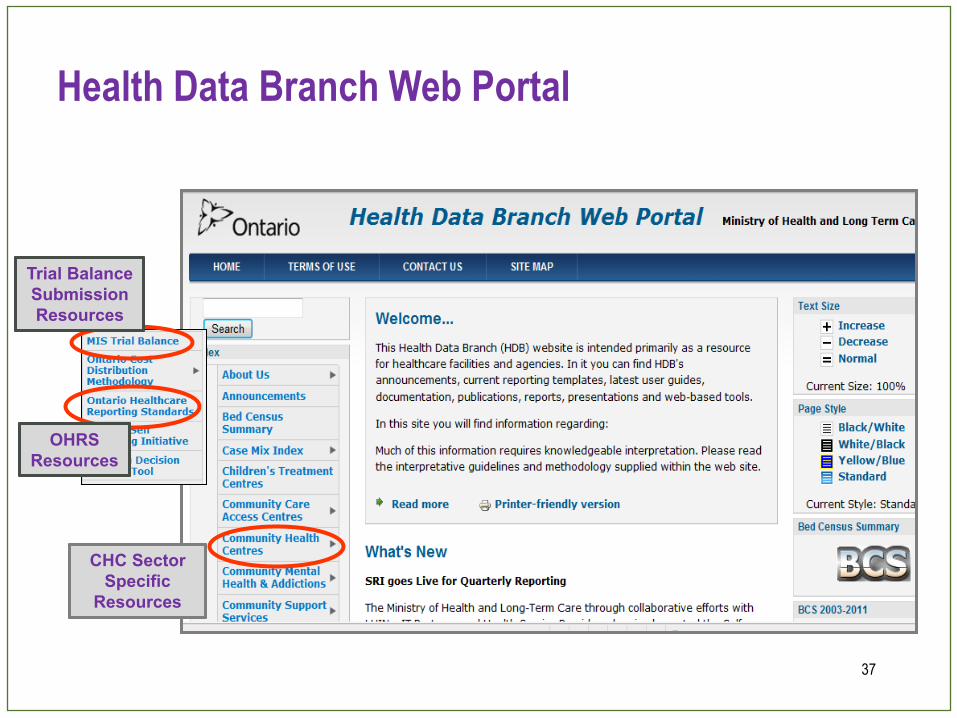
Health Data Branch Web Portal
37
CHC Sector
Specific
Resources
CHC Sector
Specific
Resources
OHRS
Resources
OHRS
Resources
Trial Balance
Submission
Resources
Trial Balance
Submission
Resources
38
Applies
to all
sectors
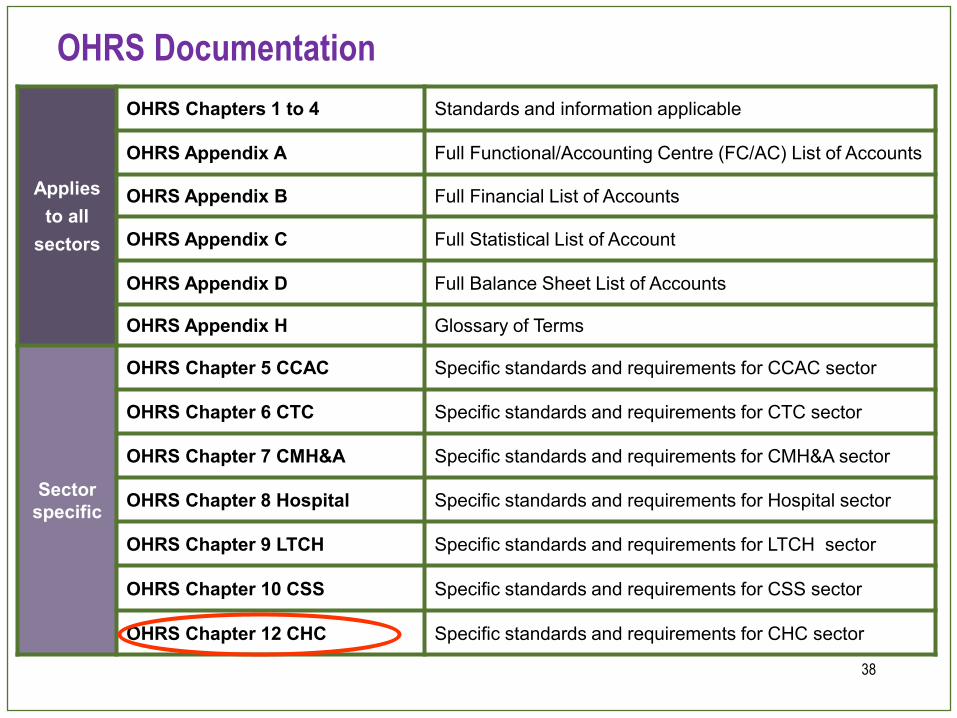
OHRS Chapters 1 to 4 Standards and information applicable
OHRS Appendix A Full Functional/Accounting Centre (FC/AC) List of Accounts
OHRS Appendix B Full Financial List of Accounts
OHRS Appendix C Full Statistical List of Account
OHRS Appendix D Full Balance Sheet List of Accounts
OHRS Appendix H Glossary of Terms
Sector
specific
OHRS Chapter 5 CCAC Specific standards and requirements for CCAC sector
OHRS Chapter 6 CTC Specific standards and requirements for CTC sector
OHRS Chapter 7 CMH&A Specific standards and requirements for CMH&A sector
OHRS Chapter 8 Hospital Specific standards and requirements for Hospital sector
OHRS Chapter 9 LTCH Specific standards and requirements for LTCH sector
OHRS Chapter 10 CSS Specific standards and requirements for CSS sector
OHRS Chapter 12 CHC Specific standards and requirements for CHC sector
OHRS Documentation
39
CHC Comparative Reports
2014/15 Q3 Trial Balance Submission
Section 5
40
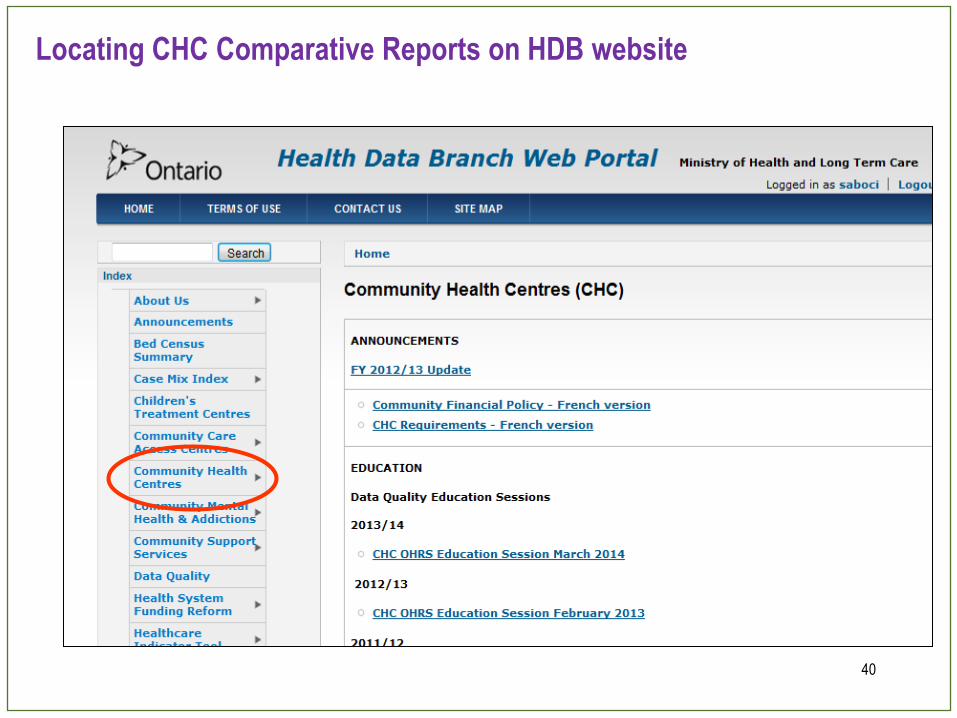
Locating CHC Comparative Reports on HDB website
41
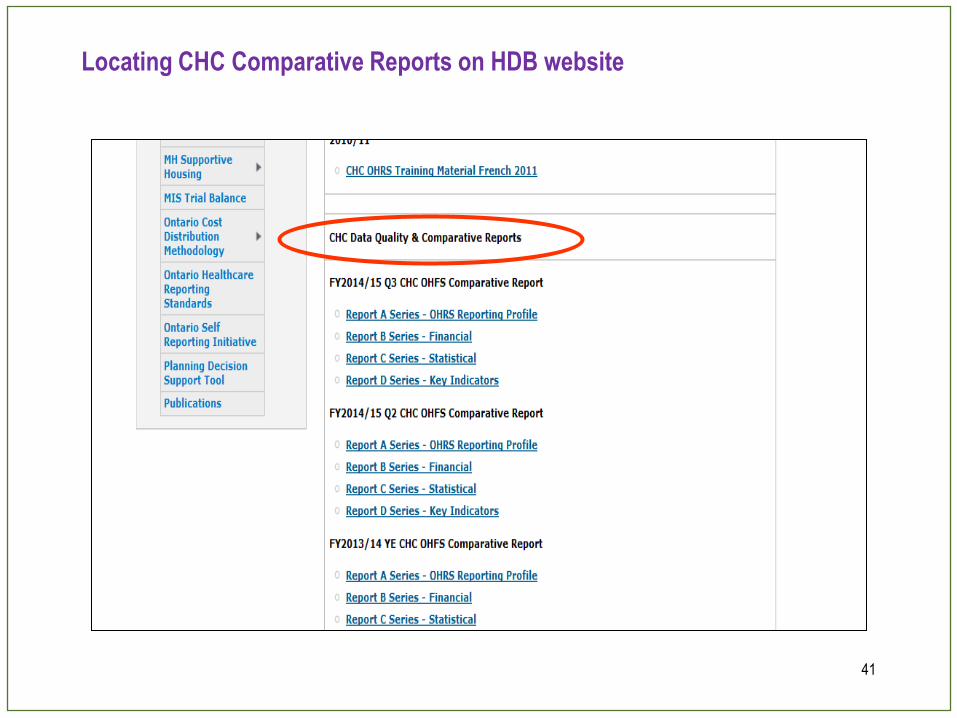
Locating CHC Comparative Reports on HDB website
42
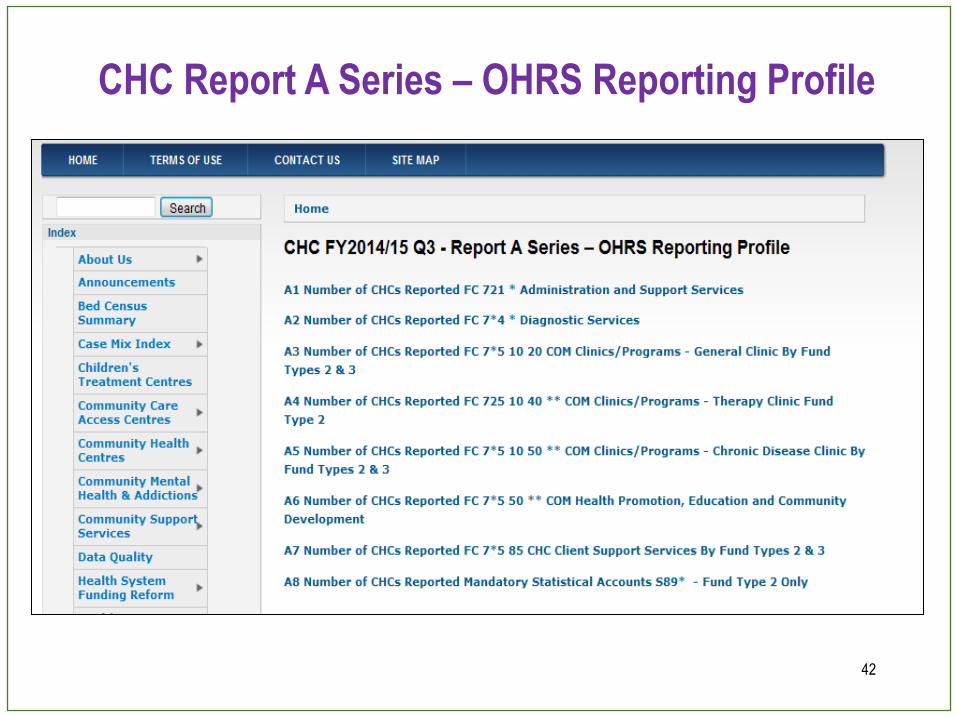
CHC Report A Series – OHRS Reporting Profile
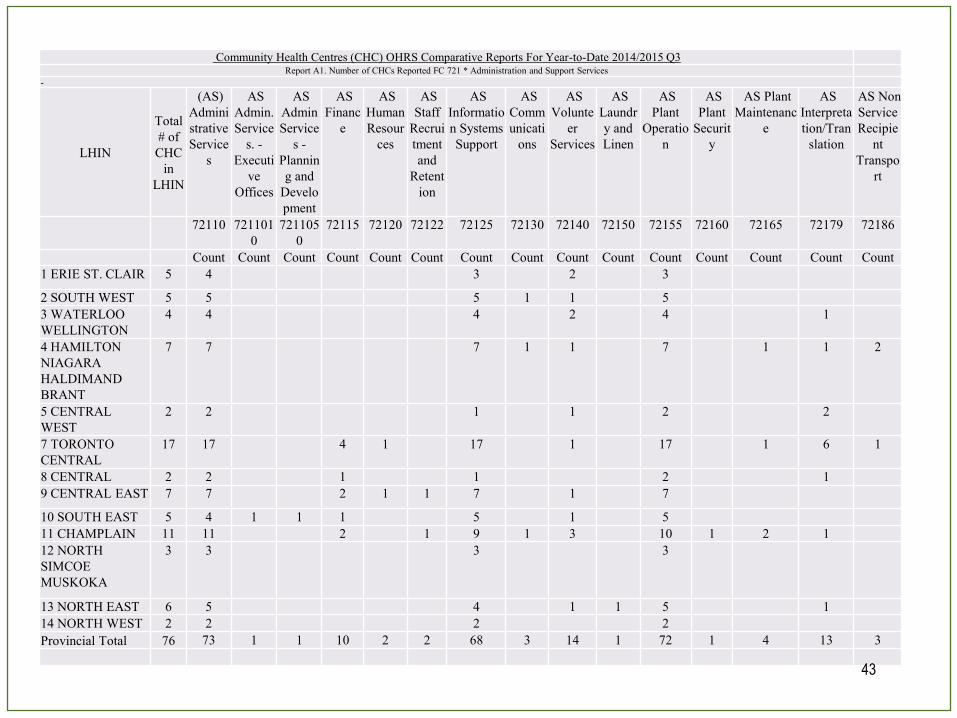
Community Health Centres (CHC) OHRS Comparative Reports For Year-to-Date 2014/2015 Q3 Report A1. Number of CHCs Reported FC 721 * Administration and Support Services
-
LHIN
Total
# of
CHC
in
LHIN
(AS)
Admini
strative
Service
s
AS
Admin.
Service
s. -
Executi
ve
Offices
AS
Admin
Service
s -
Plannin
g and
Develo
pment
AS
Financ
e
AS
Human
Resour
ces
AS
Staff
Recrui
tment
and
Retent
ion
AS
Informatio
n Systems
Support
AS
Comm
unicati
ons
AS
Volunte
er
Services
AS
Laundr
y and
Linen
AS
Plant
Operatio
n
AS
Plant
Securit
y
AS Plant
Maintenanc
e
AS
Interpreta
tion/Tran
slation
AS Non
Service
Recipie
nt
Transpo
rt
72110 721101
0
721105
0
72115 72120 72122 72125 72130 72140 72150 72155 72160 72165 72179 72186
Count Count Count Count Count Count Count Count Count Count Count Count Count Count Count 1 ERIE ST. CLAIR 5 4 3 2 3
2 SOUTH WEST 5 5 5 1 1 5 3 WATERLOO
WELLINGTON
4 4 4 2 4 1
4 HAMILTON
NIAGARA
HALDIMAND
BRANT
7 7 7 1 1 7 1 1 2
5 CENTRAL
WEST
2 2 1 1 2 2
7 TORONTO
CENTRAL
17 17 4 1 17 1 17 1 6 1
8 CENTRAL 2 2 1 1 2 1 9 CENTRAL EAST 7 7 2 1 1 7 1 7
10 SOUTH EAST 5 4 1 1 1 5 1 5 11 CHAMPLAIN 11 11 2 1 9 1 3 10 1 2 1 12 NORTH
SIMCOE
MUSKOKA
3 3 3 3
13 NORTH EAST 6 5 4 1 1 5 1 14 NORTH WEST 2 2 2 2 Provincial Total 76 73 1 1 10 2 2 68 3 14 1 72 1 4 13 3
43
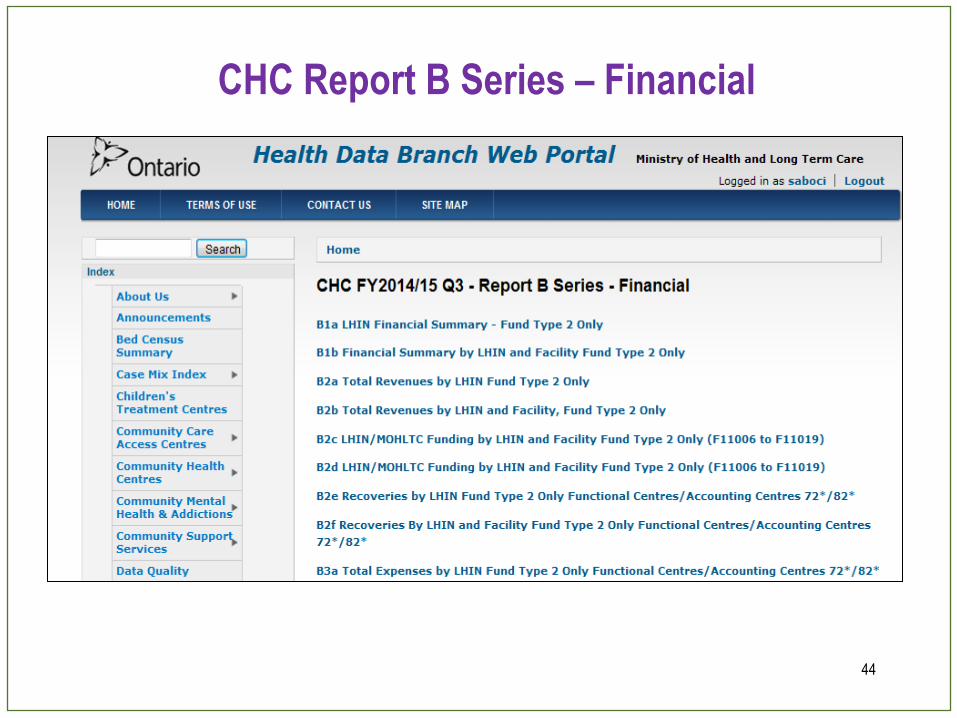
44
CHC Report B Series – Financial
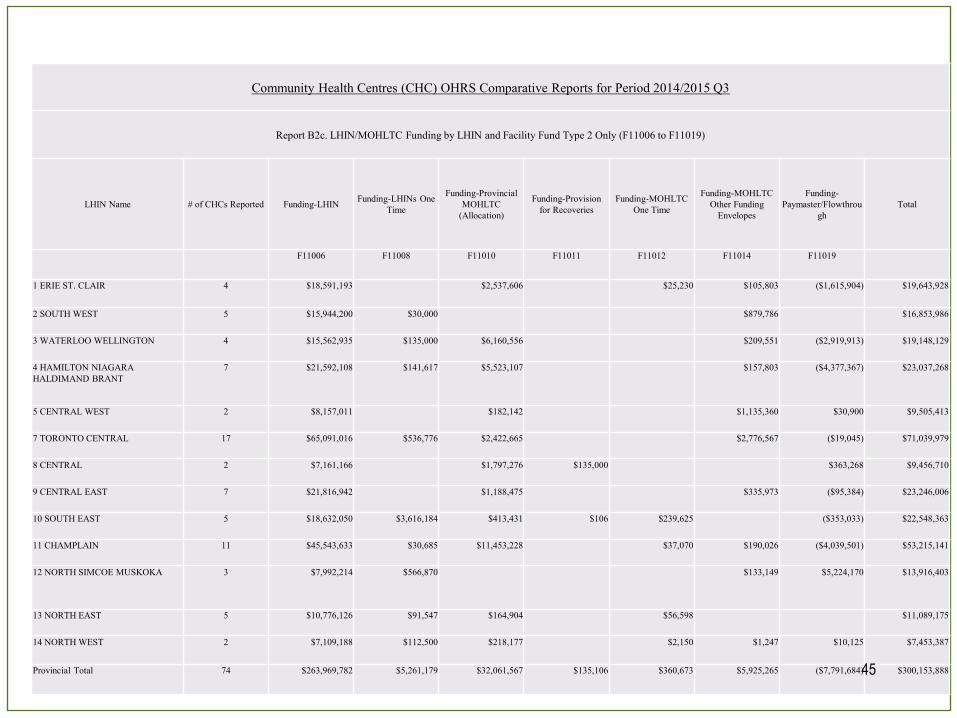
Community Health Centres (CHC) OHRS Comparative Reports for Period 2014/2015 Q3
Report B2c. LHIN/MOHLTC Funding by LHIN and Facility Fund Type 2 Only (F11006 to F11019)
LHIN Name # of CHCs Reported Funding-LHIN Funding-LHINs One
Time
Funding-Provincial
MOHLTC
(Allocation)
Funding-Provision
for Recoveries
Funding-MOHLTC
One Time
Funding-MOHLTC
Other Funding
Envelopes
Funding-
Paymaster/Flowthrou
gh
Total
F11006 F11008 F11010 F11011 F11012 F11014 F11019
1 ERIE ST. CLAIR 4 $18,591,193 $2,537,606 $25,230 $105,803 ($1,615,904) $19,643,928
2 SOUTH WEST 5 $15,944,200 $30,000 $879,786 $16,853,986
3 WATERLOO WELLINGTON 4 $15,562,935 $135,000 $6,160,556 $209,551 ($2,919,913) $19,148,129
4 HAMILTON NIAGARA
HALDIMAND BRANT
7 $21,592,108 $141,617 $5,523,107 $157,803 ($4,377,367) $23,037,268
5 CENTRAL WEST 2 $8,157,011 $182,142 $1,135,360 $30,900 $9,505,413
7 TORONTO CENTRAL 17 $65,091,016 $536,776 $2,422,665 $2,776,567 ($19,045) $71,039,979
8 CENTRAL 2 $7,161,166 $1,797,276 $135,000 $363,268 $9,456,710
9 CENTRAL EAST 7 $21,816,942 $1,188,475 $335,973 ($95,384) $23,246,006
10 SOUTH EAST 5 $18,632,050 $3,616,184 $413,431 $106 $239,625 ($353,033) $22,548,363
11 CHAMPLAIN 11 $45,543,633 $30,685 $11,453,228 $37,070 $190,026 ($4,039,501) $53,215,141
12 NORTH SIMCOE MUSKOKA 3 $7,992,214 $566,870 $133,149 $5,224,170 $13,916,403
13 NORTH EAST 5 $10,776,126 $91,547 $164,904 $56,598 $11,089,175
14 NORTH WEST 2 $7,109,188 $112,500 $218,177 $2,150 $1,247 $10,125 $7,453,387
Provincial Total 74 $263,969,782 $5,261,179 $32,061,567 $135,106 $360,673 $5,925,265 ($7,791,684) $300,153,888 45
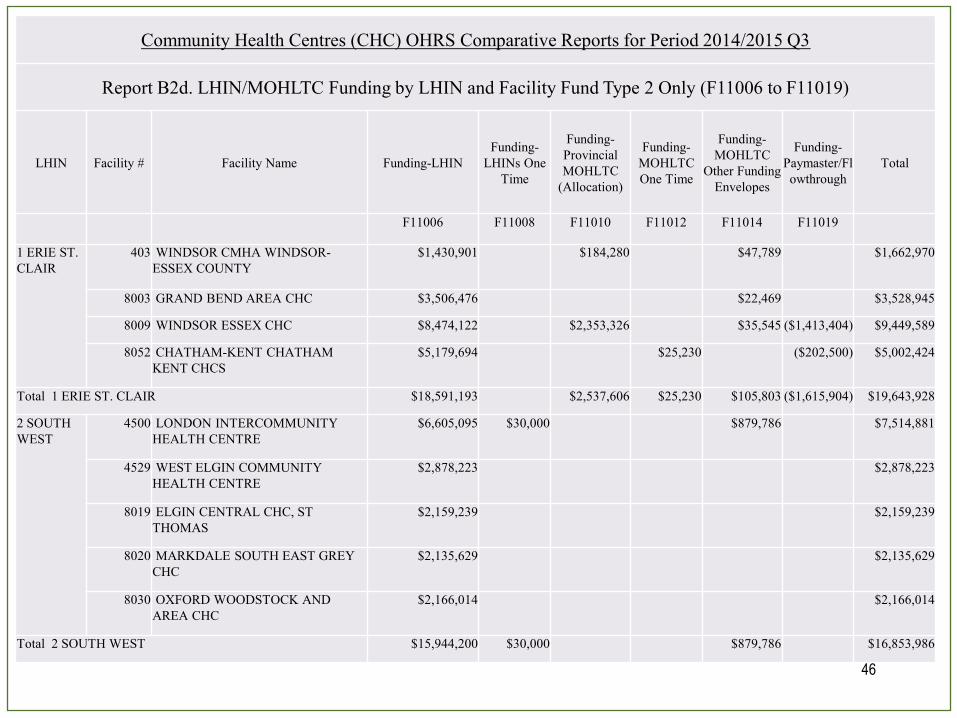
Community Health Centres (CHC) OHRS Comparative Reports for Period 2014/2015 Q3
Report B2d. LHIN/MOHLTC Funding by LHIN and Facility Fund Type 2 Only (F11006 to F11019)
LHIN Facility # Facility Name Funding-LHIN
Funding-
LHINs One
Time
Funding-
Provincial
MOHLTC
(Allocation)
Funding-
MOHLTC
One Time
Funding-
MOHLTC
Other Funding
Envelopes
Funding-
Paymaster/Fl
owthrough
Total
F11006 F11008 F11010 F11012 F11014 F11019
1 ERIE ST.
CLAIR
403 WINDSOR CMHA WINDSOR-
ESSEX COUNTY
$1,430,901 $184,280 $47,789 $1,662,970
8003 GRAND BEND AREA CHC $3,506,476 $22,469 $3,528,945
8009 WINDSOR ESSEX CHC $8,474,122 $2,353,326 $35,545 ($1,413,404) $9,449,589
8052 CHATHAM-KENT CHATHAM
KENT CHCS
$5,179,694 $25,230 ($202,500) $5,002,424
Total 1 ERIE ST. CLAIR $18,591,193 $2,537,606 $25,230 $105,803 ($1,615,904) $19,643,928
2 SOUTH
WEST
4500 LONDON INTERCOMMUNITY
HEALTH CENTRE
$6,605,095 $30,000 $879,786 $7,514,881
4529 WEST ELGIN COMMUNITY
HEALTH CENTRE
$2,878,223 $2,878,223
8019 ELGIN CENTRAL CHC, ST
THOMAS
$2,159,239 $2,159,239
8020 MARKDALE SOUTH EAST GREY
CHC
$2,135,629 $2,135,629
8030 OXFORD WOODSTOCK AND
AREA CHC
$2,166,014 $2,166,014
Total 2 SOUTH WEST $15,944,200 $30,000 $879,786 $16,853,986
46
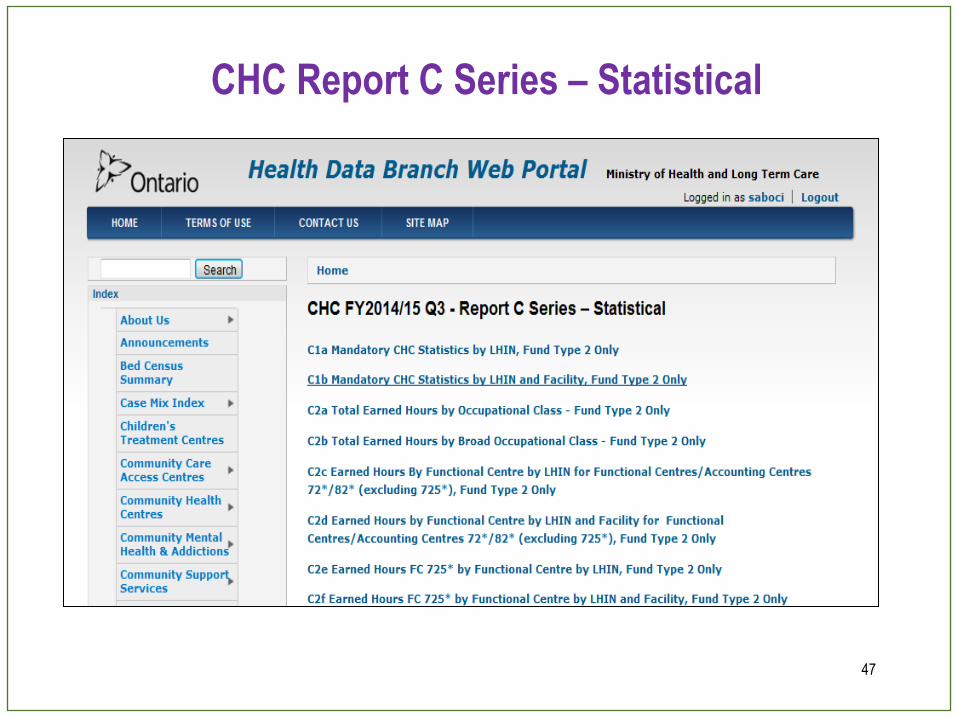
47
CHC Report C Series – Statistical
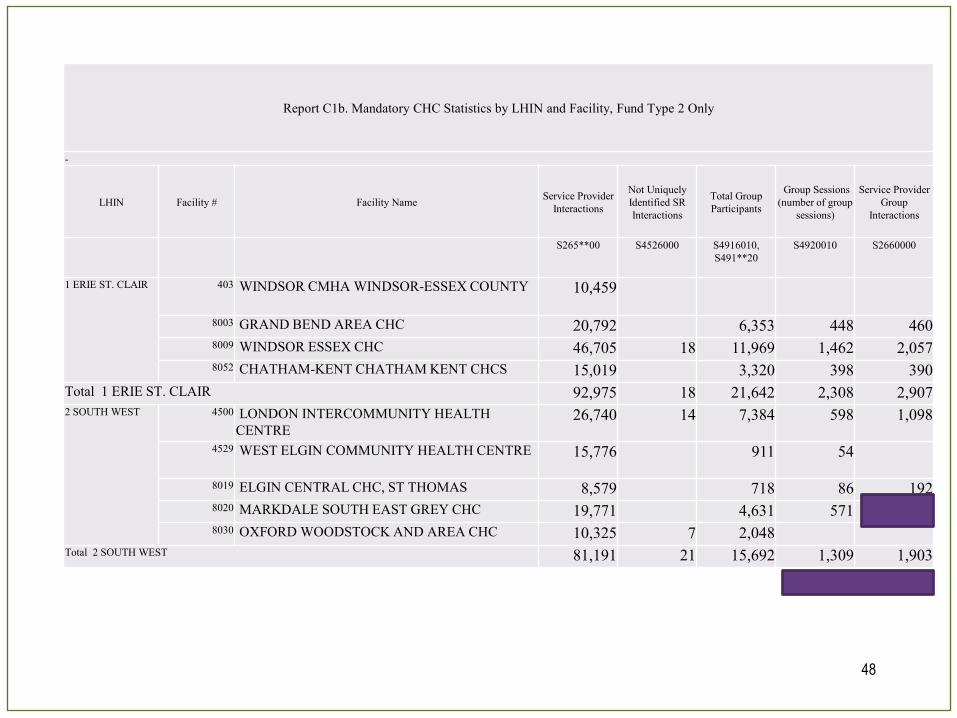
Report C1b. Mandatory CHC Statistics by LHIN and Facility, Fund Type 2 Only
-
LHIN Facility # Facility Name Service Provider
Interactions
Not Uniquely
Identified SR
Interactions
Total Group
Participants
Group Sessions
(number of group
sessions)
Service Provider
Group
Interactions
S265**00 S4526000 S4916010,
S491**20
S4920010 S2660000
1 ERIE ST. CLAIR 403 WINDSOR CMHA WINDSOR-ESSEX COUNTY 10,459
8003 GRAND BEND AREA CHC 20,792 6,353 448 460 8009 WINDSOR ESSEX CHC 46,705 18 11,969 1,462 2,057 8052 CHATHAM-KENT CHATHAM KENT CHCS 15,019 3,320 398 390
Total 1 ERIE ST. CLAIR 92,975 18 21,642 2,308 2,907 2 SOUTH WEST 4500 LONDON INTERCOMMUNITY HEALTH
CENTRE 26,740 14 7,384 598 1,098
4529 WEST ELGIN COMMUNITY HEALTH CENTRE 15,776 911 54
8019 ELGIN CENTRAL CHC, ST THOMAS 8,579 718 86 192 8020 MARKDALE SOUTH EAST GREY CHC 19,771 4,631 571 613 8030 OXFORD WOODSTOCK AND AREA CHC 10,325 7 2,048
Total 2 SOUTH WEST 81,191 21 15,692 1,309 1,903
48
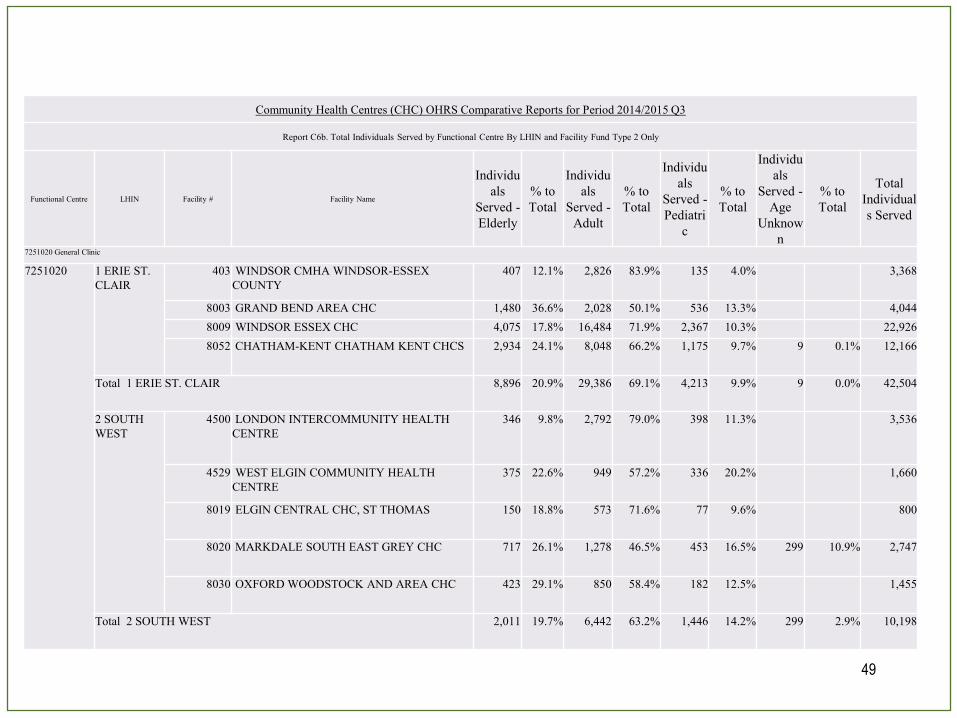
Community Health Centres (CHC) OHRS Comparative Reports for Period 2014/2015 Q3
Report C6b. Total Individuals Served by Functional Centre By LHIN and Facility Fund Type 2 Only
Functional Centre LHIN Facility # Facility Name
Individu
als
Served -
Elderly
% to
Total
Individu
als
Served -
Adult
% to
Total
Individu
als
Served -
Pediatri
c
% to
Total
Individu
als
Served -
Age
Unknow
n
% to
Total
Total
Individual
s Served
7251020 General Clinic
7251020 1 ERIE ST.
CLAIR
403 WINDSOR CMHA WINDSOR-ESSEX
COUNTY
407 12.1% 2,826 83.9% 135 4.0% 3,368
8003 GRAND BEND AREA CHC 1,480 36.6% 2,028 50.1% 536 13.3% 4,044
8009 WINDSOR ESSEX CHC 4,075 17.8% 16,484 71.9% 2,367 10.3% 22,926
8052 CHATHAM-KENT CHATHAM KENT CHCS 2,934 24.1% 8,048 66.2% 1,175 9.7% 9 0.1% 12,166
Total 1 ERIE ST. CLAIR 8,896 20.9% 29,386 69.1% 4,213 9.9% 9 0.0% 42,504
2 SOUTH
WEST
4500 LONDON INTERCOMMUNITY HEALTH
CENTRE
346 9.8% 2,792 79.0% 398 11.3% 3,536
4529 WEST ELGIN COMMUNITY HEALTH
CENTRE
375 22.6% 949 57.2% 336 20.2% 1,660
8019 ELGIN CENTRAL CHC, ST THOMAS 150 18.8% 573 71.6% 77 9.6% 800
8020 MARKDALE SOUTH EAST GREY CHC 717 26.1% 1,278 46.5% 453 16.5% 299 10.9% 2,747
8030 OXFORD WOODSTOCK AND AREA CHC 423 29.1% 850 58.4% 182 12.5% 1,455
Total 2 SOUTH WEST 2,011 19.7% 6,442 63.2% 1,446 14.2% 299 2.9% 10,198
49
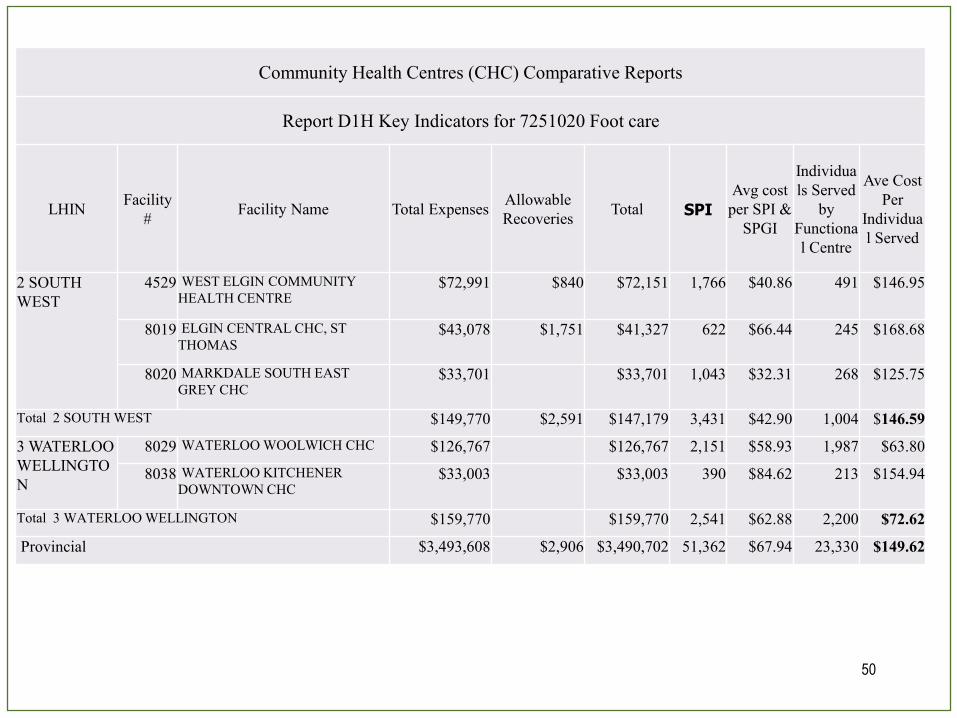
Community Health Centres (CHC) Comparative Reports
Report D1H Key Indicators for 7251020 Foot care
LHIN Facility
# Facility Name Total Expenses
Allowable
Recoveries Total SPI
Avg cost
per SPI &
SPGI
Individua
ls Served
by
Functiona
l Centre
Ave Cost
Per
Individua
l Served
2 SOUTH
WEST
4529 WEST ELGIN COMMUNITY
HEALTH CENTRE $72,991 $840 $72,151 1,766 $40.86 491 $146.95
8019 ELGIN CENTRAL CHC, ST
THOMAS $43,078 $1,751 $41,327 622 $66.44 245 $168.68
8020 MARKDALE SOUTH EAST
GREY CHC $33,701 $33,701 1,043 $32.31 268 $125.75
Total 2 SOUTH WEST $149,770 $2,591 $147,179 3,431 $42.90 1,004 $146.59
3 WATERLOO
WELLINGTO
N
8029 WATERLOO WOOLWICH CHC $126,767 $126,767 2,151 $58.93 1,987 $63.80
8038 WATERLOO KITCHENER
DOWNTOWN CHC $33,003 $33,003 390 $84.62 213 $154.94
Total 3 WATERLOO WELLINGTON $159,770 $159,770 2,541 $62.88 2,200 $72.62
Provincial $3,493,608 $2,906 $3,490,702 51,362 $67.94 23,330 $149.62
50
51
QUESTIONS
Section 6