Embed Size (px)
Citation preview
October 2016
Improving Australian Housing Envelope Integrity
A Net Benefit Case for Post Construction Fan Pressurisation Testing
Report prepared by:
The Australian Institute for Refrigeration Air Conditioning and Heating (AIRAH)
Building Physics Special Technical Group
Improving Australian Housing Envelope Integrity | October 2016
Page 2 of 144
Prepared by
Australian Institute of Refrigeration Air Conditioning and Heating (AIRAH)
3/1 Elizabeth Street, Melbourne, VIC 3000
Tel: 03 8623 3000 | www.airah.org.au | email: [email protected]
Acknowledgments
This report was prepared by the AIRAH Building Physics Special Technical Group. The following participated in the development and review of the guidelines:
Jesse Clarke, M.AIRAH (lead author)
Sean Maxwell, M.AIRAH (contributor)
Greg King, M.AIRAH
Natalie Rosenbaum, M.AIRAH
Craig MacLauchlan, M.AIRAH
Andy Russell, M.AIRAH
Darren O’Dea
About AIRAH
Established in 1920, AIRAH has established itself as the pre-eminent member institute for Australian HVAC&R professionals. AIRAH is Australia’s most dynamic and progressive HVAC&R organisation, earning recognition and respect from government and industry bodies, for its leadership, collaboration, expertise and professionalism.
AIRAH has a reach of 25,000 air conditioning, refrigeration, ventilation and heating professionals across Australia. AIRAH is recognised for its expertise across a wide range of issues in the area of engineering services for the built environment. AIRAH encourages world's best practice within the industry. Through continuing professional development, accreditation programs and a wide range of technical publications, AIRAH has earned a reputation for developing the competence and skills of practitioners within the air conditioning and refrigeration industries.
Improving Australian Housing Envelope Integrity | October 2016
Page 3 of 144
AIRAH Special Technical Groups
AIRAH’s Special Technical Groups provide a platform for collaborative involvement for AIRAH members to support the goals and strategic aims of AIRAH.
This can include:
Engaging with local TAFES and universities
Identification of relevant industry issues for AIRAH events (division seminars, workshops or conferences)
Policy advice
Thought leadership
Regulation development
Review and development of industry best practice advice
Professional development
Whole of supply chain views on specific topic issues and best practice delivery in the Australian and international community.
Committees also contribute to the review and development of AIRAHs strategic aims through communication with the AIRAH Executive and AIRAH Board.
Disclaimer
The information or advice contained in this document is intended for use only by those who have adequate technical training in the field to which the Guidelines. The document has been compiled as an aid, only and the information or advice should be verified before it is put to use. Reasonable efforts have been taken to ensure that the information or advice is accurate, reliable and accords with current standards as at the date of publication.
To the maximum extent permitted by law, the Australian Institute of Refrigeration Air Conditioning and Heating Inc., its officers, employees and agents
a) disclaim all responsibility and all liability (including without limitation, liability in negligence) for all expenses, losses, damages and costs, whether direct, indirect, consequential or special you might incur as a result of the information in this publication being inaccurate or incomplete in any way, and for any reason; and
b) exclude any warranty, condition, guarantee, description or representation in relation to this publication, whether express or implied.
In all cases, the user should also establish the accuracy, currency and applicability of the information or advice in relation to any specific circumstances and must rely on his or her professional judgement at all times.
© AIRAH 2016
Improving Australian Housing Envelope Integrity | October 2016
Page 4 of 144
Improving Australian Housing Envelope Integrity
A Net Benefit Case for Post Construction Fan Pressurisation Testing
“A large fraction of a modern, well-insulated building's space
conditioning energy load is due to uncontrolled air leakage.
Wintertime condensation of water vapour in exfiltrating air (or
summertime condensation of infiltrating air) within assemblies
is one of the two major sources of moisture in the above-grade
enclosure (driving rain being the other). Air flow through the
enclosure can also carry; exhaust gases, odours, and sounds
through enclosures as well as mould spores and off gassing
generated within the enclosure. Uncontrolled air leakage
through the enclosure is therefore often a major cause of
performance (e.g. comfort, health, energy, durability, etc.)
problems.”
Building Science Digest 014
Air Flow Control in Buildings
October 2007, John Straube
“Productivity savings of up to $1.1 billion per annum may be
achieved in part by increasing the uptake of Performance
Solutions. This is because Performance Solutions can lead to
more innovative and cost-effective construction practices.”
Australian Building Codes Board
Australian Building Regulation Bulletin
April 2016

Improving Australian Housing Envelope Integrity | October 2016
Page 5 of 144
Table of Contents
EXECUTIVE SUMMARY ...................................................................................................................................... 14
1 INTRODUCTION .......................................................................................................................................... 18
2 THE NEED FOR IMPROVED HOUSING ENVELOPE INTEGRITY ...................................................................... 20
2.1 PRACTICAL IMPLEMENTATION OF AIR SEALING ...................................................................................................................... 21 2.2 RECENT RESEARCH – A SNAPSHOT OF AUSTRALIA ................................................................................................................. 23 2.3 OPTIONS FOR ADDRESSING AIR LEAKAGE ............................................................................................................................. 24 2.4 INDUSTRY LEARNING ...................................................................................................................................................... 25
3 QUANTIFYING THE BENEFIT – DEPENDENT VARIABLES .............................................................................. 25
3.1 CLIMATE ..................................................................................................................................................................... 29 3.2 HOUSING ACTIVITY BY CLIMATE REGION ............................................................................................................................ 29 3.3 CURRENT BUILDING PRACTICE .......................................................................................................................................... 29 3.4 STATE BASED CONSTRUCTION METHODS............................................................................................................................ 30 3.5 HEATING AND COOLING SYSTEMS ..................................................................................................................................... 31 3.6 EFFICIENCY OF HEATING AND COOLING SYSTEMS .................................................................................................................. 33 3.7 FUEL PRICES ................................................................................................................................................................ 36 3.8 PRESENT VALUE OF FUTURE SAVINGS ................................................................................................................................ 38 3.9 HOUSE SPECIFICATIONS .................................................................................................................................................. 38
4 ECONOMIC COSTS ...................................................................................................................................... 45
5 ECONOMIC BENEFITS ................................................................................................................................. 48
5.1 BCA CLIMATE ZONE 1 - HOT HUMID SUMMER, WARM WINTER ............................................................................................... 50 5.2 BCA CLIMATE ZONE 2 - WARM HUMID SUMMER, MILD WINTER ............................................................................................. 52 5.3 BCA CLIMATE ZONE 3 - HOT DRY SUMMER, WARM WINTER ................................................................................................... 53 5.4 BCA CLIMATE ZONE 4 - HOT DRY SUMMER, COOL WINTER ..................................................................................................... 54 5.5 BCA CLIMATE ZONE 5 - WARM TEMPERATE ....................................................................................................................... 55 5.6 BCA CLIMATE ZONE 6 - MILD TEMPERATE ......................................................................................................................... 56 5.7 BCA CLIMATE ZONE 7 - COOL TEMPERATE ......................................................................................................................... 58 5.8 BCA CLIMATE ZONE 8 – ALPINE ...................................................................................................................................... 60
6 PUBLIC HEALTH AND AMENTIY .................................................................................................................. 61
6.1 INDOOR THERMAL STABILITY ........................................................................................................................................... 62 6.2 ACOUSTIC PERFORMANCE ............................................................................................................................................... 67 6.3 MOISTURE MANAGEMENT .............................................................................................................................................. 68 6.4 VENTILATION AND INFILTRATION ....................................................................................................................................... 70 6.5 LIMITING HEALTH AND AMENITY RISKS .............................................................................................................................. 79 6.6 WEATHER-PROOFING .................................................................................................................................................... 80
7 FIRE SAFETY ............................................................................................................................................... 83
8 PEAK LOAD REDUCTION ............................................................................................................................. 85
9 IMPACTS .................................................................................................................................................... 92
9.1 SOCIAL AND COMMUNITY IMPACT .................................................................................................................................... 92 9.2 CARBON REDUCTION IMPACT .......................................................................................................................................... 92 9.3 COMPETITION .............................................................................................................................................................. 94 9.4 ECONOMIC IMPACT ....................................................................................................................................................... 95
10 CONCLUSIONS ............................................................................................................................................ 96
11 RECOMMENDATIONS ................................................................................................................................. 98
12 FURTHER INVESTIGATIONS ........................................................................................................................ 98
13 REFERENCES ............................................................................................................................................. 100
APPENDIX A – PREDICTING ENERGY USE FROM ACH50 RESULTS ...................................................................... 103
PERSILY-KRONVALL ESTIMATION MODEL ......................................................................................................................................... 104 LBL INFILTRATION MODEL .......................................................................................................................................................... 104 SHERMAN INFILTRATION ESTIMATION MODEL .................................................................................................................................. 106 ASHARAE ENHANCED INFILTRATION MODEL ................................................................................................................................... 107
Improving Australian Housing Envelope Integrity | October 2016
Page 6 of 144
LBL MODEL VS PERSILY-KRONVALL MODEL ..................................................................................................................................... 107
APPENDIX B - AIR SEALING PROCEDURES ....................................................................................................... 115
APPENDIX C – EXTERNAL AIR BARRIER PERFORMANCE .................................................................................. 118
APPENDIX D - HOUSE DESIGNS ....................................................................................................................... 121
SIMPLE 3 BEDROOM SINGLE STOREY DESIGN ................................................................................................................................... 121 THE HOUSING RESEARCH FACILITY................................................................................................................................................. 123
APPENDIX E - HOUSE SPECIFICATIONS ............................................................................................................ 125
APPENDIX F – ASHRAE VENTILATION EFFECTIVENESS ..................................................................................... 141
APPENDIX G – PEAK COOLING LOAD BY NATHERS CLIMATE ........................................................................... 142
Improving Australian Housing Envelope Integrity | October 2016
Page 7 of 144
Figures
Figure 1 Problems related to poor air sealing in buildings, adapted from Berge 2011 ........................................... 19 Figure 2 Effect of poor air sealing on heating and cooling loads (NatHERS 28) ...................................................... 22 Figure 3 Distribution of pressure testing results, ACH50 (CSIRO 2015) ..................................................................... 23 Figure 4 Input parameters for economic benefit calculation ................................................................................... 26 Figure 5 NPV calculation process ............................................................................................................................. 27 Figure 6 Housing Approvals by NatHERS Climate Zone, ABS 2015 .......................................................................... 28 Figure 7 Air infiltration rates at 50Pa as measured by Ambrose and Syme (2015). ................................................ 29 Figure 8 Cladding Types by State, BIS Shrapnel 2011 .............................................................................................. 31 Figure 9 Type of heating system by household, ABS 2014 ....................................................................................... 32 Figure 10 Type of cooling system by household, ABS 2014 ..................................................................................... 32 Figure 11 Average COP and EER of MEPS Air Conditioners (0 - 30kW) .................................................................... 33 Figure 12 Thermal Efficiency of Gas Heating Systems, derived from AS/NZS 5263.1.3 ........................................... 34 Figure 13 Co-Efficient of Performance (COP) of Heating Systems ........................................................................... 35 Figure 14 Electricity Price Predictions, AEMO 2015 (Including WA Estimation) ...................................................... 36 Figure 15 Calculated gas price projections .............................................................................................................. 37 Figure 16 Average yearly air change rate assumed in compliance calculations ...................................................... 42 Figure 17 Loss of rating performance based on air change rate for 3 bed house ................................................... 43 Figure 18 Loss of rating performance based on air change rate for The Research Facility ..................................... 43 Figure 19 Loss of rating performance Vs Infiltration, averaged into BCA climate zones ......................................... 44 Figure 20 Present value benefits and costs of 10 ACH50 benchmark (2015 approval data) .................................... 48 Figure 21 BCR for adopting air sealing (7% discount) .............................................................................................. 49 Figure 22 BCR for adopting air sealing (5% discount) .............................................................................................. 49 Figure 23 BCR for adopting air sealing (3.5% IPCC discount)................................................................................... 50 Figure 24 Housing approvals (2015) in BCA climate 1 ............................................................................................. 51 Figure 25 Housing approvals (2015) in BCA climate 2 ............................................................................................. 52 Figure 26 Housing approvals (2015) in BCA climate 3 ............................................................................................. 53 Figure 27 Housing approvals (2015) in BCA climate 4 ............................................................................................. 54 Figure 28 Housing approvals (2015) in BCA climate 5 ............................................................................................. 56 Figure 29 Housing approvals (2015) in BCA climate 6 ............................................................................................. 57 Figure 30 Housing approvals (2015) in BCA climate 7 ............................................................................................. 59 Figure 31 Housing approvals (2015) in BCA climate 8 ............................................................................................. 60 Figure 32 The ability of fan pressurisation verification to enhance BCA Vol. 2 objectives....................................... 62 Figure 33 Relative Risk (RR) of mortaility vs temeprature in Sydney, Gasparrini et al. 2015 .................................. 63 Figure 34 Relative Risk (RR) of mortaility vs temeprature in Canada, Gasparrini et al. 2015 ................................. 64 Figure 35 Relative Risk (RR) of mortaility vs temeprature in Sweden, Gasparrini et al. 2015 ................................. 64 Figure 36 Indicative air sealing of buildings in various countries in the 1980’s ....................................................... 65 Figure 37 Natural Comfort(Free Running Mode) for typical 3 bedroom House 6 Star ............................................ 66 Figure 38 Natural Comfort (Free Running Mode) for The Housing Research Facility, 6 Star ................................... 66 Figure 39 Air sealing at perimeter of acoustic laboratory test rig ........................................................................... 67 Figure 40 Composite loss of a leaky panel as a function of the total percentage of leaks ...................................... 68 Figure 41 Latent Cooling loads vs air leakage rate, Housing Research Facility ....................................................... 70 Figure 42 Fresh air rates under ventilation scenarios for equivalent air quality (@ 7ACH50) .................................. 76 Figure 43 Star rating versus fresh air rates single storey house (@ 7ACH50 Envelope) ........................................... 77 Figure 44 Star rting versus fresh air rates housing research facility (@ 7ACH50 Envelope) ..................................... 78 Figure 45 Loss of rating performance Vs fresh air rate, averaged into BCA climate zones ..................................... 78 Figure 46 Enclosure system types (Straube, 2010) for compliance with BCA V2.2.1 ............................................... 81 Figure 47 Masonry veneer face sealed system under test (air sealed cladding) ..................................................... 82 Figure 48 Weatherboard pressure moderated system under test (air sealed membrane)...................................... 83 Figure 49 Fire Rated Wall with pipe pentration under Test ..................................................................................... 83 Figure 50 Fire rated cabling (-/120/60) and pipe (-/120/-) sealing ......................................................................... 84 Figure 51 Non-sealed cable and pipe pentration in fire rated wall (BCA Logic, 2015) ............................................ 84 Figure 52 Single storey house peak heating load Vs HDD, 10 ACH50 Vs 35ACH50 .................................................... 86 Figure 53 Single storey house peak sensible cooling load Vs CDD, 10 ACH50 Vs 35ACH50........................................ 87 Figure 54 Single storey house peak latent cooling load Vs CDD, 10 ACH50 Vs 35ACH50 ........................................... 88 Figure 55 The Housing Research Facility peak heating load Vs HDD, 10 ACH50 Vs 35ACH50 ................................... 89 Figure 56 Housing Research Facility peak sensible cooling load Vs CDD, 10 ACH50 Vs 35ACH50 .............................. 90 Figure 57 Housing Research Facility peak latent cooling load Vs CDD, 10 ACH50 Vs 35ACH50 ................................. 91
Improving Australian Housing Envelope Integrity | October 2016
Page 8 of 144
Figure 58 Potential tonnes of CO2 mitigated by air sealing new houses built in 2015 ............................................ 93 Figure 59 Calculation check for Kronval and Persily Rule of Thumb ...................................................................... 108 Figure 60 Estimated ACH
-1 vs ACH50 for 2 storey house in Canberra ...................................................................... 112
Figure 61 sealing under bottom plate.................................................................................................................... 115 Figure 62 sealing around windows ........................................................................................................................ 115 Figure 63 Taping and sealing membranes ............................................................................................................. 116 Figure 64 Snug fitting insulation increase airflow resistance ................................................................................ 117 Figure 65 Sealing wet areas ................................................................................................................................... 117 Figure 66 Pressure sensor tubing installed on test rig ........................................................................................... 118 Figure 67 Wall wrap air leakage being tested under pressure .............................................................................. 119 Figure 68 Improving air barrier integrity, taping centre overlap and around windows ........................................ 119 Figure 69 Effect of wall wrap and sealing on wall air infiltration .......................................................................... 120 Figure 70 Simple 3 bedroom design ....................................................................................................................... 121 Figure 71 Simple 3 bedroom floor plan .................................................................................................................. 121 Figure 72 Simple 3 bedroom North & West facades .............................................................................................. 122 Figure 73 Simple 3 bedroom South & East facades ............................................................................................... 122 Figure 74 The Housing Research Facility ............................................................................................................... 123 Figure 75 The Housing Research Facility Floor Plan Layout ................................................................................... 124 Figure 76 ASHRAE house used for ventilation effectiveness simulations ............................................................... 141 Figure 77 Hourly peak cooling load, Housing Research Facility, Canberra, 35 ACH50 (Leaky) ............................... 142 Figure 78 Hourly peak cooling load, Housing Research Facility, Canberra, 10 ACH50 (Sealed) .............................. 143 Figure 79 Hourly peak heating load, Housing Research Facility, Canberra, 35 ACH50 (Leaky)............................... 143 Figure 80 Hourly peak heating load, Housing Research Facility, Canberra, 5 ACH50 (Sealed) ............................... 144
Tables
Table 1 Single storey 3 bedroom house base construction scenarios ...................................................................... 39 Table 2 Double storey 3 bedroom Housing Research Facility base construction scenarios ..................................... 40 Table 3 Cost associated with achieveing 10 ACH50 – Single storey 3 bedroom ....................................................... 46 Table 4 Cost associated with achieveing 10 ACH50 – Housig Research Facility, 2 storey ......................................... 47 Table 5 Houses already achieving 10 ACH50, based on Ambrose and Syme (CSIRO, 2015) ..................................... 47 Table 6 Minimum intermittent source extract ventilation rates.............................................................................. 73 Table 7 Ventilation strategies required based on ACH50 Infiltration Measurement ................................................ 74 Table 8 Single storey house peak heating load reduction in capital cities ............................................................... 86 Table 9 Single storey house peak sensible cooling load reduction in capital cities .................................................. 87 Table 10 Single storey house peak latent cooling load reduction in capital cities ................................................... 88 Table 11 Housing Research Facility peak heating load reduction in capital cities ................................................... 89 Table 12 Housing Research Facility peak sensible cooling load reduction in capital cities ...................................... 90 Table 13 The Housing Research Facility peak latent cooling load reduction in capital cities .................................. 91 Table 14 National Greenhouse Accounts Factors, Department of Environment, 2014 ........................................... 93 Table 15 Terrain coefficients .................................................................................................................................. 108 Table 16 buidling shielding class (Sherman M. , The Use of Blower Door Data, 1998) ......................................... 109 Table 17 Enelope leakage fractions; walls, floors; ceilings (Sherman, 2011) ........................................................ 109 Table 18 Single Storey House description and input parameters (LBL Model) ..................................................... 110 Table 19 Double Storey House description and input parameters (LBL Model)..................................................... 111 Table 20 Annual average infiltration Vs ACH50 test results by NatHERS climate ................................................... 113
Improving Australian Housing Envelope Integrity | October 2016
Page 9 of 144
GLOSSARY
Air barrier A layer that greatly restricts the movement of air under the normal pressure differences found across building elements.
Air Changes The number of times the air volume within a house is completely replaced with outside air in a one hour time period.
ABCB The Australian Building Codes Board. A joint initiative of the Australian Government and state and territory governments, the ABCB regulates safety, health, and amenity and sustainability issues through the National Construction Code (NCC).
AccuRate Is a CSIRO developed software tool. The software has been built on decades of scientific research and lessons from over a decade of the Nationwide House Energy Rating Scheme program.
AccuRate enables house designers to model a house to a fine level of detail, calculate temperatures, heating and cooling energy requirements on an hourly basis, and assess a house’s energy efficiency in any one of 69 different climatic zones in Australia.
ACH-1 Annual average air changes per hour under normal operating pressures.
ACH50 Air changes per hour measured during a pressurisation test is reported at a nominal value of 50Pa and will generally be 20 times higher than the normal operating infiltration rate.
ASHRAE American Society of Heating, Refrigerating and Air-Conditioning Engineers
BCA The Building Code of Australia. Generally refers to Volume 1 and/or Volume 2 of the National Construction Code (NCC). Volume One contains the requirements for Class 2 to 9 (multi-residential, commercial, industrial and public) buildings and structures. Volume Two contains the requirements for Class 1 (residential) and Class 10 (non-habitable) buildings and structures.
BCR Benefit to Cost Ratio
Chenath Engine NatHERS Accredited Software tools are underpinned by CSIRO’s Chenath Engine. The Chenath Engine is used by NatHERS software tools to perform the calculations and modelling supporting each home energy rating.
The Chenath Engine has been developed by the Commonwealth Scientific and Industrial Research Organisation (CSIRO) and is based on decades of scientific research on the way buildings operate in Australian conditions. It uses climate data and average user behaviour, among other factors, to predict annual totals of hourly heating and cooling energy requirements for residential dwellings.
Condensation The process used to describe moisture formation on a surface as a result of moist air coming into contact with a surface which is at a lower temperature. As cool air is unable to retain the same amount of water vapour as warm air, excess moisture is released as condensation.
CSR House Is a high performance energy efficient BCA Class 1 house built by CSR building products in 2012 for research and development of products and building systems.

Improving Australian Housing Envelope Integrity | October 2016
Page 10 of 144
Dew Point The temperature at which the relative humidity of the air reaches 100%, at which time saturation occurs and water vapour contained in the air will begin to condense. The dew point temperature of the air depends upon the air temperature and the humidity of the air and can be determined using a psychrometric chart.
Energy Rating A star value (from 0 to 10 stars) that is calculated based on the predicted annual Energy Load and the Star Band Criteria for each Climate Zone. The predicted annual Energy Load and the corresponding star rating band for the particular Climate Zone is the design’s star rating for regulatory purposes.
Exfiltration The leakage of room air out of a building, intentionally or not, is called exfiltration.
Heater, Flued A dedicated exhaust pipe for combustion heating appliances that directs exhaust gases to the outside of a building.
Heater, Unflued (Flueless) A combustion heating appliance that is not able to directly exhaust gases to the outside of a building.
Housing Research Facility (HRF) CSR House is now used as a research facility for testing new innovations.
Infiltration The unintentional or accidental introduction of outside air into a building, typically through cracks in the building envelope. Infiltration is sometimes called air leakage.
IPCC Intergovernmental Panel on Climate Change
Kilowatt-hour, kWh The kilowatt-hour (symbolized kWh) is a unit of energy equivalent to one kilowatt (1 kW) of power sustained for one hour. One watt is equal to 1 J/s. One kilowatt-hour is 3.6 megajoules, which is the amount of energy converted if work is done at an average rate of one thousand watts for one hour.
Megajoule, MJ The joule, symbol J, is a derived unit of energy in the International System of Units. The megajoule (MJ) is equal to one million joules.
Moisture Content (Air) Moisture content of air refers to the grams of water that is present in a cubic meter of air.
Moisture, External The penetration of moisture into the building cavity through various sources such as rain, capillary action, leaks, solar driven moisture, air movement and vapour diffusion.
Moisture, Internal Moisture generated by human activities inside a building, i.e. breathing, sweating, cooking, clothes drying or showering.
Energy Load (Thermal) It is the predicted annual, energy requirements in conditioned zones arising from space conditioning to maintain thermal comfort within a dwelling reported in Megajoules per Meter Square per annum, MJ/m².a
NCC The National Construction Code. It is an initiative of the Council of Australian Governments developed to incorporate all on-site building and plumbing requirements into a single code. The NCC sets the minimum requirements for the design, construction and performance of buildings throughout Australia.
Improving Australian Housing Envelope Integrity | October 2016
Page 11 of 144
Pliable building membrane (or underlay) A pliable material, which may be installed to act as sarking, a thermal insulation or vapour control membrane, air barrier, ember barrier or any combination of these.
Relative Humidity (%RH) The measure of the amount of water vapour in the air relative to the maximum amount of water that the air can hold at a given temperature.
Temperature, Dry bulb A measure of the temperature of the air, excluding the influence of radiation and moisture. Together with wet bulb temperature, relative humidity and dew point at the ambient temperature can be determined.
Temperature, Wet bulb Wet-bulb temperature reflects the physical properties of a system with a mixture of a gas and a vapour, usually air and water vapour. Wet bulb temperature is the lowest temperature that can be reached by the evaporation of water only. It is the temperature felt when the skin is wet and is exposed to moving air.
Vapour diffusion Vapour diffusion occurs through air and/or porous building products when there is a vapour pressure difference between indoor and outdoor air conditions. The rate of diffusion depends upon the permeability of the linings and materials that make up the building fabric.
Ventilation Ventilation is the removal of contaminated air and replacement with fresh outdoor air.
Ventilation, Extract Extract ventilation is the removal of contaminated air by way of powered ventilators or fans that remove air from the building. Fresh outdoor air may enter into the building by leakage, purpose built openings or dedicated supply fans.
Ventilation, Mechanical Mechanical ventilation is the removal of contaminated air and replacement with fresh outdoor air by utilising power ventilators, fans or the like.
Ventilation, Natural Natural ventilation is the removal of contaminated air and replacement with fresh outdoor air by utilising operable windows, doors or purpose made openings.
Ventilation, Purge Purge ventilation is the removal of large quantities of air and replacement with fresh outdoor air in a short period of time. This may be by mechanical or natural means.
Ventilation, Source Extract Source extract ventilation is the removal of contaminated air at the source of contamination utilising power ventilators, fans or the like.
Improving Australian Housing Envelope Integrity | October 2016
Page 12 of 144
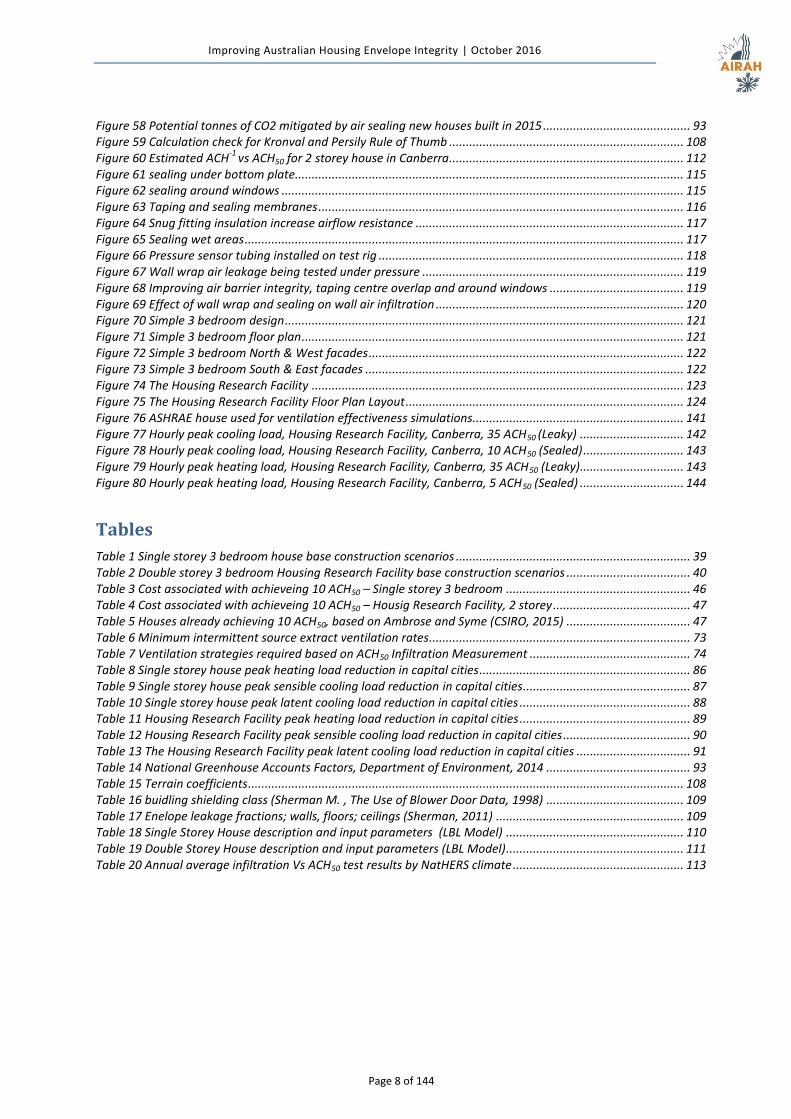
FOREWORD
The Problem
According to the Australian Government’s YourHome guides, “Air leakage accounts for
15−25% of winter heat loss in buildings and can contribute to a significant loss of coolness in
climates where air conditioners are used.” Draughts are also one of the leading causes of
discomfort in homes. The National Construction Code of Australia includes basic requirements
for draught sealing residential homes, but the language is general and difficult to enforce.
Ultimately, compliance with energy provisions of the code has been shown by the Federal
Government’s National Energy Efficient Building Project to be lacking.
Recent CSIRO data on Australian building air sealing highlights both problems and
opportunities. The report mentions a recommended target for Australian building air sealing
at 10 ACH50 deemed as “Fair” in the Australian Government’s YourHome guide. While the
average of fan pressurisation test results was 15.4 ACH50, many homes were dramatically
leakier, with a significant portion testing over 20 ACH50 deemed as “Poor” in the Australian
Government’s YourHome guide. These homes are at risk for major performance problems like
the inability to keep the house comfortable during adverse weather conditions. This is often
referred to as the “performance gap” which is the disparity between the planned outcomes
and real outcomes. Furthermore energy calculations for code compliance may be based on
assumed air infiltration rates less than or equal to 10 ACH50 but the building does not
necessarily achieve this post construction.
Additionally houses are being built
below 3 ACH50 which means that
accumulation of internal moisture is a
higher risk. If the extent of air sealing is
validated mechanical ventilation can
be suitably addressed within in the
National Construction Code to alleviate
this risk.
Difference between code-required building sealing and typical construction
Improving Australian Housing Envelope Integrity | October 2016
Page 13 of 144
The Opportunity
The current process of verifying that homes have been adequately sealed according to the
requirements of the Australia’s National Construction Code is visual and therefore subjective
and unreliable. To overcome this limitation and enforce code and regulation requirements for
draught-proofing of homes, European countries have for years required air leakage testing of
homes for verification. Performance is measured by the fan pressurisation method,
commonly called a blower door test. This method is quick and repeatable, and by comparison
to visual methods of verification, it is quantifiable and therefore more reliable. This
quantitative measure of air sealing allows for benchmarking and standardisation. Much of
the argument for not adopting this in Australia to date is that our climate is mild and that the
costs are not warranted. From a building physics perspective this is not the case in Australia
and for every dollar spent will return $1.8 - $2.6 in economic benefit.
Fortunately, improving draught sealing of new homes is readily achievable by mainstream
Australian construction. The CSIRO data shows that one third of the homes in the sample are
already being built to meet the recommended target of 10 ACH50.
Testing homes by fan pressurisation has been used for over 40 years to evaluate the air
sealing adequacy of buildings internationally, and it is used by many countries as a
performance based validation technique to ensure compliance with sealing requirements of
building codes. This performance based measure allows a builder considerable flexibility in
materials and methods used to meet requirements. In fact, basic levels of sealing may be
achieved simply by following the acceptable construction practice in the National
Construction Code. The difference is that a performance target can be prescribed and verified
with a quantitative test.
Improving Australian Housing Envelope Integrity | October 2016
Page 14 of 144
EXECUTIVE SUMMARY
This report presents the case that performance based sealing and verification of as-
constructed air leakage rates in new housing in accordance with AS/NZS ISO 9972 is greatly
beneficial to Australia and is valid for inclusion in the 2019 Building Code.
The Need
Recent research by CSIRO has shown that the current prescriptive methods outlined in the
BCA for sealing construction systems are not effectively achieving their purpose in 65% of
cases and not fulfilling the NCC objectives to reduce carbon emissions. This also has potential
sub-optimal outcomes for health, amenity and fire safety.
The case is presented for building integrity testing as a performance solution alternative to
the acceptable construction practice for air sealing in BCA Volume 2 clause 3.12.3 for
residential housing. The report concludes:
Air sealing to a “Fair” level of 10 ACH50 is realistic and achievable with standard
Australian construction practice.
A building code target of value of 10 ACH50 would effectively bring 65% of new houses
tested to a “Fair” level of performance.
Current Practice
Recommendations in this report are not advocating an increase in stringency of the current
energy efficiency provisions in BCA Volume 2. It is advocating the use of a performance based
method of verification to increase air sealing alignment with the current energy efficiency
objectives, facilitating industry to develop performance based solutions for existing
requirements and increase productivity within the Australian construction industry. This
report makes the following recommendations:
A performance target of 10 ACH50 is implemented as a performance based measure in
parallel with acceptable construction practice in 2019 code revision.
AS/NZS ISO 9972 is used as the standard test methodology to validate the
performance.
A performance based benchmark is in parallel with acceptable construction practice
until 2022 building code update where performance verification becomes the only
option.
Improving Australian Housing Envelope Integrity | October 2016
Page 15 of 144
Motive for This Report
To show that improved envelope integrity through draught sealing is possible and cost-
effective in Australian construction. To establish evidence for a code based requirement for
testing by fan pressurisation as a cost-effective way to improve compliance with National
Construction Code requirements for building sealing.
Methodology
The analysis takes into account the many factors affecting the calculation of cost-
effectiveness, including climate, housing construction activity by state, current building
practice, state-specific construction methods, a variety of heating and cooling systems and
their efficiencies, fuel prices, and the present value of future energy savings.
The Economic Benefit
The analysis within the report shows that the energy provisions can be greatly undermined by
high air leakage rates through the building envelope. An achievable and realistic building code
performance benchmark enabling post construction testing using AS/NS ISO 9972 will deliver
an economic BCR of 1.7 @ 7% discount rate for 25 year projections. The BCR is calculated to
be 2.1 @ 5% discount rate and as high as 2.5 @ 3.5% (IPCC) discount rate meaning that air
sealing is valid for inclusion in the building code.
This measure would contribute towards the $1.1 billion per year productivity gain through the
uptake of performance base solutions (ABCB, 2016 ). This report concludes:
$255 - 371 million of economic benefit can be gained by $146.7 Million per year
investment in air sealing technologies and practices.
The cost of implementation of air control measures is estimated to be relatively minor
ranging from $163-$1468 per house.
Other Benefits
Reduced air permeability is not only an energy, carbon emission and cost saving argument.
Well established international building science research shows that improved air sealing will
have the overall positive performance impact on buildings particularly in relation to the NCC
objectives for health, amenity and fire safety.
The health and amenity benefits are difficult to quantify, however these benefits are
described in this report which are additional to the direct economic savings. These include
improved mechanical ventilation effectiveness, uniformity of thermal comfort, improved air
quality, superior acoustics, better weather tightness and enhanced ability to manage
Improving Australian Housing Envelope Integrity | October 2016
Page 16 of 144
moisture and mould risks resulting in overall healthier buildings.
The fire safety benefits may be enhanced by better auditing of construction work during the
testing process in which air leaks undermine fire rated system performance. Diagnostic
techniques to address air sealing for energy efficiency and fire compartmentalisation share
the same fundamental scientific principles to achieve performance based code requirements.
This report concludes air sealing verification has potential to mitigate 33360 Tonnes of
CO2/year and will:
Enhance overall innovation in manufacturing and construction sectors.
Reduce the longer term relative risk of mortality and sickness
Help safeguard occupants from illness or loss of amenity as a result of undue sound
Enhance the ability to protect the building from damage caused by external humidity
entering a building.
Allow highly effective low cost balanced mechanical ventilation strategies to safeguard
occupants from accumulation of internal moisture in a building.
Improve the ability to prevent the penetration of water in walling systems
Help to avoid the spread of fire
Reduce peak load when a leaky home (35ACH50) is sealed to a “fair” level (10 ACH50)
and operated with effective controlled natural ventilation strategies:
o Peak heating load can be reduced by 21-32% in capital cities.
o Peak sensible cooling load can be reduced by 7-22% in capital cities.
o Peak latent cooling peak load can be reduced by 1-43% in capital cities.
o Peak latent cooling load reduction due to air sealing is largely due to the
prevention of infiltration of humid air, in warmer tropical climates this has the
largest effect.
National Energy Efficiency Performance Target – BCA Climate Variations
The impact of the provisions varies across housing construction types and climate zones.
Depending on the location, BCR ratios for houses using simulation compliance ranged from
0.4 to 4.9 (7% discount rate) on a climatic basis (excluding Northern Territory – BCA 1 & 3).
It should be noted that while the reference buildings used to create these estimates may be
indicative of the economy as a whole, some caution should be used when interpreting results
at a local level. There may be local influences which may affect the analysis. For instance, the
BCR for BCA Zone 1 and 2 relate to achieving a 6 star energy rating. However, in climate zones
Improving Australian Housing Envelope Integrity | October 2016
Page 17 of 144
1 (Weipa, Wyndham) and 2 (Brisbane), where climates are conducive to outdoor living, there
are optional credits in the BCA of up to 1 star for a covered outdoor living area that meets
specific criteria. The star rating target with an outdoor living area is 5.5 stars when either
complying roof insulation or at least one complying ceiling fan is installed. The target falls to 5
stars when both are installed.
In order to protect health and amenity in sealed buildings this report recommends:
The 2019 building code incorporates requirements for the mechanical ventilation
system configuration required to achieve air change effectiveness when performance
based measurements below 7 ACH50 are achieved.
Continuous outdoor air supply in BCA zone 1 (tropical climates) should be
implemented with caution due to the high external humidity.
The building code is updated to ensure all new buildings in Australia meet the intent of
Energy Safe Victoria requirements as outlined in AS/NZS 5601.1.
AS/NZS 5601.1 will need to be addressed in the Plumbing Code of Australia (Clause
E1.2) in conjunction with AS/NZS ISO 9972 performance benchmarks incorporated into
the BCA.
Improving Australian Housing Envelope Integrity | October 2016
Page 18 of 144
1 INTRODUCTION The design detailing, construction techniques and workmanship are all essential in achieving
adequate building envelope integrity which will deliver the objectives of the NCC. In 2015 ISO
9972:2006 was adopted as an Australian and New Zealand Standard. This standard outlines
the principle methodology to undertake post construction verification of the thermal
performance of buildings by determination of air permeability of the envelope using the fan
pressurisation method. This provides a highly valuable performance based opportunity for the
building code to quantify the air sealing requirements for energy efficiency, allowing this
performance based solution to improve productivity. The Australian Building Codes Board is
working to increase the ability of industry to develop performance based solutions which
foster innovation and cost effective construction practices to realise a potential $1.1 billion
per annum in productivity savings (ABCB, 2016 ). Some performance based requirements
have already been introduced into the code but still excludes air sealing performance
requirements.
“Quantified Performance Requirements and Verification Methods have been
progressively introduced into the NCC since NCC 2015. This is part of a long-term goal
to increase the use of the performance-based opportunities of the code. In addition
to quantifying the requirements of the NCC, the ABCB is working to increase the
awareness and ability of industry to develop Performance Solutions.”
“The Centre for International Economics has estimated that at this point in time the
national code has improved the productivity of the Australian construction industry by
$1.1 billion per annum. Of this, $780 million is attributed to the performance-based
nature of the national code. Further additional productivity savings of up to $1.1
billion per annum may be achieved in part by increasing the uptake of Performance
Solutions. This is because Performance Solutions can lead to more innovative and
cost-effective construction practices.”
(ABCB, 2016 )
A common misconception is that the only benefit to air sealing a building is to increase the
energy efficiency of the building envelope. However, the benefits range from increased
energy efficiency, improved fire performance, superior acoustics, better weather tightness
and enhanced ability to manage moisture and mould risks in buildings. This has multiple
benefits to society through reduction in energy costs, reduced stress in persistent cold and
extreme hot weather for susceptible demographic groups, safer buildings, better quality of
Improving Australian Housing Envelope Integrity | October 2016
Page 19 of 144
life and enhanced building longevity through controlling unintended moisture transfer and
water damage.
The energy savings which could potentially be realised from widespread utilisation of air
infiltration testing would have huge implications for economic savings for consumers.
Amongst these benefits there are also the benefits of enhancing the correlation between
building code design requirements for acoustics, fire, health and amenity objectives and as
built outcomes.
Gaps in the envelope will carry, heat energy, acoustic energy, moisture laden air, hot gases
and poisonous gases. Building sealing is essential to obtain performance outcomes for
acoustic construction system, fire rating levels, effective mechanical ventilation, moisture
management and energy performance.
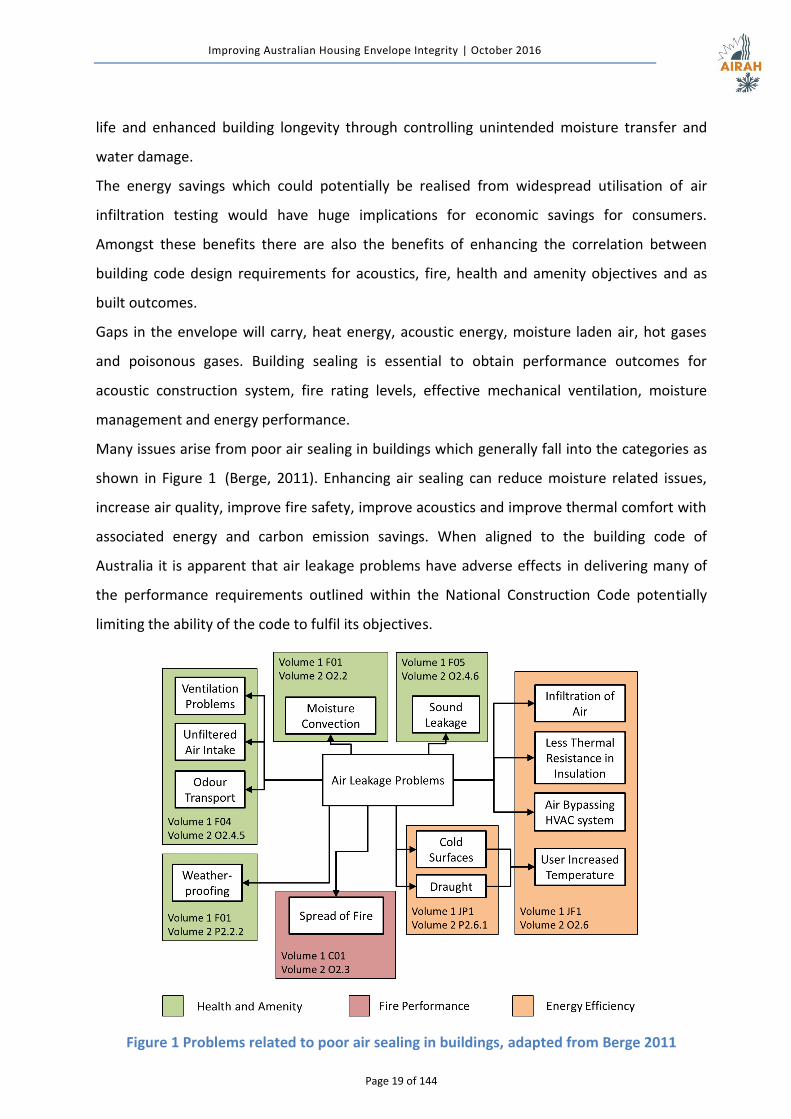
Many issues arise from poor air sealing in buildings which generally fall into the categories as
shown in Figure 1 (Berge, 2011). Enhancing air sealing can reduce moisture related issues,
increase air quality, improve fire safety, improve acoustics and improve thermal comfort with
associated energy and carbon emission savings. When aligned to the building code of
Australia it is apparent that air leakage problems have adverse effects in delivering many of
the performance requirements outlined within the National Construction Code potentially
limiting the ability of the code to fulfil its objectives.
Figure 1 Problems related to poor air sealing in buildings, adapted from Berge 2011
Improving Australian Housing Envelope Integrity | October 2016
Page 20 of 144
The primary benefit of air sealing is gained through thermal comfort benefits and associated
power bill reductions. From a safety aspect this includes reduced heat stress for the extremely
young, the elderly and the frail in persistent cold and/or extreme hot conditions reducing
morbidity and mortality rates in these extreme events as well as enhanced performance of
passive fire protection.
For the purpose of this report the benefits primarily fall into two categories:
1) Quantitative benefits – Energy savings, financial savings and carbon savings
2) Qualitative benefits – Fire safety, acoustic performance, moisture management and
mechanical ventilation effectiveness
The BCR calculated in this report accounts for the quantitative benefits and the qualitative
benefits are an additional bonus.
2 THE NEED FOR IMPROVED HOUSING ENVELOPE INTEGRITY The main need for a performance based measure within the building code is that the air
control function of the building envelope plays a vital role in achieving energy efficient
outcomes in all climates including cool climates, tropical climates and everything in between.
Air control is also essential to the moisture balance of residential and commercial buildings
particularly in tropical climates with high outdoor relative humidity or climates with very cool
exterior conditions. International literature identifies adverse effects of condensation and
mould when moisture laden air is not effectively controlled through the building envelope in
cold and tropical climates. Effective performance based measures for quantifying the air
leakage across the building envelope need to be made available to allow design professionals
to carry out moisture balance calculations for optimising the heat, air and moisture
relationships which occur in building envelopes, this can then be validated post construction
to deliver the design intent and building code objectives.
The ability to reduce the amount of air that infiltrates into buildings can help mitigate peak
load spikes on heating and air conditioning systems allowing them to maintain temperature
control in cold snaps and heat waves. If adopted on a wide scale adequately sealed buildings
can help to reduce the peak load of the energy grid in both winter and summer.
It is well documented worldwide that reducing the amount of infiltration air into building will
reduce both the heating and cooling loads. In the current Australian Building Code for
compliance with 3.12 energy provisions for residential buildings air infiltration is addressed as
Acceptable Construction Practice with reference to specific air leakage paths through
Improving Australian Housing Envelope Integrity | October 2016
Page 21 of 144
chimneys, flues, roof lights, windows, doors, exhaust fans, evaporative coolers, roof
construction, wall construction and floor construction.
For all the leakage paths mentioned above the building code refers to each device or
construction to have a “seal”, be “sealed”, have a “self-closing damper” or “constructed to
minimise air leakage.” The quality of the devices installed is not quantified or specified with a
performance benchmark. Analysis outlined in the report identifies the difference between
compliance calculations and the as-built air infiltration performance varies considerably due
to specific design decisions, product selections and construction methods.
The infiltration rate according to the fan pressurisation technique (AS/NZS ISO 9972) is
measured at an indoor to outdoor reference pressure difference of 50 Pascals. The number of
times the total volume of air in the house is swapped per hour under pressure is measured
and recorded. This is known as an air change rate and is normally notated at the test pressure
as ACH50.
For the purpose of energy calculations in this analysis a rule-of-thumb conversion of air
changes @ 50Pa (ACH50) to annual average air changes per hour (ACH-1) was calculated using
the approach attributed to Kronvall & Persily (Sherman M. , The Use of Blower Door Data,
1998). This identifies the air annual average infiltration (ACH-1) to be equal to the ACH50
divided by 20. Further discussion of the applicability of this to Australian conditions is outlined
in Appendix A.
2.1 Practical Implementation of air sealing
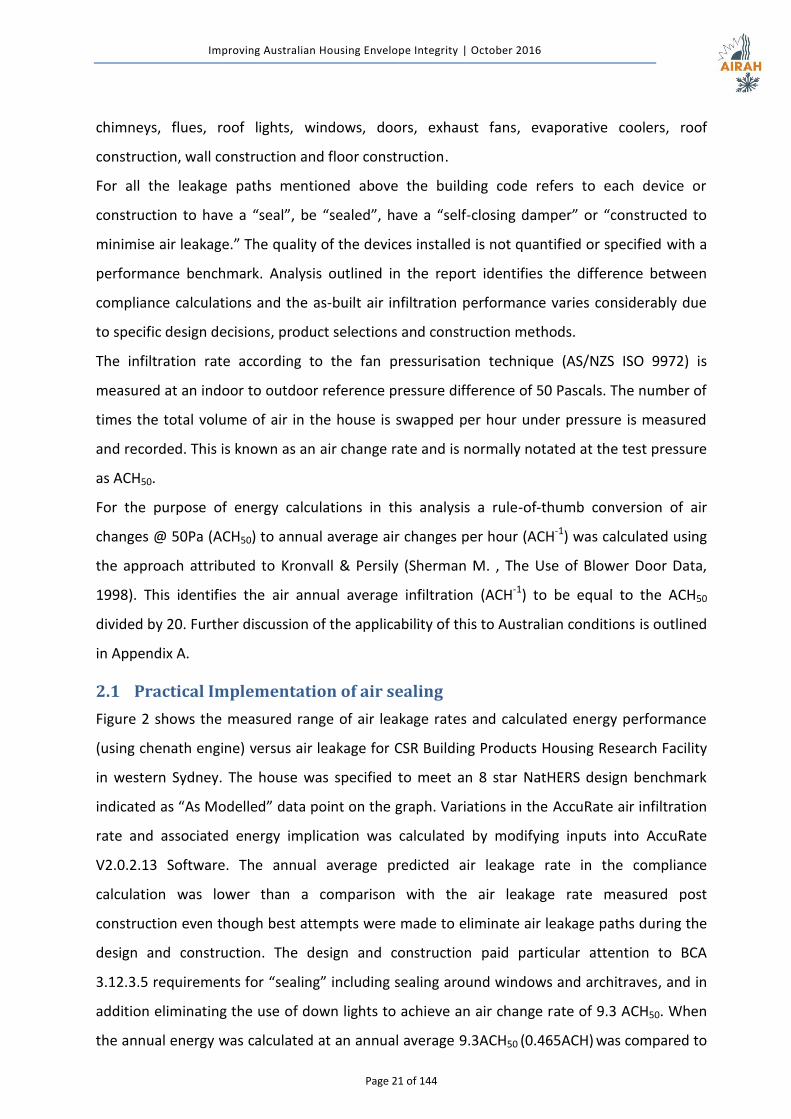
Figure 2 shows the measured range of air leakage rates and calculated energy performance
(using chenath engine) versus air leakage for CSR Building Products Housing Research Facility
in western Sydney. The house was specified to meet an 8 star NatHERS design benchmark
indicated as “As Modelled” data point on the graph. Variations in the AccuRate air infiltration
rate and associated energy implication was calculated by modifying inputs into AccuRate
V2.0.2.13 Software. The annual average predicted air leakage rate in the compliance
calculation was lower than a comparison with the air leakage rate measured post
construction even though best attempts were made to eliminate air leakage paths during the
design and construction. The design and construction paid particular attention to BCA
3.12.3.5 requirements for “sealing” including sealing around windows and architraves, and in
addition eliminating the use of down lights to achieve an air change rate of 9.3 ACH50. When
the annual energy was calculated at an annual average 9.3ACH50 (0.465ACH) was compared to
Improving Australian Housing Envelope Integrity | October 2016
Page 22 of 144
compliance calculations which assumed annual average of 4.36 ACH50 (0.218ACH) the
compliance calculations estimated 25% less heating and 7% less cooling and The Housing
Research Facility effectively achieved 0.6 stars less than the compliance calculation when
adjusted for the measured air leakage.
In 2014 a study commissioned by the department of industry, “The NatHERS benchmark
study” (Floyd, February 2014) resulted in modifications to the software to restrict user inputs
for air leakage sites around windows to “medium gaps” for compliance calculations as is now
incorporated into AccuRate V2.3.3.13. This effectively limits The Housing Research Facility
model to an average annual air leakage rate equivalent to 7ACH50. Post construction
improvements to The Housing Research Facility allowed a result of 6.5 ACH50 to be achieved
aligning to NatHERS compliance calculation assumptions, BCA 3.12.3 and actual achieved
performance.
Appendix B outlines the general air sealing requirements used in The Housing Research
Facility to achieve below 10 ACH50 and would be typical of methods required for project
homes to achieve this level of performance. This is one example that shows that air sealing to
a “Fair” level of 10 ACH50 is easily achievable with standard Australian construction practice.
Figure 2 Effect of poor air sealing on heating and cooling loads (NatHERS 28)
Improving Australian Housing Envelope Integrity | October 2016
Page 23 of 144
2.2 Recent Research – A snapshot of Australia
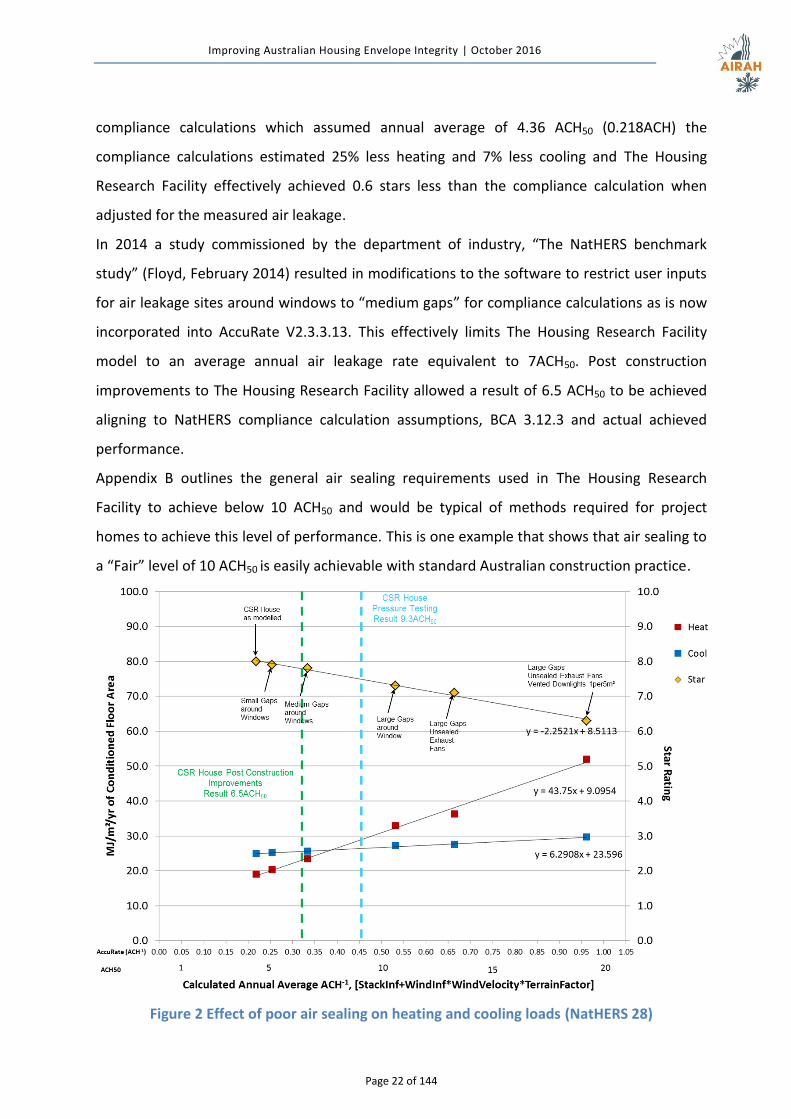
A recent study into the air leakage rates of Australian houses (Ambrose & Syme, 2015)
incorporated testing of 129 houses nationally with approximately 20 houses from each capital
city. The houses in most cities were up to 3 years old and insulation and glazing assumed to
be specified to a 6 star level under the Nationwide House Energy Rating Scheme (NatHERS).
The Melbourne houses were an older data set up to 10 years old and of 4 and 5 star standard.
The overall national results (Figure 3) indicate that many Australian houses have far higher
infiltration rates than would be reasonable expected by adopting BCA Volume 2 acceptable
construction practice in section 3.12.3.
CSIRO recommended a building code target of value of 10 ACH50 (Ambrose & Syme, 2015)
which would effectively bring 65% of houses tested to a “Fair” level of performance (Reardon,
2013). Figure 3 green bars indicate the 35% of tested houses which achieve a “Fair” level of
performance. The research conducted at The Housing Research Facility also suggests this is a
realistic and achievable target as shown in Figure 2 blue dotted line achieved (9.3ACH50) with
low cost implications to industry when practices such as those outlined in Appendix B are
adopted.
Figure 3 Distribution of pressure testing results, ACH50 (CSIRO 2015)
Improving Australian Housing Envelope Integrity | October 2016
Page 24 of 144
2.3 Options for addressing air leakage
To address excessive air leakage issues standardised test procedures would either need to be
developed for all individual products that are identified as points of air leakage according to
section J3 and 3.12.3 in the building code, or alternatively AS/NZS ISO 9972 provides a
performance based test allowing any combination of product selection and build techniques
to achieve a performance based envelope integrity after completion of the project. To test
individual leakage points to drive better air sealing would require standards for air leakage
rates of all individual building products and assemblies as identified in the BCA and outlined
below:
1. chimney and flues products,
2. roof light products,
3. window and door products,
4. exhaust fan products,
5. evaporative coolers.
The process of individual product compliance becomes overly onerous for suppliers, very
complex for compliance checks, costly, and difficult for building certifiers to check. In addition
individual product compliance does not verify the workmanship in which was used to install
these products and how well they are set into the structural components or linings.
The quality of the building envelope and its ability to control air transfer can only be
effectively verified by post construction testing techniques. Specifically the items in section
3.12.3.5 for the construction quality of roofs, walls, floors can only effectively be addressed by
post construction testing. AS/NZS ISO 9972 provides the ability for industry to verify the
quality of air sealing techniques and allow industry learning to address the excessive air
leakage issues undermining building performance and delivering the objectives of the building
code.
Through public consultation process during the adoption of AS/NZS ISO 9972 industry agreed
this standard test procedure will allow repeatable testing results and allow designers to
specify testing for the validation of air infiltration performance of their buildings. This will
allow buildings to realise the full potential of their designed energy efficiency measures and
provide verification of system designs which can mitigate moisture related issues, such as
mould, rot and mildew.
Improving Australian Housing Envelope Integrity | October 2016
Page 25 of 144
2.4 Industry Learning
As building energy efficiency regulations increase the diligence in construction method and
design decisions surrounding the selection of sealing products will improve. Exhaust fans and
roof lights which potentially transfer air across the building envelope as well as services which
penetrate plasterboard linings and/or pliable building membranes at places such as around
light fittings, wall sockets and plumbing will all contribute to increased air infiltration and
exfiltration. Research suggests poor selection of these products leads to a disparity between
the claimed performance and actual operational performance with poor long term financial
outcomes for consumers. This is often referred to as the “performance gap” which is the
disparity between the planned outcomes and real outcomes. The poor selection of air sealing
products along with uncontrolled installation methods of these products can undermine the
intended performance of insulation and windows in which the regulatory energy efficiency
benchmarks are focussed. Validation through whole building testing of the infiltration
performance can be used as a strong indicator of the collective effectiveness of all air control
products, systems and construction methods in limiting wastage of conditioned air providing
large financial benefits to consumers and a net positive impact for Australia.
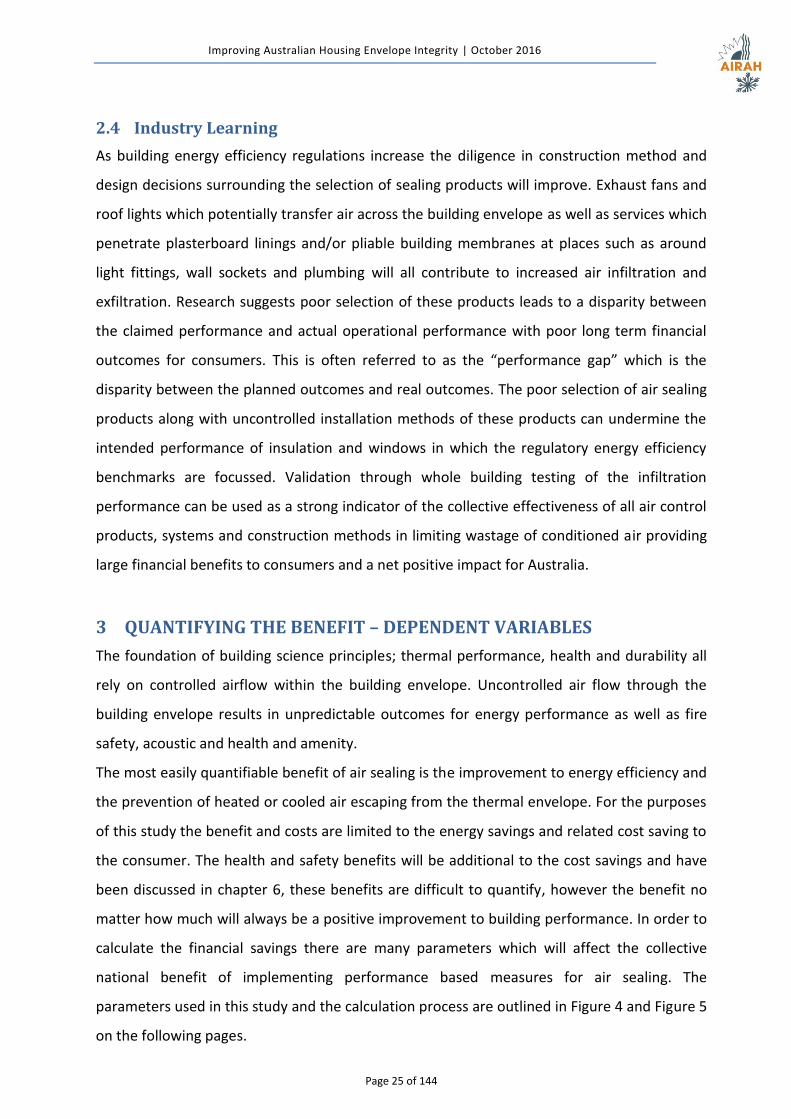
3 QUANTIFYING THE BENEFIT – DEPENDENT VARIABLES
The foundation of building science principles; thermal performance, health and durability all
rely on controlled airflow within the building envelope. Uncontrolled air flow through the
building envelope results in unpredictable outcomes for energy performance as well as fire
safety, acoustic and health and amenity.
The most easily quantifiable benefit of air sealing is the improvement to energy efficiency and
the prevention of heated or cooled air escaping from the thermal envelope. For the purposes
of this study the benefit and costs are limited to the energy savings and related cost saving to
the consumer. The health and safety benefits will be additional to the cost savings and have
been discussed in chapter 6, these benefits are difficult to quantify, however the benefit no
matter how much will always be a positive improvement to building performance. In order to
calculate the financial savings there are many parameters which will affect the collective
national benefit of implementing performance based measures for air sealing. The
parameters used in this study and the calculation process are outlined in Figure 4 and Figure 5
on the following pages.
Improving Australian Housing Envelope Integrity | October 2016
Page 26 of 144
Due to lack of data on current practice and air sealing performance in the Northern Territory no benefit could be calculated and is therefore excluded from the benefit calculations.
Figure 4 Input parameters for economic benefit calculation
4 National Economic Benefit 25 year period @ 7% discount rate, 25 year period @ 5% discount rate,
and
25 year period @ 3.5 % discount rate
3.1 NatHERS Climate
data for 69 zones
3.2 Housing Approval
Data 2015 (ABS, 2015)
3.3 Australian housing air sealing data
(CSIRO,2015)
3.4 Wall type
statistics
(BIS Shrapnel, 2011)
3.5 Heating and Cooling
System types
(ABS 2014)
3.6 Heating and cooling appliances efficiency
(MEPS, 2016)
3.7 Predictions
of gas prices
(Grattan, 2014)
3.7 Predictions of electricty
prices
(AEMO, 2014)
3.8 NPV Discount
rate
@ 7%, 5% and 3.5% (IPCC)
3.9.1
House Types
1) Single storey
2) double storey
3.9.2 Simulations
for 6 star
(air sealing -
BCA 3.12.4)
3.9.3 Simulations with 10, 15, 20, 25, 30
and 35 ACH50
National annual energy load saving calculation
Energy load calculation
Fuel consumption calculation
NPV calculation
Input variables into the benefit calculations for air sealing of
residential homes in Australia as outlined in this report
Improving Australian Housing Envelope Integrity | October 2016
Page 27 of 144
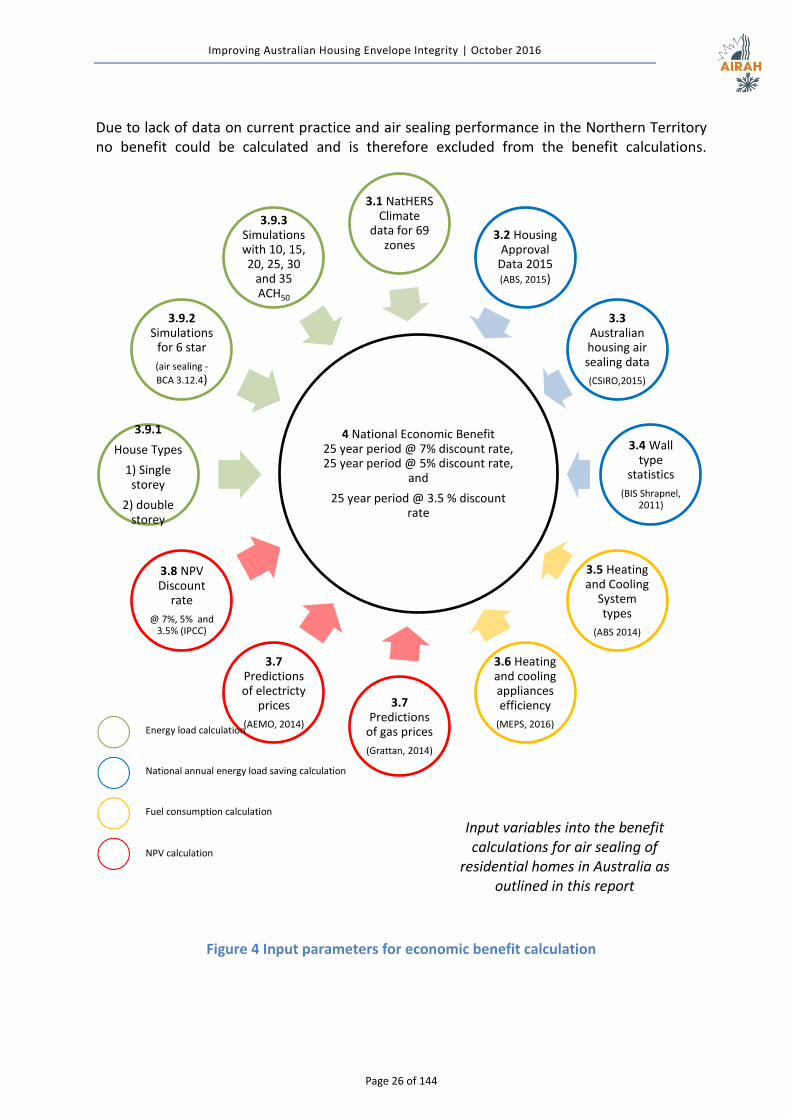
Figure 5 NPV calculation process
Energy Load
• Two house designs specified and simulated at 6 stars in each of the 69 NatHERS climate zones for brick veneer, lightweight cladding and cavity brick construction types
• Each 6 star compliance option was run with modified air change rates at 10,15, 20 , 25, 30 and 35 ACH50
• Total 2,484 simulations
• MJ/yr was determined for each of the 2,484 simulations
National Energy Load Saving
• Household Energy Load Saving 𝐸𝐿𝑠𝑎𝑣𝑖𝑛𝑔 = 𝐸𝐿𝑥ACH50
− 𝐸𝐿10ACH50
• Household Energy Load saving was multiplied according to the number of houses and the proportioned according to the construction type in each climate zone
• The average between the two house types was used in this analysis
Fuel Cosumption
• The statistics for the heating and cooling system types were used to proportion the national Energy Load saving to the associated fuel type
• Average heating and cooling system efficiencies were used to convert the Energy Load Savings to gas and electricity savings
NPV Calculation
• Future savings are returned to home occupiers as gas and electricity usage redcutions
• the future $ savings were calcuated using: - Future gas price predictions - Future electricity price predictions
Improving Australian Housing Envelope Integrity | October 2016
Page 28 of 144
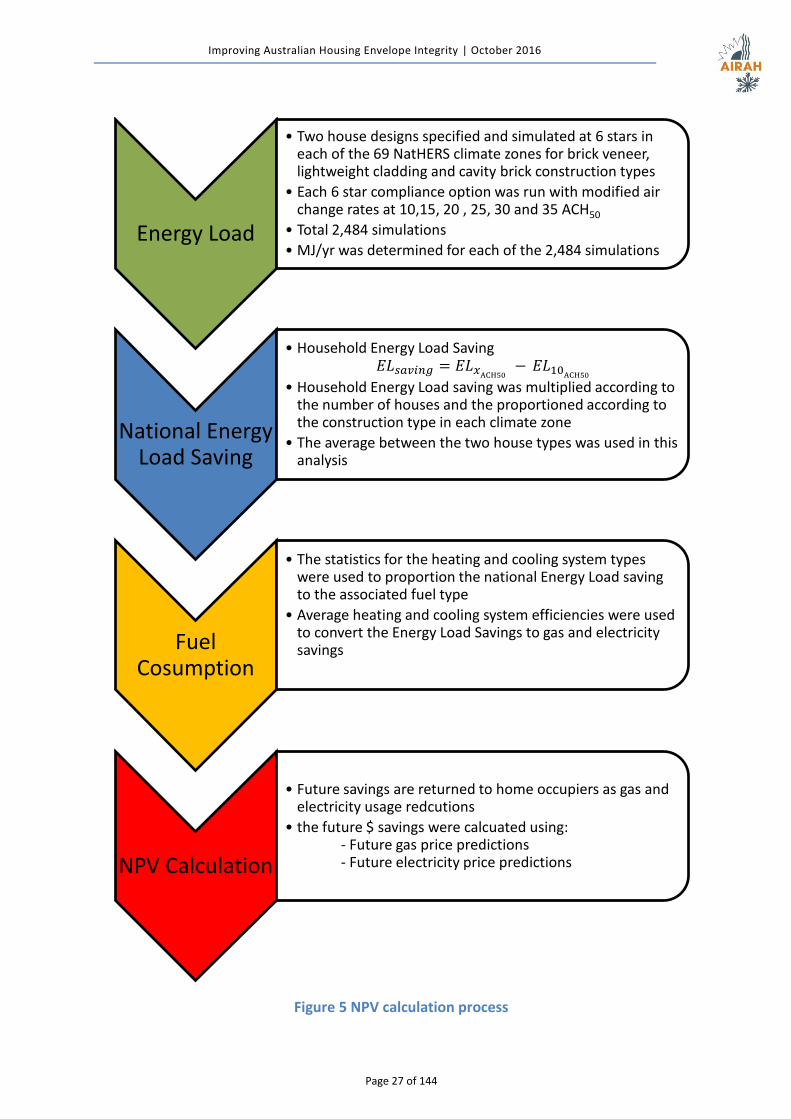
Figure 6 Housing Approvals by NatHERS Climate Zone, ABS 2015
Improving Australian Housing Envelope Integrity | October 2016
Page 29 of 144
3.1 Climate
Australia has one of the largest climate variations in the world ranging from tropical to alpine
which will have vastly different benefits to mild climatic conditions in benign climates such as
Brisbane. For the purpose of the benefit calculation the NatHERS climate data set for 69 zones
across Australia has been utilised.
3.2 Housing Activity by Climate Region
Climate will determine the benefit to energy savings on an individual house scale. In order to
quantify this on a national scale the number of houses built in each climate zone will have a
large influence on the overall benefit achieved by a code based requirement.
The majority of houses are being built in and around the major centres of Sydney, Melbourne,
Brisbane, Adelaide and Perth as shown in figure 6 (ABS Housing Approval Data, 2015).
3.3 Current Building Practice
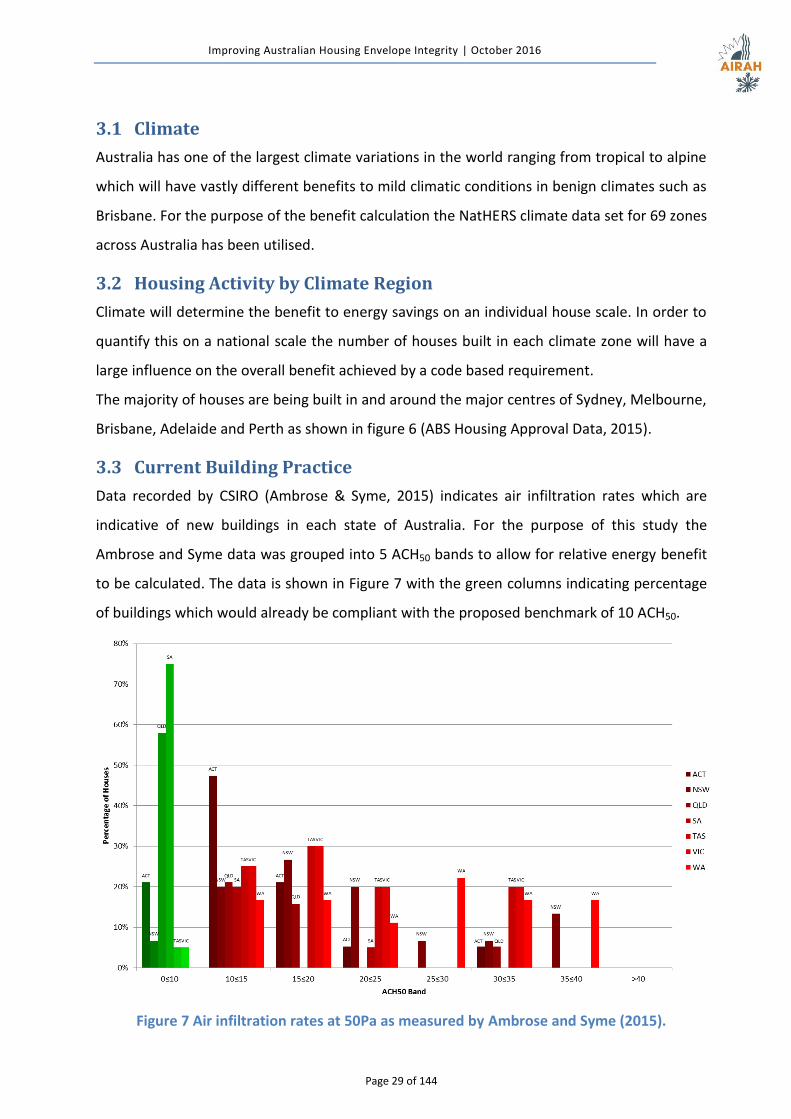
Data recorded by CSIRO (Ambrose & Syme, 2015) indicates air infiltration rates which are
indicative of new buildings in each state of Australia. For the purpose of this study the
Ambrose and Syme data was grouped into 5 ACH50 bands to allow for relative energy benefit
to be calculated. The data is shown in Figure 7 with the green columns indicating percentage
of buildings which would already be compliant with the proposed benchmark of 10 ACH50.
Figure 7 Air infiltration rates at 50Pa as measured by Ambrose and Syme (2015).
Improving Australian Housing Envelope Integrity | October 2016
Page 30 of 144
The data in Figure 7 shows that South Australia has 75% of houses below 10 ACH50 and
Tasmania 79% below 10 ACH50. Ambrose and Syme gave some explanation for this unusually
good performance of buildings in both Hobart and Adelaide which was attributed to:
significant proportion of the Hobart houses were architect designed with the specific
intent of being tightly sealed, including the overall top performing house, which
recorded a result of 1.4 ACH@50Pa and had the specific objective of aiming for the
PassivHaus standard of 0.6 ACH@50Pa.
Adelaide cohort was more specialist houses and greater care and attention was paid
to the build quality of the houses.
Since the release of the report in December 2015 further discussions with the author Michael
Ambrose indicated that
“Hobart houses were middle to high spec architectural homes often with specific air
tightness goals identified and many had high performance European style uPVC or
timber windows incorporating effective gasket systems.” (Ambrose M. , 2016)
It is recommended that further investigations in to the infiltration rates in Tasmanian and
South Australian Homes is further investigated to either validate or disprove the superior air
infiltration performance of homes in these states as it may result in an actual benefit larger
than calculated in this study.
The air infiltration rates used in the calculation of this benefit analysis utilises CSIRO data for
all states (Excluding Northern Territory) as represented in Figure 7.
3.4 State Based Construction Methods
The ability of a house to remain comfortable with high or low infiltration rates can be greatly
affected by the climate as well as the amount of thermal mass and energy stored within the
envelope itself. For the purpose of this report; brick veneer, cavity brick and lightweight
construction types were considered in the benefit calculation.
The regulatory software utilised in the Nationwide House Energy Rating Scheme (NatHERS)
takes into account both the thermal conductance of building materials as well as the heat
capacitance of materials used in buildings and their effect on the heating and cooling loads
within a home. AccuRate Software was developed by CSIRO for the purpose of balancing
these material attributes with floor plan layout and the designed form of a building.
In order to assess the effect of the construction type in relation to the air sealing of any given
Improving Australian Housing Envelope Integrity | October 2016
Page 31 of 144
dwelling AccuRate Sustainability V2.3.3.13 was used to simulate different houses with three
different wall construction types tuned to a benchmark level of 6 stars as per the National
Construction Code.
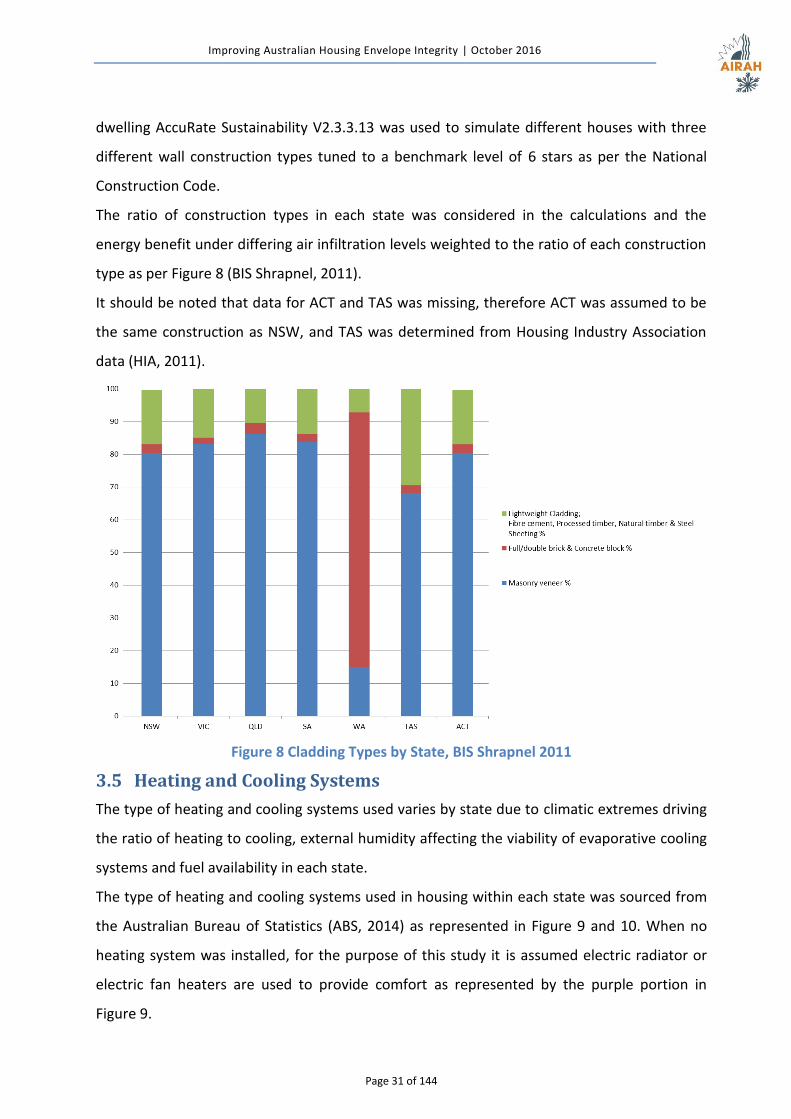
The ratio of construction types in each state was considered in the calculations and the
energy benefit under differing air infiltration levels weighted to the ratio of each construction
type as per Figure 8 (BIS Shrapnel, 2011).
It should be noted that data for ACT and TAS was missing, therefore ACT was assumed to be
the same construction as NSW, and TAS was determined from Housing Industry Association
data (HIA, 2011).
Figure 8 Cladding Types by State, BIS Shrapnel 2011
3.5 Heating and Cooling Systems
The type of heating and cooling systems used varies by state due to climatic extremes driving
the ratio of heating to cooling, external humidity affecting the viability of evaporative cooling
systems and fuel availability in each state.
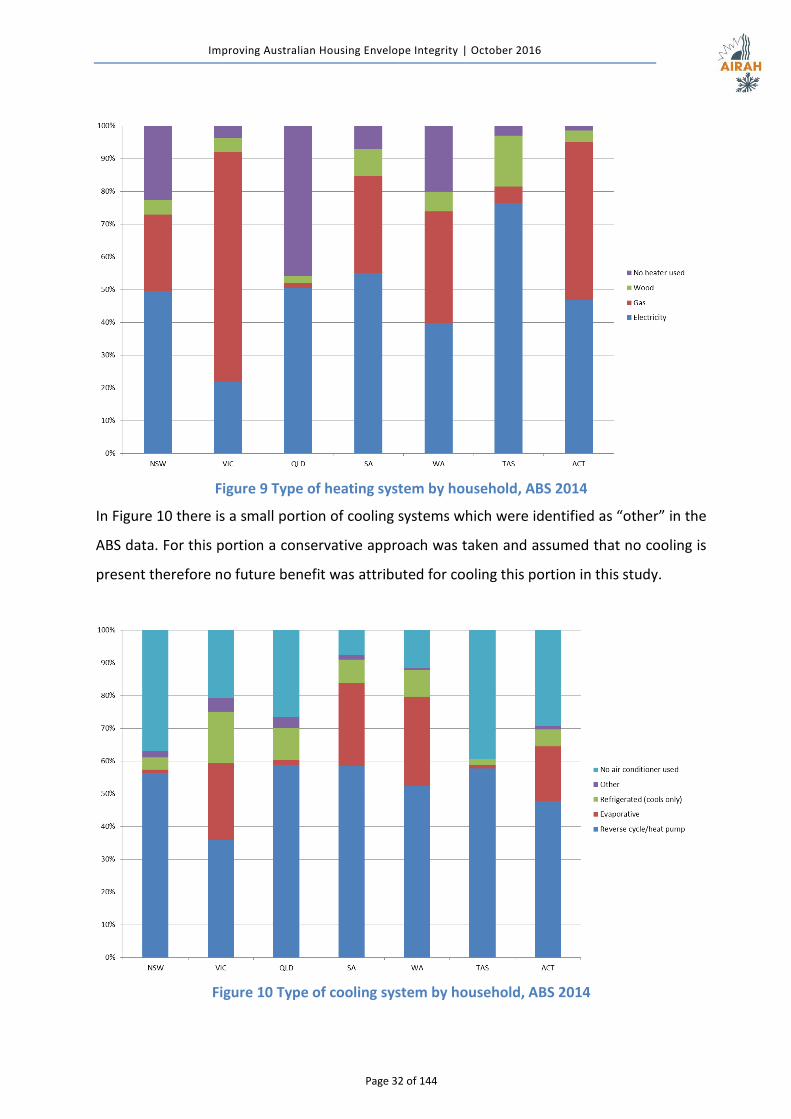
The type of heating and cooling systems used in housing within each state was sourced from
the Australian Bureau of Statistics (ABS, 2014) as represented in Figure 9 and 10. When no
heating system was installed, for the purpose of this study it is assumed electric radiator or
electric fan heaters are used to provide comfort as represented by the purple portion in
Figure 9.
Improving Australian Housing Envelope Integrity | October 2016
Page 32 of 144
Figure 9 Type of heating system by household, ABS 2014
In Figure 10 there is a small portion of cooling systems which were identified as “other” in the
ABS data. For this portion a conservative approach was taken and assumed that no cooling is
present therefore no future benefit was attributed for cooling this portion in this study.
Figure 10 Type of cooling system by household, ABS 2014
Improving Australian Housing Envelope Integrity | October 2016
Page 33 of 144
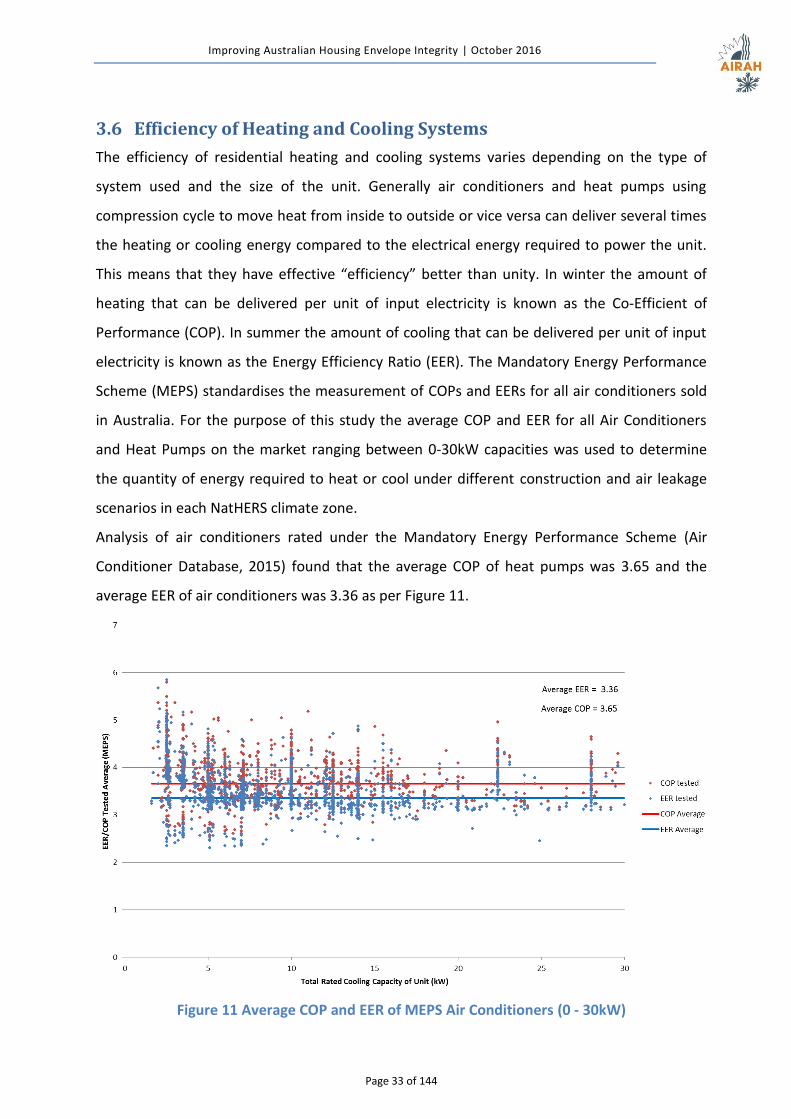
3.6 Efficiency of Heating and Cooling Systems
The efficiency of residential heating and cooling systems varies depending on the type of
system used and the size of the unit. Generally air conditioners and heat pumps using
compression cycle to move heat from inside to outside or vice versa can deliver several times
the heating or cooling energy compared to the electrical energy required to power the unit.
This means that they have effective “efficiency” better than unity. In winter the amount of
heating that can be delivered per unit of input electricity is known as the Co-Efficient of
Performance (COP). In summer the amount of cooling that can be delivered per unit of input
electricity is known as the Energy Efficiency Ratio (EER). The Mandatory Energy Performance
Scheme (MEPS) standardises the measurement of COPs and EERs for all air conditioners sold
in Australia. For the purpose of this study the average COP and EER for all Air Conditioners
and Heat Pumps on the market ranging between 0-30kW capacities was used to determine
the quantity of energy required to heat or cool under different construction and air leakage
scenarios in each NatHERS climate zone.
Analysis of air conditioners rated under the Mandatory Energy Performance Scheme (Air
Conditioner Database, 2015) found that the average COP of heat pumps was 3.65 and the
average EER of air conditioners was 3.36 as per Figure 11.
Figure 11 Average COP and EER of MEPS Air Conditioners (0 - 30kW)
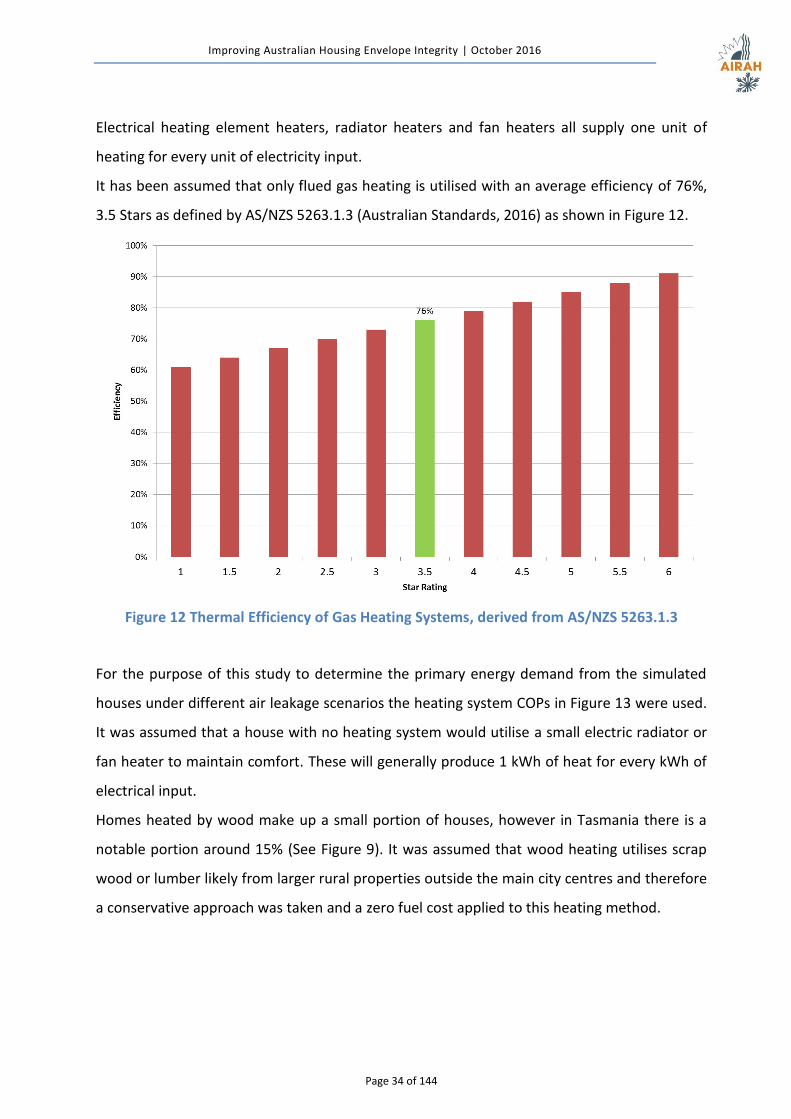
Improving Australian Housing Envelope Integrity | October 2016
Page 34 of 144
Electrical heating element heaters, radiator heaters and fan heaters all supply one unit of
heating for every unit of electricity input.
It has been assumed that only flued gas heating is utilised with an average efficiency of 76%,
3.5 Stars as defined by AS/NZS 5263.1.3 (Australian Standards, 2016) as shown in Figure 12.
Figure 12 Thermal Efficiency of Gas Heating Systems, derived from AS/NZS 5263.1.3
For the purpose of this study to determine the primary energy demand from the simulated
houses under different air leakage scenarios the heating system COPs in Figure 13 were used.
It was assumed that a house with no heating system would utilise a small electric radiator or
fan heater to maintain comfort. These will generally produce 1 kWh of heat for every kWh of
electrical input.
Homes heated by wood make up a small portion of houses, however in Tasmania there is a
notable portion around 15% (See Figure 9). It was assumed that wood heating utilises scrap
wood or lumber likely from larger rural properties outside the main city centres and therefore
a conservative approach was taken and a zero fuel cost applied to this heating method.

Improving Australian Housing Envelope Integrity | October 2016
Page 35 of 144
Figure 13 Co-Efficient of Performance (COP) of Heating Systems
In Australia cooling homes is generally achieved by use of compression cycle air conditioners.
An EER of 3.36 for air conditioners was used in this study. This was based on the average
performance of all reverse cycle and refrigeration only units (0-30kW) which make up the
majority of residential cooling systems throughout Australia (See Figure 11).
According to 2014 ABS data in Figure 10, there is a significant portion of houses that utilise
evaporative air conditioners in the hotter drier parts of Australia including South Australia,
Western Australia, Victoria and Australian Capital Territory. The building code does not
prescribe air sealing provisions to houses that utilise evaporative air conditioners as they can
potentially add large amounts of moisture to the interior of the house which may result in
adverse health outcomes for occupants in well-sealed homes. For the purposes of this study a
conservative approach was taken and this portion of houses with evaporative air conditioners
were excluded from the benefit calculations, assuming air sealing would not be carried out for
this reason and therefore no benefit attributed.
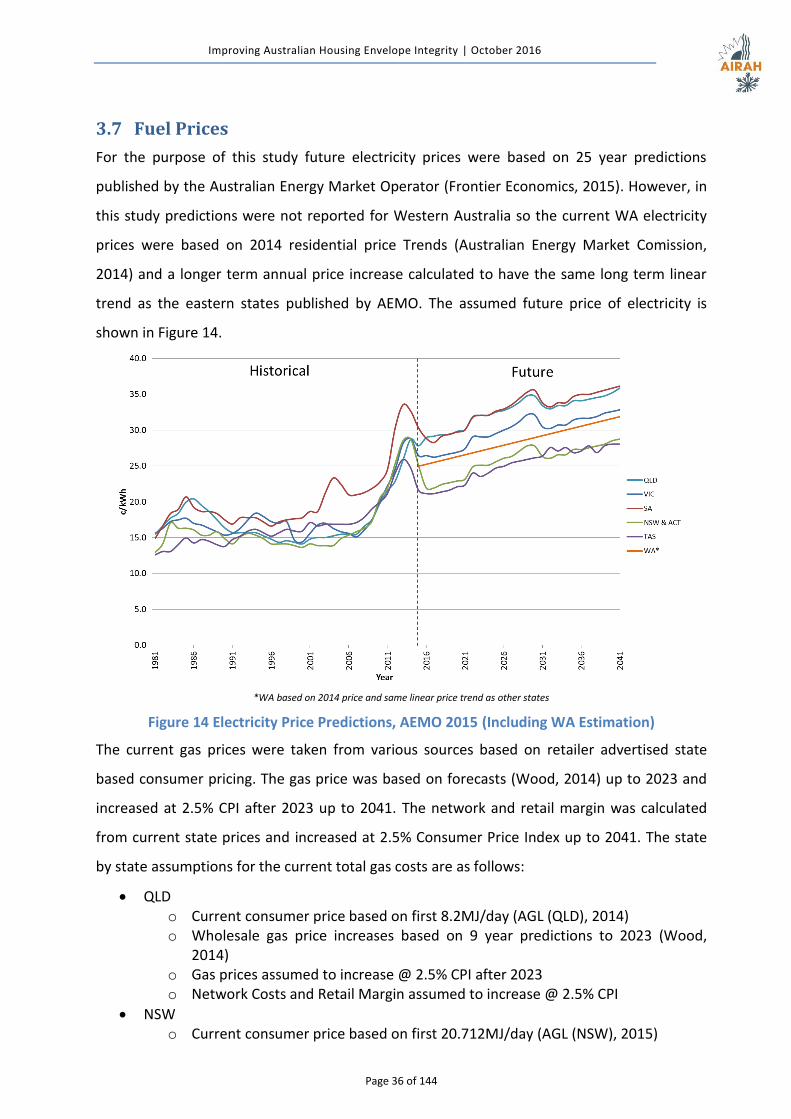
Improving Australian Housing Envelope Integrity | October 2016
Page 36 of 144
3.7 Fuel Prices
For the purpose of this study future electricity prices were based on 25 year predictions
published by the Australian Energy Market Operator (Frontier Economics, 2015). However, in
this study predictions were not reported for Western Australia so the current WA electricity
prices were based on 2014 residential price Trends (Australian Energy Market Comission,
2014) and a longer term annual price increase calculated to have the same long term linear
trend as the eastern states published by AEMO. The assumed future price of electricity is
shown in Figure 14.
*WA based on 2014 price and same linear price trend as other states
Figure 14 Electricity Price Predictions, AEMO 2015 (Including WA Estimation)
The current gas prices were taken from various sources based on retailer advertised state
based consumer pricing. The gas price was based on forecasts (Wood, 2014) up to 2023 and
increased at 2.5% CPI after 2023 up to 2041. The network and retail margin was calculated
from current state prices and increased at 2.5% Consumer Price Index up to 2041. The state
by state assumptions for the current total gas costs are as follows:
QLD o Current consumer price based on first 8.2MJ/day (AGL (QLD), 2014) o Wholesale gas price increases based on 9 year predictions to 2023 (Wood,
2014) o Gas prices assumed to increase @ 2.5% CPI after 2023 o Network Costs and Retail Margin assumed to increase @ 2.5% CPI
NSW o Current consumer price based on first 20.712MJ/day (AGL (NSW), 2015)
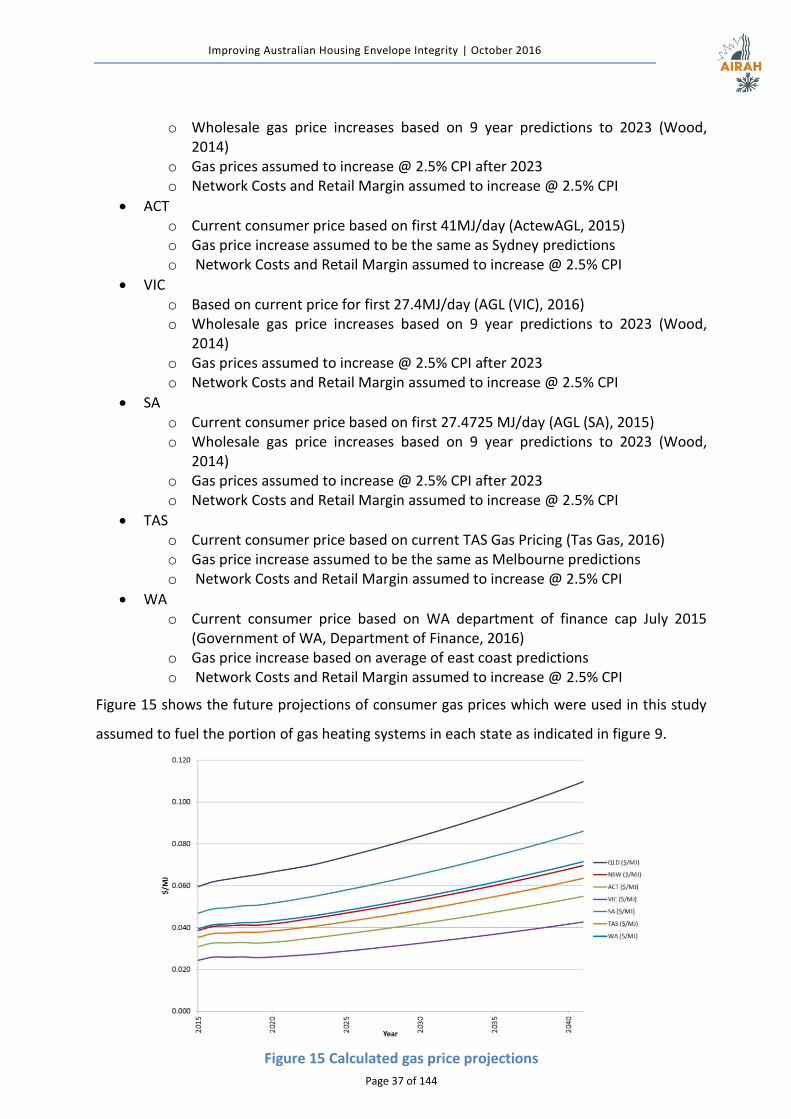
Improving Australian Housing Envelope Integrity | October 2016
Page 37 of 144
o Wholesale gas price increases based on 9 year predictions to 2023 (Wood, 2014)
o Gas prices assumed to increase @ 2.5% CPI after 2023 o Network Costs and Retail Margin assumed to increase @ 2.5% CPI
ACT o Current consumer price based on first 41MJ/day (ActewAGL, 2015) o Gas price increase assumed to be the same as Sydney predictions o Network Costs and Retail Margin assumed to increase @ 2.5% CPI
VIC o Based on current price for first 27.4MJ/day (AGL (VIC), 2016) o Wholesale gas price increases based on 9 year predictions to 2023 (Wood,
2014) o Gas prices assumed to increase @ 2.5% CPI after 2023 o Network Costs and Retail Margin assumed to increase @ 2.5% CPI
SA o Current consumer price based on first 27.4725 MJ/day (AGL (SA), 2015) o Wholesale gas price increases based on 9 year predictions to 2023 (Wood,
2014) o Gas prices assumed to increase @ 2.5% CPI after 2023 o Network Costs and Retail Margin assumed to increase @ 2.5% CPI
TAS o Current consumer price based on current TAS Gas Pricing (Tas Gas, 2016) o Gas price increase assumed to be the same as Melbourne predictions o Network Costs and Retail Margin assumed to increase @ 2.5% CPI
WA o Current consumer price based on WA department of finance cap July 2015
(Government of WA, Department of Finance, 2016) o Gas price increase based on average of east coast predictions o Network Costs and Retail Margin assumed to increase @ 2.5% CPI
Figure 15 shows the future projections of consumer gas prices which were used in this study
assumed to fuel the portion of gas heating systems in each state as indicated in figure 9.
Figure 15 Calculated gas price projections
Improving Australian Housing Envelope Integrity | October 2016
Page 38 of 144
3.8 Present Value of Future Savings
The discount rate used in a Regulatory Impact Assessment (RIA) has a very significant impact
on the value that is placed on benefits accumulated in the future over a long time, which is
exactly the value that post construction air infiltration testing creates. The lower the discount
rate used, the higher the value of future benefits.
For the purpose of this report a discount rate of 5% has been used, and also reports outcomes
at 7% in line with the Office of Best Practice Regulation (OBPR, 2016). The IPCC
(Intergovernmental Panel on Climate Change) recommendation on this point is the following:
“The recommendation here is to use a 3.5% rate for 1-30 years, a 3% rate for 31-75
years, a 2.5 rate for 76-125 years, a 2% rate for 125-200 years, 1.5 for 100-300 years,
and 1% for longer periods” (IPCC, 2007)
The analysis in this report is based on a 25 year future period aligning with the AEMO forecast
period for electricity prices. A 5% discount rate has been applied and results are also reported
with 7% and a 3.5% discount rate in line with IPCC recommendations for a 25 year period.
3.9 House Specifications
The current performance benchmark for residential housing in the National Construction
Code is 6 Stars as calculated under the Nationwide House Energy Rating Scheme. This equates
to a set amount of energy per square metre of floor area and the 6 star allowance varies for
each climate zone in Australia.
The construction materials, insulation levels, window performance and shading to achieve 6
star will all vary on a climate zone basis. The actual energy predictions are also dependent on
the house layout; house design, volume and thermal storage capacity of the materials used
therefore two house designs with three primary construction types were assessed.
Common industry practice is to refer to a star rating as the performance metric therefore in
this section performance is reported and discussed in “stars,” the associated MJ/m²/yr
savings which relate to the star ratings were used in the economic benefit calculations in
section 5.
3.9.1 House Design
Air infiltration will have a major impact on both the heating and cooling requirements of a
building. The actual volume of infiltration and exfiltration air is related to the total volume of
the building. A high ACH50 value in a large dwelling means that the building is leaking an
overall larger volume of air and the energy penalty will be higher as the cubic meters required
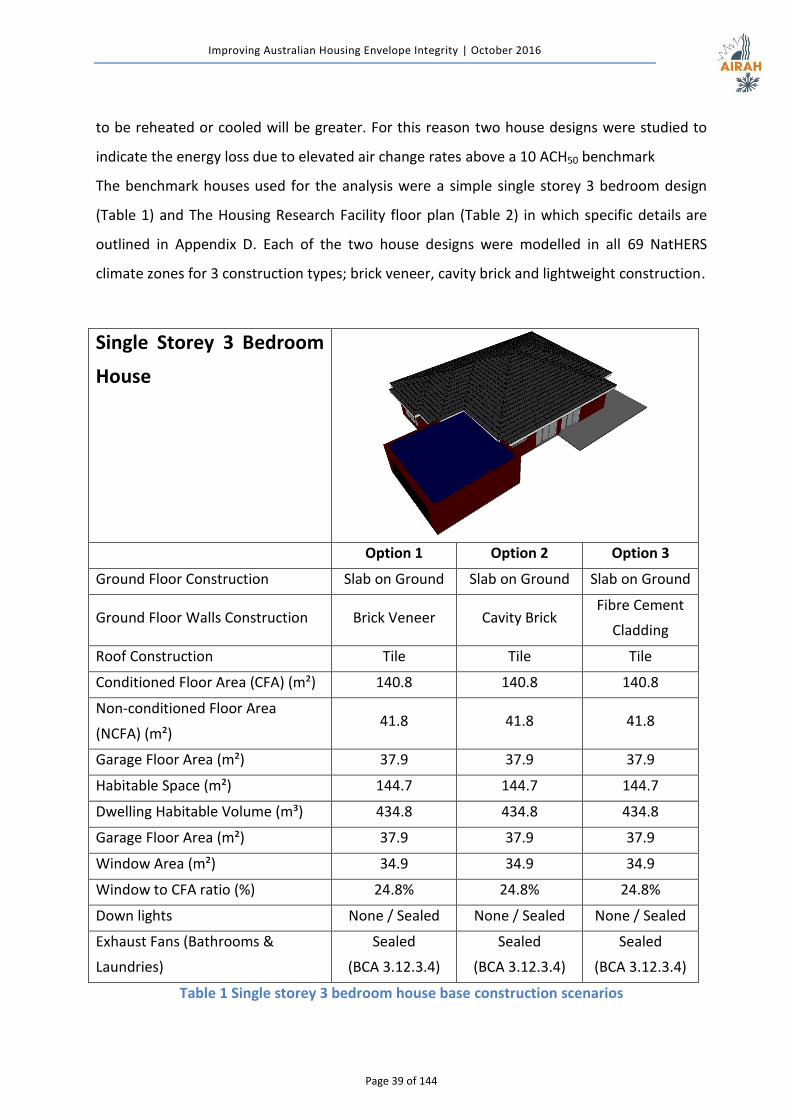
Improving Australian Housing Envelope Integrity | October 2016
Page 39 of 144
to be reheated or cooled will be greater. For this reason two house designs were studied to
indicate the energy loss due to elevated air change rates above a 10 ACH50 benchmark
The benchmark houses used for the analysis were a simple single storey 3 bedroom design
(Table 1) and The Housing Research Facility floor plan (Table 2) in which specific details are
outlined in Appendix D. Each of the two house designs were modelled in all 69 NatHERS
climate zones for 3 construction types; brick veneer, cavity brick and lightweight construction.
Single Storey 3 Bedroom
House
Option 1 Option 2 Option 3
Ground Floor Construction Slab on Ground Slab on Ground Slab on Ground
Ground Floor Walls Construction Brick Veneer Cavity Brick Fibre Cement
Cladding
Roof Construction Tile Tile Tile
Conditioned Floor Area (CFA) (m²) 140.8 140.8 140.8
Non-conditioned Floor Area
(NCFA) (m²) 41.8 41.8 41.8
Garage Floor Area (m²) 37.9 37.9 37.9
Habitable Space (m²) 144.7 144.7 144.7
Dwelling Habitable Volume (m³) 434.8 434.8 434.8
Garage Floor Area (m²) 37.9 37.9 37.9
Window Area (m²) 34.9 34.9 34.9
Window to CFA ratio (%) 24.8% 24.8% 24.8%
Down lights None / Sealed None / Sealed None / Sealed
Exhaust Fans (Bathrooms &
Laundries)
Sealed
(BCA 3.12.3.4)
Sealed
(BCA 3.12.3.4)
Sealed
(BCA 3.12.3.4)
Table 1 Single storey 3 bedroom house base construction scenarios
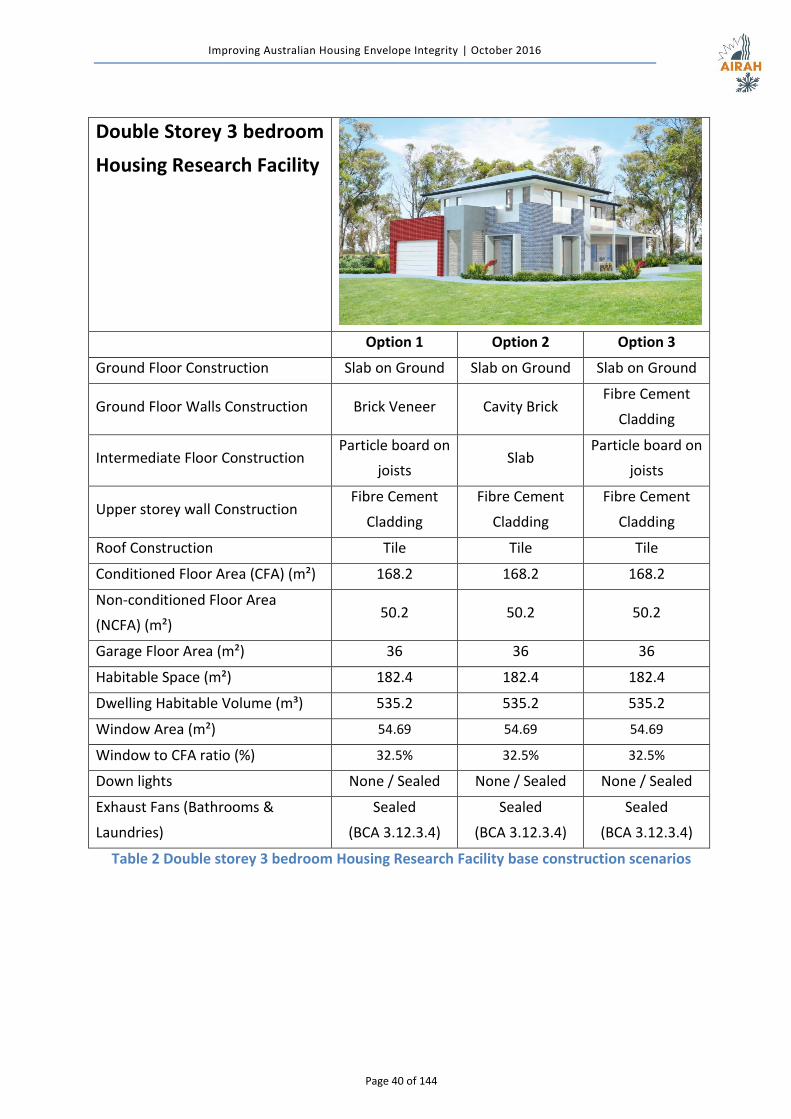
Improving Australian Housing Envelope Integrity | October 2016
Page 40 of 144
Double Storey 3 bedroom
Housing Research Facility
Option 1 Option 2 Option 3
Ground Floor Construction Slab on Ground Slab on Ground Slab on Ground
Ground Floor Walls Construction Brick Veneer Cavity Brick Fibre Cement
Cladding
Intermediate Floor Construction Particle board on
joists Slab
Particle board on
joists
Upper storey wall Construction Fibre Cement
Cladding
Fibre Cement
Cladding
Fibre Cement
Cladding
Roof Construction Tile Tile Tile
Conditioned Floor Area (CFA) (m²) 168.2 168.2 168.2
Non-conditioned Floor Area
(NCFA) (m²) 50.2 50.2 50.2
Garage Floor Area (m²) 36 36 36
Habitable Space (m²) 182.4 182.4 182.4
Dwelling Habitable Volume (m³) 535.2 535.2 535.2
Window Area (m²) 54.69 54.69 54.69
Window to CFA ratio (%) 32.5% 32.5% 32.5%
Down lights None / Sealed None / Sealed None / Sealed
Exhaust Fans (Bathrooms &
Laundries)
Sealed
(BCA 3.12.3.4)
Sealed
(BCA 3.12.3.4)
Sealed
(BCA 3.12.3.4)
Table 2 Double storey 3 bedroom Housing Research Facility base construction scenarios
Improving Australian Housing Envelope Integrity | October 2016
Page 41 of 144
3.9.2 Building Envelope Specifications
The performance of the buildings was based on NatHERS compliant AccuRate simulations to
meet a 6 star performance for all NatHERS climate regions in all states and territories. The 5
variables which were modified to improve heating and cooling energy requirements to the 6
star performance levels included:
1. Ceiling insulation levels,
2. Wall insulation Levels,
3. Roof insulation levels,
4. Window performance specification (U & SHGC),
5. Eave dimensions
All specifications for every simulated scenario are detailed in Appendix E.
The cost effectiveness of the material selections implemented to achieve 6 star NatHERS is
not relevant in the case of this study. The objective was to define the resulting cooling energy
and heating energy requirements at the 6 star performance level. A total of 414 combinations
of house design and specifications were made to derive the house energy load (MJ/m²/yr) for
both heating and cooling for each house type, with each of the 3 different construction types,
with 6 star specifications in each climate region.
The influence of air infiltration on the calculated energy requirement for each of the 414
house specifications was determined at 6 different infiltration rates 10 ACH50 – 35 ACH50 at 5
ACH50 increments to determine the benefit of addressing excessive air infiltration in the
portion of houses above 10 ACH50 identified in figure 7 (Section 3.3).
3.9.3 Air Infiltration Rate
Variations in the air permeability calculations were undertaken to determine the benefit of
improving minimum industry practice to 10 ACH50 from the infiltration rates presented in
Figure 7 in combination with the 6 star material specifications as per Appendix E.
The NatHERS tools currently do not give the user the ability to manually modify the air
infiltration rate within the dwelling under consideration. The calculations within this study
have modified the infiltration rate in the AccuRate simulation files by utilisation of the
Advanced Comfort Index developed by the CRC for Low Carbon Living. This has modified
algorithms which allow adaptations to the standard AccuRate infiltration assumptions by
utilising the concepts and methodology outlined in ‘Infiltration Calculations in AccuRate
V2.0.2.13’ (Chen, 2013).
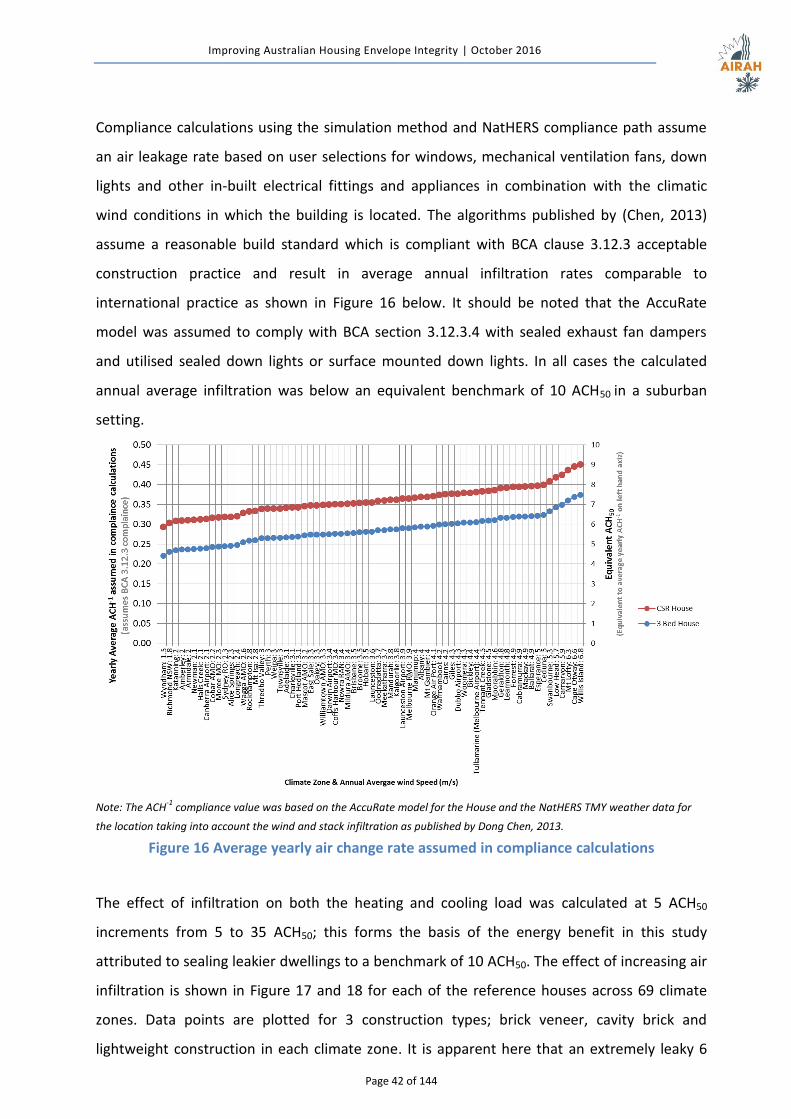
Improving Australian Housing Envelope Integrity | October 2016
Page 42 of 144
Compliance calculations using the simulation method and NatHERS compliance path assume
an air leakage rate based on user selections for windows, mechanical ventilation fans, down
lights and other in-built electrical fittings and appliances in combination with the climatic
wind conditions in which the building is located. The algorithms published by (Chen, 2013)
assume a reasonable build standard which is compliant with BCA clause 3.12.3 acceptable
construction practice and result in average annual infiltration rates comparable to
international practice as shown in Figure 16 below. It should be noted that the AccuRate
model was assumed to comply with BCA section 3.12.3.4 with sealed exhaust fan dampers
and utilised sealed down lights or surface mounted down lights. In all cases the calculated
annual average infiltration was below an equivalent benchmark of 10 ACH50 in a suburban
setting.
Note: The ACH
-1 compliance value was based on the AccuRate model for the House and the NatHERS TMY weather data for
the location taking into account the wind and stack infiltration as published by Dong Chen, 2013.
Figure 16 Average yearly air change rate assumed in compliance calculations
The effect of infiltration on both the heating and cooling load was calculated at 5 ACH50
increments from 5 to 35 ACH50; this forms the basis of the energy benefit in this study
attributed to sealing leakier dwellings to a benchmark of 10 ACH50. The effect of increasing air
infiltration is shown in Figure 17 and 18 for each of the reference houses across 69 climate
zones. Data points are plotted for 3 construction types; brick veneer, cavity brick and
lightweight construction in each climate zone. It is apparent here that an extremely leaky 6
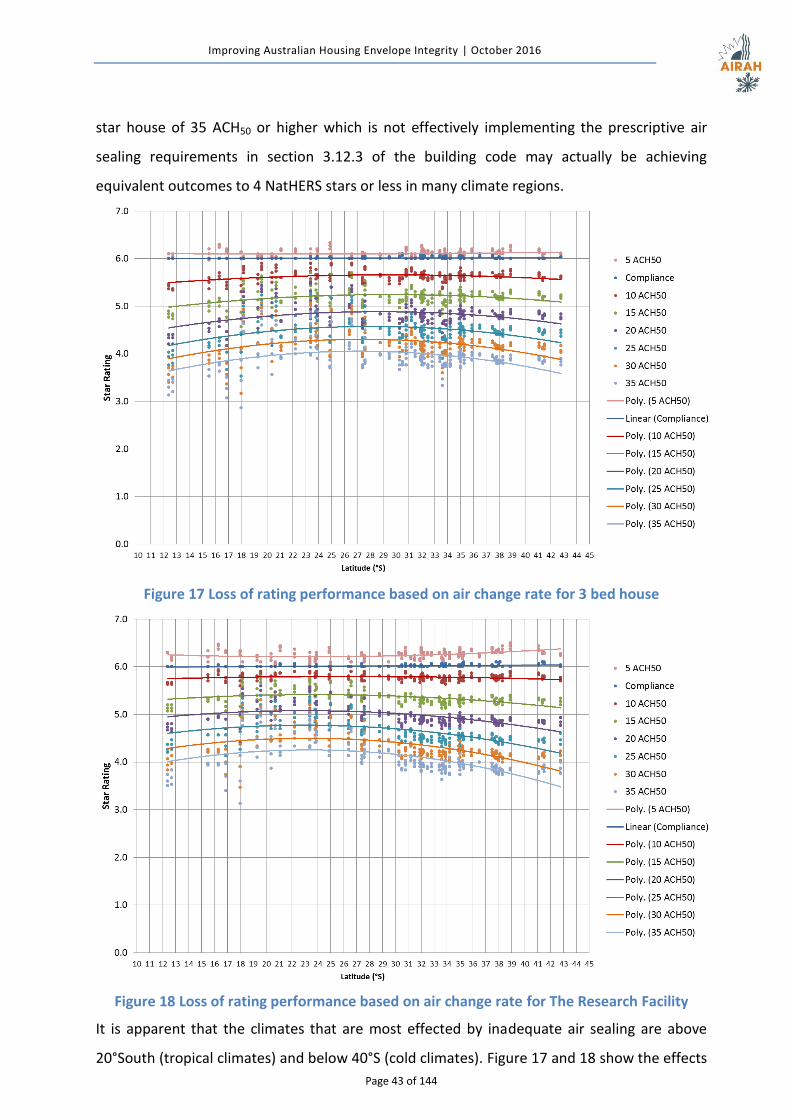
Improving Australian Housing Envelope Integrity | October 2016
Page 43 of 144
star house of 35 ACH50 or higher which is not effectively implementing the prescriptive air
sealing requirements in section 3.12.3 of the building code may actually be achieving
equivalent outcomes to 4 NatHERS stars or less in many climate regions.
Figure 17 Loss of rating performance based on air change rate for 3 bed house
Figure 18 Loss of rating performance based on air change rate for The Research Facility
It is apparent that the climates that are most effected by inadequate air sealing are above
20°South (tropical climates) and below 40°S (cold climates). Figure 17 and 18 show the effects
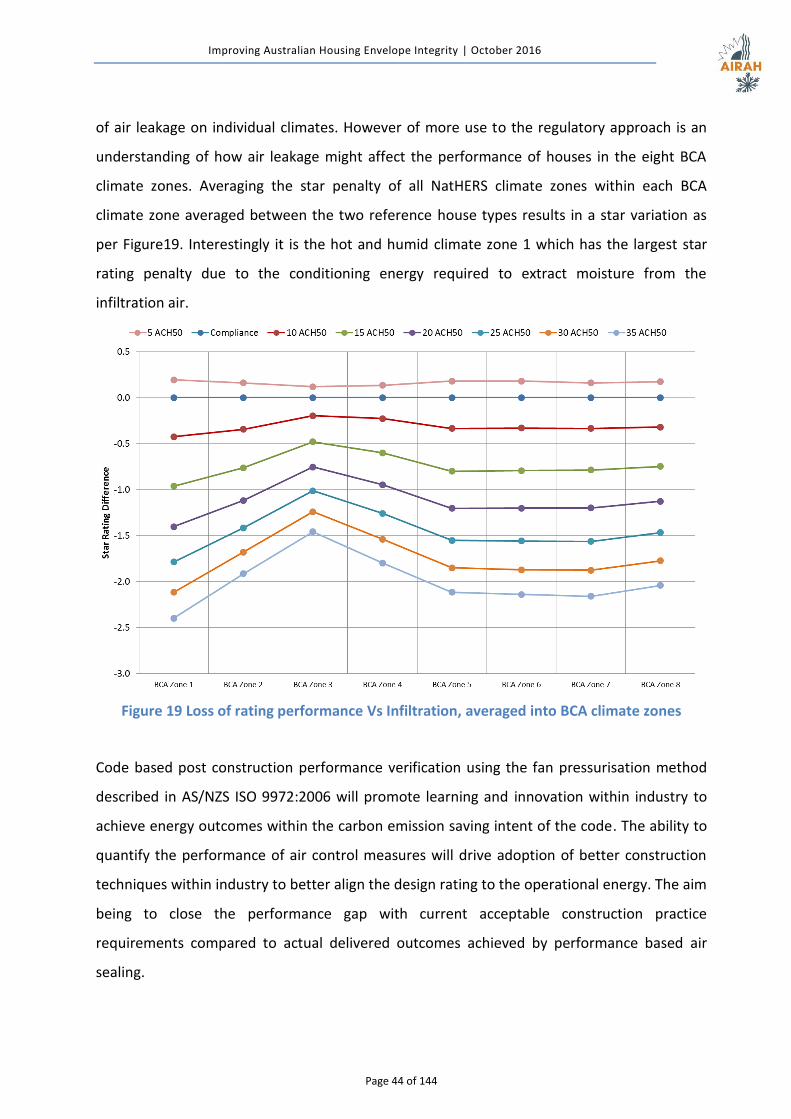
Improving Australian Housing Envelope Integrity | October 2016
Page 44 of 144
of air leakage on individual climates. However of more use to the regulatory approach is an
understanding of how air leakage might affect the performance of houses in the eight BCA
climate zones. Averaging the star penalty of all NatHERS climate zones within each BCA
climate zone averaged between the two reference house types results in a star variation as
per Figure19. Interestingly it is the hot and humid climate zone 1 which has the largest star
rating penalty due to the conditioning energy required to extract moisture from the
infiltration air.
Figure 19 Loss of rating performance Vs Infiltration, averaged into BCA climate zones
Code based post construction performance verification using the fan pressurisation method
described in AS/NZS ISO 9972:2006 will promote learning and innovation within industry to
achieve energy outcomes within the carbon emission saving intent of the code. The ability to
quantify the performance of air control measures will drive adoption of better construction
techniques within industry to better align the design rating to the operational energy. The aim
being to close the performance gap with current acceptable construction practice
requirements compared to actual delivered outcomes achieved by performance based air
sealing.
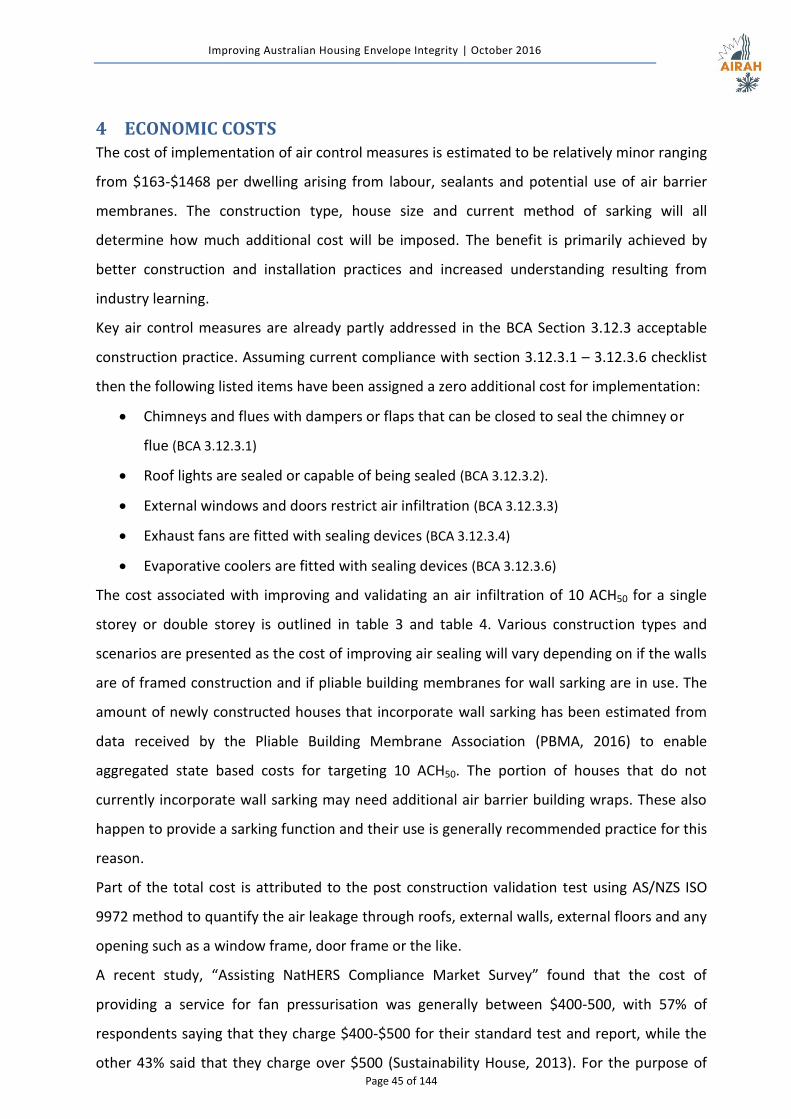
Improving Australian Housing Envelope Integrity | October 2016
Page 45 of 144
4 ECONOMIC COSTS The cost of implementation of air control measures is estimated to be relatively minor ranging
from $163-$1468 per dwelling arising from labour, sealants and potential use of air barrier
membranes. The construction type, house size and current method of sarking will all
determine how much additional cost will be imposed. The benefit is primarily achieved by
better construction and installation practices and increased understanding resulting from
industry learning.
Key air control measures are already partly addressed in the BCA Section 3.12.3 acceptable
construction practice. Assuming current compliance with section 3.12.3.1 – 3.12.3.6 checklist
then the following listed items have been assigned a zero additional cost for implementation:
Chimneys and flues with dampers or flaps that can be closed to seal the chimney or
flue (BCA 3.12.3.1)
Roof lights are sealed or capable of being sealed (BCA 3.12.3.2).
External windows and doors restrict air infiltration (BCA 3.12.3.3)
Exhaust fans are fitted with sealing devices (BCA 3.12.3.4)
Evaporative coolers are fitted with sealing devices (BCA 3.12.3.6)
The cost associated with improving and validating an air infiltration of 10 ACH50 for a single
storey or double storey is outlined in table 3 and table 4. Various construction types and
scenarios are presented as the cost of improving air sealing will vary depending on if the walls
are of framed construction and if pliable building membranes for wall sarking are in use. The
amount of newly constructed houses that incorporate wall sarking has been estimated from
data received by the Pliable Building Membrane Association (PBMA, 2016) to enable
aggregated state based costs for targeting 10 ACH50. The portion of houses that do not
currently incorporate wall sarking may need additional air barrier building wraps. These also
happen to provide a sarking function and their use is generally recommended practice for this
reason.
Part of the total cost is attributed to the post construction validation test using AS/NZS ISO
9972 method to quantify the air leakage through roofs, external walls, external floors and any
opening such as a window frame, door frame or the like.
A recent study, “Assisting NatHERS Compliance Market Survey” found that the cost of
providing a service for fan pressurisation was generally between $400-500, with 57% of
respondents saying that they charge $400-$500 for their standard test and report, while the
other 43% said that they charge over $500 (Sustainability House, 2013). For the purpose of

Improving Australian Housing Envelope Integrity | October 2016
Page 46 of 144
this study $500 fee for service has been utilised in the calculations, justifiable by the
economies of scale, competition and innovation generated by a code requirement.
The other portion of the cost goes into improving air sealing of the envelope. This cost can be
achieved with minor modifications to design and construction practices, focusing on
identifying areas which can be sealed during the construction phase with low cost sealants
and tapes as shown in table 3 and 4. Appendix B outlines low cost opportunities for improving
air sealing as identified by research undertaken at The Housing Research facility on which the
costs in table 3 and 4 were based.
Additional Air Barrier
Required Wall Sarking already used
Cost (Material and Labour) Brick
Veneer Light Weight
Cladding Brick
Veneer Light Weight
Cladding Cavity Brick
Blower door test $500 $500 $500 $500 $500
Window and door reveal seals $163 $163 $163 $163 $163
Bottom plate sealing mastic $186 $186 $186 $186 N/A
Wall Wrap $439 $439 $0 $0 N/A
Taping wrap overlaps and joints
$100 $100 $0 $0 N/A
Dampers on flues for gas fireplaces * (BCA 3.12.3.1)
$0 $0 $0 $0 $0
Adequate weather-stripping of doors and windows * (BCA 3.12.3.3)
$0 $0 $0 $0 $0
Exhaust fans with damper/seal * (BCA 3.12.3.4)
$0 $0 $0 $0 $0
Evaporative cooling systems with damper *(BCA 3.12.3.6)
$0 $0 $0 $0 $0
Ducted heating/cooling systems with continuous ductwork * (BCA 3.12.5.3)
$0 $0 $0 $0 $0
No Cavity sliding doors ** $0 $0 $0 $0 $0
No unsealed downlights ** $0 $0 $0 $0 $0
Total Costs $1,387 $1,387 $849 $849 $663
* Compliance to current building code - No Cost Allocated
** Zero cost design decision
Table 3 Cost associated with achieveing 10 ACH50 – Single storey 3 bedroom
Improving Australian Housing Envelope Integrity | October 2016
Page 47 of 144
Additional Air Barrier
Required Wall Sarking already used
Cost (Material and Labour) Brick
Veneer Light Weight
Cladding Brick
Veneer Light Weight
Cladding Cavity Brick
Blower door test $500 $500 $500 $500 $500
Window and door reveal seals $262 $262 $262 $262 $262
Bottom plate sealing mastic $196 $196 $196 $196 N/A
Wall Wrap $890 $890 $0 $0 N/A
Taping wrap overlaps and joints $120 $120 $0 $0 N/A
Dampers on flues for gas fireplaces * (BCA 3.12.3.1)
$0 $0 $0 $0 $0
Adequate weather-stripping of doors and windows * (BCA 3.12.3.3)
$0 $0 $0 $0 $0
Exhaust fans with damper/seal * (BCA 3.12.3.4)
$0 $0 $0 $0 $0
Evaporative cooling systems with damper *(BCA 3.12.3.6)
$0 $0 $0 $0 $0
Ducted heating/cooling systems with continuous ductwork * (BCA 3.12.5.3)
$0 $0 $0 $0 $0
No Cavity sliding doors ** $0 $0 $0 $0 $0
No unsealed downlights ** $0 $0 $0 $0 $0
Total Costs $1,968 $1,968 $959 $959 $762
* Compliance to current building code - No Cost Allocated
** Zero cost design decision
Table 4 Cost associated with achieveing 10 ACH50 – Housig Research Facility, 2 storey
Achieving 10 ACH50 is a realistic and achievable target based on current building practices.
This is reflected in the fact that a significant portion of new buildings in Queensland, South
Australia and Tasmania achieved below 10 ACH50 in the data set recorded by Ambrose and
Syme (2015) (Table 5). This portion will not require additional building costs but this analysis
assumes will impose a cost of $500 for a validation test to ensure compliance.
Housing Approvals 2015 (Detached)
% of CSIRO Data < 10 ACH50
Estimated Houses to Achieve < 10 ACH50
NSW 30772 7% 2051
VIC 44972 5% 2249
QLD 31377 58% 18166
SA 8820 75% 6615
WA 23543 0% 0
TAS 2490 79% 1956
ACT 3514 21% 740
Table 5 Houses already achieving 10 ACH50, based on Ambrose and Syme (CSIRO, 2015)

Improving Australian Housing Envelope Integrity | October 2016
Page 48 of 144
5 ECONOMIC BENEFITS The benefits of improved air sealing are primarily in air conditioned buildings in very hot and
humid climates and heated buildings in cooler climates. Generally most climates indicate
favourable BCRs. The total BCR associated with performance based fan pressurisation testing
is calculated to be 1.7 @ 7% discount rate, 2.1 @ 5% discount rate or 2.5 @ 3.5% discount
rate (IPCC recommended) over a 25 year period. Figure 20 shows the associated present value
of the future 25 year economic benefit as calculated to be $255 million, $314 million and
$371 million respectively for 2015 housing approval numbers. The cost of implementing air
control measures and validating using performance based fan pressurisation requirements for
2015 housing approvals is calculated to be $146.7 million as shown in Figure 20.
Figure 20 Present value benefits and costs of 10 ACH50 benchmark (2015 approval data)
The least benefit is seen in the mild BCA climate zone 2 with a 0.5 BCR ratio @ 5% discount
rate a maximum of 0.6 @ 3.5% discount rate and just 0.4 @ 7% discount rate. The highest BCR
is seen in BCA climate 8 with a 6.0 BCR ratio @ 5% discount rate a maximum of 7.0 @ 3.5%
discount rate and 4.9 @ 7% discount rate. Figure 21 to 23 show the total cost and benefit in
each BCA climate zone for a 7%, 5% and 3.5% discount rate. Housing approvals were
aggregated into climate regions for purpose of calculations and the subsequent benefit and
cost are based on total housing approvals in each BCA climate zone for the year 2015. The
assumptions outlined in section 3 were used to calculate the benefits and the assumptions in
section 4 used to determine the financial cost to society and form the basis of the numbers
Improving Australian Housing Envelope Integrity | October 2016
Page 49 of 144
presented in Figures 21 to 23.
Figure 21 BCR for adopting air sealing (7% discount)
Figure 22 BCR for adopting air sealing (5% discount)
Improving Australian Housing Envelope Integrity | October 2016
Page 50 of 144
Figure 23 BCR for adopting air sealing (3.5% IPCC discount)
The housing development activity in each state and the related BCA climate zone are the key
driver of the contribution to the overall benefit. The BCR for each BCA climate zone varies and
is discussed in more detail for each zone on the following pages.
5.1 BCA Climate Zone 1 - Hot humid summer, warm winter
Climate Zone 1 stretches across the states of WA, NT and
QLD. In the case of this analysis NT housing was excluded
from the analysis due to no data being available for air
sealing. So the relative air leakiness of houses in the hot
humid parts of Australia is defined by WA and QLD housing.
With 2,433 houses approved in 2015 (Figure 24) the total
benefit to Australia remains small however the total BCR is
favourable with a 1.4 @ 5% discount rate. Due to the high
humidity and large amounts of moisture in the external air energy is required to reduce
indoor humidity to maintain comfort in this climate. A BCR of 1.01 @ 7% discount and 1.9 @
3.5% discount rate show this climate is just favourable for air sealing in economic terms. All
calculations are generally based on a NatHERS cooling temperature of 27°C (28°C Wyndham,
26°C Weipa) which in reality may be higher than actual operating temperatures in homes
Source: http://www.yourhome.gov.au/
Improving Australian Housing Envelope Integrity | October 2016
Page 51 of 144
(Saman, Oliphant, Mudge, & Halawa, 2008), this means that the cooling loads may be higher
and the resulting benefits of air sealing in BCA zone 1 may actually be greater than stated
here.
In addition BCRs calculated here are based on a 6 star benchmark for the reference houses. In
reality houses in Climate Zone 1 may gain compliance with 5 - 5.5 stars due to allowable
concessions, therefore the BCR may vary from the number stated in favour of a higher BCR.
Figure 24 Housing approvals (2015) in BCA climate 1
Western Australia
The 2015 CSIRO data (Ambrose & Syme, 2015) indicated that WA has some of the leakiest
houses in Australia which means air sealing is highly beneficial. The wide use of cavity brick
construction in WA means that walls may be sealed relatively easily and cost effectively. The
same ratio of construction types was used across all WA climate zones.
Queensland
The 2015 CSIRO data (Ambrose & Syme, 2015) indicated that 58% of QLD houses would
already meet a 10 ACH50 benchmark (based on Brisbane data) and therefore these houses
contributed a zero benefit to a code based performance requirement. This same portion was
assumed in BCA climate zone 1. In the case of the already compliant houses no additional
effort or costs for builders are imposed apart from the $500 fan pressurisation per house for
performance validation. A further 29% are less than 15 ACH50 and only contribute a marginal
benefit for improving air sealing.
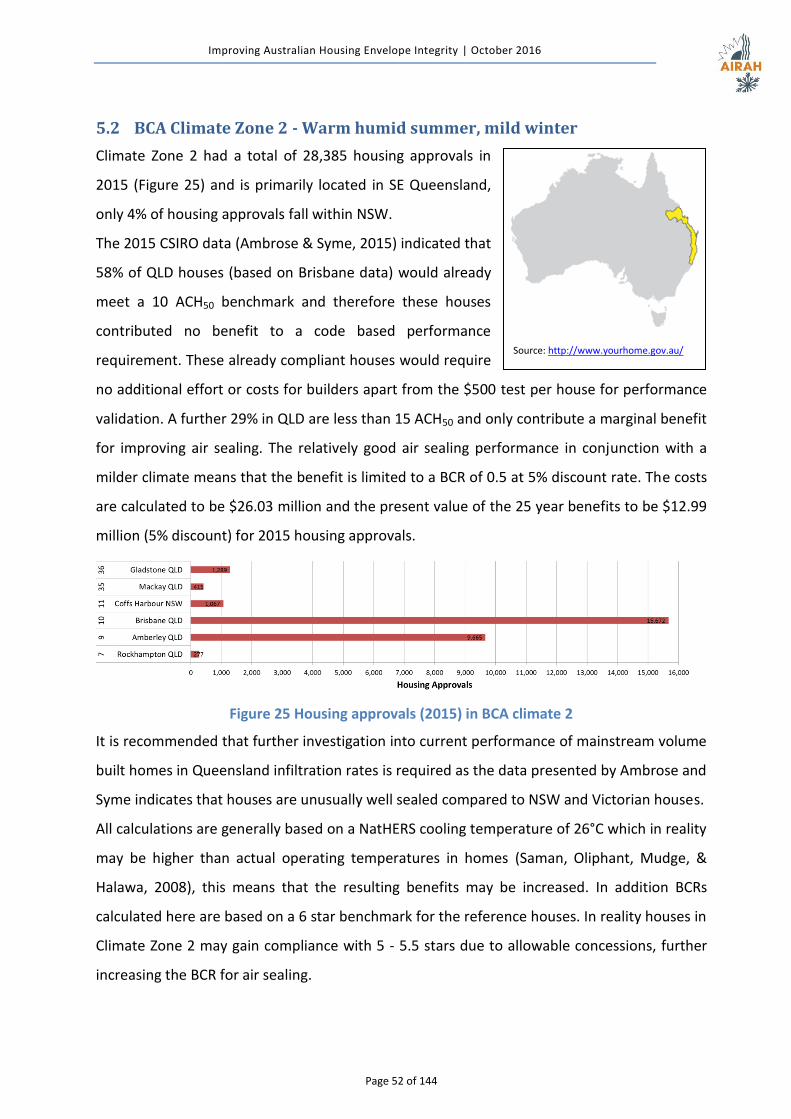
Improving Australian Housing Envelope Integrity | October 2016
Page 52 of 144
5.2 BCA Climate Zone 2 - Warm humid summer, mild winter
Climate Zone 2 had a total of 28,385 housing approvals in
2015 (Figure 25) and is primarily located in SE Queensland,
only 4% of housing approvals fall within NSW.
The 2015 CSIRO data (Ambrose & Syme, 2015) indicated that
58% of QLD houses (based on Brisbane data) would already
meet a 10 ACH50 benchmark and therefore these houses
contributed no benefit to a code based performance
requirement. These already compliant houses would require
no additional effort or costs for builders apart from the $500 test per house for performance
validation. A further 29% in QLD are less than 15 ACH50 and only contribute a marginal benefit
for improving air sealing. The relatively good air sealing performance in conjunction with a
milder climate means that the benefit is limited to a BCR of 0.5 at 5% discount rate. The costs
are calculated to be $26.03 million and the present value of the 25 year benefits to be $12.99
million (5% discount) for 2015 housing approvals.
Figure 25 Housing approvals (2015) in BCA climate 2
It is recommended that further investigation into current performance of mainstream volume
built homes in Queensland infiltration rates is required as the data presented by Ambrose and
Syme indicates that houses are unusually well sealed compared to NSW and Victorian houses.
All calculations are generally based on a NatHERS cooling temperature of 26°C which in reality
may be higher than actual operating temperatures in homes (Saman, Oliphant, Mudge, &
Halawa, 2008), this means that the resulting benefits may be increased. In addition BCRs
calculated here are based on a 6 star benchmark for the reference houses. In reality houses in
Climate Zone 2 may gain compliance with 5 - 5.5 stars due to allowable concessions, further
increasing the BCR for air sealing.
Source: http://www.yourhome.gov.au/

Improving Australian Housing Envelope Integrity | October 2016
Page 53 of 144
5.3 BCA Climate Zone 3 - Hot dry summer, warm winter
Climate Zone 3 stretches across the states of WA, NT and
QLD. In the case of this analysis NT housing was excluded
from the analysis due to no data being available for air
sealing of NT housing. So the relative air leakiness of houses
in these hot dry parts of Australia is defined by WA and QLD
housing.
There are only a relatively small number of houses, with
1,989 total approvals for climate zone 3 in 2015 (Figure 26).
Within this inland region the only notable development area is within Oakey climate zone.
The hot and dry climate may have high diurnal swings; this means that air leakage may not
have such a large benefit in housing that has any significant level of heat capacity (thermal
mass).
The implementation costs are calculated to be $1.76 million and will provide $1.72 million
(5% discount) in savings over 25 years delivering a 1.0 BCR.
The BCR is calculated to be 0.8 @ 7% discount rate and 1.2 @ 3.5% discount rate meaning
that the BCR is viable under IPCC guidelines but not under stringent economic terms.
All calculations are generally based on a NatHERS cooling temperature of 27°C which in reality
may be higher than actual operating temperatures in homes (Saman, Oliphant, Mudge, &
Halawa, 2008), this means that the cooling loads may be higher and the resulting benefits of
air sealing in BCA zone 3 may actually be greater than stated here.
Figure 26 Housing approvals (2015) in BCA climate 3
Source: http://www.yourhome.gov.au/
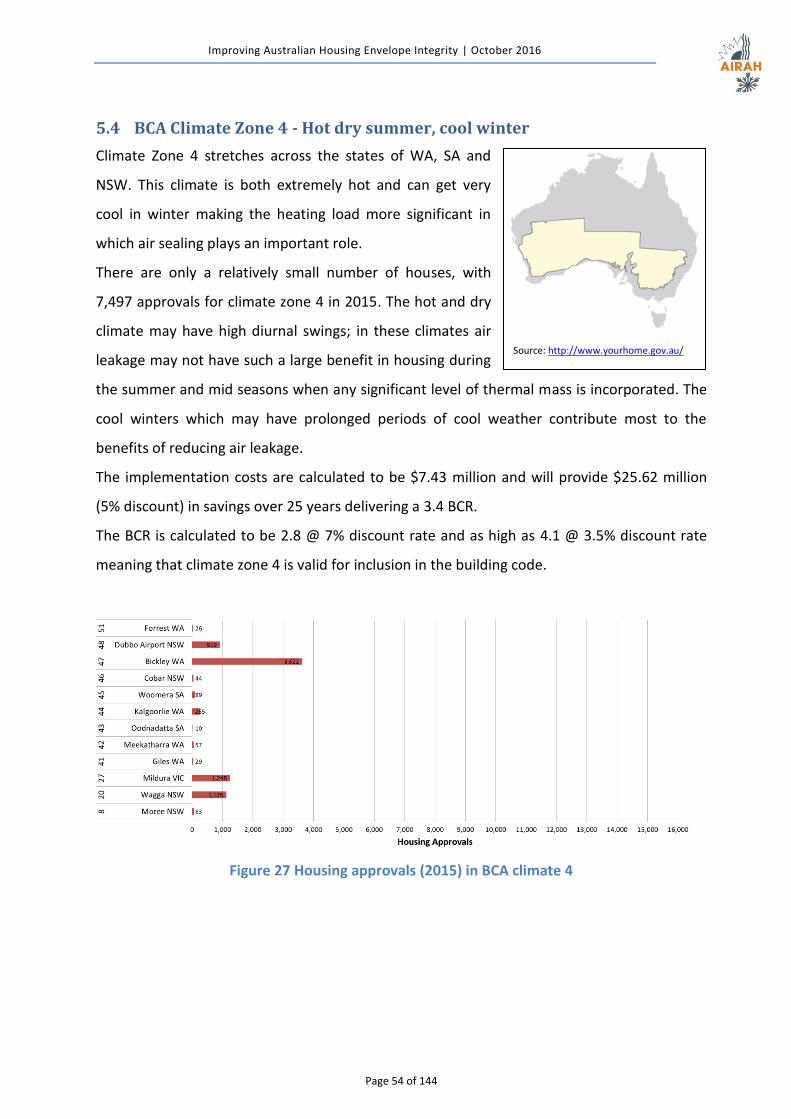
Improving Australian Housing Envelope Integrity | October 2016
Page 54 of 144
5.4 BCA Climate Zone 4 - Hot dry summer, cool winter
Climate Zone 4 stretches across the states of WA, SA and
NSW. This climate is both extremely hot and can get very
cool in winter making the heating load more significant in
which air sealing plays an important role.
There are only a relatively small number of houses, with
7,497 approvals for climate zone 4 in 2015. The hot and dry
climate may have high diurnal swings; in these climates air
leakage may not have such a large benefit in housing during
the summer and mid seasons when any significant level of thermal mass is incorporated. The
cool winters which may have prolonged periods of cool weather contribute most to the
benefits of reducing air leakage.
The implementation costs are calculated to be $7.43 million and will provide $25.62 million
(5% discount) in savings over 25 years delivering a 3.4 BCR.
The BCR is calculated to be 2.8 @ 7% discount rate and as high as 4.1 @ 3.5% discount rate
meaning that climate zone 4 is valid for inclusion in the building code.
Figure 27 Housing approvals (2015) in BCA climate 4
Source: http://www.yourhome.gov.au/

Improving Australian Housing Envelope Integrity | October 2016
Page 55 of 144
5.5 BCA Climate Zone 5 - Warm temperate
Climate Zone 5 is predominantly coastal regions covering the
capital cities of Sydney, Adelaide and Perth. There is
significant housing development in this climate region with
36,077 houses approved in 2015. This means there is means
there is a significant benefit to introduce performance based
requirements for air sealing at a 10 ACH50 benchmark.
Due to the large number of housing development in this
region it delivers a large benefit to Australia. The
implementation costs are calculated to be $36.39 million and will provide $67.49 million (5%
discount) in savings over 25 years delivering a 1.9 BCR.
The BCR is calculated to be 1.5 @ 7% discount rate and as high as 2.2 @ 3.5% discount rate
meaning that climate zone 5 is valid for inclusion in the building code.
New South Wales
The 2015 CSIRO data (Ambrose & Syme, 2015) indicated that NSW houses are relative leaky
with only 7% equal to or better than a 10 ACH50 benchmark. A high portion of houses in NSW
are estimated to not have external wall wraps potentially increasing the cost to achieve a 10
ACH50 benchmark. Note that BCRs calculated here are based on a 6 star benchmark for the
reference houses. In reality BASIX prescribes the current performance required for
compliance which may be lower and more benefit to be gained for the same cost.
South Australia
The 2015 CSIRO data (Ambrose & Syme, 2015) indicated that 75% of SA houses already meet
a 10 ACH50 benchmark and therefore contributed a zero benefit. In the case of the already
compliant houses no additional effort or costs for builders are imposed apart from the $500
fan pressurisation per house for performance validation. It is recommended that further
investigation into current performance of mainstream volume built homes in South Australia
is undertaken as Ambrose and Syme (2015) concluded that their data suggests houses are
unusually well sealed. Therefore the benefit may be greater than stated here.
Western Australia
The 2015 CSIRO data (Ambrose & Syme, 2015) indicated that WA has some of the leakiest
houses in Australia which means air sealing is highly beneficial. The wide use of cavity brick
construction in WA means that walls may be sealed relatively easily. The cost of
implementation is reduced as additional air barriers are not necessarily required in walls.
Source: http://www.yourhome.gov.au/
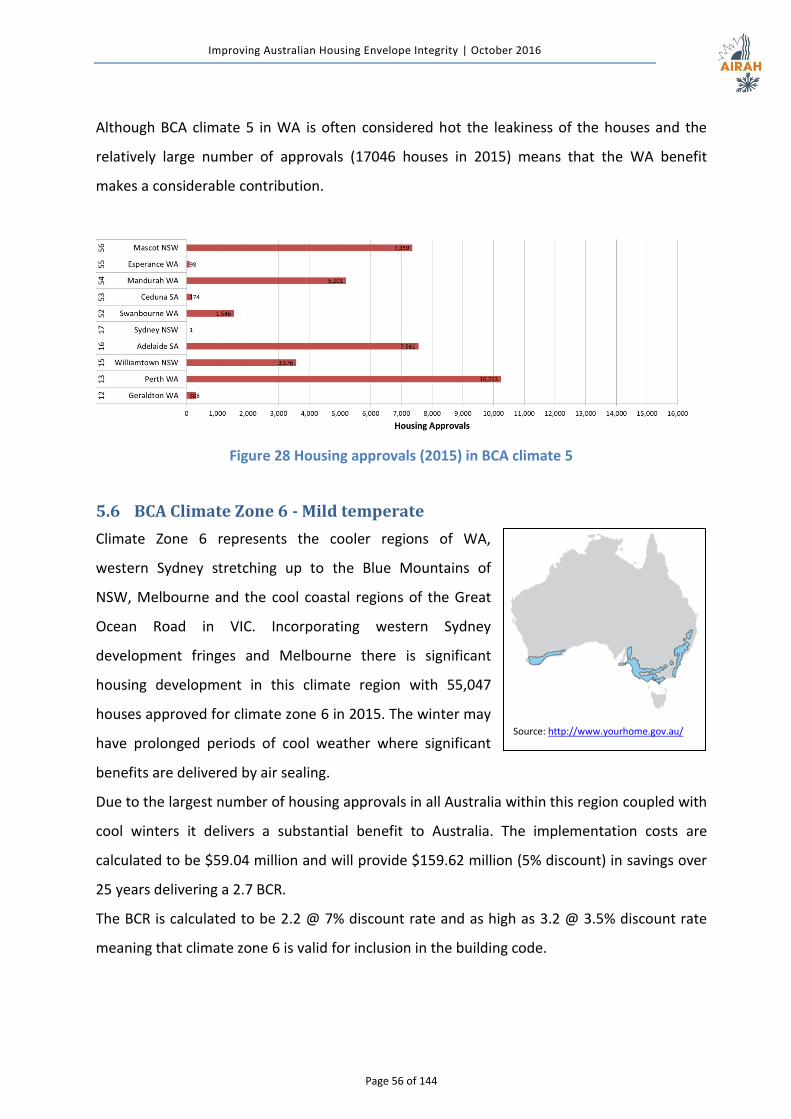
Improving Australian Housing Envelope Integrity | October 2016
Page 56 of 144
Although BCA climate 5 in WA is often considered hot the leakiness of the houses and the
relatively large number of approvals (17046 houses in 2015) means that the WA benefit
makes a considerable contribution.
Figure 28 Housing approvals (2015) in BCA climate 5
5.6 BCA Climate Zone 6 - Mild temperate
Climate Zone 6 represents the cooler regions of WA,
western Sydney stretching up to the Blue Mountains of
NSW, Melbourne and the cool coastal regions of the Great
Ocean Road in VIC. Incorporating western Sydney
development fringes and Melbourne there is significant
housing development in this climate region with 55,047
houses approved for climate zone 6 in 2015. The winter may
have prolonged periods of cool weather where significant
benefits are delivered by air sealing.
Due to the largest number of housing approvals in all Australia within this region coupled with
cool winters it delivers a substantial benefit to Australia. The implementation costs are
calculated to be $59.04 million and will provide $159.62 million (5% discount) in savings over
25 years delivering a 2.7 BCR.
The BCR is calculated to be 2.2 @ 7% discount rate and as high as 3.2 @ 3.5% discount rate
meaning that climate zone 6 is valid for inclusion in the building code.
Source: http://www.yourhome.gov.au/
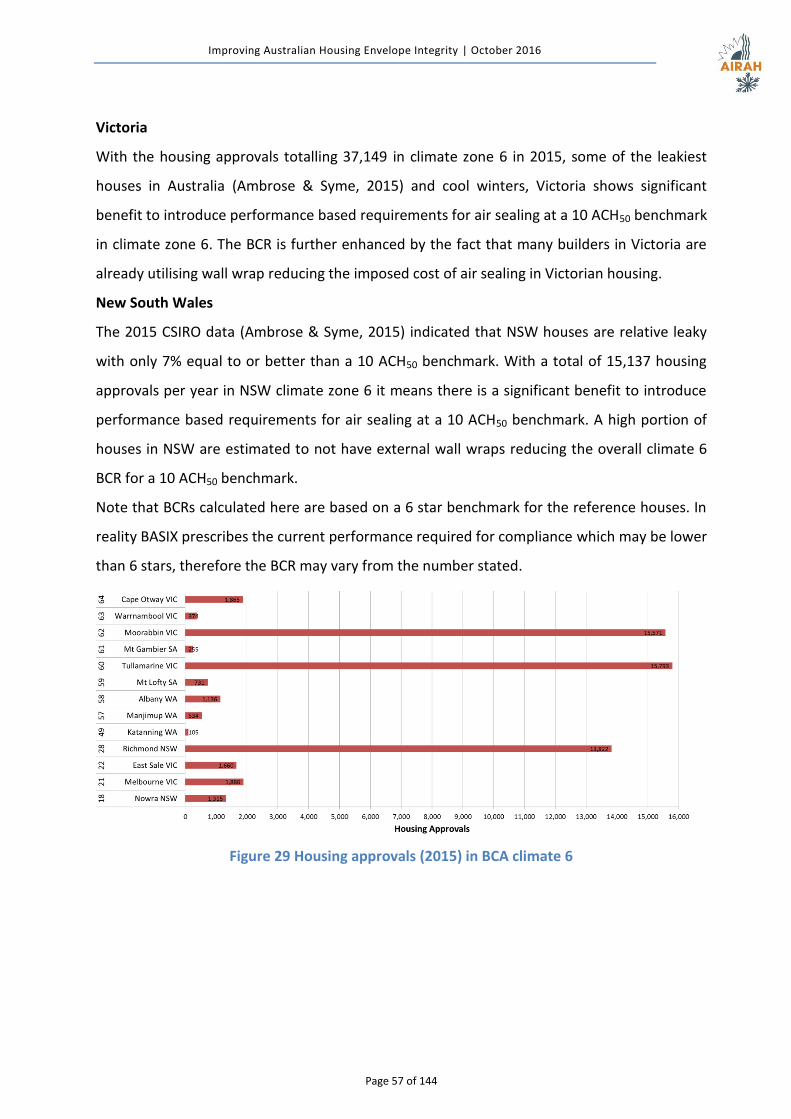
Improving Australian Housing Envelope Integrity | October 2016
Page 57 of 144
Victoria
With the housing approvals totalling 37,149 in climate zone 6 in 2015, some of the leakiest
houses in Australia (Ambrose & Syme, 2015) and cool winters, Victoria shows significant
benefit to introduce performance based requirements for air sealing at a 10 ACH50 benchmark
in climate zone 6. The BCR is further enhanced by the fact that many builders in Victoria are
already utilising wall wrap reducing the imposed cost of air sealing in Victorian housing.
New South Wales
The 2015 CSIRO data (Ambrose & Syme, 2015) indicated that NSW houses are relative leaky
with only 7% equal to or better than a 10 ACH50 benchmark. With a total of 15,137 housing
approvals per year in NSW climate zone 6 it means there is a significant benefit to introduce
performance based requirements for air sealing at a 10 ACH50 benchmark. A high portion of
houses in NSW are estimated to not have external wall wraps reducing the overall climate 6
BCR for a 10 ACH50 benchmark.
Note that BCRs calculated here are based on a 6 star benchmark for the reference houses. In
reality BASIX prescribes the current performance required for compliance which may be lower
than 6 stars, therefore the BCR may vary from the number stated.
Figure 29 Housing approvals (2015) in BCA climate 6
Improving Australian Housing Envelope Integrity | October 2016
Page 58 of 144
5.7 BCA Climate Zone 7 - Cool temperate
Climate zone 7 is cool with prolonged winters. The higher
regions of mainland Australia and the majority of Tasmania
fall into this climate.
The winters are generally very cold and cool weather
dominates for the majority of the year. Housing in this
region totals 13,985 approvals in 2015 and the benefit of air
sealing to Australia is enhanced by the large benefit gained
in these regions.
The implementation costs are calculated to be $13.81 million and will provide $43.17 million
(5% discount) in savings over 25 years delivering a 3.1 BCR.
The BCR is calculated to be 2.6 @ 7% discount rate and as high as 3.7 @ 3.5% discount rate
meaning that climate zone 7 is valid for inclusion in the building code.
New South Wales
Note that BCRs calculated here are based on a 6 star benchmark for the reference houses. In
reality BASIX prescribes the current performance required for compliance which may be lower
than 6 stars, therefore the BCR may vary from the number stated.
Victoria
With the largest number of housing approvals in climate zone 7 totalling 6,575 in 2015, some
of the leakiest houses in Australia (Ambrose & Syme, 2015) and relatively cool winters,
Victoria shows significant benefit to introduce performance based requirements for air
sealing at a 10 ACH50 benchmark. The BCR is further enhanced by the fact that many builders
in Victoria are already utilising wall wrap reducing the imposed cost of air sealing in Victorian
housing.
Tasmania
The 2015 CSIRO data (Ambrose & Syme, 2015) indicated that Tasmania has some of the best
air sealed houses in Australia. This may be attributed to Tasmania almost entirely covered by
climate zone 7 where the natural response is to conserve warm air within the homes. With
79% of houses in Tasmania already meeting or exceeding a 10 ACH50 performance benchmark
the cost of compliance is small with only a $500 test imposed to validate performance. The
21% of houses above 10 ACH50 show significant ongoing energy benefits to be brought in line
with the 79% of already compliant homes. The overall contribution to Australia’s benefit is
small due to the relatively small number of housing approvals.
Source: http://www.yourhome.gov.au/

Improving Australian Housing Envelope Integrity | October 2016
Page 59 of 144
It is recommended that further investigation into the current performance of mainstream
volume built homes in Tasmania is undertaken as Ambrose and Syme (2015) concluded that
their data suggests houses are unusually well sealed. Therefore the benefit may actually be
greater than stated here.
Australian Capital Territory
The 2015 CSIRO data (Ambrose & Syme, 2015) indicated that 79% of houses are leakier than
10 ACH50. This combined with the predominantly heating climate in Canberra conducive to air
sealing allows for large benefits.
Figure 30 Housing approvals (2015) in BCA climate 7

Improving Australian Housing Envelope Integrity | October 2016
Page 60 of 144
5.8 BCA Climate Zone 8 – Alpine
Climate zone 8 contains the coldest regions of Australia with
winter snowfall. The alpine regions of the Great Dividing
Range fall into this climate.
Housing in this region totalled 75 approvals in 2015
therefore the overall benefit to Australia is limited. However
on an individual household level the benefit is substantial.
The implementation costs are calculated to be $110,000 and
will provide $650,000 (5% discount) in savings over 25 years
delivering a 6.0 BCR.
The BCR is calculated to be 4.9 @ 7% discount rate and as high as 7.0 @ 3.5% discount rate
meaning that climate zone 8 is valid for inclusion in the building code.
Note that BCRs calculated here are based on a 6 star benchmark for the reference houses. In
reality BASIX prescribes the current performance required for compliance which may be lower
than 6 stars, therefore the BCR may vary from the number stated.
Figure 31 Housing approvals (2015) in BCA climate 8
Source: http://www.yourhome.gov.au/
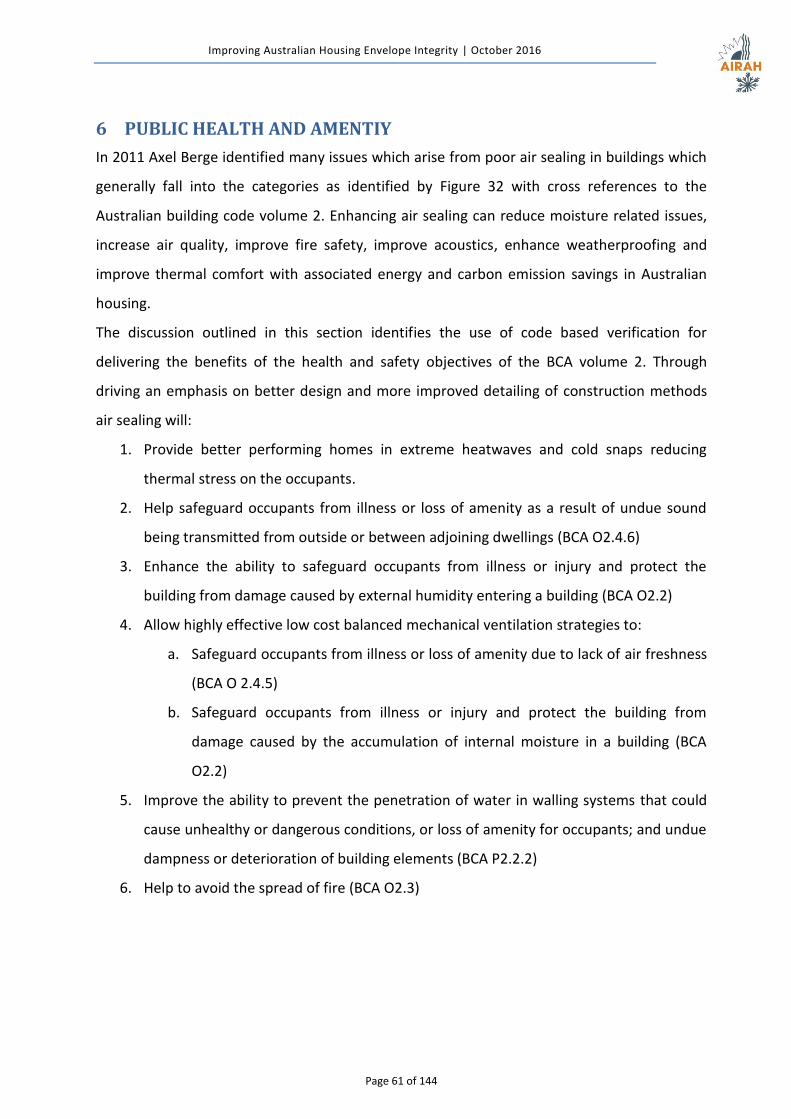
Improving Australian Housing Envelope Integrity | October 2016
Page 61 of 144
6 PUBLIC HEALTH AND AMENTIY
In 2011 Axel Berge identified many issues which arise from poor air sealing in buildings which
generally fall into the categories as identified by Figure 32 with cross references to the
Australian building code volume 2. Enhancing air sealing can reduce moisture related issues,
increase air quality, improve fire safety, improve acoustics, enhance weatherproofing and
improve thermal comfort with associated energy and carbon emission savings in Australian
housing.
The discussion outlined in this section identifies the use of code based verification for
delivering the benefits of the health and safety objectives of the BCA volume 2. Through
driving an emphasis on better design and more improved detailing of construction methods
air sealing will:
1. Provide better performing homes in extreme heatwaves and cold snaps reducing
thermal stress on the occupants.
2. Help safeguard occupants from illness or loss of amenity as a result of undue sound
being transmitted from outside or between adjoining dwellings (BCA O2.4.6)
3. Enhance the ability to safeguard occupants from illness or injury and protect the
building from damage caused by external humidity entering a building (BCA O2.2)
4. Allow highly effective low cost balanced mechanical ventilation strategies to:
a. Safeguard occupants from illness or loss of amenity due to lack of air freshness
(BCA O 2.4.5)
b. Safeguard occupants from illness or injury and protect the building from
damage caused by the accumulation of internal moisture in a building (BCA
O2.2)
5. Improve the ability to prevent the penetration of water in walling systems that could
cause unhealthy or dangerous conditions, or loss of amenity for occupants; and undue
dampness or deterioration of building elements (BCA P2.2.2)
6. Help to avoid the spread of fire (BCA O2.3)
Improving Australian Housing Envelope Integrity | October 2016
Page 62 of 144
Figure 32 The ability of fan pressurisation verification to enhance BCA Vol. 2 objectives
6.1 Indoor Thermal Stability
The primary benefit of air sealing is gained through thermal comfort benefits to the
community and associated reduction in energy requirements. From a health aspect this
includes reduced heat stress for the extremely young, the elderly and the frail in extreme cold
and/or extreme hot conditions reducing morbidity and mortality rates in these extreme
events.
In January 2014 Melbourne experienced a heat wave in which more than 203 deaths were
reported to the coroner, more than twice the average. In 2009 Victoria experienced a heat
wave which was reported to have killed more than 370 (ABC, 2014). A four-day heatwave in
Victoria in January 2014 resulted in a 24 per cent increase in the number of deaths and a 97
per cent increase in emergency calls for cardiac issues (ABC, 2014). An additional 167 people
died that week compared to previous years. Housing provides a refuge for many people
during peak temperatures and it is essential that the building and services are able to operate
effectively in these periods for the health and safety of vulnerable demographic groups.
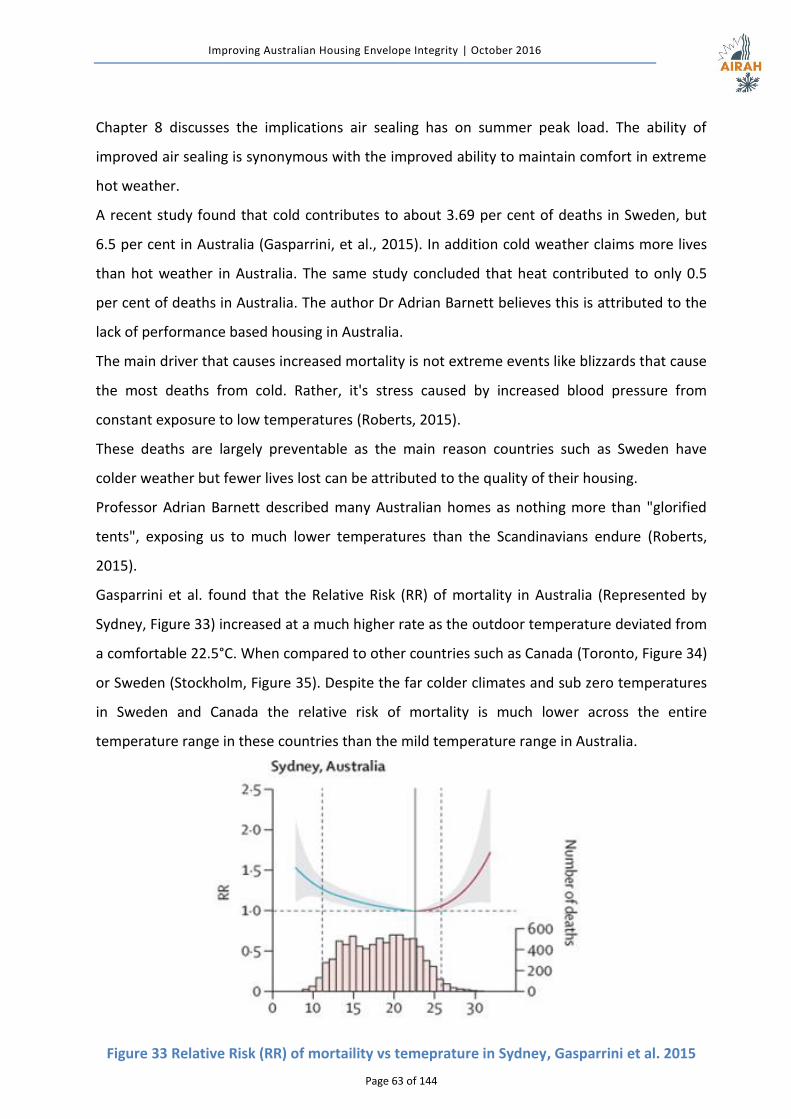
Improving Australian Housing Envelope Integrity | October 2016
Page 63 of 144
Chapter 8 discusses the implications air sealing has on summer peak load. The ability of
improved air sealing is synonymous with the improved ability to maintain comfort in extreme
hot weather.
A recent study found that cold contributes to about 3.69 per cent of deaths in Sweden, but
6.5 per cent in Australia (Gasparrini, et al., 2015). In addition cold weather claims more lives
than hot weather in Australia. The same study concluded that heat contributed to only 0.5
per cent of deaths in Australia. The author Dr Adrian Barnett believes this is attributed to the
lack of performance based housing in Australia.
The main driver that causes increased mortality is not extreme events like blizzards that cause
the most deaths from cold. Rather, it's stress caused by increased blood pressure from
constant exposure to low temperatures (Roberts, 2015).
These deaths are largely preventable as the main reason countries such as Sweden have
colder weather but fewer lives lost can be attributed to the quality of their housing.
Professor Adrian Barnett described many Australian homes as nothing more than "glorified
tents", exposing us to much lower temperatures than the Scandinavians endure (Roberts,
2015).
Gasparrini et al. found that the Relative Risk (RR) of mortality in Australia (Represented by
Sydney, Figure 33) increased at a much higher rate as the outdoor temperature deviated from
a comfortable 22.5°C. When compared to other countries such as Canada (Toronto, Figure 34)
or Sweden (Stockholm, Figure 35). Despite the far colder climates and sub zero temperatures
in Sweden and Canada the relative risk of mortality is much lower across the entire
temperature range in these countries than the mild temperature range in Australia.
Figure 33 Relative Risk (RR) of mortaility vs temeprature in Sydney, Gasparrini et al. 2015
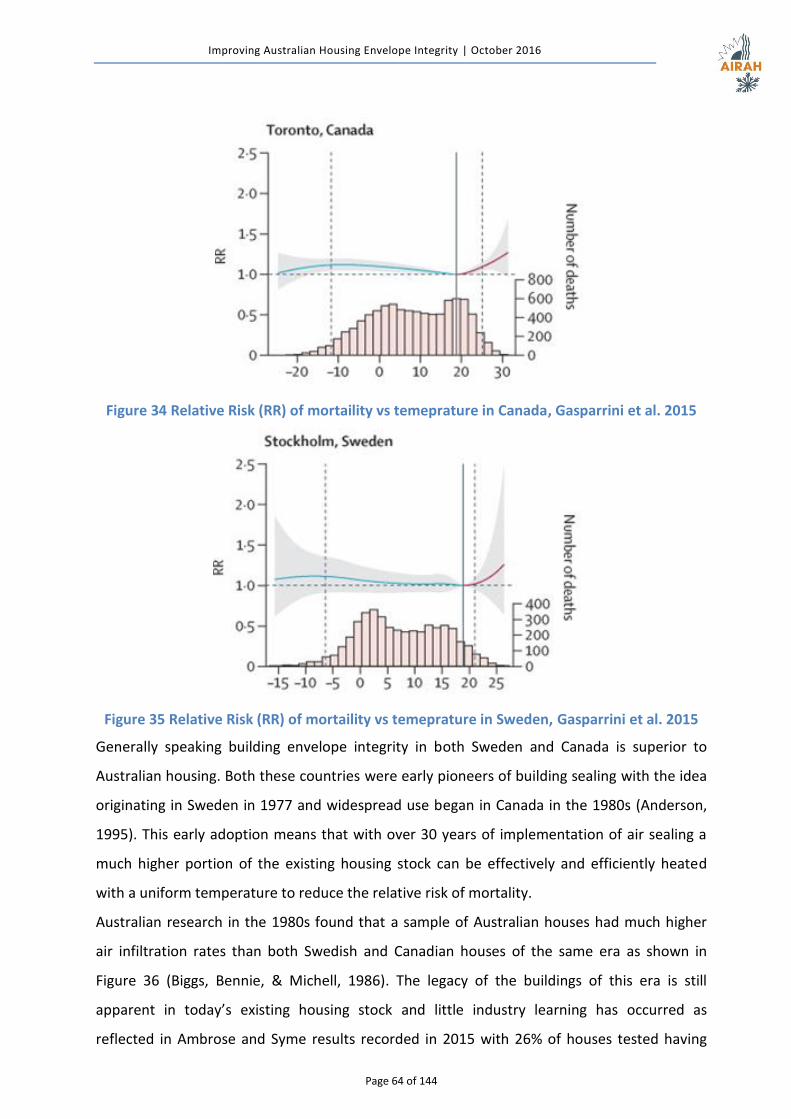
Improving Australian Housing Envelope Integrity | October 2016
Page 64 of 144
Figure 34 Relative Risk (RR) of mortaility vs temeprature in Canada, Gasparrini et al. 2015
Figure 35 Relative Risk (RR) of mortaility vs temeprature in Sweden, Gasparrini et al. 2015
Generally speaking building envelope integrity in both Sweden and Canada is superior to
Australian housing. Both these countries were early pioneers of building sealing with the idea
originating in Sweden in 1977 and widespread use began in Canada in the 1980s (Anderson,
1995). This early adoption means that with over 30 years of implementation of air sealing a
much higher portion of the existing housing stock can be effectively and efficiently heated
with a uniform temperature to reduce the relative risk of mortality.
Australian research in the 1980s found that a sample of Australian houses had much higher
air infiltration rates than both Swedish and Canadian houses of the same era as shown in
Figure 36 (Biggs, Bennie, & Michell, 1986). The legacy of the buildings of this era is still
apparent in today’s existing housing stock and little industry learning has occurred as
reflected in Ambrose and Syme results recorded in 2015 with 26% of houses tested having
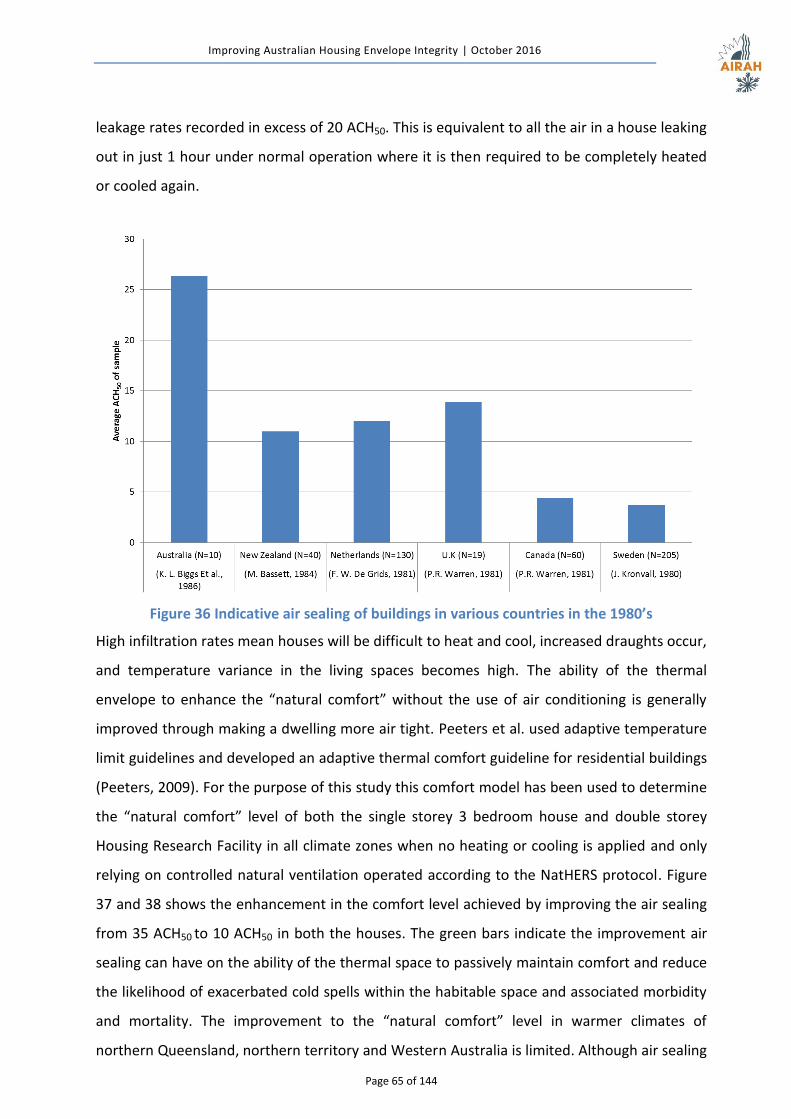
Improving Australian Housing Envelope Integrity | October 2016
Page 65 of 144
leakage rates recorded in excess of 20 ACH50. This is equivalent to all the air in a house leaking
out in just 1 hour under normal operation where it is then required to be completely heated
or cooled again.
Figure 36 Indicative air sealing of buildings in various countries in the 1980’s
High infiltration rates mean houses will be difficult to heat and cool, increased draughts occur,
and temperature variance in the living spaces becomes high. The ability of the thermal
envelope to enhance the “natural comfort” without the use of air conditioning is generally
improved through making a dwelling more air tight. Peeters et al. used adaptive temperature
limit guidelines and developed an adaptive thermal comfort guideline for residential buildings
(Peeters, 2009). For the purpose of this study this comfort model has been used to determine
the “natural comfort” level of both the single storey 3 bedroom house and double storey
Housing Research Facility in all climate zones when no heating or cooling is applied and only
relying on controlled natural ventilation operated according to the NatHERS protocol. Figure
37 and 38 shows the enhancement in the comfort level achieved by improving the air sealing
from 35 ACH50 to 10 ACH50 in both the houses. The green bars indicate the improvement air
sealing can have on the ability of the thermal space to passively maintain comfort and reduce
the likelihood of exacerbated cold spells within the habitable space and associated morbidity
and mortality. The improvement to the “natural comfort” level in warmer climates of
northern Queensland, northern territory and Western Australia is limited. Although air sealing
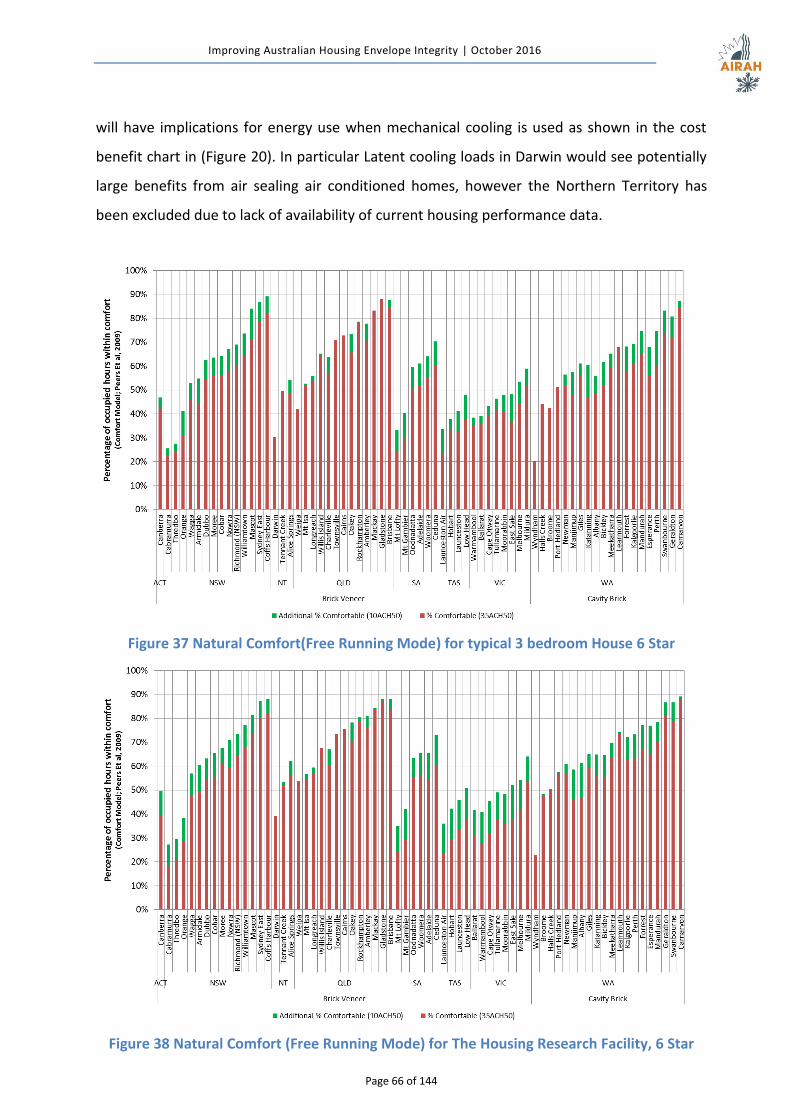
Improving Australian Housing Envelope Integrity | October 2016
Page 66 of 144
will have implications for energy use when mechanical cooling is used as shown in the cost
benefit chart in (Figure 20). In particular Latent cooling loads in Darwin would see potentially
large benefits from air sealing air conditioned homes, however the Northern Territory has
been excluded due to lack of availability of current housing performance data.
Figure 37 Natural Comfort(Free Running Mode) for typical 3 bedroom House 6 Star
Figure 38 Natural Comfort (Free Running Mode) for The Housing Research Facility, 6 Star

Improving Australian Housing Envelope Integrity | October 2016
Page 67 of 144
In the long term implementation of code based requirements; adequate air sealing is likely to
reduce the relative risk of mortality and sickness by increasing the ability of the building to
naturally maintain comfort conditions.
6.2 Acoustic Performance
Sound is readily transported through air. If there are air leaks through sound barriers, the
sound will shortcut through these and will not reduce as much as for a completely airtight
barrier. Thus leakages will also affect the disturbance from sound leaking into the building,
and good air sealing increases the indoor acoustic amenity.
The acoustic performance of wall systems is measured as a sound reduction in either Rw or
may include an adaption factor (Ctr) for low frequency noise, which becomes Rw + Ctr. The BCA
specifies acoustic rating of wall systems based on laboratory test results. When tested in
laboratories it is essential that good seals around the perimeter of the test rig are maintained
to limit the amount of noise bypassing the construction system and lowering the acoustic
rating as shown in Figure 39. The same attention to air sealing in the field is required to
achieve acoustic ratings for internal partitions between occupancies and for external to
indoor noise transmission.
Figure 39 Air sealing at perimeter of acoustic laboratory test rig
Figure 40 highlights the acoustic benefits limiting the air leakage paths in construction
systems (Long, 2014). A 10m² brick veneer wall with an Rw 60, and an effective leakage area of
1 cm² (0.001%) will reduce the rating to Rw 50, or with a 10cm² (0.01%) effective leakage area
reduced to Rw 40 greatly limiting the benefit of the external wall system to prevent external
to internal noise transmission.
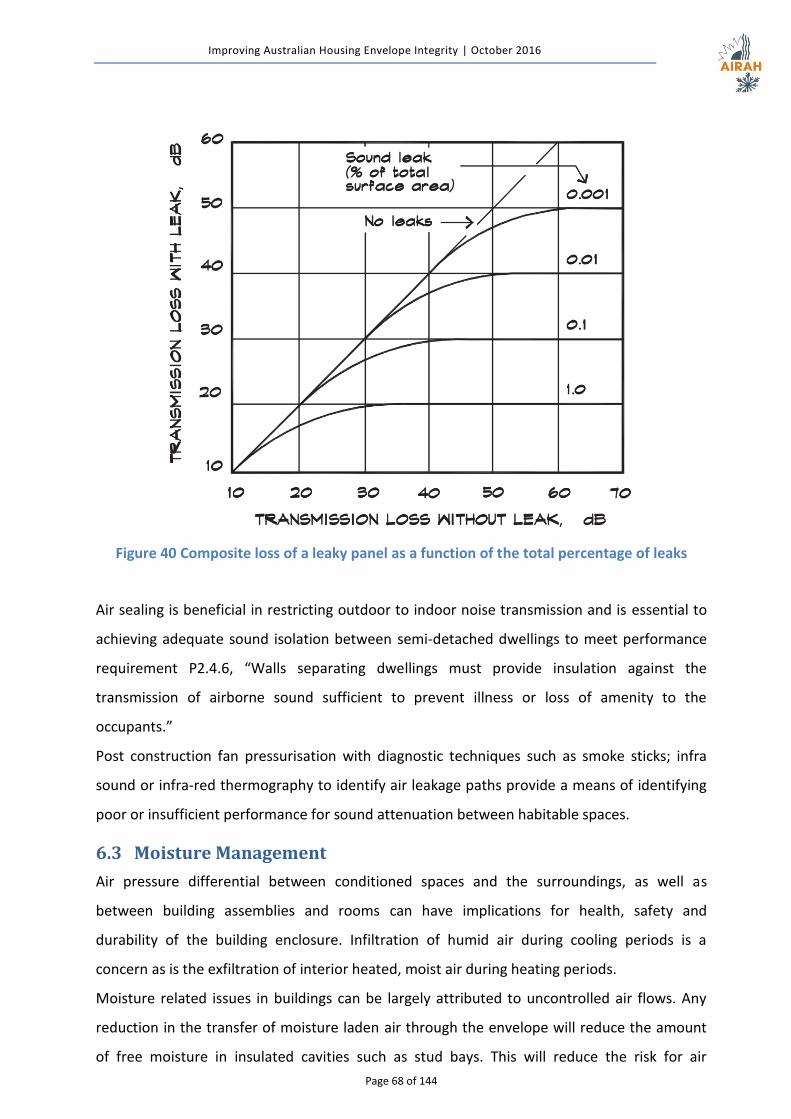
Improving Australian Housing Envelope Integrity | October 2016
Page 68 of 144
Figure 40 Composite loss of a leaky panel as a function of the total percentage of leaks
Air sealing is beneficial in restricting outdoor to indoor noise transmission and is essential to
achieving adequate sound isolation between semi-detached dwellings to meet performance
requirement P2.4.6, “Walls separating dwellings must provide insulation against the
transmission of airborne sound sufficient to prevent illness or loss of amenity to the
occupants.”
Post construction fan pressurisation with diagnostic techniques such as smoke sticks; infra
sound or infra-red thermography to identify air leakage paths provide a means of identifying
poor or insufficient performance for sound attenuation between habitable spaces.
6.3 Moisture Management
Air pressure differential between conditioned spaces and the surroundings, as well as
between building assemblies and rooms can have implications for health, safety and
durability of the building enclosure. Infiltration of humid air during cooling periods is a
concern as is the exfiltration of interior heated, moist air during heating periods.
Moisture related issues in buildings can be largely attributed to uncontrolled air flows. Any
reduction in the transfer of moisture laden air through the envelope will reduce the amount
of free moisture in insulated cavities such as stud bays. This will reduce the risk for air
Improving Australian Housing Envelope Integrity | October 2016
Page 69 of 144
transported moisture causing condensation and moisture related issues such as wood rot and
mould. As the ABCB suggests
“Water vapour can form at everyday temperatures, travel freely in air and condense in
parts of a building where a sustained presence of liquid water or frost might be
dangerous or damaging” (ABCB, 2014),
This is also confirmed by The Building Science Corporation
“Stopping air is the second-most-important job of a building enclosure. Next to rain,
air leaks through walls, roofs, and floors can have the most damaging effect on the
durability of a house. Uncontrolled airflow through the shell not only carries moisture
into framing cavities, causing mould and rot, but it also can account for a huge portion
of a home's energy use and can cause indoor-air-quality problems.” (Straube, Energy
Leaks How They Waste Energy and Rot Houses, 2012)
This highlights the benefit of mitigating uncontrolled air transport through the building
envelope and containing air movement to purpose built drying cavities. Although difficult to
quantify this benefit of adopting AS/NZS ISO 9972 as a reference in the BCA it provides the
basis to be able to start addressing these issues by limiting air transported water vapour in
the building envelope.
Figure 41 highlights the extent of latent heat (humidity) ingress into the housing research
facility when modelled in all major capital cities and how this varies with the air leakage rate.
Clearly the outstanding location here is Darwin in which the tropical weather has high
external temperatures with high humidity. This raises particular health concerns with leaky air
conditioned buildings and microbial growth.
“Moisture is a special class of contaminant because it commonly exists in both liquid
and vapour form and is a limiting factor in the growth of moulds and fungus. Poor air
tightness that allows damp air to come in contact with cool surfaces is quite likely to
lead to the growth of micro biologicals.” (Sherman & Chan, 2004)
In Figure 41 it can be seen that latent heat loads in Darwin increase dramatically with air
leakage. If the moisture laden air is transferring into the building increasing the air
conditioning loads then it is transferring through the building envelope at unknown locations.
This poses large risks for interstitial condensation, mould and fungus growth. This is of
concern in air conditioned buildings which are likely to have cooler internal construction
linings or structural framing increasing the risk of condensation on these cooler surfaces and
likely to be hidden within cavities. These issues provide a widespread health concern in
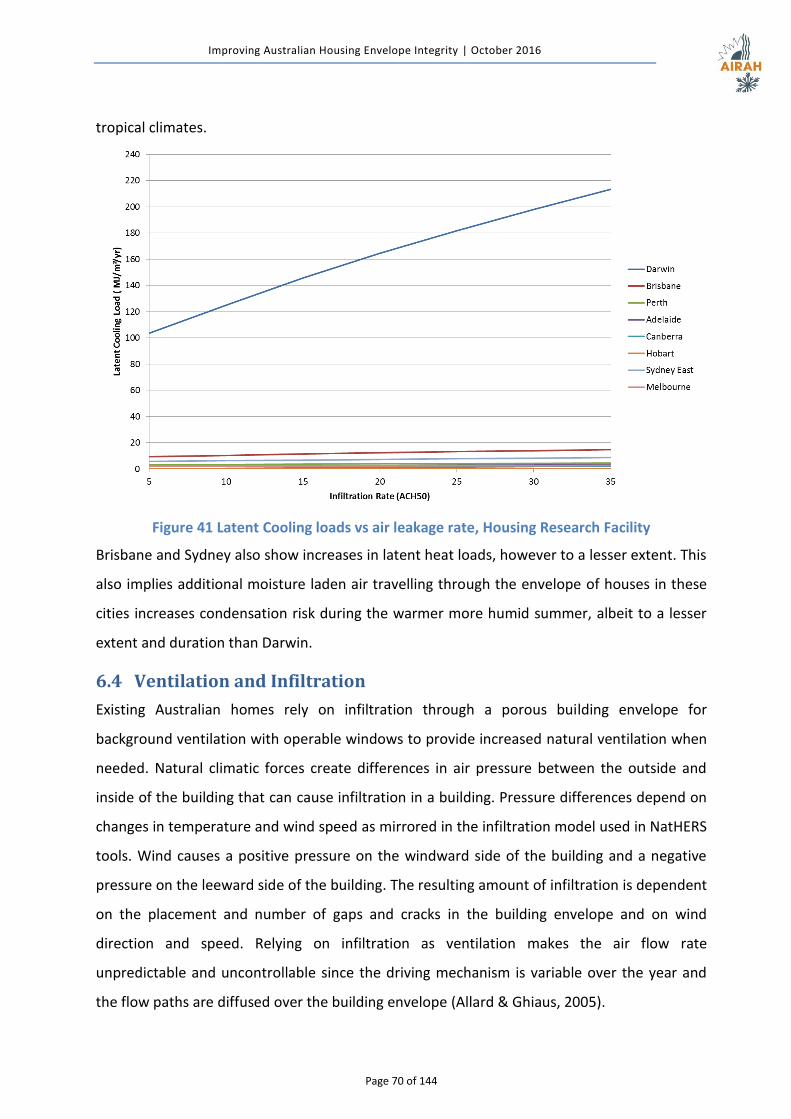
Improving Australian Housing Envelope Integrity | October 2016
Page 70 of 144
tropical climates.
Figure 41 Latent Cooling loads vs air leakage rate, Housing Research Facility
Brisbane and Sydney also show increases in latent heat loads, however to a lesser extent. This
also implies additional moisture laden air travelling through the envelope of houses in these
cities increases condensation risk during the warmer more humid summer, albeit to a lesser
extent and duration than Darwin.
6.4 Ventilation and Infiltration
Existing Australian homes rely on infiltration through a porous building envelope for
background ventilation with operable windows to provide increased natural ventilation when
needed. Natural climatic forces create differences in air pressure between the outside and
inside of the building that can cause infiltration in a building. Pressure differences depend on
changes in temperature and wind speed as mirrored in the infiltration model used in NatHERS
tools. Wind causes a positive pressure on the windward side of the building and a negative
pressure on the leeward side of the building. The resulting amount of infiltration is dependent
on the placement and number of gaps and cracks in the building envelope and on wind
direction and speed. Relying on infiltration as ventilation makes the air flow rate
unpredictable and uncontrollable since the driving mechanism is variable over the year and
the flow paths are diffused over the building envelope (Allard & Ghiaus, 2005).
Improving Australian Housing Envelope Integrity | October 2016
Page 71 of 144
This most basic fresh air supply system (infiltration) has no extra construction costs or explicit
operating costs; however, there is poor control over fresh air rates when the envelope is
leaky. The energy implications arise almost exclusively from the need to condition the
outdoor air. The system relies on the occupants to open and close windows to provide
adequate fresh air when the envelope is tight. The lack of control can result in energy loss due
to high air change rates especially in winter when temperature differences and wind speeds
are high (Russell, Sherman, & Rudd , 2005). Alternatively, this method may under-supply
fresh air during the hot summer months. When climatic conditions are favourable, natural
ventilation (through windows and doors) can be used for cooling and can replace air
conditioning systems for part of the year.
The Building Code of Australia currently specifies when mechanical ventilation is required in
domestic dwellings but there are no quantifiable performance requirements to ensure that
the ventilation achieves its purpose. The purpose as set out in P2.4.5 is to maintain adequate
air quality free of odour, micro-organisms, pathogens or toxins.
The current acceptable construction practice to meet P2.4.5 does not currently promote
effective ventilation. Habitable rooms, sanitary compartments, bathrooms, shower rooms,
laundries require only external operable openings of pre-determined size to allow occupants
to purge contaminants (natural ventilation). Mechanical ventilation (exhaust fans) is also
acceptable for sanitary compartments, laundries or bathrooms which exhaust to outside or
into the roof space. The key issues with this approach are:
1. Reliance on the occupants to manage indoor contaminates by purging air from rooms
2. Mechanical exhaust fans have no performance specifications and therefore may not
be correctly sized or located.
To protect health and amenity it is necessary to have a constant flow of fresh air delivered at
a minimum performance flow rate. AS 1668.2 sets permissible mechanical ventilation rates
having consideration to health and ventilation amenity (Standards Australia, 2012). The
specified ventilation rates are intended to maintain general contaminants (e.g. body odours,
volatile organic compounds and the like) at concentrations below exposures that have the
potential to cause adverse health effects to a majority of occupants.
Improving Australian Housing Envelope Integrity | October 2016
Page 72 of 144
6.4.1 Ventilation Strategies
Air quality can correspond positively to ventilation and ventilation can be made more
effective by having sealed envelopes to enable purposeful ventilation paths. There are four
key aspects of maintaining air quality and reducing the risk of the build-up of micro-
organisms, pathogens or toxins (commonly mould) in well-sealed buildings:
1. Reduce the quantity of pollutants through appropriate selection of furnishings and
products (i.e. low or zero VOC products). Currently no provisions exist in the Australian
building code for this.
2. Ensure source extract ventilation is always direct to the outside for bathrooms,
laundries and kitchens to remove water vapour and odours at the source. The extract
ventilation must have minimum performance targets for extract ventilation rates.
3. Utilise low volume continuous ventilation of rooms or spaces to dilute and flush out
pollutants and water vapour that may not be removed by operation of extract
ventilation in accordance with (2). Currently there are no provisions for this in the BCA
but is essential for high integrity well sealed building envelopes.
4. Utilise purge ventilation, or manually controlled ventilation of rooms and spaces at a
high rate to rapidly dilute pollutants and water vapour (i.e. open windows and doors
on a daily basis). Currently the BCA addresses this by specifying minimum operable
areas for habitable spaces in accordance with the acceptable construction practice in
Vol 2 Clause 3.8.5.2.
6.4.2 Extract Ventilation
In general the best approach to manage indoor air quality is source control of pollutants and
water vapour. This is the removal of the contaminant and/or moisture where they are
generated. Intermittent extract ventilation as specified in AS 1668.2 can be effective in
kitchen, toilets, bathroom and sanitary compartments as shown in Table 6. The UK Part F
Building Regulations (HM Government, 2010) specifies minimum flow rates for kitchen
exhaust required for effective removal of contaminants.
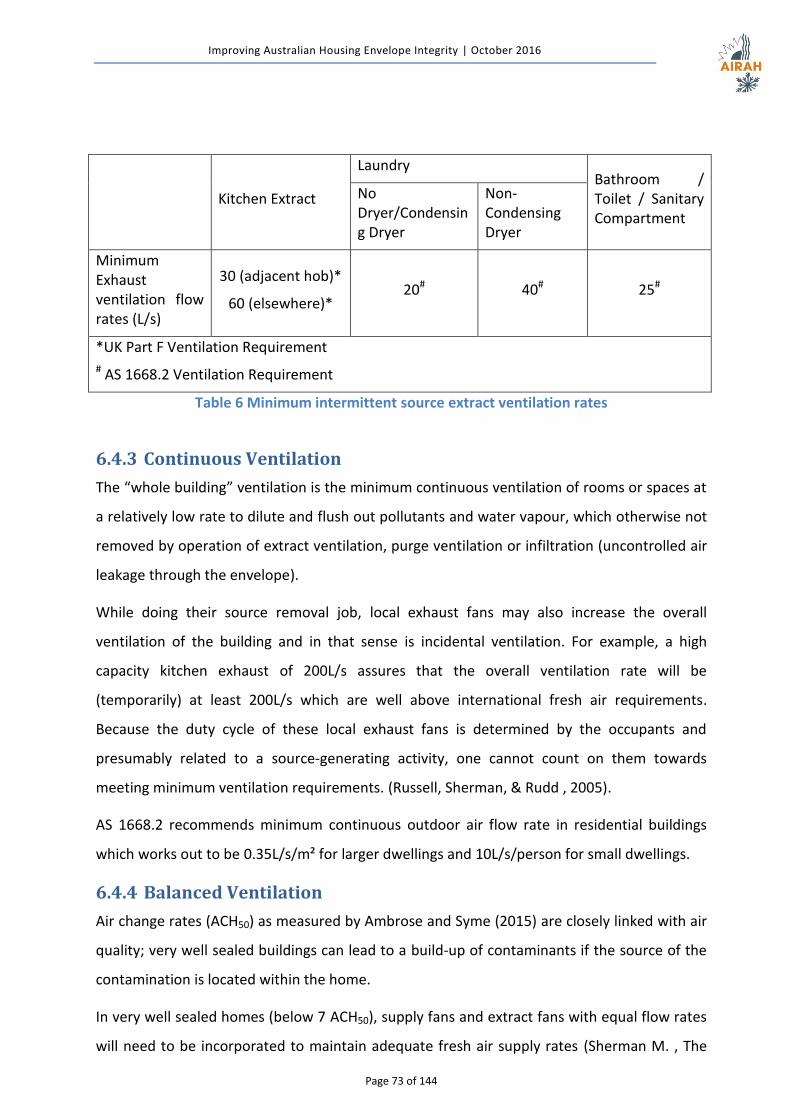
Improving Australian Housing Envelope Integrity | October 2016
Page 73 of 144
Kitchen Extract
Laundry Bathroom / Toilet / Sanitary Compartment
No Dryer/Condensing Dryer
Non-Condensing Dryer
Minimum Exhaust ventilation flow rates (L/s)
30 (adjacent hob)*
60 (elsewhere)* 20# 40# 25#
*UK Part F Ventilation Requirement
# AS 1668.2 Ventilation Requirement
Table 6 Minimum intermittent source extract ventilation rates
6.4.3 Continuous Ventilation
The “whole building” ventilation is the minimum continuous ventilation of rooms or spaces at
a relatively low rate to dilute and flush out pollutants and water vapour, which otherwise not
removed by operation of extract ventilation, purge ventilation or infiltration (uncontrolled air
leakage through the envelope).
While doing their source removal job, local exhaust fans may also increase the overall
ventilation of the building and in that sense is incidental ventilation. For example, a high
capacity kitchen exhaust of 200L/s assures that the overall ventilation rate will be
(temporarily) at least 200L/s which are well above international fresh air requirements.
Because the duty cycle of these local exhaust fans is determined by the occupants and
presumably related to a source-generating activity, one cannot count on them towards
meeting minimum ventilation requirements. (Russell, Sherman, & Rudd , 2005).
AS 1668.2 recommends minimum continuous outdoor air flow rate in residential buildings
which works out to be 0.35L/s/m² for larger dwellings and 10L/s/person for small dwellings.
6.4.4 Balanced Ventilation
Air change rates (ACH50) as measured by Ambrose and Syme (2015) are closely linked with air
quality; very well sealed buildings can lead to a build-up of contaminants if the source of the
contamination is located within the home.
In very well sealed homes (below 7 ACH50), supply fans and extract fans with equal flow rates
will need to be incorporated to maintain adequate fresh air supply rates (Sherman M. , The
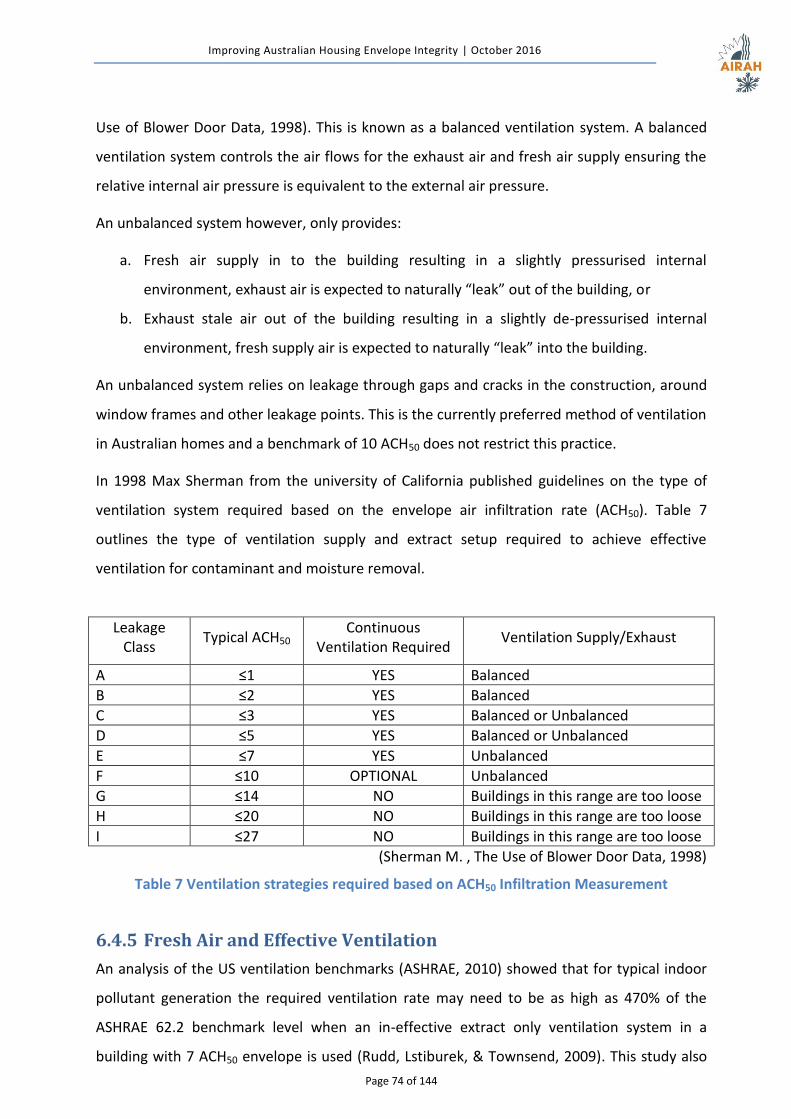
Improving Australian Housing Envelope Integrity | October 2016
Page 74 of 144
Use of Blower Door Data, 1998). This is known as a balanced ventilation system. A balanced
ventilation system controls the air flows for the exhaust air and fresh air supply ensuring the
relative internal air pressure is equivalent to the external air pressure.
An unbalanced system however, only provides:
a. Fresh air supply in to the building resulting in a slightly pressurised internal
environment, exhaust air is expected to naturally “leak” out of the building, or
b. Exhaust stale air out of the building resulting in a slightly de-pressurised internal
environment, fresh supply air is expected to naturally “leak” into the building.
An unbalanced system relies on leakage through gaps and cracks in the construction, around
window frames and other leakage points. This is the currently preferred method of ventilation
in Australian homes and a benchmark of 10 ACH50 does not restrict this practice.
In 1998 Max Sherman from the university of California published guidelines on the type of
ventilation system required based on the envelope air infiltration rate (ACH50). Table 7
outlines the type of ventilation supply and extract setup required to achieve effective
ventilation for contaminant and moisture removal.
Leakage Class
Typical ACH50 Continuous
Ventilation Required Ventilation Supply/Exhaust
A ≤1 YES Balanced
B ≤2 YES Balanced
C ≤3 YES Balanced or Unbalanced
D ≤5 YES Balanced or Unbalanced
E ≤7 YES Unbalanced
F ≤10 OPTIONAL Unbalanced
G ≤14 NO Buildings in this range are too loose
H ≤20 NO Buildings in this range are too loose
I ≤27 NO Buildings in this range are too loose
(Sherman M. , The Use of Blower Door Data, 1998)
Table 7 Ventilation strategies required based on ACH50 Infiltration Measurement
6.4.5 Fresh Air and Effective Ventilation
An analysis of the US ventilation benchmarks (ASHRAE, 2010) showed that for typical indoor
pollutant generation the required ventilation rate may need to be as high as 470% of the
ASHRAE 62.2 benchmark level when an in-effective extract only ventilation system in a
building with 7 ACH50 envelope is used (Rudd, Lstiburek, & Townsend, 2009). This study also
Improving Australian Housing Envelope Integrity | October 2016
Page 75 of 144
showed that by the simple placement of inlet vents above windows ventilation effectiveness
will be greatly enhanced.
ASHRAE requires ventilation rates based on ASHRAE 62.2 utilising the following relationship,
Q (L/s) = 0.05 *Afloor + 3.5 (N+ 1)
Where:
Afloor is floor area in m²
N is number of bedrooms
Comparatively, the Australian Standard 1668.2-2012 “The use of ventilation and air
conditioning in buildings” recommends minimum outdoor air flow rate in buildings. For
residential buildings, the minimum amount of introduced outdoor air should be the greater
value of area-based minimum and the occupancy based minimum, which are:
a. Area based minimum,
qmin = 0.35 x A
Where:
qmin is minimum ventilation rate (in L/s) 𝐴 is floor area
b. Occupancy based minimum:
qmin = 10 × N
Where:
𝑞min is minimum ventilation rate (in L/s) N is number of people in the space
Interestingly when compared to the requirements under ASHRAE the requirement in AS
1668.2 yields much higher air flow rates, in addition the way the air is supplied and the
effectiveness of the air exchange may affect the amount of air required to achieve the same
indoor air quality objectives (Rudd, Lstiburek, & Townsend, 2009). Figure 42 shows the
relative air volume rate to achieve suitable air quality in a 4 bedroom 240m² house as studied
by Rudd et al. in 2009 (See Appendix F). The AS 1668.2 volumetric air requirement for the
same house has been overlayed in Figure 42. Under the contaminant scenario shown (50%
from building, 50% from occupants) the AS 1668.2 requirement is more than enough even in
the least effective case utilising a single extract fan from the master bathroom to attain an
equivalent level of air quality as a fully ducted, balanced ventilation system. This implies that
the Australian standard is more than sufficient to allow adequate fresh air rates in Australian
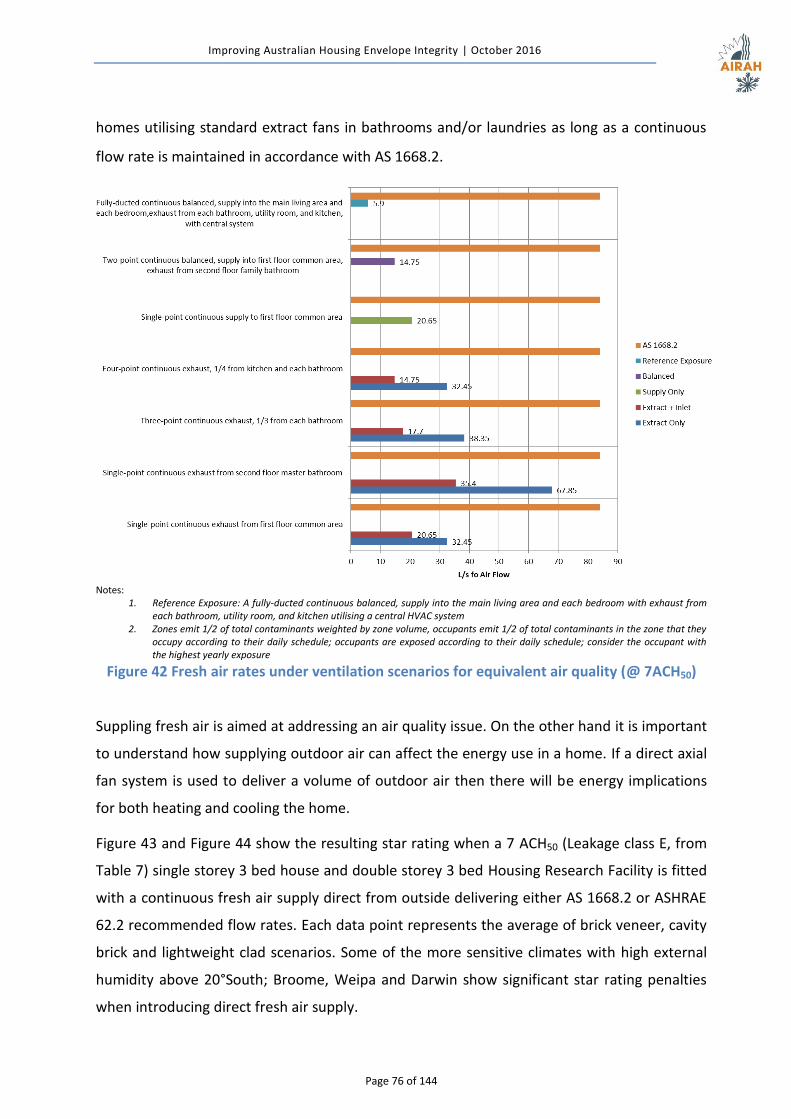
Improving Australian Housing Envelope Integrity | October 2016
Page 76 of 144
homes utilising standard extract fans in bathrooms and/or laundries as long as a continuous
flow rate is maintained in accordance with AS 1668.2.
Notes:
1. Reference Exposure: A fully-ducted continuous balanced, supply into the main living area and each bedroom with exhaust from each bathroom, utility room, and kitchen utilising a central HVAC system
2. Zones emit 1/2 of total contaminants weighted by zone volume, occupants emit 1/2 of total contaminants in the zone that they occupy according to their daily schedule; occupants are exposed according to their daily schedule; consider the occupant with the highest yearly exposure
Figure 42 Fresh air rates under ventilation scenarios for equivalent air quality (@ 7ACH50)
Suppling fresh air is aimed at addressing an air quality issue. On the other hand it is important
to understand how supplying outdoor air can affect the energy use in a home. If a direct axial
fan system is used to deliver a volume of outdoor air then there will be energy implications
for both heating and cooling the home.
Figure 43 and Figure 44 show the resulting star rating when a 7 ACH50 (Leakage class E, from
Table 7) single storey 3 bed house and double storey 3 bed Housing Research Facility is fitted
with a continuous fresh air supply direct from outside delivering either AS 1668.2 or ASHRAE
62.2 recommended flow rates. Each data point represents the average of brick veneer, cavity
brick and lightweight clad scenarios. Some of the more sensitive climates with high external
humidity above 20°South; Broome, Weipa and Darwin show significant star rating penalties
when introducing direct fresh air supply.
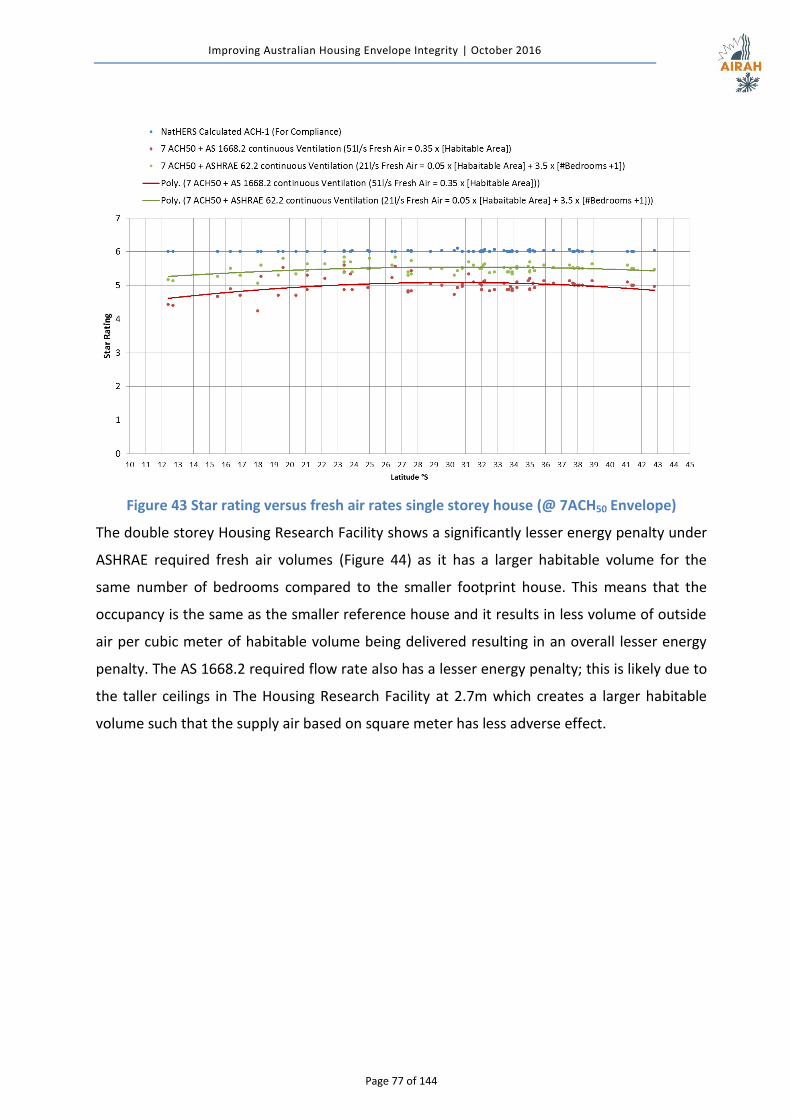
Improving Australian Housing Envelope Integrity | October 2016
Page 77 of 144
Figure 43 Star rating versus fresh air rates single storey house (@ 7ACH50 Envelope)
The double storey Housing Research Facility shows a significantly lesser energy penalty under
ASHRAE required fresh air volumes (Figure 44) as it has a larger habitable volume for the
same number of bedrooms compared to the smaller footprint house. This means that the
occupancy is the same as the smaller reference house and it results in less volume of outside
air per cubic meter of habitable volume being delivered resulting in an overall lesser energy
penalty. The AS 1668.2 required flow rate also has a lesser energy penalty; this is likely due to
the taller ceilings in The Housing Research Facility at 2.7m which creates a larger habitable
volume such that the supply air based on square meter has less adverse effect.
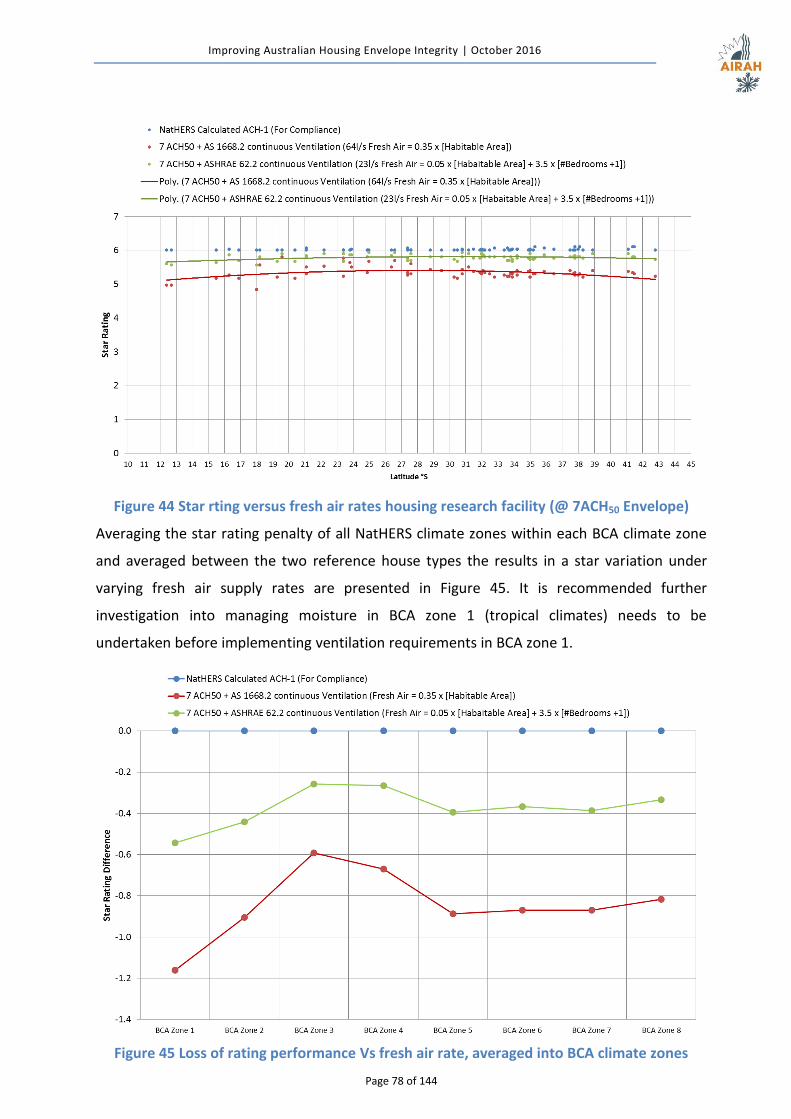
Improving Australian Housing Envelope Integrity | October 2016
Page 78 of 144
Figure 44 Star rting versus fresh air rates housing research facility (@ 7ACH50 Envelope)
Averaging the star rating penalty of all NatHERS climate zones within each BCA climate zone
and averaged between the two reference house types the results in a star variation under
varying fresh air supply rates are presented in Figure 45. It is recommended further
investigation into managing moisture in BCA zone 1 (tropical climates) needs to be
undertaken before implementing ventilation requirements in BCA zone 1.
Figure 45 Loss of rating performance Vs fresh air rate, averaged into BCA climate zones
Improving Australian Housing Envelope Integrity | October 2016
Page 79 of 144
6.5 Limiting Health and Amenity Risks
In 2004 a study commissioned by the Natural Heritage Trust into the effects of gas heating
concluded:
“When un-flued gas heaters are operating, indoor air generally exhibits substantially
higher levels of nitrogen dioxide, carbon dioxide and carbon monoxide than the highest
concentrations measured in ambient air in Australia. The measured average peak 1
hour nitrogen dioxide levels were over 10 times higher than the equivalent measured
outdoor values. These levels, especially for nitrogen dioxide, were often significantly
above health based indoor air quality criteria.” (AWN Consultants and Team Ferrari,
2004).
This health concern is currently covered by BCA clause 3.12.3 (b)(ii) which states that building
sealing is not required for “A permanent building ventilation opening that is necessary for the
safe operation of a gas appliance,” however this conflicts with performance requirement 2.6.1
to facilitate the efficient use of energy.
AS/NZS 5601 currently prohibits the installation of gas hose fittings for non-flued gas heaters
in bedrooms, bathrooms, saunas, toilets, hallways and garages. However it does not restrict
the use from habitable living spaces, dining spaces and kitchens. AS/NZS 5601 will need to be
addressed in the building code and Plumbing code (Clause E1.2) in conjunction with AS/NZS
ISO 9972 performance benchmarks incorporated into the BCA.
State requirements that currently conflict with P2.6.1 to facilitate the efficient use of energy
can be found in AS/NZS 5601 as referenced in the Plumbing Code of Australia as follows:
Energy Safety Division of the Department of Commerce, Western Australia
“Where a quick-connect device socket is installed indoors, for the future connection of
a flueless space heater, the room is required to have two permanent ventilation
openings direct to outside. The openings are required to be provided at high and low
levels, with a minimum vertical separation of 1.5 m. Each opening is required to have
an aggregated minimum free area of 25,000 mm2.” (AS/NZS 5601.1)
Office of the Technical Regulator, South Australia
“Two permanent ventilation openings are required to be provided directly to outside,
one at a high level and one at a low level, each having a minimum free area of 1,000
Improving Australian Housing Envelope Integrity | October 2016
Page 80 of 144
mm2 per MJ/h. Where a quick connect device socket is installed for the future
connection of a flueless heater and the capacity is unknown, the room is required to
have two ventilation openings installed, one at high level and one at low level. Each
opening is required to have a minimum free area of 25,000 mm2.” (AS/NZS 5601.1)
It is recommended that the building code is updated to ensure all new buildings in Australia
should meet the intent of Energy Safe Victoria requirements as outlined in AS/NZS 5601.1
and be adopted within the building code:
“A person cannot install any flueless space heater as a new installation in residential
premises (including a caravan or boat). A person is required not to install or locate for
use a connection device (quick connect, bayonet connection) for a flueless space heater
in residential premises including a caravan or boat.”
However a person is permitted to replace an existing flueless space heater with a new
flueless space heater if the new flueless heater meets the following requirements:
(a) The heater being replaced operated on LP Gas; and
(b) The new heater operates on LP Gas; and
(c) The emission of oxides of nitrogen from the new heater does not exceed 2.5
ng/J; and
(d) The carbon monoxide/carbon dioxide ratio of the new heater does not
exceed 0.002.
6.6 Weather-Proofing
Controlling air leaks in wall systems is critical to achieving weather-proofing in accordance
with BCA. The Building Research Association of New Zealand (BRANZ) identified through many
years of research that:
“Wind acting on a building creates a pressure difference between the higher pressure
outside and the lower pressure inside. The design of a wall system must incorporate an
undamaged barrier to resist these wind pressures and to avoid any air leakage paths to
the interior of the building. If an air leakage path exists, water can be carried along it
into the wall assembly. If not provided with effective air seals, any gaps, joints and
junctions in the wall cladding can become air leakage paths that can carry water when
present.” (BRANZ, 2010)
Improving Australian Housing Envelope Integrity | October 2016
Page 81 of 144
This effect is apparent in the BCA verification method V2.2.1 Weatherproofing. This
verification method utilises AS/NZS 4284 Testing of Building Facades (Standards Australia,
2008) as the basis of the verification in which a cyclic pressure is applied to the wall system to
induce water leaks due to isolated air flow paths in the walling system. The integrity of the air
seals in the water-proof layer will provide ultimate determination of a pass or fail result.
The fundamental scientific approaches to achieving a weather-proof system (Straube, 2010) is
described in figure 46 below.
Notes: Classification is made on actual behaviour, not necessarily design intent. For the purpose of this classification system, the following definitions are necessary:
1. Drained: the large majority of the water that penetrates the screen is removed by gravity.
2. Cavity: a clear space or a filled space that facilitates gravity drainage and air flow and resists the lateral transfer of water (a capillary break)
3. Ventilated: allows some degree of water vapour diffusion through vent and redistribution within the cavity by air mixing and vapour diffusion.
4. Pressure-moderated: an approach that moderates air pressure differences across the screen. If perfect moderation is achieved, a theoretical condition, it is termed “pressure equalised”
Figure 46 Enclosure system types (Straube, 2010) for compliance with BCA V2.2.1
Testing undertaken for both drained screen type cladding systems and perfect barrier systems
was carried out at CSIRO testing facilities in 2015 as shown in Figure 47 and 48. The testing for
compliance in accordance with BCA V2.2.1 and AS/NZS 4284 validated the concept as
Enclosure System
Imperfect Barrier
Drained or Screened Types
Vented Ventilated
Pressure Moderated
Perfect Barrier
Perfect Barrier Types
Face Sealed Concealed
Barrier
Improving Australian Housing Envelope Integrity | October 2016
Page 82 of 144
published by BRANZ (BRANZ, 2010) that an effectively sealed air barrier is the basis of
weather-proofing.
All system types require an airtight water barrier; the only difference is the location of the air
barrier within the system and the material which constitutes the air barrier. The correlation
between air control and weatherproofing as identified by BRANZ means that air tight
envelopes actually deliver superior rain control. AS/NZS ISO 9972 provides a basis to verify the
holistic level of integrity which incorporates this enhanced rain control function.
Perfect barrier type systems require air seals in the water-proof external surface and window
junctions as shown in figure 47. If an air leakage path exists, water can be carried along it into
the wall assembly.
Figure 47 Masonry veneer face sealed system under test (air sealed cladding)
Drained or screen type systems require air sealing at the water barrier sarking membrane
with careful integration into window and door reveals using appropriate flashings as shown in
figure 48. If an air leakage path through the sarking membrane exists, water can be carried
along it into the wall assembly. Research undertaken by a leading product manufacturer has
shown properly taped and sealed sarking can reduce air leakage by 82% (Appendix C) which
will in turn increase overall weather tightness in drained and screen type systems.
Improving Australian Housing Envelope Integrity | October 2016
Page 83 of 144
Figure 48 Weatherboard pressure moderated system under test (air sealed membrane)
Performance based requirements for air leakage utilising AS/NZS ISO 9972 will allow for
holistic validation of the enclosure integrity and provide some security that air sealing for
weatherisation has been undertaken to a reasonable degree.
7 FIRE SAFETY
Sealing of constructions also improves fire safety. Fire Rating Levels (FRL) are specified by the
building code and measured in accordance with AS 1530.4. Unsealed paths through the
building component can deteriorate its performance in terms of the structural adequacy
rating, integrity rating and insulation rating in the event of a fire as well as allowing hot gases
and fumes to migrate between compartments. Adequate sealing at ceiling, wall and floor
junctions is necessary in fire rated walls to achieve performance as well as fire rated sealants
around penetrations through fire rated construction systems. Figure 49 shows the laboratory
testing procedure incorporating seals around a pipe penetration required to achieve the Fire
Rating Level (FRL).
Figure 49 Fire Rated Wall with pipe pentration under Test
Improving Australian Housing Envelope Integrity | October 2016
Page 84 of 144
Integrity failure occurs in a fire test when a structural element develops spaces or openings
through which hot flames or gases can pass; air leakage paths can expedite this process.
Ultimately early failure in the integrity will result and a speedier decline to structural failure
and collapse of the system under load. Good air sealing allows the laboratory tested FRL
values for constructions to be better implemented in practice and to some extent
pressurisation testing can act as an indicator for a fire safe building.
Diagnostic tools are commonly used when fan pressurisation testing is carried out to allow for
the air leakage paths to be identified. These tools may consist of smoke sticks, thermography
or ultrasound devices to locate non-sealed gaps in the construction. The use of these tools for
locating and rectifying gaps for energy efficiency purposes also increases the likelihood of
identifying fire rated construction systems which may be undermined by poor air sealing.
Figure 50 shows the fire rated method of installing cabling and pipe penetrations in walls as
per AS 1530.4 laboratory testing. Figure 51 shows non-compliant installations of penetrations
in fire rated walls in a class 2 development. Poor air leakage test results and/or air leakage
path detection techniques in any building type can allow for enhanced identification of non-
visible fire integrity issues.
Figure 50 Fire rated cabling (-/120/60) and pipe (-/120/-) sealing
Figure 51 Non-sealed cable and pipe pentration in fire rated wall (BCA Logic, 2015)
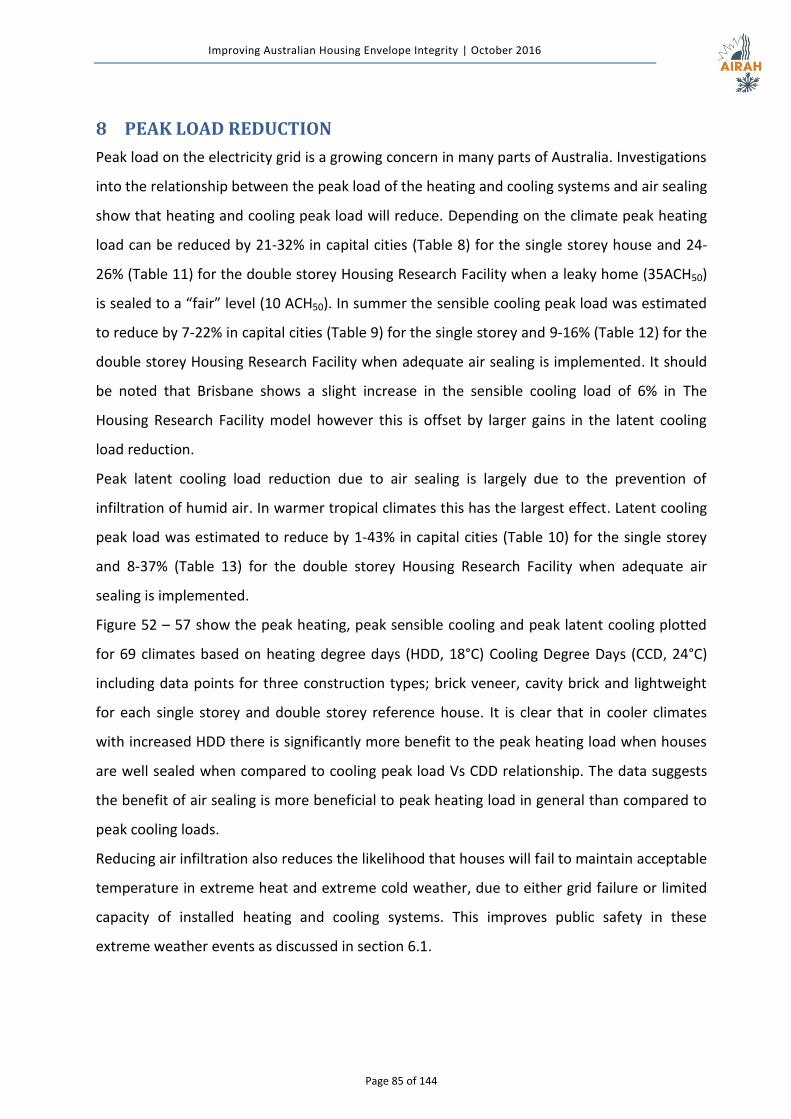
Improving Australian Housing Envelope Integrity | October 2016
Page 85 of 144
8 PEAK LOAD REDUCTION
Peak load on the electricity grid is a growing concern in many parts of Australia. Investigations
into the relationship between the peak load of the heating and cooling systems and air sealing
show that heating and cooling peak load will reduce. Depending on the climate peak heating
load can be reduced by 21-32% in capital cities (Table 8) for the single storey house and 24-
26% (Table 11) for the double storey Housing Research Facility when a leaky home (35ACH50)
is sealed to a “fair” level (10 ACH50). In summer the sensible cooling peak load was estimated
to reduce by 7-22% in capital cities (Table 9) for the single storey and 9-16% (Table 12) for the
double storey Housing Research Facility when adequate air sealing is implemented. It should
be noted that Brisbane shows a slight increase in the sensible cooling load of 6% in The
Housing Research Facility model however this is offset by larger gains in the latent cooling
load reduction.
Peak latent cooling load reduction due to air sealing is largely due to the prevention of
infiltration of humid air. In warmer tropical climates this has the largest effect. Latent cooling
peak load was estimated to reduce by 1-43% in capital cities (Table 10) for the single storey
and 8-37% (Table 13) for the double storey Housing Research Facility when adequate air
sealing is implemented.
Figure 52 – 57 show the peak heating, peak sensible cooling and peak latent cooling plotted
for 69 climates based on heating degree days (HDD, 18°C) Cooling Degree Days (CCD, 24°C)
including data points for three construction types; brick veneer, cavity brick and lightweight
for each single storey and double storey reference house. It is clear that in cooler climates
with increased HDD there is significantly more benefit to the peak heating load when houses
are well sealed when compared to cooling peak load Vs CDD relationship. The data suggests
the benefit of air sealing is more beneficial to peak heating load in general than compared to
peak cooling loads.
Reducing air infiltration also reduces the likelihood that houses will fail to maintain acceptable
temperature in extreme heat and extreme cold weather, due to either grid failure or limited
capacity of installed heating and cooling systems. This improves public safety in these
extreme weather events as discussed in section 6.1.
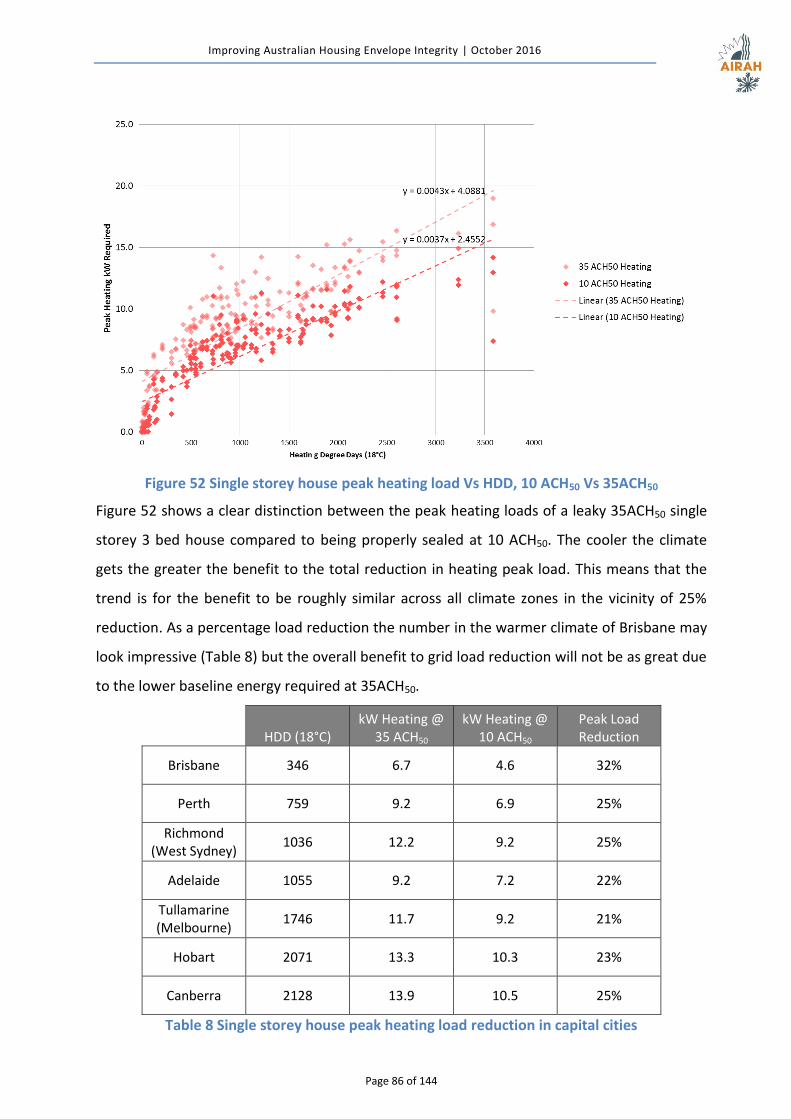
Improving Australian Housing Envelope Integrity | October 2016
Page 86 of 144
Figure 52 Single storey house peak heating load Vs HDD, 10 ACH50 Vs 35ACH50
Figure 52 shows a clear distinction between the peak heating loads of a leaky 35ACH50 single
storey 3 bed house compared to being properly sealed at 10 ACH50. The cooler the climate
gets the greater the benefit to the total reduction in heating peak load. This means that the
trend is for the benefit to be roughly similar across all climate zones in the vicinity of 25%
reduction. As a percentage load reduction the number in the warmer climate of Brisbane may
look impressive (Table 8) but the overall benefit to grid load reduction will not be as great due
to the lower baseline energy required at 35ACH50.
HDD (18°C) kW Heating @
35 ACH50 kW Heating @
10 ACH50 Peak Load Reduction
Brisbane 346 6.7 4.6 32%
Perth 759 9.2 6.9 25%
Richmond (West Sydney)
1036 12.2 9.2 25%
Adelaide 1055 9.2 7.2 22%
Tullamarine (Melbourne)
1746 11.7 9.2 21%
Hobart 2071 13.3 10.3 23%
Canberra 2128 13.9 10.5 25%
Table 8 Single storey house peak heating load reduction in capital cities
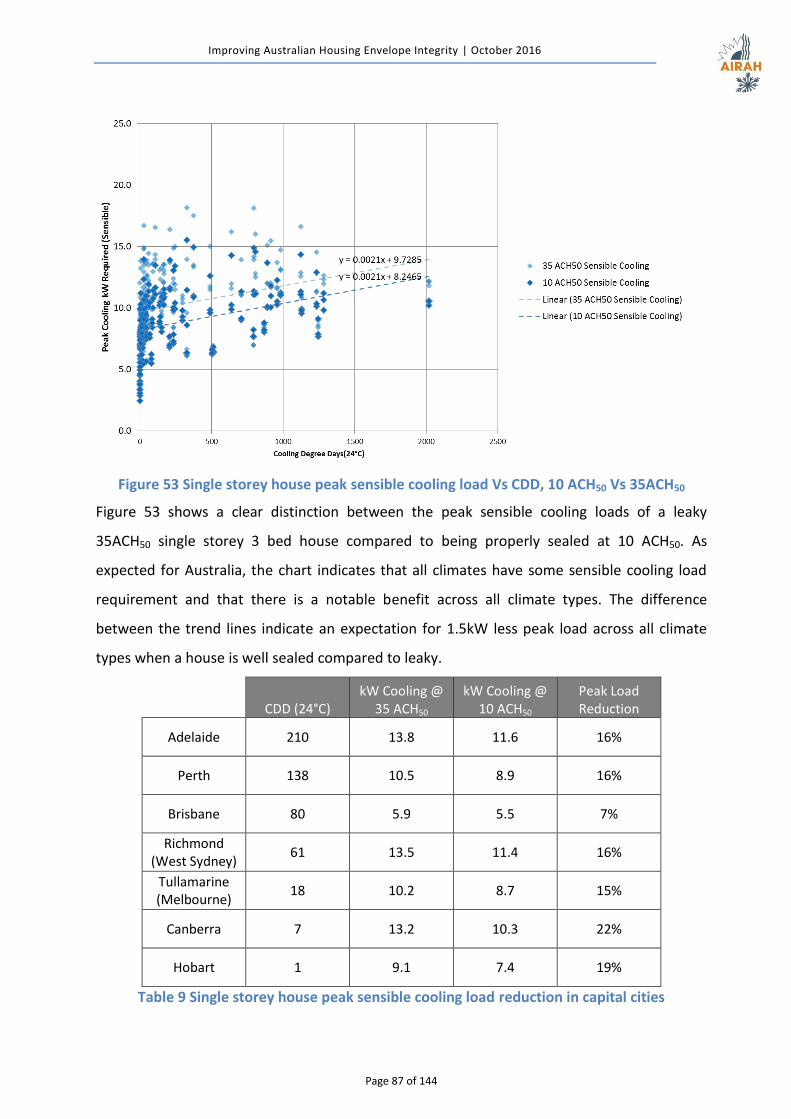
Improving Australian Housing Envelope Integrity | October 2016
Page 87 of 144
Figure 53 Single storey house peak sensible cooling load Vs CDD, 10 ACH50 Vs 35ACH50
Figure 53 shows a clear distinction between the peak sensible cooling loads of a leaky
35ACH50 single storey 3 bed house compared to being properly sealed at 10 ACH50. As
expected for Australia, the chart indicates that all climates have some sensible cooling load
requirement and that there is a notable benefit across all climate types. The difference
between the trend lines indicate an expectation for 1.5kW less peak load across all climate
types when a house is well sealed compared to leaky.
CDD (24°C) kW Cooling @
35 ACH50 kW Cooling @
10 ACH50 Peak Load Reduction
Adelaide 210 13.8 11.6 16%
Perth 138 10.5 8.9 16%
Brisbane 80 5.9 5.5 7%
Richmond (West Sydney)
61 13.5 11.4 16%
Tullamarine (Melbourne)
18 10.2 8.7 15%
Canberra 7 13.2 10.3 22%
Hobart 1 9.1 7.4 19%
Table 9 Single storey house peak sensible cooling load reduction in capital cities
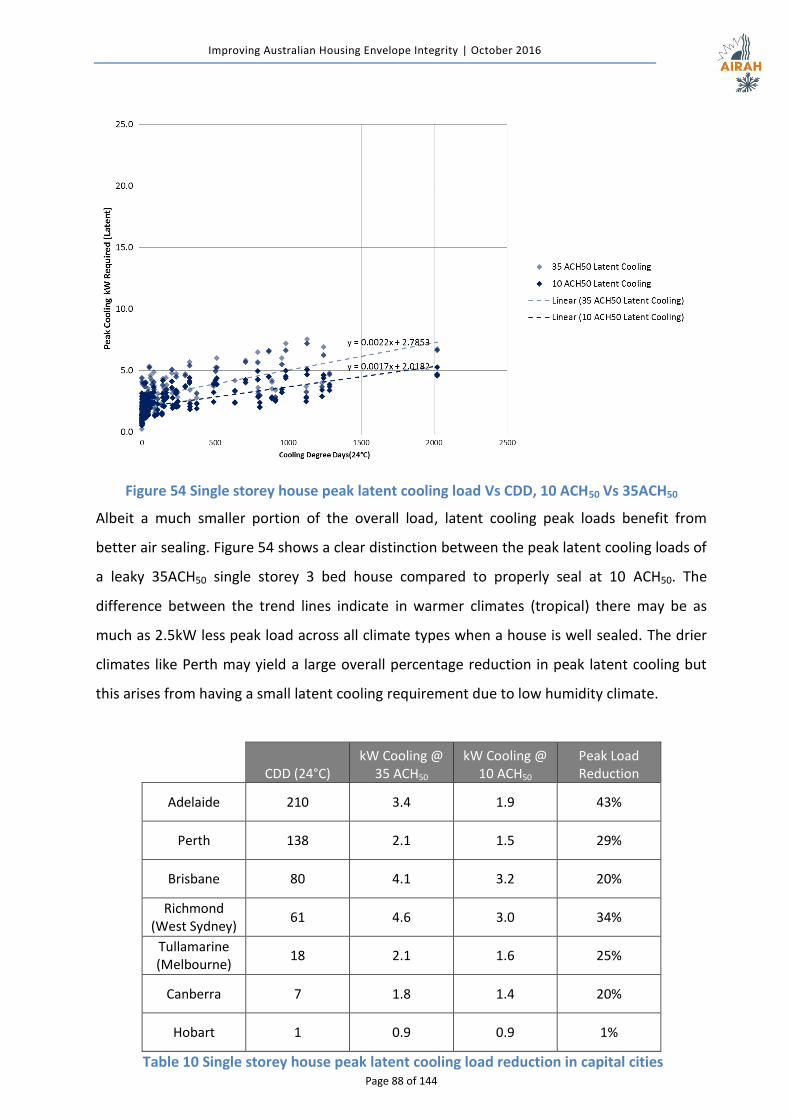
Improving Australian Housing Envelope Integrity | October 2016
Page 88 of 144
Figure 54 Single storey house peak latent cooling load Vs CDD, 10 ACH50 Vs 35ACH50
Albeit a much smaller portion of the overall load, latent cooling peak loads benefit from
better air sealing. Figure 54 shows a clear distinction between the peak latent cooling loads of
a leaky 35ACH50 single storey 3 bed house compared to properly seal at 10 ACH50. The
difference between the trend lines indicate in warmer climates (tropical) there may be as
much as 2.5kW less peak load across all climate types when a house is well sealed. The drier
climates like Perth may yield a large overall percentage reduction in peak latent cooling but
this arises from having a small latent cooling requirement due to low humidity climate.
CDD (24°C) kW Cooling @
35 ACH50 kW Cooling @
10 ACH50 Peak Load Reduction
Adelaide 210 3.4 1.9 43%
Perth 138 2.1 1.5 29%
Brisbane 80 4.1 3.2 20%
Richmond (West Sydney)
61 4.6 3.0 34%
Tullamarine (Melbourne)
18 2.1 1.6 25%
Canberra 7 1.8 1.4 20%
Hobart 1 0.9 0.9 1%
Table 10 Single storey house peak latent cooling load reduction in capital cities
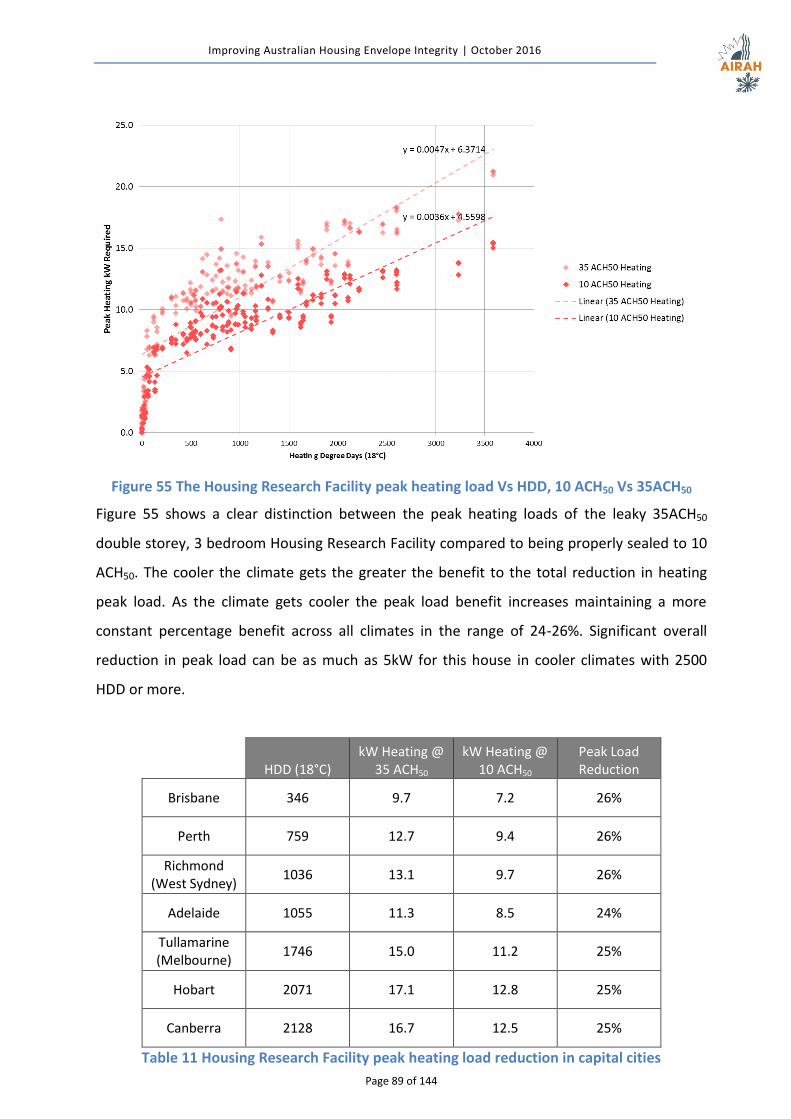
Improving Australian Housing Envelope Integrity | October 2016
Page 89 of 144
Figure 55 The Housing Research Facility peak heating load Vs HDD, 10 ACH50 Vs 35ACH50
Figure 55 shows a clear distinction between the peak heating loads of the leaky 35ACH50
double storey, 3 bedroom Housing Research Facility compared to being properly sealed to 10
ACH50. The cooler the climate gets the greater the benefit to the total reduction in heating
peak load. As the climate gets cooler the peak load benefit increases maintaining a more
constant percentage benefit across all climates in the range of 24-26%. Significant overall
reduction in peak load can be as much as 5kW for this house in cooler climates with 2500
HDD or more.
HDD (18°C) kW Heating @
35 ACH50 kW Heating @
10 ACH50 Peak Load Reduction
Brisbane 346 9.7 7.2 26%
Perth 759 12.7 9.4 26%
Richmond (West Sydney)
1036 13.1 9.7 26%
Adelaide 1055 11.3 8.5 24%
Tullamarine (Melbourne)
1746 15.0 11.2 25%
Hobart 2071 17.1 12.8 25%
Canberra 2128 16.7 12.5 25%
Table 11 Housing Research Facility peak heating load reduction in capital cities
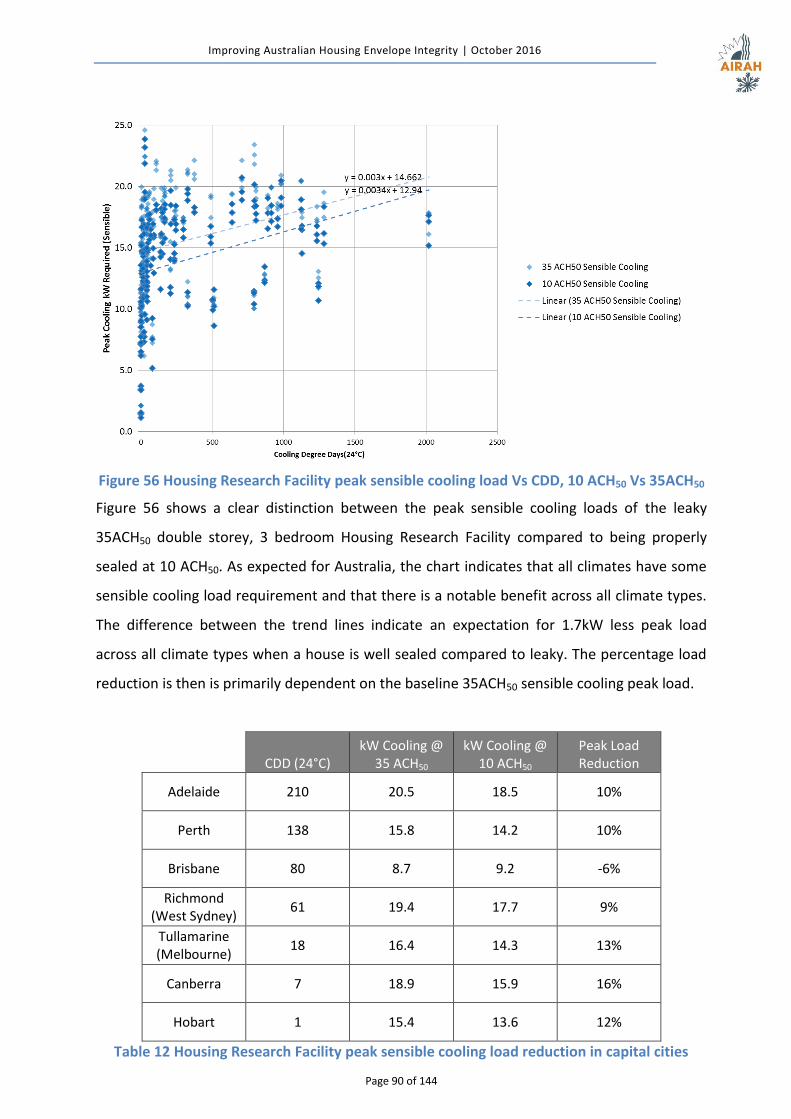
Improving Australian Housing Envelope Integrity | October 2016
Page 90 of 144
Figure 56 Housing Research Facility peak sensible cooling load Vs CDD, 10 ACH50 Vs 35ACH50
Figure 56 shows a clear distinction between the peak sensible cooling loads of the leaky
35ACH50 double storey, 3 bedroom Housing Research Facility compared to being properly
sealed at 10 ACH50. As expected for Australia, the chart indicates that all climates have some
sensible cooling load requirement and that there is a notable benefit across all climate types.
The difference between the trend lines indicate an expectation for 1.7kW less peak load
across all climate types when a house is well sealed compared to leaky. The percentage load
reduction is then is primarily dependent on the baseline 35ACH50 sensible cooling peak load.
CDD (24°C) kW Cooling @
35 ACH50 kW Cooling @
10 ACH50 Peak Load Reduction
Adelaide 210 20.5 18.5 10%
Perth 138 15.8 14.2 10%
Brisbane 80 8.7 9.2 -6%
Richmond (West Sydney)
61 19.4 17.7 9%
Tullamarine (Melbourne)
18 16.4 14.3 13%
Canberra 7 18.9 15.9 16%
Hobart 1 15.4 13.6 12%
Table 12 Housing Research Facility peak sensible cooling load reduction in capital cities
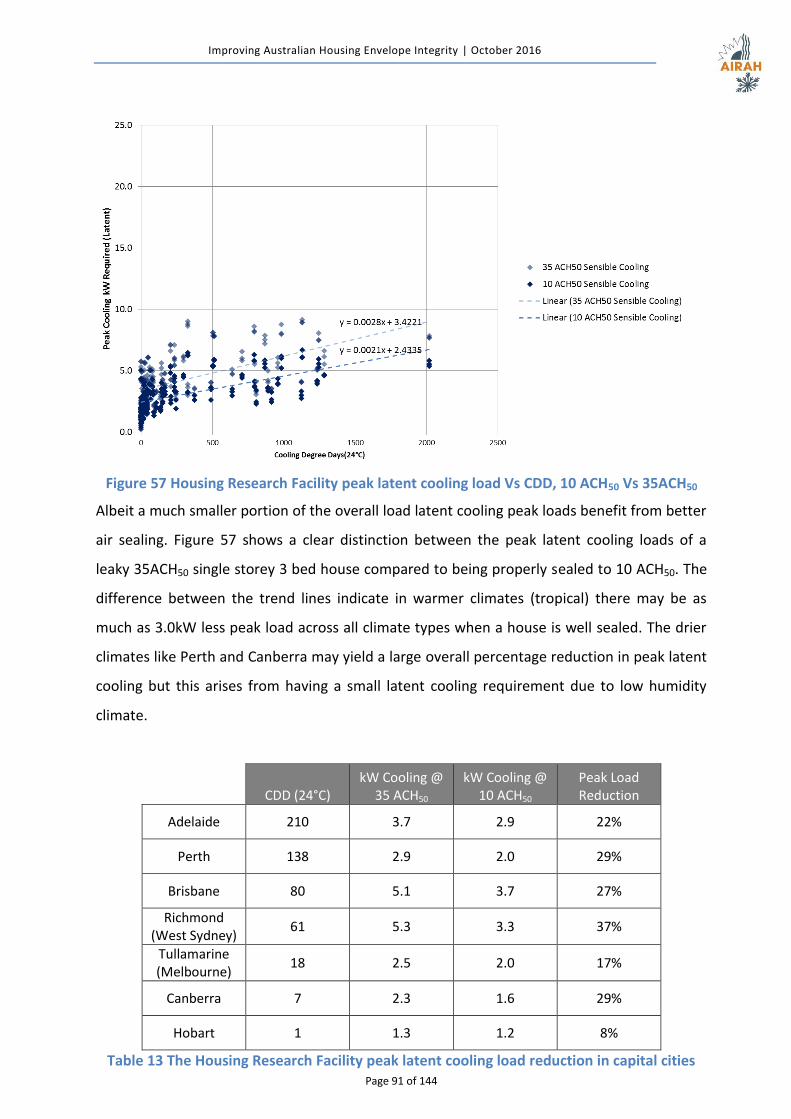
Improving Australian Housing Envelope Integrity | October 2016
Page 91 of 144
Figure 57 Housing Research Facility peak latent cooling load Vs CDD, 10 ACH50 Vs 35ACH50
Albeit a much smaller portion of the overall load latent cooling peak loads benefit from better
air sealing. Figure 57 shows a clear distinction between the peak latent cooling loads of a
leaky 35ACH50 single storey 3 bed house compared to being properly sealed to 10 ACH50. The
difference between the trend lines indicate in warmer climates (tropical) there may be as
much as 3.0kW less peak load across all climate types when a house is well sealed. The drier
climates like Perth and Canberra may yield a large overall percentage reduction in peak latent
cooling but this arises from having a small latent cooling requirement due to low humidity
climate.
CDD (24°C) kW Cooling @
35 ACH50 kW Cooling @
10 ACH50 Peak Load Reduction
Adelaide 210 3.7 2.9 22%
Perth 138 2.9 2.0 29%
Brisbane 80 5.1 3.7 27%
Richmond (West Sydney)
61 5.3 3.3 37%
Tullamarine (Melbourne)
18 2.5 2.0 17%
Canberra 7 2.3 1.6 29%
Hobart 1 1.3 1.2 8%
Table 13 The Housing Research Facility peak latent cooling load reduction in capital cities
Improving Australian Housing Envelope Integrity | October 2016
Page 92 of 144
The correlation between air leakage and peak energy load for heating, sensible cooling and
latent cooling shows that in general there is a reduction of peak load in winter and summer
for all Australian climate zones. Specific climatic factors such as diurnal temperature swing
and construction factors such as building type will affect the overall outcome. The calculations
indicate that in a 6 star rated NatHERS house in any climate zone peak heating load may be
reduced by 21 – 32%, peak sensible cooling by 7 – 22% and peak latent cooling by 1-43%
depending on the external humidity. In specific cases such as double storey buildings (in
Brisbane) which suffer from hot air trapped at the upper level may result in increased cooling
on the upper level, in the particular case of The Housing Research Facility this is outweighed
by reduction in latent peak load reduction.
9 IMPACTS
9.1 Social and Community Impact
The consumer federation supported the adoption of this AS/NZS ISO 9972 standard to enable
consumers to be given further information about the effectiveness of the long term operation
of their homes and associated financial benefits. It will lead to better home performance in
extreme weather events and reduce the likelihood of the elderly or frail from suffering undue
heat related illness and stress, improve fire safety and health and amenity within homes.
A home is often the biggest financial purchase many people will make. Having a standardised
post construction compliance test for air sealing of a home allows build quality testing to be
performed for homes in which they are looking to purchase. This provides certainty that they
are purchasing at least the minimum requirements for construction integrity. The intangible
benefits associated with increased comfort and well-being is synonymous with the energy
savings.
Air sealing any building is essential for obtaining reliable outcomes for improved health,
amenity and energy performance along with preventing misleading claims made by
developers or builders in regards to energy savings or comfort, both of which can be both
severely undermined and highly variable due to uncontrolled air transfer.
9.2 Carbon Reduction Impact
Air sealing is aimed at improving compliance with the energy provisions and closing the gap
between claimed energy performance and real energy performance. The performance based
verification of compliance with P2.6.1 with an emphasis on as-built performance will achieve
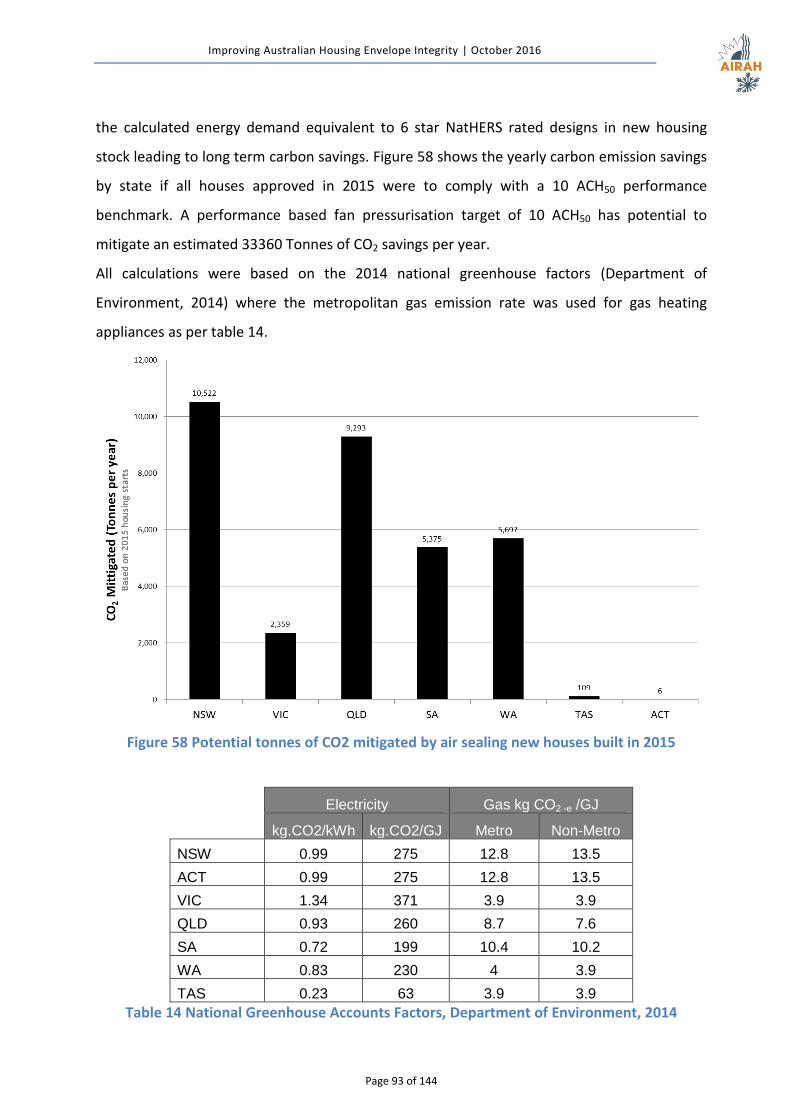
Improving Australian Housing Envelope Integrity | October 2016
Page 93 of 144
the calculated energy demand equivalent to 6 star NatHERS rated designs in new housing
stock leading to long term carbon savings. Figure 58 shows the yearly carbon emission savings
by state if all houses approved in 2015 were to comply with a 10 ACH50 performance
benchmark. A performance based fan pressurisation target of 10 ACH50 has potential to
mitigate an estimated 33360 Tonnes of CO2 savings per year.
All calculations were based on the 2014 national greenhouse factors (Department of
Environment, 2014) where the metropolitan gas emission rate was used for gas heating
appliances as per table 14.
Figure 58 Potential tonnes of CO2 mitigated by air sealing new houses built in 2015
Electricity Gas kg CO2 -e /GJ
kg.CO2/kWh kg.CO2/GJ Metro Non-Metro
NSW 0.99 275 12.8 13.5
ACT 0.99 275 12.8 13.5
VIC 1.34 371 3.9 3.9
QLD 0.93 260 8.7 7.6
SA 0.72 199 10.4 10.2
WA 0.83 230 4 3.9
TAS 0.23 63 3.9 3.9
Table 14 National Greenhouse Accounts Factors, Department of Environment, 2014

Improving Australian Housing Envelope Integrity | October 2016
Page 94 of 144
9.3 Competition
ISO 9972 forms the basis of most international pressurisation testing standards including the
European Norm, EN 13829, the British ATTMA standards and AS/NZS ISO 9972. This aligns
Australia with all European countries currently using pressure testing to meet the energy
efficiency requirements of the European directive. The tools and apparatuses used in the fan
pressurisation of buildings are well developed and established in European and North
American countries. The equipment can be operated to meet any test protocol, the products
and services required to undertake the testing and deliver higher performance in air sealing
are all available in Australia.
A performance based benchmark within the Building Code of Australia incorporating AS/NZS
ISO 9972 target of 10 ACH50 is not restrictive to competition as it requires knowledge and
building techniques which are commonly available in Australia and worldwide to achieve
better building outcomes aligned with BCA objectives. The test equipment can be designed
and manufactured using commercially available techniques and equipment available
anywhere in the world as long as it meets the tolerances as specified in the standard.
The adoption of AS/NZS ISO 9972 in the BCA is likely to drive the development of new
construction measures and innovations to improve the air sealing of buildings to enhance the
compliance with the BCA energy efficiency provisions as has been experienced in all countries
that have codified this technique.
Ideally a building has a zero air leakage factor (0 ACH50) to provide highest energy efficiency
and optimal ventilation systems for water vapour management. To achieve this future
tightening of the performance benchmarks will drive the need for further products, services
and construction methods to be developed along with innovation and upskilling within the
trades sector to realise increased stringency below 10 ACH50. Additionally the development
and commercialisation of new technologies will be required to address evolving issues
associated with air sealing as we further learn to build high performance near Zero Energy
buildings in Australia.
Technology in building products required to drive air sealing to more appropriate levels is
already widely available but not necessarily correctly applied in practice. It is innovation and
technological advancement of construction practices which will be driven mostly by
performance based post construction validation techniques such as fan pressurisation. This
will enable better ways of assembling products together for optimal energy efficiency, health,
amenity, and fire safety outcomes for consumers. This may help to drive both manufacturing
Improving Australian Housing Envelope Integrity | October 2016
Page 95 of 144
and service based innovation.
Construction techniques in Australia have similarities to some parts of the world but Australia
will need to evolve its construction techniques in its own way using domestic knowledge and
innovative products as well as international knowledge and innovation to improve the air
leakage of Australian buildings.
Overall innovation in manufacturing and construction sectors will be driven by performance
based benchmarks incorporated into section 3.12.3 of the BCA volume 2.
9.4 Economic Impact
The savings are largely gained by the end users of buildings with lower energy and running
costs that are closer to the intended National Construction Code 6 star energy performance
benchmark, as well as healthier indoor environments. As consumers begin to value the
tangible and intangible benefits they may begin to increasing expenditure on better products,
better services and better construction techniques in which manufacturers, builders and
consultants could increase revenue.
However, there is an additional cost of testing buildings after they are complete. This cost will
be borne by the builder to gain compliance in which the capital costs will be passed on to the
consumers who will be rewarded with ongoing energy savings
A growth in the service based industry is likely to evolve to enable future increase in the
demand for testing technicians to be met. This may be seen as a growth in consulting and
service based companies as they extend operations within this emerging field.
The overall economic impact is unquestionably positive, saving money for consumers,
increasing job opportunities, increasing building quality, improving energy performance,
improving moisture resilience, improving acoustic performance, reducing associated carbon
dioxide emissions and improving the overall health and well-being of occupants living in these
buildings.
Improving Australian Housing Envelope Integrity | October 2016
Page 96 of 144
10 CONCLUSIONS
Air sealing to a “Fair” level of 10 ACH50 is realistic and achievable with standard
Australian construction practice.
A building code target of value of 10 ACH50 would effectively bring 65% of new houses
tested to a “Fair” level of performance.
AS/NZS ISO 9972 provides a standardised method for industry to verify the
performance of air sealing and in economic terms is valid for inclusion in the building
code.
The energy penalty for high infiltration rates ranges from the equivalent of 1.5 stars
(BCA Zone 3) - 2.4 stars (BCA Zone 1) for extreme infiltration rates of ≥ 35 ACH50.
$255 - 371 million of economic benefit can be gained by $146.7 Million per year
investment in air sealing technologies and practices.
The cost of implementation of air control measures is estimated to be relatively minor
ranging from $163-$1468 per house.
Air sealing will deliver an economic BCR of 1.7 @ 7% discount rate, 2.1 @ 5% discount
rate or 2.5 @ the IPCC recommended 3.5% discount rate for 25 year projections.
A code target of 10 ACH50 has potential to mitigate an estimated 33360 Tonnes of
CO2/year.
Overall innovation in manufacturing and construction sectors will be driven by
performance based benchmarks incorporated into section 3.12.3 of the BCA.
Through driving an emphasis on better design and more improved detailing of
construction methods air sealing will:
o Reduce the longer term relative risk of mortality and sickness by increasing the
ability of the building to naturally maintain comfort conditions.
o Help safeguard occupants from illness or loss of amenity as a result of undue
sound being transmitted from outside or between adjoining dwellings
improving compliance with BCA O2.4.6.
o Enhance the ability to safeguard occupants from illness or injury and protect
the building from damage caused by external humidity entering a building
improving compliance with BCA O2.2.
o Allow highly effective low cost balanced ventilation strategies to:

Improving Australian Housing Envelope Integrity | October 2016
Page 97 of 144
Safeguard occupants from illness or loss of amenity due to lack of air
freshness improving compliance with BCA O 2.4.5.
Safeguard occupants from illness or injury and protect the building
from damage caused by the accumulation of internal moisture in a
building improving compliance with BCA O2.2.
o Improve the ability to prevent the penetration of water in walling systems that
could cause unhealthy or dangerous conditions or loss of amenity for
occupants; and undue dampness or deterioration of building elements
improving compliance with BCA P2.2.2. The correlation between air control
and weatherproofing means that an air tight envelope actually delivers
superior weatherproofing.
o Help to avoid the spread of fire improving compliance with BCA O2.3 by
utilising assessment tools to determine gaps in construction through
identification of air leakage paths.
When a leaky home (35ACH50) is sealed to a “fair” level (10 ACH50) and operated with
effective controlled natural ventilation strategies:
o Peak heating load can be reduced by 21-32% in capital cities.
o Peak sensible cooling load can be reduced by 7-22% in capital cities.
o Peak latent cooling peak load can be reduced by 1-43% in capital cities.
o Peak latent cooling load reduction due to air sealing is largely due to the
prevention of infiltration of humid air, in warmer tropical climates this has the
largest effect.
International practice suggests that a continuous ventilation requirement is necessary
for houses that are sealed below 7 ACH50.
Existing Australian standard AS 1668.2 for ventilation is suitable for reference in
conjunction with AS/NZS ISO 9972 having consideration to managing energy efficiency
with health and amenity objectives of the BCA.
Health concerns exist for the operation of un-flued gas heaters in well-sealed
buildings.
Improving Australian Housing Envelope Integrity | October 2016
Page 98 of 144
11 RECOMMENDATIONS
A performance target of 10 ACH50 is implemented as a performance based measure in
parallel with acceptable construction practice in 2019 code revision.
AS/NZS ISO 9972 is used as the standard test methodology to validate the
performance.
A performance based benchmark is in parallel with acceptable construction practice
until 2022 building code update where performance verification becomes the only
option.
Continuous ventilation rates for houses less than 7 ACH50 should have flow rates as
specified in AS 1668.2.
o AS 1668.2 should be listed for review to optimise the flow rate to minimise
energy penalty while maintaining indoor air quality in line with international
research.
The 2019 building code incorporates requirements for the ventilation system
configuration required to achieve air change effectiveness when performance based
measurements below 7 ACH50 are achieved.
Continuous outdoor air supply in BCA zone 1 (tropical climates) should be
implemented with caution due to the high external humidity.
The building code is updated to ensure all new buildings in Australia meet the intent of
Energy Safe Victoria requirements as outlined in AS/NZS 5601.1.
AS/NZS 5601.1 will need to be addressed in the Plumbing Code of Australia (Clause
E1.2) in conjunction with AS/NZS ISO 9972 performance benchmarks incorporated into
the BCA.
12 Further Investigations
Further investigation into managing moisture in BCA zone 1 (tropical climates) needs
to be undertaken before implementing ventilation requirements in BCA zone 1.
The current performance of Queensland homes as indicated by CSIRO data are
unusually well sealed compared to NSW and Victorian houses and extension of this
data set would be beneficial.
Options for only verifying a portion of buildings; say 50% or 25% of newly constructed
buildings would reduce the financial impost and thereby increasing the BCR in mild
Improving Australian Housing Envelope Integrity | October 2016
Page 99 of 144
climates such as Brisbane. The ability to deliver the desired compliance outcome
would need to be evaluated.
Fan pressurisation testing in Northern Territory be undertaken to understand the air
sealing performance in air conditioned homes. Due to the latent cooling loads air
sealing stands to provide the largest per house benefit out of all states.
Investigations in to the infiltration rates in Tasmanian and South Australian homes is
undertaken to extend the CSIRO data set in these states.
Research is undertaken on integration of evaporative air conditioners in adequately
sealed homes to include these homes within section 3.12.3. Many states that utilise
large portions of evaporative air conditioners in hot dry summers; Victoria, South
Australia, Australian Capital Territory and Western Australia also have cold winters.
Development of Australian design guidance to aid in the selection of building materials
and construction types to prevent the accumulation of internal moisture by managing
water vapour diffusion.
Improving Australian Housing Envelope Integrity | October 2016
Page 100 of 144
13 REFERENCES ABC. (2014, Jan 23). Heatwave blamed for large spike in the number of deaths in Victoria last
week. Australia: ABC.
ABC. (2014, Oct 13). January heatwave: deaths up 24pc, cardiac emergencies up 97pc, analysis shows. Australia: ABC.
ABCB. (2014). Condensation Handbook: Second Edition. Australian Building Codes Board.
ABCB. (2016 , April). Issue 17 - Energy Efficiency and the Increased Use of Perforrmance. Australian Building Regulation Bulletin, pp. 21-22.
ABS. (2014). Environmental Issues: Energy Use and Conservation, Table 4: Main Source of Energy for HEating, Households. Australian Bureau of Statistics.
ABS Housing Approval Data. (2015). Australian Bureau of Statistics.
ActewAGL. (2015, 07 1). ActewAGL. Retrieved 4 7, 2016, from Schedule of Charges fro 1st July 2015: http://www.actewagl.com.au/Product-and-services/Prices.aspx
AGL (NSW). (2015, 07 29). AGL. Retrieved 4 7, 2016, from Energy Proce Fact Sheet, AGL New South Wales Residnetial Gas Regulated Offer: https://www.agl.com.au/residential/energy-plans/electricity-and-gas-plans/price-and-contract-information/price-and-product-information-statements-including-energy-price-fact-sheets
AGL (QLD). (2014, 08 5). AGL. Retrieved 04 07, 2014, from Energy Price Fact Sheet, Queensland Residential Gas Standing Offer: https://www.agl.com.au/residential/energy-plans/electricity-and-gas-plans/price-and-contract-information/price-and-product-information-statements-including-energy-price-fact-sheets
AGL (SA). (2015, 08 03). AGL. Retrieved 04 07, 2016, from Energy Proce Fact Sheet, South Australia Residential Standing Offer: https://www.agl.com.au/residential/energy-plans/electricity-and-gas-plans/price-and-contract-information/price-and-product-information-statements-including-energy-price-fact-sheets
AGL (VIC). (2016, 01 18). AGL. Retrieved 4 7, 2016, from Price and product information statement - AGL Savers™ Energy Plan Victoria, Residential Customers, Gas: https://www.agl.com.au/residential/energy-plans/electricity-and-gas-plans/price-and-contract-information/price-and-product-information-statements-including-energy-price-fact-sheets
Air Conditioner Database. (2015). Retrieved 03 30, 2016, from Equipment Energy Efficiency (E3) program: energyrating.gov.au
Allard, F., & Ghiaus, C. (2005). Natural Ventilation in Urban Environment. AIVC.
Ambrose, M. (2016). Discussion. (J. Clarke, Interviewer)
Ambrose, M., & Syme, M. (2015). House Energy Efficiency Inspections Project. CSIRO and Department of Industry Innovation and Science.
Anderson, A. (1995, Dec). The History of The blower Door. Home Energy Magazine.
ASHRAE. (2010). Standard 62.2-2010 . Ventilation and Acceptable Indoor Air Quality in Low-Rise Residential Buildings. US: ASHRAE.
Improving Australian Housing Envelope Integrity | October 2016
Page 101 of 144
Australian Energy Market Comission. (2014). 2014 Residential Electricity Price Trends . COAG.
Australian Standards. (2016). AS/NZS 5263.1 Gas Applainces. Part 1.3: Gas Space Heating Appliances. SAI Global.
AWN Consultants and Team Ferrari. (2004). Technical Report No. 9: Unflued Gas Apliances and Air Quality in Australian Homes.
Barnett, A. (2015). Mortality risk attributable to high and low ambient temperature: a multicountry observational study. The Lancet.
Berge, A. (2011). Analysis of Methods to Calulate Air Infiltration for Use in ENergy Calculation. Chalmers University of Technology.
Biggs, K. L., Bennie, I., & Michell, D. (1986). Air Peremabilty of Some Australian Houses. Buidling and Environment, Vol. 21, No. 2, 89-96.
BIS Shrapnel. (2011). Building Materials in New Dwellings: External Wall Cladding.
BRANZ. (2010, October). Drained and Ventilated Cavities. BRANZ Bulletin 527.
Chen, D. (2013). Infiltration Calculations in AccuRate V2.0.2.13. CSIRO Sustainable Ecosystems.
Department of Environment. (2014). National Greenhouse Accounts Factors. Department of Environment.
Floyd, W. (February 2014). NatHERS Benchmark Study. Department of Industry.
Frontier Economics. (2015). Electricity Market Forecasts: 2015. AEMO.
Gasparrini, A., Guo, Y., Hashizume, M., Lavigne, E., Zanobetti, A., Schwartz, J., et al. (2015). Mortality risk attributable to high and low ambient temperature: a multicountry observational study. Lancet.
Government of WA, Department of Finance. (2016). Gas Pricing. Retrieved 04 05, 2016, from https://www.finance.wa.gov.au/cms/Public_Utilities_Office/Homes_and_Communities/Gas/Gas_tariff_caps.aspx
HM Government. (2010). Part F: Ventilation, F1 Means of ventilation. The Building Regulations 2000. UK: HM Government.
IPCC. (2007). IPCC. Retrieved 04 04, 2016, from Climate Change 2007: Working Group III: Mitigation of Climate Change: https://www.ipcc.ch/publications_and_data/ar4/wg3/en/ch2s2-4-2-1.html
Long, M. (2014). Architectural Acoustics. Elsevier Science.
Lstiburek, J. W. (2013). First Deal With the Manure then Don't Suck. ASHRAE Journal.
OBPR. (2016, February). Depertment of the Prime Minister and Cabinet. Retrieved 07 13, 2016, from Office of Best Practice Regulation: http://www.dpmc.gov.au/resource-centre/regulation/cost-benefit-analysis-guidance-note
PBMA. (2016). Pliable Building Membrane Association.
Peeters, L. e. (2009). Thermal comfort in residential buildings: Comfort values and scales for building energy simulation. Applied Energy, 772-780.
Reardon, C. (2013). Your Home - Passive Design - Sealing your home. Australian Government.
Roberts, N. (2015, 06 11). Australian Houses are Just Glorified Tents. The AGE.
Improving Australian Housing Envelope Integrity | October 2016
Page 102 of 144
Rudd, A., Lstiburek, J., & Townsend, A. (2009). A Method for Modifying Ventilation Airflow Rates to Achieve Equivalent Ocupant Exposure. Conference Paper - 0908. ASHRAE.
Russell, M., Sherman, M., & Rudd , A. (2005). Review of Residential Ventilation Technologies, Report N0 LBNL 57730 . Lawrence Berkeley Laboratory .
Saman, W., Oliphant, M., Mudge, L., & Halawa, E. (2008). Study of the Effect of Temperature settings on AccuRate Cooling Energy Requirements and Comparison with Monitored Data. Sustainable Energy Centre, Institute of Sustainable Technologies, University of South Australia.
Sherman, M. (1998). The Use of Blower Door Data. Lawrence Berkeley National Laboratory.
Sherman, M. H., & Chan, R. (2004). Building Airtightness: Research and Practice. Lawrence Berkeley National Laboratory: Rerport No. LBNL-53356.
Sherman, M., Turner, J. N., & Walker, I. S. (2011). Infiltration as Ventilation: Weather Induced Dilution. Lawrence Berkley National Laboratories - Environmental Technologies Division.
SKM Gas Market Study Task Force. (2013). Gas Market Modelling Report SH43529. SKM.
Standards Australia. (2008). AS/NZS 4284. Testing of Building Facades. SAI Global.
Standards Australia. (2012). AS 1668.2. The use of ventilation and airconditioning in buildings - Mechanical ventilation in buildings. Sydney, Australia: SAI Global.
Straube, J. (2010, 08 06). Rain Control Theory. Building Science Digest 030.
Straube, J. (2012, October). Energy Leaks How They Waste Energy and Rot Houses. FINE HOMEBUILDING, pp. 45-49.
Sustainability House. (2013). Assisting NatHERS Compliance Market Survey. Department of Resources, Energy and Tourism.
Tas Gas. (2016). Tas Gas. Retrieved 04 05, 2016, from Residential Pricing: https://www.tasgas.com.au/residential-pricing
Walker, I. S., & Wilson, D. J. (April 1998). Field Validation of Algebraic Equations for Stack and Wind Driven Air Infiltration Calculations. SHRAE HVAC&R Research Journal, Vol. 4, No. 2.
Wood, T. (2014). Gas at the crossroads. Grattan Institute.
Improving Australian Housing Envelope Integrity | October 2016
Page 103 of 144
APPENDIX A – PREDICTING ENERGY USE FROM ACH50 RESULTS
There are two different approaches which are possible for utilising pressure testing results for
the prediction of energy in individual buildings, physical and statistical. In a physical model the
building component characteristics are put together into a calculation model with which the
leakages can be simulated. A statistical model sets up a combination of variables which can be
seen to correlate to the airtightness. In Australia little data exists to generate statistical
models for Australian housing leakage characteristics and therefore are not deemed suitable
at this stage. The lack of existing data and research in the Australian context is the primary
reason why the kronvall and Persily (Sherman M. , The Use of Blower Door Data, 1998) rule of
thumb has been used to convert between test results and annual average operational
building air leakage. In this section a discussion of the validity of the Kronvall and Persily
estimation method in Australia is presented and compared to other estimation models.
Internationally the primary existing physical models for conversion between pressure test
results and actual operational air infiltration are:
a) Persily-Kronvall estimation model
b) LBL Infiltration Model
c) Sherman Infiltration Estimation Model
d) ASHARAE enhanced infiltration model
The pressure testing results give an indication of individual building behaviour based on the
characteristics of the leakage paths in the building. Every building will be slightly different in
the pressure flow characteristics and the overall quantities of air which leak through the
envelope. The actual air leakage at any given time is based on temperature differential
between inside and outside and site wind conditions.
AS/NZS ISO 9972 describes the total envelope leakage using the power law seen in Equation
(1). With the power law, the total flow is considered to be somewhere between laminar and
turbulent. As the flow takes different forms at different leakage paths and at different
pressure differences, this is an approximation.
�̇� = 𝐶𝐿 · (∆𝑃)𝑛
Where,
V̇ is the infiltration air flow [m³ /s] 𝐶𝐿 is a constant [m³ /s·Pa] n is an exponent [-]
(1)
Improving Australian Housing Envelope Integrity | October 2016
Page 104 of 144
From the characteristics and mathematical relationship between air leakage and pressure it is
possible to utilise known calculation methodologies to determine how the building will leak
under any given set of temperature and wind conditions. This allows energy use to be
calculated based on a variable infiltration model in the energy prediction models such as
those used in NatHERS.
Persily-Kronvall estimation model
The Persily-Kronvall estimation model is the simplest possible model. It is shown in Equation
(1) and Equation 2. It assumes that there is a linear relation between the q50 value and the
annual infiltration.
𝑞𝑖𝑛𝑓 = 𝑞50
20
Where
qinf is the average airflow over the year [𝑙/(𝑠 · 𝑚²)]
q50 is the permeability at 50Pa pressure difference [𝑙/(𝑠 · 𝑚²)]
This is directly transferable to air change rates.
𝐴𝐶𝐻−1 = 𝐴𝐶𝐻50
20
Where
ACH-1 is the average air flow over the year [ACH] ACH50 is the air change rate at 50Pa [ACH50]
This is a climate independent model and allows for average infiltration energy modelling using
annual average infiltration rate that is assumed to remain constant throughout the year.
LBL Infiltration Model
The LBL Infiltration Model was developed at Lawrence Berkley Laboratories in the early
eighties. The total flow through the envelope is calculated by superposition of the
contributions from wind and stack, shown in Equation (4).
To describe the building the model uses the equivalent leakage area which can be obtained
from a fan pressurization test. The rest of the flow terms are separated into a constant and a
variable part, see Equation (5). For the flow from wind, the variable part is the wind speed
and the constant part contains information about sheltering and terrain, see Equation (6). For
flow from stack the variable part is the temperature difference between indoor and outdoor
and the constant contains information on leakage distribution and building height, see
(2)
(3)
Improving Australian Housing Envelope Integrity | October 2016
Page 105 of 144
Equation (7) (Sherman M. , The Use of Blower Door Data, 1998)The equation follows the
climate data time step and for each step the infiltration is calculated from the actual wind
speed and temperature.
�̇� = √�̇�𝑤² + 𝑉�̇�²
�̇� = 𝐸𝐿𝐴 · √𝑓𝑤² · 𝑈2 + 𝑓𝑠² · ∆T
𝑓𝑤 = 𝐶′ · (1 − 𝑅)1/3 · 𝐴 · (𝐻
10)
𝐵
𝑓𝑠 = (1 −
𝑅2)
1/3
3 · (1 −
𝑥2𝐻
(2 − 𝑅2))
3/2
· √(𝑔 · 𝐻
𝑇𝑖)
𝑅 = 𝐸𝐿𝐴𝐶 + 𝐸𝐿𝐴𝑓
𝐸𝐿𝐴
𝑥 = 𝐸𝐿𝐴𝐶 − 𝐸𝐿𝐴𝑓
𝐸𝐿𝐴
Where
�̇�is the infiltration air flow [m³ /s]
�̇�𝑤 is the infiltration air flow induced by wind [m³ /s]
�̇�𝑠 is the infiltration air flow induced by the stack effect [m³ /s] ELA is the equivalent leakage area [cm²] U is the wind speed at a nearby weather station [m/s] ∆T is the temperature difference [°C] C’ is the shielding coefficient [-] A and B are terrain coefficients [-] H is the building height [m] g is the gravitational constant [m/s² ] 𝑇𝑖 is the indoor temperature[K] 𝐸𝐿𝐴𝑐 is the leakage through the ceiling [cm²] 𝐸𝐿𝐴𝑓 is the leakage through the floor [cm²]
The model uses the Equivalent leakage area, ELA, at a 4 Pa pressure difference to describe the
leakages. The infiltration is governed by the transient weather data which generates transient
(4)
(5)
(6)
(7)
(8)
(9)

Improving Australian Housing Envelope Integrity | October 2016
Page 106 of 144
leakage rate information. Thus, the energy usage can also be calculated for transient
conditions. The ELA is calculated according to ASTM E779 with a discharge co-efficient, 𝐶𝑑 of
1.0 and ∆𝑃 of 4Pa. The flow rate at 4Pa, 𝑄 ∆𝑃, is estimated from the air change rate and the n
exponent from equation (1). Equation (10) describes the relationship between ELA, pressure
and flow rate.
𝐸𝐿𝐴 = 𝑄 ∆𝑃
𝐶𝑑 · √(
𝜌
2 · ∆𝑃)
Where,
ELA is the Equivalent Leakage Area [m²]
∆𝑃 is the pressure difference [Pa] 𝑄 ∆𝑃 is the airflow rate per unit area at pressure difference ∆P (ASTM E779 states 4Pa) [m³/s] 𝐶𝑑 is the discharge coefficient (ASTM E779 states 1.0) [dimensionless] 𝜌 is the density of air [kg/m³]
Sherman Infiltration Estimation Model
Sherman (1987) has made a development of the Kronvall Persily estimation model using a
simplification from the LBL Infiltration Method. The model assumes a linear relation between
the infiltration and the leakage at 50Pa pressure difference, see Equation (10). The difference
from the Persily Kronvall estimation model is that the constant depends on local data of the
analysed object, see Equation (11). Averaged local weather data is used for the specific
infiltration, savg [m/s], in Equation (12) and the correction factors cf1 -cf3 are corrections for
crack type, building height and shelter conditions.
𝑞𝑖𝑛𝑓 = 𝑞50
𝑁
𝑁 = 14
𝑆𝑎· 𝑐𝑓1 · 𝑐𝑓2 · 𝑐𝑓3
𝑆𝑎𝑣𝑔 = √𝑓𝑤² · 𝑈𝑎𝑣𝑔2 + 𝑓𝑠² · |∆𝑇𝑎𝑣𝑔|
Where
qinf is the average infiltration flow over the year [l/(s·m2 )] q50 is the permeability at 50 Pa reference pressure [l/(s·m2 )] N is a constant [-] Savg is the average specific infiltration [m/s]
cf1, cf2 and cf3 are correction factors [-] fw is the wind factor and is set to 0.13 [-] Uavg is the average annual wind speed [m/s]
Uavg is the stack factor and is set to 0.12 [m/(s·K1/2 )
(10)
(11)
(12)
Improving Australian Housing Envelope Integrity | October 2016
Page 107 of 144
∆Tavg is the annual average temperature difference [⁰C]
The model uses the permeability at 50Pa pressure difference as leakage description. For
infiltration the average values of temperature and wind speed is used which makes it
unnecessary to use anything more specific than an averaged model to calculate the energy.
ASHARAE enhanced infiltration model
The ASHRAE Enhanced Infiltration model is used in the ASHRAE 62.2 standard developed for
utilising ventilation to protect indoor air quality in residential buildings.
A Lawrence Berkley Laboratories publication (Sherman, Turner, & Walker, Infiltration as
Ventilation: Weather Induced Dilution, 2011) states that:
“The enhanced infiltration model and shelter class selection used for the calculations
resulted in conservative values of infiltration……..These assumptions make the use of
the derived values directly appropriate for applying to equivalent ventilation
calculations and IAQ, but they would significantly underestimate energy impacts and
so are not appropriate.”
For this reason this model has not been considered for validation against the rule of thumb.
LBL model VS Persily-Kronvall model
Calculations were carried out to compare the time and weather dependent LBL model against
the Kronvall and Persily model. The infiltration in the LBL model is governed by the transient
weather data which generates transient leakage rate information. This makes it possible to
determine if the annual average infiltration for typical house assumptions in Australian
climate conditions (wind and temperature) is likely to obey the Kronvall and Persily model.
Kronval and Persily model simply states that the annual average air infiltration is 1/20th or 5%
of the ACH50 test result as shown in equation (2).
Following the procedure outlined in Figure 59 for a typical 200m² single storey and double
storey house then the divisor is able to be calculated and compared to the denominator of 20.
This enables the calculation of an “N” value as per equation (10) in the Sherman Infiltration
Estimation Model, however based on the time dependent climatic conditions.
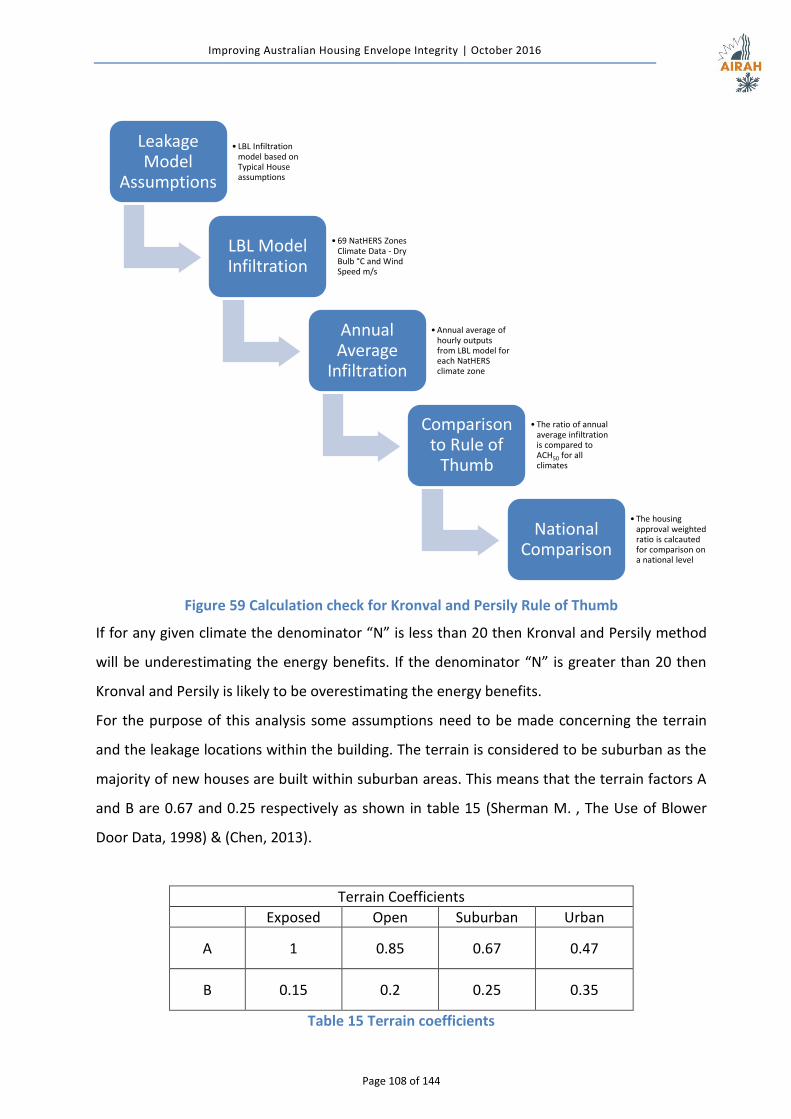
Improving Australian Housing Envelope Integrity | October 2016
Page 108 of 144
Figure 59 Calculation check for Kronval and Persily Rule of Thumb
If for any given climate the denominator “N” is less than 20 then Kronval and Persily method
will be underestimating the energy benefits. If the denominator “N” is greater than 20 then
Kronval and Persily is likely to be overestimating the energy benefits.
For the purpose of this analysis some assumptions need to be made concerning the terrain
and the leakage locations within the building. The terrain is considered to be suburban as the
majority of new houses are built within suburban areas. This means that the terrain factors A
and B are 0.67 and 0.25 respectively as shown in table 15 (Sherman M. , The Use of Blower
Door Data, 1998) & (Chen, 2013).
Terrain Coefficients
Exposed Open Suburban Urban
A 1 0.85 0.67 0.47
B 0.15 0.2 0.25 0.35
Table 15 Terrain coefficients
Leakage Model
Assumptions
• LBL Infiltration model based on Typical House assumptions
LBL Model Infiltration
• 69 NatHERS Zones Climate Data - Dry Bulb °C and Wind Speed m/s
Annual Average
Infiltration
• Annual average of hourly outputs from LBL model for each NatHERS climate zone
Comparison to Rule of
Thumb
• The ratio of annual average infiltration is compared to ACH50 for all climates
National Comparison
• The housing approval weighted ratio is calcauted for comparison on a national level
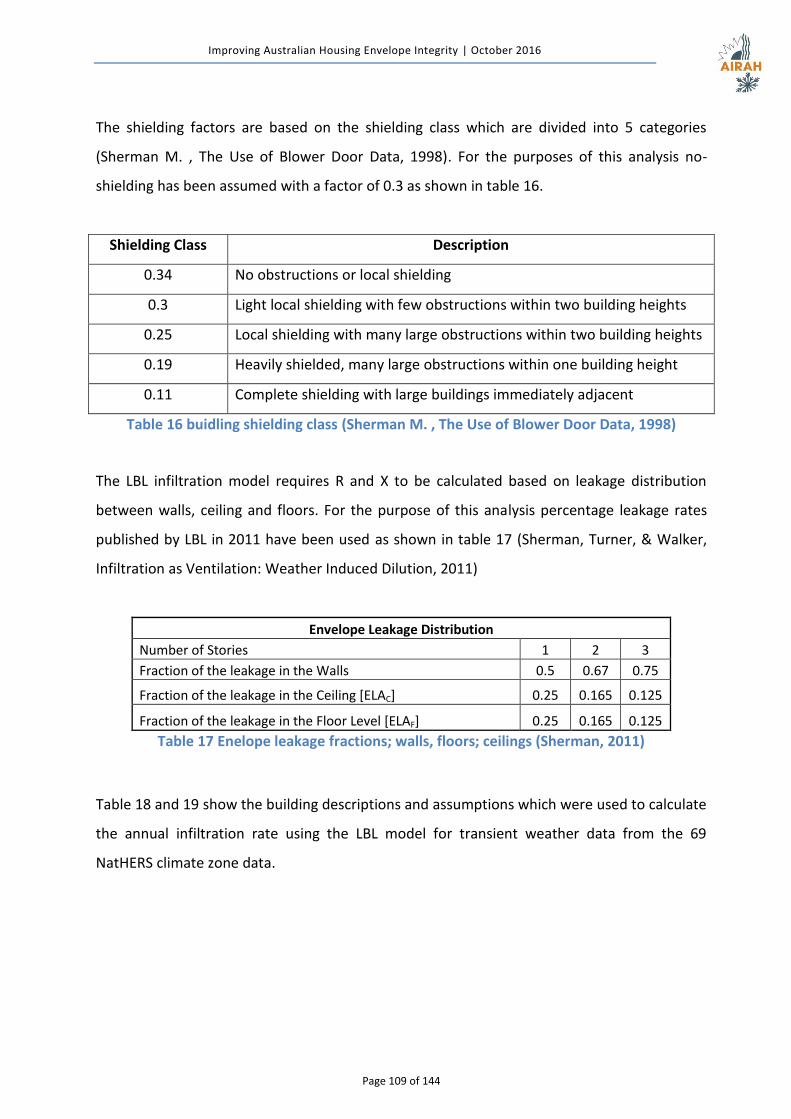
Improving Australian Housing Envelope Integrity | October 2016
Page 109 of 144
The shielding factors are based on the shielding class which are divided into 5 categories
(Sherman M. , The Use of Blower Door Data, 1998). For the purposes of this analysis no-
shielding has been assumed with a factor of 0.3 as shown in table 16.
Shielding Class Description
0.34 No obstructions or local shielding
0.3 Light local shielding with few obstructions within two building heights
0.25 Local shielding with many large obstructions within two building heights
0.19 Heavily shielded, many large obstructions within one building height
0.11 Complete shielding with large buildings immediately adjacent
Table 16 buidling shielding class (Sherman M. , The Use of Blower Door Data, 1998)
The LBL infiltration model requires R and X to be calculated based on leakage distribution
between walls, ceiling and floors. For the purpose of this analysis percentage leakage rates
published by LBL in 2011 have been used as shown in table 17 (Sherman, Turner, & Walker,
Infiltration as Ventilation: Weather Induced Dilution, 2011)
Envelope Leakage Distribution
Number of Stories 1 2 3
Fraction of the leakage in the Walls 0.5 0.67 0.75
Fraction of the leakage in the Ceiling [ELAC] 0.25 0.165 0.125
Fraction of the leakage in the Floor Level [ELAF] 0.25 0.165 0.125
Table 17 Enelope leakage fractions; walls, floors; ceilings (Sherman, 2011)
Table 18 and 19 show the building descriptions and assumptions which were used to calculate
the annual infiltration rate using the LBL model for transient weather data from the 69
NatHERS climate zone data.
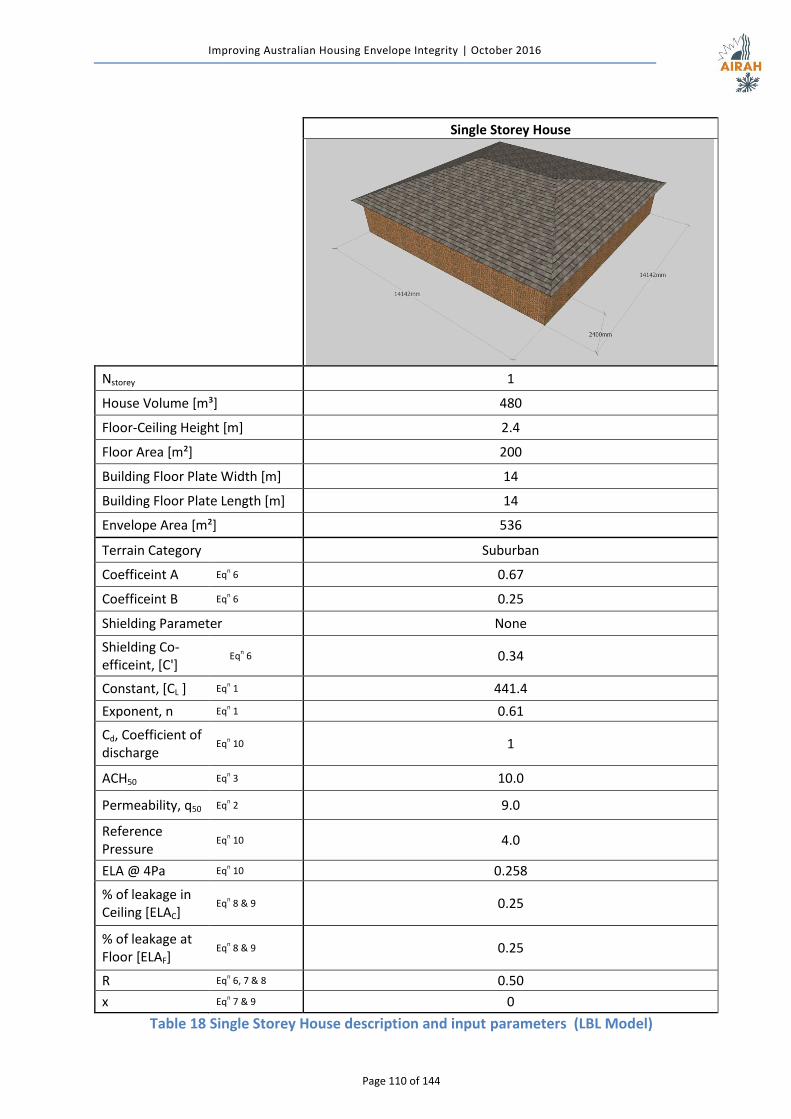
Improving Australian Housing Envelope Integrity | October 2016
Page 110 of 144
Single Storey House
Nstorey 1
House Volume [m³] 480
Floor-Ceiling Height [m] 2.4
Floor Area [m²] 200
Building Floor Plate Width [m] 14
Building Floor Plate Length [m] 14
Envelope Area [m²] 536
Terrain Category Suburban
Coefficeint A Eqn 6 0.67
Coefficeint B Eqn 6 0.25
Shielding Parameter None
Shielding Co-efficeint, [C']
Eqn 6 0.34
Constant, [CL ] Eqn 1 441.4
Exponent, n Eqn 1 0.61
Cd, Coefficient of discharge
Eqn 10 1
ACH50 Eqn 3 10.0
Permeability, q50 Eqn 2 9.0
Reference Pressure
Eqn 10 4.0
ELA @ 4Pa Eqn 10 0.258
% of leakage in Ceiling [ELAC]
Eqn 8 & 9 0.25
% of leakage at Floor [ELAF]
Eqn 8 & 9 0.25
R Eqn 6, 7 & 8 0.50
x Eqn 7 & 9 0
Table 18 Single Storey House description and input parameters (LBL Model)
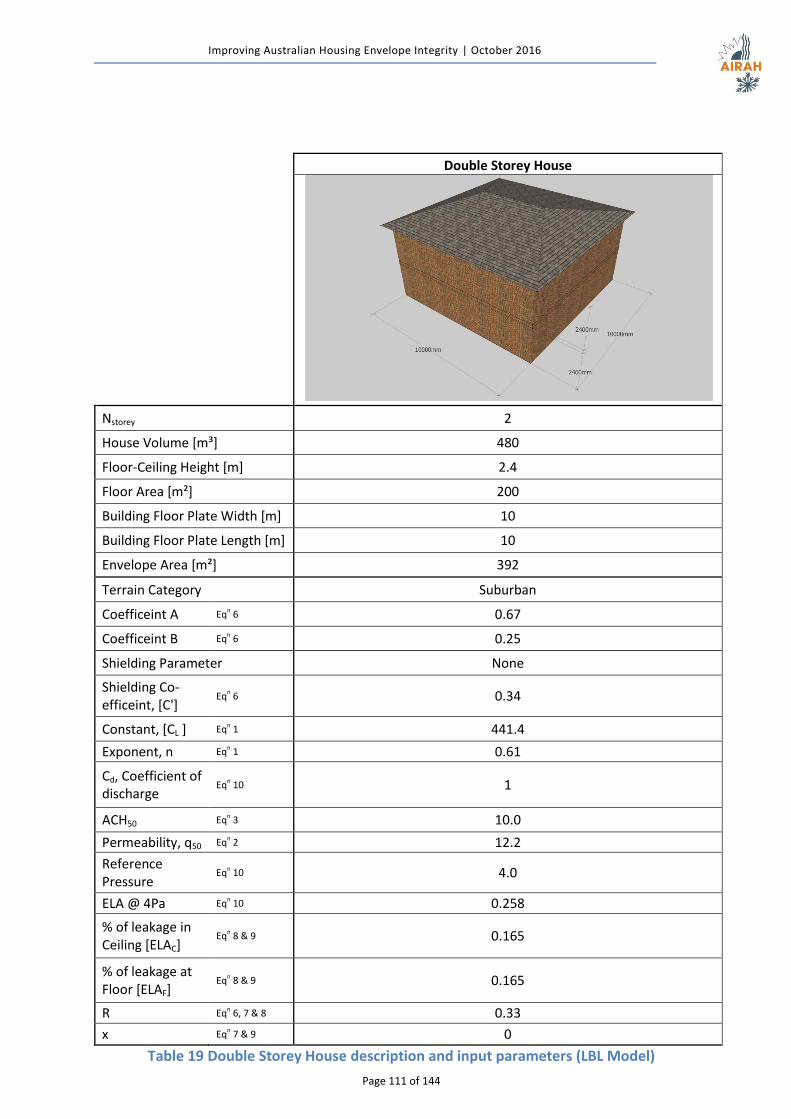
Improving Australian Housing Envelope Integrity | October 2016
Page 111 of 144
Double Storey House
Nstorey 2
House Volume [m³] 480
Floor-Ceiling Height [m] 2.4
Floor Area [m²] 200
Building Floor Plate Width [m] 10
Building Floor Plate Length [m] 10
Envelope Area [m²] 392
Terrain Category Suburban
Coefficeint A Eqn 6 0.67
Coefficeint B Eqn 6 0.25
Shielding Parameter None
Shielding Co-efficeint, [C']
Eqn 6 0.34
Constant, [CL ] Eqn 1 441.4
Exponent, n Eqn 1 0.61
Cd, Coefficient of discharge
Eqn 10 1
ACH50 Eqn 3 10.0
Permeability, q50 Eqn 2 12.2
Reference Pressure
Eqn 10 4.0
ELA @ 4Pa Eqn 10 0.258
% of leakage in Ceiling [ELAC]
Eqn 8 & 9 0.165
% of leakage at Floor [ELAF]
Eqn 8 & 9 0.165
R Eqn 6, 7 & 8 0.33
x Eqn 7 & 9 0
Table 19 Double Storey House description and input parameters (LBL Model)
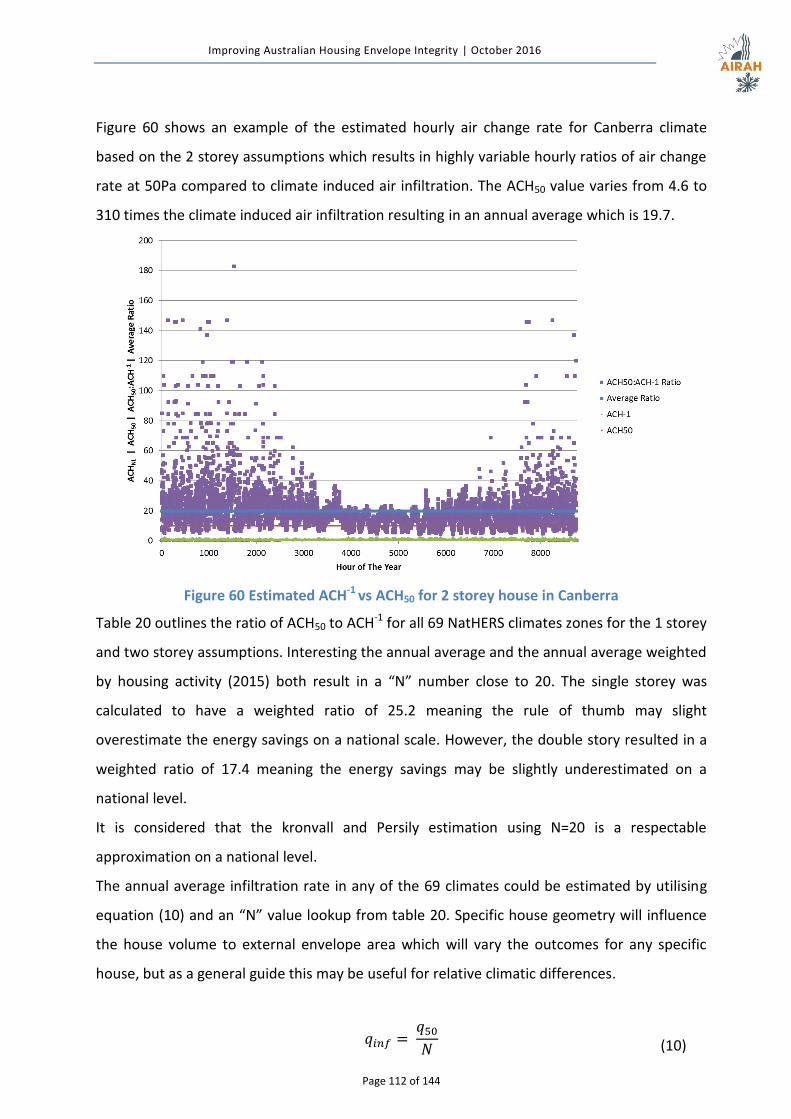
Improving Australian Housing Envelope Integrity | October 2016
Page 112 of 144
Figure 60 shows an example of the estimated hourly air change rate for Canberra climate
based on the 2 storey assumptions which results in highly variable hourly ratios of air change
rate at 50Pa compared to climate induced air infiltration. The ACH50 value varies from 4.6 to
310 times the climate induced air infiltration resulting in an annual average which is 19.7.
Figure 60 Estimated ACH-1 vs ACH50 for 2 storey house in Canberra
Table 20 outlines the ratio of ACH50 to ACH-1 for all 69 NatHERS climates zones for the 1 storey
and two storey assumptions. Interesting the annual average and the annual average weighted
by housing activity (2015) both result in a “N” number close to 20. The single storey was
calculated to have a weighted ratio of 25.2 meaning the rule of thumb may slight
overestimate the energy savings on a national scale. However, the double story resulted in a
weighted ratio of 17.4 meaning the energy savings may be slightly underestimated on a
national level.
It is considered that the kronvall and Persily estimation using N=20 is a respectable
approximation on a national level.
The annual average infiltration rate in any of the 69 climates could be estimated by utilising
equation (10) and an “N” value lookup from table 20. Specific house geometry will influence
the house volume to external envelope area which will vary the outcomes for any specific
house, but as a general guide this may be useful for relative climatic differences.
𝑞𝑖𝑛𝑓 = 𝑞50
𝑁 (10)
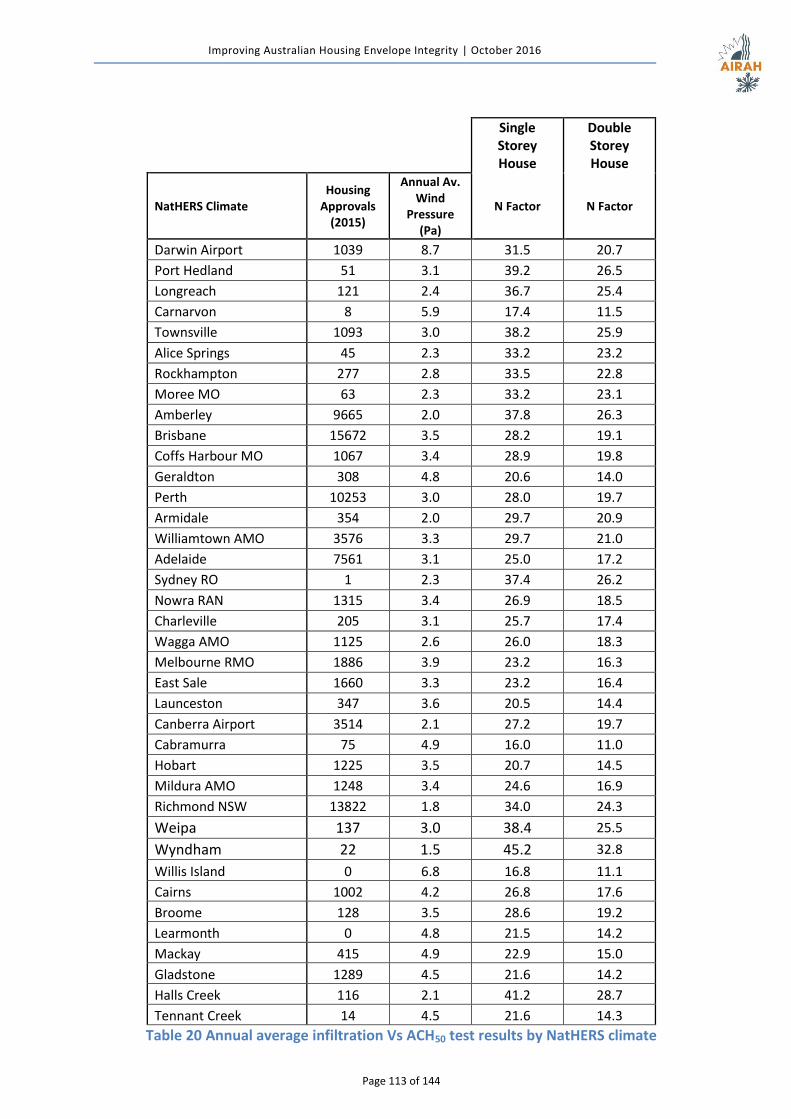
Improving Australian Housing Envelope Integrity | October 2016
Page 113 of 144
Single Storey House
Double Storey House
NatHERS Climate Housing
Approvals (2015)
Annual Av. Wind
Pressure (Pa)
N Factor N Factor
Darwin Airport 1039 8.7 31.5 20.7
Port Hedland 51 3.1 39.2 26.5
Longreach 121 2.4 36.7 25.4
Carnarvon 8 5.9 17.4 11.5
Townsville 1093 3.0 38.2 25.9
Alice Springs 45 2.3 33.2 23.2
Rockhampton 277 2.8 33.5 22.8
Moree MO 63 2.3 33.2 23.1
Amberley 9665 2.0 37.8 26.3
Brisbane 15672 3.5 28.2 19.1
Coffs Harbour MO 1067 3.4 28.9 19.8
Geraldton 308 4.8 20.6 14.0
Perth 10253 3.0 28.0 19.7
Armidale 354 2.0 29.7 20.9
Williamtown AMO 3576 3.3 29.7 21.0
Adelaide 7561 3.1 25.0 17.2
Sydney RO 1 2.3 37.4 26.2
Nowra RAN 1315 3.4 26.9 18.5
Charleville 205 3.1 25.7 17.4
Wagga AMO 1125 2.6 26.0 18.3
Melbourne RMO 1886 3.9 23.2 16.3
East Sale 1660 3.3 23.2 16.4
Launceston 347 3.6 20.5 14.4
Canberra Airport 3514 2.1 27.2 19.7
Cabramurra 75 4.9 16.0 11.0
Hobart 1225 3.5 20.7 14.5
Mildura AMO 1248 3.4 24.6 16.9
Richmond NSW 13822 1.8 34.0 24.3
Weipa 137 3.0 38.4 25.5
Wyndham 22 1.5 45.2 32.8
Willis Island 0 6.8 16.8 11.1
Cairns 1002 4.2 26.8 17.6
Broome 128 3.5 28.6 19.2
Learmonth 0 4.8 21.5 14.2
Mackay 415 4.9 22.9 15.0
Gladstone 1289 4.5 21.6 14.2
Halls Creek 116 2.1 41.2 28.7
Tennant Creek 14 4.5 21.6 14.3
Table 20 Annual average infiltration Vs ACH50 test results by NatHERS climate
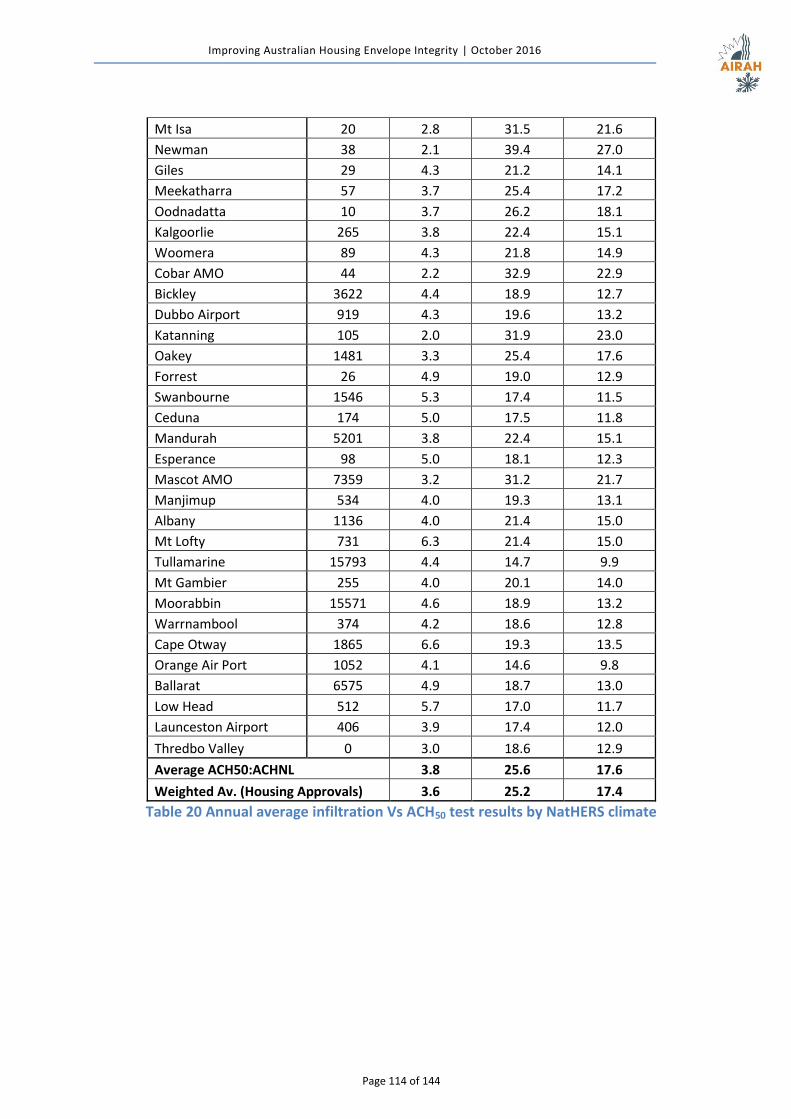
Improving Australian Housing Envelope Integrity | October 2016
Page 114 of 144
Mt Isa 20 2.8 31.5 21.6
Newman 38 2.1 39.4 27.0
Giles 29 4.3 21.2 14.1
Meekatharra 57 3.7 25.4 17.2
Oodnadatta 10 3.7 26.2 18.1
Kalgoorlie 265 3.8 22.4 15.1
Woomera 89 4.3 21.8 14.9
Cobar AMO 44 2.2 32.9 22.9
Bickley 3622 4.4 18.9 12.7
Dubbo Airport 919 4.3 19.6 13.2
Katanning 105 2.0 31.9 23.0
Oakey 1481 3.3 25.4 17.6
Forrest 26 4.9 19.0 12.9
Swanbourne 1546 5.3 17.4 11.5
Ceduna 174 5.0 17.5 11.8
Mandurah 5201 3.8 22.4 15.1
Esperance 98 5.0 18.1 12.3
Mascot AMO 7359 3.2 31.2 21.7
Manjimup 534 4.0 19.3 13.1
Albany 1136 4.0 21.4 15.0
Mt Lofty 731 6.3 21.4 15.0
Tullamarine 15793 4.4 14.7 9.9
Mt Gambier 255 4.0 20.1 14.0
Moorabbin 15571 4.6 18.9 13.2
Warrnambool 374 4.2 18.6 12.8
Cape Otway 1865 6.6 19.3 13.5
Orange Air Port 1052 4.1 14.6 9.8
Ballarat 6575 4.9 18.7 13.0
Low Head 512 5.7 17.0 11.7
Launceston Airport 406 3.9 17.4 12.0
Thredbo Valley 0 3.0 18.6 12.9
Average ACH50:ACHNL 3.8 25.6 17.6
Weighted Av. (Housing Approvals) 3.6 25.2 17.4
Table 20 Annual average infiltration Vs ACH50 test results by NatHERS climate
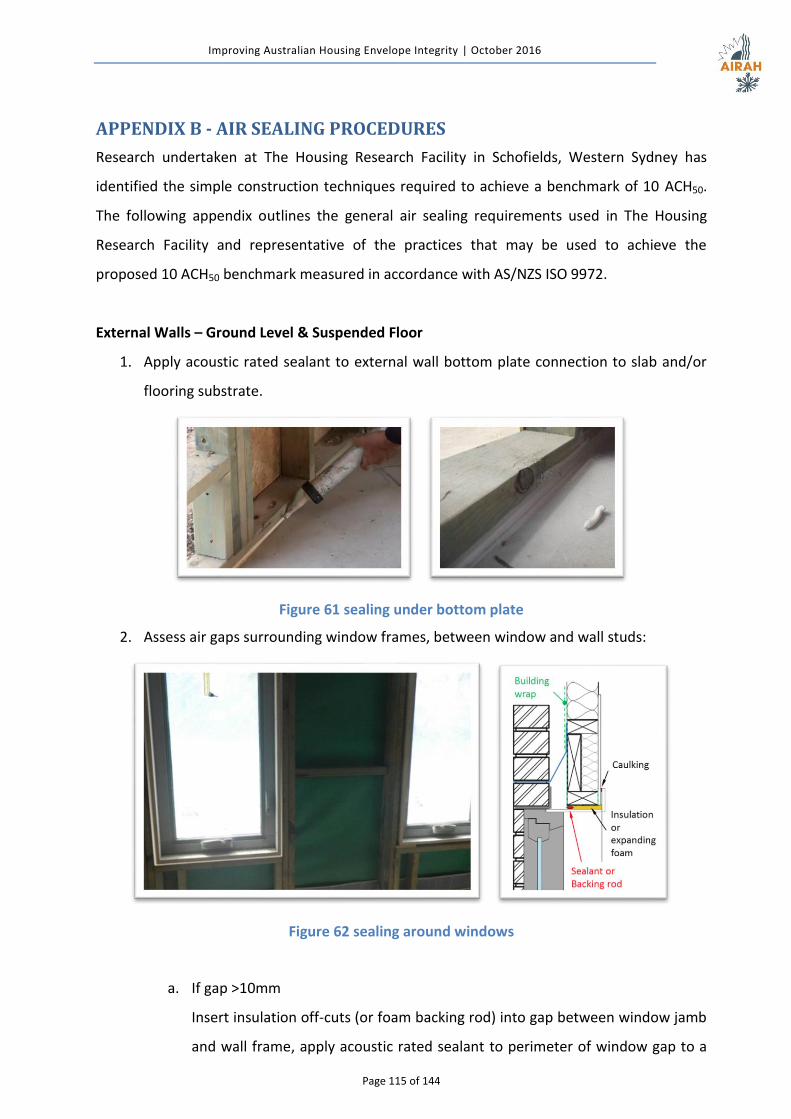
Improving Australian Housing Envelope Integrity | October 2016
Page 115 of 144
APPENDIX B - AIR SEALING PROCEDURES
Research undertaken at The Housing Research Facility in Schofields, Western Sydney has
identified the simple construction techniques required to achieve a benchmark of 10 ACH50.
The following appendix outlines the general air sealing requirements used in The Housing
Research Facility and representative of the practices that may be used to achieve the
proposed 10 ACH50 benchmark measured in accordance with AS/NZS ISO 9972.
External Walls – Ground Level & Suspended Floor
1. Apply acoustic rated sealant to external wall bottom plate connection to slab and/or
flooring substrate.
Figure 61 sealing under bottom plate
2. Assess air gaps surrounding window frames, between window and wall studs:
Figure 62 sealing around windows
a. If gap >10mm
Insert insulation off-cuts (or foam backing rod) into gap between window jamb
and wall frame, apply acoustic rated sealant to perimeter of window gap to a
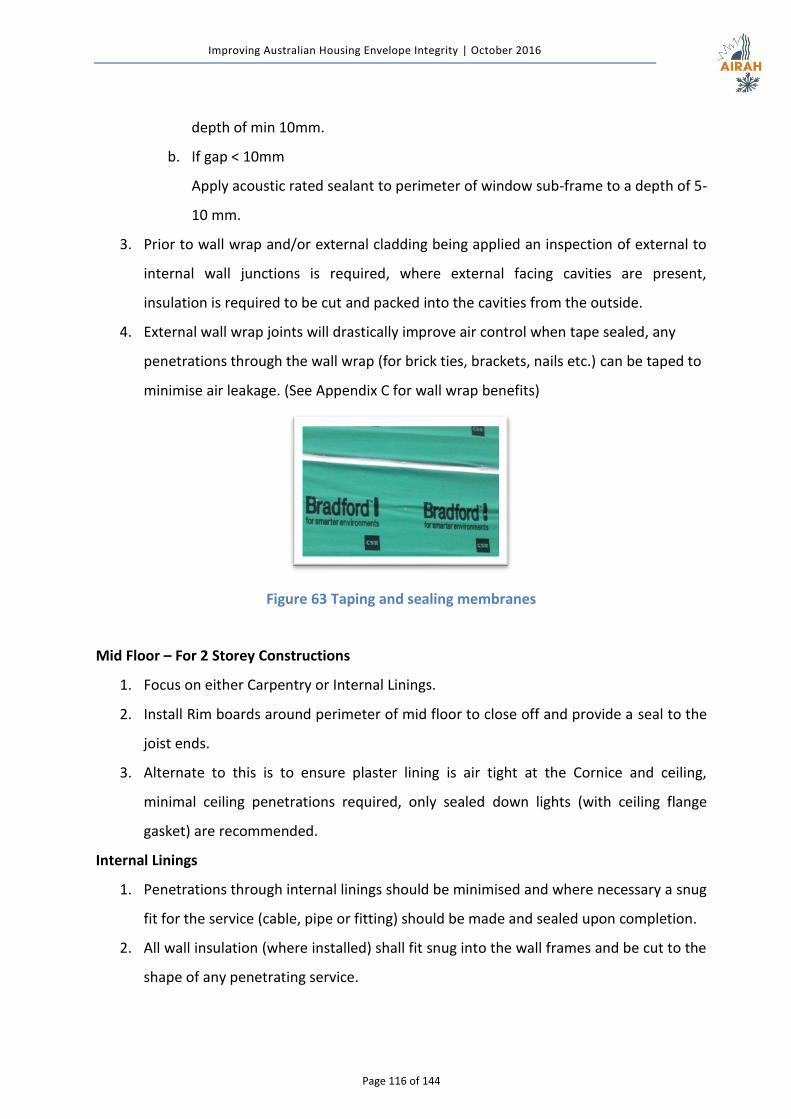
Improving Australian Housing Envelope Integrity | October 2016
Page 116 of 144
depth of min 10mm.
b. If gap < 10mm
Apply acoustic rated sealant to perimeter of window sub-frame to a depth of 5-
10 mm.
3. Prior to wall wrap and/or external cladding being applied an inspection of external to
internal wall junctions is required, where external facing cavities are present,
insulation is required to be cut and packed into the cavities from the outside.
4. External wall wrap joints will drastically improve air control when tape sealed, any
penetrations through the wall wrap (for brick ties, brackets, nails etc.) can be taped to
minimise air leakage. (See Appendix C for wall wrap benefits)
Figure 63 Taping and sealing membranes
Mid Floor – For 2 Storey Constructions
1. Focus on either Carpentry or Internal Linings.
2. Install Rim boards around perimeter of mid floor to close off and provide a seal to the
joist ends.
3. Alternate to this is to ensure plaster lining is air tight at the Cornice and ceiling,
minimal ceiling penetrations required, only sealed down lights (with ceiling flange
gasket) are recommended.
Internal Linings
1. Penetrations through internal linings should be minimised and where necessary a snug
fit for the service (cable, pipe or fitting) should be made and sealed upon completion.
2. All wall insulation (where installed) shall fit snug into the wall frames and be cut to the
shape of any penetrating service.
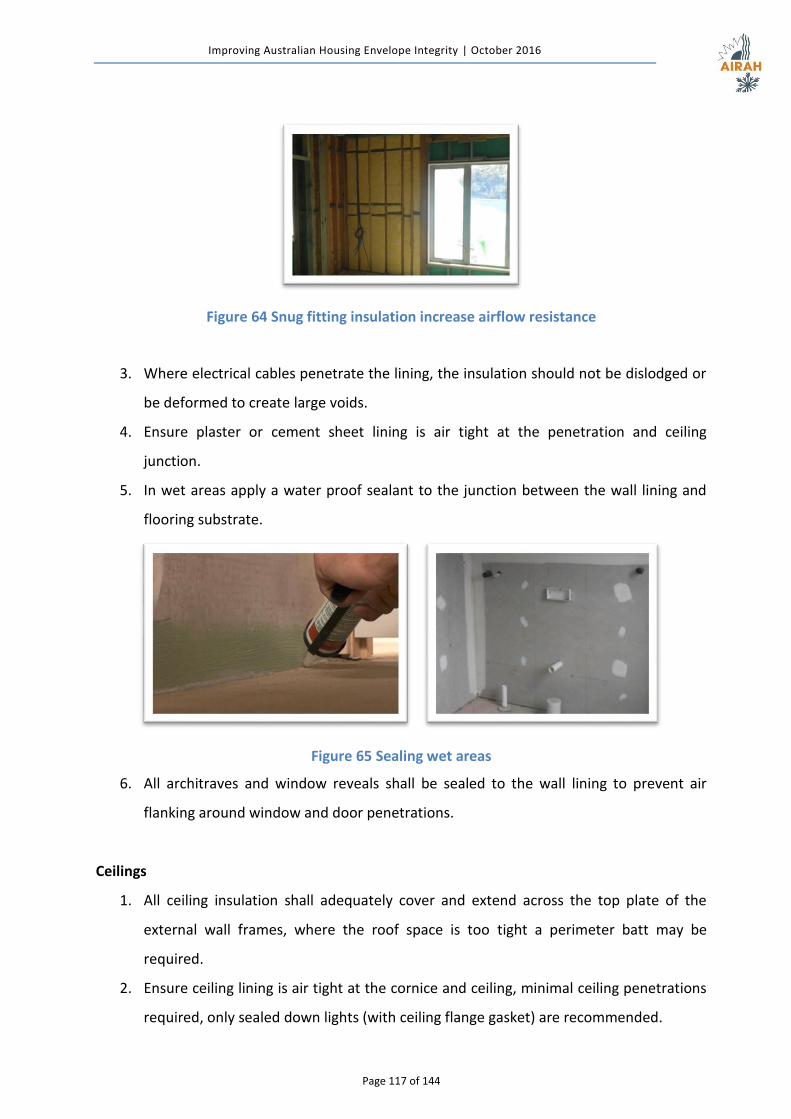
Improving Australian Housing Envelope Integrity | October 2016
Page 117 of 144
Figure 64 Snug fitting insulation increase airflow resistance
3. Where electrical cables penetrate the lining, the insulation should not be dislodged or
be deformed to create large voids.
4. Ensure plaster or cement sheet lining is air tight at the penetration and ceiling
junction.
5. In wet areas apply a water proof sealant to the junction between the wall lining and
flooring substrate.
Figure 65 Sealing wet areas
6. All architraves and window reveals shall be sealed to the wall lining to prevent air
flanking around window and door penetrations.
Ceilings
1. All ceiling insulation shall adequately cover and extend across the top plate of the
external wall frames, where the roof space is too tight a perimeter batt may be
required.
2. Ensure ceiling lining is air tight at the cornice and ceiling, minimal ceiling penetrations
required, only sealed down lights (with ceiling flange gasket) are recommended.
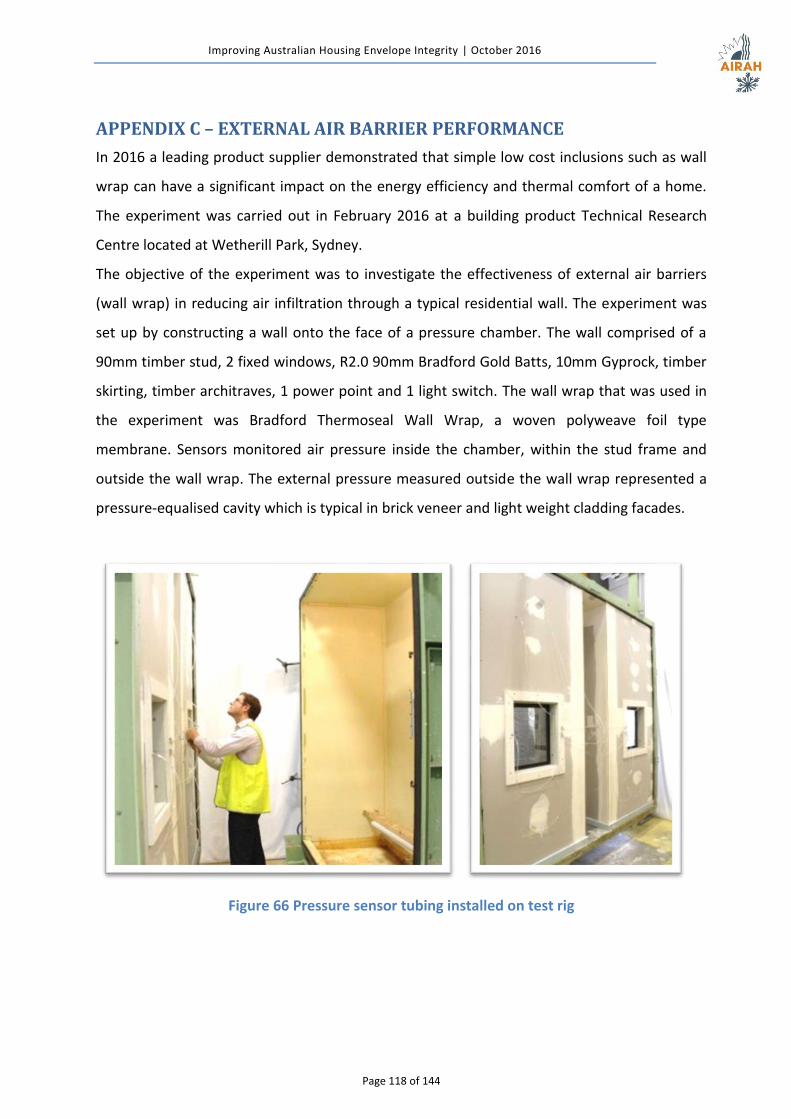
Improving Australian Housing Envelope Integrity | October 2016
Page 118 of 144
APPENDIX C – EXTERNAL AIR BARRIER PERFORMANCE
In 2016 a leading product supplier demonstrated that simple low cost inclusions such as wall
wrap can have a significant impact on the energy efficiency and thermal comfort of a home.
The experiment was carried out in February 2016 at a building product Technical Research
Centre located at Wetherill Park, Sydney.
The objective of the experiment was to investigate the effectiveness of external air barriers
(wall wrap) in reducing air infiltration through a typical residential wall. The experiment was
set up by constructing a wall onto the face of a pressure chamber. The wall comprised of a
90mm timber stud, 2 fixed windows, R2.0 90mm Bradford Gold Batts, 10mm Gyprock, timber
skirting, timber architraves, 1 power point and 1 light switch. The wall wrap that was used in
the experiment was Bradford Thermoseal Wall Wrap, a woven polyweave foil type
membrane. Sensors monitored air pressure inside the chamber, within the stud frame and
outside the wall wrap. The external pressure measured outside the wall wrap represented a
pressure-equalised cavity which is typical in brick veneer and light weight cladding facades.
Figure 66 Pressure sensor tubing installed on test rig
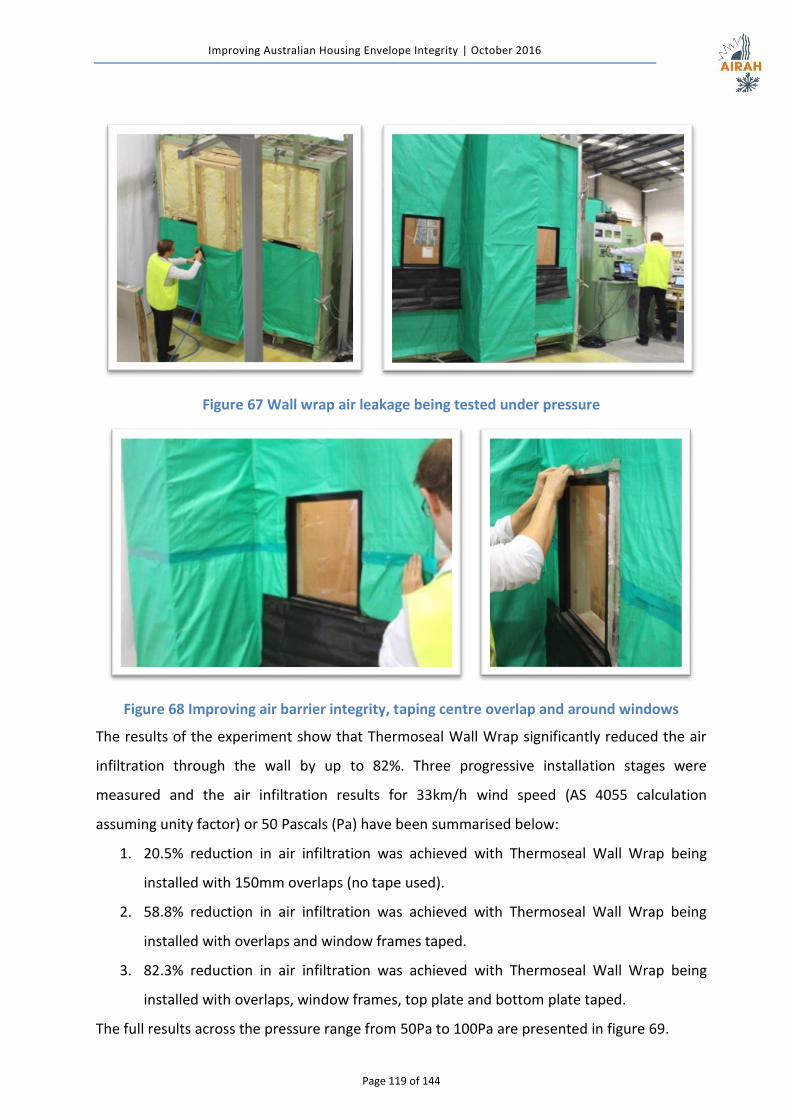
Improving Australian Housing Envelope Integrity | October 2016
Page 119 of 144
Figure 67 Wall wrap air leakage being tested under pressure
Figure 68 Improving air barrier integrity, taping centre overlap and around windows
The results of the experiment show that Thermoseal Wall Wrap significantly reduced the air
infiltration through the wall by up to 82%. Three progressive installation stages were
measured and the air infiltration results for 33km/h wind speed (AS 4055 calculation
assuming unity factor) or 50 Pascals (Pa) have been summarised below:
1. 20.5% reduction in air infiltration was achieved with Thermoseal Wall Wrap being
installed with 150mm overlaps (no tape used).
2. 58.8% reduction in air infiltration was achieved with Thermoseal Wall Wrap being
installed with overlaps and window frames taped.
3. 82.3% reduction in air infiltration was achieved with Thermoseal Wall Wrap being
installed with overlaps, window frames, top plate and bottom plate taped.
The full results across the pressure range from 50Pa to 100Pa are presented in figure 69.
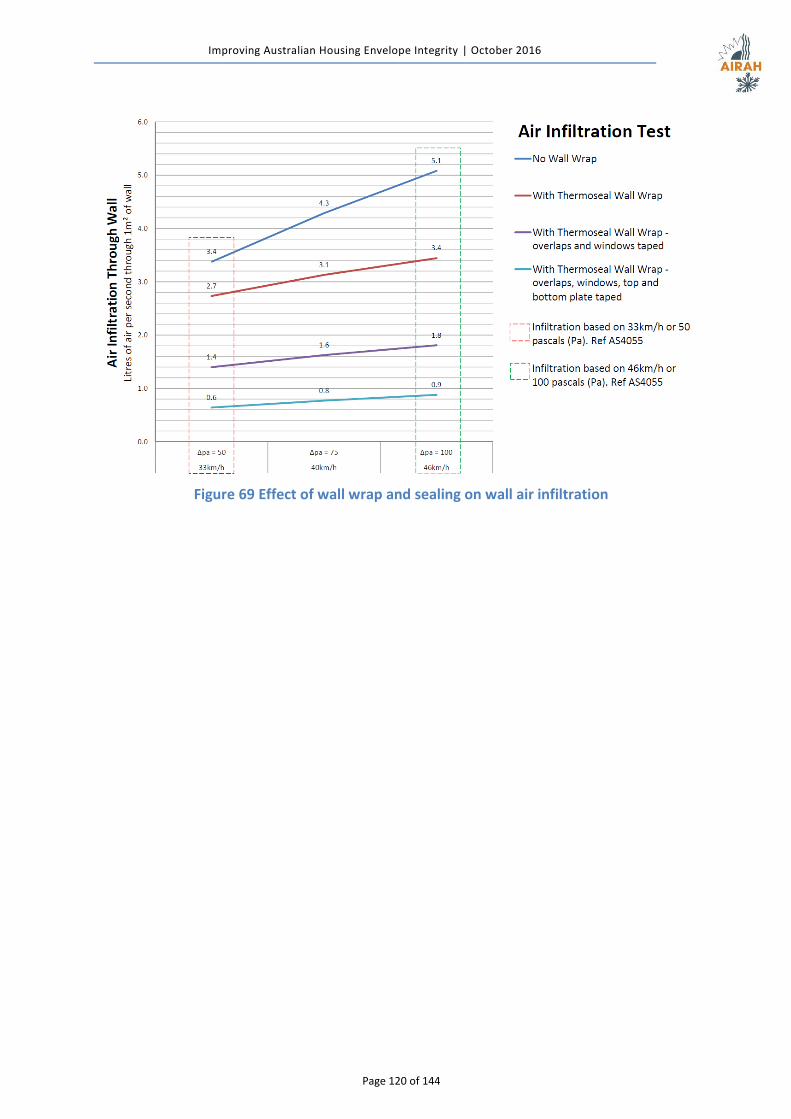
Improving Australian Housing Envelope Integrity | October 2016
Page 120 of 144
Figure 69 Effect of wall wrap and sealing on wall air infiltration
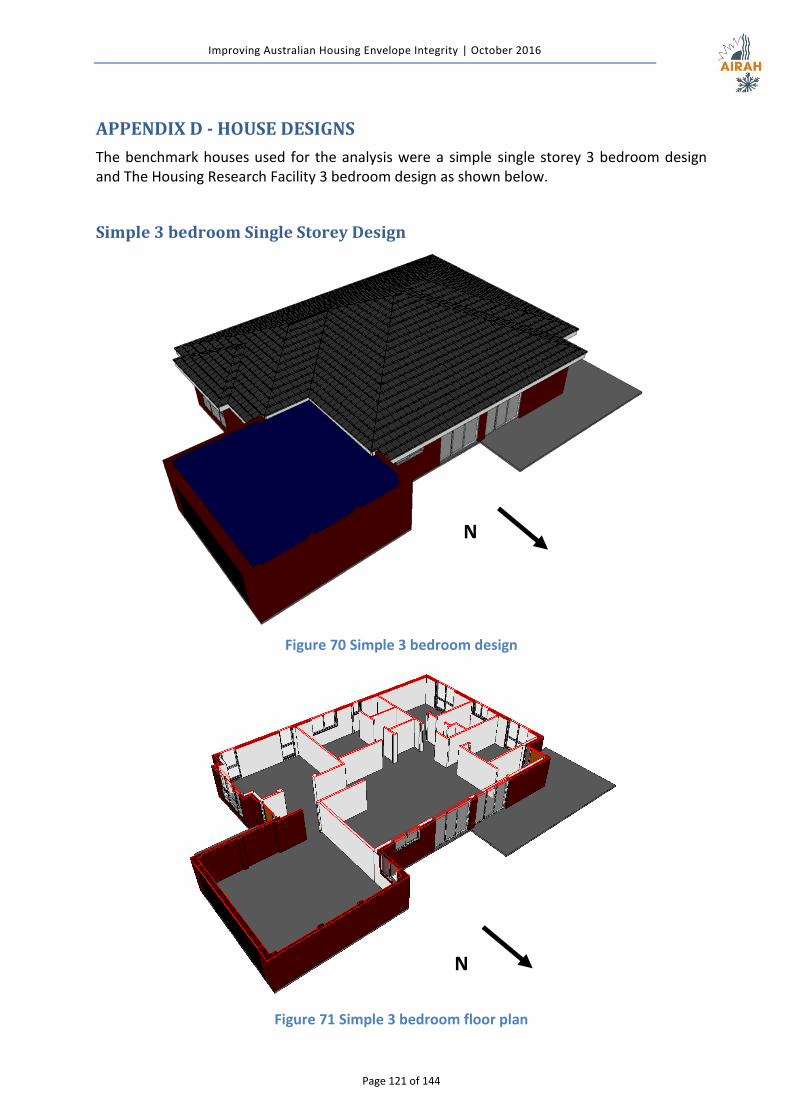
Improving Australian Housing Envelope Integrity | October 2016
Page 121 of 144
APPENDIX D - HOUSE DESIGNS
The benchmark houses used for the analysis were a simple single storey 3 bedroom design and The Housing Research Facility 3 bedroom design as shown below.
Simple 3 bedroom Single Storey Design
Figure 70 Simple 3 bedroom design
Figure 71 Simple 3 bedroom floor plan
N
N
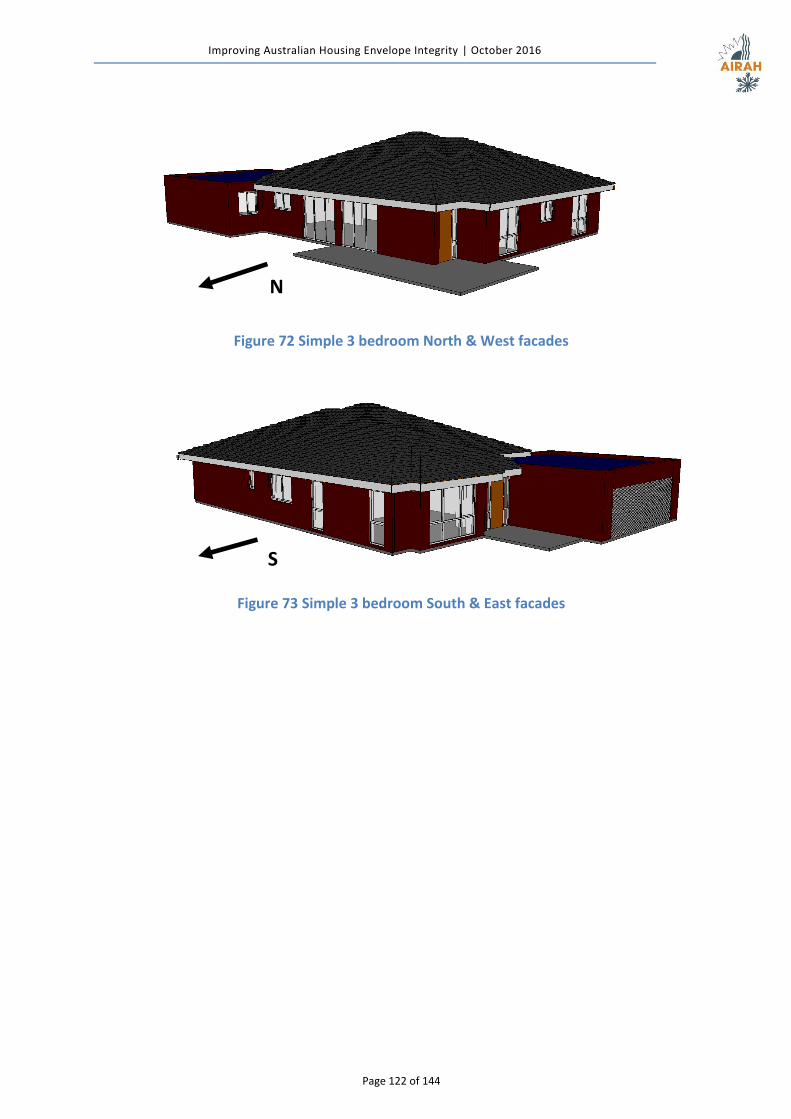
Improving Australian Housing Envelope Integrity | October 2016
Page 122 of 144
Figure 72 Simple 3 bedroom North & West facades
Figure 73 Simple 3 bedroom South & East facades
N
S
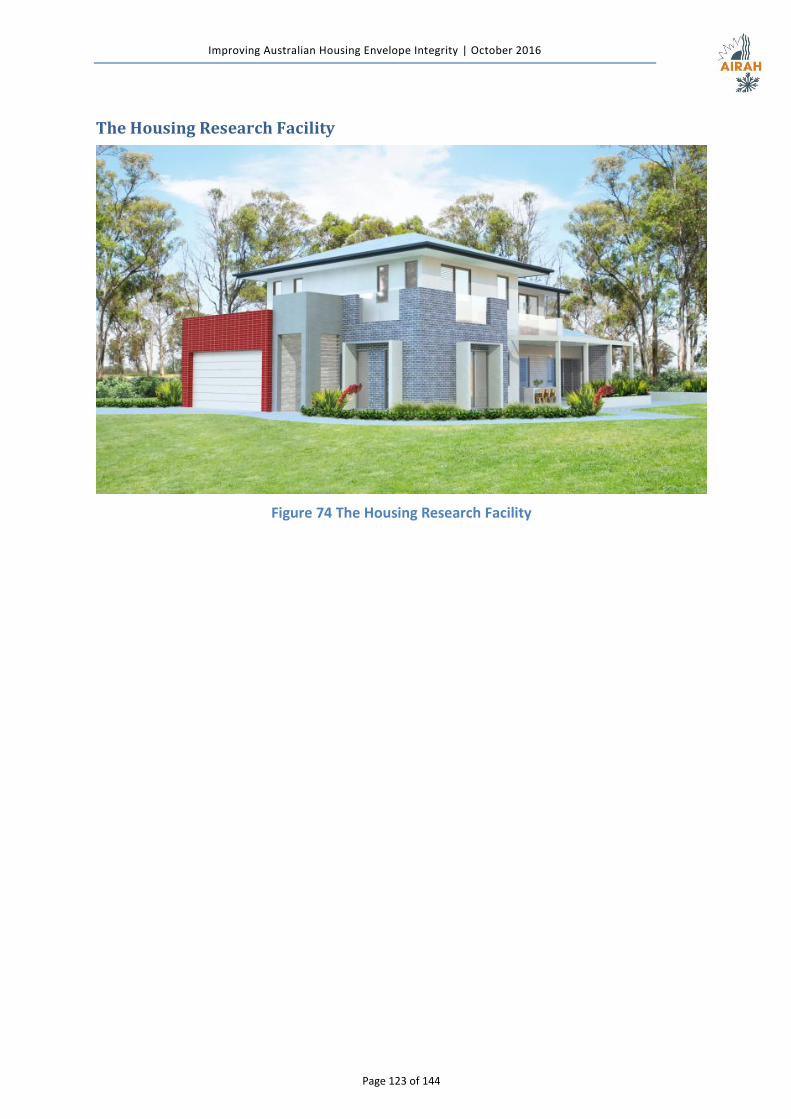
Improving Australian Housing Envelope Integrity | October 2016
Page 123 of 144
The Housing Research Facility
Figure 74 The Housing Research Facility
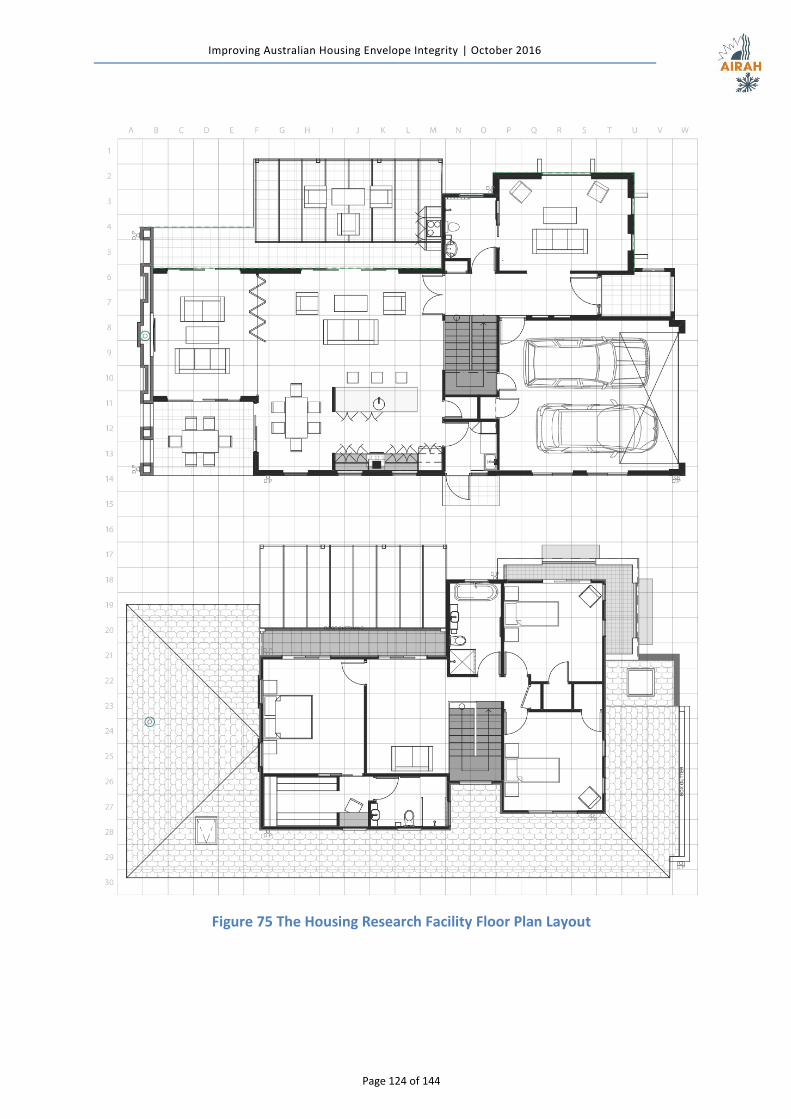
Improving Australian Housing Envelope Integrity | October 2016
Page 124 of 144
Figure 75 The Housing Research Facility Floor Plan Layout
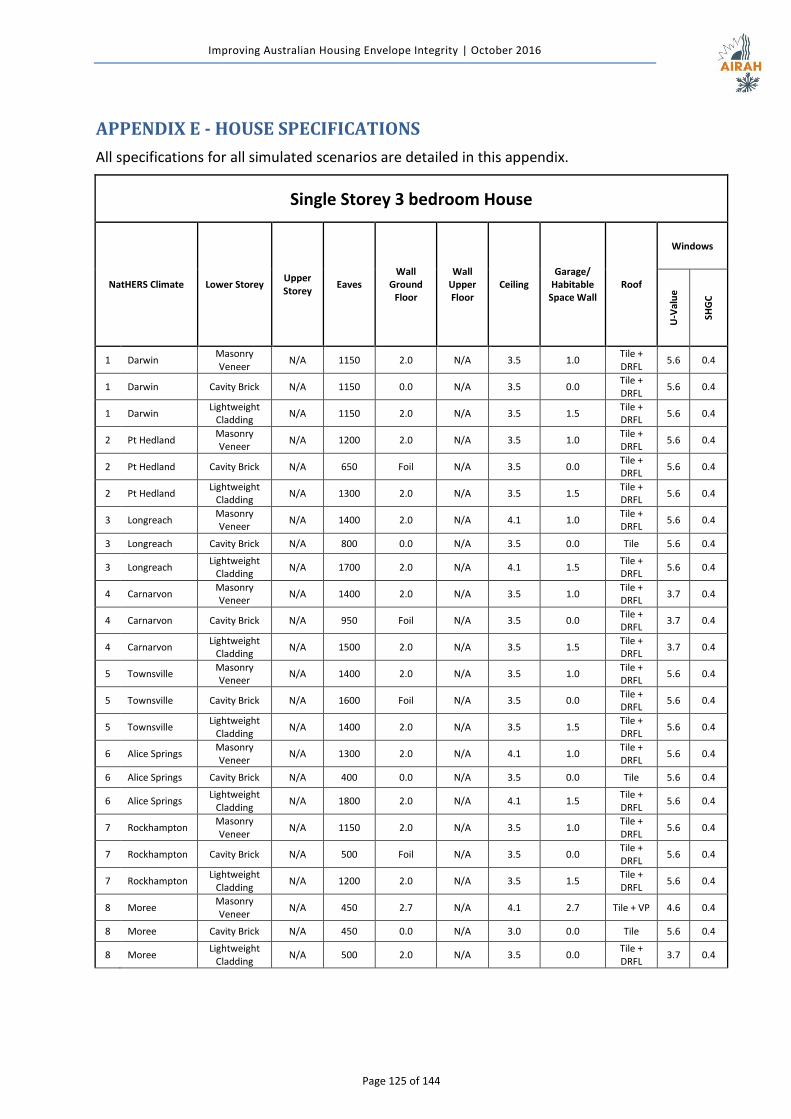
Improving Australian Housing Envelope Integrity | October 2016
Page 125 of 144
APPENDIX E - HOUSE SPECIFICATIONS
All specifications for all simulated scenarios are detailed in this appendix.
Single Storey 3 bedroom House
NatHERS Climate Lower Storey Upper Storey
Eaves Wall
Ground Floor
Wall Upper Floor
Ceiling Garage/
Habitable Space Wall
Roof
Windows
U-V
alu
e
SHG
C
1 Darwin Masonry Veneer
N/A 1150 2.0 N/A 3.5 1.0 Tile + DRFL
5.6 0.4
1 Darwin Cavity Brick N/A 1150 0.0 N/A 3.5 0.0 Tile + DRFL
5.6 0.4
1 Darwin Lightweight
Cladding N/A 1150 2.0 N/A 3.5 1.5
Tile + DRFL
5.6 0.4
2 Pt Hedland Masonry Veneer
N/A 1200 2.0 N/A 3.5 1.0 Tile + DRFL
5.6 0.4
2 Pt Hedland Cavity Brick N/A 650 Foil N/A 3.5 0.0 Tile + DRFL
5.6 0.4
2 Pt Hedland Lightweight
Cladding N/A 1300 2.0 N/A 3.5 1.5
Tile + DRFL
5.6 0.4
3 Longreach Masonry Veneer
N/A 1400 2.0 N/A 4.1 1.0 Tile + DRFL
5.6 0.4
3 Longreach Cavity Brick N/A 800 0.0 N/A 3.5 0.0 Tile 5.6 0.4
3 Longreach Lightweight
Cladding N/A 1700 2.0 N/A 4.1 1.5
Tile + DRFL
5.6 0.4
4 Carnarvon Masonry Veneer
N/A 1400 2.0 N/A 3.5 1.0 Tile + DRFL
3.7 0.4
4 Carnarvon Cavity Brick N/A 950 Foil N/A 3.5 0.0 Tile + DRFL
3.7 0.4
4 Carnarvon Lightweight
Cladding N/A 1500 2.0 N/A 3.5 1.5
Tile + DRFL
3.7 0.4
5 Townsville Masonry Veneer
N/A 1400 2.0 N/A 3.5 1.0 Tile + DRFL
5.6 0.4
5 Townsville Cavity Brick N/A 1600 Foil N/A 3.5 0.0 Tile + DRFL
5.6 0.4
5 Townsville Lightweight
Cladding N/A 1400 2.0 N/A 3.5 1.5
Tile + DRFL
5.6 0.4
6 Alice Springs Masonry Veneer
N/A 1300 2.0 N/A 4.1 1.0 Tile + DRFL
5.6 0.4
6 Alice Springs Cavity Brick N/A 400 0.0 N/A 3.5 0.0 Tile 5.6 0.4
6 Alice Springs Lightweight
Cladding N/A 1800 2.0 N/A 4.1 1.5
Tile + DRFL
5.6 0.4
7 Rockhampton Masonry Veneer
N/A 1150 2.0 N/A 3.5 1.0 Tile + DRFL
5.6 0.4
7 Rockhampton Cavity Brick N/A 500 Foil N/A 3.5 0.0 Tile + DRFL
5.6 0.4
7 Rockhampton Lightweight
Cladding N/A 1200 2.0 N/A 3.5 1.5
Tile + DRFL
5.6 0.4
8 Moree Masonry Veneer
N/A 450 2.7 N/A 4.1 2.7 Tile + VP 4.6 0.4
8 Moree Cavity Brick N/A 450 0.0 N/A 3.0 0.0 Tile 5.6 0.4
8 Moree Lightweight
Cladding N/A 500 2.0 N/A 3.5 0.0
Tile + DRFL
3.7 0.4
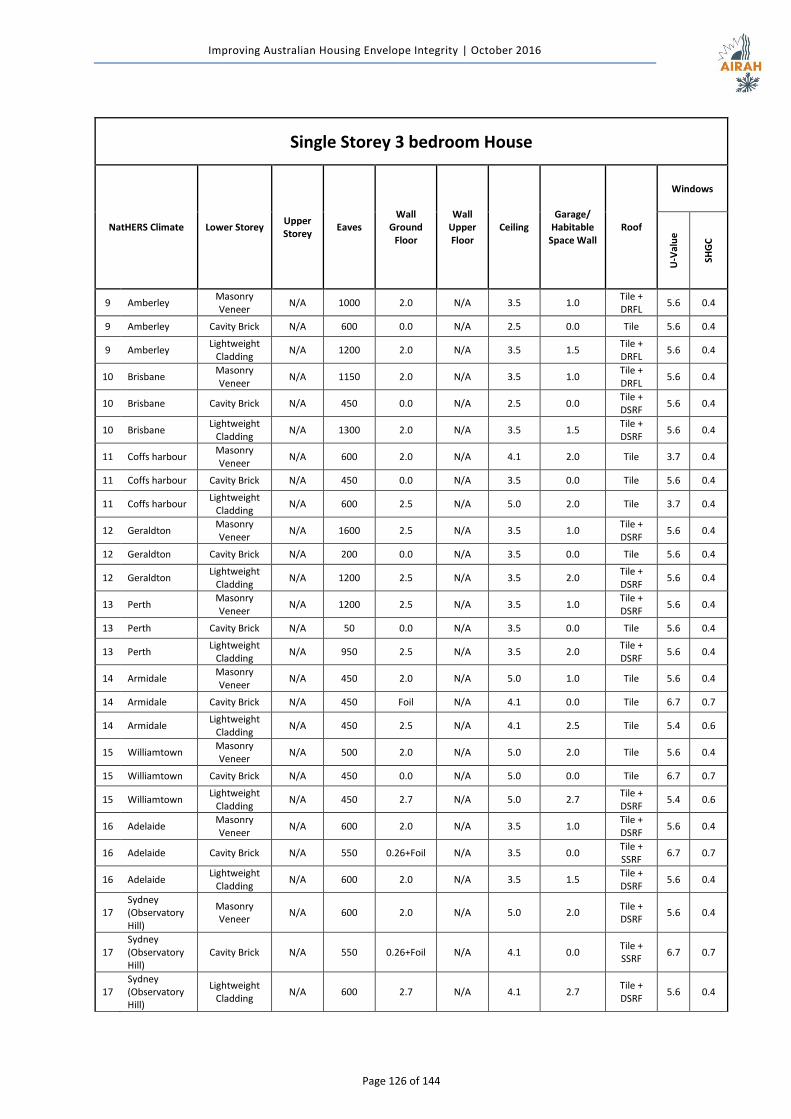
Improving Australian Housing Envelope Integrity | October 2016
Page 126 of 144
Single Storey 3 bedroom House
NatHERS Climate Lower Storey Upper Storey
Eaves Wall
Ground Floor
Wall Upper Floor
Ceiling Garage/
Habitable Space Wall
Roof
Windows
U-V
alu
e
SHG
C
9 Amberley Masonry Veneer
N/A 1000 2.0 N/A 3.5 1.0 Tile + DRFL
5.6 0.4
9 Amberley Cavity Brick N/A 600 0.0 N/A 2.5 0.0 Tile 5.6 0.4
9 Amberley Lightweight
Cladding N/A 1200 2.0 N/A 3.5 1.5
Tile + DRFL
5.6 0.4
10 Brisbane Masonry Veneer
N/A 1150 2.0 N/A 3.5 1.0 Tile + DRFL
5.6 0.4
10 Brisbane Cavity Brick N/A 450 0.0 N/A 2.5 0.0 Tile + DSRF
5.6 0.4
10 Brisbane Lightweight
Cladding N/A 1300 2.0 N/A 3.5 1.5
Tile + DSRF
5.6 0.4
11 Coffs harbour Masonry Veneer
N/A 600 2.0 N/A 4.1 2.0 Tile 3.7 0.4
11 Coffs harbour Cavity Brick N/A 450 0.0 N/A 3.5 0.0 Tile 5.6 0.4
11 Coffs harbour Lightweight
Cladding N/A 600 2.5 N/A 5.0 2.0 Tile 3.7 0.4
12 Geraldton Masonry Veneer
N/A 1600 2.5 N/A 3.5 1.0 Tile + DSRF
5.6 0.4
12 Geraldton Cavity Brick N/A 200 0.0 N/A 3.5 0.0 Tile 5.6 0.4
12 Geraldton Lightweight
Cladding N/A 1200 2.5 N/A 3.5 2.0
Tile + DSRF
5.6 0.4
13 Perth Masonry Veneer
N/A 1200 2.5 N/A 3.5 1.0 Tile + DSRF
5.6 0.4
13 Perth Cavity Brick N/A 50 0.0 N/A 3.5 0.0 Tile 5.6 0.4
13 Perth Lightweight
Cladding N/A 950 2.5 N/A 3.5 2.0
Tile + DSRF
5.6 0.4
14 Armidale Masonry Veneer
N/A 450 2.0 N/A 5.0 1.0 Tile 5.6 0.4
14 Armidale Cavity Brick N/A 450 Foil N/A 4.1 0.0 Tile 6.7 0.7
14 Armidale Lightweight
Cladding N/A 450 2.5 N/A 4.1 2.5 Tile 5.4 0.6
15 Williamtown Masonry Veneer
N/A 500 2.0 N/A 5.0 2.0 Tile 5.6 0.4
15 Williamtown Cavity Brick N/A 450 0.0 N/A 5.0 0.0 Tile 6.7 0.7
15 Williamtown Lightweight
Cladding N/A 450 2.7 N/A 5.0 2.7
Tile + DSRF
5.4 0.6
16 Adelaide Masonry Veneer
N/A 600 2.0 N/A 3.5 1.0 Tile + DSRF
5.6 0.4
16 Adelaide Cavity Brick N/A 550 0.26+Foil N/A 3.5 0.0 Tile + SSRF
6.7 0.7
16 Adelaide Lightweight
Cladding N/A 600 2.0 N/A 3.5 1.5
Tile + DSRF
5.6 0.4
17 Sydney (Observatory Hill)
Masonry Veneer
N/A 600 2.0 N/A 5.0 2.0 Tile + DSRF
5.6 0.4
17 Sydney (Observatory Hill)
Cavity Brick N/A 550 0.26+Foil N/A 4.1 0.0 Tile + SSRF
6.7 0.7
17 Sydney (Observatory Hill)
Lightweight Cladding
N/A 600 2.7 N/A 4.1 2.7 Tile + DSRF
5.6 0.4
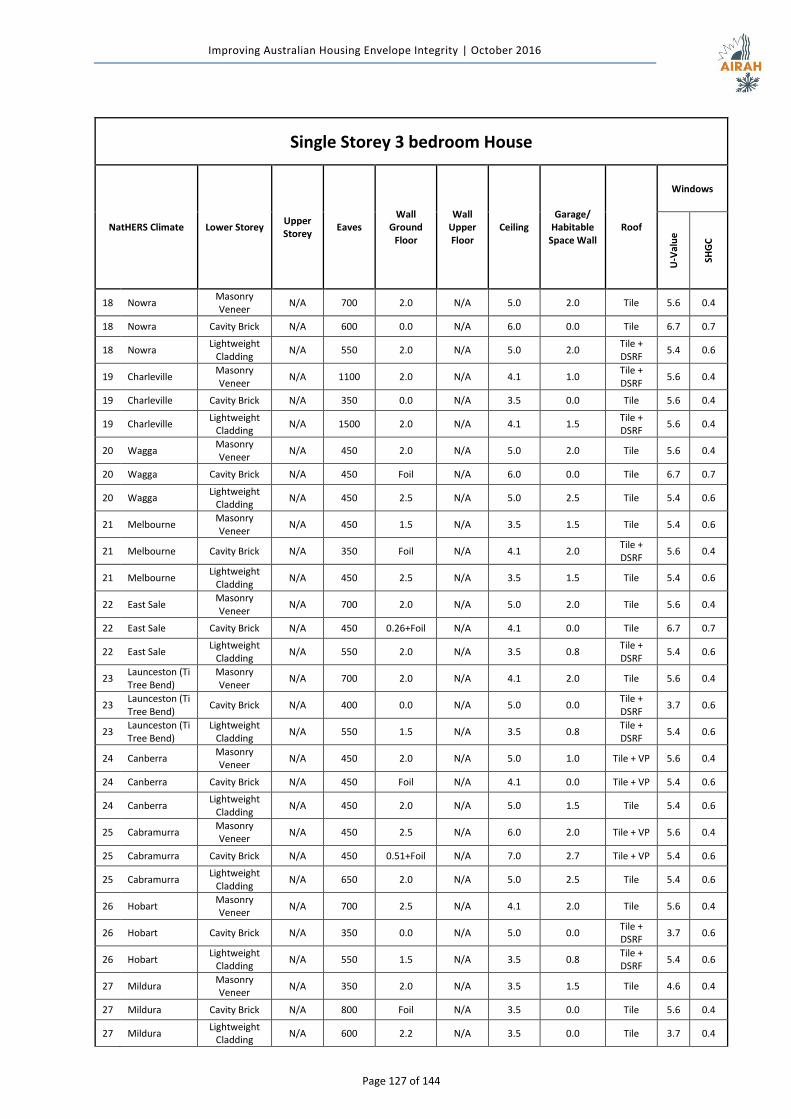
Improving Australian Housing Envelope Integrity | October 2016
Page 127 of 144
Single Storey 3 bedroom House
NatHERS Climate Lower Storey Upper Storey
Eaves Wall
Ground Floor
Wall Upper Floor
Ceiling Garage/
Habitable Space Wall
Roof
Windows
U-V
alu
e
SHG
C
18 Nowra Masonry Veneer
N/A 700 2.0 N/A 5.0 2.0 Tile 5.6 0.4
18 Nowra Cavity Brick N/A 600 0.0 N/A 6.0 0.0 Tile 6.7 0.7
18 Nowra Lightweight
Cladding N/A 550 2.0 N/A 5.0 2.0
Tile + DSRF
5.4 0.6
19 Charleville Masonry Veneer
N/A 1100 2.0 N/A 4.1 1.0 Tile + DSRF
5.6 0.4
19 Charleville Cavity Brick N/A 350 0.0 N/A 3.5 0.0 Tile 5.6 0.4
19 Charleville Lightweight
Cladding N/A 1500 2.0 N/A 4.1 1.5
Tile + DSRF
5.6 0.4
20 Wagga Masonry Veneer
N/A 450 2.0 N/A 5.0 2.0 Tile 5.6 0.4
20 Wagga Cavity Brick N/A 450 Foil N/A 6.0 0.0 Tile 6.7 0.7
20 Wagga Lightweight
Cladding N/A 450 2.5 N/A 5.0 2.5 Tile 5.4 0.6
21 Melbourne Masonry Veneer
N/A 450 1.5 N/A 3.5 1.5 Tile 5.4 0.6
21 Melbourne Cavity Brick N/A 350 Foil N/A 4.1 2.0 Tile + DSRF
5.6 0.4
21 Melbourne Lightweight
Cladding N/A 450 2.5 N/A 3.5 1.5 Tile 5.4 0.6
22 East Sale Masonry Veneer
N/A 700 2.0 N/A 5.0 2.0 Tile 5.6 0.4
22 East Sale Cavity Brick N/A 450 0.26+Foil N/A 4.1 0.0 Tile 6.7 0.7
22 East Sale Lightweight
Cladding N/A 550 2.0 N/A 3.5 0.8
Tile + DSRF
5.4 0.6
23 Launceston (Ti Tree Bend)
Masonry Veneer
N/A 700 2.0 N/A 4.1 2.0 Tile 5.6 0.4
23 Launceston (Ti Tree Bend)
Cavity Brick N/A 400 0.0 N/A 5.0 0.0 Tile + DSRF
3.7 0.6
23 Launceston (Ti Tree Bend)
Lightweight Cladding
N/A 550 1.5 N/A 3.5 0.8 Tile + DSRF
5.4 0.6
24 Canberra Masonry Veneer
N/A 450 2.0 N/A 5.0 1.0 Tile + VP 5.6 0.4
24 Canberra Cavity Brick N/A 450 Foil N/A 4.1 0.0 Tile + VP 5.4 0.6
24 Canberra Lightweight
Cladding N/A 450 2.0 N/A 5.0 1.5 Tile 5.4 0.6
25 Cabramurra Masonry Veneer
N/A 450 2.5 N/A 6.0 2.0 Tile + VP 5.6 0.4
25 Cabramurra Cavity Brick N/A 450 0.51+Foil N/A 7.0 2.7 Tile + VP 5.4 0.6
25 Cabramurra Lightweight
Cladding N/A 650 2.0 N/A 5.0 2.5 Tile 5.4 0.6
26 Hobart Masonry Veneer
N/A 700 2.5 N/A 4.1 2.0 Tile 5.6 0.4
26 Hobart Cavity Brick N/A 350 0.0 N/A 5.0 0.0 Tile + DSRF
3.7 0.6
26 Hobart Lightweight
Cladding N/A 550 1.5 N/A 3.5 0.8
Tile + DSRF
5.4 0.6
27 Mildura Masonry Veneer
N/A 350 2.0 N/A 3.5 1.5 Tile 4.6 0.4
27 Mildura Cavity Brick N/A 800 Foil N/A 3.5 0.0 Tile 5.6 0.4
27 Mildura Lightweight
Cladding N/A 600 2.2 N/A 3.5 0.0 Tile 3.7 0.4

Improving Australian Housing Envelope Integrity | October 2016
Page 128 of 144
Single Storey 3 bedroom House
NatHERS Climate Lower Storey Upper Storey
Eaves Wall
Ground Floor
Wall Upper Floor
Ceiling Garage/
Habitable Space Wall
Roof
Windows
U-V
alu
e
SHG
C
28 Richmond Masonry Veneer
N/A 700 2.0 N/A 5.0 2.0 Tile 5.6 0.4
28 Richmond Cavity Brick N/A 450 0.0 N/A 5.0 0.0 Tile 6.7 0.7
28 Richmond Lightweight
Cladding N/A 550 2.7 N/A 5.0 2.7
Tile + DSRF
5.4 0.6
29 Weipa Masonry Veneer
N/A 1100 2.0 N/A 3.5 1.0 Tile + DSRF
5.6 0.4
29 Weipa Cavity Brick N/A 900 0.0 N/A 3.5 0.0 Tile + DSRF
5.6 0.4
29 Weipa Lightweight
Cladding N/A 1050 2.0 N/A 3.5 1.5
Tile + DSRF
5.6 0.4
30 Wyndham Masonry Veneer
N/A 1300 2.0 N/A 3.5 1.0 Tile + DSRF
5.6 0.4
30 Wyndham Cavity Brick N/A 1300 Foil N/A 3.5 0.0 Tile + DSRF
5.6 0.4
30 Wyndham Lightweight
Cladding N/A 1300 2.0 N/A 3.5 1.5
Tile + DSRF
5.6 0.4
31 Willis Island Masonry Veneer
N/A 750 2.0 N/A 3.5 1.0 Tile + DSRF
5.6 0.4
31 Willis Island Cavity Brick N/A 700 Foil N/A 3.5 0.0 Tile + DSRF
5.6 0.4
31 Willis Island Lightweight
Cladding N/A 800 2.0 N/A 3.5 1.0
Tile + DSRF
5.6 0.4
32 Cairns Masonry Veneer
N/A 1250 2.0 N/A 3.5 1.0 Tile + DSRF
5.6 0.4
32 Cairns Cavity Brick N/A 1050 Foil N/A 3.5 0.0 Tile + DSRF
5.6 0.4
32 Cairns Lightweight
Cladding N/A 1250 2.0 N/A 3.5 1.5
Tile + DSRF
5.6 0.4
33 Broome Masonry Veneer
N/A 850 2.0 N/A 3.5 1.0 Tile + DSRF
5.6 0.4
33 Broome Cavity Brick N/A 650 Foil N/A 3.5 0.0 Tile + DSRF
5.6 0.4
33 Broome Lightweight
Cladding N/A 900 2.0 N/A 3.5 1.5
Tile + DSRF
5.6 0.4
34 Learmonth Masonry Veneer
N/A 950 2.0 N/A 3.5 1 Tile + DSRF
3.7 0.4
34 Learmonth Cavity Brick N/A 300 Foil N/A 3.5 0.0 Tile + DSRF
5.6 0.4
34 Learmonth Lightweight
Cladding N/A 1000 2.5 N/A 4.1 1.5
Tile + DSRF
3.7 0.4
35 Mackay Masonry Veneer
N/A 1450 2.0 N/A 3.5 1.0 Tile + DSRF
5.6 0.4
35 Mackay Cavity Brick N/A 1100 Foil N/A 3.5 0.0 Tile + DSRF
5.6 0.4
35 Mackay Lightweight
Cladding N/A 1500 2.0 N/A 3.5 1.5
Tile + DSRF
5.6 0.4
36 Gladstone Masonry Veneer
N/A 1450 2.0 N/A 3.5 1.0 Tile + DSRF
5.6 0.4
36 Gladstone Cavity Brick N/A 550 Foil N/A 3.5 0.0 Tile + DSRF
5.6 0.4
36 Gladstone Lightweight
Cladding N/A 1300 2.0 N/A 3.5 1.5
Tile + DSRF
5.6 0.4
Improving Australian Housing Envelope Integrity | October 2016
Page 129 of 144
Single Storey 3 bedroom House
NatHERS Climate Lower Storey Upper Storey
Eaves Wall
Ground Floor
Wall Upper Floor
Ceiling Garage/
Habitable Space Wall
Roof
Windows
U-V
alu
e
SHG
C
37 Halls Creek Masonry Veneer
N/A 1400 2.0 N/A 3.5 1.0 Tile + DSRF
5.6 0.4
37 Halls Creek Cavity Brick N/A 800 Foil N/A 3.5 0.0 Tile + DSRF
5.6 0.4
37 Halls Creek Lightweight
Cladding N/A 750 2.5 N/A 4.1 1.5
Tile + DSRF
3.7 0.4
38 Tennant Creek
Masonry Veneer
N/A 1400 2.0 N/A 4.1 2.0 Tile + DSRF
5.6 0.4
38 Tennant Creek
Cavity Brick N/A 900 0.26+Foil N/A 3.5 0.0 Tile 5.6 0.4
38 Tennant Creek
Lightweight Cladding
N/A 1600 2.0 N/A 4.1 1.5 Tile + DSRF
5.6 0.4
39 Mt Isa Masonry Veneer
N/A 1300 2.0 N/A 4.1 2.0 Tile + DSRF
5.6 0.4
39 Mt Isa Cavity Brick N/A 850 0.26+Foil N/A 3.5 0.0 Tile 5.6 0.4
39 Mt Isa Lightweight
Cladding N/A 1500 2.0 N/A 4.1 1.5
Tile + DSRF
5.6 0.4
40 Newman Masonry Veneer
N/A 1400 2.0 N/A 3.5 1.0 Tile + DSRF
5.6 0.4
40 Newman Cavity Brick N/A 450 Foil N/A 3.5 0.0 Tile + DSRF
5.6 0.4
40 Newman Lightweight
Cladding N/A 750 2.5 N/A 4.1 1.5
Tile + DSRF
3.7 0.4
41 Giles Masonry Veneer
N/A 900 2.0 N/A 3.5 1.0 Tile + DSRF
5.6 0.4
41 Giles Cavity Brick N/A 50 0.0 N/A 2.5 0.0 Tile + DSRF
5.6 0.4
41 Giles Lightweight
Cladding N/A 450 1.5 N/A 3.5 1.5
Tile + DSRF
3.7 0.4
42 Meekatharra Masonry Veneer
N/A 1000 2.0 N/A 3.5 1.0 Tile + DSRF
5.6 0.4
42 Meekatharra Cavity Brick N/A 50 0.0 N/A 2.5 0.0 Tile + SSRF
5.6 0.4
42 Meekatharra Lightweight
Cladding N/A 550 1.5 N/A 3.5 1.5
Tile + DSRF
3.7 0.4
43 Oodnadatta Masonry Veneer
N/A 1800 2.0 N/A 4.1 2.0 Tile + DSRF
5.6 0.4
43 Oodnadatta Cavity Brick N/A 1200 0.26+Foil N/A 3.5 0.0 Tile + SSRF
6.7 0.7
43 Oodnadatta Lightweight
Cladding N/A 2000 2.0 N/A 4.1 1.5
Tile + DSRF
5.6 0.4
44 Kalgoorlie Masonry Veneer
N/A 600 1.5 N/A 3.5 1.0 Tile + DSRF
5.6 0.4
44 Kalgoorlie Cavity Brick N/A 200 0.0 N/A 2.0 0.0 Tile 5.6 0.4
44 Kalgoorlie Lightweight
Cladding N/A 550 1.0 N/A 3.5 1.0
Tile + DSRF
3.7 0.4
45 Woomera Masonry Veneer
N/A 650 2.0 N/A 4.1 2.0 Tile + DSRF
5.6 0.4
45 Woomera Cavity Brick N/A 500 0.0 N/A 3.5 0.0 Tile + SSRF
6.7 0.7
45 Woomera Lightweight
Cladding N/A 750 2.0 N/A 4.1 1.5
Tile + DSRF
5.6 0.4

Improving Australian Housing Envelope Integrity | October 2016
Page 130 of 144
Single Storey 3 bedroom House
NatHERS Climate Lower Storey Upper Storey
Eaves Wall
Ground Floor
Wall Upper Floor
Ceiling Garage/
Habitable Space Wall
Roof
Windows
U-V
alu
e
SHG
C
46 Cobar Masonry Veneer
N/A 450 2.7 N/A 4.1 1.5 Tile 4.6 0.4
46 Cobar Cavity Brick N/A 350 0.0 N/A 3.5 0.0 Tile 5.6 0.4
46 Cobar Lightweight
Cladding N/A 600 2.5 N/A 4.1 0.0 Tile 3.7 0.4
47 Bickley Masonry Veneer
N/A 600 1.5 N/A 3.5 0.5 Tile + DSRF
5.6 0.4
47 Bickley Cavity Brick N/A 650 0.0 N/A 3.5 0.0 Tile 5.6 0.4
47 Bickley Lightweight
Cladding N/A 450 1.5 N/A 3.5 0.0
Tile + DSRF
3.7 0.4
48 Dubbo Masonry Veneer
N/A 450 2.0 N/A 4.1 0.0 Tile + VP 4.6 0.4
48 Dubbo Cavity Brick N/A 450 0.0 N/A 4.1 0.0 Tile 5.6 0.4
48 Dubbo Lightweight
Cladding N/A 450 2.0 N/A 4.1 0.0 Tile 3.7 0.4
49 Katanning Masonry Veneer
N/A 600 1.5 N/A 3.5 0.5 Tile + DSRF
5.6 0.4
49 Katanning Cavity Brick N/A 550 0.0 N/A 3.5 0.0 Tile 5.6 0.4
49 Katanning Lightweight
Cladding N/A 650 1.5 N/A 3.5 0.0
Tile + DSRF
3.7 0.4
50 Oakey Masonry Veneer
N/A 800 2.5 N/A 3.5 0.0 Tile + DSRF
5.6 0.4
50 Oakey Cavity Brick N/A 0 0.0 N/A 2.0 0.0 Tile 5.6 0.4
50 Oakey Lightweight
Cladding N/A 700 2.0 N/A 3.5 1.5
Tile + DSRF
5.6 0.4
51 Forrest Masonry Veneer
N/A 600 2.0 N/A 3.5 0.5 Tile + DSRF
5.6 0.4
51 Forrest Cavity Brick N/A 850 0.0 N/A 2.0 0.0 Tile 5.6 0.4
51 Forrest Lightweight
Cladding N/A 450 1.5 N/A 3.5 0.0
Tile + DSRF
3.7 0.4
52 Swanbourne Masonry Veneer
N/A 600 2.0 N/A 3.5 0.5 Tile + DSRF
5.6 0.4
52 Swanbourne Cavity Brick N/A 500 0.0 N/A 2.0 0.0 Tile 5.6 0.4
52 Swanbourne Lightweight
Cladding N/A 450 1.5 N/A 3.5 0.0
Tile + DSRF
3.7 0.4
53 Ceduna Masonry Veneer
N/A 350 2.0 N/A 4.1 2.0 Tile + DSRF
5.6 0.4
53 Ceduna Cavity Brick N/A 150 0.0 N/A 2.5 0.0 Tile + SSRF
6.7 0.7
53 Ceduna Lightweight
Cladding N/A 650 2.0 N/A 4.1 1.5
Tile + DSRF
5.6 0.4
54 Mandurah Masonry Veneer
N/A 550 2.0 N/A 3.5 0.5 Tile + DSRF
5.6 0.4
54 Mandurah Cavity Brick N/A 1000 0.0 N/A 2.5 0.0 Tile 5.6 0.4
54 Mandurah Lightweight
Cladding N/A 450 1.5 N/A 3.5 0.0
Tile + DSRF
3.7 0.4
55 Esperance Masonry Veneer
N/A 750 2.0 N/A 3.5 0.5 Tile + DSRF
5.6 0.4
55 Esperance Cavity Brick N/A 700 0.0 N/A 3.5 0.0 Tile 4.6 0.5
55 Esperance Lightweight
Cladding N/A 450 1.0 N/A 4.1 0.0
Tile + DSRF
3.7 0.4
Improving Australian Housing Envelope Integrity | October 2016
Page 131 of 144
Single Storey 3 bedroom House
NatHERS Climate Lower Storey Upper Storey
Eaves Wall
Ground Floor
Wall Upper Floor
Ceiling Garage/
Habitable Space Wall
Roof
Windows
U-V
alu
e
SHG
C
56 Mascot (Sydney Airport)
Masonry Veneer
N/A 500 2.0 N/A 4.1 2.0 Tile + DSRF
5.6 0.4
56 Mascot (Sydney Airport)
Cavity Brick N/A 400 Foil N/A 3.5 0.0 Tile + SSRF
6.7 0.7
56 Mascot (Sydney Airport)
Lightweight Cladding
N/A 550 2.0 N/A 4.1 2.0 Tile + DSRF
5.6 0.4
57 Manjimup Masonry Veneer
N/A 700 2.0 N/A 3.5 1.0 Tile + DSRF
5.6 0.4
57 Manjimup Cavity Brick N/A 500 0.0 N/A 5.0 0.0 Tile + DSRF
4.6 0.5
57 Manjimup Lightweight
Cladding N/A 700 1.5 N/A 4.1 0.0
Tile + DSRF
3.7 0.4
58 Albany Masonry Veneer
N/A 600 1.5 N/A 3.5 1.0 Tile + DSRF
5.6 0.4
58 Albany Cavity Brick N/A 400 0.0 N/A 5.0 0.0 Tile + DSRF
4.6 0.5
58 Albany Lightweight
Cladding N/A 900 1.5 N/A 4.1 0.0
Tile + DSRF
3.7 0.4
59 Mt Lofty Masonry Veneer
N/A 350 2.5 N/A 4.1 2.0 Tile + DSRF
5.6 0.4
59 Mt Lofty Cavity Brick N/A 150 0.26+Foil N/A 5.0 1.0 Tile + SSRF
6.7 0.7
59 Mt Lofty Lightweight
Cladding N/A 250 2.5 N/A 4.1 1.5
Tile + DSRF
5.6 0.4
60 Tullamarine (Melbourne Airport)
Masonry Veneer
N/A 350 2.5 N/A 3.5 0.0 Tile 4.6 0.4
60 Tullamarine (Melbourne Airport)
Cavity Brick N/A 600 0.26+Foil N/A 4.1 0.0 Tile 5.4 0.6
60 Tullamarine (Melbourne Airport)
Lightweight Cladding
N/A 450 1.7 N/A 3.5 1.0 Tile 4.3 0.5
61 Mt Gambier Masonry Veneer
N/A 450 1.5 N/A 4.1 1.5 Tile + DSRF
5.6 0.4
61 Mt Gambier Cavity Brick N/A 350 Foil N/A 5.0 0.0 Tile + SSRF
6.7 0.7
61 Mt Gambier Lightweight
Cladding N/A 450 2.0 N/A 4.1 1.5
Tile + DSRF
5.6 0.4
62 Moorabbin Masonry Veneer
N/A 350 2.0 N/A 3.5 0.0 Tile 4.6 0.4
62 Moorabbin Cavity Brick N/A 600 0.26+Foil N/A 5.0 1.0 Tile 5.4 0.6
62 Moorabbin Lightweight
Cladding N/A 450 1.5 N/A 4.1 0.0 Tile 4.3 0.5
63 Warrnambool Masonry Veneer
N/A 700 1.7 N/A 5.0 2.0 Tile 5.6 0.4
63 Warrnambool Cavity Brick N/A 450 0.26+Foil N/A 6.0 0.0 Tile 6.7 0.7
63 Warrnambool Lightweight
Cladding N/A 550 1.5 N/A 3.5 0.8
Tile + DSRF
5.4 0.6
Improving Australian Housing Envelope Integrity | October 2016
Page 132 of 144
Single Storey 3 bedroom House
NatHERS Climate Lower Storey Upper Storey
Eaves Wall
Ground Floor
Wall Upper Floor
Ceiling Garage/
Habitable Space Wall
Roof
Windows
U-V
alu
e
SHG
C
64 Cape Otway Masonry Veneer
N/A 700 2.7 N/A 5.0 2.0 Tile 5.6 0.4
64 Cape Otway Cavity Brick N/A 350 0.0 N/A 4.1 0.0 Tile + DSRF
3.7 0.6
64 Cape Otway Lightweight
Cladding N/A 550 1.5 N/A 3.5 0.8
Tile + DSRF
5.4 0.6
65 Orange Masonry Veneer
N/A 450 2.0 N/A 4.1 0.0 Tile 5.4 0.6
65 Orange Cavity Brick N/A 350 0.26+Foil N/A 6.0 2.0 Tile + DSRF
5.6 0.4
65 Orange Lightweight
Cladding N/A 450 2.5 N/A 5.0 0.0 Tile 5.4 0.6
66 Ballarat Masonry Veneer
N/A 700 2.7 N/A 6.0 2.0 Tile 5.6 0.4
66 Ballarat Cavity Brick N/A 600 0.26+Foil N/A 3.0 0.0 Tile + DSRF
3.7 0.6
66 Ballarat Lightweight
Cladding N/A 550 1.5 N/A 4.1 2.0
Tile + DSRF
5.4 0.6
67 Low Head Masonry Veneer
N/A 700 2.7 N/A 4.1 2.0 Tile 5.6 0.4
67 Low Head Cavity Brick N/A 450 0.0 N/A 3.5 0.0 Tile + DSRF
3.7 0.6
67 Low Head Lightweight
Cladding N/A 450 1.5 N/A 3.5 0.8 Tile 5.4 0.6
68 Launceston Airport
Masonry Veneer
N/A 700 2.0 N/A 5.0 2.0 Tile 5.6 0.4
68 Launceston Airport
Cavity Brick N/A 300 0.0 N/A 5.0 0.0 Tile + DSRF
3.7 0.6
68 Launceston Airport
Lightweight Cladding
N/A 550 1.5 N/A 3.5 0.8 Tile + DSRF
5.4 0.6
69 Thredbo Masonry Veneer
N/A 450 2.0 N/A 6.0 2.0 Tile + VP 5.6 0.4
69 Thredbo Cavity Brick N/A 450 0.26+Foil N/A 6.0 2.7 Tile + VP 5.4 0.6
69 Thredbo Lightweight
Cladding N/A 450 2.0 N/A 5.0 2.0 Tile 5.4 0.6
Improving Australian Housing Envelope Integrity | October 2016
Page 133 of 144
The Housing Research Facility
NatHERS Climate Lower Storey
Upper Storey
Eaves Wall
Ground Floor
Wall Upper Floor
Ceiling Garage/
Habitable Space Wall
Roof
Windows
U-V
alu
e
SHG
C
1 Darwin Masonry Veneer
Lightweight Cladding
650 2.0 2.0 3.5 0.0 Tile + DSRF
5.6 0.41
1 Darwin Cavity Brick Lightweight
Cladding 800 Foil 1.5 2.5 0.0
Tile + DSRF
4.8 0.59
1 Darwin Lightweight
Cladding Lightweight
Cladding 750 1.5 1.5 2.0 1.0
Tile + DSRF
4.8 0.59
2 Pt Hedland Masonry Veneer
Lightweight Cladding
1100 2.0 2.0 3.5 0.0 Tile + DSRF
5.6 0.41
2 Pt Hedland Cavity Brick Lightweight
Cladding 700 Foil 1.5 2.5 0.0
Tile + DSRF
4.8 0.59
2 Pt Hedland Lightweight
Cladding Lightweight
Cladding 1000 2.0 2.0 2.0 1.0
Tile + DSRF
5.6 0.41
3 Longreach Masonry Veneer
Lightweight Cladding
1000 2.5 2.5 3.5 0.0 Tile + DSRF
5.6 0.36
3 Longreach Cavity Brick Lightweight
Cladding 250 0.0 1.0 2.0 0.0
Tile + DSRF
5.6 0.41
3 Longreach Lightweight
Cladding Lightweight
Cladding 1200 2.0 2.0 2.5 2.0
Tile + DSRF
5.6 0.36
4 Carnarvon Masonry Veneer
Lightweight Cladding
350 1.5 1.5 3.5 0.0 Tile + DSRF
5.6 0.41
4 Carnarvon Cavity Brick Lightweight
Cladding 450 0.0 1.5 2.0 0.0
Tile + DSRF
6.7 0.7
4 Carnarvon Lightweight
Cladding Lightweight
Cladding 1200 2.0 2.0 4.1 2.5
Tile + DSRF
6.7 0.57
5 Townsville Masonry Veneer
Lightweight Cladding
450 2.0 2.0 3.5 0.0 Tile + DSRF
5.4 0.58
5 Townsville Cavity Brick Lightweight
Cladding 250 Foil 1.5 2.5 0.0
Tile + DSRF
4.8 0.59
5 Townsville Lightweight
Cladding Lightweight
Cladding 1200 1.5 1.5 2.0 1.0
Tile + DSRF
6.7 0.7
6 Alice Springs Masonry Veneer
Lightweight Cladding
900 2.7 2.7 5.0 2.7 Tile + DSRF
4.8 0.59
6 Alice Springs Cavity Brick Lightweight
Cladding 800 0.0 1.5 2.5 0.0
Tile + DSRF
4.8 0.59
6 Alice Springs Lightweight
Cladding Lightweight
Cladding 1200 2.0 2.0 3.5 2.0
Tile + DSRF
4.3 0.47
7 Rockhampton Masonry Veneer
Lightweight Cladding
650 2.0 2.0 3.5 0.0 Tile + DSRF
5.4 0.58
7 Rockhampton Cavity Brick Lightweight
Cladding 550 0.0 1.5 2.0 0.0
Tile + DSRF
6.7 0.7
7 Rockhampton Lightweight
Cladding Lightweight
Cladding 1200 2.7 2.7 4.1 2.7
Tile + DSRF
6.7 0.7
8 Moree Masonry Veneer
Lightweight Cladding
450 1.5 1.5 3.5 1.0 Tile + DSRF
4.8 0.59
8 Moree Cavity Brick Lightweight
Cladding 700 0.0 1.5 3.5 0.0
Tile + DSRF
6.7 0.7
8 Moree Lightweight
Cladding Lightweight
Cladding 450 2.0 2.0 4.1 2.0
Tile + DSRF
4.8 0.59
9 Amberley Masonry Veneer
Lightweight Cladding
450 1.5 1.5 3.5 1.0 Tile + DSRF
4.8 0.59
9 Amberley Cavity Brick Lightweight
Cladding 50 0.0 1.0 2.0 0.0
Tile + SRFL
6.7 0.7
9 Amberley Lightweight
Cladding Lightweight
Cladding 1000 2.0 2.0 3.5 1.0
Tile + DRFL
5.6 0.41
Improving Australian Housing Envelope Integrity | October 2016
Page 134 of 144
The Housing Research Facility
NatHERS Climate Lower Storey
Upper Storey
Eaves Wall
Ground Floor
Wall Upper Floor
Ceiling Garage/
Habitable Space Wall
Roof
Windows
U-V
alu
e
SHG
C
10 Brisbane Masonry Veneer
Lightweight Cladding
450 1.5 1.5 3.5 1.0 Tile + DRFL
6.7 0.7
10 Brisbane Cavity Brick Lightweight
Cladding 450 0.0 0.5 1.5 0.0 Tile 6.7 0.7
10 Brisbane Lightweight
Cladding Lightweight
Cladding 700 1.5 1.5 3.5 0.0
Tile + DSRF
5.6 0.41
11 Coffs harbour Masonry Veneer
Lightweight Cladding
450 1.5 2.0 3.5 2.0 Tile + DSRF
6.7 0.7
11 Coffs harbour Cavity Brick Lightweight
Cladding 450 0.0 DSRF 2.0 0.0 Tile 6.7 0.7
11 Coffs harbour Lightweight
Cladding Lightweight
Cladding 450 2.0 2.0 3.5 1.0
Tile + DSRF
5.6 0.41
12 Geraldton Masonry Veneer
Lightweight Cladding
200 1.0 1.0 3.5 1.0 Tile + DSRF
4.9 0.33
12 Geraldton Cavity Brick Lightweight
Cladding 350 0.0 DSRF 2.0 0.0
Tile + DSRF
6.7 0.7
12 Geraldton Lightweight
Cladding Lightweight
Cladding 1000 2.5 2.5 3.5 2.0
Tile + DSRF
5.6 0.36
13 Perth Masonry Veneer
Lightweight Cladding
450 1.0 1.0 3.5 1.0 Tile + DSRF
3.4 0.4
13 Perth Cavity Brick Lightweight
Cladding 350 0.0 DSRF 5.0 0.0
Tile + DSRF
5.2 0.39
13 Perth Lightweight
Cladding Lightweight
Cladding 750 2.7 2.7 4.1 2.0
Tile + DSRF
5.2 0.35
14 Armidale Masonry Veneer
Lightweight Cladding
450 2.5 2.5 4.1 2.0 Tile + DSRF
6.7 0.7
14 Armidale Cavity Brick Lightweight
Cladding 600 Foil 1.5 3.5 1.0 Tile 4.8 0.59
14 Armidale Lightweight
Cladding Lightweight
Cladding 450 2.5 2.5 3.5 1.0
Tile + DSRF
4.8 0.59
15 Williamtown Masonry Veneer
Lightweight Cladding
450 2.7 2.7 6.0 0.0 Tile + DSRF
4.8 0.59
15 Williamtown Cavity Brick Lightweight
Cladding 450 0.0 1.5 3.5 0.0 Tile 4.8 0.59
15 Williamtown Lightweight
Cladding Lightweight
Cladding 450 2.0 2.0 4.1 1.0
Tile + DSRF
4.8 0.59
16 Adelaide Masonry Veneer
Lightweight Cladding
450 2.0 1.5 3.5 0.0 Tile + DSRF
2.9 0.51
16 Adelaide Cavity Brick Lightweight
Cladding 600 0.0 2.7 4.1 0.0
Tile + DSRF
4.1 0.52
16 Adelaide Lightweight
Cladding Lightweight
Cladding 900 2.0 2.0 3.5 2.0
Tile + DSRF
4.3 0.53
17 Sydney (Observatory Hill)
Masonry Veneer
Lightweight Cladding
400 1.5 2.0 3.5 0.0 Tile + DSRF
4.8 0.59
17 Sydney (Observatory Hill)
Cavity Brick Lightweight
Cladding 450 0.0 1.0 2.0 0.0 Tile 4.8 0.59
17 Sydney (Observatory Hill)
Lightweight Cladding
Lightweight Cladding
550 1.5 1.5 4.1 0.0 Tile + DSRF
4.8 0.59
18 Nowra Masonry Veneer
Lightweight Cladding
450 1.5 1.5 3.5 0.0 Tile 2.9 0.51
18 Nowra Cavity Brick Lightweight
Cladding 800 0.0 1.5 2.0 0.0
Tile + DSRF
4.1 0.52
18 Nowra Lightweight
Cladding Lightweight
Cladding 450 1.5 1.5 3.5 1.0
Tile + DSRF
4.3 0.53
Improving Australian Housing Envelope Integrity | October 2016
Page 135 of 144
The Housing Research Facility
NatHERS Climate Lower Storey
Upper Storey
Eaves Wall
Ground Floor
Wall Upper Floor
Ceiling Garage/
Habitable Space Wall
Roof
Windows
U-V
alu
e
SHG
C
19 Charleville Masonry Veneer
Lightweight Cladding
600 2.5 2.5 3.5 0.0 Tile + DSRF
4.8 0.34
19 Charleville Cavity Brick Lightweight
Cladding 600 0.0 1.5 2.0 0.0
Tile + DSRF
5.6 0.41
19 Charleville Lightweight
Cladding Lightweight
Cladding 450 2.5 2.5 3.5 0.5
Tile + DSRF
4.9 0.33
20 Wagga Masonry Veneer
Lightweight Cladding
450 2.0 2.0 3.5 0.0 Tile 2.9 0.51
20 Wagga Cavity Brick Lightweight
Cladding 450 0.0 2.5 6.0 0.0
Tile + DSRF
4.1 0.52
20 Wagga Lightweight
Cladding Lightweight
Cladding 450 1.5 1.5 6.0 1.5
Tile + DSRF
4.3 0.53
21 Melbourne Masonry Veneer
Lightweight Cladding
450 2.0 2.5 3.5 0.0 Tile
+VPM 2.9 0.51
21 Melbourne Cavity Brick Lightweight
Cladding 450 Foil + 0.38 2.0 3.5 0.0
Tile +VPM
4.1 0.52
21 Melbourne Lightweight
Cladding Lightweight
Cladding 450 2.5 2.5 4.1 2.0
Tile +VPM
4.3 0.53
22 East Sale Masonry Veneer
Lightweight Cladding
450 1.5 1.5 4.1 0.0 Tile
+VPM 2.9 0.51
22 East Sale Cavity Brick Lightweight
Cladding 450 Foil 2.0 5.0 1.0
Tile +VPM
4.1 0.47
22 East Sale Lightweight
Cladding Lightweight
Cladding 450 2.0 2.0 4.1 1.0
Tile +VPM
4.3 0.53
23 Launceston (Ti Tree Bend)
Masonry Veneer
Lightweight Cladding
450 1.5 1.5 4.1 0.0 Tile
+VPM 2.9 0.51
23 Launceston (Ti Tree Bend)
Cavity Brick Lightweight
Cladding 450 Foil 2.0 5.0 1.0
Tile +VPM
4.1 0.47
23 Launceston (Ti Tree Bend)
Lightweight Cladding
Lightweight Cladding
450 2.0 2.0 4.1 1.0 Tile
+VPM 4.3 0.53
24 Canberra Masonry Veneer
Lightweight Cladding
450 1.5 1.5 4.1 0.0 Tile
+VPM 2.9 0.51
24 Canberra Cavity Brick Lightweight
Cladding 450 Foil 2.0 3.5 1.0
Tile +VPM
4.1 0.47
24 Canberra Lightweight
Cladding Lightweight
Cladding 450 2.0 2.0 4.1 1.0
Tile +VPM
4.3 0.53
25 Cabramurra Masonry Veneer
Lightweight Cladding
450 2.0 2.0 4.1 0.5 Tile
+VPM 2.9 0.51
25 Cabramurra Cavity Brick Lightweight
Cladding 450 Foil + 0.26 2.0 5.0 1.0
Tile +VPM
2.9 0.51
25 Cabramurra Lightweight
Cladding Lightweight
Cladding 450 2.0 2.0 4.1 0.5
Tile +VPM
2.9 0.51
26 Hobart Masonry Veneer
Lightweight Cladding
450 2.0 2.0 3.5 1.5 Tile
+VPM 3.6 0.54
26 Hobart Cavity Brick Lightweight
Cladding 450 Foil 2.0 3.5 1.0
Tile +VPM
3.6 0.54
26 Hobart Lightweight
Cladding Lightweight
Cladding 450 2.0 2.0 4.1 0.5
Tile +VPM
3.6 0.54
27 Mildura Masonry Veneer
Lightweight Cladding
450 2.7 2.7 5.0 2.7 Tile
+VPM 3.6 0.54
27 Mildura Cavity Brick Lightweight
Cladding 450 0.0 2.0 4.1 0.5
Tile +VPM
3.6 0.54
27 Mildura Lightweight
Cladding Lightweight
Cladding 450 2.7 2.7 4.1 1.0
Tile +VPM
3.6 0.54
Improving Australian Housing Envelope Integrity | October 2016
Page 136 of 144
The Housing Research Facility
NatHERS Climate Lower Storey
Upper Storey
Eaves Wall
Ground Floor
Wall Upper Floor
Ceiling Garage/
Habitable Space Wall
Roof
Windows
U-V
alu
e
SHG
C
28 Richmond Masonry Veneer
Lightweight Cladding
450 2.7 2.7 6.0 0.0 Tile + DSRF
4.8 0.59
28 Richmond Cavity Brick Lightweight
Cladding 450 0.0 1.0 3.5 0.0
Tile + DSRF
4.8 0.59
28 Richmond Lightweight
Cladding Lightweight
Cladding 450 2.0 2.0 4.1 1.0
Tile + DSRF
4.8 0.59
29 Weipa Masonry Veneer
Lightweight Cladding
300 2.0 2.0 3.5 0.0 Tile + DSRF
5.6 0.41
29 Weipa Cavity Brick Lightweight
Cladding 300 0.0 1.0 2.5 0.0
Tile + DSRF
4.8 0.59
29 Weipa Lightweight
Cladding Lightweight
Cladding 300 1.5 1.5 2.0 1.0
Tile + DSRF
4.8 0.59
30 Wyndham Masonry Veneer
Lightweight Cladding
600 1.0 1.0 3.5 1.0 Tile + DSRF
4.8 0.34
30 Wyndham Cavity Brick Lightweight
Cladding 600 Foil 1.0 2.5 1.0
Tile + DSRF
4.8 0.34
30 Wyndham Lightweight
Cladding Lightweight
Cladding 600 1.5 1.5 2.0 1.0
Tile + DSRF
4.8 0.34
31 Willis Island Masonry Veneer
Lightweight Cladding
450 1.0 1.0 3.5 1.0 Tile + DSRF
6.7 0.7
31 Willis Island Cavity Brick Lightweight
Cladding 600 0.0 1.0 2.5 1.0
Tile + DSRF
6.7 0.7
31 Willis Island Lightweight
Cladding Lightweight
Cladding 600 1.5 1.5 2.0 1.0
Tile + DSRF
6.7 0.7
32 Cairns Masonry Veneer
Lightweight Cladding
450 2.0 2.0 3.5 0.0 Tile + DSRF
6.7 0.7
32 Cairns Cavity Brick Lightweight
Cladding 450 Foil 2.0 3.5 0.0
Tile + DSRF
6.7 0.7
32 Cairns Lightweight
Cladding Lightweight
Cladding 450 1.5 1.5 2.0 1.0
Tile + DSRF
6.7 0.7
33 Broome Masonry Veneer
Lightweight Cladding
700 2.0 2.0 3.5 0.0 Tile + DSRF
5.6 0.41
33 Broome Cavity Brick Lightweight
Cladding 800 Foil 2.0 3.5 0.0
Tile + DSRF
5.6 0.41
33 Broome Lightweight
Cladding Lightweight
Cladding 900 1.5 1.5 2.0 1.0
Tile + DSRF
5.6 0.41
34 Learmonth Masonry Veneer
Lightweight Cladding
900 2.0 2.0 3.5 0.0 Tile + DSRF
5.6 0.41
34 Learmonth Cavity Brick Lightweight
Cladding 800 0.0 2.0 2.5 0.0
Tile + DSRF
6.7 0.7
34 Learmonth Lightweight
Cladding Lightweight
Cladding 1200 1.5 1.5 2.0 1.0
Tile + DSRF
5.6 0.41
35 Mackay Masonry Veneer
Lightweight Cladding
450 1.0 1.0 2.0 0.0 Tile 6.7 0.7
35 Mackay Cavity Brick Lightweight
Cladding 450 0.0 0.0 0.0 0.0
Tile + SSRF
6.7 0.7
35 Mackay Lightweight
Cladding Lightweight
Cladding 450 DSRF DSRF 2.0 0.0
Tile + SSRF
6.7 0.7
36 Gladstone Masonry Veneer
Lightweight Cladding
450 1.0 1.5 2.0 0.0 Tile 6.7 0.7
36 Gladstone Cavity Brick Lightweight
Cladding 300 0.0 0.0 0.5 0.0 Tile 6.7 0.7
36 Gladstone Lightweight
Cladding Lightweight
Cladding 550 DSRF DSRF 2.0 0.0
Tile + SSRF
6.7 0.7
Improving Australian Housing Envelope Integrity | October 2016
Page 137 of 144
The Housing Research Facility
NatHERS Climate Lower Storey
Upper Storey
Eaves Wall
Ground Floor
Wall Upper Floor
Ceiling Garage/
Habitable Space Wall
Roof
Windows
U-V
alu
e
SHG
C
37 Halls Creek Masonry Veneer
Lightweight Cladding
1300 2.0 2.0 3.5 0.0 Tile + DSRF
5.6 0.41
37 Halls Creek Cavity Brick Lightweight
Cladding 1200 0.0 1.0 2.0 1.0
Tile + DSRF
5.6 0.41
37 Halls Creek Lightweight
Cladding Lightweight
Cladding 1200 2.0 2.0 3.5 1.0
Tile + SSRF
5.6 0.41
38 Tennant Creek Masonry Veneer
Lightweight Cladding
1500 2.0 2.0 3.5 0.0 Tile + DSRF
5.6 0.36
38 Tennant Creek Cavity Brick Lightweight
Cladding 700 0.0 1.0 2.0 1.0
Tile + DSRF
5.6 0.41
38 Tennant Creek Lightweight
Cladding Lightweight
Cladding 1300 2.0 2.0 3.5 1.0
Tile + SSRF
5.6 0.41
39 Mt Isa Masonry Veneer
Lightweight Cladding
800 2.0 2.0 3.5 0.0 Tile + DSRF
5.6 0.36
39 Mt Isa Cavity Brick Lightweight
Cladding 700 0.0 0.5 1.5 0.0
Tile + DSRF
5.6 0.41
39 Mt Isa Lightweight
Cladding Lightweight
Cladding 800 2.0 2.0 3.5 1.0
Tile + SSRF
5.6 0.41
40 Newman Masonry Veneer
Lightweight Cladding
1400 2.0 2.0 3.5 0.0 Tile + DSRF
5.2 0.39
40 Newman Cavity Brick Lightweight
Cladding 1400 0.0 1.0 2.0 1.0
Tile + DSRF
5.6 0.41
40 Newman Lightweight
Cladding Lightweight
Cladding 1600 2.0 2.0 3.5 1.0
Tile + SSRF
5.2 0.39
41 Giles Masonry Veneer
Lightweight Cladding
1200 2.5 2.5 3.5 0.0 Tile + DSRF
4.9 0.33
41 Giles Cavity Brick Lightweight
Cladding 700 0.0 2.0 3.5 1.0
Tile + DSRF
5.6 0.41
41 Giles Lightweight
Cladding Lightweight
Cladding 450 2.7 2.7 4.1 2.7
Tile + DSRF
4.9 0.33
42 Meekatharra Masonry Veneer
Lightweight Cladding
1200 2.5 2.5 4.1 0.0 Tile + DSRF
4.9 0.33
42 Meekatharra Cavity Brick Lightweight
Cladding 600 0.0 1.5 3.5 1.0
Tile + DSRF
5.6 0.41
42 Meekatharra Lightweight
Cladding Lightweight
Cladding 450 2.5 2.5 4.1 1.0
Tile + DSRF
4.9 0.33
43 Oodnadatta Masonry Veneer
Lightweight Cladding
1300 2.7 2.7 4.1 1.0 Tile + DSRF
4.9 0.33
43 Oodnadatta Cavity Brick Lightweight
Cladding 1200 Foil 1.5 4.1 1.0
Tile + DSRF
5.6 0.41
43 Oodnadatta Lightweight
Cladding Lightweight
Cladding 1300 2.7 2.7 4.1 1.0
Tile + DSRF
4.9 0.33
44 Kalgoorlie Masonry Veneer
Lightweight Cladding
800 2.7 2.7 5.0 1.0 Tile + DSRF
4.9 0.33
44 Kalgoorlie Cavity Brick Lightweight
Cladding 1200 0.0 1.5 4.1 1.0
Tile + DSRF
5.6 0.41
44 Kalgoorlie Lightweight
Cladding Lightweight
Cladding 1300 2.7 2.7 4.1 1.0
Tile + DSRF
4.9 0.33
45 Woomera Masonry Veneer
Lightweight Cladding
800 2.7 2.7 4.1 1.0 Tile + DSRF
4.9 0.33
45 Woomera Cavity Brick Lightweight
Cladding 450 Foil 1.5 4.1 0.0
Tile + DSRF
5.6 0.41
45 Woomera Lightweight
Cladding Lightweight
Cladding 1300 2.5 2.5 3.5 1.0
Tile + DSRF
4.9 0.33
Improving Australian Housing Envelope Integrity | October 2016
Page 138 of 144
The Housing Research Facility
NatHERS Climate Lower Storey
Upper Storey
Eaves Wall
Ground Floor
Wall Upper Floor
Ceiling Garage/
Habitable Space Wall
Roof
Windows
U-V
alu
e
SHG
C
46 Cobar Masonry Veneer
Lightweight Cladding
600 2.0 2.0 3.5 1 Tile + DSRF
4.9 0.33
46 Cobar Cavity Brick Lightweight
Cladding 450 0.0 1.5 4.1 0.0
Tile + DSRF
5.6 0.41
46 Cobar Lightweight
Cladding Lightweight
Cladding 450 2.0 2.0 3.5 1
Tile + DSRF
4.9 0.33
47 Bickley Masonry Veneer
Lightweight Cladding
450 2.7 2.7 5.0 2.7 Tile + DSRF
4.9 0.33
47 Bickley Cavity Brick Lightweight
Cladding 450 Foil 1.5 4.1 2.0
Tile + DSRF
5.6 0.41
47 Bickley Lightweight
Cladding Lightweight
Cladding 450 2.7 2.7 4.1 2.7
Tile + DSRF
4.9 0.33
48 Dubbo Masonry Veneer
Lightweight Cladding
450 2.7 2.7 6.0 2.7 Tile + DSRF
4.9 0.33
48 Dubbo Cavity Brick Lightweight
Cladding 450 Foil 2.5 4.1 2.0
Tile + DSRF
5.6 0.41
48 Dubbo Lightweight
Cladding Lightweight
Cladding 450 2.7 2.7 4.1 2.7
Tile + DSRF
4.9 0.33
49 Katanning Masonry Veneer
Lightweight Cladding
450 2.0 2.5 4.1 2.0 Tile + DSRF
4.8 0.59
49 Katanning Cavity Brick Lightweight
Cladding 450 0.0 1.0 3.5 1.0
Tile + SSRF
4.8 0.59
49 Katanning Lightweight
Cladding Lightweight
Cladding 450 2.5 2.5 3.5 1.0
Tile + SSRF
4.8 0.59
50 Oakey Masonry Veneer
Lightweight Cladding
450 2.0 2.0 4.1 2.0 Tile + DSRF
4.8 0.59
50 Oakey Cavity Brick Lightweight
Cladding 450 0.0 1.0 2.5 0.0
Tile + SSRF
6.7 0.7
50 Oakey Lightweight
Cladding Lightweight
Cladding 450 2.0 2.0 4.1 1.0
Tile + SSRF
4.8 0.59
51 Forrest Masonry Veneer
Lightweight Cladding
600 2.5 2.5 6.0 1.5 Tile + DSRF
4.5 0.61
51 Forrest Cavity Brick Lightweight
Cladding 450 Foil 1.0 2.5 0.0
Tile + SSRF
6.7 0.7
51 Forrest Lightweight
Cladding Lightweight
Cladding 450 2.5 2.5 6.0 1.5
Tile + SSRF
4.5 0.61
52 Swanbourne Masonry Veneer
Lightweight Cladding
450 2.5 2.5 4.1 2.0 Tile + DSRF
4.8 0.59
52 Swanbourne Cavity Brick Lightweight
Cladding 450 0.0 2.5 2.5 0.0
Tile + DSRF
6.7 0.7
52 Swanbourne Lightweight
Cladding Lightweight
Cladding 450 2.0 2.0 4.1 2.0
Tile + SSRF
4.8 0.59
53 Ceduna Masonry Veneer
Lightweight Cladding
450 2.5 2.5 5.0 2.0 Tile + DSRF
4.3 0.47
53 Ceduna Cavity Brick Lightweight
Cladding 450 Foil + 0.38 2.5 3.5 0.0
Tile + DSRF
6.7 0.7
53 Ceduna Lightweight
Cladding Lightweight
Cladding 450 2.5 2.5 4.1 2.0
Tile + SSRF
4.3 0.47
54 Mandurah Masonry Veneer
Lightweight Cladding
450 2.0 2.0 3.5 1.0 Tile + DSRF
4.8 0.59
54 Mandurah Cavity Brick Lightweight
Cladding 450 0.0 2.5 2.5 0.0
Tile + DSRF
6.7 0.7
54 Mandurah Lightweight
Cladding Lightweight
Cladding 450 2.0 2.0 4.1 2.0 Tile 4.8 0.59
Improving Australian Housing Envelope Integrity | October 2016
Page 139 of 144
The Housing Research Facility
NatHERS Climate Lower Storey
Upper Storey
Eaves Wall
Ground Floor
Wall Upper Floor
Ceiling Garage/
Habitable Space Wall
Roof
Windows
U-V
alu
e
SHG
C
55 Esperance Masonry Veneer
Lightweight Cladding
450 2.7 2.7 5.0 2.7 Tile + DSRF
4.8 0.59
55 Esperance Cavity Brick Lightweight
Cladding 450 Foil 2.0 3.5 2.0
Tile + DSRF
6.7 0.7
55 Esperance Lightweight
Cladding Lightweight
Cladding 450 2.7 2.7 4.1 2.0
Tile + VPM
4.8 0.59
56 Mascot (Sydney Airport)
Masonry Veneer
Lightweight Cladding
450 2.5 2.5 3.5 0.0 Tile + VPM
4.8 0.59
56 Mascot (Sydney Airport)
Cavity Brick Lightweight
Cladding 450 0.0 2.5 5.0 0.0
Tile + VPM
6.7 0.7
56 Mascot (Sydney Airport)
Lightweight Cladding
Lightweight Cladding
450 2.0 2.0 4.1 0.0 Tile + VPM
4.8 0.59
57 Manjimup Masonry Veneer
Lightweight Cladding
450 2.7 2.7 4.1 2.7 Tile + VPM
4.3 0.47
57 Manjimup Cavity Brick Lightweight
Cladding 450 Foil 2.7 6.0 0.0
Tile + VPM
4.3 0.47
57 Manjimup Lightweight
Cladding Lightweight
Cladding 450 2.5 2.5 4.1 2.5
Tile + VPM
4.3 0.47
58 Albany Masonry Veneer
Lightweight Cladding
450 2.0 2.0 4.1 2.0 Tile + VPM
4.3 0.47
58 Albany Cavity Brick Lightweight
Cladding 450 Foil 2.7 6.0 0.0
Tile + VPM
4.3 0.47
58 Albany Lightweight
Cladding Lightweight
Cladding 450 2.0 2.0 4.1 1.5
Tile + VPM
4.3 0.47
59 Mt Lofty Masonry Veneer
Lightweight Cladding
300 2.7 2.7 5.0 2.7 Tile + VPM
4.1 0.52
59 Mt Lofty Cavity Brick Lightweight
Cladding 50 Foil + 0.38 2.7 6.0 2.7
Tile + VPM
4.1 0.52
59 Mt Lofty Lightweight
Cladding Lightweight
Cladding 450 2.7 2.7 5.0 2.7
Tile + VPM
4.1 0.52
60 Tullamarine (Melbourne Airport)
Masonry Veneer
Lightweight Cladding
450 2.5 2.5 5.0 2.5 Tile + VPM
4.3 0.47
60 Tullamarine (Melbourne Airport)
Cavity Brick Lightweight
Cladding 450 Foil + 0.38 2.0 4.1 1.0
Tile + VPM
4.3 0.47
60 Tullamarine (Melbourne Airport)
Lightweight Cladding
Lightweight Cladding
450 2.5 2.5 5.0 2.0 Tile + VPM
4.3 0.47
61 Mt Gambier Masonry Veneer
Lightweight Cladding
450 2.5 2.5 5.0 1.5 Tile + VPM
4.3 0.47
61 Mt Gambier Cavity Brick Lightweight
Cladding 450 Foil + 0.38 2.0 3.5 1.0
Tile + VPM
4.3 0.47
61 Mt Gambier Lightweight
Cladding Lightweight
Cladding 450 2.5 2.5 4.1 0.0
Tile + VPM
4.3 0.47
62 Moorabbin Masonry Veneer
Lightweight Cladding
450 2.7 2.7 6.0 2.7 Tile + VPM
4.3 0.47
62 Moorabbin Cavity Brick Lightweight
Cladding 450 Foil + 0.38 2.7 6.0 1.5
Tile + VPM
4.3 0.47
62 Moorabbin Lightweight
Cladding Lightweight
Cladding 450 2.7 2.7 6.0 2.7
Tile + VPM
4.3 0.47
Improving Australian Housing Envelope Integrity | October 2016
Page 140 of 144
The Housing Research Facility
NatHERS Climate Lower Storey
Upper Storey
Eaves Wall
Ground Floor
Wall Upper Floor
Ceiling Garage/
Habitable Space Wall
Roof
Windows
U-V
alu
e
SHG
C
63 Warrnambool Masonry Veneer
Lightweight Cladding
450 2.7 2.7 5.0 1.5 Tile + VPM
4.3 0.47
63 Warrnambool Cavity Brick Lightweight
Cladding 450 Foil + 0.38 2.7 4.1 1.0
Tile + VPM
4.3 0.47
63 Warrnambool Lightweight
Cladding Lightweight
Cladding 450 2.7 2.7 5.0 1.0
Tile + VPM
4.3 0.47
64 Cape Otway Masonry Veneer
Lightweight Cladding
450 2.7 2.7 6.0 2.7 Tile + VPM
3.6 0.47
64 Cape Otway Cavity Brick Lightweight
Cladding 450 Foil + 0.38 2.5 5.0 1.5
Tile + VPM
3.6 0.54
64 Cape Otway Lightweight
Cladding Lightweight
Cladding 450 2.7 2.7 5.0 1.0
Tile + VPM
3.6 0.54
65 Orange Masonry Veneer
Lightweight Cladding
450 2.7 2.7 4.1 2.7 Tile + VPM
3.6 0.47
65 Orange Cavity Brick Lightweight
Cladding 450 Foil + 0.38 2.5 3.5 1.5
Tile + VPM
3.6 0.54
65 Orange Lightweight
Cladding Lightweight
Cladding 450 2.7 2.7 3.5 1.0
Tile + VPM
3.6 0.54
66 Ballarat Masonry Veneer
Lightweight Cladding
450 2.7 2.7 5.0 2.7 Tile + VPM
3.6 0.54
66 Ballarat Cavity Brick Lightweight
Cladding 450 Foil + 0.38 2.5 5.0 1.5
Tile + VPM
3.6 0.54
66 Ballarat Lightweight
Cladding Lightweight
Cladding 450 2.7 2.7 5.0 1.5
Tile + VPM
3.6 0.54
67 Low Head Masonry Veneer
Lightweight Cladding
450 2.0 2.0 4.1 1.0 Tile + VPM
3.6 0.47
67 Low Head Cavity Brick Lightweight
Cladding 450 Foil 2.5 6.0 0.0
Tile + VPM
3.6 0.54
67 Low Head Lightweight
Cladding Lightweight
Cladding 450 2.0 2.0 3.5 1.0
Tile + VPM
3.6 0.47
68 Launceston Airport
Masonry Veneer
Lightweight Cladding
450 2.5 2.5 5.0 1.0 Tile + VPM
3.6 0.47
68 Launceston Airport
Cavity Brick Lightweight
Cladding 450 Foil 2.5 5.0 1.0
Tile + VPM
3.6 0.54
68 Launceston Airport
Lightweight Cladding
Lightweight Cladding
450 2.5 2.5 4.1 1.0 Tile + VPM
3.6 0.47
69 Thredbo Masonry Veneer
Lightweight Cladding
450 2.7 2.7 6.0 2.7 Tile + VPM
3.6 0.54
69 Thredbo Cavity Brick Lightweight
Cladding 450 Foil + 0.38 2.7 5.0 2.7
Tile + VPM
3.5 0.64
69 Thredbo Lightweight
Cladding Lightweight
Cladding 450 2.7 2.7 5.0 2.7
Tile + VPM
3.6 0.54
Improving Australian Housing Envelope Integrity | October 2016
Page 141 of 144
APPENDIX F – ASHRAE VENTILATION EFFECTIVENESS
The study by ASHRAE (Rudd, Lstiburek, & Townsend, 2009) utilised a reference exposure level
based on the ASHRAE Standard 62.2-2007 ventilation rate using a fully-ducted balanced
ventilation system as the reference system and a moderately airtight building enclosure (3.5
ACH50). A ventilation airflow coefficient was then determined for each ventilation system such
that the occupant exposure using the subject ventilation system was equal to the occupant
exposure using the reference system at the baseline ventilation rate. These coefficients can
be used to compare the effectiveness of different ventilation systems.
A single house plan was used in this study. The house modelled is a two-story, approximately
2600 sf (240 m2) house with four bedrooms and three bathrooms.
Figure 76 ASHRAE house used for ventilation effectiveness simulations
Improving Australian Housing Envelope Integrity | October 2016
Page 142 of 144
APPENDIX G – PEAK COOLING LOAD BY NATHERS CLIMATE
Using hourly load analysis the peak load spikes for the summer cooling and winter heating are
able to be calculated for all climate zones.
The graphs below show an example in Canberra for how the peak heating and cooling
requirements vary based on approximately 1.75ACH-1 (35ACH50) and 0.5ACH-1 (10 ACH50) and
using Typical Meteorological Year (TMY) data for load analysis. Figure 77 -80 show the hourly
loads for the double storey 6 Star Housing Research Facility in Canberra. It can be seen that
the estimated cooling and heating peaks are significantly reduced with an infiltration
reduction from 1.75 to 0.5ACH-1 by 16% and 25% respectively.
Figure 77 Hourly peak cooling load, Housing Research Facility, Canberra, 35 ACH50 (Leaky)
Improving Australian Housing Envelope Integrity | October 2016
Page 143 of 144
Figure 78 Hourly peak cooling load, Housing Research Facility, Canberra, 10 ACH50 (Sealed)
Figure 79 Hourly peak heating load, Housing Research Facility, Canberra, 35 ACH50 (Leaky)
Peak Load 13.83kWc, 1st February 5pm
Improving Australian Housing Envelope Integrity | October 2016
Page 144 of 144
Figure 80 Hourly peak heating load, Housing Research Facility, Canberra, 5 ACH50 (Sealed)
End of report