Embed Size (px)
Citation preview
IMPROVING AN ORDER-DELIVERY
PROCESS WITH PROCESS MANAGEMENT
AND LEAN METHODOLOGY
Case: Startex Oy
LAHTI UNIVERSITY OF APPLIED SCIENCES Faculty of Business Studies Degree Programme of International Business Bachelor’s Thesis Autumn 2009 Anu Nieminen
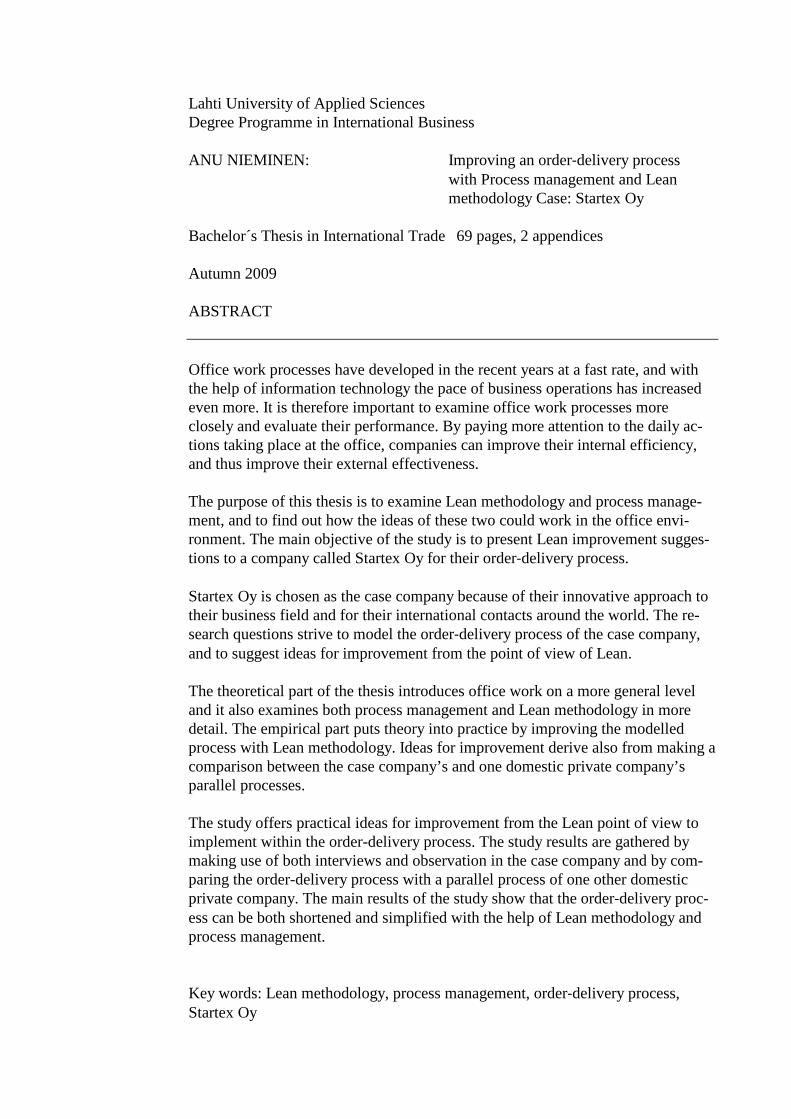
Lahti University of Applied Sciences Degree Programme in International Business ANU NIEMINEN: Improving an order-delivery process with Process management and Lean methodology Case: Startex Oy Bachelor´s Thesis in International Trade 69 pages, 2 appendices Autumn 2009 ABSTRACT Office work processes have developed in the recent years at a fast rate, and with the help of information technology the pace of business operations has increased even more. It is therefore important to examine office work processes more closely and evaluate their performance. By paying more attention to the daily ac-tions taking place at the office, companies can improve their internal efficiency, and thus improve their external effectiveness. The purpose of this thesis is to examine Lean methodology and process manage-ment, and to find out how the ideas of these two could work in the office envi-ronment. The main objective of the study is to present Lean improvement sugges-tions to a company called Startex Oy for their order-delivery process. Startex Oy is chosen as the case company because of their innovative approach to their business field and for their international contacts around the world. The re-search questions strive to model the order-delivery process of the case company, and to suggest ideas for improvement from the point of view of Lean. The theoretical part of the thesis introduces office work on a more general level and it also examines both process management and Lean methodology in more detail. The empirical part puts theory into practice by improving the modelled process with Lean methodology. Ideas for improvement derive also from making a comparison between the case company’s and one domestic private company’s parallel processes. The study offers practical ideas for improvement from the Lean point of view to implement within the order-delivery process. The study results are gathered by making use of both interviews and observation in the case company and by com-paring the order-delivery process with a parallel process of one other domestic private company. The main results of the study show that the order-delivery proc-ess can be both shortened and simplified with the help of Lean methodology and process management. Key words: Lean methodology, process management, order-delivery process, Startex Oy
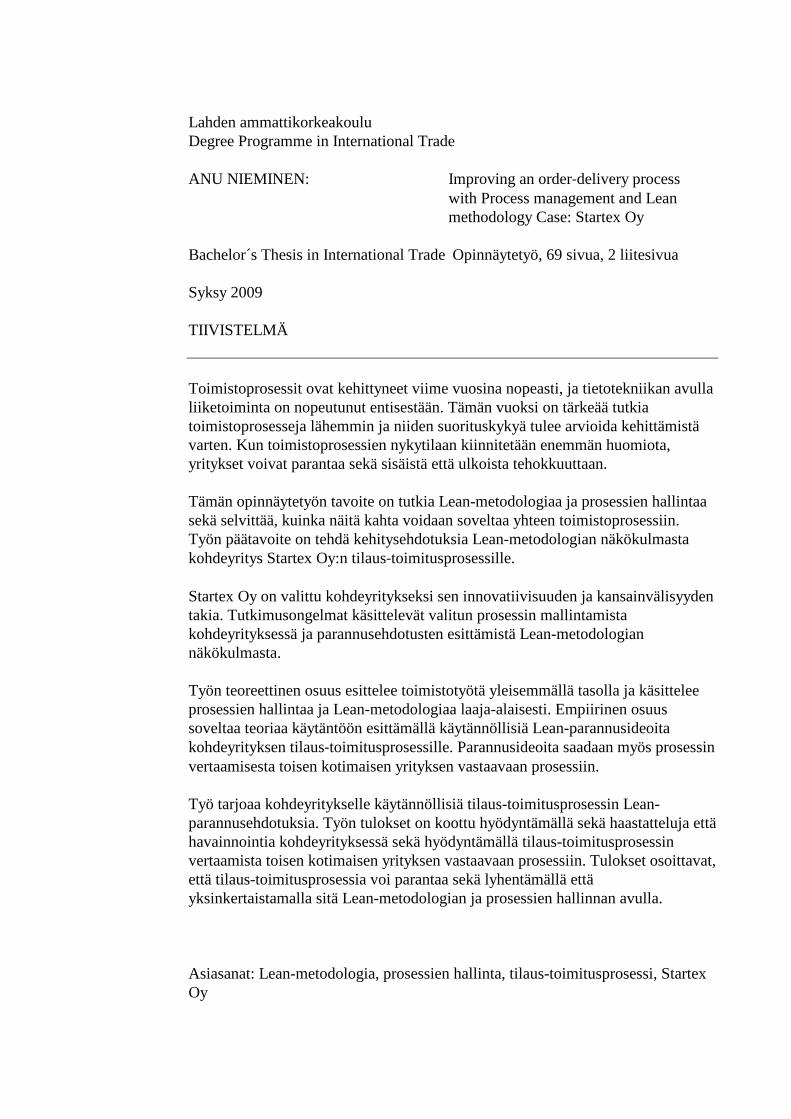
Lahden ammattikorkeakoulu Degree Programme in International Trade ANU NIEMINEN: Improving an order-delivery process with Process management and Lean methodology Case: Startex Oy Bachelor´s Thesis in International Trade Opinnäytetyö, 69 sivua, 2 liitesivua Syksy 2009 TIIVISTELMÄ Toimistoprosessit ovat kehittyneet viime vuosina nopeasti, ja tietotekniikan avulla liiketoiminta on nopeutunut entisestään. Tämän vuoksi on tärkeää tutkia toimistoprosesseja lähemmin ja niiden suorituskykyä tulee arvioida kehittämistä varten. Kun toimistoprosessien nykytilaan kiinnitetään enemmän huomiota, yritykset voivat parantaa sekä sisäistä että ulkoista tehokkuuttaan. Tämän opinnäytetyön tavoite on tutkia Lean-metodologiaa ja prosessien hallintaa sekä selvittää, kuinka näitä kahta voidaan soveltaa yhteen toimistoprosessiin. Työn päätavoite on tehdä kehitysehdotuksia Lean-metodologian näkökulmasta kohdeyritys Startex Oy:n tilaus-toimitusprosessille. Startex Oy on valittu kohdeyritykseksi sen innovatiivisuuden ja kansainvälisyyden takia. Tutkimusongelmat käsittelevät valitun prosessin mallintamista kohdeyrityksessä ja parannusehdotusten esittämistä Lean-metodologian näkökulmasta. Työn teoreettinen osuus esittelee toimistotyötä yleisemmällä tasolla ja käsittelee prosessien hallintaa ja Lean-metodologiaa laaja-alaisesti. Empiirinen osuus soveltaa teoriaa käytäntöön esittämällä käytännöllisiä Lean-parannusideoita kohdeyrityksen tilaus-toimitusprosessille. Parannusideoita saadaan myös prosessin vertaamisesta toisen kotimaisen yrityksen vastaavaan prosessiin. Työ tarjoaa kohdeyritykselle käytännöllisiä tilaus-toimitusprosessin Lean-parannusehdotuksia. Työn tulokset on koottu hyödyntämällä sekä haastatteluja että havainnointia kohdeyrityksessä sekä hyödyntämällä tilaus-toimitusprosessin vertaamista toisen kotimaisen yrityksen vastaavaan prosessiin. Tulokset osoittavat, että tilaus-toimitusprosessia voi parantaa sekä lyhentämällä että yksinkertaistamalla sitä Lean-metodologian ja prosessien hallinnan avulla. Asiasanat: Lean-metodologia, prosessien hallinta, tilaus-toimitusprosessi, Startex Oy
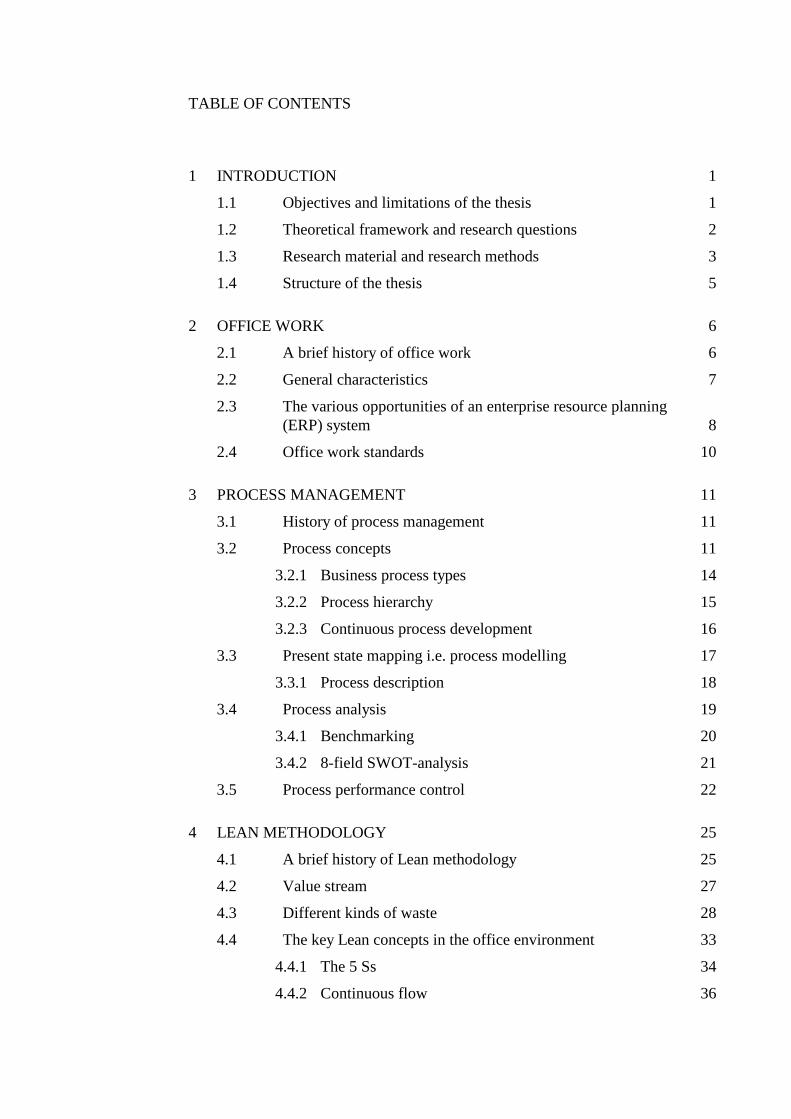
TABLE OF CONTENTS
1 INTRODUCTION 1
1.1 Objectives and limitations of the thesis 1
1.2 Theoretical framework and research questions 2
1.3 Research material and research methods 3
1.4 Structure of the thesis 5
2 OFFICE WORK 6
2.1 A brief history of office work 6
2.2 General characteristics 7
2.3 The various opportunities of an enterprise resource planning (ERP) system 8
2.4 Office work standards 10
3 PROCESS MANAGEMENT 11
3.1 History of process management 11
3.2 Process concepts 11
3.2.1 Business process types 14
3.2.2 Process hierarchy 15
3.2.3 Continuous process development 16
3.3 Present state mapping i.e. process modelling 17
3.3.1 Process description 18
3.4 Process analysis 19
3.4.1 Benchmarking 20
3.4.2 8-field SWOT-analysis 21
3.5 Process performance control 22
4 LEAN METHODOLOGY 25
4.1 A brief history of Lean methodology 25
4.2 Value stream 27
4.3 Different kinds of waste 28
4.4 The key Lean concepts in the office environment 33
4.4.1 The 5 Ss 34
4.4.2 Continuous flow 36
4.4.3 Jidoka 36
4.5 Lean leadership 37
4.6 Implementing Lean in a nutshell 38
5 PRESENT STATE MAPPING OF THE ORDER-DELIVERY PROCESS AT STARTEX OY 40
5.1 Startex Oy overview 40
5.2 An ERP system at Startex Oy 41
5.3 The most important processes at Startex Oy 41
5.4 The present state of the order-delivery process at Startex Oy 43
5.5 Problem areas within the process at Startex Oy 47
6 IMPROVEMENT SUGGESTIONS TO THE ORDER-DELIVERY PROCESS AT STARTEX OY 49
6.1 Lean into the process 49
6.2 Benchmarking the case company’s order-delivery process 52
6.2.1 The comparison between the order-delivery processes 54
6.3 8-field SWOT-analysis 56
6.4 Expert opinions about the improvement ideas for the order-delivery process 59
7 SUMMARY 61
LIST OF SOURCES 64
APPENDICES 69
1 INTRODUCTION
1.1 Objectives and limitations of the thesis
The main objective of this thesis is to find practical ways of improving an office
work process, namely the order-delivery process of the case company Startex Oy,
to be more efficient and less time consuming by implementing Lean methodology
in the process. This company is a Finnish corporation and was founded in 1981.
The company specializes in ski wax and roller skis production and sales. Startex
Oy co-operates at present with 25 countries around the world. The company has
developed a wide range of different ski waxes, ski products and roller skis and is
very successful in its field. (Startex Oy 2009.)
This thesis will discuss the key aspects of the order-delivery process, which is one
of the most significant office work processes of the company. The process was
chosen in co-operation with the contact person of the case company. The case
company is only used as an example of an international company and therefore
information supplied by it will remain at a more general level, rather than giving
specific details of its operations. Hence, the study offers ideas for improvement
from the point of view of Lean methodology to the case company on how it could
improve the internal efficiency of their order-delivery process.
With the purpose of providing practical guidelines for the case company’s order-
delivery process, a comparison will be drawn between the order-delivery processes
of the case company and one domestic private company. Although the companies
are very different from each other, the comparison is presumed to provide consid-
erable benefit to both companies, though the main focus is on the case company’s
process.
2
1.2 Theoretical framework and research questions
The figure 1 below presents the research plan of this thesis. The theoretical
framework of the study covers topics relating to office work, process management
and Lean methodology. As process management and Lean methodology go hand
in hand, both subjects are to be studied in detail. Office work is examined on a
more general level, and after it process management and Lean methodology are
examined in greater detail. Seeing that the improvement suggestions are to be pre-
sented from the point of view of Lean methodology, the three topics must be un-
derstood thoroughly.
FIGURE 1. The research plan of the thesis
3
Moving on in figure 1, the key research questions are illustrated. The aim of the
first research question is to find out the present state of the order-delivery process
at Startex Oy by modelling it with the help of present state mapping. The goal of
the second research question is to examine that process fully and to outline the key
areas in need for improvement. Improvement suggestions derive from the analysis
of the research results. Co-operation with the case company’s personnel at all
times during the thesis process is crucial and it will impact the outcome of the
research.
1.3 Research material and research methods
All material regarding the case company will be provided by the case company’s
personnel. All other materials required in the study are acquired from publications
in both written and electronic forms.
This research is carried out as a qualitative study, and the following research
methods are chosen to collect primary information to help the analysis of the re-
sults. With the help of the chosen research methods; observation, poly-structured
interviews, unstructured interviews, workday journals and benchmarking, a de-
tailed viewpoint of the present state of the order-delivery process can be reached
and possible improvement ideas can be perceived.
Observation
Observation as a research method can be divided into two parts: systematic obser-
vation and participative observation. Since systematic observation method re-
quires a professional researcher to take the full advantage of it, focus will be on
the participative observation method. (Hirsjärvi, Remes & Sajavaara, 2007, 186-
215).
Participative observation is very useful in gathering primary information, and in
this study primary information is crucial in order to gather an authentic view of the
4
case company’s order-delivery process. In this thesis, participative observation is
used on many occasions so that a more realistic picture of the current situation can
be observed. In this study, participative observation is carried out so that the au-
thor is acting as an observer, working in the background and asking questions.
Interviews
Interview as a research method will help when an inside outlook on the work
processes is wanted. This method will not, however, provide a fully realistic pic-
ture. Interviews tend to give information of what people think about their work,
rather than providing an authentic picture of what people actually do in their work.
(Hirsjärvi et al. 2007, 207.)
Both unstructured and semi-structured interviews are to be used in the modelling
phase of the order-delivery process to give a better understanding of the possible
problem areas. Interviews will be carried out later on in the process, since they
need a lot of planning in advance. The interviews will be completed as individual
and group interviews. All interviews will be recorded so no information is lost.
Workday journals
Workday journal as a research method can be seen as a type of a questionnaire
where employees write down their different tasks and activities during the work-
ing days. Therefore the preparation process of the workday journals is just as im-
portant as creating of a normal questionnaire. Workday journals can be put into
practice in many ways, but nowadays the electronic workday journal forms are
much more efficient and much faster than non-electronic forms because the elec-
tronic journals can be analysed without the conversion from paper form to elec-
tronic. A modified, non-electronic, workday journal example is attached in the
appendix 1.
5
Benchmarking
This research method is essentially a comparative research, and it is a valuable
tool in process analysis. A company’s processes can be compared to another one’s
parallel processes. The aim of making a comparison is to improve both compa-
nies’ processes. Benchmarking is generally divided into three groups; internal,
external and operational. (Hölttä & Savonen 1997, 21; Lecklin, 2006, 161-163.)
In this thesis, benchmarking will be conducted as a comparison between the case
company’s order-delivery process and a domestic service-oriented private compa-
ny’s parallel process. The comparison of the processes aims to provide an addi-
tional viewpoint to the analysis of the case company’s process and to help in the
idea generation of the improvement suggestions.
1.4 Structure of the thesis
The theoretical part of the study consists of four elements. The first chapter of the
study is an introduction and it outlines the research plan of the thesis in more de-
tail. The second part presents office work in general, concentrating on the fast
development of it. The third part of the study concentrates on process manage-
ment, examining the subject on a more general level. The fourth part of the study
introduces Lean methodology in greater detail, as it is the focal point of the study.
In the empirical part of the study, the case company is presented in the fifth chap-
ter, focusing on the present state of the order-delivery process. Moving on, in
chapter six, Lean improvement recommendations are presented to the modelled
process; the chapter also describes the comparison of the case company’s process
to another domestic private company’s parallel process and concludes by present-
ing expert opinions about the suggested improvement recommendations to the
order-delivery process. Chapter seven presents the author’s conclusions of the
thesis and a summary of the whole study.
6
2 OFFICE WORK
2.1 A brief history of office work
Office work has developed greatly in the industrial age through the introduction of
automation, specifically when the typewriter and the adding machine were intro-
duced in the 19th century. Later, the addition of computers and IT-systems affected
the organization of office work. The automation of work has, though, resulted in
fewer jobs as no longer are machine operators needed and many clerk tasks are
redundant, which again cuts costs. (Encyclopaedia Britannica, 2008.)
The fast development of office work in the computer age led to the rise of virtual
offices, because with the help of telecommunications and computers office work-
ers would not have to leave home for work. Virtual offices have, however, not
materialized for the benefit coming from interactions with other fellow employees
at the office. Work efficiency, on the other hand, has been improved because
automation lets managers to monitor their employees’ work efficiency. To give an
example of monitoring, managers can find out the number and times of a worker’s
telephone calls and track the number and nature of web sites an employee ac-
cesses. (Encyclopaedia Britannica, 2008.)
As industrial production increased, new methods were introduced to office work
as well. One of the most significant new office work approaches was Taylorism.
Aalto & Westermarck, (1997, 17) have discussed the main characteristic of Tay-
lorism, the scientific management. This approach was based on a thorough analy-
sis of work flows with the intention of optimising the work tasks.
Now, in the 21st century, office work has become more important and efficient in
many ways and office environments are now seen as just as important as the work
force itself. As a result of the development of information technology, the storing
and protection of information is becoming more and more crucial for the company
in order to be successful and to stay on track of its operations. But with the new
7
technology comes a need for quality and efficiency controls (Aalto & Wester-
marck, 1997, 135). Fortunately there are various methods to help with this need,
such as the ISO 9000-standards and certificates.
2.2 General characteristics
Office work in a nutshell is all about supporting the business operations and help-
ing in the recording process of those actions and decisions. Office work is the in-
visible strength of the company, which maintains all of the incoming and outgoing
data and refines it for different uses. (Aalto & Westermarck, 1993, 17.)
Aalto & Westermarck, (1993) have divided office work into two parts. The first
part is about information processing and is by nature very repetitive, for example
accounting and invoicing. The second part is about gathering information and ad-
justing documents for different situations, for example different kinds of meetings
and negotiation situations.
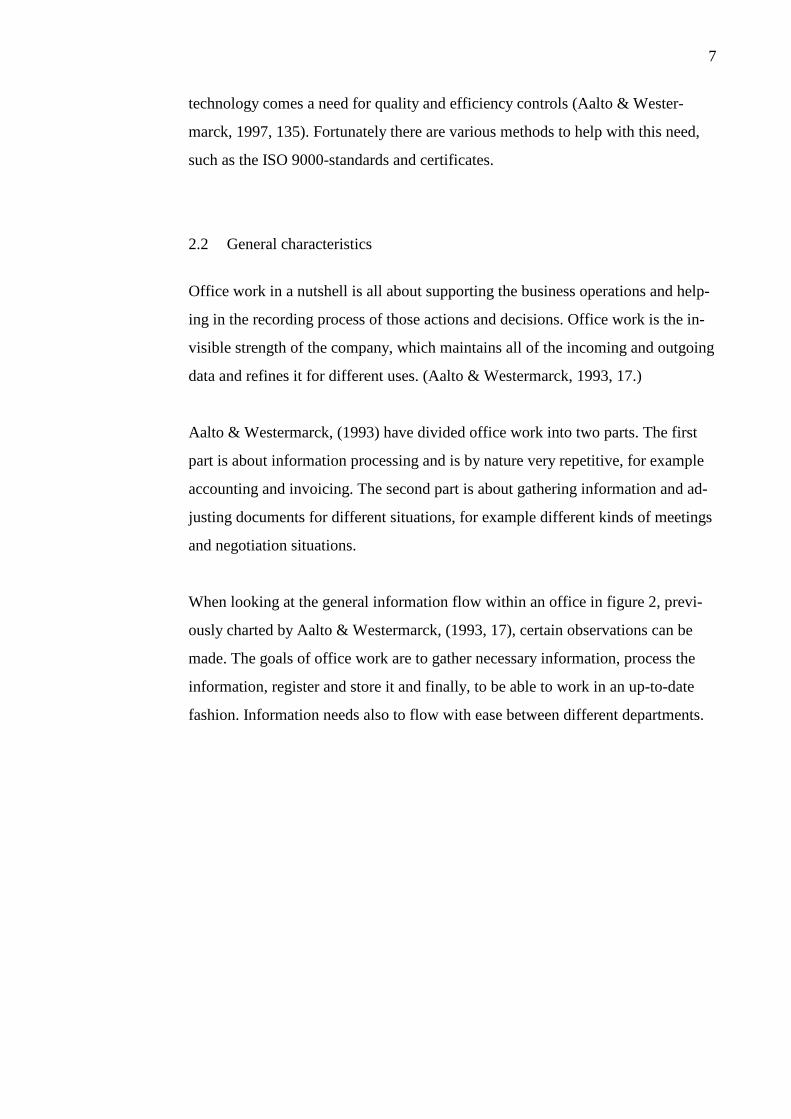
When looking at the general information flow within an office in figure 2, previ-
ously charted by Aalto & Westermarck, (1993, 17), certain observations can be
made. The goals of office work are to gather necessary information, process the
information, register and store it and finally, to be able to work in an up-to-date
fashion. Information needs also to flow with ease between different departments.
8
FIGURE 2. Information flow in the office (Aalto & Westermarck, 1993, 17.
Translated by the author of the thesis)
As presented in figure 2, in an office information is gathered with the help of dif-
ferent kinds of reports and documents. After this, it can be adjusted and altered
before it is stored, either in paper or electronic forms, preferably in both forms
when dealing with important documents. At this stage it is easy to retrieve infor-
mation by other employees, who can, for instance, distribute the document to
other departments for internal use or to have it available for external use. (Aalto &
Westermarck, 1993, 17-18.)
In order to achieve that, various types of equipment and expertise are needed.
These include the necessary word processing programmes, spreadsheet software
programmes and presentation software and also the industry-specialised software
designed for the particular company. Both high quality equipment and specialised
expertise is required in order to be able to operate in a quick and efficient way.
(Aalto & Westermarck, 1993, 19.)
2.3 The various opportunities of an enterprise resource planning (ERP) system
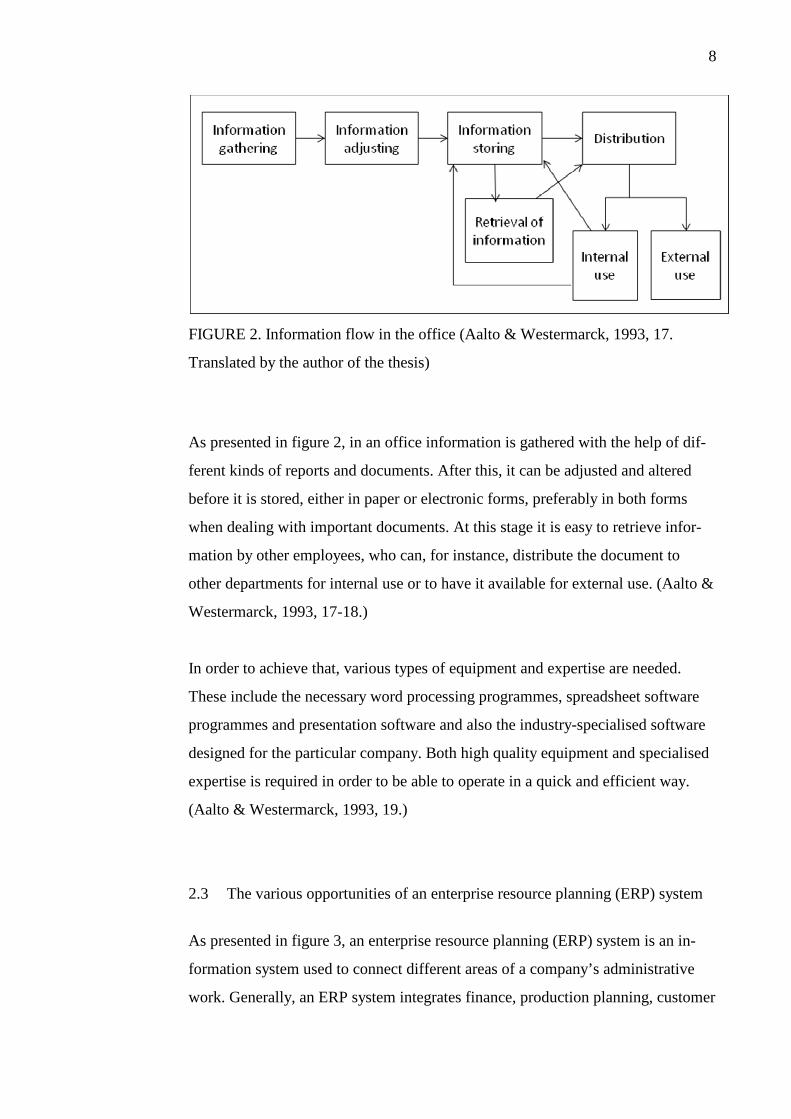
As presented in figure 3, an enterprise resource planning (ERP) system is an in-
formation system used to connect different areas of a company’s administrative
work. Generally, an ERP system integrates finance, production planning, customer
9
relationship management and human resources into one system. ERP systems
support the value chain, allowing the company to add value to its goods and ser-
vices. (Encyclopaedia Britannica, 2009.)
FIGURE 3. An ERP system
To get the maximum benefit of an ERP system, all parties who have access to the
system need to be able to use the system to the fullest. Also, it needs to be made
sure that all sections of the system are interacting with each other coherently and
that information is available on all of the computers in the company. (Aalto, Pel-
tomäki & Westermarck, 2007, 16.)
An example of an ERP system is software called Visma, also presently utilized in
the case company for more than one year. This software assists in creating value to
the supply chain by tracking different areas of, for instance, production, storage
and financial management. The software is user-friendly, and the software compa-
ny provides also a helpdesk to its customers. (Visma Software Oyj. 2008.)
10
2.4 Office work standards
In the office environment, standards come in handy when the same types of docu-
ments are used consistently. The aim of document and template standards is to
increase the rate of processing, for example by using the document standard SFS
2485 or SFS 3172 for domestic trade. (SFS-Käsikirja 76, 2000.) Standards are
nowadays made to be international, but since they are merely guidelines, they re-
main voluntary. (SFS, 2009.)
ISO 9000-standards
ISO 9000-standards, which are a series of quality management standards, were
accepted in 1987 by International Standard Organization (ISO). The development
of internationally recognized quality management standards was stimulated by the
increase in international trade and because of the fear of a variety of different na-
tional standards would complicate the international trade. (Lecklin, 2006, 309;
ISO, 2009.)
In year 2000, a new, updated version of ISO 9000 was published, the ISO
9000:2000 standard with the ISO 9004:2000 standard, providing instructions and
guidelines. The significance of ISO 9001 standard is so substantial that in specific
businesses companies are obliged to acquire the certificate in order to even receive
orders. (Lecklin, 2006, 310.)
11
3 PROCESS MANAGEMENT
3.1 History of process management
Process management dates back to the times of Frederick Taylor, who was respon-
sible of developing process improvement. Process management developed greatly
when Shewart, Deming, Juran and others combined the Taylorist process im-
provement to statistical process control. The development involved measuring and
limiting process variation, making improvements continuous and allowing work-
ers to improve their own processes. (Jeston & Nelis, 2006, xiv.)
Toyota then realized the opportunities of process management and turned it into a
distinctive advance in their operations. The widely known Toyota Production Sys-
tem (TPS) combined statistical process control with ongoing learning in teams,
adopting both waste and inventory control. (Jeston & Nelis, 2006, xiv.)
The basis of TPS is the elimination of different kinds of waste, the same as with
Lean methodology. This was accomplished by introducing two fundamental ap-
proaches: Just-in-time (JIT) production and Autonomation. JIT in practice means
that material, data and information flow to a workstation in only the amount
needed, allowing the system to minimize the amount of “work-in-process”.
Autonomation, then again, means the automation with human intelligence, focus-
ing on improving quality within a process. (Venegas, 2007, x.)
3.2 Process concepts
Process definition
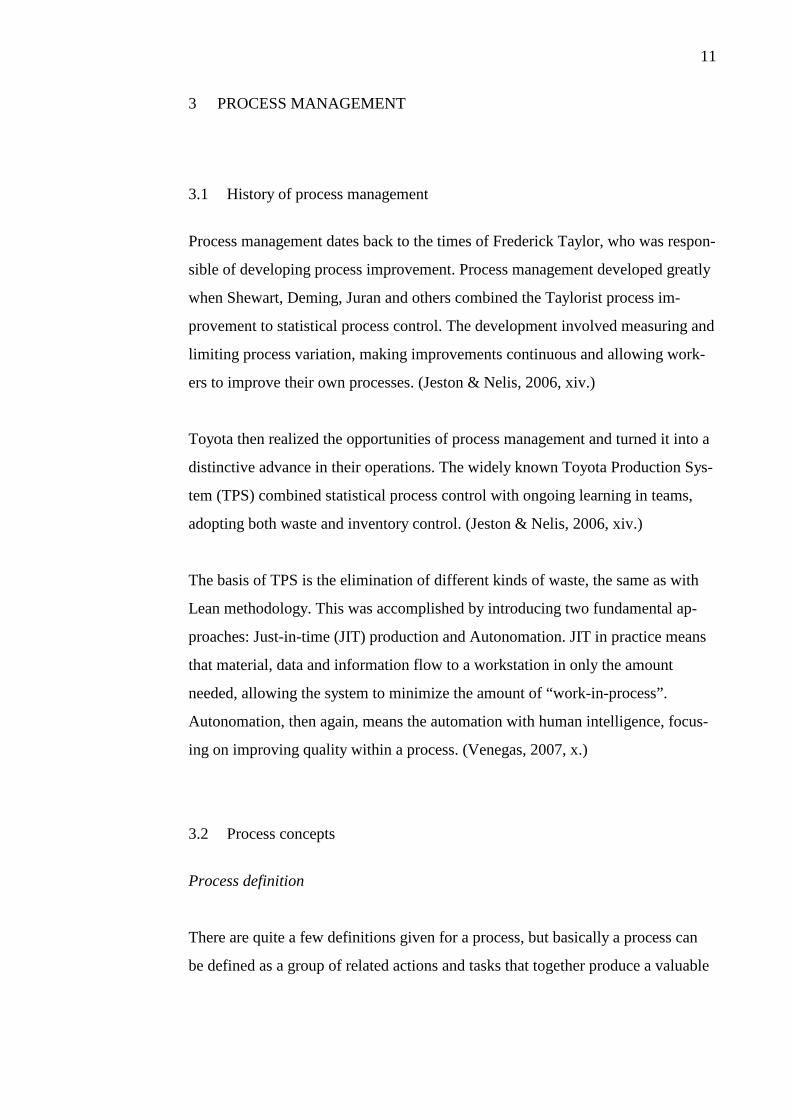
There are quite a few definitions given for a process, but basically a process can
be defined as a group of related actions and tasks that together produce a valuable
12
outcome. A process is also defined as a repetitive sequence of tasks, which can be
defined and measured. (Lecklin, 2006, 123; Moisio, 07/2005.)
FIGURE 4. Simplified business process (Lecklin, 2006, 124. Translated by the
author of the thesis)
In figure 4 above, the basic business process is presented. A process has inputs,
such as information or materials, coming from either an internal or external pro-
vider. The result of a process is an output that a customer, internal or external, has
wanted. The process procedure looks like a series of black boxes, in which the
inputs are transformed into outputs with the help of people, methods and tech-
niques, knowledge and skills and other resources. (Lecklin, 2006, 124.)
Process management
Process management is based on the basic question of how value is created for the
customer in an organization. (Laamanen & Tinnilä, 2009, 52.) Process manage-
ment is basically a management style striving towards improving not only the re-
sults, but also the processes, which create value for the customer. These processes
are for example process development, marketing and order-delivery processes.
13
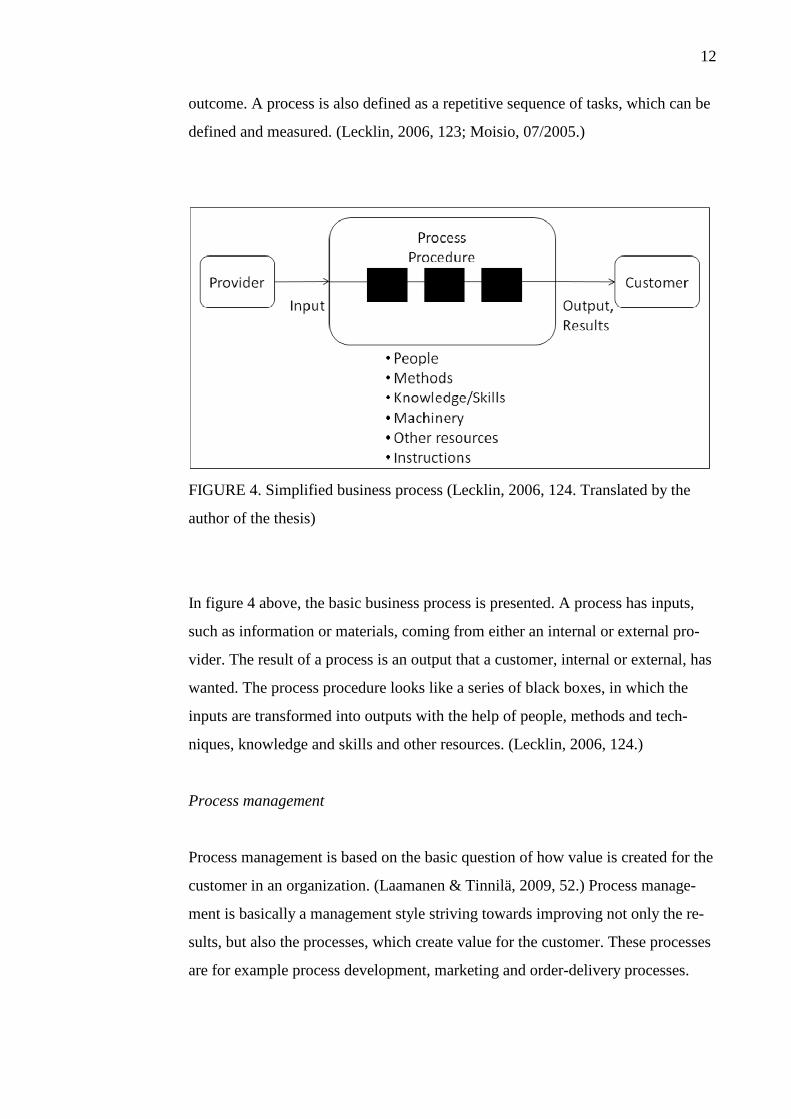
FIGURE 5. Process management (Lecklin, 2006, 126. Translated by the author of
the thesis)
In figure 5 above, process management is illustrated. Process management does
demand the abandonment of functional organization, where different departments
do not interact with each other. Process owners are then the upper management,
and all processes are seen as a network, where core processes are joined together
from the end results of each of them.
Process owner
A process always has an owner and a customer. The process owner has many roles
and responsibilities:
- Understand customer needs
- Identify opportunities for improvement
- Implement and sustain improvements
- Transfer process knowledge
(Gathered by Moisio, 06/2009.)
A process owner can be compared to a department manager in a traditional or-
ganisation. It is the process owner’s responsibility to guarantee the success of the
end result of the process. The process owner is also responsible for the planning
14
and defining of the process and for acquiring the human resources required in the
process. The process owner ought to be chosen on the basis of several aspects. The
end customers of the process are to be defined first and the person responsible for
the critical factors in the process need to be known, as the process owner is often
regarded as a mentor for the process. (Lecklin, 2006, 131.)
Process map
A process map is the big picture of the whole company illustrating the core proc-
esses of the company with all of the connections between the different support
processes. A process map can be broken into smaller pieces, which then present
the core processes one by one. The idea behind the process map is to help the
whole personnel of the company to “stay on the map” when process management
is first introduced in the company. (Leckin 2007, 136: Moisio, 08/2005.)
Process flowchart
A process flowchart is drawn when the process flow is to be illustrated in detail.
In a process flowchart all process steps are visible and process roles are identified.
A process flowchart is also the first step in improving the process, and is followed
by process analysis. (Moisio, 08/2005.)
3.2.1 Business process types
Business processes are categorised typically into four main categories. These cate-
gories are core, support, key and sub processes. A core process serves the cus-
tomer, has an immediate contact to the customer and creates value for the cus-
tomer. Examples of core processes are customer service, product and service de-
velopment and order-delivery process. (Moisio, 08/2005.)
Support processes enable core processes to function, and usually have only inter-
nal customers, who are the other people involved in the process. Examples of
15
these types of processes are human resource management, financial administration
and material flow management. Support processes can be found within one core
process and they include many tasks and activities. (Moisio, 08/2005.)
Key processes are vital for the success of the organization. Key processes are the
most important processes of the company and therefore are the primary develop-
ment areas. Usually they are core or support processes, for example, future plan-
ning and co-operation with customers. (Lecklin, 2006, 130.)
Sub processes are smaller processes within the bigger ones, but nevertheless are
important to model and understand, for instance daily accounting tasks; paying
bills, checking accounts receivables ledgers etc. Sub processes can be cut into
smaller pieces, resulting in tasks. Tasks, however, cannot be divided into smaller
parts. (Lecklin, 2006, 130.)
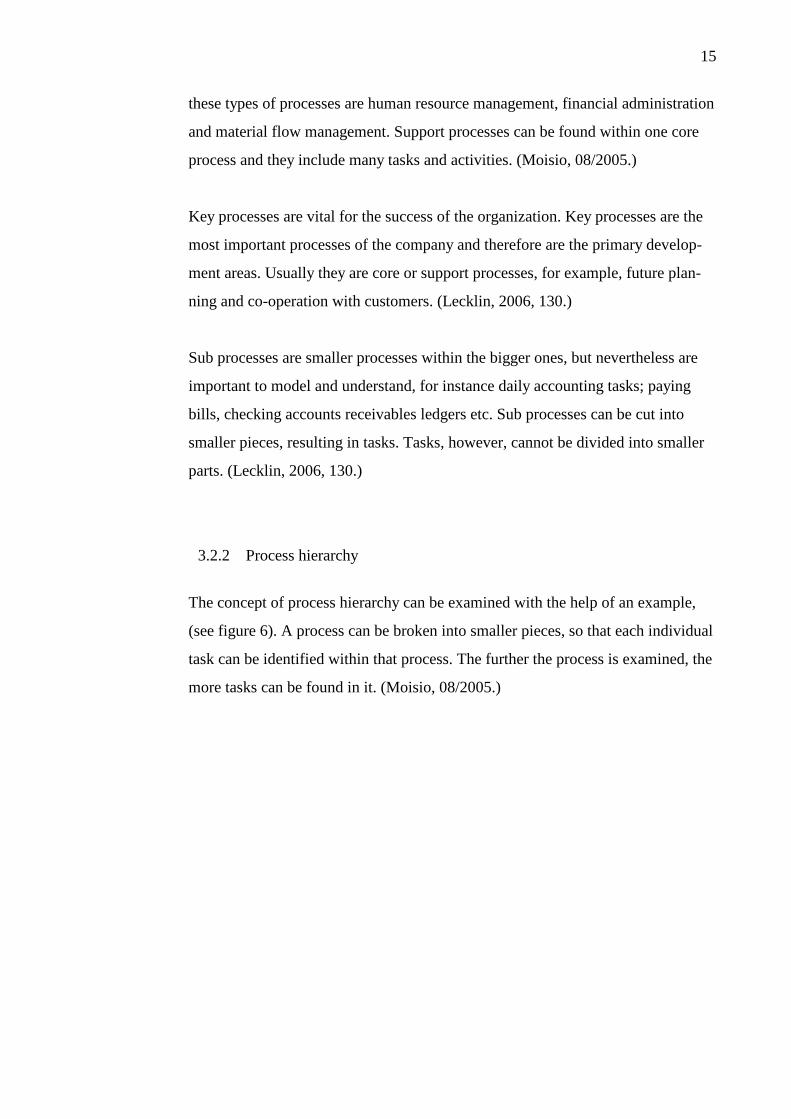
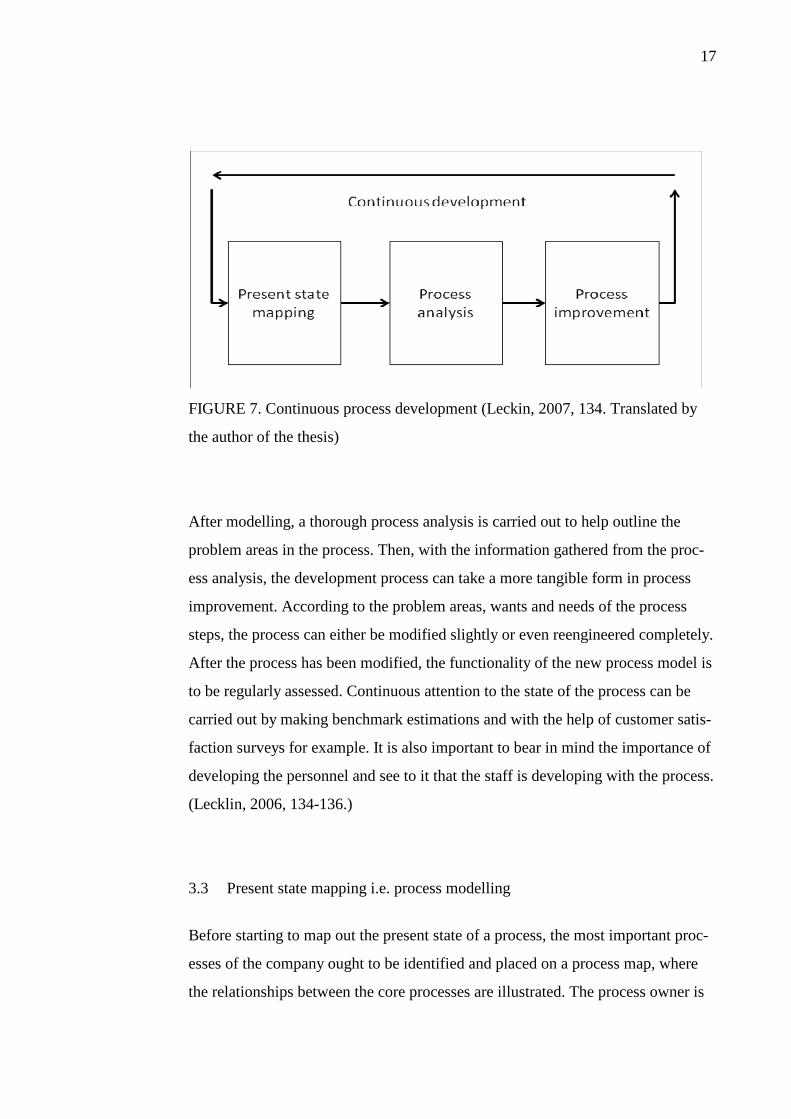
3.2.2 Process hierarchy
The concept of process hierarchy can be examined with the help of an example,
(see figure 6). A process can be broken into smaller pieces, so that each individual
task can be identified within that process. The further the process is examined, the
more tasks can be found in it. (Moisio, 08/2005.)
16
FIGURE 6. Process hierarchy (Lecklin, 2006, 133. Translated by the author of the
thesis)
In figure 6 above, a typical core process, customer relationships management
(CRM) is illustrated as a hierarchy of processes. The core process consists of three
processes within itself. Solution definition includes two sub processes. Planning
of quotation, a sub process of solution definition has three tasks. To compile a
process hierarchy is demanding, but it helps to understand the structure of each
core process in detail, making it that much easier to start business process man-
agement. A good process hierarchy has two or three levels in it, and therefore in
the example the sub process of planning a quotation could be lifted to the upper
level. In order to the process hierarchy to function properly, the limitations of dif-
ferent levels’ processes must be precise and accurate. One task can belong only to
one process. (Lecklin, 2006, 134.)
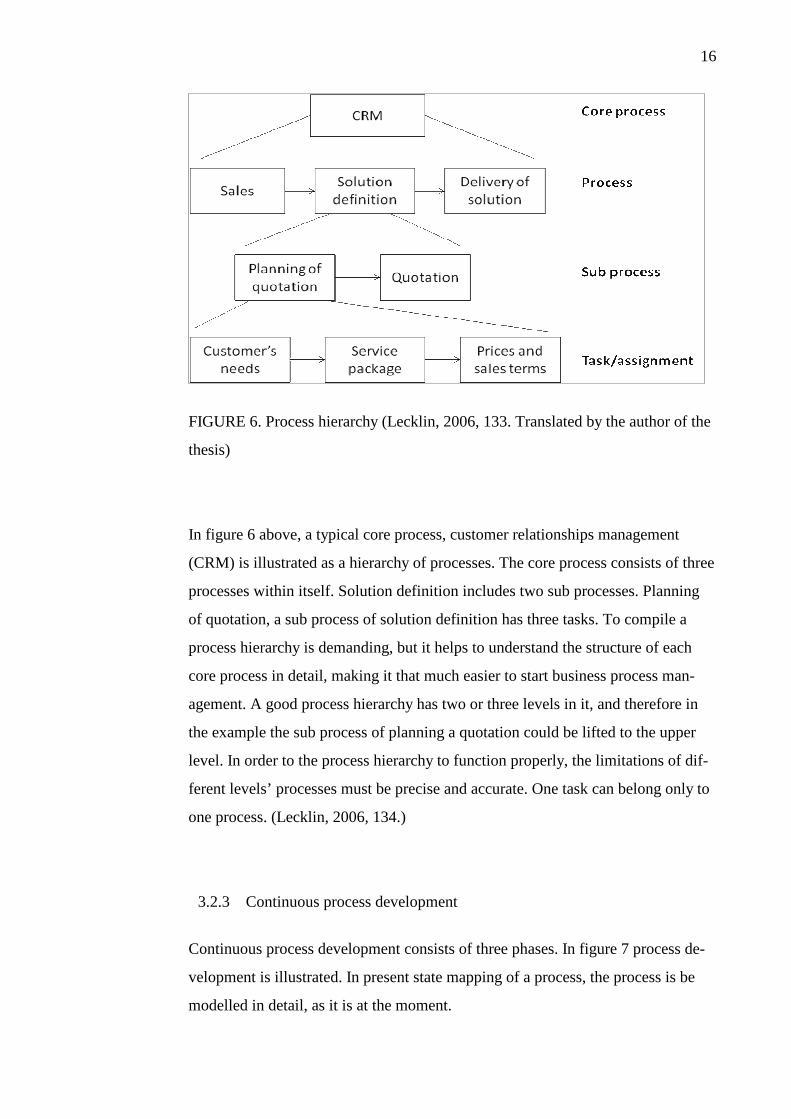
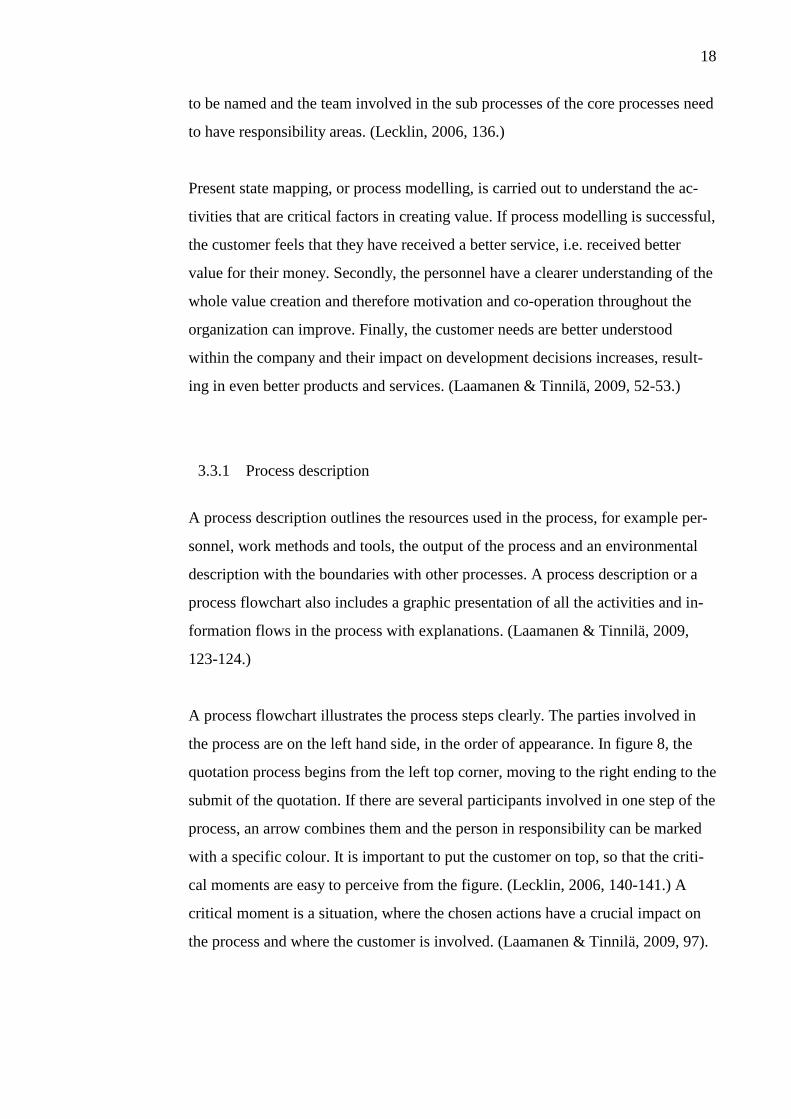
3.2.3 Continuous process development
Continuous process development consists of three phases. In figure 7 process de-
velopment is illustrated. In present state mapping of a process, the process is be
modelled in detail, as it is at the moment.
17
FIGURE 7. Continuous process development (Leckin, 2007, 134. Translated by
the author of the thesis)
After modelling, a thorough process analysis is carried out to help outline the
problem areas in the process. Then, with the information gathered from the proc-
ess analysis, the development process can take a more tangible form in process
improvement. According to the problem areas, wants and needs of the process
steps, the process can either be modified slightly or even reengineered completely.
After the process has been modified, the functionality of the new process model is
to be regularly assessed. Continuous attention to the state of the process can be
carried out by making benchmark estimations and with the help of customer satis-
faction surveys for example. It is also important to bear in mind the importance of
developing the personnel and see to it that the staff is developing with the process.
(Lecklin, 2006, 134-136.)
3.3 Present state mapping i.e. process modelling
Before starting to map out the present state of a process, the most important proc-
esses of the company ought to be identified and placed on a process map, where
the relationships between the core processes are illustrated. The process owner is
18
to be named and the team involved in the sub processes of the core processes need
to have responsibility areas. (Lecklin, 2006, 136.)
Present state mapping, or process modelling, is carried out to understand the ac-
tivities that are critical factors in creating value. If process modelling is successful,
the customer feels that they have received a better service, i.e. received better
value for their money. Secondly, the personnel have a clearer understanding of the
whole value creation and therefore motivation and co-operation throughout the
organization can improve. Finally, the customer needs are better understood
within the company and their impact on development decisions increases, result-
ing in even better products and services. (Laamanen & Tinnilä, 2009, 52-53.)
3.3.1 Process description
A process description outlines the resources used in the process, for example per-
sonnel, work methods and tools, the output of the process and an environmental
description with the boundaries with other processes. A process description or a
process flowchart also includes a graphic presentation of all the activities and in-
formation flows in the process with explanations. (Laamanen & Tinnilä, 2009,
123-124.)
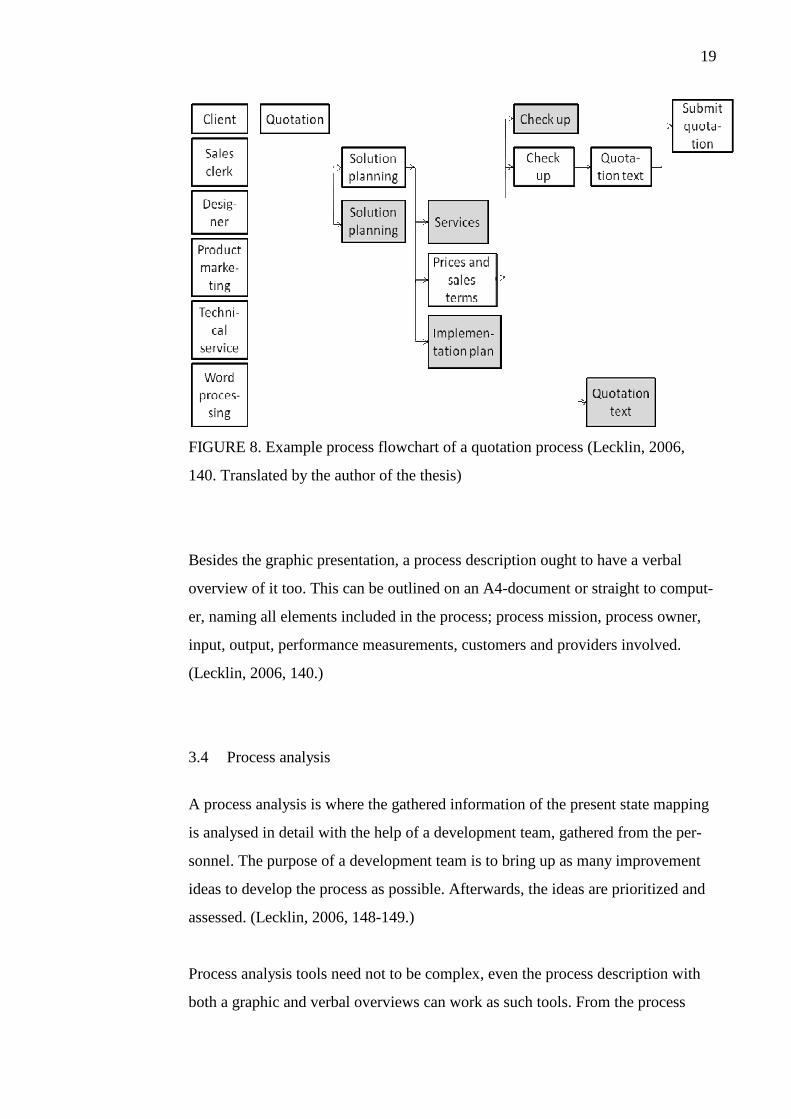
A process flowchart illustrates the process steps clearly. The parties involved in
the process are on the left hand side, in the order of appearance. In figure 8, the
quotation process begins from the left top corner, moving to the right ending to the
submit of the quotation. If there are several participants involved in one step of the
process, an arrow combines them and the person in responsibility can be marked
with a specific colour. It is important to put the customer on top, so that the criti-
cal moments are easy to perceive from the figure. (Lecklin, 2006, 140-141.) A
critical moment is a situation, where the chosen actions have a crucial impact on
the process and where the customer is involved. (Laamanen & Tinnilä, 2009, 97).
19
FIGURE 8. Example process flowchart of a quotation process (Lecklin, 2006,
140. Translated by the author of the thesis)
Besides the graphic presentation, a process description ought to have a verbal
overview of it too. This can be outlined on an A4-document or straight to comput-
er, naming all elements included in the process; process mission, process owner,
input, output, performance measurements, customers and providers involved.
(Lecklin, 2006, 140.)
3.4 Process analysis
A process analysis is where the gathered information of the present state mapping
is analysed in detail with the help of a development team, gathered from the per-
sonnel. The purpose of a development team is to bring up as many improvement
ideas to develop the process as possible. Afterwards, the ideas are prioritized and
assessed. (Lecklin, 2006, 148-149.)
Process analysis tools need not to be complex, even the process description with
both a graphic and verbal overviews can work as such tools. From the process
20
descriptions the wasteful steps can be spotted easily and areas that could be sim-
plified and shortened are visible. (Lecklin, 2006, 149.)
3.4.1 Benchmarking
Benchmarking, which essentially is a comparative research, is a valuable tool in
process analysis. A company’s processes can be compared to another one’s paral-
lel processes, making it more straightforward to improve the company’s own
processes. Benchmarking starts at the planning stage of what processes are ex-
amined and how the actual assessment is carried out. The aim of benchmarking is
to gain such results that both companies benefit from it. (Hölttä & Savonen, 1997,
21.)
There are two ways to carry out benchmarking, either by comparing results and
achievement levels or by comparing procedures, namely the contents of processes
and work steps. The two ways can also be used at the same time. (Lecklin, 2006,
161.)
Benchmarking is generally divided into three groups; internal, external and opera-
tional. The threshold to performing internal benchmarking is low and therefore it
is recommended to start with it before moving on to other ways of implementing
benchmarking. The purpose of internal benchmarking is to learn about the compa-
ny’s strongest units and processes. (Lecklin, 2006, 161-162.)
External benchmarking, then again, involves two companies from the same busi-
ness in the comparison and operational benchmarking extends the concept further
by comparing a company’s operations to another company’s operations from a
different business. In operational benchmarking, the company of comparison is
chosen for its excellent process functionality and efficiency. Operational ben-
chmarking might be the most challenging type of benchmarking, but if the process
development target is aimed high, then operational benchmarking is worth the
effort. (Lecklin, 2006, 161-163.)
21
3.4.2 8-field SWOT-analysis
When trying to identify problem areas in the process analysis phase, a SWOT-
analysis can be of advantage in pinpointing problems areas and in suggesting
strategies for coping with them. The SWOT-technique includes specifying and
relating both organizational strengths and weaknesses and environmental oppor-
tunities and threats. (Proctor, 1995, 56.) Mr. Tony Proctor introduced the 8-field
SWOT-analysis to help identify factors which give rise to problem solutions.
An 8-field SWOT-analysis takes the traditional SWOT-analysis of a company’s
internal strengths and weaknesses and external opportunities and threats, a step
further. It adds four more aspects to the table, which derive from the four original
parts. (Hölttä & Savonen, 1997, 53.)
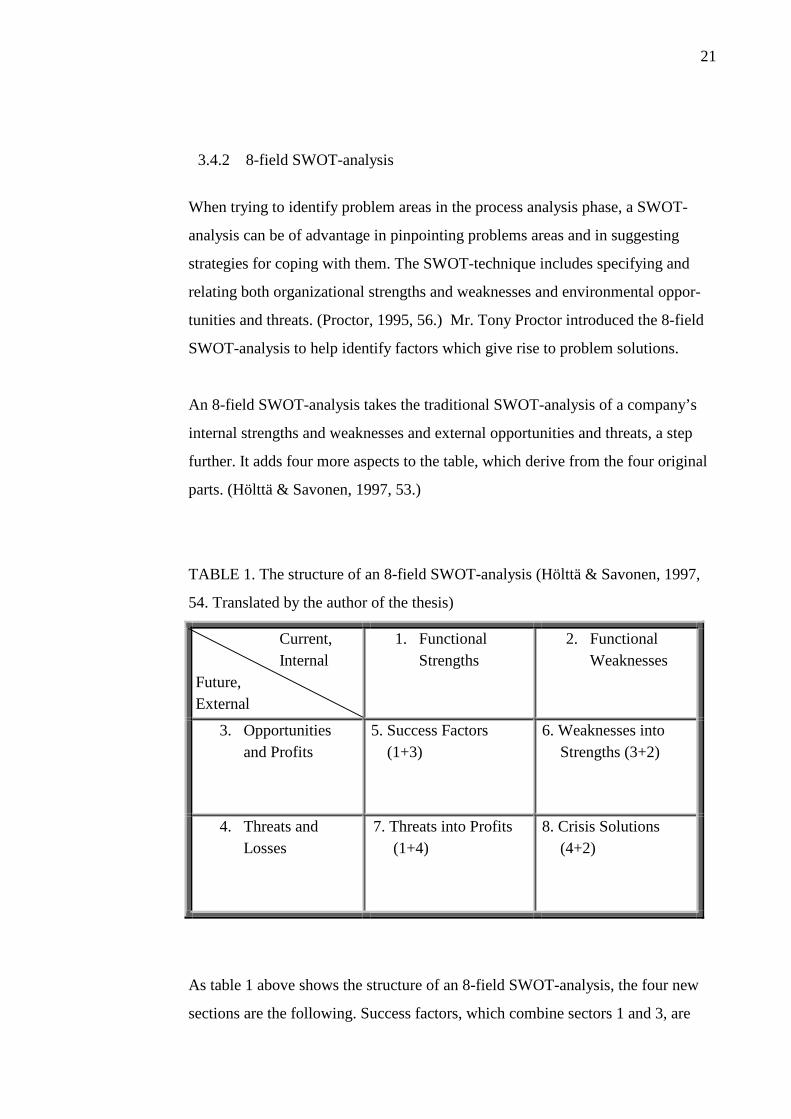
TABLE 1. The structure of an 8-field SWOT-analysis (Hölttä & Savonen, 1997,
54. Translated by the author of the thesis)
Current, Internal Future, External
1. Functional Strengths
2. Functional Weaknesses
3. Opportunities and Profits
5. Success Factors (1+3)
6. Weaknesses into Strengths (3+2)
4. Threats and Losses
7. Threats into Profits (1+4)
8. Crisis Solutions (4+2)
As table 1 above shows the structure of an 8-field SWOT-analysis, the four new
sections are the following. Success factors, which combine sectors 1 and 3, are
22
defined by examining how a company’s external opportunities and profits are
achieved with the internal functional strengths. The weaknesses into strengths-
section, combining sectors 3 and 2, is defined by searching for the means for
transforming company’s internal weaknesses into strengths with the help of exter-
nal opportunities and profits. (Hölttä & Savonen, 1997, 53.)
Moving on in table 1, section 7, that is threats into profits, combines sections 1
and 4. Threats are modified in such ways that profits can be obtained, with the
help of studying various ways of striving to reach the company’s visions. Lastly,
crisis solutions-section 8 is classified as risks, which can be caused by external
threats or by internal functional weaknesses and as finding ways for preparing for
crises. (Hölttä & Savonen, 1997, 54.)
3.5 Process performance control
Performance control is an essential part of process management. It is said that if a
process cannot be measured for its performance, it cannot be controlled. There are
numerous types of performance control tools available. A good performance con-
trol tool is reliable, affordable, precise and straightforward. In general, perform-
ance control tools are divided into two types; result controls and internal quality
controls. Result controls, which evaluate the quality of end products, focus on the
external features of the end product, for instance durability, performance and
weight. Internal quality controls provide information of the current processes and
are more often statistical measures, such as reports and financial statements.
(Lecklin, 2006, 151-152.)
In production and delivery processes good examples of performance controls are
for instance;
- delivery time in days
- number of returns, also %
- duration of production process in days
- number of faulty products, also %
23
- incomplete work €
(Lecklin, 2006, 154.)
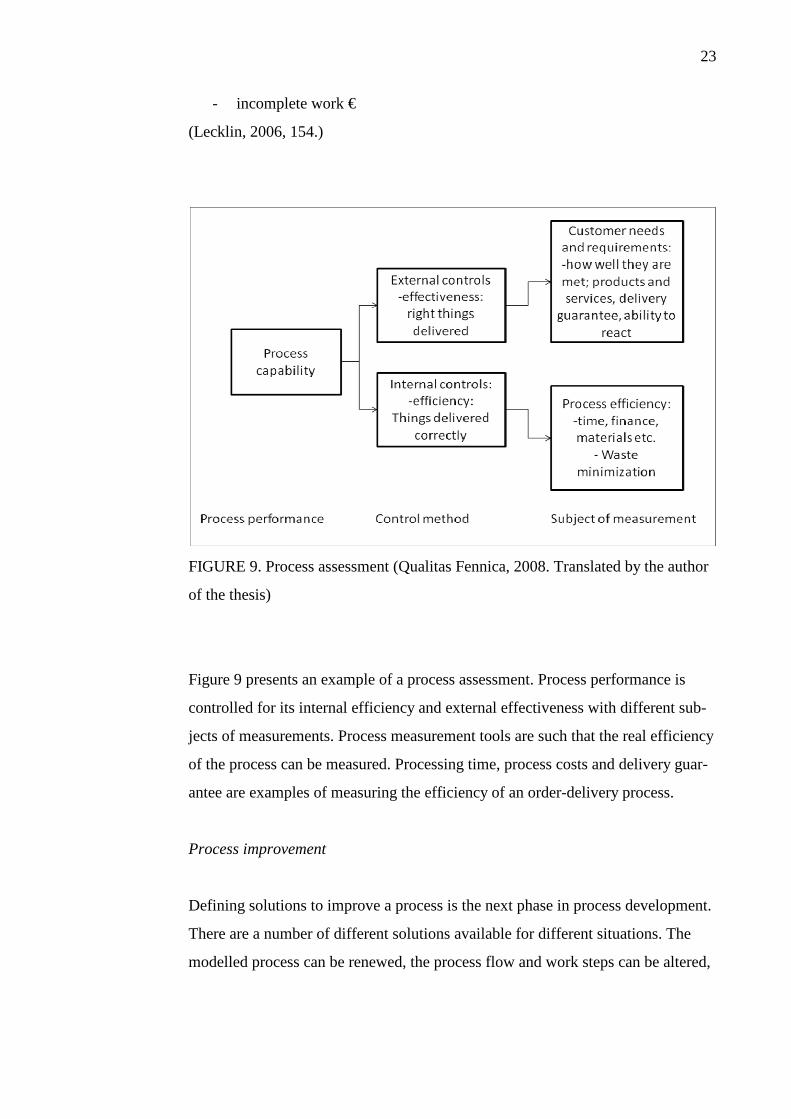
FIGURE 9. Process assessment (Qualitas Fennica, 2008. Translated by the author
of the thesis)
Figure 9 presents an example of a process assessment. Process performance is
controlled for its internal efficiency and external effectiveness with different sub-
jects of measurements. Process measurement tools are such that the real efficiency
of the process can be measured. Processing time, process costs and delivery guar-
antee are examples of measuring the efficiency of an order-delivery process.
Process improvement
Defining solutions to improve a process is the next phase in process development.
There are a number of different solutions available for different situations. The
modelled process can be renewed, the process flow and work steps can be altered,
24
the management style can be revised to be more process-centred or, lastly, the
solutions can all be adapted at the same time. (Lecklin, 2006, 187-188.)
When choosing the way of how to improve a modelled process, there are three
common evaluation criteria; process performance, customer satisfaction and the
prospect of implementing a change. Process performance improvement is the most
common motive in developing a process, for with it mistakes decrease and per-
formance indexes increase. Personnel are responsible for creating better perfor-
mance, and because of that personnel must feel comfortable with changes and be
ready to make changes. (Lecklin, 2006, 188-189.)
25
4 LEAN METHODOLOGY
4.1 A brief history of Lean methodology
The very first person to introduce an entire production process was Mr. Henry
Ford in 1913. He introduced moving assembly lines with standard work, and
called it flow production. The only problem with Ford’s system was the lack of
variety in the finished cars. In 1930, and especially after World War II, Kiichiro
Toyoda, Taiichi Ohno and others at Toyota looked at Ford’s system. They thought
that a series of simple innovations might just improve the continuity in the process
flow and provide more variety in product offerings. After revisiting Ford’s origi-
nal thinking, they invented Toyota Production System (TPS), which is also the
basis of Lean methodology. (Lean Enterprise Institute, 2009.)
Lean methodology evolved from TPS. The principles of TPS and Lean are thus
similar, but are organized in a different manner. In order to understand the strate-
gies of Lean, it is imperative to understand the principles of TPS. TPS builds on
operational stability, which means the attention distributed to all factors affecting
the flow of work, for example, timetables, material flow, information flow and
qualified staff. One other principle of TPS is the Just-in-time method, i.e. produc-
ing only what is needed, when it is needed and the exact amount that is needed.
(Sayer & Williams, 2007, 35.)
Lean methodology, on the other hand, is an operational strategy and a business
philosophy. Although it emphasizes the elimination of waste, reducing costs, im-
proving customer satisfaction, respecting the work force and reducing cycle times,
it also focuses on Just-in-time and other common TPS methods. The main goal of
Lean methodology is to add to the competitiveness of the company by enhancing
its efficiency, productivity and quality. (Venegas, 2007, xi.)
26
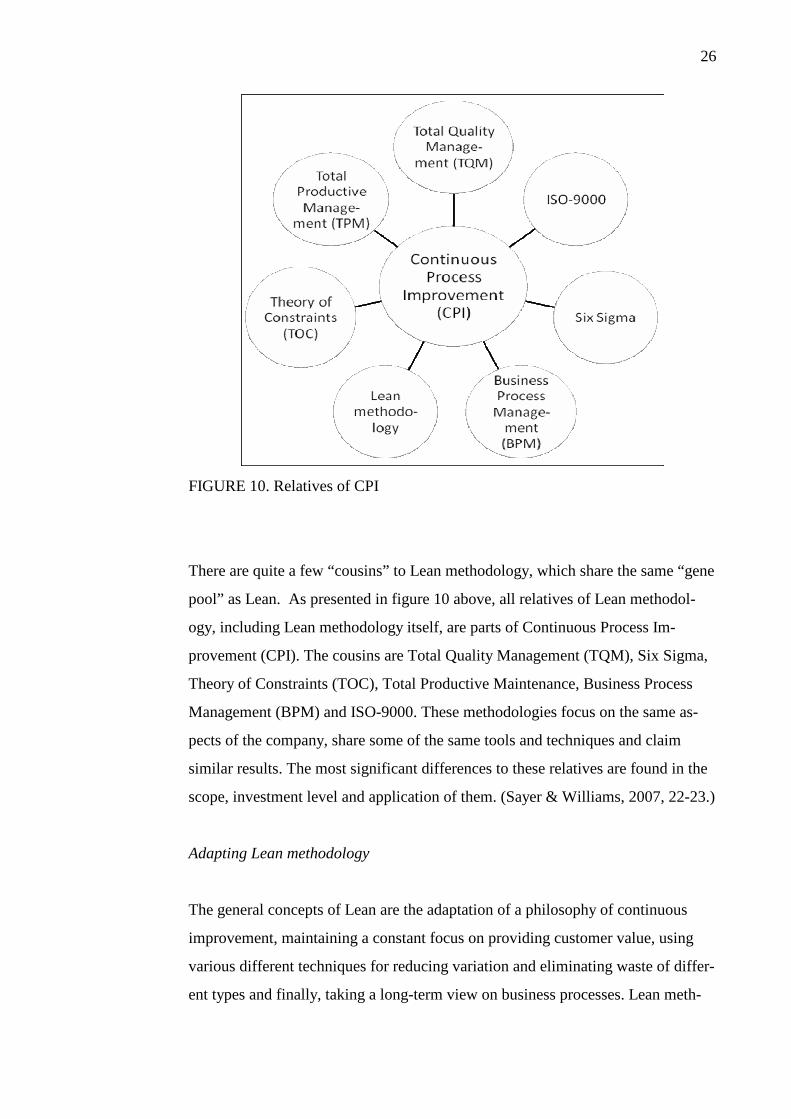
FIGURE 10. Relatives of CPI
There are quite a few “cousins” to Lean methodology, which share the same “gene
pool” as Lean. As presented in figure 10 above, all relatives of Lean methodol-
ogy, including Lean methodology itself, are parts of Continuous Process Im-
provement (CPI). The cousins are Total Quality Management (TQM), Six Sigma,
Theory of Constraints (TOC), Total Productive Maintenance, Business Process
Management (BPM) and ISO-9000. These methodologies focus on the same as-
pects of the company, share some of the same tools and techniques and claim
similar results. The most significant differences to these relatives are found in the
scope, investment level and application of them. (Sayer & Williams, 2007, 22-23.)
Adapting Lean methodology
The general concepts of Lean are the adaptation of a philosophy of continuous
improvement, maintaining a constant focus on providing customer value, using
various different techniques for reducing variation and eliminating waste of differ-
ent types and finally, taking a long-term view on business processes. Lean meth-
27
odology has been adopted by a wide range of different industries, for example,
automotive, banking, construction, healthcare, and government. This goes to show
just how adaptable Lean methodology is. It is for that reason why Lean methodol-
ogy can also be adopted to office work, meaning the internal functions of a com-
pany, supplier networks and customer value chains. (Sayer & Williams, 2007, 11-
12.)
“Lean can be summarised as the systematic pursuit of perfect value through the
elimination of waste in all aspects of the organisation’s business processes”
(Bendell 2006). The pursuit for perfectionism involves a thorough understanding
of all products and services and of the business processes, this being the value
stream of the business. (Bendell 2006.)
4.2 Value stream
Value stream in Lean thinking means the way through which products and ser-
vices are provided to the market. A value stream, or the process flow, consists of
activities that are both value-added and non-value-added. Value-added activities
have three criteria; they need to be something that the customer is willing to pay
for; the activity must transform the product or service some how and the activity
must be done correctly the first time. Non-value-added activities, also known as
the three Ms-muda, mura and muri, are activities, which use resources without
adding value for the customer, activities that do not run smoothly or consistently,
or lastly, activities, which unnecessary burden people, equipment or systems.
(Sayer & Williams, 2007, 51-53.)
28
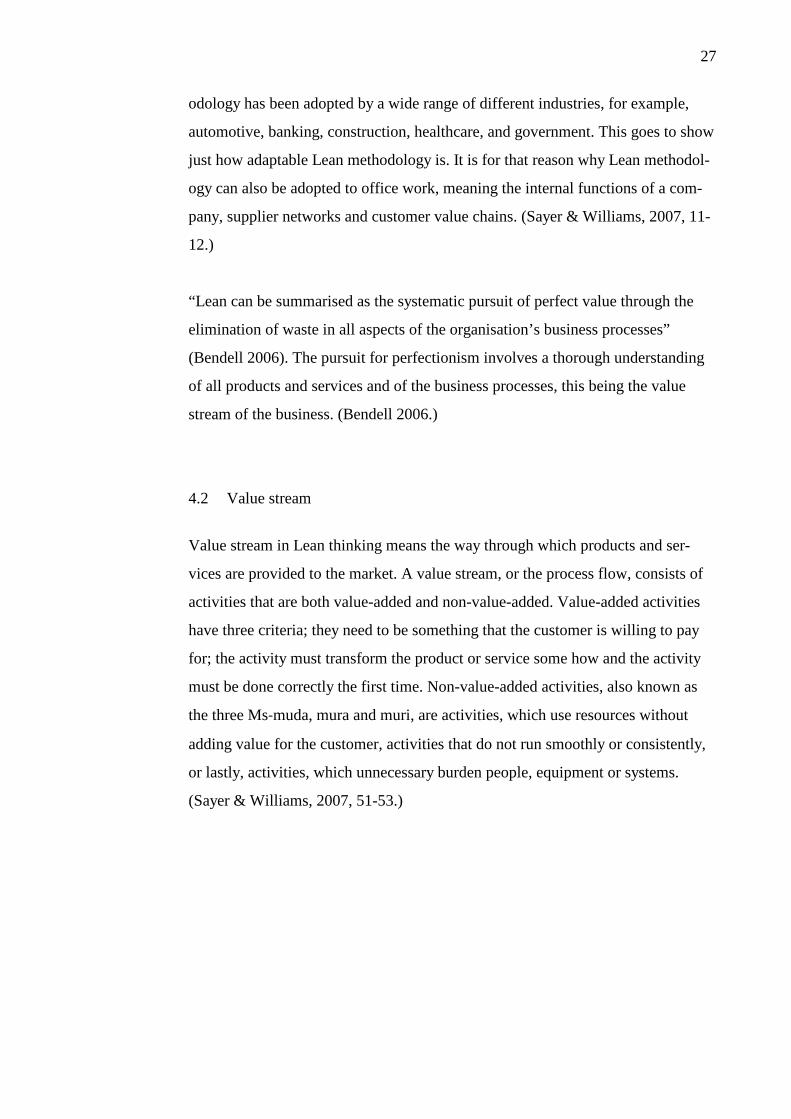
FIGURE 11. Value stream (Moisio, 12/2008. Translated by the author of the the-
sis)
Figure 11 above illustrates the value stream of creating customer value. Informa-
tion flow starts with the needs of the customer, working backwards the production
chain. Material flow, on the other hand, starts with the sales and marketing de-
partment with product planning, working toward the customer at the end of the
value chain. In order to provide real customer value through the value stream, all
departments involved in the customer value creation chain must co-operate with
each other.
4.3 Different kinds of waste
In Lean thinking, waste can be defined as anything that does not add value to a
product or a service from the customer’s point of view. Waste can be tangible or
intangible, both in production and in office environment. In production, waste can
be identified and spotted quite easily, but in office processes it is much more sub-
tle and complex. Waste, in definition, either adds friction or completely blocks the
flow of value. (Venegas, 2007, 9.) There are seven types of waste that first were
identified by Mr. Taiichi Ohno, after he had visited a Ford factory in Detroit re-
peatedly. (Womack, Jones, & Roos, 1990.)
29
Waste can be found everywhere; here are just a few examples of different kinds of
waste in production:
- Using more raw material than necessary; buying, transporting, storing and
disposing of excess raw materials not only costs a lot, but also takes more
time and space.
- Spending more time to produce a product or a service; customers wait un-
necessary long periods of time and energy and facilities are thus used need-
lessly.
- Making mistakes; mistakes slow down the flow of value, as it takes time
and more materials to correct them.
- Having incomplete information or instructions; this results in mistakes,
lost time and missed deadlines.
- Having people work improperly; this is the most wasteful of all. It is a di-
rect waste of time and effort, and will harm the employees’ psyche and
morale. Plus, it can be hazardous.
Adopting Lean is all about trying to avoid these kinds of waste and adding value
to the processes from the customer’s point of view, while having a long-term view
on the process. (Sayer & Williams, 2007, 13-14.)
The seven types of waste in the office environment
The seven types of waste are one of the key points in carrying out a Lean imple-
mentation. In the office environment the seven types of waste are somewhat dif-
ferent. A list of typical office waste is for example;
- unnecessary print-outs
- difficulties with information technology
- multiple checkups of travel bills
- mistakes in invoicing
- high employee turnover
(Moisio, 09/2008.)
30
As there are seven different types of waste found in production, there are seven
types of waste in the office environment as well. These seven types of waste are
presented in the following table 2 with definitions in relation to office surround-
ings. (Sayer & Williams, 2007, 44; Gemba Research, 2007.) The table 2 helps to
identify office waste, which can be quite similar to production waste, but is easily
put aside and forgotten. For example erroneous print-outs are often just disposed
of, when they could be, if nothing more, used again. Reuse would then again,
minimize paper waste.
31
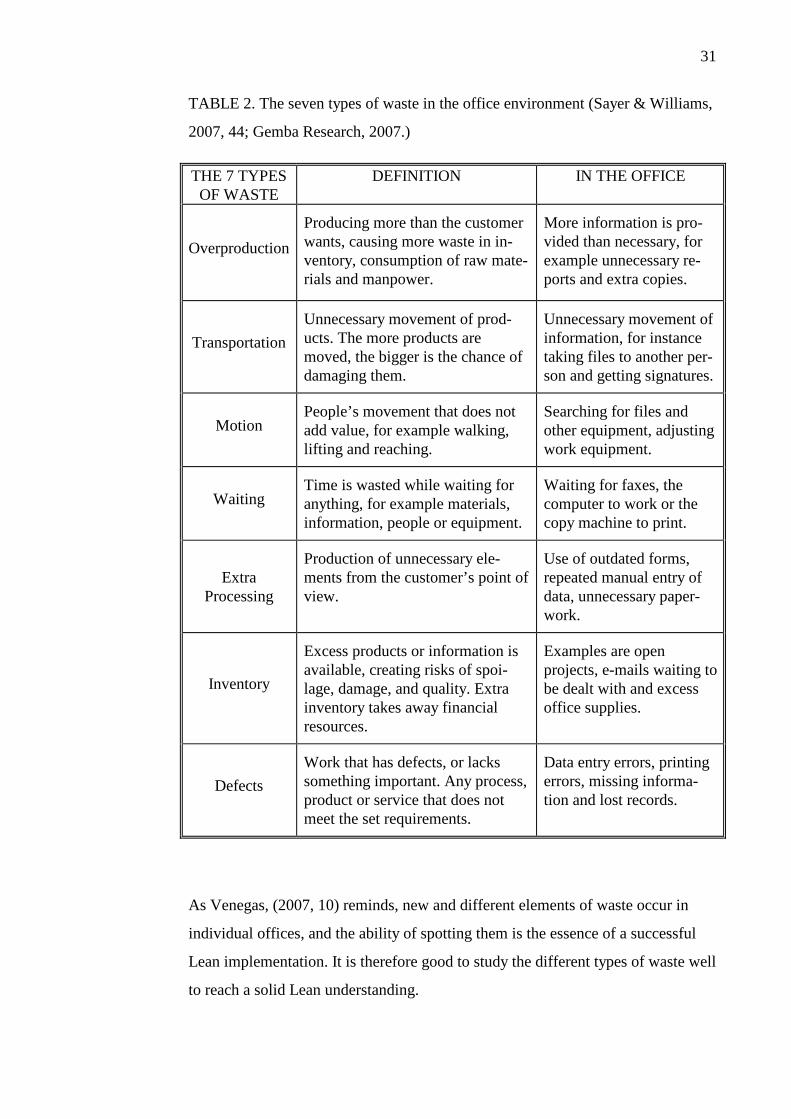
TABLE 2. The seven types of waste in the office environment (Sayer & Williams,
2007, 44; Gemba Research, 2007.)
As Venegas, (2007, 10) reminds, new and different elements of waste occur in
individual offices, and the ability of spotting them is the essence of a successful
Lean implementation. It is therefore good to study the different types of waste well
to reach a solid Lean understanding.
THE 7 TYPES OF WASTE
DEFINITION IN THE OFFICE
Overproduction
Producing more than the customer wants, causing more waste in in-ventory, consumption of raw mate-rials and manpower.
More information is pro-vided than necessary, for example unnecessary re-ports and extra copies.
Transportation
Unnecessary movement of prod-ucts. The more products are moved, the bigger is the chance of damaging them.
Unnecessary movement of information, for instance taking files to another per-son and getting signatures.
Motion People’s movement that does not add value, for example walking, lifting and reaching.
Searching for files and other equipment, adjusting work equipment.
Waiting Time is wasted while waiting for anything, for example materials, information, people or equipment.
Waiting for faxes, the computer to work or the copy machine to print.
Extra Processing
Production of unnecessary ele-ments from the customer’s point of view.
Use of outdated forms, repeated manual entry of data, unnecessary paper-work.
Inventory
Excess products or information is available, creating risks of spoi-lage, damage, and quality. Extra inventory takes away financial resources.
Examples are open projects, e-mails waiting to be dealt with and excess office supplies.
Defects
Work that has defects, or lacks something important. Any process, product or service that does not meet the set requirements.
Data entry errors, printing errors, missing informa-tion and lost records.
32
Table 2 above gives an overlook of how the traditional manufacturing wastes can
be adapted to the office surroundings. There are, however, different ways of por-
traying these wastes and one of these ways has been presented by Mr Carlos Ve-
negas (2007). In the following, a different style of allocation of the seven types of
waste is presented by examining the four most common types of office waste; in-
formation waste, process waste, physical environment waste and people waste.
The same allocation of different types of wastes has also been presented by Mr.
Moisio. (Moisio, 09/2008.)
“Information is to office and management functions what raw material is to manu-
facturing” (Venegas 2007, 11). When information is poorly managed, it results in
erosion and obstructions in the flow of value, also known as information waste.
Information waste includes different types of sub wastes, of which the four most
common are presented below:
- Incompatible information systems: occurs when two or more systems are
used in the same process, but cannot share data. This type of waste causes
mistakes and takes up valuable time when data is transformed to another
form.
- Manual check-ups of electronic data: manual checking defeats the purpose
of automation and paperless office and could be regarded as a case of ef-
fort redundancy.
(Venegas, 2007, 12-13.)
These types of information waste could be avoided by taking an advantage of a
single comprehensive database, an ERP system. Examples of such systems are the
Visma products. (Visma Software, 2009.)
Venegas, 2007, also speaks about process waste, physical environment waste and
people waste. Process waste comprises all of the seven main types of waste, but
has been adjusted to better suit different business environments. Elements, such as
33
checking, approvals and incomplete data are examples of such additions to the
traditional “seven types of waste” list. (Venegas, 2007, 21.)
Process waste can also be described as strategic waste, i.e. when processes are not
focused on the customer value. Process waste includes not only inspections and
rework of different documents but also corrections of unpredictable process out-
comes. (Moisio, 09/2008.)
Physical environment waste is divided into two sub categories. The first one com-
prises waste related to safety, and the other one relates to the movement of people
or objects. These types of waste can be eliminated by taking care of, for instance,
proper ventilation, sufficient lighting and suitable office furniture in the office
environment. (Venegas, 2007, 29-30.)
People waste i.e. inefficiencies in how people work, can be divided into several
smaller kinds of waste, for example, lack of training, multitasking and work inter-
ruptions. People waste can prove costly to the business, because human capital is
the most important asset of any business. (Venegas, 2007, 31.)
Moreover, people waste, also known as human energy waste, can be seen as own-
ership and control waste. This type of waste occurs when people need to wait for
approvals, there is no clear ownership of different issues and when people are
working on unnecessary or inappropriate tasks. (Moisio, 09/2008.)
4.4 The key Lean concepts in the office environment
When bringing Lean methodology into the office environment, the differences of
the operational settings have to be cared for. For in the office circumstances, the
concepts of value and waste are hidden in intangible processes. (Venegas, 2007,
9.) Lean in the service environment can help in, for instance, reducing time spent
performing business activities, increasing customer satisfaction by improving the
timeliness and quality of deliverables and reducing the total cost of doing business
34
by eliminating wasted time and effort. In the office setting, where service busi-
nesses are more labour intensive, the respect for people in the value chain is ever
more important. (Sayer & Williams, 2007, 301-304.)
Improving service processes with Lean methodology can be executed in many
ways. The 5 Ss method, continuous flow, Jidoka (mistake proofing) and having
standard operations are just a few examples of making a difference. (Venegas,
2007, 39.) In the following the four methods are examined in more detail.
4.4.1 The 5 Ss
In services 5 Ss means Sort, Straighten, Scrub, Systematize and Standardize. The
aim of this method is to clear up the clutter and create an organized workplace that
has a smooth value chain. This method is recommended as the first step in imple-
menting Lean methodology as it clarifies the task at hand, making it easier to im-
plement further improvements. (Venegas, 2007, 40.)
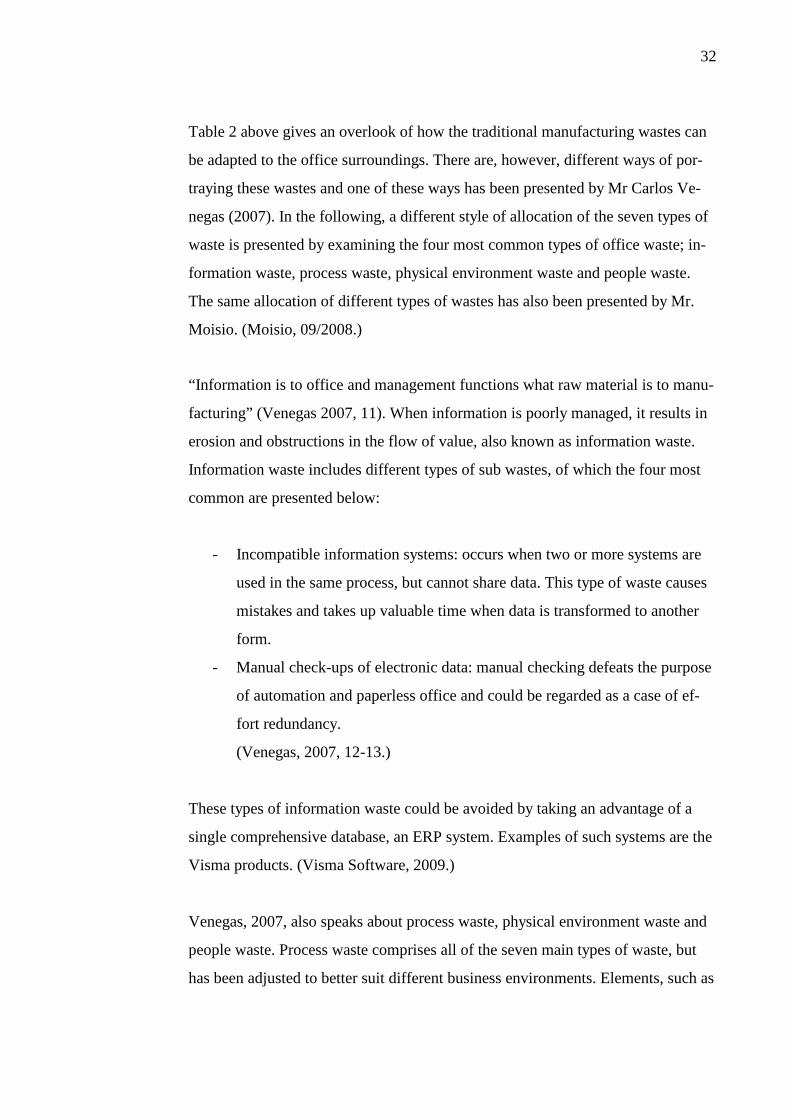
TABLE 3. The 5 Ss in the office (Venegas, 2007, 40.)
ACTIVITY DESCRIPTION
Sort Identify and separate elements required for the task
Simplify Simplify the process and workspace
Sweep Remove unnecessary items
Standardize Document the process
Sustain Maintain the changes
As presented in table 3, the 5 Ss method has five phases to clear up the workspace.
The first phase Sort in practise means the separating of the necessary from the
unnecessary elements within the process. In the end of sorting, there ought to be
only the essentials and imperatives left to complete the job. (Venegas, 2007, 41.)
35
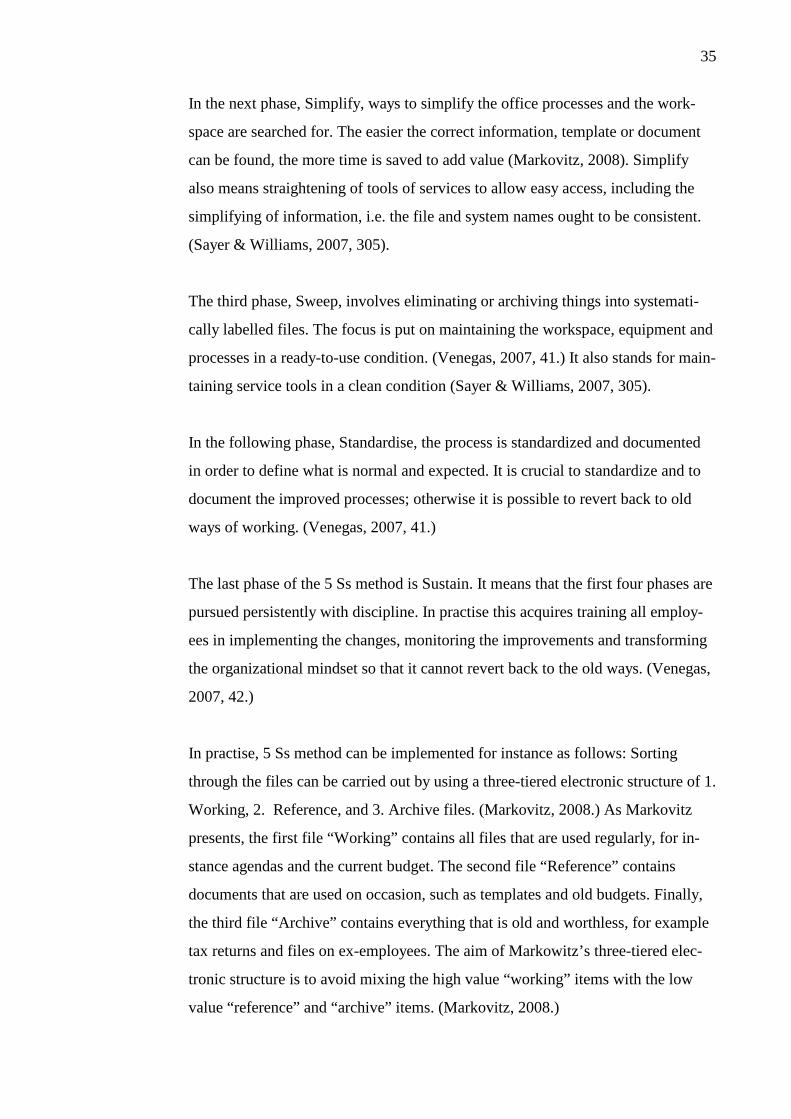
In the next phase, Simplify, ways to simplify the office processes and the work-
space are searched for. The easier the correct information, template or document
can be found, the more time is saved to add value (Markovitz, 2008). Simplify
also means straightening of tools of services to allow easy access, including the
simplifying of information, i.e. the file and system names ought to be consistent.
(Sayer & Williams, 2007, 305).
The third phase, Sweep, involves eliminating or archiving things into systemati-
cally labelled files. The focus is put on maintaining the workspace, equipment and
processes in a ready-to-use condition. (Venegas, 2007, 41.) It also stands for main-
taining service tools in a clean condition (Sayer & Williams, 2007, 305).
In the following phase, Standardise, the process is standardized and documented
in order to define what is normal and expected. It is crucial to standardize and to
document the improved processes; otherwise it is possible to revert back to old
ways of working. (Venegas, 2007, 41.)
The last phase of the 5 Ss method is Sustain. It means that the first four phases are
pursued persistently with discipline. In practise this acquires training all employ-
ees in implementing the changes, monitoring the improvements and transforming
the organizational mindset so that it cannot revert back to the old ways. (Venegas,
2007, 42.)
In practise, 5 Ss method can be implemented for instance as follows: Sorting
through the files can be carried out by using a three-tiered electronic structure of 1.
Working, 2. Reference, and 3. Archive files. (Markovitz, 2008.) As Markovitz
presents, the first file “Working” contains all files that are used regularly, for in-
stance agendas and the current budget. The second file “Reference” contains
documents that are used on occasion, such as templates and old budgets. Finally,
the third file “Archive” contains everything that is old and worthless, for example
tax returns and files on ex-employees. The aim of Markowitz’s three-tiered elec-
tronic structure is to avoid mixing the high value “working” items with the low
value “reference” and “archive” items. (Markovitz, 2008.)
36
4.4.2 Continuous flow
Continuous flow or Single-Piece-Flow method is the situation where a product or
a service progresses through the value stream without any interruption (Venegas,
2007, 43). It can also be defined as carrying out one-piece-at-a-time process,
which aims at eliminating stagnation of work between each process steps.
(Moisio, 12/2008.)
In the office environment this means completing each process accurately and
without interruptions, which can be a real challenge. This because interruption is
an inherent part of office work. Phone calls, e-mails and other employees con-
stantly interrupt the work at hand. (Venegas, 2007, 43-44.) Some of the interrup-
tions cannot be changed or eliminated, but striving for continuous flow can still be
beneficial. A good practical example of eliminating interruptions in the office is to
set a specific time for answering e-mail and phone calls. (Venegas, 2007, 44.)
In order to establish successful continuous flow, effective communication and co-
operation between processes and departments are needed. This can be enabled by
highlighting the symbiotic aspect of the relationship between different depart-
ments. (Venegas, 2007, 45.) After all, the different departments depend on each
other.
4.4.3 Jidoka
Jidoka by definition means the transference of human intelligence to machines by
using automation. The automation makes sure that defects are detected by stop-
ping the machine in order for someone to come and fix the problem. By detecting
the mistakes when they happen, the quality of the product in the value stream can
be better guaranteed. (Sayer & Williams, 2007, 339.)
37
Jidoka means built-in quality at the source, and it can be used with techniques
such as mistake proofing (poka-yoke) and just-in-time (Sayer & Williams, 2007,
37). Jidoka is not used purely for correcting mistakes, for it is more useful when it
is used for tracing and eliminating the root cause of the mistake. This method will
add valuable time, cut costs and improve overall productivity of the process. (Ve-
negas, 2007, 45).
In the office environment, Jidoka and its techniques are particularly useful, be-
cause of the high attention required in performing repetitive tasks. A good way of
using Jidoka in these kinds of tasks is to make use of web documents, which do
not allow the user to continue if the fields of the document are left blank or are
filled in with unexpected data. (Venegas, 2007, 45.)
4.5 Lean leadership
In order to implement Lean management in an organization, it is crucial that all
executives develop a thorough understanding of the Lean management system.
This because most executives are more interested in micro-evolutionary depart-
ment-specific improvements, rather than revolutionary improvement across the
company and Lean methodology can therefore seem too challenging. (Emiliani,
2007, 25 & 41-45.)
38
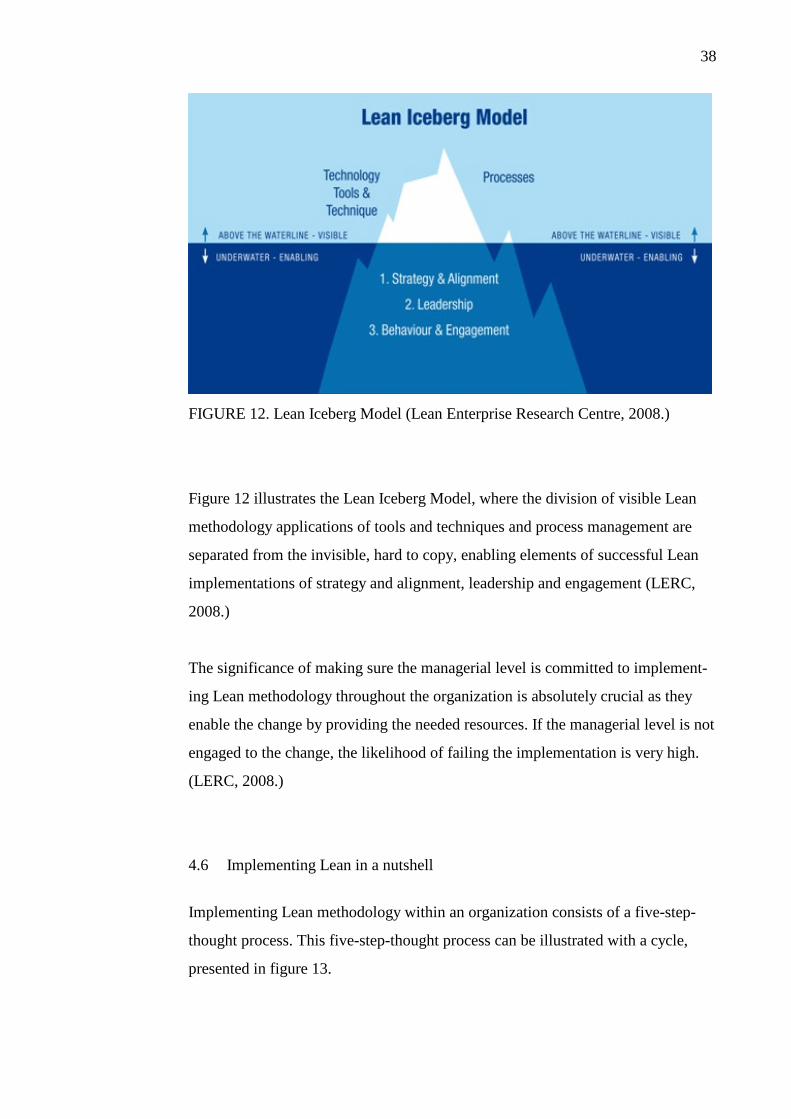
FIGURE 12. Lean Iceberg Model (Lean Enterprise Research Centre, 2008.)
Figure 12 illustrates the Lean Iceberg Model, where the division of visible Lean
methodology applications of tools and techniques and process management are
separated from the invisible, hard to copy, enabling elements of successful Lean
implementations of strategy and alignment, leadership and engagement (LERC,
2008.)
The significance of making sure the managerial level is committed to implement-
ing Lean methodology throughout the organization is absolutely crucial as they
enable the change by providing the needed resources. If the managerial level is not
engaged to the change, the likelihood of failing the implementation is very high.
(LERC, 2008.)
4.6 Implementing Lean in a nutshell
Implementing Lean methodology within an organization consists of a five-step-
thought process. This five-step-thought process can be illustrated with a cycle,
presented in figure 13.
39
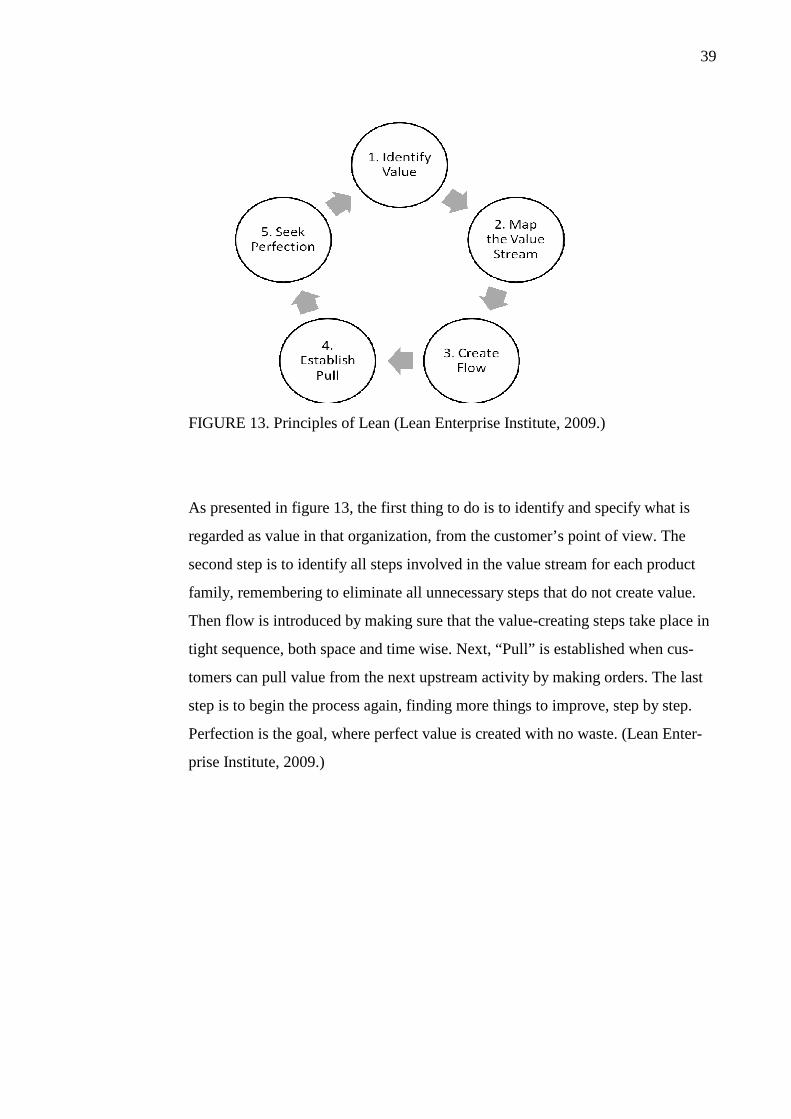
FIGURE 13. Principles of Lean (Lean Enterprise Institute, 2009.)
As presented in figure 13, the first thing to do is to identify and specify what is
regarded as value in that organization, from the customer’s point of view. The
second step is to identify all steps involved in the value stream for each product
family, remembering to eliminate all unnecessary steps that do not create value.
Then flow is introduced by making sure that the value-creating steps take place in
tight sequence, both space and time wise. Next, “Pull” is established when cus-
tomers can pull value from the next upstream activity by making orders. The last
step is to begin the process again, finding more things to improve, step by step.
Perfection is the goal, where perfect value is created with no waste. (Lean Enter-
prise Institute, 2009.)
40
5 PRESENT STATE MAPPING OF THE ORDER-DELIVERY PROCESS AT STARTEX OY
5.1 Startex Oy overview
Startex Oy is an international company providing high quality ski waxes and roller
skis for all skiers from beginners to the world cup winners. The company, in op-
eration since 1981, is well-known for its active development and innovative ski
wax solutions. (Startex Oy, 2006.)
This mostly family-owned company, located in Hollola, Finland, has experienced
continuous success due to its many strategic business decisions, innovative prod-
uct developments and co-operations with different stakeholders. As the company
specializes in producing and selling of various ski waxes and other similar prod-
ucts, it has chosen to compete with high quality, rather than competitive pricing
and it relies on its customer loyalty. (Salmi, H. 2009.)
The most valuable asset of Startex Oy is the START-brand. START-brand is
highly valued in the market and has been chosen as the most appreciated winter
sports brand by Taloustutkimus, Sport, years 2003-2007. (Salmi, 2009.)
The organizational chart of the case company, in appendix 2, shows how respon-
sibility is divided in the company. The product development and research, for ex-
ample, is the responsibility of the Chief Executive Officer, upper level Production
Manager and Export Manager although these persons are also responsible for oth-
er aspects as well. (Salmi, 2009.)
41
5.2 An ERP system at Startex Oy
Startex Oy is currently applying an enterprise resource planning system, called
Visma L7, in their business operations. This programme has been in use for one
and a half years now, and it has been seen as a very good and valuable asset. At
present, Startex Oy has combined its financial administration, procurement, ac-
counting, storage administration and production planning into this one ERP sys-
tem. (Salmi, 2009.)
The system provides assistance in several different business operation fields, for
example, payroll and quality control functions are still available in the system.
Visma L7 also provides a helpdesk-service over the phone. (Visma Software Oyj
2008; Visma L7 brochure.)
5.3 The most important processes at Startex Oy
The most important processes in Startex Oy are the production process of both
regular and specialized products, order-delivery process and project processes, for
example campaign projects, which are all taken into consideration in Visma L7’s
functions. However, when the processes are examined more thoroughly, room for
improvement can be noticed. The functionality of these core processes have a di-
rect impact on the profit ratio of the company and must be well taken care of to
guarantee success in the future too. (Salmi, 2009.)
The order-delivery process has not been modelled before in the case company, but
the estimated time of processing an average size order ready for delivery is some
30 minutes, depending on the size of the delivery. Larger shipments naturally take
more time, and if there are not enough products in the stock, the process can take
more than one day to go through. (Salmi, 2009.)
42
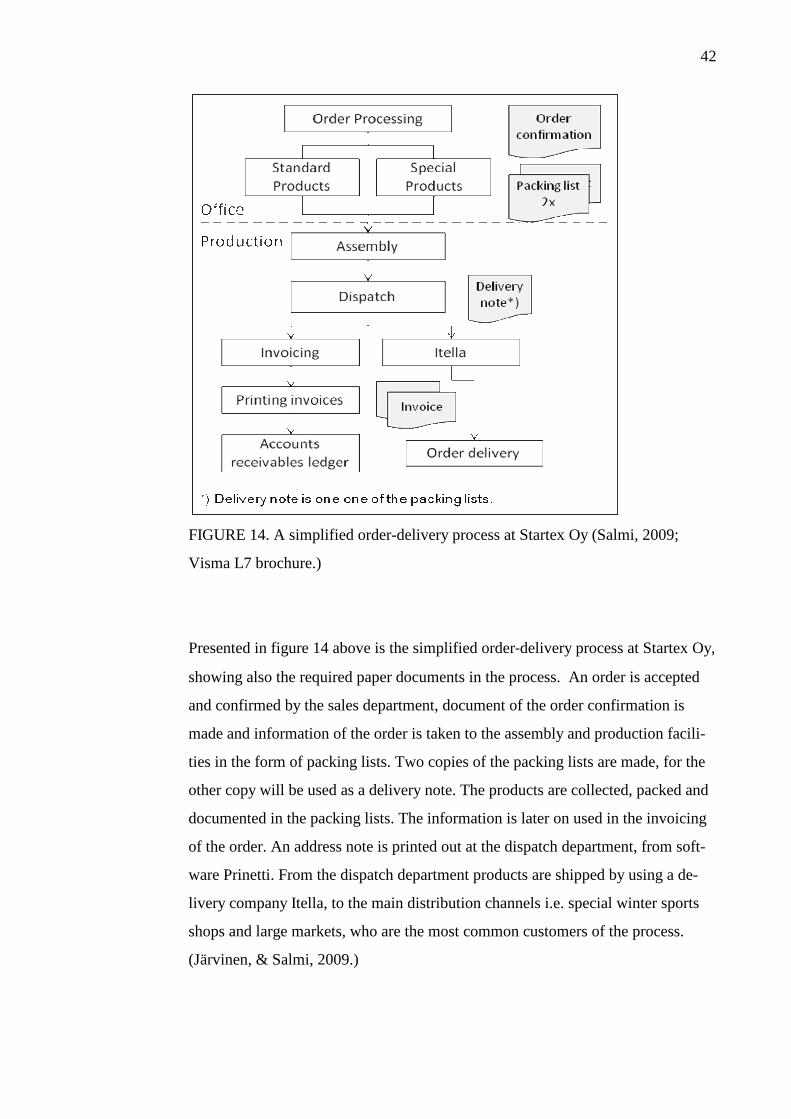
FIGURE 14. A simplified order-delivery process at Startex Oy (Salmi, 2009;
Visma L7 brochure.)
Presented in figure 14 above is the simplified order-delivery process at Startex Oy,
showing also the required paper documents in the process. An order is accepted
and confirmed by the sales department, document of the order confirmation is
made and information of the order is taken to the assembly and production facili-
ties in the form of packing lists. Two copies of the packing lists are made, for the
other copy will be used as a delivery note. The products are collected, packed and
documented in the packing lists. The information is later on used in the invoicing
of the order. An address note is printed out at the dispatch department, from soft-
ware Prinetti. From the dispatch department products are shipped by using a de-
livery company Itella, to the main distribution channels i.e. special winter sports
shops and large markets, who are the most common customers of the process.
(Järvinen, & Salmi, 2009.)
43
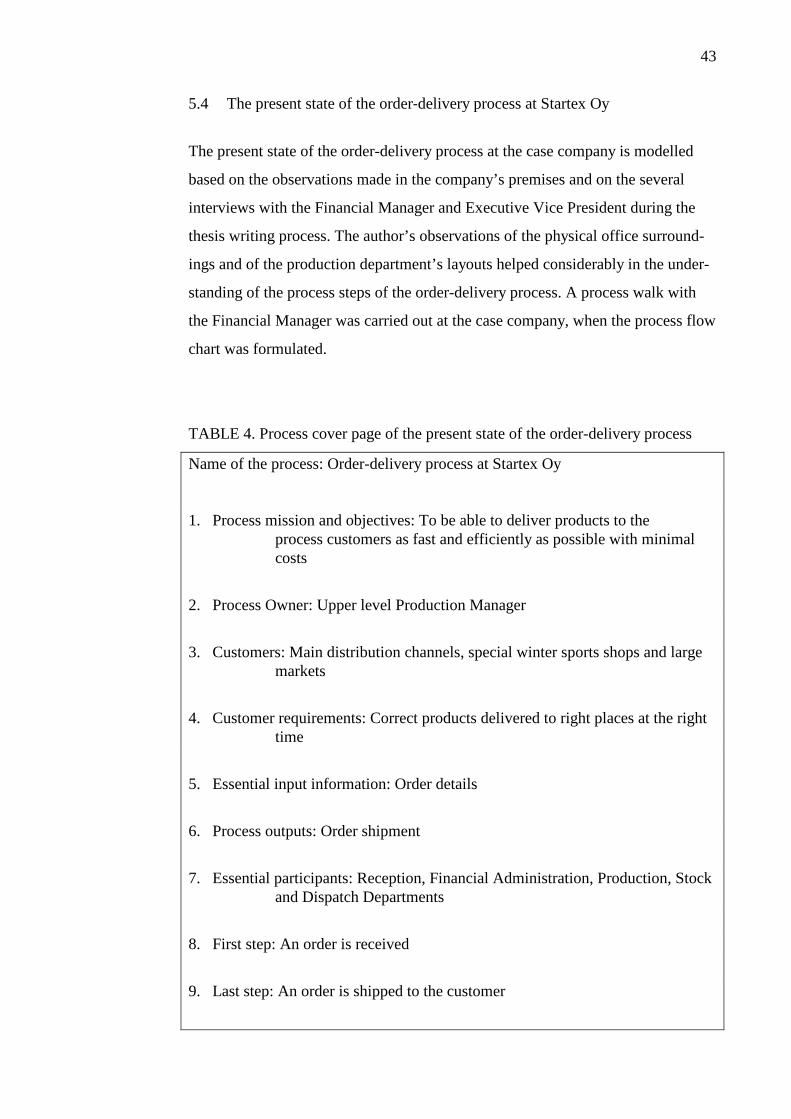
5.4 The present state of the order-delivery process at Startex Oy
The present state of the order-delivery process at the case company is modelled
based on the observations made in the company’s premises and on the several
interviews with the Financial Manager and Executive Vice President during the
thesis writing process. The author’s observations of the physical office surround-
ings and of the production department’s layouts helped considerably in the under-
standing of the process steps of the order-delivery process. A process walk with
the Financial Manager was carried out at the case company, when the process flow
chart was formulated.
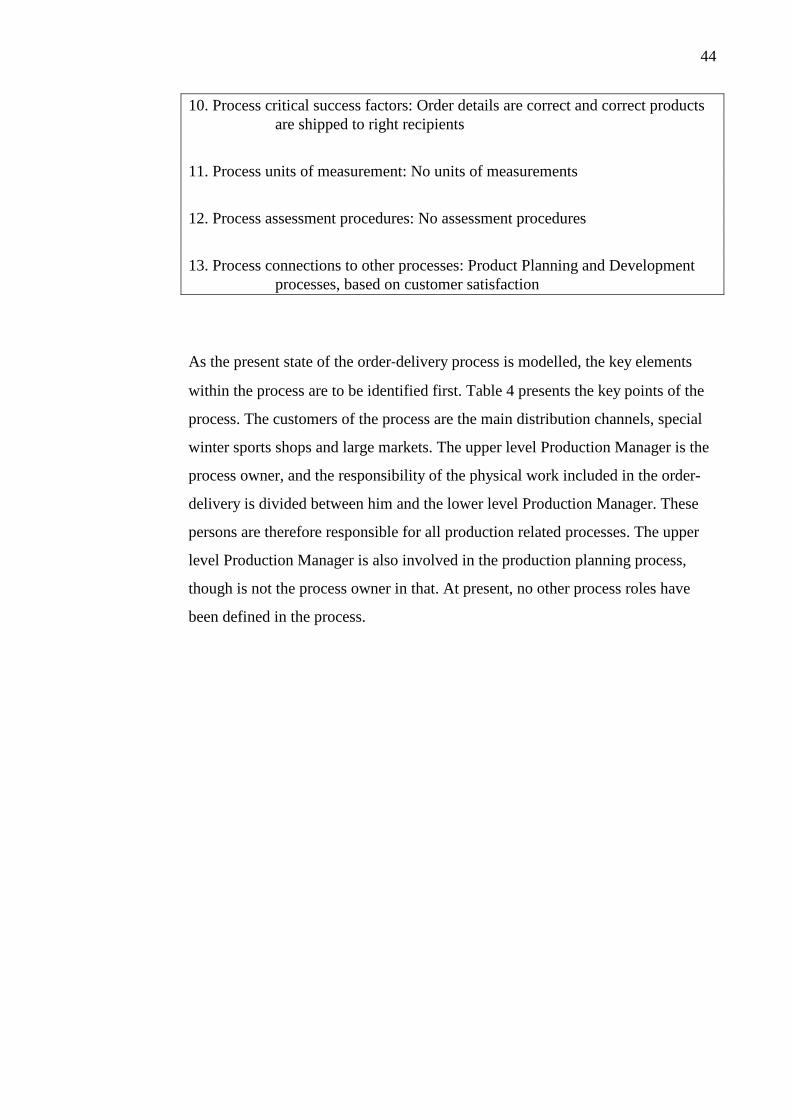
TABLE 4. Process cover page of the present state of the order-delivery process
Name of the process: Order-delivery process at Startex Oy
1. Process mission and objectives: To be able to deliver products to the process customers as fast and efficiently as possible with minimal costs
2. Process Owner: Upper level Production Manager
3. Customers: Main distribution channels, special winter sports shops and large markets
4. Customer requirements: Correct products delivered to right places at the right time
5. Essential input information: Order details
6. Process outputs: Order shipment
7. Essential participants: Reception, Financial Administration, Production, Stock and Dispatch Departments
8. First step: An order is received
9. Last step: An order is shipped to the customer
44
10. Process critical success factors: Order details are correct and correct products are shipped to right recipients
11. Process units of measurement: No units of measurements
12. Process assessment procedures: No assessment procedures
13. Process connections to other processes: Product Planning and Development processes, based on customer satisfaction
As the present state of the order-delivery process is modelled, the key elements
within the process are to be identified first. Table 4 presents the key points of the
process. The customers of the process are the main distribution channels, special
winter sports shops and large markets. The upper level Production Manager is the
process owner, and the responsibility of the physical work included in the order-
delivery is divided between him and the lower level Production Manager. These
persons are therefore responsible for all production related processes. The upper
level Production Manager is also involved in the production planning process,
though is not the process owner in that. At present, no other process roles have
been defined in the process.
45
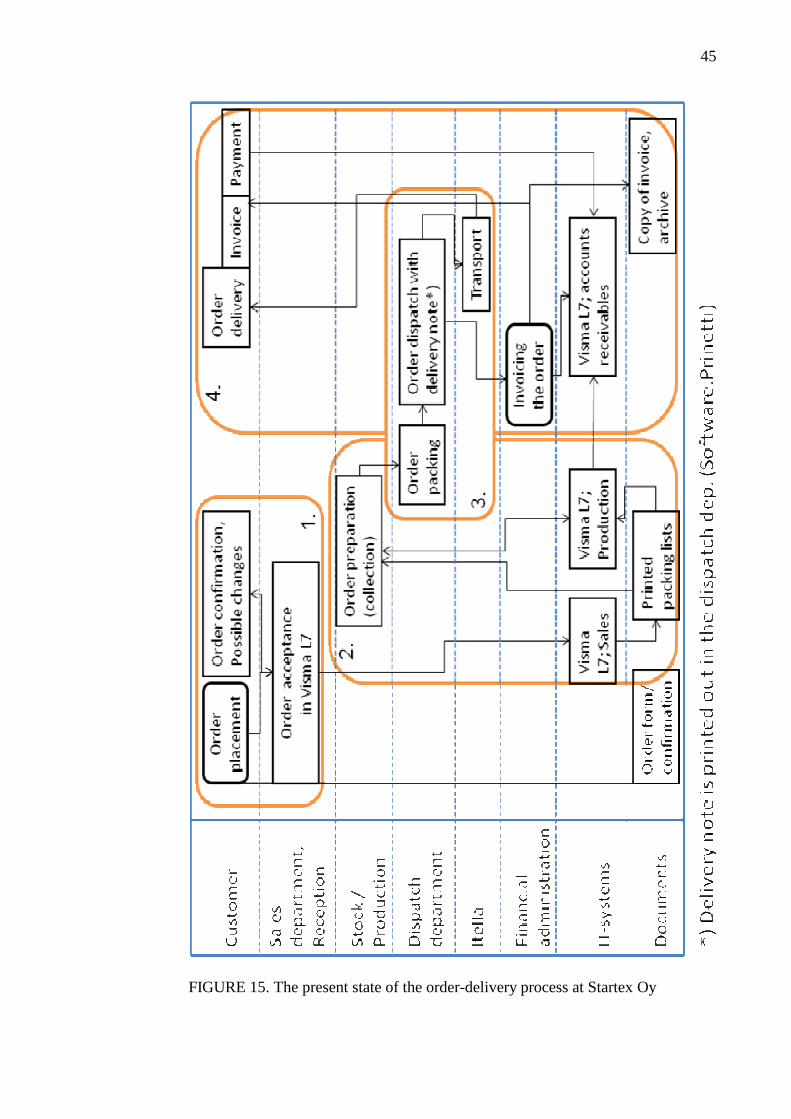
FIGURE 15. The present state of the order-delivery process at Startex Oy
46
The order-delivery process can be divided into four main parts; order acceptance,
order preparation, order dispatch and order invoicing, see figure 15; four num-
bered, rounded rectangles in orange. Order acceptance is completed in the office,
and this sub process has two tasks in it. The order placement by the customer has
to be accepted and checked to make sure no mistakes are made and then the order
details are entered into the ERP system, from where the packing lists can be
printed out and taken to the stock and production departments. The packing list
can also be seen from the computer in the stock and dispatch departments, where
the employees have a limited access to the ERP system. The packing list states
details of the shipment, for example the gross and net weight, volume and con-
tents of each parcel. Two copies of the packing list are printed out; one copy
works as a delivery note, which is included in the shipment and the other one stays
in, and the customer is invoiced based on that remaining packing list.
The next phase in the process is order preparation, which includes order collection
and product packing. Based on the packing list, specific products are collected
from the stock. If there are no available products, they must first be produced by
the production department’s employees, who also have access to the packing list.
Completed products are entered into the ERP system. Once collected, the products
are packed to plastic protective materials and then fitted in a cardboard box. The
box is then sealed. After that an address note, printed out from Prinetti, software
provided by Itella, which assists in printing out address cards, is attached to each
parcel.
Next, in the third part of the process, the order is dispatched. The cardboard boxes
are moved to the dispatch department with the copy of the packing list and the
lower level Production Manager is responsible to check that correct products are
dispatched.
As the last part of the order-delivery process, the order is invoiced. According to
the packing list, after the order has been shipped, the order dispatch is entered to
the ERP system. Then Financial Administration compiles the invoice. The com-
47
pleted invoice is then sent to the buyer, who then makes the payment, after which
the Financial Administration checks the payment in the accounts receivables as
received. Itella also sends a monthly invoice to the case company for providing the
transportation service, according to the number of shipments made with the com-
pany’s customer number.
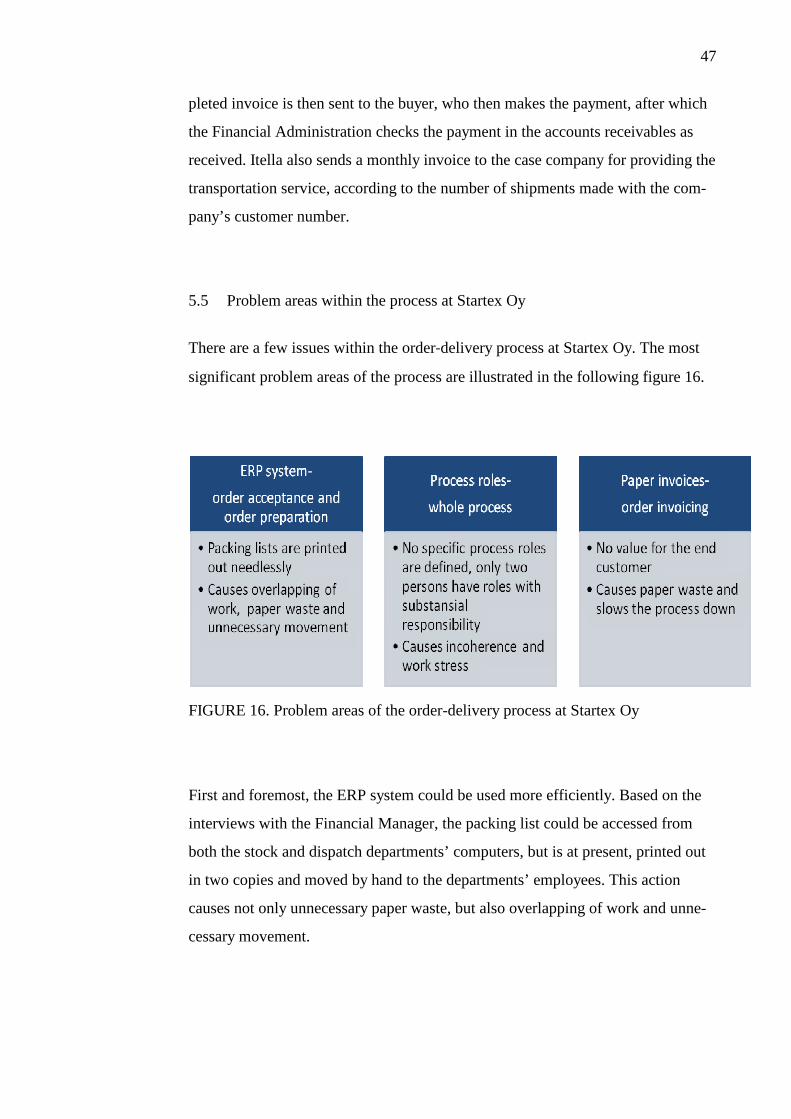
5.5 Problem areas within the process at Startex Oy
There are a few issues within the order-delivery process at Startex Oy. The most
significant problem areas of the process are illustrated in the following figure 16.
FIGURE 16. Problem areas of the order-delivery process at Startex Oy
First and foremost, the ERP system could be used more efficiently. Based on the
interviews with the Financial Manager, the packing list could be accessed from
both the stock and dispatch departments’ computers, but is at present, printed out
in two copies and moved by hand to the departments’ employees. This action
causes not only unnecessary paper waste, but also overlapping of work and unne-
cessary movement.
48
The reason for using the paper version of the packing list is that it is regarded as a
more convenient way of dealing with the matter. This reasoning might be because
the use of the ERP system is seen as a more complicated way of dealing with the
simple task. By training the work staff involved with the ERP system, the use of it
could increase, thus improving the processes incorporated in the ERP system.
Another problem area visible in the order-delivery process is the lack of specified
process owners in it. At the moment, the responsibility of the order-delivery
process is divided between the upper level Production Manager and the lower lev-
el Production Manager. The amount of responsibility on just two employees seems
to be substantial. This uneven distribution of responsibility can cause problems of
two kinds.
On the short-term, problems can arise when one of the Production Managers is on
a sick leave or unable for other reasons to be present at the work site. On the long-
term, problems will come when the upper level Production Manager retires and
someone else has to take up the responsibilities. Not only will it take a lot of time
to train a new employee, the new person might not be able to take up the work
tasks the same way as the former employee, therefore causing smaller issues with-
in the process. For example, mistakes, overlapping and rework of different tasks
can come up.
One more problem area in the order-delivery process is the use of paper invoices.
Electronic invoices not only save paper, but also speed up the invoice process.
Invoices are now sent afterwards separately to the buyers. If e-invoices were im-
plemented with the help of the currently used ERP system, the invoice process
would get faster and the sellers would be able to make the payments with more
ease.
49
6 IMPROVEMENT SUGGESTIONS TO THE ORDER-DELIVERY PROCESS AT STARTEX OY
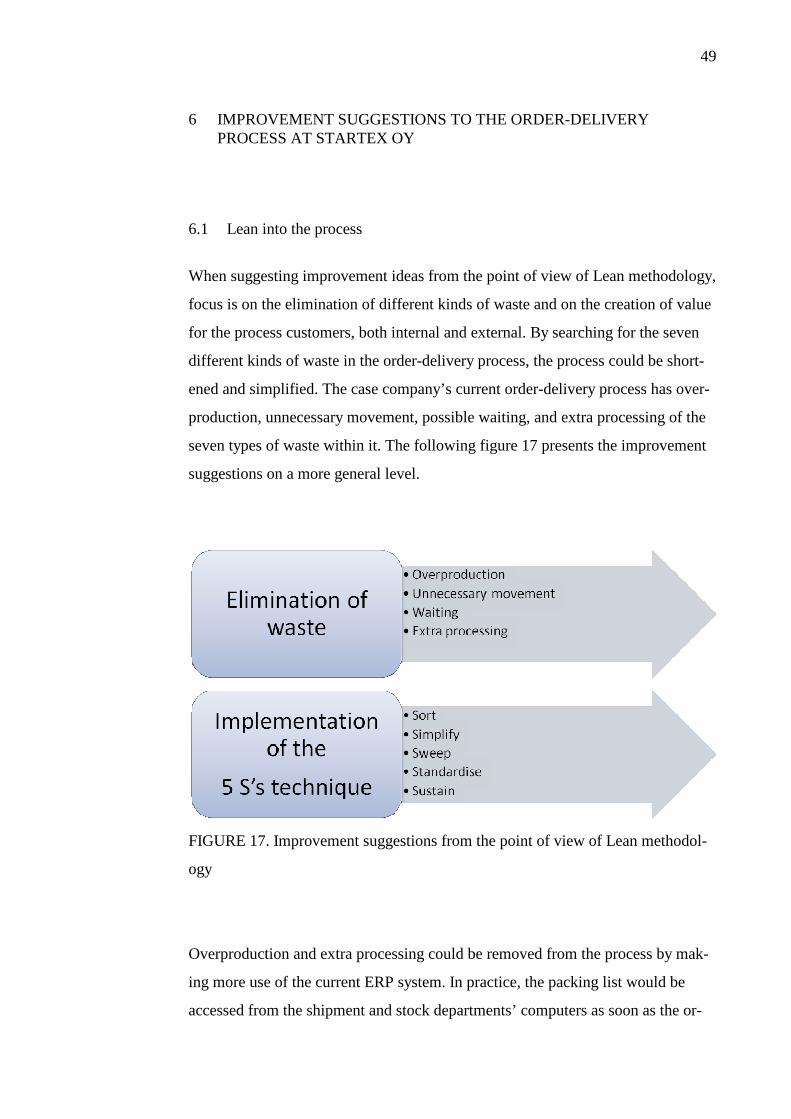
6.1 Lean into the process
When suggesting improvement ideas from the point of view of Lean methodology,
focus is on the elimination of different kinds of waste and on the creation of value
for the process customers, both internal and external. By searching for the seven
different kinds of waste in the order-delivery process, the process could be short-
ened and simplified. The case company’s current order-delivery process has over-
production, unnecessary movement, possible waiting, and extra processing of the
seven types of waste within it. The following figure 17 presents the improvement
suggestions on a more general level.
FIGURE 17. Improvement suggestions from the point of view of Lean methodol-
ogy
Overproduction and extra processing could be removed from the process by mak-
ing more use of the current ERP system. In practice, the packing list would be
accessed from the shipment and stock departments’ computers as soon as the or-
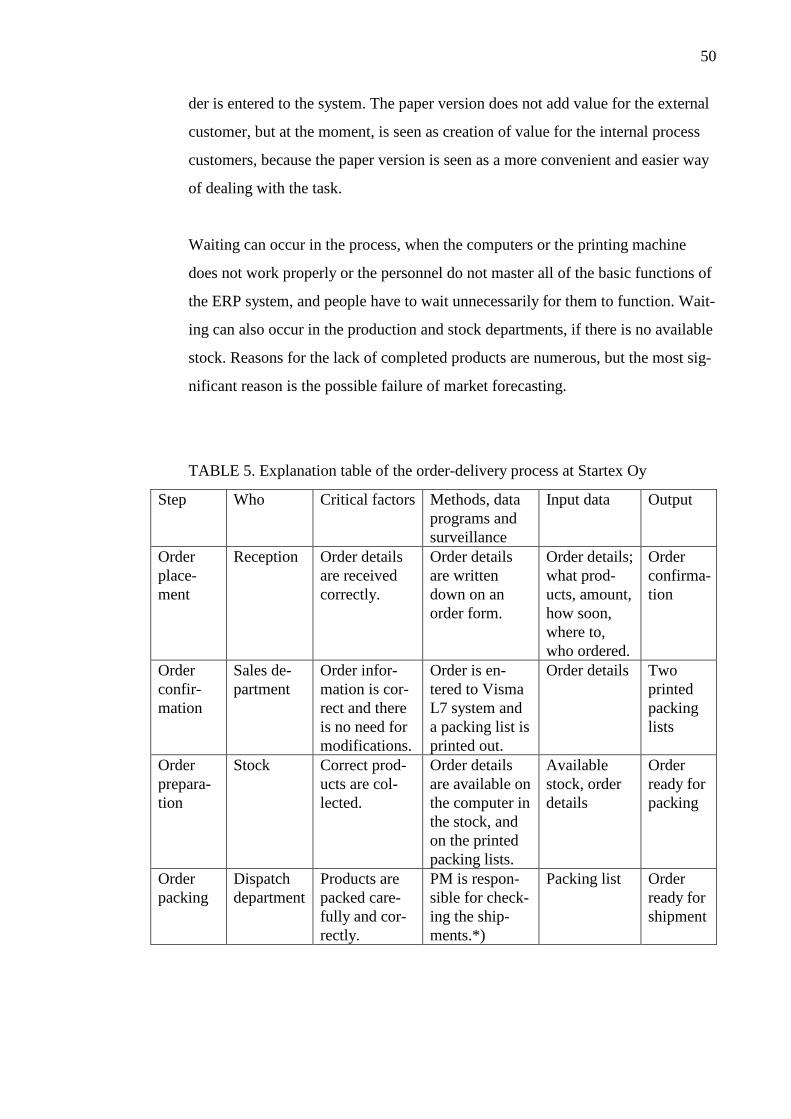
50
der is entered to the system. The paper version does not add value for the external
customer, but at the moment, is seen as creation of value for the internal process
customers, because the paper version is seen as a more convenient and easier way
of dealing with the task.
Waiting can occur in the process, when the computers or the printing machine
does not work properly or the personnel do not master all of the basic functions of
the ERP system, and people have to wait unnecessarily for them to function. Wait-
ing can also occur in the production and stock departments, if there is no available
stock. Reasons for the lack of completed products are numerous, but the most sig-
nificant reason is the possible failure of market forecasting.
TABLE 5. Explanation table of the order-delivery process at Startex Oy
Step Who Critical factors Methods, data programs and surveillance
Input data Output
Order place-ment
Reception Order details are received correctly.
Order details are written down on an order form.
Order details; what prod-ucts, amount, how soon, where to, who ordered.
Order confirma-tion
Order confir-mation
Sales de-partment
Order infor-mation is cor-rect and there is no need for modifications.
Order is en-tered to Visma L7 system and a packing list is printed out.
Order details Two printed packing lists
Order prepara-tion
Stock Correct prod-ucts are col-lected.
Order details are available on the computer in the stock, and on the printed packing lists.
Available stock, order details
Order ready for packing
Order packing
Dispatch department
Products are packed care-fully and cor-rectly.
PM is respon-sible for check-ing the ship-ments.*)
Packing list Order ready for shipment
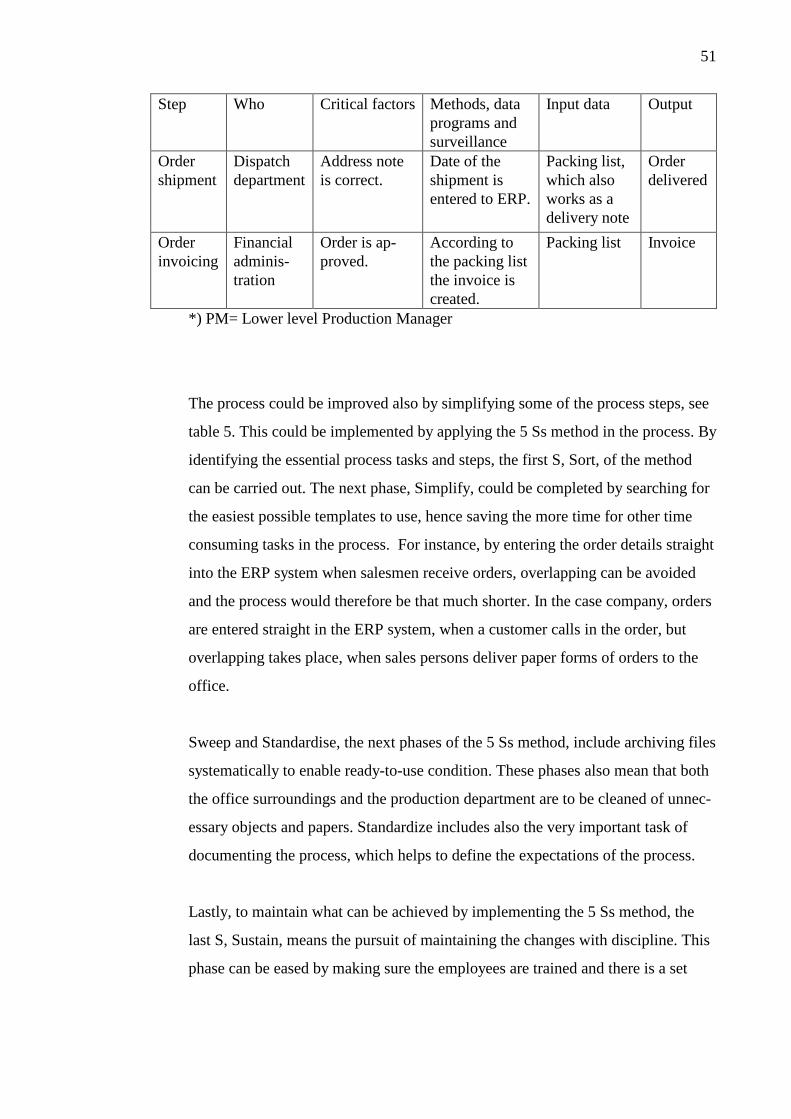
51
Step Who Critical factors Methods, data programs and surveillance
Input data Output
Order shipment
Dispatch department
Address note is correct.
Date of the shipment is entered to ERP.
Packing list, which also works as a delivery note
Order delivered
Order invoicing
Financial adminis-tration
Order is ap-proved.
According to the packing list the invoice is created.
Packing list Invoice
*) PM= Lower level Production Manager
The process could be improved also by simplifying some of the process steps, see
table 5. This could be implemented by applying the 5 Ss method in the process. By
identifying the essential process tasks and steps, the first S, Sort, of the method
can be carried out. The next phase, Simplify, could be completed by searching for
the easiest possible templates to use, hence saving the more time for other time
consuming tasks in the process. For instance, by entering the order details straight
into the ERP system when salesmen receive orders, overlapping can be avoided
and the process would therefore be that much shorter. In the case company, orders
are entered straight in the ERP system, when a customer calls in the order, but
overlapping takes place, when sales persons deliver paper forms of orders to the
office.
Sweep and Standardise, the next phases of the 5 Ss method, include archiving files
systematically to enable ready-to-use condition. These phases also mean that both
the office surroundings and the production department are to be cleaned of unnec-
essary objects and papers. Standardize includes also the very important task of
documenting the process, which helps to define the expectations of the process.
Lastly, to maintain what can be achieved by implementing the 5 Ss method, the
last S, Sustain, means the pursuit of maintaining the changes with discipline. This
phase can be eased by making sure the employees are trained and there is a set
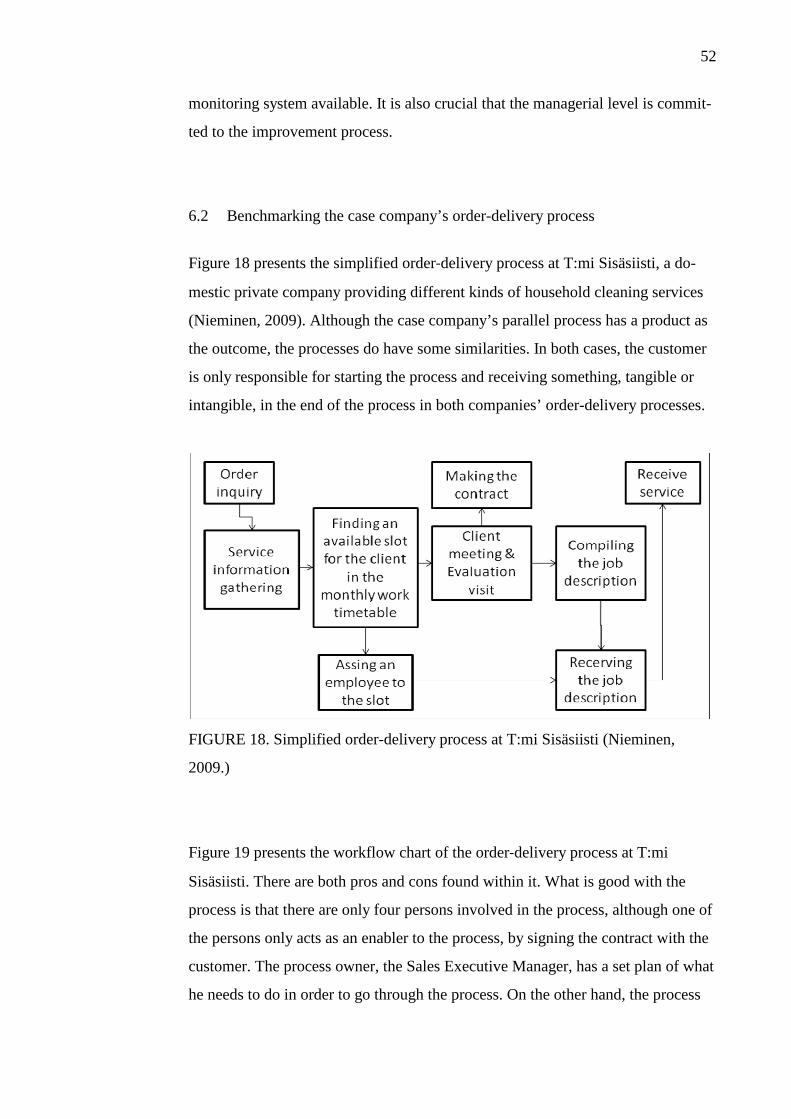
52
monitoring system available. It is also crucial that the managerial level is commit-
ted to the improvement process.
6.2 Benchmarking the case company’s order-delivery process
Figure 18 presents the simplified order-delivery process at T:mi Sisäsiisti, a do-
mestic private company providing different kinds of household cleaning services
(Nieminen, 2009). Although the case company’s parallel process has a product as
the outcome, the processes do have some similarities. In both cases, the customer
is only responsible for starting the process and receiving something, tangible or
intangible, in the end of the process in both companies’ order-delivery processes.
FIGURE 18. Simplified order-delivery process at T:mi Sisäsiisti (Nieminen,
2009.)
Figure 19 presents the workflow chart of the order-delivery process at T:mi
Sisäsiisti. There are both pros and cons found within it. What is good with the
process is that there are only four persons involved in the process, although one of
the persons only acts as an enabler to the process, by signing the contract with the
customer. The process owner, the Sales Executive Manager, has a set plan of what
he needs to do in order to go through the process. On the other hand, the process
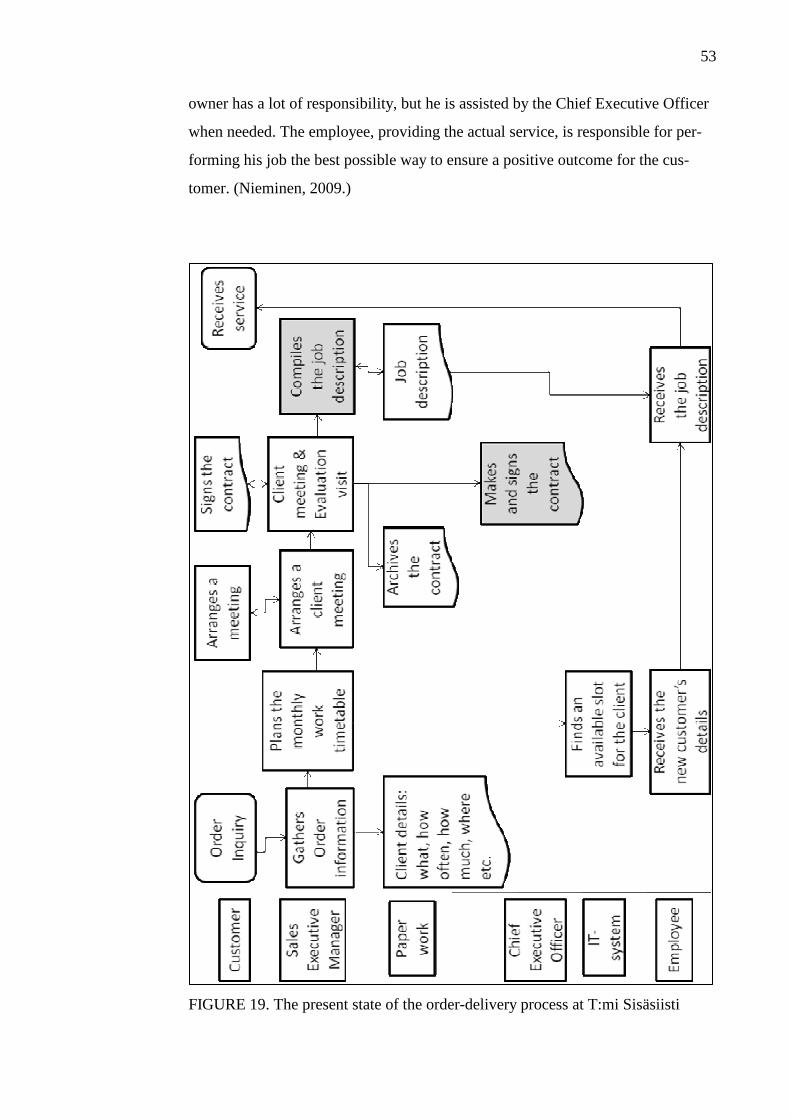
53
owner has a lot of responsibility, but he is assisted by the Chief Executive Officer
when needed. The employee, providing the actual service, is responsible for per-
forming his job the best possible way to ensure a positive outcome for the cus-
tomer. (Nieminen, 2009.)
FIGURE 19. The present state of the order-delivery process at T:mi Sisäsiisti
54
Another positive aspect to the process at T:mi Sisäsiisti is the limited number of
process steps. Order acceptance and finding of the available slot in the work time-
table can be performed during one phone call, providing that the order details are
gathered correctly. The contract is combined during the evaluation visit, which
takes place at the potential customer’s home, or where the service is needed.
Negatives about the order-delivery process at T:mi Sisäsiisti is the lack of use of
IT-systems. Order inquiries could be delivered electronically with the help of or-
der forms. The company has, however, started to use simple computerized models
of the monthly work timetables, which can be updated easily. Also the job de-
scription could be compiled electronically, which would ensure a clear document
for the employee, although the document needs to be printed out for the employee.
6.2.1 The comparison between the order-delivery processes
When comparing the order-delivery process at T:mi Sisäsiisti with the case com-
pany’s parallel process, there are a few issues to notice. The case company is tak-
ing a considerable advantage by utilizing the ERP system, which saves time and
makes processes more standardized. The scope of the order-delivery process at
T:mi Sisäsiisti is though much smaller than that of Startex Oy, so that the same
advantage of an ERP system is not applicable to the parallel process at T:mi
Sisäsiisti. On the other hand, Startex Oy, which has a larger scope in its order-
delivery process, could expand the use of its ERP system. The most considerable
differences between the two parallel processes are illustrated in the following fig-
ure 20.
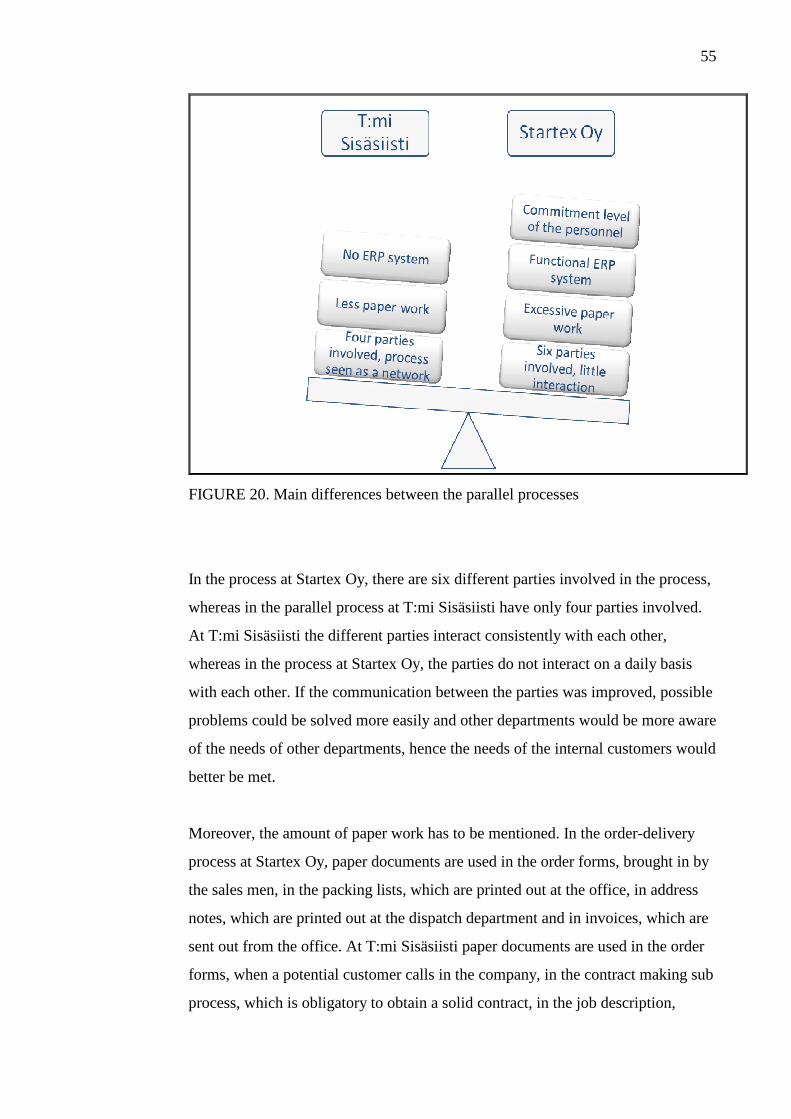
55
FIGURE 20. Main differences between the parallel processes
In the process at Startex Oy, there are six different parties involved in the process,
whereas in the parallel process at T:mi Sisäsiisti have only four parties involved.
At T:mi Sisäsiisti the different parties interact consistently with each other,
whereas in the process at Startex Oy, the parties do not interact on a daily basis
with each other. If the communication between the parties was improved, possible
problems could be solved more easily and other departments would be more aware
of the needs of other departments, hence the needs of the internal customers would
better be met.
Moreover, the amount of paper work has to be mentioned. In the order-delivery
process at Startex Oy, paper documents are used in the order forms, brought in by
the sales men, in the packing lists, which are printed out at the office, in address
notes, which are printed out at the dispatch department and in invoices, which are
sent out from the office. At T:mi Sisäsiisti paper documents are used in the order
forms, when a potential customer calls in the company, in the contract making sub
process, which is obligatory to obtain a solid contract, in the job description,
56
which is compiled electronically but printed out for the employee and in invoices,
which are sent out from the office. In both companies, some of the paper docu-
ments could be removed form the process.
At the case company, order forms, packing lists and invoices could be easily done
electronically with the help of the ERP system already adopted in the company.
This would save paper and make the overall process that much faster. In the paral-
lel process at T:mi Sisäsiisti, the situation is not entirely the same. Because a large
number of the customers of the company are elderly people who do not have ac-
cess to internet or are not capable of making payments electronically, the invoices
must be printed out for that customer segment. For other customers, e-invoices
would work, and therefore a part of the paper invoices could be transformed into
e-invoices.
Last but not least, the importance of an overall commitment of the company’s per-
sonnel must be mentioned. In order to succeed in making any kinds of changes,
the managerial level has to be convinced of the benefits of what focusing on proc-
ess management and Lean methodology can bring to the company. It is therefore
crucial to properly validate the development plan to the management and to make
sure responsibility areas are evenly distributed between the people involved in the
process by identifying process roles.
6.3 8-field SWOT-analysis
In the following table 6, the 8-field SWOT-analysis of the order-delivery process
at Startex Oy is illustrated. Boxes one to four belong to the traditional SWOT-
analysis and boxes five to eight are the different combinations of boxes one to
four.
Table 5 examines the order-delivery process by scanning it with four things in
mind; how to create success factors, transform weaknesses into strengths, alter
external threats into profits and lastly, to create crisis solutions. Strengthening the
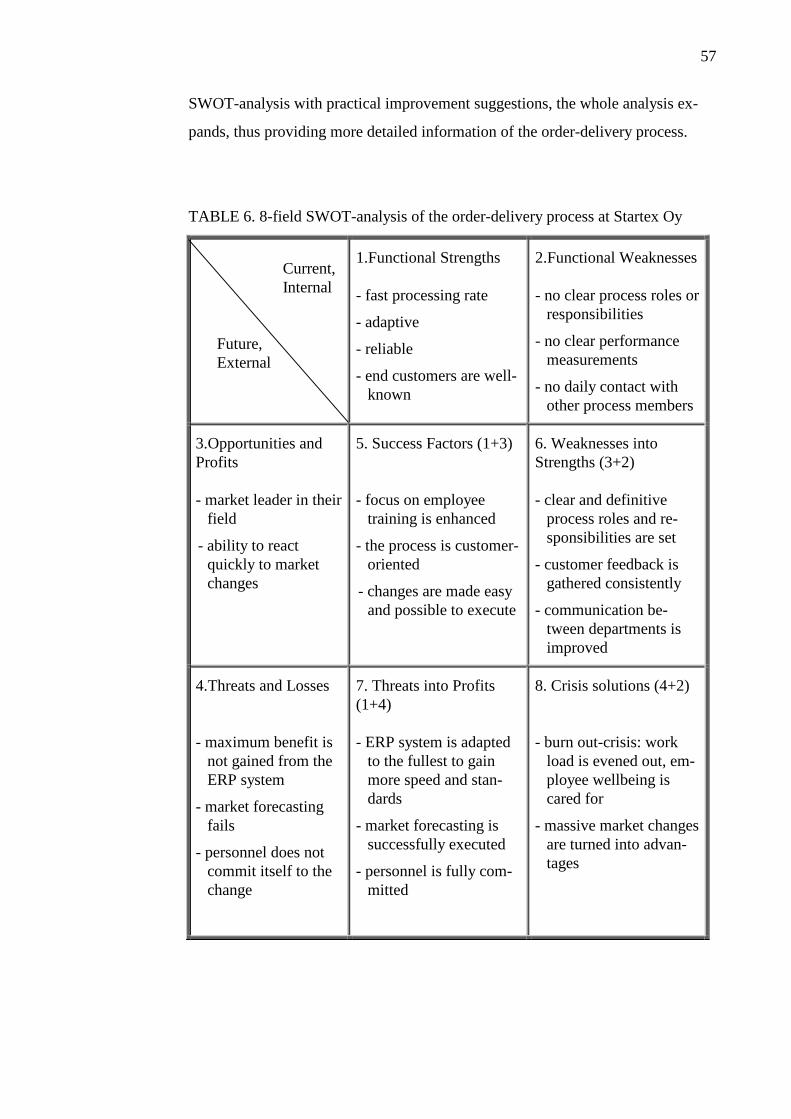
57
SWOT-analysis with practical improvement suggestions, the whole analysis ex-
pands, thus providing more detailed information of the order-delivery process.
TABLE 6. 8-field SWOT-analysis of the order-delivery process at Startex Oy
Current, Internal
Future, External
1.Functional Strengths - fast processing rate
- adaptive
- reliable
- end customers are well-known
2.Functional Weaknesses - no clear process roles or
responsibilities
- no clear performance measurements
- no daily contact with other process members
3.Opportunities and Profits - market leader in their
field
- ability to react quickly to market changes
5. Success Factors (1+3) - focus on employee
training is enhanced
- the process is customer-oriented
- changes are made easy and possible to execute
6. Weaknesses into Strengths (3+2) - clear and definitive
process roles and re-sponsibilities are set
- customer feedback is gathered consistently
- communication be-tween departments is improved
4.Threats and Losses - maximum benefit is
not gained from the ERP system
- market forecasting fails
- personnel does not commit itself to the change
7. Threats into Profits (1+4) - ERP system is adapted
to the fullest to gain more speed and stan-dards
- market forecasting is successfully executed
- personnel is fully com-mitted
8. Crisis solutions (4+2) - burn out-crisis: work
load is evened out, em-ployee wellbeing is cared for
- massive market changes are turned into advan-tages
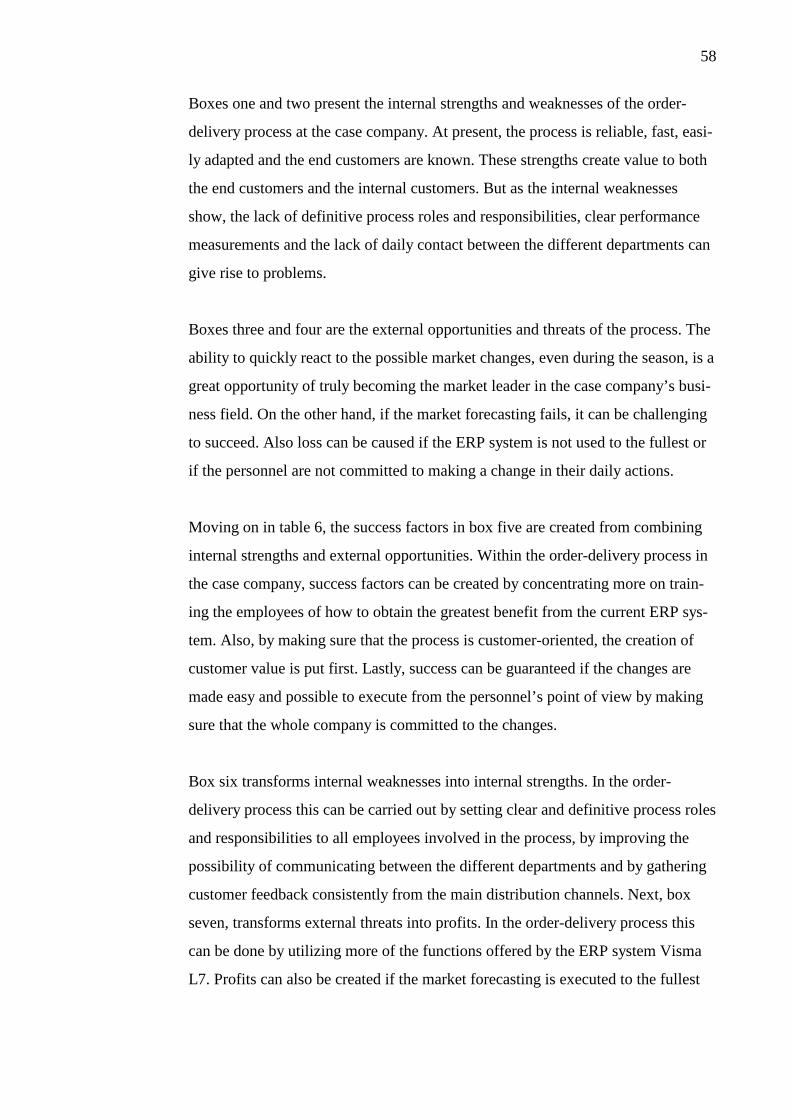
58
Boxes one and two present the internal strengths and weaknesses of the order-
delivery process at the case company. At present, the process is reliable, fast, easi-
ly adapted and the end customers are known. These strengths create value to both
the end customers and the internal customers. But as the internal weaknesses
show, the lack of definitive process roles and responsibilities, clear performance
measurements and the lack of daily contact between the different departments can
give rise to problems.
Boxes three and four are the external opportunities and threats of the process. The
ability to quickly react to the possible market changes, even during the season, is a
great opportunity of truly becoming the market leader in the case company’s busi-
ness field. On the other hand, if the market forecasting fails, it can be challenging
to succeed. Also loss can be caused if the ERP system is not used to the fullest or
if the personnel are not committed to making a change in their daily actions.
Moving on in table 6, the success factors in box five are created from combining
internal strengths and external opportunities. Within the order-delivery process in
the case company, success factors can be created by concentrating more on train-
ing the employees of how to obtain the greatest benefit from the current ERP sys-
tem. Also, by making sure that the process is customer-oriented, the creation of
customer value is put first. Lastly, success can be guaranteed if the changes are
made easy and possible to execute from the personnel’s point of view by making
sure that the whole company is committed to the changes.
Box six transforms internal weaknesses into internal strengths. In the order-
delivery process this can be carried out by setting clear and definitive process roles
and responsibilities to all employees involved in the process, by improving the
possibility of communicating between the different departments and by gathering
customer feedback consistently from the main distribution channels. Next, box
seven, transforms external threats into profits. In the order-delivery process this
can be done by utilizing more of the functions offered by the ERP system Visma
L7. Profits can also be created if the market forecasting is executed to the fullest
59
benefit for the case company and if the whole personnel are engaged in the proc-
ess.
Finally, box eight suggests crisis solutions to issues related to the process in ques-
tion. The possibility of a burn out-crisis could be avoided by balancing the work-
load between the other employees involved in the process and by caring for the
employee well-being more. Although semi-annual conversations with the employ-
ees are held, the levelling of the responsibility could improve the overall work
morale. In addition, by transforming potential market changes into advantages, the
company can avoid financial losses, for example by expanding the product range
to cover more market segments.
6.4 Expert opinions about the improvement ideas for the order-delivery process
When the ideas for improvement from the point of view of Lean methodology
were reviewed with the contact person of the case company, a few notions were
made. The importance of receiving feedback of the modelling process is essential.
After the feedback and comments are given, adjustment can be made, which will
further benefit the case company. The process modelling and recommendation
ideas were seen as practical and such that additional value for the end customer
could be created, although there were two matters that needed adjusting. (Salmi,
2009.)
The order-delivery process had been modelled to represent the actual flow of the
process, and although all of the process modelling tools were not used, the process
was modelled accurately. Only a few small alterations were made to the analysis
of the order-delivery process after the feedback from the contact person of the case
company was given. There were two copies of the packing list used in the process
and one of the copies worked as the delivery note, whereas the other one worked
as the basis of the invoice. (Salmi, 2009.) This mistake could have been noticed by
the author of the thesis, if the process was modelled with all of the process mem-
bers present.
60
Another alteration, which was made to the process analysis after the feedback, was
that the responsibility of the production was actually divided between four per-
sons. This mistake was made because the organizational chart of the case com-
pany, provided by the case company, was a little confusing. Nevertheless, the
main responsibility of the order-delivery process remains one the shoulders of two
persons, the upper and lower level Production Managers. The upper level Produc-
tion Manager has his attention more on the managerial aspects of the process, and
the lower level Production Manager is responsible for the actual, physical imple-
mentation of the order-delivery process. (Salmi, 2009.)
61
7 SUMMARY
This study was conducted for the author’s personal interest towards the subjects of
process management and Lean methodology. The case company had not modelled
its order-delivery process beforehand, and the personnel were also interested to
find out how the process flows in reality. For those reasons the order-delivery
process was chosen as the main centre of attention for the study. The process was
also chosen because it consisted of many phases including paper work of many
sort. The elimination of unnecessary paper work was also one of the author’s in-
terests.
The most significant goal of the study was to provide an example of how process
management and Lean methodology could be combined into one office work
process in order to question the everyday, seemingly simple, processes taking
place at the office surroundings. The study also demonstrated how many different
phases were included in one business process. By improving the everyday proc-
esses, companies can improve their internal efficiency; hence create additional
value for the customer.
The order-delivery process of the case company could have been examined in
more detail by incorporating more process modelling techniques and by the utili-
zation of the workday journals, see example in appendix 1. The more thorough
examination of the process with all of the people involved in the process could
have resulted in more accurate and detailed conclusions.
The most important aim of the study was to understand all of the steps involved in
the order-delivery process and to find out practical, cost-effective ways of improv-
ing that process by implementing Lean methodology, which traditionally is em-
ployed in the production surrounding, in the process.
The ideas for improvement from Lean point of view remain as such, for the lack
of time and interest from the case company’s viewpoint to the matter. The case
62
company might have had different areas of interest than concentrating on the im-
provement of its office work processes, because it would require different kinds of
resources to implement the changes and this might have seemed to be all too time
consuming and demanding for the case company’s personnel.
Despite the fact that the case company is innovative and well-known for its exper-
tise in its field, by putting continuous improvement into practice within their daily
office work processes, an even better representation of the high quality of the case
company could have been perceived.
As the research methods and the whole research plan were assessed by the author,
some aspects came up. The research plan could have worked better, if all of the
research methods could have been utilized. The reason why some of the methods
were set aside was that the case company was not able to provide the required
human resources to model the chosen process. The lack of human resources might
have derived from the inefficient presentation of the goals of the study.
The results of the study do provide enough information to form a basis for conti-
nuous process improvement within the case company. The main challenge that the
case company face are the sufficient supply of training to the personnel and the
commitment from the managerial level to the implementation of making changes.
In order to enable the change, the whole organization needs to be convinced of the
benefits that arise from continuous process improvement with the help of Lean
methodology.
The purpose of the study was to examine and model in detail one office work
process, i.e. the order-delivery process in the case company Startex Oy, and to
distinguish different ways of improving that process with the help of process man-
agement and Lean methodology. The main goal of the improvement ideas from
the Lean methodology point of view was to raise awareness of the importance of
modelling core processes to gain maximum benefits from them. Lean methodol-
ogy viewpoint suggests a new perspective to the overall improvement of the proc-
ess.
63
At first, the study introduced office work and process management on a general
level, though still examining the relevant aspects of the subjects, regarding the
improvement of office processes. Process management was examined thoroughly
to assist in obtaining a more in depth outlook of the idea of process modelling and
process analysis.
Secondly, the study examined Lean methodology in greater detail for it was cho-
sen as the focal point of the study. Lean methodology was applied to the im-
provement suggestions. The suggestions stressed the importance of leveling the
amount of responsibility between the people involved in the process by identifying
process roles and the value of the currently underestimated ERP system’s assis-
tance in the case company.
Lastly, the study compared the case company’s order-delivery process between a
different domestic private company’s parallel processes in order to find possible
improvement areas in the case company’s process. Expert opinions about the im-
provement suggestions to the order-delivery process were also discussed. Finally,
the study assessed the research plan as a whole, covering both pros and cons of the
plan and examining what could have done differently.
64
LIST OF SOURCES
PRINTED SOURCES
Aalto Liisa & Westermack Irmeli, 1993. Tuottava toimistotyö. Porvoo: WSOY.
Aalto Liisa, Peltomäki Sinikka & Westermarck Irmeli, 2007. Tehokkaasti
toimistossa. Helsinki: WSOY.
Emiliani Bob, 2007. Real Lean Critical Issues and Opportunities in Lean Man-
agement. Volume two. United States of America Wethersfield, CT: The Center for
Lean Business Management, LLC.
Gleeson Kerry, 2000. Toimi heti Lopeta lykkääminen. Suomentaja Tytti Träff. 2nd
edition, Juva: WSOY.
Hirsjärvi, S., Remes, P. & Sajavaara, P. 2007. Tutki ja kirjoita. 13th revised
edition, Helsinki: Tammi.
Hölttä Tuula & Savonen Marja-Leena, 1997. Muutosvoimana laatujohtaminen.
Helsinki: Oy Edita Ab.
Jeston John & Nelis Johan, 2006. Business Process Management. Great Britain:
Elsevier Ltd.
Laamanen, Kai & Tinnilä, Markku, 2009. Prosessijohtamisen käsitteet. 4th revised
edition, Espoo: Teknologiateollisuus Oy.
Lecklin, Olli, 2006. Laatu yrityksen menestystekijänä. 5th revised edition.
Helsinki: Kauppakamari.
Proctor Tony, 1995. The essence of management creativity. Great Britain,
65
Cornwall: Prentice Hall International (UK) Ltd.
Sayer Natalie J. & Williams Bruce, 2007. Lean for dummies. United States of
America: Wiley publishing, Inc.
Suomen Standardisoimisliitto, 2000. SFS-KÄSIKIRJA 76. 5th edition, Helsinki:
Kyriiri Oy.
Venegas Carlos, 2007. Flow in the office Implementing and Sustaining Lean Im-
provements. New York: ProductivityPress.com.
Visma Software Oyj. 2008.Visma L7 Järjestelmäkuvaus. Brochure.
Womack, James P., Jones, Daniel T. & Roos, Daniel.1990. The machine that
changed the world. United States of America, New York: Free Press.
INTERVIEWS
Salmi, H. 2009, Startex Oy. Financial Manager. Interview 27th February 2009 and
discussion over the phone 26th October 2009.
Salmi, H. and Järvinen, E. 2009. Startex Oy. Financial Manager, Executive Vice
President. Interview 29th June 2009.
Nieminen, A. 2009. T:mi Sisäsiisti. Financial Manager. 15th October 2009.
ELECTRONIC SOURCES
Bendell Tony, 2006. A review and comparison of six sigma and the lean
organisations. The TQM Magazine, 18/2006, 255-262.
66
[referred on 21st September, 2009] Available at:
http://www.emeraldinsight.com/Insight/ViewContentServlet?contentType=Article
&Filename=Published/EmeraldFullTextArticle/Articles/0680170104.html
Dan Markovitz, 17th September 2008. 5 Ss for Information [e-document]. Lean
Enterprise Institute. [referred on 22nd September 2009] Available at:
http://www.lean.org/admin/km/documents/f39b250e-ddec-4289-9954-
05802019ecbf-LEI%205S%20for%20Information.pdf
Encyclopaedia Britannica, 2008. History of the organization of work [e-
document]. Encyclopaedia Britannica [referred on 30th September 2009] Available
at:
http://www.britannica.com/EBchecked/topic/1359490/history-of-the-organization-
of-work/67060/The-office-workplace
Encyclopaedia Britannica. 2009. Information system. [e-document] Encyclopaedia
Britannica [referred on 30th September 2009] Available at:
http://www.britannica.com/EBchecked/topic/287895/information-system
Gemba Research LLC, 2007. The Seven Wastes of Information [e-document].
Gemba Research LLC. [referred on 23th September 2009] Available at:
http://www.gemba.com/Consulting.cfm?id=109
ISO organization, 2009. Quality management standards. ISO organization. [re-
ferred on 7th October 2009] Available at:
http://www.iso.org/iso/about/the_iso_story/iso_story_quality_management_standa
rds.htm
LEI, Lean Enterprise Institute, Inc. 2009. A Brief History of Lean. [referred on
22th September 2009] Available at:
http://www.lean.org/WhatsLean/History.cfm
LERC, Lean Enterprise Research Centre, 2008. ‘Staying Lean’. [referred on 21st
67
October 2009.] Available at:
http://www.leanenterprise.org.uk/content/view/195/144/
Moisio, J. August 2005. Kouluta esimiehille prosessiajattelua. [e-document].
Qualitas Fennica Oy. [referred on 30th September 2009] Available at:
http://www.ims.fi/upload/media-4981a0a21d1e5.pdf
Moisio, J. September 2008. Lean periaatteita prosessien kehittämisessä. [e-
document]. Qualitas Fennica Oy. [referred on 29th September 2009] Available at:
http://www.ims.fi/upload/media-498975a1cd9ed.pdf
Moisio, J. December 2008. Tutustu Leaniin ja pohdi mistä teillä voisi aloittaa. [e-
document]. Qualitas Fennica Oy. [referred on 7th October 2009] Available at:
http://www.ims.fi/upload/media-4989761f1135d.pdf
Moisio, J. June 2009. Prosessileikkeleitä maailmalta―mitä prosessiajattelussa
tapahtuu 2009. Gathered from e-articles by Moisio, J. [e-document]. Qualitas
Fennica Oy. [referred on 30th September 2009] Available at:
http://www.ims.fi/upload/media-4a2369e8ad7de.pdf
Moisio, J. 2008. Prosessien tunnistaminen on kehittämisen alku.[e-document].
Qualitas Fennica Oy. [referred on 5th October 2009] Available at:
http://www.ims.fi/upload/media-4981a5103c99c.pdf
Salmi, Hanna, 2009. Email heading: Yritysesittely [email]. Recipient Nieminen,
Anu. Message composed on 12.2.2009 [referred on 26.8.2009].
Startex Oy, 2006. [referred on 17th of December, 2008] Available at:
www.startex.fi/company.php
Suomen Standardisoimisliitto (SFS), March 2009. SFS-Käsikirja 1, 6th revised
edition [e-document] SFS. [referred on 30th September 2009] Available at:
http://www.sfs.fi/files/kk12009.pdf

68
Visma software, 2009. [referred on 27th September 2009] Available at:
http://www.visma.fi/index.asp?strUrl=//applications/system/publish/view/showobj
ect.asp?infoobjectid=1002229&menuid=1002469
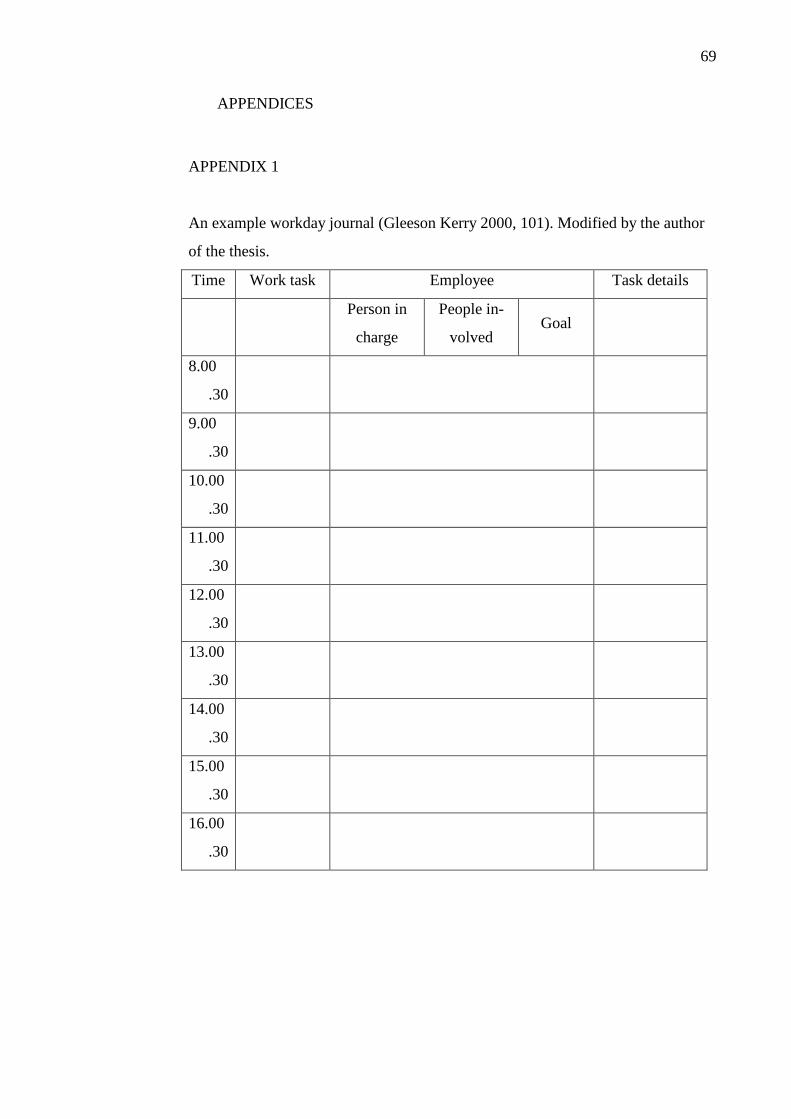
69
APPENDICES
APPENDIX 1
An example workday journal (Gleeson Kerry 2000, 101). Modified by the author
of the thesis.
Time Work task Employee Task details
Person in
charge
People in-
volved Goal
8.00
.30
9.00
.30
10.00
.30
11.00
.30
12.00
.30
13.00
.30
14.00
.30
15.00
.30
16.00
.30
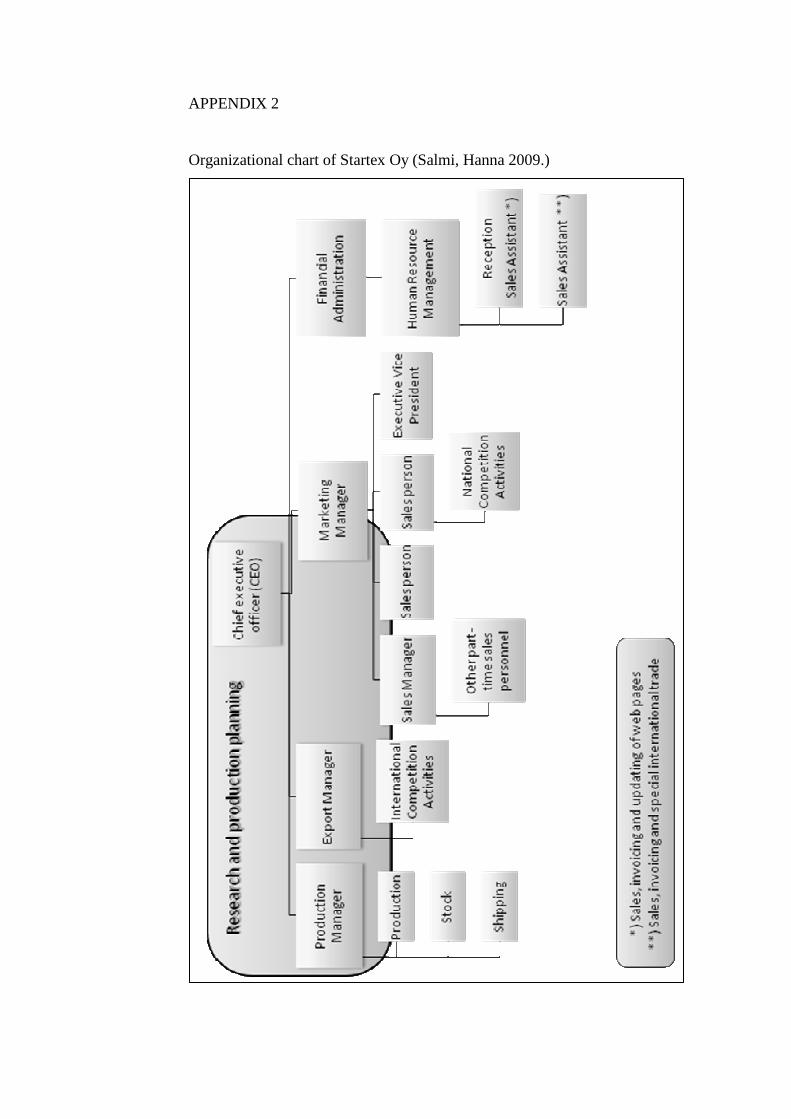
APPENDIX 2
Organizational chart of Startex Oy (Salmi, Hanna 2009.)