Embed Size (px)
Citation preview
Improving Access to Financial Services in Indonesia
Pub
lic D
iscl
osur
e A
utho
rized
Pub
lic D
iscl
osur
e A
utho
rized
Pub
lic D
iscl
osur
e A
utho
rized
Pub
lic D
iscl
osur
e A
utho
rized

THE WORLD BANK OFFICE JAKARTA
Indonesia Stock Exchange Building, Tower II/12-13th Fl.Jl. Jend. Sudirman Kav. 52-53Jakarta 12910Tel: (6221) 5299-3000Fax: (6221) 5299-3111
THE WORLD BANK
1818 H Street N.W.Washington, D.C. 20433 USATel: (202) 458-1876Fax: (202) 522-1557/1560Email : [email protected] : www.worldbank.org
Printed in April 2010
Improving Access to Financial Services in Indonesia was produced by staff of the World Bank with fi nancial support provided by the Dutch Government. The fi ndings, interpretations and conclusions expressed in this report do not necessarily refl ect the views of the Board of Executive Directors of the World Bank or the governments they represent.
The World Bank does not guarantee the accuracy of the data included in this work. The boundaries, colors, denomination and other information shown on any map in this work do not imply any judgment on the part of the World Bank concerning the legal status of any territory or the endorsement of acceptance of such boundaries.

Improving Access to Financial Services in Indonesia

Improving Access to Financial Services in Indonesia2
ForewordIn many developing countries less than half of the population has an account with a formal fi nancial institution. The Indonesian situation is only marginally better - just about half the population has such access. Recent developments in theoretical and empirical literature have shown that providing access to fi nance for a greater share of the population is critical for reducing income inequality, as well as enabling more rapid economic growth. Inclusive fi nancial systems free poor individuals and small enterprises from the need to rely on their own limited savings and earnings to build their assets safely, mitigate risks they face from unexpected events, invest in their education, become entrepreneurs, or take advantage of promising growth opportunities. Failure to provide more households and small and medium enterprises with the fi nancial services they need acts as a brake on development. Sound fi nancial sector policies that encourage competition, provide the right incentives to individuals, and help overcome barriers to access are thus central not only to stability but also to growth, poverty reduction, and more equitable distribution of resources and capacities. Reforms to promote access to fi nancial services should therefore be high on the list of policy makers’ priorities.
The Government of Indonesia has long had improvement of access to credit as one of the cornerstones of its development agenda. While an impressive amount of data and analysis exists on the state of access to credit by small and medium enterprises (SMEs) in Indonesia, there is little hard data and analysis on which to base policies for extending access to broader fi nancial services (beyond credit) to a greater share of the population. What is the demand-side view of the constraints to improved access to fi nance? What do consumers and the currently un-banked population think of fi nancial services? What access do they have and what products and services do they need? This report is an attempt to plug this important data gap and address such questions. It is intended to support the Government’s policy agenda in this critical area.
The key feature of this report is a nationwide household survey of access to fi nancial services on the basis of which it provides data, analysis, and recommendations that can assist the authorities as well as other stakeholders such as the fi nancial services industry in getting an insight into access to fi nancial services in Indonesia. The report aims to identify who does (and does not) have access to fi nancial services in Indonesia, the constraining factors for broader access, and measures that can lower barriers to access for un-banked households.
The World Bank Group has long recognized that well-functioning fi nancial systems that are stable, effi cient, and accessible are essential for economic development. As part of this, it is supporting ongoing eff orts to measure access to fi nance, its determinants, its impact, as well as design and implementation of policies and programs to promote access in several countries across the globe. I hope that this report serves to begin the process of discussions and dialog on this important issue across stakeholders in Indonesia. The World Bank Group stands ready to support the Government of Indonesia as it works to enable those currently outside the formal fi nancial system to join it and reap the benefi ts of such access to formal fi nancial services.
Joachim von AmsbergCountry Director
Indonesia

3
Acknowledgements
This report is the result of a team eff ort involving staff and consultants of the World Bank. The team was led by P.S. Srinivas, Task Team Leader, Yoko Doi, Clarita Cynthia Kusharto, Bilal Husnain Zia, I Gede Putra Arsana, Djauhari Sitorus, Neni Lestari Lloyd Kenward, Chitra Buchori and Fitria Fitrani. The team wishes acknowledge the support provided by Achmad Budiman for his contribution to mobile phone banking section, Sumantoro Martowijoyo on reviewing regulatory frameworks, Irfan Timothy Kortchack for editing work and Hasbi Akhir for designing the report. The team also wishes to thank the peer reviewers: Mohammad Ikhsan, Special Staff to the Vice President, the Vice President Offi ce and Professor, University of Indonesia, and Anjali Kumar, Lead Economist, IEGCG.
The report was prepared under the overall guidance of Tunc Uyanik, Sector Manager, Finance & Private Sector Development, East Asia &the Pacifi c Region; Vikram Nehru, Sector Director, Poverty Reduction & Economic Management, East Asia & the Pacifi c Region; and Joachim von Amsberg, Country Director Indonesia.
The team gratefully acknowledges government support from the Coordinating Ministry of Economic Aff airs, Ministry of Finance, and Bank Indonesia. The survey work was conducted by Regional Economic Development Institute (REDI). The team would like to acknowledge the collaborative work with Dr. Shawn A. Cole and Thomas Sampson from Harvard Business School on the experimental fi nancial literacy program for the unbanked households in East Java undertaken during the household survey implementation.
Preliminary fi ndings of the report were presented to senior offi cials of Bank Indonesia, Bappenas, Ministry of Finance, Bapepam-LK, Coordinating Ministry of Economic Aff airs (CMEA) and other line ministries during a meeting organized by the CMEA in June 2009. During December 9-10, 2009, an international workshop on enhancing access to formal fi nancial services in Indonesia was held with more than 250 participants of senior policy makers, senior management of fi nancial service providers, academics and donors to disseminate the fi ndings from the report and stimulate discussions among and feedback from participants on this issue. The report has taken inputs and feedback from these events into account.
The team also acknowledges the fi nancial support from the Government of the Netherlands (through the Dutch Trust Fund for Improving Indonesia’s Investment Climate and the Multi-Donor Facility for Trade and Investment Climate).

Improving Access to Financial Services in Indonesia4
List of Abbreviations
A2F Access to Finance
ADB Asian Development Bank
AML Anti-Money Laundering
APEC Asia-Pacifi c Economic Cooperation
API Arsitektur Perbankan Indonesia (Indonesian Banking Architecture)
ATM Automated Teller Machine
Bapepam-LK Indonesia Capital Market and Financial Institution Supervisory Agency
BEE Black Economic Empowerment
BI Bank Indonesia
BKD Badan Kredit Desa (Rural Credit Bank)
BPD Bank Pembangunan Daerah (Regional Development Bank)
BPR Bank Perkreditan Rakyat (People’s Credit Bank)
BPS Badan Pusat Statistik (Central Bureau of Statistics)
BRI Bank Rakyat Indonesia
CGAP Consultative Group to Assist the Poor
FAO Food and Agriculture Organization
FATF Financial Action Task Force
GDP Gross Domestic Product
GoI Government of Indonesia
GTZ Gesellschaft fur Technische Zusammenarbeit
ICD Islamic Corporation for Development of the Private Sector
IDIC Indonesian Deposit Insurance Corporation (LPS)
IFAD International Fund for Agricultural Development
IFC International Finance Corporation
IFI International Financial Institution
ILO International Labour Organization
IPO Initial Public Off ering
Inpres Presidential Instruction
IT Information Technology
KSP Kelompok Sains Petani (Farmer’s Science Group; Savings and Loan Cooperative)
KTP Kartu Tanda Penduduk (National Identity Card)
KUK Kredit Usaha Kecil (Small Scale Business Loan)
Kupedes Kredit Umum Pedesan (Village Credit Program)
KUR Kredit Usaha Rakyat (Peoples Business Credit)
KYC Know Your Customer
5
LDKP Lembaga Dana Kredit Pedesaan (Rural Credit Fund Institution)
LPS Lembaga Penjamin Simpanan (Deposit Insurance Organization)
MASS Microfi nance Access and Services Survey
MCSME Ministry of Cooperatives and Small and Medium Enterprises
MoF Ministry of Finance
MSME Micro Small and Medium Enterprises
NBFI Non-Bank Financial Institution
NGO Non-Government Organization
NPWP Nomor Pokok Wajib Pajak (Taxpayer Number)
OECD Organization for Economic and Cultural Development
OJK Otoritas Jasa Keuangan (Financial Services Authority)
PJTKI Perusahaan Jasa Tenaga Kerja Indonesia (Indonesian Workforce Service Company)
PODES Statistik Potensi Desa (Village Potential Statistics)
PP Perum Pegadaian (State-owned Pawnbroker)
PPATK Pusat Pelaporan dan Analisis Transaksi Keuangan (Financial Intelligence Unit)
ProFI Promotion of Small Financial Institutions
Puskesmas Pusat Kesehatan Masyarakat (Community Health Center)
RICA Rural Investment Climate Assessment
SAF Survey of Access to Finance
SEACEN South East Asian Central Banks
SID Sistem Informasi Debitur (Debtor Reporting System)
Simpedes Simpanan Pedesaan (Village Saving Program)
SIUP Surat Ijin Usaha Perdagangan (Business Trading License)
SKB Surat Keputusan Bersama (Joint Ministerial Decree)
SME Small and Medium Enterprises
SoB State-Owned Bank
Susenas Survey Sosial Ekonomi Nasional (National Socio-Economic Survey)
UNDP United Nations Development Programme

Improving Access to Financial Services in Indonesia6
Table of Contents Foreword 2
Acknowledgments 3
List of Abbreviations 4
Table of Contents 6
List of Tables 8
List of Figures 8
List of Boxes 10
Chapter 1 Executive Summary 11
Chapter 2 The Current Supply of Financial Services in Indonesia 19
2.1 Overview of Indonesia’s Financial Sector 19
2.2 The Commercial Banking System 21
2.3 Regional Reach of Indonesia’s Commercial Banks 25
2.4 People’s Credit Banks (BPRs) 30
2.5 Microfi nance Institutions 32
2.6 Sharia Finance and Banking 36
2.7 Non-Bank Financial Institutions (NBFIs) 39
2.8 Financial Services in Support of Remittances 40
2.9 Summary of Policy Issues, by Area 44
Chapter 3 Demand-side Aspects: What do People Want? 47
3.1 Introduction and Overview 47
3.2 Survey Results: Supply of Financial Services 50
3.3 Survey Results: Demand for Types of Financial Services 55
3.4 Survey Results: Demand for Savings Accounts 55
3.4.1 Barriers to Accessibility: Reasons for Savers Being Unbanked 57
3.4.2 Key Socio-economic Characteristics of Indonesia’s Savers 60
3.4.3 Econometric Analysis of Savings 63
3.5 Survey Results on Demand for Loans 64
3.5.1 Who Does Not Borrow? 69
3.5.2 Barriers to Accessibility: Why Do People Not Borrow? 70
3.5.3 Key Socio-Economic Characteristics of Indonesia’s Borrowers 71
3.5.4 Econometric Results for Loans 76
3.6 The ‘Truly Financially Excluded’: No Loans And No Savings Accounts 77
3.7 Survey Results on Demand for Insurance 79
3.7.1 Econometric Results for Insurance 83
3.8 Other Survey Results: Risks to Financial Well-Being 84
3.8.1 Other Survey Results: Demand for Other Financial Instruments 84
3.8.2 Other Survey Results: Expressed Demand for Financial Products 86
3.9 Summary of Policy Issues 88
Chapter 4 Regulatory Impediments to Access 91

7
4.1 Introduction 91
4.1.1 Indonesia’s Financial Regulators & Supervisors 93
4.2 Assessment of the Current Regulatory System, by Service Provider 95
4.2.1 Regulatory Barriers to Access: Commercial Banks 95
4.2.2 Regulatory Barriers to Access: Bank Perkreditan Rakyat (BPRs) 99
4.2.3 Regulatory Barriers to Access: Cooperatives 104
4.2.4 LPS’s Role in the Regulatory Environment 106
4.2.5 Regulatory Barriers to Access: Finance Companies 107
4.2.6 Regulatory Barriers to Access: Insurance Companies 108
4.2.7 Barriers to Access: Pawnshops 109
4.3 Summary of Policy Issues, by Service Provider 111
Chapter 5 Special Topics Concerning Access to Finance 115
5.1 MSMEs and Access to Finance 115
5.1.1 Key Findings of Bank Indonesia’s Survey of MSMEs 116
5.1.2 MSME Lending & Policies in Indonesia 118
5.2 Migrant Workers and Access to Finance 122
5.2.1 A2F Findings on Indonesian Migrant Workers 122
5.2.2 Migrants & Access to Financial Services 125
5.2.3 The Pre-Departure Stage 126
5.2.4 Financial Service Needs During Migration 131
5.2.5 The Post-Migration Period 137
5.3 Mobile Banking 137
5.3.1 The International Context 137
5.3.2 The State of Mobile Banking in Indonesia 140
5.3.3 Mobile Banking to Improve Access to Financial Services 142
5.4 Policy Issues 143
Chapter 6 Policy Recommendations for Improved Access to Financial Services 147
6.1 General Strategic Matters 147
6.2 Regulatory Issues 148
6.2.1 Mobile Banking 148
6.2.2 Commercial Banks 149
6.2.3 BPRs 149
6.2.4 LPS 150
6.2.5 Cooperatives 150
6.2.6 Pawnshops 150
6.2.7 Other Financial Institutions 150
6.3 MSMEs 150
6.4 Overseas Workers and Remittances 151
6.5 Matters of More Limited Concern 151

Improving Access to Financial Services in Indonesia8
Annexes 155
References 194
List of Tables
Table 1. International Comparison of Financial Sectors: Selected Financial Indicators 20
Table 2. International Comparison of Bank Branch Density 20
Table 3. Indonesia, Number of Financial Institutions 22
Table 4. Number of Kabupaten/Kotamadya With and Without Branches of Commercial Banks 29
Table 5. Sharia Banking Offi ces (number of banks, etc.) 36
Table 6. Sharia Rural Bank Performance Indicators 37
Table 7. Offi cial Overseas Worker Placement, 2004 40
Table 8. Cost of Domestic Remittances, April 2009 43
Table 9. Travel to Banks, Time & Cost 52
Table 10. Saver’s Travel to Banks, by Urban/Rural & Java/Off Java 53
Table 11. Non-savers’ Travel to Banks, Urban/Rural & Java/Off -Java 53
Table 12. Summary of Indonesian Savers’ Characteristics 63
Table 13. Household Indebtedness 72
Table 14. Borrowers’ Characteristics, by Gender 74
Table 15. Summary of Insurance Holders’ Characteristics 83
Table 16. Summary of Households Use & Interest in Formal Financial Products 89
Table 17. Financial Providers and Financial Services in Indonesia 94
Table 18. BPR Start-up Capital Requirement 99
Table 19. Access to Finance Indicators-Loans and Deposits 103
Table 20. Legal Basis of the Cooperative System 104
Table 21. Financial Services of Savings and Loan Cooperatives 105
Table 22. Legal Basis of the Finance Companies 108
Table 23. Sample Savings Product Off ered by Banks and the Post Offi ce 130
Table 24. Indicative Cost of Remitting Money from a Middle-East Country 134
Table 25. Key Policy Recommendations on Improving Access to Financing 152
Table 26. Statistical Comparison of Village-Level Variables in the A2F Survey and PODES 162
Table 27. Statistical Comparison of A2F vs. Non-A2F Villages Using SUSENAS Data 163
List of Figures
Figure 1. Share of the Population with formal fi nancial access 12
Figure 2. Savers’ Financial Inclusion 13
Figure 3. Borrowers’ Financial Inclusion 13
Figure 4. Financial Structure (December 2008) 21
Figure 5. Total Banks by Type of Bank 21
Figure 6. Number of Bank Branches and ATMs, by Type of Bank 23
Figure 7. Bank Head Offi ces & Branches, by Province 25
Figure 8. Bank Branches & Density Vs. Per Capita Income, by Province 26

9
Figure 9. Total ATMs & Density Vs. Per Capita Income, by Province 28
Figure 10. Number of Kabupaten without Bank Branches, by Province 30
Figure 11. Financial Performance of BPRs 32
Figure 12. Top 20 Developing-country Recipients of Remittances, 2005 41
Figure 13. Bank Account Distribution, by Type of Bank 51
Figure 14. Bank Branch Locations 51
Figure 15. Travel Time to Nearest Bank Branch 52
Figure 16. Average Time to Reach Select Institutions 54
Figure 17. Waiting Time to be Served in a Bank 54
Figure 18. Financial Products Used by Households 55
Figure 19. Summary of Survey Results for Savers 56
Figure 20. Overlap Among Savings Providers 56
Figure 21. Reasons for Having a Bank Account, by Type of Bank 57
Figure 22. Main Reasons for Not Having a Bank Account 58
Figure 23. Main Reasons for Not Opening a Bank Account, by Income Deciles 59
Figure 24. Yearly Total Household Expenditure 60
Figure 25. Savers’ Socio-economic Characteristics 61
Figure 26. More Savers’ Socio-economic Characteristics 62
Figure 27. Savings by Per Capita Expenditure 62
Figure 28. Summary of Survey Results for Borrowers 64
Figure 29. Purpose of Loan, by Service Provider 66
Figure 30. Loan Sizes, by Institution 67
Figure 31. Indicative Loan Interest Rates 68
Figure 32. Non-Borrowers by Per Capita Expenditure 69
Figure 33. Non-Borrowers’ Characteristics 70
Figure 34. Characteristics of Borrowers 73
Figure 35. Borrowers’ Characteristics, Urban/Rural 73
Figure 36. Borrowers’ Characteristics, by Age 74
Figure 37. Borrowers’ Characteristics, by Employment Status 74
Figure 38. Borrowers’ Characteristics, by Type of Job 75
Figure 39. Borrowers’ Characteristics, by Enterprise Ownership 75
Figure 40. Borrowers, by Region, by per Capita Expenditure 76
Figure 41. Bank Loan, by Region, by per Capita Expenditure 76
Figure 42. Characteristics of ‘Truly Financially Excluded’, by per Capita Expenditure 77
Figure 43. Characteristics of the ‘Truly Financially Excluded’ 78
Figure 44. Characteristics of the ‘Truly Financially Excluded’, continued 79
Figure 45. Insurance Holders, by per capita Expenditure 80
Figure 46. Types of Insurance Ownership 81
Figure 47. Characteristics of Holders of Insurance 82
Figure 48. Characteristics of Insurance Holders, continued 83
Figure 49. MSME Lending 119
Figure 50. MSME Characteristics 121
Improving Access to Financial Services in Indonesia10
Figure 51. Characteristics of Migrant Workers 124
Figure 52. Migrant Workers, by Type of Work and Legal Status (in per cent) 125
Figure 53. Indonesian Migrant Workers and Access to Finance 126
Figure 54. Migrant Workers in the Formal Sector, Financed by Employers 127
Figure 55. How Migrant Workers Finance Pre-departure Expenses 128
Figure 56. Method of Receiving Remittances, by Host Country (in percent) 135
Figure 57. Access to Financial Services Versus Access to Credit 156
Figure 58. Diff erence Between Access to and Usage of Services 157
Figure 59. Samples in PODES 2005 vs. Access to Finance 2007, at Village Level 160
Figure 60. A2F Sample Characteristics 164
Figure 61. Urban/Rural Split 164
Figure 62. Respondents, by Province 165
Figure 63. Sample Characteristics, Age by Gender 165
Figure 64. Respondents, by Employment & Education 166
Figure 65. Respondent Wage Composition 166
List of Boxes
Box 1. The Role of State Vs. Private Banks in Indonesia 24
Box 2. BRI’s MASS Survey: Insights to Banks’ Capacity to Reach the Poor 31
Box 3. The Shadowy Faces of Indonesia’s Lintah Darat 34
Box 4. BRI’s Unit Desa System 35
Box 5. Wider Access to Financial Services through Sharia Mobile Banking 38
Box 6. What Do Household Surveys in Other Countries Tell Us? 48
Box 7. What Do Other Surveys for Indonesia Tell Us? 49
Box 8. Sampling Methodology of the Indonesian Survey 49
Box 9. Some Details on Insurance in the Survey 80
Box 10. Survey Results on Mobile Banking 85
Box 11. Survey Results on Financial Literacy 86
Box 12. Evidence on Easing Constraints to Opening Bank Accounts 88
Box 13. South Africa’s Approach to Improving Access to Financial Services 92
Box 14. Some History on the Regulation of Other Microfi nance Institutions 101
Box 15. Legal Framework for Microfi nance Institutions in Indonesia 111
Box 16. Case Study: Migrant Workers Bound for Taiwan 129
Box 17. Perum Pegadaian (The State-owned Pawnshop) & Access to Credit 129
Box 18. Remittance Method and Frequency from a Middle East Country 132
Box 19. The Methods of Remittance: Formal vs. Informal 133
Box 20. Voices of Hard Experience 136
Box 21. Promising Technologial Advances – South Africa’s WIZZIT 138
Box 22. International Experience in Reducing the Cost of Mobile Banking 139
Box 23. Mobile Banking Product Development in Indonesia 141
Box 24. Weaknesses in the Regulatory Environment for Branchless Banking in Indonesia 142

11
Chapter 1
Executive Summary
There is an impressive amount of evidence to support the proposition that access to formal fi nancial services is a critically important factor for the achievement of poverty alleviation1. There is a growing recognition that increasing access to formal fi nancial services has both private and social benefi ts. Extending access to fi nancial services encourages economic growth and can improve income distribution.
In light of the evidence for the benefi ts of expanded access to fi nancial services, fi nancial inclusion is high on the policy agenda of a number of developing countries worldwide. This is often particularly necessary in such countries, where banking and fi nancial systems are often underdeveloped and often cater only to large fi rms in the formal sector and/or high-income individuals. Improving access requires actions on both the supply and demand side, by both the public and private sectors. It also requires changes in the institutional environment. Recent experiences in several countries show that with the right information on who lacks access and for what reasons, policies can be adjusted and products can be designed to scale up access, especially with new technology.
The Government of Indonesia has also placed high importance on the issue of improved access. The Indonesian government acknowledges that limited access to fi nancial services is a constraint to development, and the authorities are initiating policies aimed at overcoming this constraint. One of the key constraints to concrete policy action in improving access to fi nancial services, in particular at the household level, is the lack of concrete data and sound analysis on what exactly the demand-side view of the constraints. Before attempting to address the issue of extending access, it is necessary to answer the following questions: What
1 See, for example, the work of Beck, Demirguc-Kunt and Martinez Peria (2004), (2005) and (2006). Banking the Poor (2009c), Access to Finance Study: Brazil (2004), India (2006c), Nepal (2007b), and Pakistan (2009b)

Improving Access to Financial Services in Indonesia12
Chapter 1Executive Summary
do consumers and the currently un-banked population think of fi nancial services? What products and services do they need? Are these products and services are available to them? If not, why not? Evidence-based answers to these questions can provide a solid basis to inform policy and product development. While there is a signifi cant amount of data and analysis on the issue of access to credit, particularly by Small and Medium Enterprises (SMEs) 2, there is very little data or analysis on matters related to broader access to fi nancial services.
The basis for this report is a nationwide household survey related to issues of access to fi nancial services. On the basis of this survey, data, analysis, and recommendations are presented as inputs for regulatory authorities and other stakeholders, including those in the fi nancial services industry. The report begins with a review of the supply side of fi nancial services from an access perspective, followed by an examination of the demand side of access to those services. It then looks at the regulatory barriers to fi nancial inclusion and discusses the means by which these barriers may be addressed. Finally, it addresses a number of topics that are of particular relevance to issues of access, including MSMEs, overseas migrant workers and mobile banking.
The immediate purpose of the report is to inform policy-makers and the industry on where and in which sectors of the population constraints to access to fi nancial services exist. The objective is to identify—as specifi cally as possible—measures that can lower barriers to access for poorer households, especially measures that work in cost-eff ective ways.
Survey Results on the Demand for Financial Services
Just about half of Indonesia’s population has access to formal fi nancial services. This is better than countries such as China, Pakistan, Bangladesh, and the Philippines. It is, however, worse than countries such as Sri Lanka, Thailand, and Malaysia. In short, there is much room for improvement.
Figure 1. Share of the Population with formal fi nancial
access
0
20
40
60
80
100%
Sources: World Bank (2008d); World Bank (2009b)
Commercial banks, which dominate the Indonesian fi nancial sector, serve a relatively small proportion of Indonesian households. One-third of Indonesians don’t save at all, and can be considered truly ‘fi nancially excluded’ (see Figure 2 below). Similarly, less than half of Indonesians save at banks, and of those who do save at banks, two-thirds also save at some other type of service providers. Considering the overlap between banks and the informal sector, informal institutions actually service more savers than do banks.
2 World Bank (2006e),“Making the New Indonesia Work for the Poor,”; World Bank (2006):“Revitalizing the Rural Economy: An assessment of the investment climate faced by non-farm enterprises at the District level” ; Signifi cant work done by GTZ on rural banks: See http://www.profi .or.id/; FAO and IFAD on rural fi nance: http://www.ruralfi nance.org/ and http://www1.deptan.go.id/kln/FAO%20in%20%20Indonesia.htm. ILO on migrant workers: See http://www.ilobkk-migration.org/, IFC/GTZ, and CGAP (2009d), ADB (2007): “Low Income Households’ Access to Financial Services” (2007)

13
Chapter 1Executive Summary
Figure 2. Savers’ Financial Inclusion A mere 17% of Indonesians borrow from banks, with about one third more borrowing from the informal sector. On this basis, roughly 40% of the population is ‘fi nancially excluded’ from credit (see the Figure 3: below). The most important reason for exclusion appears to be diffi culties satisfying documentation requirements. The evidence suggests that lack of collateral is a secondary reason.
The single most important fi nancial service identifi ed by households in the
survey is a bank savings account. The most important stated reason for having a bank account is ‘security’. By far, the most common stated reason for not having a bank account is ‘lack of income’ or not having a job. While the survey’s respondents claimed that access to credit from banks was also important, it was considerably further down the list of priorities than access to a savings account. Credit is still concentrated in the informal sector, with sources of credit being widely diversifi ed among service providers.
Figure 3. Borrowers’ Financial InclusionTaken together, the above fi ndings underscore the importance of expanding fi nancial services institutions abilities to off er both savings and credit services, while raising depositors’ incomes through broader policies of economic development. These fi ndings also underscore the challenge to Indonesia’s formal fi nancial system, especially the banks, of signifi cantly expanding its client base, to reach a much larger portion of the population. The ‘truly fi nancially excluded’, or those who have
neither a savings account nor a loan, are predominantly poor, poorly educated, live off -Java in rural areas, and do not own non-farm enterprises. Off Java residents are more than twice as likely to have neither a bank account nor a loan, than are on Java residents.
Physical access to formal fi nancial services is not generally regarded as a signifi cant constraint. The vast majority (some 95%) of Indonesians rated the physical and geographical accessibility of banking facilities as ‘convenient’ or ‘very convenient’. The exception is in rural, off -Java regions, especially where water transport is involved. Nonetheless, it is notable that average travel times to reach bank branches compare favorably to the average travel times taken to reach key public services such as hospitals, schools and other health facilities.
One simple, low-cost solution for borrowers who want to access bank credit at a lower interest rate is for them to open a bank account. Banks and MFIs both charge nominal interest rates of about 30% per annum, with both institutions off ering lower rates to borrowers who hold a savings account. Nominal interest rates from other formal and informal sources of credit, except for loans from employers, friends and neighbors, tend to be higher.

Improving Access to Financial Services in Indonesia14
Chapter 1Executive Summary
Consumers do respond to more attractive pricing of fi nancial services, particularly lower charges on savings accounts. However, the demand looks somewhat price inelastic, which implies that banks need to carefully consider whether it is in their fi nancial interest to reduce fees. This is consistent with identifi ed bank policies that set deposit rates and administration fees in a way that discourages small savers. One policy option in this regard is to encourage banks to off er basic banking services or ‘no frills’ accounts, an initiative that has already begun and appears set to grow in 2010. It should be noted that banks in a number of countries around the world are implementing such ‘no frills’ schemes, although in diff erent ways. Another option would be to encourage regulatory and technological advances to foster the development of services such as mobile banking, which allows service providers to reach more customers at lower cost. Another innovation, especially given Indonesia’s geography, would be to permit and encourage banks to form partnerships with non-bank in institutions and outlets as a means of increasing access to their services.
Some new products that would be of interest to consumers are contractual savings products for urban residents or mobile savings services for rural residents. As for extending the reach of formal bank services so that it better served lower income earners, the most promising avenue looks like mobile banking – even if at fi rst, it is likely that mobile banking is largely likely to be focused on payments services. Even the poorest people in remote villages often have access to mobile phones, and the survey uncovers considerable interest in mobile banking among those with a mobile phone, but with no bank account at present.
Key Aspects of the Current Supply of Financial Services
Although the number of banks has declined substantially since the 1997/98 crisis, banks have signifi cantly expanded the reach of their fi nancial services by expanding their network of branches and through the use of ATMs. Other formal sector providers such as cooperatives and the state owned pawnshop have also expanded their physical outreach. Per capita income and population density go a long way towards explaining the reach of Indonesia’s commercial banking system and the diff erences between the provinces in terms of its reach. The only notable exceptions relative to the average are Jakarta (which is ‘over-serviced’) and East Kalimantan (which is large, resource rich, sparsely populated and ‘under-serviced’). In considering banks, it is important to distinguish between the commercial banks and People’s Credit Banks (BPRs), which are regional in nature and much smaller in size. Among the former, only a relatively small number currently provide fi nancial services to a signifi cant number of lower income households. And even among these, their focus tends to be on better-off clients. However, the commercial banks do make important contributions in other ways. For instance, a number of large commercial banks are involved in so-called ‘linkage program’ with BPRs. In addition, their numbers include one of the largest micro fi nance institutions in the world (BRI’s Unit Desa system). Also, commercial banks are aggressive, opportunistic competitors who are quick to move into promising new markets. Such characteristics imply that the commercial banks are the institutions most likely to introduce new cost-cutting technologies and to put competitive pressure on other fi nancial institutions. Still, they are only a part of the short-term answer to improving access to fi nancial services, because they do not currently have the facilities and infrastructure to serve the lower strata of Indonesian society, particularly for members of the community living in remote, rural areas.
By contrast, in terms of improving access to fi nancial services, the BPRs and other small fi nancial institutions off er much more promise in the near- to medium-term. Despite a great deal of diversity, they are often on the frontline of the delivery of fi nancial services to MSMEs and poorer households, including those in very remote parts of Indonesia. As detailed below, much can be done on the regulatory front to extend their reach.
Sharia banking (and more generally, sharia fi nancing) currently commands a small market share, although this market share has been expanding rapidly for about a decade. These institutions are particularly

15
Chapter 1Executive Summary
important because they cater almost exclusively to the lower end of the market, including in rural regions. Also, Indonesia’s fi rst sharia bank (established in 1992) is a leading innovator in terms of extending fi nancial services to poor remote areas through mobile banking.
Among other fi nancial institutions that provide access to fi nancial services for the poor, three are especially notable: the state-owned pawnshop; cooperatives; and other micro fi nance institutions. Each faces its own particular constraints to which there are specifi c solutions, which are discussed further below. Non-Bank Financial Institutions (NBFIs) play a less signifi cant role in terms of the services they off er to lower income earners, although there has been some encouraging progress in a few areas in recent years. In particular, a number of these institutions off er micro insurance and leasing products that are of particular relevance to MSMEs.
Main Recommendations
Improved access to fi nancial services by lower-income Indonesians requires both public and private sector interventions and innovative public-private partnerships. Based on the self-identifi ed needs of lower income Indonesians, the focus should be on access to a broad range of fi nancial services, rather than merely on access to credit. Credit is important for the poor, but savings facilities rank much higher. A signifi cant proportion of lower income earners fi nd existing fi nancial products to be inappropriate to their needs. Designing and pilot testing appropriate products through partnerships could potentially facilitate access to formal fi nancial sector by a greater proportion of the population, to the benefi t of both clients and fi nancial institutions themselves.
From a public sector perspective, strengthening the existing legal and regulatory framework for various formal fi nancial institutions would be a good fi rst step in aiding the process. For every important service provider, there are aspects of the regulatory framework that could be reformed for the sake of improving access to fi nancial services, without compromising prudential safety.
For commercial banks, the most promising simple, low-cost regulatory reform would involve steps to create a conducive environment for mobile banking, which holds considerable promise in terms of improving access to fi nancial services. Mobile banking holds great promise for reducing costs and extending reach – although, in line with international experience, it is likely to initially focus on payments services and remittances. BI has recently made notable regulatory advances, although much more is still possible. For instance, revised regulations now permit non-bank service providers to issue e-money, but only for payment purposes. If non-bank service providers want to off er person-to-person services, they need a remittance license. At present, eligibility requirements are a signifi cant, unintended barrier to entry. Simpler ways are available to accomplish the same regulatory purpose, without creating such barriers.
To deliver mobile banking services cheaply, the economies of scale off ered by a network of non-bank retail agents is vital. This would entail allowing banks the discretion to outsource services using a network of non-bank third parties, with the banks remaining responsible for their agents’ activities. For mobile banking to be able to meet the needs of the ‘fi nancially excluded’, there are also important Know Your Client (KYC) issues to be addressed. For example, simplifi ed KYC requirements for low-risk, low-value accounts and transactions would permit the remote opening of bank accounts in isolated areas, allowing non-bank agents to facilitate the opening of new accounts.
Smaller regulatory changes involving commercial banks might also be helpful. For example, an offi cial policy on dormant accounts might help reduce banks’ monthly administration fees. Policies to make it easier for banks to unilaterally close inactive, non-zero accounts could be developed, with institutional arrangements in place for the management of such accounts after they are closed. Bank Indonesia’s recent arrangement

Improving Access to Financial Services in Indonesia16
Chapter 1Executive Summary
with major commercial banks to introduce basic banking services, with the proposed launch of a new saving product called TabunganKu (My Saving) in early 2010, is also a step in the right direction. In the area of reporting requirements, annual business plans could be combined with the banks’ annual reports. Regulations concerning the relocation of branches and ATM machines are currently unnecessarily restrictive, with a reporting and approval process required even for minor relocations within the same geographical area. Instead, the regulations should require general descriptions of the location of such facilities. It would also be useful to ease offi cial regulations on the establishment of new branches, at least to bring them into line with Bank Indonesia’s current, relatively liberal interpretation of theoretically stringent regulations.
Concerning BPRs, there are several regulatory barriers that could be eased to improve access, although Bank Indonesia seems to be re-thinking policy in this area already. Consideration could be given to a lower tier of minimum start-up capital for small BPRs in remote locations. Also, NGOs and foreign investors could be allowed to participate in BPRs that are looking for capital. Reporting requirements could be revised for small BPRs in locations without adequate communications services. Written disclosure requirements could be waived in areas of low fi nancial literacy, to be replaced by oral briefi ngs for new customers, perhaps using the local language if appropriate.
As with commercial banks, Know Your Customer (KYC) regulations that demand the presentation of a full set of documentation to access fi nancial services could be eliminated or simplifi ed for small accounts. Similarly, the requirements for taxpayer numbers could be waived for small loans below a pre-specifi ed threshold. Again, as was the case with commercial banks, while the regulations regarding the establishment of new branches are theoretically quite restrictive, in practice these are interpreted fairly liberally. However, the regulations should perhaps be revised so that they refl ect actual practice. In other areas, to enforce regulations on BPRs, BI is already working hard to augment its capacity. As an additional interim step, BI might seek additional, temporary assistance by outsourcing certain tasks to fi rms that specialize in micro-fi nance, a measure for which there are already precedents, with BRI already been charged with the supervision of certain fi nancial institutions in specifi c areas. Important regulatory steps could be taken to improve the capacities of cooperatives, pawnshops and other microfi nance institutions and to ensure that they are better able to provide increased access to fi nancial services. With cooperatives, the most important issues appear to be prudential. These should be addressed on a sector-wide basis before any signifi cant problems surface and potentially erode memberships’ existing access to fi nancial services. Concurrently, there needs to be an upgrading of the MSME’s regulatory and supervisory capacity. Measures to address this could include the temporary outsourcing of certain functions to fi rms specializing in micro-fi nance.
With pawnshops, the state-owned monopoly could be offi cially opened up to competition from the private sector. At present, a number of private pawnshops are already off ering services on the fringes of legality, so opening up this sector would serve the double purpose of encouraging healthy competition and facilitating better regulation of the currently unsupervised and unregulated private pawnshops. In parallel, there needs to be a discussion on the extent to which these institutions needs to be brought under a formal regulatory umbrella, keeping in mind international experience.
With regard to other microfi nance institutions, the most productive step is probably to restore momentum to the drafting of a new Micro-Finance Law. A vital part of this process would involve encouraging public debate on the relevant issues. It is important that the new Law emphasizes facilitation and access, taking into account emerging global experience regarding regulation and supervision of such institutions. In support, linkage programs between commercial banks and BPRs could be expanded to include non-bank MFIs. In addition, it would be helpful if a similar role could be defi ned for NGOs.
17
Chapter 1Executive Summary
In the area of insurance, a stronger foundation is needed for healthy expansion of this industry, with this industry being challenged by several fundamental structural issues. In particular, the industry is currently characterized by the existence of a number of weak and unviable fi rms. This needs to be addressed before the industry can play a signifi cant role in expanding access to fi nancial services. An important exception is the micro-insurance business, which is currently expanding rapidly, with the benefi t of a successful public-private partnership. This could serve as a model for other products targeting lower income earners. There are also emerging models being developed elsewhere in the world that should be explored to determine their relevance to the Indonesian context.
This report also addresses issues relating to MSMEs and migrant workers as special topics of interest in the context of accessibility to fi nancial services. MSMEs’ issues of access to fi nancial services are virtually one-dimensional: that is, the most signifi cant issue by far involves access to credit, with the level of diffi culty being in the inverse proportion to the size of the business. While Indonesia has striven to develop policies to promote access to fi nance by MSME, there is general dissatisfaction with results to date, despite the large expenditures by the government. This is due in large part to the past emphasis of the government’s programs, which has been on subsidized credit programs. In line with international experience, these subsidized credit programs have not been overwhelmingly successful. The Government continues to make access to credit for MSMEs a major policy issue. As part of its endeavors in this regard, it has initiated the Kredit Usaha Rakyat (KUR) program as a means to consolidate the existing programs and put in place an integrated credit guarantee scheme to bring previously unbanked MSMEs into the formal banking sector. While a formal review of this program was underway at the time of writing of this report, the Government has also announced a signifi cant scaling up of the program. Depending upon the results of the assessment, the government may consider strengthening or modifying the existing KUR program.
Issues related to migrant workers and their access to fi nancial services are also high on the Government’s agenda. From an access to fi nance perspective, this group should be of particular interest to fi nancial institutions, given the large remittances that these workers send home. In general, in several areas, to assist migrant workers, Indonesia could seek to re-negotiate the terms of its Memoranda of Understanding on Migrant Workers with recipient countries3 in order to better balance the interests of the workers themselves with the interests of employers and recruitment agencies. From the perspective of increasing access to fi nancial services, specifi c points of negotiation could include a discussion of acceptable forms of identifi cation and the exemption of small transfers from these formal identifi cation requirements keeping in mind global AML/CFT eff orts.
To convince banks of the commercial value of this market, it might be useful to explore the possibility of developing innovative public private partnerships to bring greater segments of these workers into the formal fi nancial sector. One possibility is to encourage the wider use of domestic guarantors (or co-signers) for pre-departure loans to migrant workers. Development partners (or NGOs) with particular interests in migrant worker issues might consider acting as a guarantor in pilot projects that may perhaps later be scaled up. Another possibility would be steps to encourage the design of innovative savings instruments that would permit these workers to save their earnings for use over a longer period of time.
The Way Ahead
In order to facilitate fi nancial inclusion in a manner that truly meets the needs of lower income earners, it is clear that the government must strive to improve access to a broad range of fi nancial services, rather than merely focusing on improved access to credit. A number of developing countries have implemented
3 A recent World Bank study makes several practical suggestions in this regard; see The Malaysia-Indonesia Remittance Corridor (2008a).

Improving Access to Financial Services in Indonesia18
Chapter 1Executive Summary
policies and strategies to achieve this result. Access to fi nance is an issue that involves a number of diff erent stakeholders, including government agencies and authorities such as Bank Indonesia, Bapepam-LK, Ministry of Finance, Ministry of Cooperatives and SMEs; fi nancial institutions from the private sector, including state owned and private banks, non-bank fi nancial institutions; and NGOs, foundations, development agencies and think-tanks working in this area. Technology and education will play a key role in scaling up access rapidly. Thus, telecommunications service providers, academic institutions and fi nancial literacy providers are also signifi cant stake holders. Indonesia’s international development partners can provide knowledge and fi nancial inputs. With all these stakeholders working together, it is possible to signifi cantly improve access to fi nancial services by a large segment of the population. In the short and medium term, this will provide signifi cant benefi ts both to the individuals who are able to access the services and to the fi nancial institutions that provide them. In the longer term, improving access to fi nancial services in this fashion will facilitate the achievement of broader economic development and poverty alleviation goals.

19
Chapter 2
The Current Supply of Financial Services in Indonesia
This Chapter looks at the current supply of fi nancial services in Indonesia. It begins with an overview of the Indonesian fi nancial sector and attempts to put the diff erent service providers in context, particularly in terms of the diff erent segments that each of the varying service providers caters to.
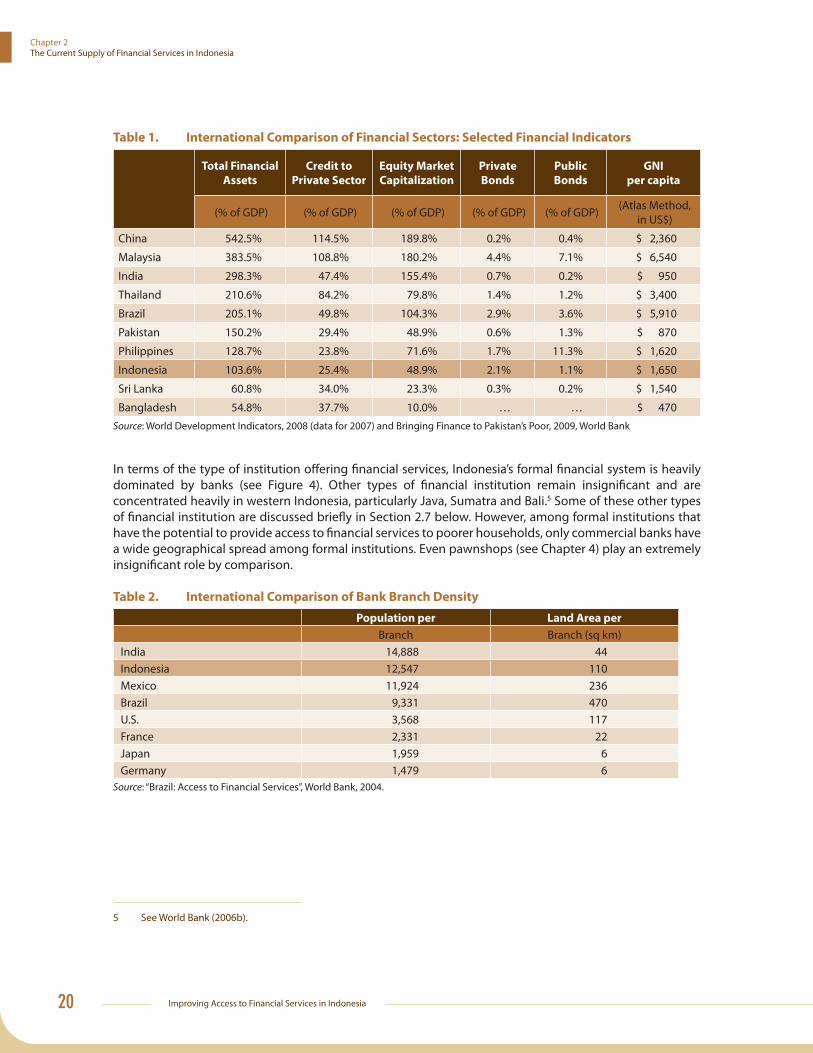
2.1 Overview of Indonesia’s Financial SectorBy international standards, Indonesia’s fi nancial sector is still small in relation to GDP (see Table 1 and World Bank [2006a]). In terms of the nation’s total fi nancial assets, the size of the fi nancial sector is equivalent to only slightly more than 100% of GDP. This is considerably less than the size of the fi nancial sectors in large Asian economies such as those of India and China, where the equivalent fi gures are 300% and 500% respectively. Rather, the size of Indonesia’s fi nancial sector is barely comparable to those of countries such as the Philippines and Pakistan. Among other indicators, as a proportion of national GDP, the value of credit made available by Indonesian banks to the private sector is lower than almost any other comparable country in the region (Table 1). In addition, in terms of the geographical area and the number of people served by each branch, Indonesia has a relatively low rate of bank branch density (Table 2).4 The number of people served by each branch is high relative to that in other comparable countries, while the geographical territory is served by each branch is about average, although notably lower than Mexico and Brazil.
4 The data in Table 2 include BRI’s Unit Desa system, which account for almost 1/3 of all bank branches in Indonesia.
Improving Access to Financial Services in Indonesia20
Chapter 2The Current Supply of Financial Services in Indonesia
Table 1. International Comparison of Financial Sectors: Selected Financial Indicators
Total Financial
Assets
Credit to
Private Sector
Equity Market
Capitalization
Private
Bonds
Public
Bonds
GNI
per capita
(% of GDP) (% of GDP) (% of GDP) (% of GDP) (% of GDP) (Atlas Method, in US$)
China 542.5% 114.5% 189.8% 0.2% 0.4% $ 2,360
Malaysia 383.5% 108.8% 180.2% 4.4% 7.1% $ 6,540
India 298.3% 47.4% 155.4% 0.7% 0.2% $ 950
Thailand 210.6% 84.2% 79.8% 1.4% 1.2% $ 3,400
Brazil 205.1% 49.8% 104.3% 2.9% 3.6% $ 5,910
Pakistan 150.2% 29.4% 48.9% 0.6% 1.3% $ 870
Philippines 128.7% 23.8% 71.6% 1.7% 11.3% $ 1,620
Indonesia 103.6% 25.4% 48.9% 2.1% 1.1% $ 1,650
Sri Lanka 60.8% 34.0% 23.3% 0.3% 0.2% $ 1,540
Bangladesh 54.8% 37.7% 10.0% … … $ 470
Source: World Development Indicators, 2008 (data for 2007) and Bringing Finance to Pakistan’s Poor, 2009, World Bank
In terms of the type of institution off ering fi nancial services, Indonesia’s formal fi nancial system is heavily dominated by banks (see Figure 4). Other types of fi nancial institution remain insignifi cant and are concentrated heavily in western Indonesia, particularly Java, Sumatra and Bali.5 Some of these other types of fi nancial institution are discussed briefl y in Section 2.7 below. However, among formal institutions that have the potential to provide access to fi nancial services to poorer households, only commercial banks have a wide geographical spread among formal institutions. Even pawnshops (see Chapter 4) play an extremely insignifi cant role by comparison.
Table 2. International Comparison of Bank Branch Density
Population per Land Area per
Branch Branch (sq km)India 14,888 44Indonesia 12,547 110Mexico 11,924 236Brazil 9,331 470U.S. 3,568 117France 2,331 22Japan 1,959 6Germany 1,479 6
Source: “Brazil: Access to Financial Services”, World Bank, 2004.
5 See World Bank (2006b).

21
Chapter 2 The Current Supply of Financial Services in Indonesia
Figure 4. Financial Structure (December 2008)
Rural Inst, Pawnshop, VC
2%
Mutual Funds 2%
Securities Firm 2%
Finance Companies 5%
Insurer 6%
Pension Funds 4%
Banks 79%
Source: Bank Indonesia, Bapepam LK, Ministry of Cooperatives, Association, Infobank magazine
2.2 The Commercial Banking SystemSince the fi nancial crisis of 1997/98, there have been signifi cant changes in the composition of fi nancial institutions in Indonesia in terms of the number and range of service providers and the number of branches operated by these providers. In particular, the number of commercial banks (especially private banks; see Figure 5), people’s credit banks (BPRs) and multi-fi nance companies have all declined markedly (Table 3). This is largely a result of government policies aimed at consolidating the number of institutions in these sub-sectors (see Chapter 4).6 By contrast, the numbers of bank branches, bank ATMs, pawnshop branches and cooperatives have all increased signifi cantly (Table 3).
Figure 5. Total Banks by Type of Bank
0
20
40
60
80
100
120
140
160
1997 1998 1999 2000 2001 2002 2003 2004 2005 2006 2007 2008
Num
bers
State Owned Banks Private Com. BanksRegional Banks Foreign & Joint Banks
Source: Bank Indonesia
6 For example, during 2007, Bank Indonesia approved 105 BPRs for consolidation into 19 entities and 5 others had their operating licenses revoked. BI issued approvals in principle for 27 new ones (Bank Indonesia (2007), p. 131).

Improving Access to Financial Services in Indonesia22
Chapter 2The Current Supply of Financial Services in Indonesia
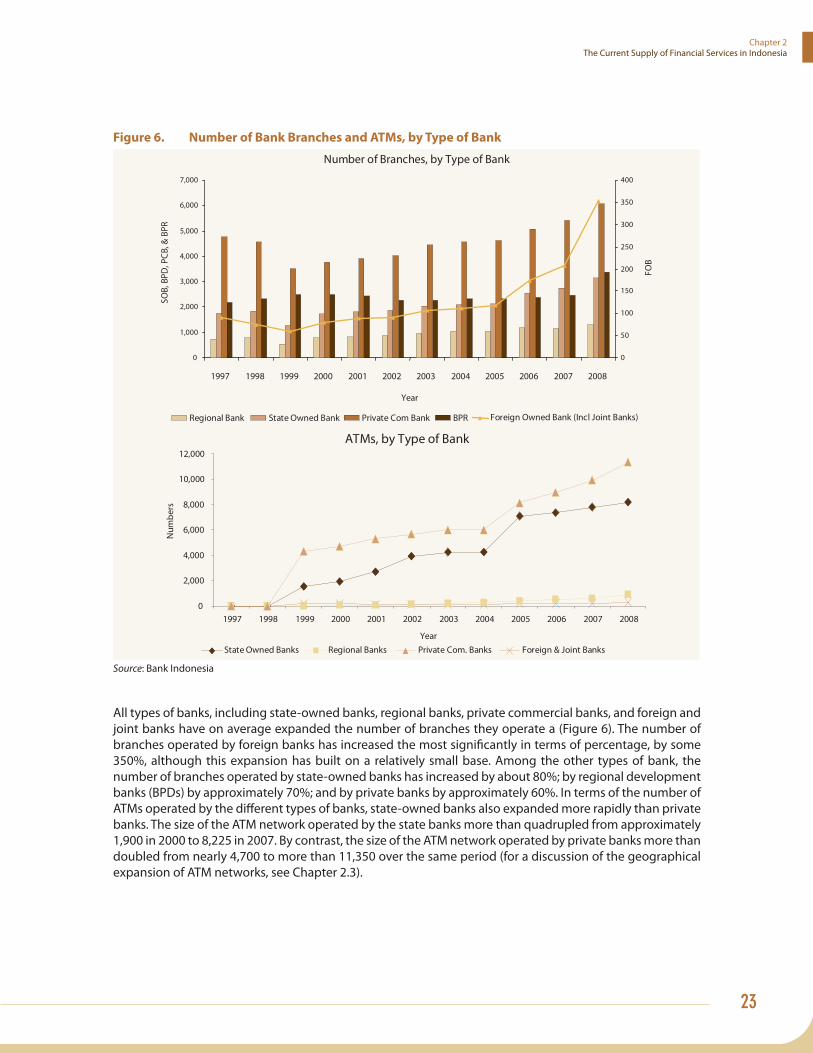
This change in composition has been defi ned by at least two key signifi cant characteristics. First, although the number of fi nancial service providers, including both banks and BPR, has fallen, the reach of existing fi nancial service providers has increased signifi cantly. For example, the number of bank branches has increased by 70% since 2000, while the number of ATMs has almost tripled (Figure 6). Secondly, the expansion has been most signifi cant amongst institutions that serve lower income groups, particularly cooperatives and pawnshops. At the same time, when formal banks have expanded, they have often done so by expanding low-cost facilities, such as new branches, ATMs and mobile banking facilities. It is likely that the expansion of such facilities is making these banks increasingly better positioned to serve lower end markets.
Table 3. Indonesia, Number of Financial Institutions
Banks Bank Branches,
including cash
offi ces
Bank
ATMs
BPRs Venture
Capital
Multi-
fi nance
Pawnshop
(branches)
Cooperatives
2000 151 6,374 7,114 2,419 59 245 692 103,077
2001 145 6,657 8,997 2,355 60 245 722 110,766
2002 142 6,844 10,613 2,143 60 244 739 118,644
2003 138 7,554 11,837 2,141 60 239 774 123,181
2004 134 7,808 13,772 2,158 60 237 806 130,730
2005 131 7,918 15,862 2,009 60 237 840 134,963
2006 131 8,980 16,991 1,880 60 214 869 141,326
2007 130 9,535 18,596 1,817 60 211 899 147,000
2008 124 10,868 20,792 1,772 60 210 1,331 149,913Source: BI, Bapepam-LK, Annual Report of Perum Pegadaian, Ministry of Cooperatives & SMEs
23
Chapter 2 The Current Supply of Financial Services in Indonesia
Figure 6. Number of Bank Branches and ATMs, by Type of Bank
Number of Branches, by Type of Bank
0
1,000
2,000
3,000
4,000
5,000
6,000
7,000
1997 1998 1999 2000 2001 2002 2003 2004 2005 2006 2007 2008 Year
SOB,
BPD
, PC
B, &
BPR
0
50
100
150
200
250
300
350
400
FOB
Regional Bank State Owned Bank Private Com Bank BPR Foreign Owned Bank (Incl Joint Banks)
ATMs, by Type of Bank
0
2,000
4,000
6,000
8,000
10,000
12,000
1997 1998 1999 2000 2001 2002 2003 2004 2005 2006 2007 2008 Year
Num
bers
State Owned Banks Regional Banks Private Com. Banks Foreign & Joint Banks
Source: Bank Indonesia
All types of banks, including state-owned banks, regional banks, private commercial banks, and foreign and joint banks have on average expanded the number of branches they operate a (Figure 6). The number of branches operated by foreign banks has increased the most signifi cantly in terms of percentage, by some 350%, although this expansion has built on a relatively small base. Among the other types of bank, the number of branches operated by state-owned banks has increased by about 80%; by regional development banks (BPDs) by approximately 70%; and by private banks by approximately 60%. In terms of the number of ATMs operated by the diff erent types of banks, state-owned banks also expanded more rapidly than private banks. The size of the ATM network operated by the state banks more than quadrupled from approximately 1,900 in 2000 to 8,225 in 2007. By contrast, the size of the ATM network operated by private banks more than doubled from nearly 4,700 to more than 11,350 over the same period (for a discussion of the geographical expansion of ATM networks, see Chapter 2.3).

Improving Access to Financial Services in Indonesia24
Chapter 2The Current Supply of Financial Services in Indonesia
Box 1. The Role of State Vs. Private Banks in Indonesia
Prior to the fi nancial deregulation drive in the 1980s, Indonesia’s seven state banks dominated the local fi nancial sector. This was largely due to the establishment of these banks on the basis of the nationalization of Dutch banks in the 1950s and 1960s. Each state bank had a somewhat specialized focus, with offi cial statements underscoring their ‘social and development role’. For example, Bank Ekspor Impor (ExIm) focused on international trade and fi nance; Bank Pembangunan Indonesia (Bapindo) was a development bank; Bank Tabungan Negara focused on facilitating the needs of housing development; and Bank Rakyat Indonesia (BRI) concentrated on the provision of rural credit. The other three, Bank Dagang Nasional (BDN), Bank Bumi Daya (BDN) and Bank Negara Indonesia (BNI; the fi rst and largest) leaned more towards the provision of services to the corporate sector.
On a system-wide basis, licensing, credit and interest rates were tightly regulated by the central bank. There were also a large number of central bank re-fi nancing schemes targeting politically important sectors. All of the state banks—some more than others—suff ered internal governance problems. Much of this changed during the 1980s, when a series of so-called deregulation packages lowered entry barriers and increased the level of competition in the sector (see, for example, Cole and Slade [1996] and Binhadi [1995]). The state banks lost market share rapidly, although their offi cial roles were little changed.
Two subsequent developments had a major impact on the role, composition, and structure of the state banks. The fi rst was the fi nancial crisis of 1997/98, which led to the merger of Bank Exim, BDN, BBD and Bapindo into Bank Mandiri. The second was a series of partial privatizations through the listing of the state-owned banks on public stock exchanges and the release of minority stake holdings on these exchanges, beginning with the listing of the BNI in 1996. Within a decade or so, all the state-owned banks except BTN had been partially privatized. During this same period, critical changes were made to the management of a number of state banks, with these changes improving internal governance appreciably.
Today, of the state banks, only BTN and BRI largely retain specialized roles. Bank Mandiri and BNI operate in direct competition with the private banks, with few special privileges. The state banks main advantages are at present mainly derived from their size. Mandiri is the largest bank in the country, accounting for almost 16% of the total assets of the fi nancial sector. BRI and BNI occupy third and fourth place respectively, with each controlling a market share of approximately 10%. BRI has an operational advantage over other banks in the fi eld of micro-fi nance because of its extremely wide network of branches that reach down to the village level, with the width of this network making it diffi cult for any newcomer to challenge this banks position. Nevertheless, and despite the large growth in the number of branches and facilities such as ATMs (noted in the main text), the share of the state banks’ assets in the banking sector has continued to decline over the long-term. By 2007, the share of the state banks assets have declined to 37%, compared with 49% in 2001 and almost 80% in the early 1980s.
It should also be mentioned that the government, as the majority shareholder, still makes occasional special demands of state banks. For example, the state-owned banks are often the target of ‘moral suasion’ when particular policies prove diffi cult to implement by conventional means; the source of temporary expertise in times of crisis, for instance when weak banks need to be closed; and the leading edge of special programs, like the Kredit Usaha Rakyat (KUR) and the Linkage Program between commercial banks on the one side and BPRs and cooperatives on the other.

25
Chapter 2 The Current Supply of Financial Services in Indonesia
2.3 Regional Reach of Indonesia’s Commercial BanksIn a country as large and diverse as Indonesia, when examining issues related to access to fi nancial services, it is very important to look at the regional distribution of commercial bank services. Unfortunately, data on the dispersion of banking services is not available in suffi cient detail to permit a robust spatial analysis across the country. For many purposes, data for provinces and special regions, such as DKI Jakarta, are the best that available. However, these data played a great deal of residual diversity in and between Jakarta, Banten and East Java, for example.
Using a relatively coarse indicator (see Figure 7), it is obvious that the density of bank outlets is considerably higher in the more heavily populated regions. Specifi cally, it is highest in Jakarta, West Java, Central Java and East Java. It is arguable whether this unequal distribution of bank services can be accounted for by population (or land mass) and income levels.
Figure 7. Bank Head Offi ces & Branches, by Province
-100
100
300
500
700
900
1100
1300
1500
1700
1900
2100
2300
2500
2700
Aceh
West Sumatera
Jambi
Bengkulu
Bangka Belitu
ng
Jakarta
Banten
Yogyakarta Bali
East Nusa Tenggara
Central K
alimantan
East Kalim
antan
Gorontalo
South Sulawesi
Southeast Sulawesi
North M
aluku
Papua
Head Quarters
Source: Bank Indonesia
To investigate this issue, the number of branches and branch density existing at the end of 2006 are regressed in terms of real per capita GDP on a provincial basis. The results are presented in Figure 8 with branch density measured in two ways: on a population-adjusted basis (see the middle panel in Figure 8) and on a land areas basis (see the lower panel in Figure 8).7
7 The size of the bubble in the top panel of Figure 8 indicates the relative size of GDP in that province. In the middle panel, it indicates relative population; in the lower panel, relative land mass.

Improving Access to Financial Services in Indonesia26
Chapter 2The Current Supply of Financial Services in Indonesia
Figure 8. Bank Branches & Density Vs. Per Capita Income, by Province
Riau Riau Islands
Jakarta
West Java
Central Java
East Java
Bali East Kalimantan
-250
250
750
1250
1750
2250
2750
-1500 3500 8500 13500 18500 23500 28500 33500 38500
Bran
ches
Total Branches, at Dec 2006
Riau
Riau Islands
Jakarta
Central Java
East Java
Bali
East Kalimantan
-1
4
9
14
19
24
29
-1500 3500 8500 13500 18500 23500 28500 33500 38500
Tota
l Bra
nche
s pe
r 100
,000
pe
rson
s
Branch Density per 100,000 persons, at December 2006
Riau
Riau Islands
Jakarta
East Kalimantan
North Maluku
Papua
-600
400
1400
2400
3400
-1500 3500 8500 13500 18500 23500 28500 33500 38500
Tota
l Bra
nche
s pe
r 1,0
00 k
m2
Constant GDP per Capita (IDR Thousand)
Branch Density per 1,000 sq km persons, at December 2006
Source: Bank Indonesia, BPS, staff calculation

27
Chapter 2 The Current Supply of Financial Services in Indonesia
As indicated in Figure 8, there is clearly a strong positive correlation between the number of branches and branch density and real per capita income. The relationships are all statistically signifi cant (t statistics on real capita GDP ranging from 2.3 to 5.1), with reasonably good fi ts (R2s ranging from .38 to .67). Statistical signifi cance and fi ts are better for branch density (that is, for the lower 2 panels in Figure 8) than for the number of branches. This implies that adjusting for land mass or population is helpful in explaining the relationship.
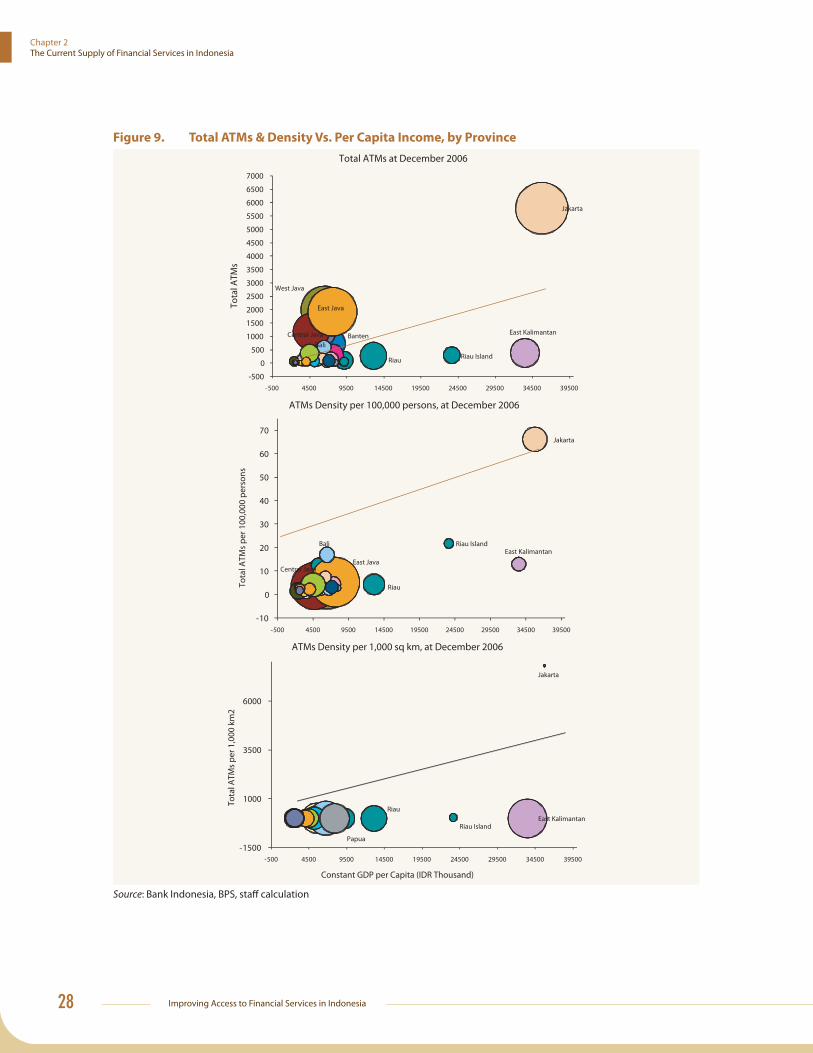
Exactly the same conclusions hold when ATMs are used as the metric instead of bank branches (see Figure 9). Indeed, the statistical fi ts are slightly tighter and the statistical signifi cance slightly higher. This is important for policy purposes. Specifi cally, the relatively low-cost of service provided by ATMs is more responsive to income levels than are the relatively high-cost services provided by bank branches. By implication, if service costs can be further reduced through means such as mobile banking, it is likely that banks would become more deeply involved in regional markets.
Looking at Figures 8 and 9, it is clear that Jakarta is consistently a large, high-side outlier. Jakarta has far more bank branches and ATMs than would be expected on the basis of population, land mass and income. All other provinces8 fall more or less in line with expectations after adjustment for income and population or land mass.
How can the fi gures for Jakarta be explained? Two explanations are plausible. First, agglomeration theory (see the World Development Report 2009) postulates that economic development tends to occur disproportionately in clusters. Specifi cally, economic development is likely to occur in relatively small, densely-populated regions like Jakarta. The second explanation concerns income inequality. The relatively large number of very wealthy people and businesses in Jakarta probably lead to a disproportionately large number of bank services in that region. This underlines the fact that the use of average income as an explanatory variable doesn’t necessarily capture the eff ect.
And what can be said by way of policy conclusions? This analysis provides strong prima facie evidence that variations in the existing supply of fi nancial services at the provincial level are largely explained by variation in population, land mass and income. Only Jakarta and East Kalimantan are clear exceptions, Jakarta being ‘over-serviced’ and East Kalimantan ‘under-serviced’. By implication, targeted eff orts on ‘fi nancially under-served’ areas will need to operate below the provincial level and they will need to take clear account of banks’ demonstrated capacity to respond to broad market conditions.
8 Another exception is the resource rich, but sparsely populated province of East Kalimantan. It is consistently a low-side outlier, implying that it has fewer bank branches and ATMs than would be expected on the basis of income, population and land mass.
Improving Access to Financial Services in Indonesia28
Chapter 2The Current Supply of Financial Services in Indonesia
Figure 9. Total ATMs & Density Vs. Per Capita Income, by Province
Riau Riau Island
Jakarta
West Java
BantenCentral Java
East Java
Bali
East Kalimantan
-500
0
500
1000
1500
2000
2500
3000
3500
4000
4500
5000
5500
6000
6500
7000
-500 4500 9500 14500 19500 24500 29500 34500 39500
Tota
l ATM
s
Total ATMs at December 2006
Riau
Riau Island
Jakarta
Central JavaEast Java
BaliEast Kalimantan
-10
0
10
20
30
40
50
60
70
-500 4500 9500 14500 19500 24500 29500 34500 39500
Tota
l ATM
s pe
r 100
,000
per
sons
ATMs Density per 100,000 persons, at December 2006
Riau
Riau Island
Jakarta
East Kalimantan
Papua-1500
1000
3500
6000
-500 4500 9500 14500 19500 24500 29500 34500 39500
Tota
l ATM
s pe
r 1,0
00 k
m2
Constant GDP per Capita (IDR Thousand)
ATMs Density per 1,000 sq km, at December 2006
Source: Bank Indonesia, BPS, staff calculation

29
Chapter 2 The Current Supply of Financial Services in Indonesia
Some data are available on the number of local jurisdictions (kabupaten in rural areas and kotamadya in urban areas) with no commercial bank branches. Surprisingly, this number has gone up substantially from 16 in 1997 to 156 in 2007 (Table 4). Upon closer inspection, this larger number appears to be entirely due to the creation of new local government jurisdictions, with the total number of such jurisdictions having increased from nearly 314 to 464 over the same period (Table 4). By contrast, the number of local jurisdictions with branches has remained fairly constant at around 300. On this basis, it seems clear that banks do not move into new regions just because political boundaries have been re-defi ned. Rather, the decision to open new branches is based upon commercial viability, which is normally insensitive to political segmentation of existing jurisdictions.
Table 4. Number of Kabupaten/Kotamadya With and Without Branches of Commercial Banks
Year # of Kabupaten/
Kotamadya
with Branches
Total Kabupaten/
Kotamadya
Percentage # of Kabupaten/
Kotamadya
with no Branches
Percentage
1997 298 314 94.9% 16 5.1%
1998 304 314 96.8% 10 3.2%
1999 299 316 94.6% 17 5.4%
2000 306 334 91.6% 28 8.4%
2001 268 349 76.8% 81 23.2%
2002 304 362 84.0% 58 16.0%
2003 303 384 78.9% 81 21.1%
2004 311 424 73.3% 113 26.7%
2005 305 448 68.1% 143 31.9%
2006 309 448 69.0% 139 31.0%
2007 308 464 66.4% 156 33.6%
Source: Bank Indonesia, Ministry of Home Aff airs, Decentralization Support Facility and World Bank Estimates
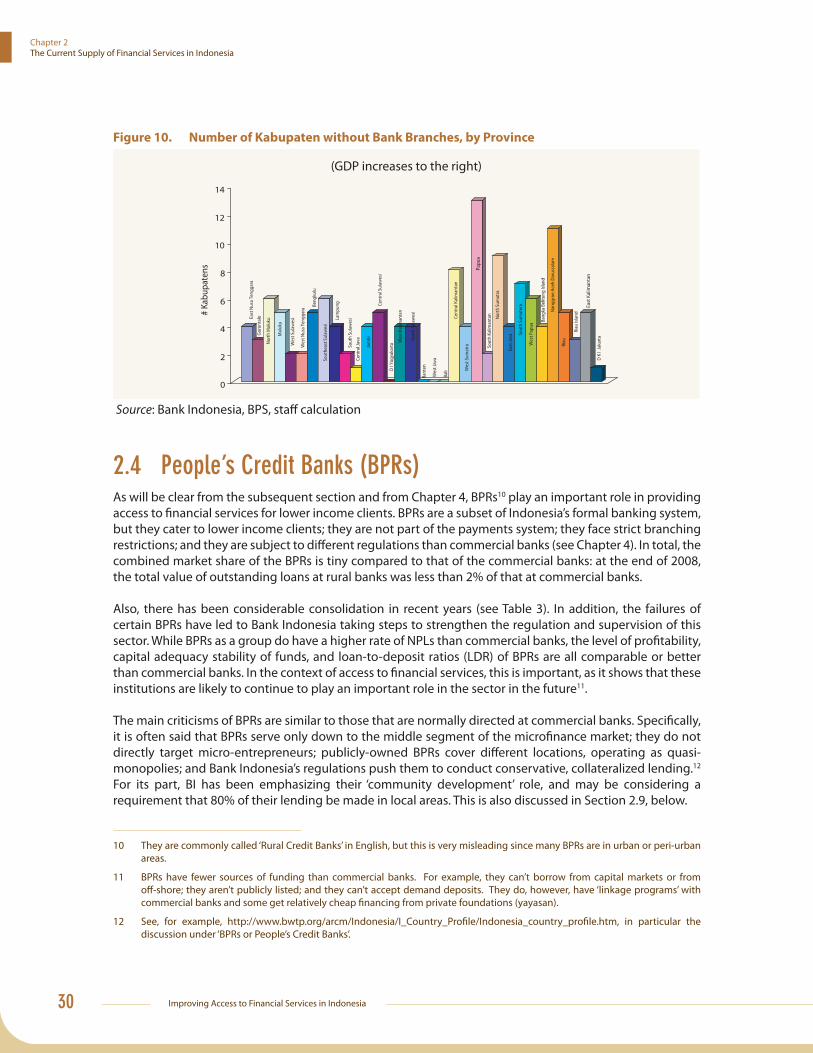
The regional distribution of the local jurisdictions without a branch of a commercial bank provides additional evidence that Indonesia’s banks are sensitive to commercial opportunities as measured by population density. Most ‘unserved kabupaten’ are in the relatively remote, sparsely populated provinces of Papua, Kalimantan and Sulawesi (see Figure 10).9 However, there is no strong relationship between ‘unserviced’ locations and per capita income (see Figure 10).
9 The ‘unserviced’ jurisdictions were Sumatra (56); Sulawesi (23); Kalimantan (22); the Papua island group (19); the Malukus (11); and Nusa Tenggara (6). As of 2007, there were only a handful (6) on Java and none on Bali.
Improving Access to Financial Services in Indonesia30
Chapter 2The Current Supply of Financial Services in Indonesia
Figure 10. Number of Kabupaten without Bank Branches, by Province
(GDP increases to the right)
East
Nus
a Te
ngga
ra
Goro
ntal
o
Nor
th M
aluk
u
Mal
uku
Wes
t Sul
awes
i
Wes
t Nus
a Te
ngga
ra
Beng
kulu
Sout
heas
t Sul
awes
i
Lam
pung
Sout
h Su
law
esi
Cent
ral J
ava
Jam
bi
Cent
ral S
ulaw
esi
D I
Yogy
akar
ta
Wes
t Kal
iman
tan
Nor
th S
ulaw
esi
Bant
en
Wes
t Jav
a
Bali
Cent
ral K
alim
anta
n
Wes
t Sum
atra
Papu
a
Sout
h Ka
liman
tan
Nor
th S
umat
ra
East
Java So
uth
Sum
ater
a
Wes
t Pap
ua
Bang
ka B
elitu
ng Is
land
Nan
ggro
e Ac
eh D
arus
sala
m
Riau
Riau
Isla
nd
East
Kal
iman
tan
D K
I Ja
kart
a
0
2
4
6
8
10
12
14
# Ka
bupa
tens
Source: Bank Indonesia, BPS, staff calculation
2.4 People’s Credit Banks (BPRs)As will be clear from the subsequent section and from Chapter 4, BPRs10 play an important role in providing access to fi nancial services for lower income clients. BPRs are a subset of Indonesia’s formal banking system, but they cater to lower income clients; they are not part of the payments system; they face strict branching restrictions; and they are subject to diff erent regulations than commercial banks (see Chapter 4). In total, the combined market share of the BPRs is tiny compared to that of the commercial banks: at the end of 2008, the total value of outstanding loans at rural banks was less than 2% of that at commercial banks.
Also, there has been considerable consolidation in recent years (see Table 3). In addition, the failures of certain BPRs have led to Bank Indonesia taking steps to strengthen the regulation and supervision of this sector. While BPRs as a group do have a higher rate of NPLs than commercial banks, the level of profi tability, capital adequacy stability of funds, and loan-to-deposit ratios (LDR) of BPRs are all comparable or better than commercial banks. In the context of access to fi nancial services, this is important, as it shows that these institutions are likely to continue to play an important role in the sector in the future11.
The main criticisms of BPRs are similar to those that are normally directed at commercial banks. Specifi cally, it is often said that BPRs serve only down to the middle segment of the microfi nance market; they do not directly target micro-entrepreneurs; publicly-owned BPRs cover diff erent locations, operating as quasi-monopolies; and Bank Indonesia’s regulations push them to conduct conservative, collateralized lending.12 For its part, BI has been emphasizing their ‘community development’ role, and may be considering a requirement that 80% of their lending be made in local areas. This is also discussed in Section 2.9, below.
10 They are commonly called ‘Rural Credit Banks’ in English, but this is very misleading since many BPRs are in urban or peri-urban areas.
11 BPRs have fewer sources of funding than commercial banks. For example, they can’t borrow from capital markets or from off -shore; they aren’t publicly listed; and they can’t accept demand deposits. They do, however, have ‘linkage programs’ with commercial banks and some get relatively cheap fi nancing from private foundations (yayasan).
12 See, for example, http://www.bwtp.org/arcm/Indonesia/I_Country_Profi le/Indonesia_country_profi le.htm, in particular the discussion under ‘BPRs or People’s Credit Banks’.

31
Chapter 2 The Current Supply of Financial Services in Indonesia
Box 2. BRI’s MASS Survey: Insights to Banks’ Capacity to Reach the Poor
As noted in the main text, Bank Rakyat Indonesia (BRI) is Indonesia’s premier lender to MSMEs, having built upon a long history of micro-lending in Indonesia (see Box 4). In the fall of 2002, BRI conducted a Microfi nance Access and Services Survey (MASS) of 1438 households in six provinces (roughly half the size of the Survey of Chapter 3) to map the fi nancial landscape and to gauge potential markets. The enumerators were BRI loan offi cers and other staff . The survey, which provided a unique opportunity to assess the creditworthiness of households using BRI’s standard commercial procedures, included other detailed information on assets, businesses and economic and social changes. Many of the results are useful for the purposes of this report, as summarized immediately below.
First, loans for small businesses are important. However, in 30% of cases, households use the loans for consumption needs, including school fees; medical treatment; household improvements; meeting daily consumption needs; and contributing to social and holiday expenses. This fi nding, which holds across a wide range of low income households, dilutes the case that lending to MSMEs will unleash a burst productive investment spending.
Second, concerning the creditworthiness of the ‘unbanked’, results indicate that creditworthiness increases with income, but 40% of the unbanked poor and very poor were deemed creditworthy by the examiners. At all levels of income, more borrowers were judged to be creditworthy than are currently borrowing or saving.
Third, the lack of collateral was cited as a deterrent by only 10% of households that are creditworthy and not borrowing. The BRI examiners concurred with this conclusion. This confi rms the insights of successful micro lenders, which is to lend on the basis of income, rather than assets.
Fourth, and possibly most important, about half of creditworthy poor households are risk averse and do not seek credit. Some households simply don’t want it. The caveat here is that clearly some households voluntarily exclude themselves due to the prevailing price of credit.
Fifth, of those poor unbanked households who did seek credit, most desired relatively small loans, even by BRI’s standards. Calculations by the researchers showed that BRI, given its current fee structure and banking practices, would lose money if it lent at the small scale sought by poorer households. The authors conclude that it remains
commercially unviable for banks to lend to many poor households, even for BRI, Indonesia’s microfi nance specialist.
Summarizing these conclusions, the evidence suggests that about 40% of the unbanked poor are creditworthy by MFI standards. However, roughly half of them do not want to borrow. And of the unbanked poor who did seek credit, about half are seeking loans that are too small to be commercially viable even for BRI, given that bank’s current commercial standards. This survey, which was heavily tilted towards credit services, provides support for the fi ndings of Chapter 3 that access to fi nancial services covers much wider ground than access to credit, including for the poor.
Source: Johnston and Morduch (2007) and (2008).
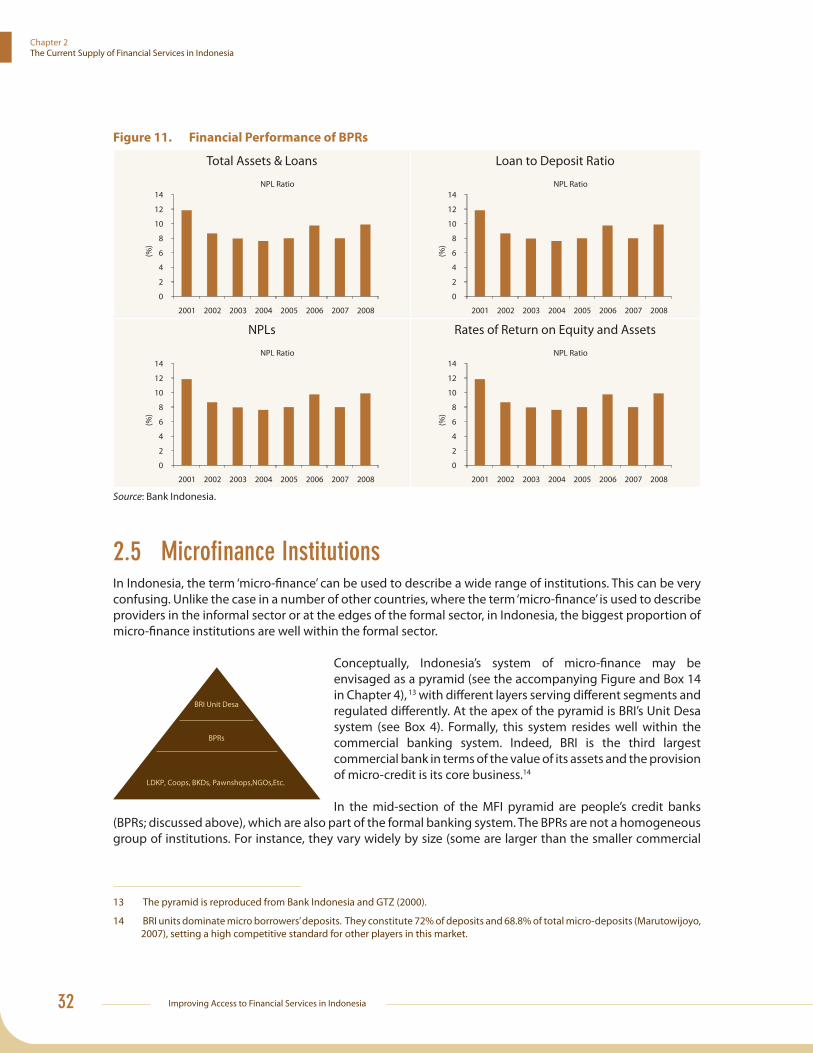
Improving Access to Financial Services in Indonesia32
Chapter 2The Current Supply of Financial Services in Indonesia
Figure 11. Financial Performance of BPRs
Total Assets & Loans
0
2
4
6
8
10
12
14
2001 2002 2003 2004 2005 2006 2007 2008
(%)
NPL Ratio
Loan to Deposit Ratio
0
2
4
6
8
10
12
14
2001 2002 2003 2004 2005 2006 2007 2008
(%)
NPL Ratio
NPLs
0
2
4
6
8
10
12
14
2001 2002 2003 2004 2005 2006 2007 2008
(%)
NPL Ratio
Rates of Return on Equity and Assets
0
2
4
6
8
10
12
14
2001 2002 2003 2004 2005 2006 2007 2008
(%)
NPL Ratio
Source: Bank Indonesia.
2.5 Microfi nance InstitutionsIn Indonesia, the term ‘micro-fi nance’ can be used to describe a wide range of institutions. This can be very confusing. Unlike the case in a number of other countries, where the term ‘micro-fi nance’ is used to describe providers in the informal sector or at the edges of the formal sector, in Indonesia, the biggest proportion of micro-fi nance institutions are well within the formal sector.
BRI Unit Desa
BPRs
LDKP, Coops, BKDs, Pawnshops,NGOs,Etc.
Conceptually, Indonesia’s system of micro-fi nance may be envisaged as a pyramid (see the accompanying Figure and Box 14 in Chapter 4), 13 with diff erent layers serving diff erent segments and regulated diff erently. At the apex of the pyramid is BRI’s Unit Desa system (see Box 4). Formally, this system resides well within the commercial banking system. Indeed, BRI is the third largest commercial bank in terms of the value of its assets and the provision of micro-credit is its core business.14
In the mid-section of the MFI pyramid are people’s credit banks (BPRs; discussed above), which are also part of the formal banking system. The BPRs are not a homogeneous group of institutions. For instance, they vary widely by size (some are larger than the smaller commercial
13 The pyramid is reproduced from Bank Indonesia and GTZ (2000).
14 BRI units dominate micro borrowers’ deposits. They constitute 72% of deposits and 68.8% of total micro-deposits (Marutowijoyo, 2007), setting a high competitive standard for other players in this market.

33
Chapter 2 The Current Supply of Financial Services in Indonesia
banks); market niche (urban versus rural); diff erential performance as between urban and rural;15 and operations (e.g., the former Badan Kredit Desa (BKDs; see Box 14) offi cially do not accept voluntary deposits).
At the lower end of the pyramid, a bewildering array of institutions overlaps the formal and informal sectors. They include fi nancial cooperatives; pawnshops; LDKPs (Lembaga Dana Kredit Perdesaan - see Box 16), which go by diff erent names in diff erent provinces and are mostly owned by provincial/district governments;16 NGOs; Grameen Bank replicas; unoffi cial moneylenders (see Box 4); and probably millions of small, informal savings and credit societies (arisan). Their main characteristics, which separate them from the regular commercial banks, are that they operate on a very small scale and they tend to lend against income, whereas the commercial banks lend against collateral. Little formal data are available on the number of such institutions, although one estimate (Morowijoyo, 2007) puts their number at 46,248 (excluding arisan) as of 2005. This report relies largely upon the Survey reported in Chapter 3.17
Eff ectiveness of the players at the lower end of the pyramid in reaching the poorest depends in large part upon operational soundness of the MFIs, especially their sustainability. For example, if they are competing with subsidized government credit programs, their commercial viability is probably at risk. Likewise, if a signifi cant portion of the MFIs’ fi nancing originates with governments, international institutions or private donors, they are exposed to shifts in the internal policies of those collaborators. Global experience shows that for such institutions achieve independence and viability, they must achieve a self sustaining profi tability, rather than dependence upon transfers, no matter how well-meaning the source of those transfers.
As a general rule, segments lower in the customer pyramid have a larger potential customer base but consisting of customers with an average lower income. At the same time, segments higher in the customer pyramid have higher eff ective interest: of all the listed segments, eff ective rates of interest at BRI are the lowest, followed by BPRs and LDKPs. Cooperatives (Koperasi) and NGOs usually provide subsidized loans for their membership and target groups.
At the lower end of the pyramid, there is a number of subsidized government lending programs. These programs are run by diff erent government departments and state-owned enterprises, with diff erent cultures, philosophies of economic development and supervisory skill sets. These compete with—and sometimes undermine—the micro-fi nance providers, often by replenishing schemes that aren’t working18,19
Many of these lower-end micro-fi nance service providers operate without a fi rmly established legal basis. This incomplete legal and regulatory framework limits reach of MFIs. Specifi cally, it restricts their sources of fi nance, because Banks are penalized for lending to organizations without legal status. It also creates an incentive for other players to operate in the least regulated segment. The formulation and implementation of the law governing micro fi nance has been under debate for almost 10 years with various proposals having been submitted to parliament. However, the law has yet to be approved. Many questions remain on the role
15 See, for example, Bank Indonesia and GTZ (2000), p. 16.
16 In Bali and West Sumatra, they are owned by the villages in which they operate. LDKPs are concentrated on Java and Bali, and they are usually supervised and supported by the Regional Development Banks (BPDs). See http://www.profi .or.id/index.php?option=com_content&task=view&id=44&Itemid=55.
17 Other useful details on some micro institutions are provided in http://www.bwtp.org/arcm/.
18 ‘Finance for the Poor’, Indonesia Policy Brief, January 2005, available at http://www.worldbank.org.id.
19 Bank BRI’s Annual Report for 2007, p.57 notes its participation in two programs: the P4K program (Pembinaan Peningkatan Pendapatan Petani Nelayan or Assistance in Income Generation for Marginal Farmers and Fishermen) run by the Ministry of Agriculture; and Micro and Small Business Loans (KUMK-SUP). It’s notable that the P4K program has sometimes been identifi ed as an exception to the general rule that subsidized credit programs don’t work (‘Rural Investment Climate Report’, World Bank, July 206). Other sources have criticized it as extremely expensive and heavily subsidized (Banking with the Poor, Asia Resource Centre for Microfi nance; http://www.bwtp.org/arcm/Indonesia/)

Improving Access to Financial Services in Indonesia34
Chapter 2The Current Supply of Financial Services in Indonesia
of various institutions in the implementation of any regulatory and supervisory framework. In early 2009, under the leadership of the Coordinating Ministry of Economic Aff airs (CMEA), a joint decree was signed between the Ministries of Finance, Cooperatives, Home Aff airs and Bank Indonesia. The joint decree created a regulatory framework under existing laws to govern non-bank and non-cooperative MFIs that currently operate outside a regulatory framework. The Joint Decree recognises four categories of MFIs: (1) People Business Credit, or BPR; (2) Saving and Loan Cooperatives; (3) Village-owned microfi nance institutions, or BUM Desa; or (4) Venture Capital Companies. However, the joint decree has yet to be fully implemented.
Box 3. The Shadowy Faces of Indonesia’s Lintah Darat
As in many developing countries, informal moneylenders abound in Indonesia, in both urban and rural areas. Understandably, they are reluctant to talk with World Bank researchers, even trusted ones, because they operate outside the law and shun public exposure. Even borrowers are hesitant to talk much about their experience with the lintah darat.
The lenders’ collective name, lintah darat, literally means ‘land bloodsucker’, and it indicates the disdain that most Indonesians hold for the profession. Still, there is strong demand for their services because they provide a vital source of quick, short-term credit, despite usurious rates of interest. The lintah darat seem to fall into two broad categories: those who do it as a profession; and those—often women—who do it part-time on a small-scale basis, operating within their own peer group. The two mentioned below are in the former category. One person in the latter category declined to discuss her business with the Bank’s fi eld team, knowing that the information would be used for this report. Instead, her input (among several others) helped to develop the characters described below.
Johannes Hutabarat (JH is a fi ctional character, pieced together from partial, anecdotal information) lives in Jakarta. Originally, JH is from Medan and he maintains a strong local network among his regional ethnic group. He operates out of a middle-class residential neighbourhood in central Jakarta and he mainly serves retail clients. Typically, his clients come to him on a word-of-mouth basis. They are normally desperate for credit and need it fast (‘uang panas’), usually for personal emergencies. JH prefers to service salaried workers, especially government employees. However, the competition for this clientele from the banks is tough; they, too, see salary earners, with the regular incomes they generate, as attractive clients. JH’s typical loan is small, maybe only a few million rupiah. The term of the loans he provides varies from between a few weeks and a few months. The eff ective annual rate is often well in excess of 50%. In the event that repayment diffi culties develop, JH turns to his network of strong-arm friends from his hometown. Their fi rst resort is intimidation of the client, followed, only if absolutely necessary, by physical violence. JH needs his clients to repay—out of fear, if necessary—but he also values return business and needs to maintain his reputation within the community as a serious businessman.
Djoko Tanuwijoyo (DT) is a real person, although that is not his real name. He lives in a mid-sized city on Java and he runs his operation diff erently to JH. His clients are usually SME businessmen who have problems with bridge fi nancing. He is often asked for loans to meet a payroll or to cover an unexpected cost overrun. They come to him because ‘the banks ask too many questions’ and because banks demand collateral. In addition, the closely-held nature of local businesses puts a premium on confi dentiality and quick response. Often DT’s clients are family members who fully understand the nature of his business and expect little by way of special favors in return. Actually, DT prefers family members (or best friends referred by them) because ‘they are trustworthy’. This is important to DT because his business is largely based upon mutual trust. DT’s typical loan is much larger than JH’s, sometimes running into billions of rupiah. His interest rates are lower than JH’s, although they may still run up to 5% per month, with rates varying according to his assessment of the risk involved in the loan. Because he lives in a smaller city and operates without a sizable band of enforcers, DT relies more on personal relationships and less on intimidation and violence. Still, his willingness to turn to such methods should not be tested because his patience with debt write-off s has its limits.
Source: World Bank fi eld interviews.
NGOs tend to serve the very lowest level of customers defi ned in the pyramid. The NGOs often operate on the basis of a quasi-humanitarianideology, sometimes in the most remote corners of their host country. Their main advantage is a willingness to provide services to levels of society that are not commercially viable that are not considered commercially viable by other operators. However, in part, NGOs operations

35
Chapter 2 The Current Supply of Financial Services in Indonesia
were hampered by their poor relations with the government.20 Also, the 2001 Law governing Foundations (Yayasan) put certain NGOs in a diffi cult position. According to the 2001 Law, foundations may only provide social, humanitarian and religious services, which prevents them from being involved in income-generating activities, such as microfi nance. They were required to cease micro-fi nance operations, or become BPRs or cooperatives. This has proved diffi cult for some NGOs that lack the funds or expertise to become BPRs or are reluctant to adopt the cooperative model.21 Virtually no data on NGOs were available for this report. However, there are anecdotal indications that some NGOs are making signifi cant progress towards overcoming their limitations in this area. One example of this might be the case of a major internationalfoundation that has been involved in the purchase of a weak local bank and its conversion into a wholesale bank (Bank Andara) for the fi nancing of BPRs and cooperatives. Another, longer-standing example involves the Rabobank Foundation, which focuses on the development of small cooperatives in rural regions.22 23 given previously stated signifi cance of NGOs in terms of reaching the poorest levels of society, these trends should be encouraged whereever possible.
Box 4. BRI’s Unit Desa System
Bank Rakyat Indonesia (BRI) runs one of the largest micro-credit programs in the world. By the end of December 2007, it had 3.52 million customers. Its genealogy is complicated, as it has undergone name changes and changes to its structure, composition and ownership over the period in it and its predecessors have operated. However, this genealogy can be traced back to 1895, when a small association to manage the funds of a local mosque in Central Java was established. In recent years, micro loans have comprised around 30% of BRI’s total loan portfolio. The remainder of its loan portfolio is comprised approximately as follows: small loans (50%); medium loans (6%); and corporate clients (14%). As a matter of BRI corporate policy, loans provided to MSME should make up at the least 80% of BRI’s total portfolio. BRIs various programs are run out of approximately 5,200 branches, the vast majority of which are included in the bank’s ‘Unit Desa’ system, which manages the rural fi nance network. With his network, BRI reaches deeply into Indonesia’s villages (see Chapter 3).
BRI’s main savings product, Simpedes (Simpanan Pedesaan), is off ered through the Unit Desa system. This product is intended to service the needs for saving system for middle-low income people, mainly in rural areas. During the 5 years in the period up until 2007, Simpedes grew at more than 18% per annum, accounting for almost 2/3 of BRI’s total deposits. The defi ning characteristics of the product include the following: a low opening minimum deposit (Rp100,000, without an ATM card); low minimum deposits (Rp10,000); a low monthly admin fee for small deposits (Rp2,000); and regular lotteries based upon minimum monthly balance. As of April 2009, Simpedes paid 2-4% interest, depending upon the size of account.
BRI’s premier micro loan product is Kupedes (Kredit Umum Pedesaan), which provides loans of up to the to the Rp100 million through the Unit Desa network. Kupedes’ clients are economically productive individuals who fall into the lower to lower middle income bracket. Typically, these clients are small traders who live and operate businesses in rural and urban areas close to BRI units. These clients take out loans to fi nance working capital, fi xed assets and other purposes. During the past 5 years, the total value of loans has grown by an average of more than 22% per year. By way of comparison, the total value of small loans has grown by an average of 22%; medium-scale loans by 40%; and corporate loans by almost 30%. Kupedes’ interest rates are currently around 1½% per month. In general, loans are made on the basis of the client’s income and perceived character, not collateral. Other features include convenient location of the banks units; simple, quick procedures; fl exible terms; and access to larger loans for borrowers who repay on time.
Sources: BRI Annual Report for 2007; http://www.bwtp.org/arcm/; and fi eld interviews.
20 See, for example, Schwarz (1994), p. 253-4, and p. 60 and Haggard (2000), p. 186.
21 See http://www.bwtp.org/arcm/
22 See http://rabobank.com/content/about_us/rabobank_foundation/
23 For other information on NGOs operating in fi nancial services, see http://www.bwtp.org/arcm/.

Improving Access to Financial Services in Indonesia36
Chapter 2The Current Supply of Financial Services in Indonesia
2.6 Sharia Finance and BankingSharia fi nance refers to a system of fi nance based on accepted interpretations of Islamic law. At present, service providers who operate according to this system command a very small market share (roughly 2-3%). However, this market share is much higher for MSMEs (about 10%)24 and it is growing very rapidly. On the basis of available information, it is diffi cult to determine if this expansion is the result of existing users of fi nancial services provided by other institutions switching their allegiance to sharia banking, or if new customers are being attracted to fi nancial services for the fi rst time. Both possibilities seem equally plausible in the local context. However, the important point is that a very popular, new service is on off er. At a minimum, this puts pressure on existing providers to improve service and reduce prices.
In recent years, Sharia products have expanded to cover all the major fi nancial services and are now off ered by to a range of diff erent service providers. The service providers off ering sharia products include conventional bank, BPRs and cooperatives, with these products including stocks; bonds; mutual funds; and insurance. Even the state-owned pawnbroker has a Sharia arm. Furthermore, the fi rst commercial bank Sharia in Indonesia, Bank Muamalat, is a leading innovator in the outreach of fi nancial services (see Box 5). For its part, Bank Indonesia has been supporting the market development of sharia service providers and their products through its ‘Accelerated Islamic Banking Development Program’, including its ‘iB Campaign 2008’.25
By the end of 2008, there were fi ve commercial banks that operated entirely according to Sharia principles and 27 conventional banks that operated more or less self-contained Sharia business units (Table 5). Adding in rural banks and their service outlets, the total number of Sharia service outlets reached 2,658 by the end of 2007, the representing a growth of approximately 600% in three years. The geographical area in which these service providers operate has also increased dramatically in the same time period, extending to an additional 70 regencies and municipalities in 31 provinces. Their outreach has been extended to more than 70 regencies and municipalities in 31 provinces. Amongst these institutions, non-performing loans account for a very respectable 4% of the total portfolio at the end of 2007, although the proportion appears to be increasing (Chart 9.6 in Bank Indonesia 2007).
Table 5. Sharia Banking Offi ces (number of banks, etc.)
2003 2004 2005 2006 2007 2008
Sharia Commercial Banks (SCB) 2 3 3 3 3 5
Sharia Business Units (SBU) 8 15 19 20 26 27
Total SCB & SBU network 253 355 458 531 597 790
Sharia Rural Banks 84 88 92 105 114 131
Sharia Service Outlets … … … 456 1,195 2,658
Source: Bank Indonesia
For the purposes of this report, it is important to note that these institutions cater mainly to the lower end of the market, off ering their services to small businesses and lower to middle income individuals. The proportion of the total value of loans provided by institutions of the this sort to MSMEs amount to more than 70%, while the vast majority (almost 98%) of their customer accounts are held by individuals (Bank Indonesia, 2007, p. 135 and 137). As for Sharia rural banks, which off er services almost exclusively to lower-income groups, their numbers have been increasing steadily with their funds mobilization and
24 See p.13 of Bank Indonesia (2005).
25 This is essentially a public information and training program. See Chapter 9 of Bank Indonesia (2007), p. 146-147.
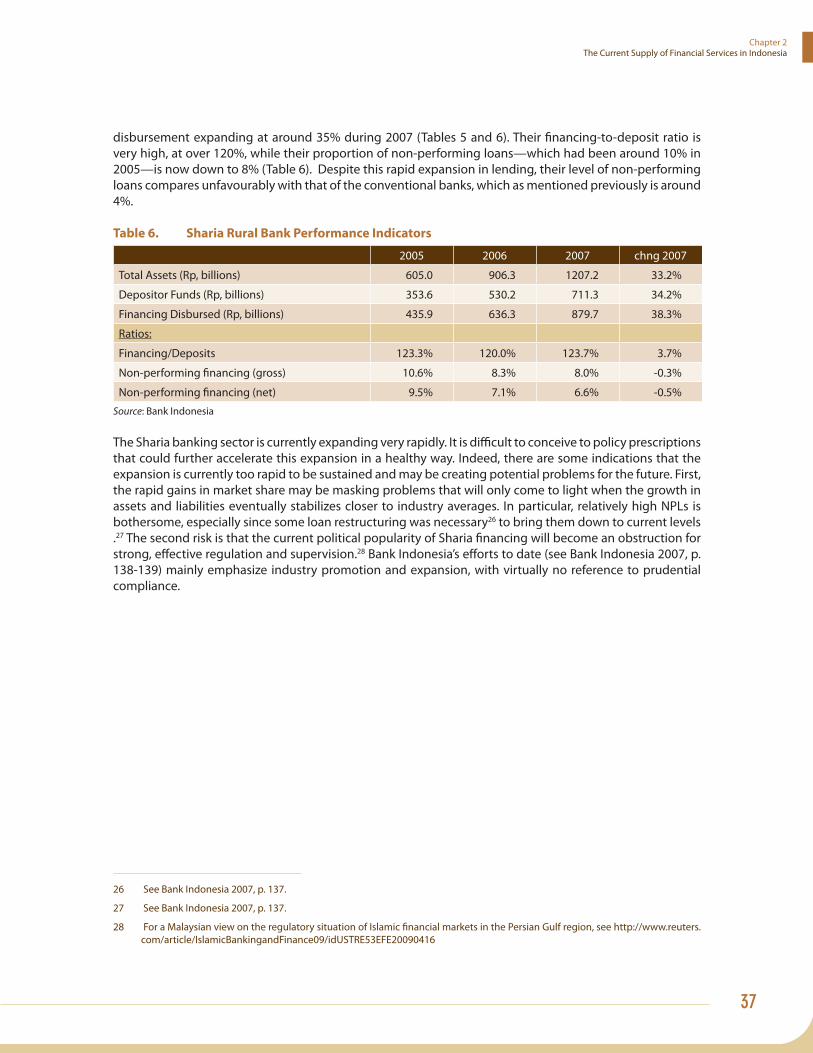
37
Chapter 2 The Current Supply of Financial Services in Indonesia
disbursement expanding at around 35% during 2007 (Tables 5 and 6). Their fi nancing-to-deposit ratio is very high, at over 120%, while their proportion of non-performing loans—which had been around 10% in 2005—is now down to 8% (Table 6). Despite this rapid expansion in lending, their level of non-performing loans compares unfavourably with that of the conventional banks, which as mentioned previously is around 4%.
Table 6. Sharia Rural Bank Performance Indicators
2005 2006 2007 chng 2007
Total Assets (Rp, billions) 605.0 906.3 1207.2 33.2%
Depositor Funds (Rp, billions) 353.6 530.2 711.3 34.2%
Financing Disbursed (Rp, billions) 435.9 636.3 879.7 38.3%
Ratios:
Financing/Deposits 123.3% 120.0% 123.7% 3.7%
Non-performing fi nancing (gross) 10.6% 8.3% 8.0% -0.3%
Non-performing fi nancing (net) 9.5% 7.1% 6.6% -0.5%
Source: Bank Indonesia
The Sharia banking sector is currently expanding very rapidly. It is diffi cult to conceive to policy prescriptions that could further accelerate this expansion in a healthy way. Indeed, there are some indications that the expansion is currently too rapid to be sustained and may be creating potential problems for the future. First, the rapid gains in market share may be masking problems that will only come to light when the growth in assets and liabilities eventually stabilizes closer to industry averages. In particular, relatively high NPLs is bothersome, especially since some loan restructuring was necessary26 to bring them down to current levels .27 The second risk is that the current political popularity of Sharia fi nancing will become an obstruction for strong, eff ective regulation and supervision.28 Bank Indonesia’s eff orts to date (see Bank Indonesia 2007, p. 138-139) mainly emphasize industry promotion and expansion, with virtually no reference to prudential compliance.
26 See Bank Indonesia 2007, p. 137.
27 See Bank Indonesia 2007, p. 137.
28 For a Malaysian view on the regulatory situation of Islamic fi nancial markets in the Persian Gulf region, see http://www.reuters.com/article/IslamicBankingandFinance09/idUSTRE53EFE20090416

Improving Access to Financial Services in Indonesia38
Chapter 2The Current Supply of Financial Services in Indonesia
Box 5. Wider Access to Financial Services through Sharia Mobile Banking
Bank Muamalat is Indonesia’s fi rst Sharia bank, established in 1992. It is a leading innovator in development of fi nancial products that reach out to poor, remote regions through the use of mobile banking. In January 2005, it launched Shar-e, a full banking services card that Bank Muamalat promotes as “the fi rst investment card”. It is unique in that the card has no limit in its wallet size; it can be used as a savings account; and it functions as an ATM and debit card. Essentially, it is a “virtual bank account”.
By the end of 2007, the number of Shar-e card holders was 1.2 million, with average deposit per customer of approximately Rp 700,000 (US$70). In 2007, the bank announced that it planned to attract an additional 700,000 customers in 2008. Fifty percent of Shar-e card holders are active customers who on average perform 15 transactions per month. Any single transaction involving an amount in excess of Rp90 million has to be reported to BI by the customer. Apart from this, however, there is no limit on transactions per day.
A potential Shar-e customer can open an account by going to a post offi ce or a Shar-e agent to complete a KYC form and present identifi cation. The potential customer must pay an opening fee of Rp 25,000 and make a minimum initial deposit of Rp 100,000. The Shar-e card holder needs to activate his or her account by contacting the Muamalat call center, with activation permitting the card to be used in ATMs. Shar-e card holders are expected to conduct transactions via phone banking, post offi ces, retail agents, or ATMs. It is very rare for them to have to go to a Bank Muamalat branch.
In 2007, Bank Muamalat worked with 1,800 post offi ces throughout the country. In 2007, it announced plans to add 500 more post offi ces in the following year. In total, there are 5,000 post offi ces across Indonesia, so the bank still has signifi cant potential to expand its network in remote places. The bank has entered into an exclusive deal with the post offi ce that gives it a monopoly over the provision of sharia-based services through the post offi ce system. In addition to providing revenue to the post offi ce, Bank Muamalat also provides computer terminals in each post offi ce and trains postal workers in banking transactions.
The Shar-e card can be used at any of the fi ve major ATM networks in the country, including BCA’s Prima network, which included approximately 6,000 ATM units by the end of 2008, accounting for approximately 30% of all ATMs in Indonesia (Table 3). For most transactions conducted through an ATM network, such as purchasing or bill payment, the card holder is charged between Rp2,000-4,000 (20-40 US cents). Phone banking facilities are also provided, with these facilities allowing the cardholder to activate the account, check the balance, and transfer funds to other card holders.
Of the total number of Shar-e card holders, 30% live in rural areas and 70% in cities. To promote Shar-e and educate its customers, Bank Muamalat uses TV ads and billboards. Also, representatives visit Islamic schools to promote the use of the card. It’s notable that many Shar-e card holders are not Moslems, with a large number of card holders in Papua and North Sulawesi, where non-Muslim ethnic groups predominates. Most users state that the convenience of the product to and the access it provides to many ATM networks is their main reason for using Shar-e.
Bank Muamalat plans to extend its networks beyond the post offi ce system to include other outlets such as the Fuji Image Plaza, a chain of fi lm processing kiosks for the facilitation of Shar-e transactions. In addition, Shar-e card holders have access to 2000 ATMs in Malaysia. There have been discussions on the provision of services to facilitate remittances from workers in Malaysia, Hong Kong and Saudi Arabia.
Shar-e card is probably one of most successful examples of Indonesian branchless banking to date. However, Bank Muamalat appears to be cautious about extending and expanding mobile banking services to facilitate transactions. At present, mobile banking can be used to check balances, but not to conduct other transactions, although there has been some discussion about extending the service to facilitate deposits.
Source: IFC, Jakarta.

39
Chapter 2 The Current Supply of Financial Services in Indonesia
2.7 Non-Bank Financial Institutions (NBFIs)29
NBFIs have not yet played a signifi cant role in enhancing access to fi nancial services amongst lower income earners. Indonesia’s non-bank fi nancial sector is small, comprising approximately 20% of the total fi nancial system. This is considerably lower proportion in relative terms than that found in several other large developing countries and many countries in the East Asia region (World Bank (2006b), and Figure 4). At the present time, government policy aims at eliminating smaller, weaker fi nance and insurance companies by mandating minimum levels of the capital and capital adequacy. As can be seen from experience with commercial banks, these mandated minimum levels are not necessarily inconsistent with the provision of services to poorer members of society. However, it does create eff ective entry barriers, which may limit access. Until this phase passes, most of Indonesia’s NBFI sector are likely to continue to off er products that are mainly relevant for larger corporates and the better-off segments of society. The important exceptions to this rule involves servicing providers off ering leasing and micro-insurance products. The leasing/multi-fi nance industry is important for some MSMEs, particularly those involved in fi elds such as construction. The main distinguishing advantages for the client are simple collateral arrangements; availability of medium- to long-term fi nancing to purchase equipment; more fi nancing (relative to cost of the equipment) than provided by banks; fl exible contracting arrangements; and tax incentives. For the multi-fi nance company, collateral is easier to repossess, despite being movable;30 capital requirements are lower; and there is less supervision than for banks. Presently, the Indonesian leasing industry is heavily dependent upon banks for its fi nancing, and many fi nance companies have joint fi nancing arrangement with banks. While leasing fi rms do reach the lower income segments through products such as motorcycle fi nancing,
A number of signifi cant initiatives have been made in terms of the provision of microinsurance products.31 In 2004, GTZ engaged in a public-private partnership with German insurer Allianz to develop a range of micro-insurance products, with this program being supported by the United Nations Development Program (UNDP). The partners aimed to develop an a range of demand-based private micro-insurance products on a model basis. The resulting study concluded that the legal framework for insurance needed to be strengthened. It also concluded that the capacity of insurance agents needed developing and that market education was necessary.32 As a result of this program, a regulation was issued to allow BPRs to sell insurance as agents of established insurers. Furthermore, a credit life insurance with additional benefi ts covering the loan client, named ‘Payung Keluarga’ (Family Umbrella), was developed.
After one year of pilot testing, more than 30,000 policies were sold with the number of active policyholders exceeding 15,000. GTZ and Allianz were satisfi ed that micro-insurance could be a sustainable, commercially viable business for the insurers. They identifi ed the prerequisites for sustainability as: i) sound product design; ii) a conservative premium calculation; iii) a clear defi nition of benefi ts; and iv) effi cient operations. ProFI continues to monitor regulatory developments and to lobby for a conducive regulatory framework for micro-insurance in Indonesia.
29 This Section draws heavily upon World Bank (2006b), using that report’s defi nition of NBFIs, which excludes MFIs.
30 Technological advances have helped, too. GPS monitors can now be secured inside the equipment, which allows the leasing company to monitor continuously the exact geographical location of the equipment.
31 This paragraph is drawn from GTZ (2007).
32 See http://www.microfi nancegateway.org/content/article/detail/36433

Improving Access to Financial Services in Indonesia40
Chapter 2The Current Supply of Financial Services in Indonesia
Since its establishment, Allianz’s micro-insurance business has grown rapidly. In 2008, the number of policies increased by 400% compared to the previous year, to backspace to more than 178,000. By 2008, Allianz had entered into cooperative agreements with 21 MFIs, including four cooperatives, eleven social foundations, four rural banks and two commercial banks. The main regions in which these products are off ered include Sumatra; Jakarta; West and Central Java; Bali; Sulawesi; and Sumba. By 2009, Allianz expects to attract at least 200,000 new policyholders.33
In a related development, Munich Re-insurance Company (the world’s largest re-insurance company) has teamed up with Indonesian insurer Asuransi Wahana Tata to off er innovative micro-insurance products called ‘Alert 1 Manggarai Protection Card‘, which are index-based fl ood insurance policies available cheaply and easily to low income families in Jakarta.34 The new product was initiated through a feasibility study between Munich Re (as partner and sole reinsurer), Asuransi Wahana Tata and GTZ. In mid-2007, a pilot study was undertaken with the product being made available in 23 sub-districts of Jakarta.
2.8 Financial Services in Support of Remittances
As described in Chapter 5, trade in labor services is potentially very important in the alleviation of poverty. On the international side, large numbers of Indonesians offi cially work overseas (Tenaga Kerja Indonesia, TKI; Table 7), with the total estimated at about 4.3 million (World Bank, 2008). This represents about 4% of Indonesia’s total work force, and many more work illegally. These workers send considerable amounts of money home (that is, remittances), making Indonesia the second largest (after the Philippines) remittance receiver in East Asia and the Pacifi c. These remittances have a direct impact on the reduction of poverty in Indonesia insofar as they boost local consumption and investment. The extent of the impact is, however, in doubt. World Bank (2008a) argues that much of remittances are spent on repaying debt, and on consumption and luxury goods.
Table 7. Offi cial Overseas Worker Placement, 2004
Region/Country of Placement Formal Informal Total Male Female Male Female
Asia-Pacifi c 68,022 47,284 497 45,167 160,970
o/w Malaysia 62,254 43,179 404 21,338 127,175
Hong Kong - - 2 14,181 14,183
Singapore 8 30 25 9,068 9,131
Brunei Darussalam 2,481 3,458 34 530 6,503
Middle East & Africa 609 312 14,930 203,848 219,699
o/w Saudi Arabia 432 191 13,724 189,099 203,446
Kuwait 29 9 1,206 14,745 15,989
Europe & America 17 3 - 1 21
Total 68,648 47,599 15,427 249,016 380,690
Source: Ministry of Manpower and Transmigration, cited in Manning and Cronin (2008)
33 See www.allianz.co.id.
34 The product off ers cheap and easily understood risk protection, specially designed for the local population. There is no lengthy policy document; rather, the insured receives a simple protection card. One card costs Rp50,000 and guarantees a one-time payment of Rp250,000 should the waters rise above 950cm (Alert 1) at the Manggarai Water Gate in Jakarta.

41
Chapter 2 The Current Supply of Financial Services in Indonesia
Despite the large number of Indonesian workers abroad, the total value of international remittances from these workers to Indonesia is small compared to many other comparable countries in the region and elsewhere (see Figure 12). Indeed, in proportion to national GDP, Indonesia does not even come close to being in the top 20 recipients of overseas remittances according to recent indicators. This raises the question of whether Indonesia’s fi nancial infrastructure is suffi ciently developed to support transfers from abroad and whether there are barriers that might be removed through policy changes. This Section looks at these particular issues, which are essentially a subset of the broader issues of access to fi nancial services for migrant workers (see Chapter 5).
Figure 12. Top 20 Developing-country Recipients of Remittances, 2005
(In billions of US$)
0
5
10
15
20
25
India
Mexico
Philippines
China
Lebanon
Morocco
RomaniaEgypt
Pakistan
Bangladesh
Colombia
El Salvador
Brazil
Dominican RepublicRussi
a
IndonesiaBosn
ia
HondurasPeru
Albania
Billi
ons o
f US$
(As per cent of GDP)
0
5
10
15
20
25
30
35
Moldova
Lebanon
Honduras
Bosnia
Tajikist
an
El Salvador
Albania
Philippines
Nicaragua
Dominican Republic
Morocco
Yemen
Armenia
Uganda
Bangladesh
Georgia
Azerb
aijan
RomaniaEgypt
Bulgaria
(Indonesia
)
As %
of G
DP
Source: UNCTAD Handbook of Statistics, 2006-07, cited in Manning and Cronin (2008)
In its examination of international remittances, this report relies upon a recent World Bank report, which, amongst other issues, explores and investigates fi nancial services available for Indonesians working in Malaysia (World Bank, (June 2008a)). As noted in Table 7, Malaysia employs the second largest number of Indonesians working abroad. The issues and policy conclusions for Malaysia are likely to apply for
Improving Access to Financial Services in Indonesia42
Chapter 2The Current Supply of Financial Services in Indonesia
Indonesians working in other major destinations, such as the Middle East and elsewhere in Asia.
To briefl y summarise the fi ndings of this report, the Malaysian-Indonesian study argues that the formal fi nancial sector in its current state does not meet the need for fi nancial services of the migrant worker. Amongst other points, the services provided by the formal fi nancial sector are uncompetitive in terms of accessibility and the range of products off ered. The formal sector little little fi nancial literacy training and few pre-departure credit products, especially for illegal workers. This poor service accounts for the large number of informal agents, many of whom exploit migrant workers for their own purposes. The report concludes (p. 49) that migrants are often trapped in cycles of continuous migration as their families become dependent upon the remittances. Although these abuses at home dilute the value of having a family member working abroad, it is hard to imagine that the family is fi nancially worse off as a result of the family member working abroad. Indonesian bankers claim that credit risk is the biggest barrier in the face of extending services, particularly if the worker is overseas commercial banks off ering personal loans might consider making a loan if there was a co-signer or guarantor, probably a family member in the home village, in Indonesia35. However, in these cases, the co-signer’s creditworthiness is the principal consideration, not the potential income fl ow from the migrant worker. In discussing the provision of remittance services, a major Indonesian bank with representative offi ces in Hong Kong and Kuala Lumpur said that the bank values the remittance business of migrant workers because of the fee income. With many of the remittance services off ered by such banks, the migrant worker can place cash with a representative offi ce of overseas for it to be immediately delivered to one of their many branches in Indonesia without the recipient needing to hold an account with that bank. That bank’s staff believe that the remittance services they off er are very competitively priced, at least in Hong Kong. For its part, Bank BRI reports large incoming and outgoing remittance transfers, with the total value of these remittances increasing by more than 65% in 2007 compared to the previous year.36
In terms of the provision of services to domestic migrant workers, studies have noted that there is a high level of fl exibility in Indonesia’s labor markets,37 with a high degree of inter-island and rural-urban mobility. Data on the volume of domestic transfers are diffi cult to track down. 38 however, the importance of cheap, convenient methods for transferring money—perhaps in relatively small amounts—from workers in the cities to their families back in the villages is self-evident.
This study shows that a number of well designed products that facilitate domestic remittances are available (Table 8). If the sender values convenience and speed, Western Union is the best option, particularly as it has more outlets than any other service provider in Indonesia. Indeed, its network is roughly twice as large as that of BRI. However, Western Union is expensive for small transfers, with the cost of these transfers amounting to more than 15% of the total value of the remittance for amounts less than Rp 750,000. The cost drops off sharply as the size of transfer rises, although these costs are still high. For example, to transfer the sum of Rp 37 million, the cost of a transfer amounts to 5% of the total value of the remittance.
35 Field reports indicate that BRI is conducting a pilot project for credit to migrant workers, to be co-signed by family members. Details could not be confi rmed with BRI, but the development sounds encouraging and further collaboration could be explored by development partners with special interests in this area.
36 See Bank BRI Annual Report for 2007, p. 62.
37 See, for example, Manning (2000).
38 Work related to this area includes a study on internal migration, pending from Australian National University.

43
Chapter 2 The Current Supply of Financial Services in Indonesia
Table 8. Cost of Domestic Remittances, April 2009
Service Provider Cost Notes
BRI (to BRI) Free within Jabotabek. Excludes Unit Desas in very remote locations (i.e. off -line).
Rp2,000 for <5,000,000. Cost rises to Rp20,000 for Unit Desas not on-line.
Rp3,000 for >5,000,000. Likely takes 3 days or more to reach off -line Unit Desa.
Small additional charge if above Rp 50,000,000.
Receiver must have a BRI account.
BRI (to other bank) Rp25,000 if <12 PM.Cost rises to Rp100,000, if 2-3 PM.
Money is transferred through the regular bank clearing system.
Western Union Rp112,500 for < Rp750,000. Instantaneous delivery to all 10,000 locations in Indonesia.
Costs rise in 18 steps, to Rp6,000 stamp duty paid by receiver if receiving outlet is physically located in a bank.
Rp1,750,000 for transfers from Rp37,500,001 to Rp41,250,000.
Larger amounts can be sent, but costs are not published locally.
Money Gram Does not remit domestically.
Post Offi ce Rp11,000 for <200,000. Sender must return subsequently, if sending from a small post offi ce.
Cost rises to Rp21,000 if Cost rises by Rp2,000 to 12,000 for ‘Instant’ service, which is only available in large post offi ces.
Rp10 -25 million. Recipient may live some distance from the local post offi ce.
For regular remittances, special arrangements can be made for local delivery from large offi ces, but courier requires a ‘tip’.
Money order is electronically, not by regular post.
Source: World Bank fi eld research.
There are other very cheap, fast options available when the recipient is the holder of a BRI account39 or if the recipient lives near a large post offi ce. BRI’s cost is extremely low, representing only around 0.5% of the total value of the remittance. In addition, if the Unit Desa branch is on-line, service is fast. The service available through the post offi ce is also cheap, although not as cheap as that off ered by BRI (see Table 8).
If the recipient lives in a very remote location, the options are services available through BRI’s Unit Desa or the post offi ce, if the recipient does not have a bank account. Financial costs are still low, although the time taken for the remittance to become available to the recipient increases to 3 days or more. In addition, there may be additional, informal delivery charges (Table 8).
39 BRI off ers transmission to branches of other banks, still at very low cost (roughly ½ of 1%) in the mornings. However, the cost rises sharply in the course of the clearing day (see Table 8).
Improving Access to Financial Services in Indonesia44
Chapter 2The Current Supply of Financial Services in Indonesia
2.9 Summary of Policy Issues, by AreaThis section summarizes the policy issues that are raised by this Chapter. Policy recommendations are provided in Chapter 6.
Analytics of the Issue: The analytical evidence of this Chapter indicates that on a provincial basis, per capita income and population density are strongly and positively correlated with the availability of services provided by Indonesia’s commercial banking system. The only notable exceptions are Jakarta,which is ‘over-serviced’ and East Kalimantan, which is large, resource rich, sparsely populated and is relatively ‘under-serviced’. The availability of fi nancial services in all other provinces is more or less positively correlated with levels of per capita income. In order to identify ‘under-serviced’ regions, it is necessary to extend the examination beyond the provincial level to the district and subdistrict level. This issue is taken up in the next Chapter.
Conventional Commercial Banks: Indonesia’s commercial banks are opportunistic, profi t-oriented institutions that will move aggressively into new, commercially viable markets. The evidence of this Chapter indicates that they have quite a wide regional reach, although the range and extent of services they off er to the poorer strata of Indonesian society is limited. Virtually all of the conventional commercial banks target the more lucrative middle income and higher segments in preference to the lower income segments. The implications of this are discussed in the next Chapter.
However, the commercial banks have two important roles to play in extending access to fi nancial services. First, banks have the fi nancial and other resources to develop and introduce new technologies to deliver relatively high-cost services to low-income clients in remote areas. Recent technological advances, such as mobile banking, discussed later in this report, have interesting potentialities in this regard, with technology having the potential to reduce unit costs to the point where services can be extended at aff ordable prices to the poorer strata of society, even in remote regions of the country. Second, the banks put competitive pressures on the other service providers, which holds down prices and improves the quality of services. This competitive pressure also facilitates the expansion of fi nancial services.
BRI’s Unit Desa System: This is Indonesia’s premier micro-fi nance provider, and its client base is among the largest in the world. Nonetheless, questions remain as to whether the reach of the Unit Desa system is suffi cient to service lower income clients. To extend its current reach—at least until lower-cost technologies are available—a policy decision on the part of the bank’s management and its regarding current fee structures and lending policies may be required. Higher interest rates on its major lending products to micro borrowers may be needed make loans to lower income clients more commercially attractive. Alternatively, might place additional fees for the administration of small loans, with the size of the fee roughly proportional to the additional costs of supervising small loans.
People’s Credit Banks (BPRs): These institutions have signifi cant potential to extend access to fi nancial services to lower income households and MSMEs. In large part, this is true because they are relatively low-cost operations and because they have better local knowledge than regular commercial banks. To support the extension of fi nancial services through these institutions, however, Bank Indonesia must continue to take measures to strengthen the regulatory environment and to improve the capacity of these institutions in order to protect the public against unviable banks.
In this regard, recent developments have been encouraging. For example, the 15 BPR failures since 2004 have been handled without any marked loss of public confi dence. Another encouraging development is that Bank Indonesia appears to be considering changing its current regulatory framework according to

45
Chapter 2 The Current Supply of Financial Services in Indonesia
which all BPR are governed by the same regulations, regardless of size, to a new approach in which the BPR may be divided into three categories, depending on their size. This new approach appears to be promising and is discussed with further suggestions in Chapter 5.
Other Micro Finance Institutions: a new Micro-Finance Law has been under discussion and in draft for many years. The fi nalisation of this legislation and its eventual implementation is a critical element for the further development of these institutions. Also, there are several government programs that off er subsidized credit to special groups in the Micro Finance segment, and there is signifi cant room for improvement in many of these programs.
Regarding other issues this sub-sector, NGOs off er an important range of services to clients in the lowest income brackets, often in the country’s most remote regions. Since Indonesia’s shift to democracy, there has been considerable expansion of NGO services. However, further development is certainly possible. These possibilities are explored in Chapter 4, together with measures that might be implemented to strengthen cooperatives and pawnshops.
Sharia Banking: This type of service provider, although still serving a small market segment, is very important in terms of expanding access to fi nancial services in Indonesia. Sharia banking has been expanding rapidly for the past decade or so, with Sharia rural banks off ering bed services almost exclusively to the poor. In addition, a major Sharia bank is a market leader in terms of implementing technological innovations that extend fi nancial services to the poor and to residents of remote areas.
The key issue for policymakers is how to continue progress at a sustainable pace. Two issues arise in this context. First, rapid expansion may be masking serious problems, such as the relatively high rate of non-performing loans, the eff ect of which may become apparent only after the growth in assets and liabilities eventually stabilize at levels closer to industry averages. And second, the current political popularity of Sharia fi nancing might undermine strong, eff ective regulation and supervision.
Non-bank Financial Institutions: With some notable exceptions, particularly in terms of leasing and micro-insurance products, the majority of NBFIs currently off er products of limited relevance to poor households and MSMEs. Creating new, more relevant product lines will require innovative thinking. There are some good examples of such innovative thinking, involving the development of products such as micro-fl ood insurance and micro-life insurance. Public-private partnerships, like that established between Alliance AG and bank Indonesia, and supported by GTZ and the UNDP, may help foster the development of such innovative thinking. However, this must be supported by a stronger legal framework; capacity development for insurance agents; and market education.
Remittances: This report fi nds no evidence of any serious problems in the area of fi nancial services that facilitate remittance payments. There are several good options available, depending upon the circumstances and interests of sender and receiver. Even for the most remote locations, there are good, cheap options whose only disadvantage compared to services are available in major city centres is a delay of a few days or more. Issues concerning international remittances are discussed at the end of Chapter 5, together with more general issues related to migrant workers and the fi nancial services required by and available to them.

Improving Access to Financial Services in Indonesia46
47
Chapter 3
Demand-side Aspects: What do People Want?
3.1 Introduction and OverviewThe entire analysis in this Chapter is based on two nationally representative surveys on Access to Finance (A2F) in Indonesia (see Box 7). The results of the fi rst large survey, which is of households, is summarized in Box 8, while its technical details, including a discussion of the diff erences between a household survey and an individual survey and of the various merits of each, are described in Annex B. The second survey, of village heads, is much shorter and complements the material found in Chapter 2.
The household survey was designed with several important goals in mind. First, it was intended to facilitate the identifi cation and understanding of Indonesian households’ access to fi nancial services. This includes a discussion of access facilitated through all institutional sources of fi nancial services, including banks, non-bank fi nance companies, micro-fi nance institutions, insurance companies, informal money lenders, community based welfare schemes and savings associations, family and friends as well as all types of access. On the savings side, this includes everything from bank accounts to savings in community welfare schemes. On the borrowing side, it includes everything from bank loans to loans provided by moneylenders.
A second goal of the survey is to identify existing constraints to accessing fi nancial services. On the demand-side, these are income barriers, cost, fi nancial literacy and so forth. Innovative public-private partnerships, possibly with the involvement of development partners, are required to identify the major, on-going supply-side constraints and to fi nd solutions that can be pilot-tested in the market.
A third goal is to determine the extent of the potential, unmet demand for fi nancial services. Specifi cally, this means measuring the scope of unmet demand for certain fi nancial products, including savings, loans,
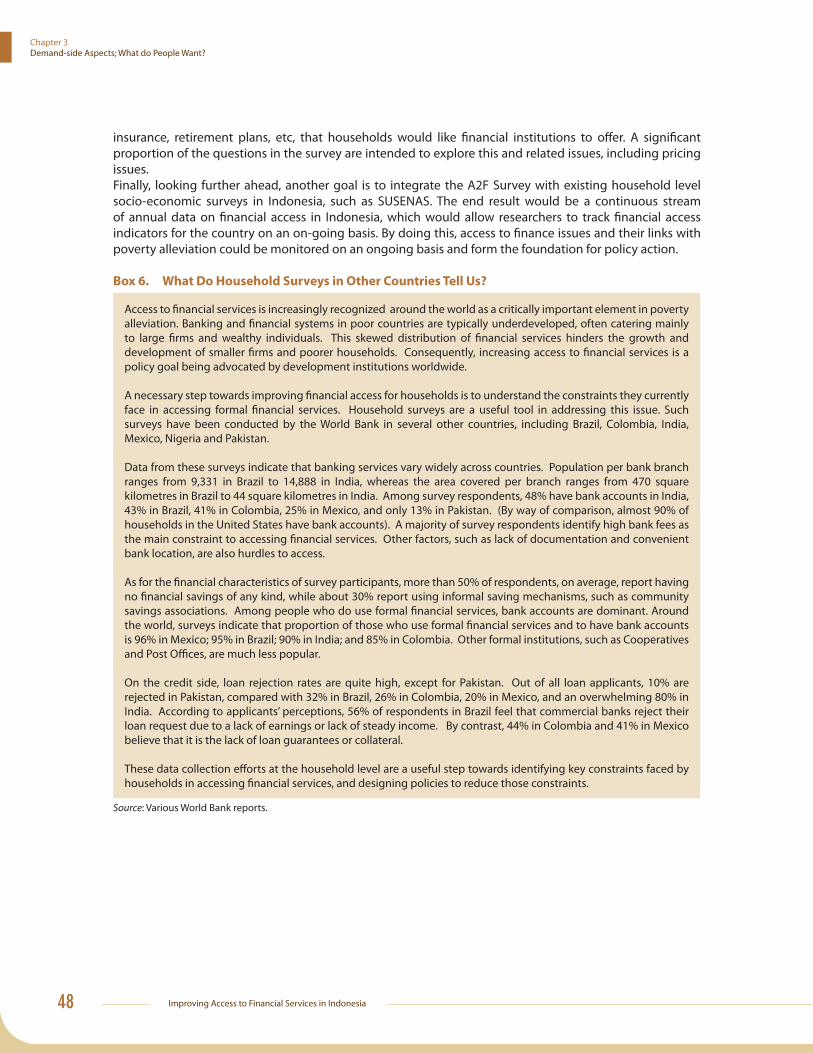
Improving Access to Financial Services in Indonesia48
Chapter 3Demand-side Aspects; What do People Want?
insurance, retirement plans, etc, that households would like fi nancial institutions to off er. A signifi cant proportion of the questions in the survey are intended to explore this and related issues, including pricing issues. Finally, looking further ahead, another goal is to integrate the A2F Survey with existing household level socio-economic surveys in Indonesia, such as SUSENAS. The end result would be a continuous stream of annual data on fi nancial access in Indonesia, which would allow researchers to track fi nancial access indicators for the country on an on-going basis. By doing this, access to fi nance issues and their links with poverty alleviation could be monitored on an ongoing basis and form the foundation for policy action.
Box 6. What Do Household Surveys in Other Countries Tell Us?
Access to fi nancial services is increasingly recognized around the world as a critically important element in poverty alleviation. Banking and fi nancial systems in poor countries are typically underdeveloped, often catering mainly to large fi rms and wealthy individuals. This skewed distribution of fi nancial services hinders the growth and development of smaller fi rms and poorer households. Consequently, increasing access to fi nancial services is a policy goal being advocated by development institutions worldwide.
A necessary step towards improving fi nancial access for households is to understand the constraints they currently face in accessing formal fi nancial services. Household surveys are a useful tool in addressing this issue. Such surveys have been conducted by the World Bank in several other countries, including Brazil, Colombia, India, Mexico, Nigeria and Pakistan.
Data from these surveys indicate that banking services vary widely across countries. Population per bank branch ranges from 9,331 in Brazil to 14,888 in India, whereas the area covered per branch ranges from 470 square kilometres in Brazil to 44 square kilometres in India. Among survey respondents, 48% have bank accounts in India, 43% in Brazil, 41% in Colombia, 25% in Mexico, and only 13% in Pakistan. (By way of comparison, almost 90% of households in the United States have bank accounts). A majority of survey respondents identify high bank fees as the main constraint to accessing fi nancial services. Other factors, such as lack of documentation and convenient bank location, are also hurdles to access.
As for the fi nancial characteristics of survey participants, more than 50% of respondents, on average, report having no fi nancial savings of any kind, while about 30% report using informal saving mechanisms, such as community savings associations. Among people who do use formal fi nancial services, bank accounts are dominant. Around the world, surveys indicate that proportion of those who use formal fi nancial services and to have bank accounts is 96% in Mexico; 95% in Brazil; 90% in India; and 85% in Colombia. Other formal institutions, such as Cooperatives and Post Offi ces, are much less popular.
On the credit side, loan rejection rates are quite high, except for Pakistan. Out of all loan applicants, 10% are rejected in Pakistan, compared with 32% in Brazil, 26% in Colombia, 20% in Mexico, and an overwhelming 80% in India. According to applicants’ perceptions, 56% of respondents in Brazil feel that commercial banks reject their loan request due to a lack of earnings or lack of steady income. By contrast, 44% in Colombia and 41% in Mexico believe that it is the lack of loan guarantees or collateral.
These data collection eff orts at the household level are a useful step towards identifying key constraints faced by households in accessing fi nancial services, and designing policies to reduce those constraints.
Source: Various World Bank reports.

49
Chapter 3 Demand-side Aspects; What do People Want?
Box 7. What Do Other Surveys for Indonesia Tell Us?
Several other surveys in Indonesia address issues more or less related to access to fi nance.BRI’s 2003 MASS Survey (see Box 2) is the most extensive alternative survey on access to fi nancial services in Indonesia. It estimates that less than 50% of rural households have access to banking services. It also provides other important details that are summarized in Box 2.
Other studies on this topic are more specialized, with a signifi cant proportion addressing MSMEs’ access to credit. These surveys tend to yield information on access to fi nancial services as a by-product of other analysis. For example, a 2003 study by the Banking With The Poor network (see http://www.bwtp.org/arcm/Indonesia/) cites several secondary sources indicate that a majority of rural households do not have access to semi-formal or formal institutions as a source of funds. The same study asserts that less than 25% of microenterprises have access to credit from a formal institution.
The Bank Indonesia’s 2005 survey of SMEs showed that approximately 71% of micro business capital is raised through self-fi nancing, while 29% is borrowed from friends, business partners and families. More details on BI’s survey are provided in Chapter 5.
The World Bank’s Rural Investment Climate Assessment (RICA; 2006) devoted an entire chapter to constraints on accessing credit by rural non-farm enterprises. It found that access to credit was the second most important constraint for the 15.7 million micro and small enterprises in rural Indonesia and demonstrated that access to credit is a far bigger constraint the cost of credit. It recommends against subsidies to make borrowing cheaper, but rather encourages incentives for extending the reach of the commercial banking sector to connect with rural household enterprises. The RICA survey indicated that borrowers believed their major constraints to be: collateral requirements; the perceived complexity and cost of application procedures; and the legal standing of the enterprise in question, particularly given the high costs of registration of a business to fulfi l the requirements set by formal lending institutions. For their part, banks feel constrained by the cost of collecting the information that allows them to identify which micro and small enterprises are good credit risks.
Box 8. Sampling Methodology of the Indonesian Survey
The sample selection methodology was designed to ensure national representation. Multi-stage random sampling was employed with population-weighted selection occurring fi rst at the province level, next at the sub-province (Kabupaten/Kota) level, and fi nally at the village (RW) level. Overall, four provinces on Java and six provinces outside Java were selected. The provinces in Java included Banten, West Java, Central Java, East Java, while provinces outside Java included Aceh, Jambi, West Kalimantan, North Sulawesi, Maluku, and Nusa Tenggara Barat.
Out of the four selected provinces in Java, 16 population-weighted sub-provinces were chosen at random. Within each of these 16 sub-provinces, four population-weighted villages (RW) were chosen at random, resulting in a total sample of 64 villages. The selection was stratifi ed according to existing between urban and rural, with the fi nal sample containing 34 urban villages and 30 rural villages.
Outside Java, one population-weighted province was chosen within each six regions, these being 1) Northern Sumatra, 2) Southern Sumatra, 3) Bali-Nusa Tenggara, 4) Kalimantan, 5) Sulawesi, and 6) Maluku-Papua. Next, within each of these provinces, two population-weighted sub-provinces were chosen at random. Finally, within each of these 12 sub-provinces, four population-weighted villages (RW) were chosen at random, resulting in a sample of 48 villages. The urban/rural stratifi cation resulted in a fi nal sample of 18 urban villages and 30 rural villages, with the predominance of rural villages in the explained by the overwhelmingly rural nature of these areas outside Java. .
Within each of the 112 villages in the survey, 30 households were randomly selected in each village for survey interviews, resulting in a fi nal sample set of 3,360 survey household respondents (1,920 on Java and 1,440 off Java closely equal to 60:40 ratios).
An outline of the characteristics of the respondents is provided in Annex B in the section entitled “Some Characteristics of Access to Finance Sample Respondents”.
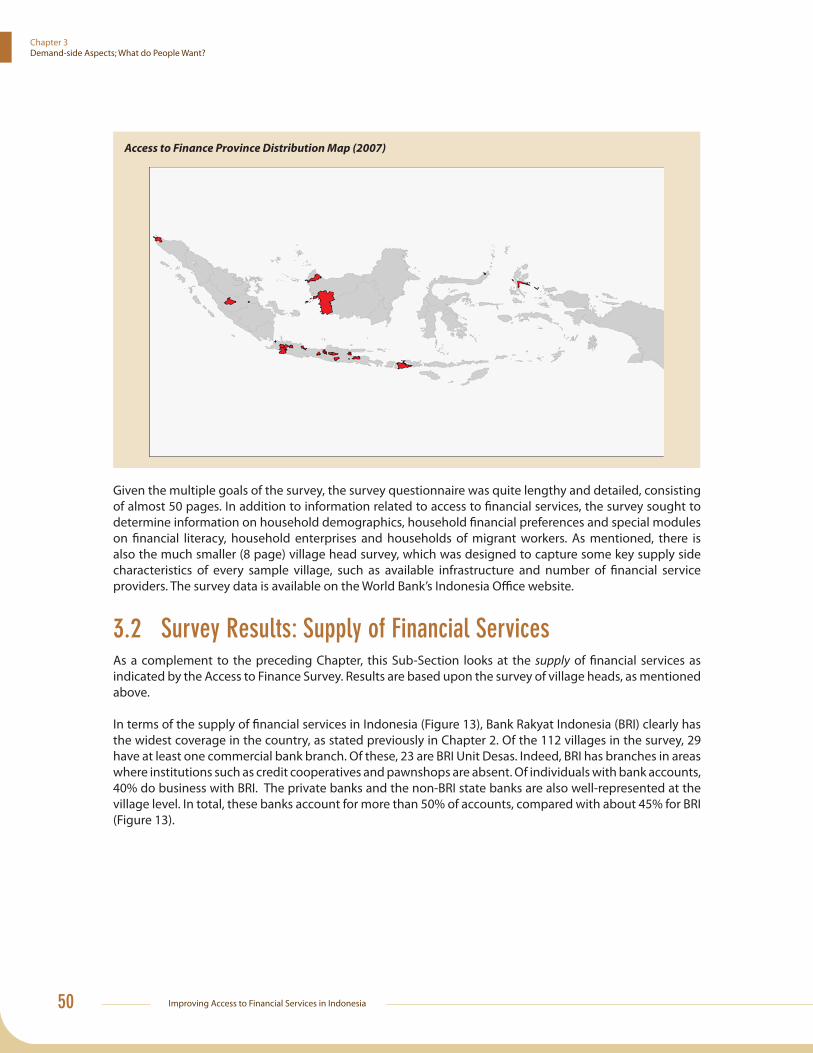
Improving Access to Financial Services in Indonesia50
Chapter 3Demand-side Aspects; What do People Want?
Access to Finance Province Distribution Map (2007)
Given the multiple goals of the survey, the survey questionnaire was quite lengthy and detailed, consisting of almost 50 pages. In addition to information related to access to fi nancial services, the survey sought to determine information on household demographics, household fi nancial preferences and special modules on fi nancial literacy, household enterprises and households of migrant workers. As mentioned, there is also the much smaller (8 page) village head survey, which was designed to capture some key supply side characteristics of every sample village, such as available infrastructure and number of fi nancial service providers. The survey data is available on the World Bank’s Indonesia Offi ce website.
3.2 Survey Results: Supply of Financial ServicesAs a complement to the preceding Chapter, this Sub-Section looks at the supply of fi nancial services as indicated by the Access to Finance Survey. Results are based upon the survey of village heads, as mentioned above.
In terms of the supply of fi nancial services in Indonesia (Figure 13), Bank Rakyat Indonesia (BRI) clearly has the widest coverage in the country, as stated previously in Chapter 2. Of the 112 villages in the survey, 29 have at least one commercial bank branch. Of these, 23 are BRI Unit Desas. Indeed, BRI has branches in areas where institutions such as credit cooperatives and pawnshops are absent. Of individuals with bank accounts, 40% do business with BRI. The private banks and the non-BRI state banks are also well-represented at the village level. In total, these banks account for more than 50% of accounts, compared with about 45% for BRI (Figure 13).

51
Chapter 3 Demand-side Aspects; What do People Want?
Figure 13. Bank Account Distribution, by Type of Bank
31,0
20,5
2,8
1,0 0,2
BRI UnitState Bank non BRI UnitPrivate BankBPRSyariah BankOther
44,5
The rate of coverage at the village level (29 out of 112 villages) is not particularly impressive. However, follow-up questions indicated that 109 of the 112 villages used commercial bank services, even if the physical infrastructure was not present in their village. Also, the vast majority of villages believe that bank branches are well-located with all but 6% of respondents reporting that bank branches are conveniently or very conveniently located (Figure 14).
Figure 14. Bank Branch Locations
10.4%
83.5%
6.1%
Very Convenient Convenient
Inconvenient
Bank Branch Locations
Not surprisingly, physical access varies between rural and urban areas (Figure 15);. As might be expected, more sparsely populated areas are served by fewer bank outlets. In rural areas, the average travel time to the nearest branch is more than 25 minutes for almost 35% of the respondents, while this was true of less than 12% of respondents in urban areas. Indeed, for the respondents in urban areas, a bank branch is located within 10 minutes traveling time for 62%, while this was true for only 31% of respondents in rural areas.

Improving Access to Financial Services in Indonesia52
Chapter 3Demand-side Aspects; What do People Want?
Figure 15. Travel Time to Nearest Bank Branch
0
10
20
30
40
Percent
<= 10 min 11-15 min 16-25 min > 25 min <= 10 min 11-15 min 16-25 min > 25 min
Rural
Time Average for Traveling toNearest Bank Branch
0
20
40
60
Percent Urban
Time Average for Traveling toNearest Bank Branch
Looking in more detail at the issue of travel to bank branches (see Table 9), it can be seen that public transport is the most common method of travel, followed by bike/motorcycle and by foot, with the use of a personal car being quite infrequent. There is relatively little diff erence in time requirements as between savers and non-savers (see the middle columns of Table 9). However, the rupiah cost is generally considerably higher for savers than non-savers. Since savers actually use banking services while non-savers do not, this indicates that both groups have a good idea of where the physical outlets are located, although non-savers have less of an idea about how much it actually costs to get there. Table 9. Travel to Banks, Time & Cost
Respondent Average time (minutes) Average cost (rupiah)
(One way trip) Savers* Non-savers Savers Non-savers Savers Non-savers
On foot 148 342 13 15 1,193 926
Bike/Motorcycle 777 722 18 20 2,586 3,119
Personal car 71 6 17 20 8,830 3,208
Public transportation 293 603 22 22 3,781 2,988
Water transportation 4 6 356 263 186,531 4,830
Other (mainly becak) 13 18 72 67 42,904 2,615
*Bank savers
The available data can be broken down according to distinctions between urban/rural and Java/off -Java locations (Tables 10 and 11). For bank savers (Table 10), average times for urban residents are very similar when comparing respondents in Java/off -Java locations. However, there are striking diff erences when comparing urban/rural respondents, with rural savers on-Java requiring approximately 50% more time than urban residents. With respondents off Java, the distinction was even more striking, with respondents in the rural areas requiring far more time than those in urban areas (2-10 times), especially if water transport is involved. Rupiah costs also vary markedly. The rupiah cost is lowest for on-Java urban residents, slightly higher for off -Java urban residents, and far higher for those who live in rural areas. Again, the cost is particularly high when water transport is required.

53
Chapter 3 Demand-side Aspects; What do People Want?
Table 10. Saver’s Travel to Banks, by Urban/Rural & Java/Off Java
Average time (minutes) Average cost (rupiah)
Urban Rural Urban Rural
(One way trip) Java Off -Java Java Off -Java Java Off -Java Java Off -Java
On foot 11 11 15 171 225 850 1,426 93,326
Bike/Motorcycle 12 14 22 28 2,142 3,181 2,669 5,109
Personal car 11 12 24 36 5,907 3,976 14,070 9,272
Public transportation 15 18 26 109 2,583 3,836 3,365 27,636
Water transportation NA 24 NA 392 NA 402,577 NA 137,535
Other 21 24 21 392 27,314 402,577 3,517 137,535
For non-savers, the travel pattern is similar to that of savers, but with less pronounced variation between regions (Table 11). It is also notable that the rupiah cost estimates by non-savers are much lower than savers’ costs in rural locations, particularly off -Java, suggesting that the actual transportation cost may be contributing to exclusion in those areas.
Table 11. Non-savers’ Travel to Banks, Urban/Rural & Java/Off -Java
Average time (minutes) Average cost (rupiah)
Urban Rural Urban Rural
(One way trip) Java Off -Java Java Off -Java Java Off -Java Java Off -Java
On foot 14 13 15 69 783 661 1,017 4,485
Bike/Motorcycle 11 9 20 40 1,941 2,990 2,967 6,813
Personal car 15 NA 16 31 3,000 NA 2,356 5,556
Public transportation 15 15 19 50 2,541 2,227 2,565 5,834
Water transportation NA 10 NA 277 NA 5,000 NA 4,805
Other 5 10 21 277 3,000 5,000 2,300 4,805
The various travel times noted above may seem excessive. However, by local standards, the averages actually compare favourably to key public services (see Figure 16). For example,40 some 48% of Indonesians can reach a bank branch in less than 10 minutes compared to the 7% of Indonesians a public hospital in the same time. By contrast, approximately 28% can reach a Puskesmas (a basic health facility) and approximately 57% can reach a school in the same time. At the other end of the scale, only about 7% of Indonesians require more than 30 minutes to reach a bank branch, which is similar to the proportion who require that time to reach a school school, and far better than proportion of 33% who require that time to reach a Puskesmas and 69% who require that time to reach a public hospital. These data indicate only modest diff erences in physical access as between those who already have a bank account (savers) and those who do not (non-savers; see Figure 16).
This comparison is important for policy purposes when allocations of public funds are involved. In particular, it suggests that public monies would be well spent on improving physical access to key public services such as basic health and education facilities – physical access to fi nancial services would improve in line with such overall improvements. Other instruments, such as policies governing competition, would be more appropriate for improving access to fi nancial services.
40 World Bank, Governance and Decentralization Survey. See http://www.dsfi ndonesia.org/apps/dsfv2/cgi-bin/dw.cgi

Improving Access to Financial Services in Indonesia54
Chapter 3Demand-side Aspects; What do People Want?
Figure 16. Average Time to Reach Select Institutions
0 20 40 60 80 100
more than 30 min
> 15 to 30 min
> 10 to 15 min
Up to 10 min
SchoolPublic HospitalPuskesmasBank (Non-savers)Bank (savers)
%
47.8
23.7
21.9
6.5
44.1
26.5
20.7
8.7
27.6
16.7
22.6
33.1
6.6
6.8
17.8
68.8
56.3
16.7
20.4
6.6
Once inside a bank, the average time spent waiting to be served is fairly short. More than a third of clients are served within 10 minutes of arrival, with less than 18% of clients in rural areas stating that they had to wait for more than 30 minutes to be served. Wait times are fairly uniform when the responses of those in urban and rural areas are compared (Figure 17).
Figure 17. Waiting Time to be Served in a Bank
17.8
30.5
18.3
33.4
12.4
22.3
26.6
38.8
0 10 20 30 40 Percentage
Rural
Urban
>30min
>15-30min
>10-15min
<= 10min
>30min
>15-30min
>10-15min
<= 10min
Urban vs Rural
To summarize, these results suggest that in urban areas, the physical proximity of bank branches is not a constraint to fi nancial access. Once inside a bank, processing and waiting times also do not appear to be a signifi cant constraint. In rural areas, where distances are longer and transportation is more diffi cult, it takes substantially longer to get to bank branches and hence this may pose something of a supply-side impediment. Nevertheless, according to survey respondents and their assessments of convenience, it is not

55
Chapter 3 Demand-side Aspects; What do People Want?
a signifi cant barrier. As stated previously, the time taken to travel to a bank branch compares favourably to the time taken to travel to key public services, such as health care facilities and schools.
These results have implications for for policy. In subsequent sections, the demand analysis by product is presented for urban and rural areas separately and the diff erences are statistically tested. For policy, it is important to know why access is low, even if physical accessibility is not a problem, and whether something can be done about the constraints.
3.3 Survey Results: Demand for Types of Financial ServicesFigure 18. Financial Products Used by Households
2,5
2,9
2,9
4,5
5,3
6,1
10,2
17,4
19,6
19,7
25,9
40,6
0 10 20 30 40 50
Credit Card
M - banking
Loan from Pawn Shops
Loan from Employer
Loan from Daily Bank
Community Welfare Program
Loan from MFI
Loan from Bank
ATM/Debit Card
On Credit from Local Shop
Loan from Neighbors, Family, & Friend
Bank Savings A ccount
Financial Services Used by Households
%
This Chapter now turns to results of the household survey. Beginning at a broad level, the survey results indicate that there is a demand for a wide range of fi nancial services (see Figure 18). Of services in demand, the single most important is a bank savings account, with 40% of respondents having a bank savings account compared with only 17% who have a bank loan. Other types of credit services rank high, too, but these services are mainly provided by informal sources and institutions, such as friends and family (26%) and local shops (20%). ATM and debit cards are relatively popular (20%), but mobile banking and credit cards rank at the very bottom of the list.
3.4 Survey Results: Demand for Savings Accounts
Much of the higher-level survey information on Indonesia’s savers is summarized in Figure 19 (for borrowers, see Figure 28 in Section 3.5). Roughly
one third of the population in Indonesia does not save at all, formally or informally, and might be considered ‘fi nancially excluded’. Considering the remaining 68% of households who do save, 50% do so at a formal savings institution and the remaining 18% save informally via community welfare schemes or informal savings clubs. Decomposing the 50% who save at a formal institution, only 47% of the population saves using formal banks and 3% use other formal institutions, such as cooperatives and credit unions.
These data point to an important weakness in the Indonesian banking system’s ability to provide access to fi nancial services. Specifi cally, less than half (47%) of the total population save in a bank, and the majority of these save informally, too. This is striking evidence of the limited extent to which Indonesia’s banks actually deliver services to the great bulk of the country’s population.

Improving Access to Financial Services in Indonesia56
Chapter 3Demand-side Aspects; What do People Want?
Figure 19. Summary of Survey Results for Savers
Looking in more detail at the 68% who are ‘fi nancially served’, there is a great deal of overlap among their use of formal institutions (Figure 20). In particular, savers who use banks also actually make much greater use other formal and informal providers (30.1% versus 16.6%). Also, among ‘exclusive use’ savers, informal vehicles, such as community welfare or informal savings clubs, are the most important category, accounting for 18.2% compared to 16.6% for banks and 1.2% for other formal institutions.
Figure 20. Overlap Among Savings Providers
16.6%
2.6%
20%
18.2%
1.2%
7.5%
1.9%
BanksksFoFormal O Otherer
Infoformal
3131.9%No Accccount
The survey continued with an attempt to determine why the ‘fi nancially served’ respondents saved, with these results broken down according to the type of bank or other institution which they saved (see Figure 21). The most common response related to ‘security’, which underscores the importance of prudential supervision of savings institutions and the maintenance of fi nancial stability. It was notable that respondents who kept their savings at Sharia banks were particularly likely to cite security as the main reason why they

57
Chapter 3 Demand-side Aspects; What do People Want?
saved. This suggests that the rapid growth of this sector may be the result of new clients participating in formal banking for the fi rst time because they are attracted by the perceived safety of Sharia banking. For most depositors (other than those at BPRs, which often have very limited transfer capacity), it was also very important that they be able to transfer money and borrow money. Other reasons cited by respondents for maintaining savings accounts were relatively insignifi cant.
There is some regional variation in the pattern of responses to the survey. Most notably, respondents in urban areas tended to save in formal institutions primarily for predicted future needs. By contrast, respondents in rural areas were signifi cantly more motivated by a desire to gain access to loans. There were also some signifi cant gender diff erences. In particular, male respondents were more likely to be motivated to have a bank account in order to obtain a formal loan, while women were more likely to be motivated to have a bank account in order to save for future needs.
Figure 21. Reasons for Having a Bank Account, by Type of Bank
3.4.1 Barriers to Accessibility: Reasons for Savers Being Unbanked
Turning to those who are ‘unbanked’, those who do not save and do not maintain accounts at any form of fi nancial institution, the Survey attempted to determine the major constraints to having a bank account (see Figure 22). By far the most common response of respondents in this category (almost 80%) was the perceived lack of money to make saving possible. The second most common reason was ‘Do not have a

Improving Access to Financial Services in Indonesia58
Chapter 3Demand-side Aspects; What do People Want?
job’ (about 10%), which is highly correlated with not having any money. An insignifi cant proportion of respondents gave other reasons for not having accounts including, ‘Don’t understand banks’ (3.1%) and ‘Do not see the advantage of having a bank account’ (3.6%).
It is striking that the least signifi cant constraints in the face of holding savings account were ‘Bank fees are too high’; ‘Distance to the bank’; and ‘Deposit rates are too low’. This confi rms the point, noted above, that long travel times to reach facilities of all diff erent kinds are considered normal in rural areas. Thus, they are not perceived to be an inconvenience. This is probably because the opportunity cost is lower for people in rural areas, their incomes being lower, on average. Also, these results suggest that the great majority of bank savers are not particularly concerned about interest rates. Figure 22. Main Reasons for Not Having a Bank Account
The Survey also sought to break down the perceived constraints in the face of holding savings account in terms of income level (see Figure 23)41 with all the respondents stratifi ed into ten income deciles. Across all
41 In this report, the measure of ‘income’ is actually household consumption, because estimates of expenditure are typically more reliable than estimates of income. In general, the results noted throughout this report also apply for household income, although the relationship isn’t quite as tight.
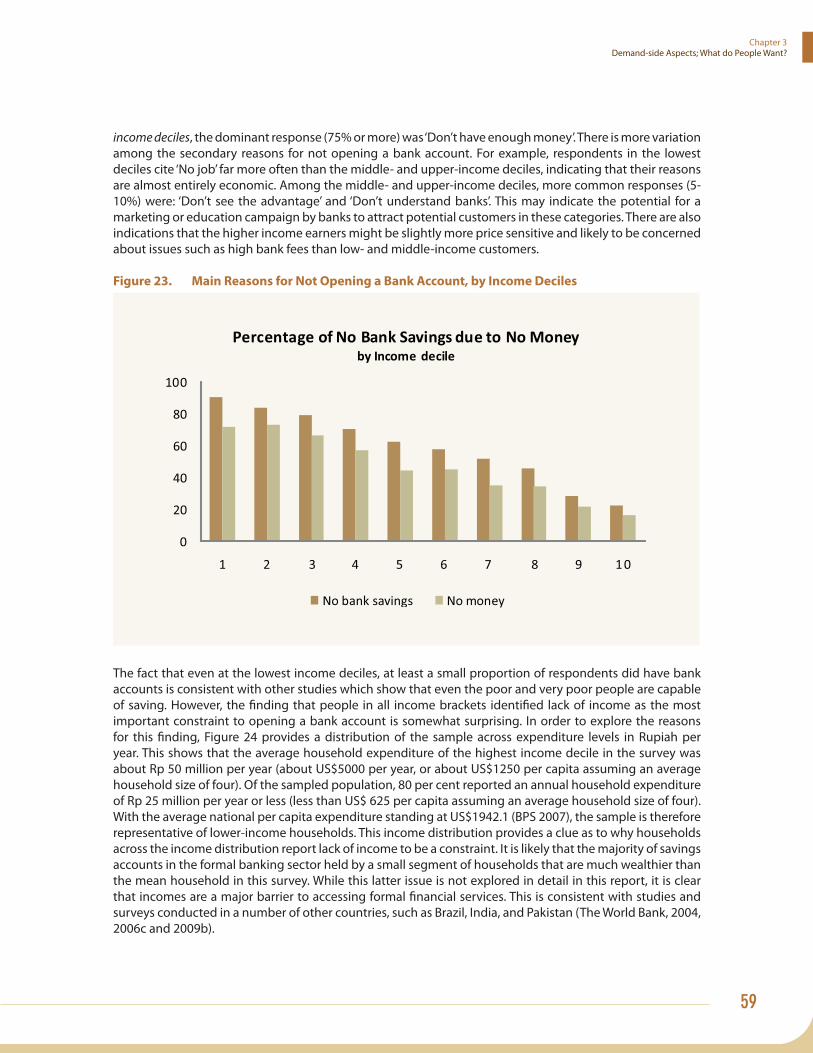
59
Chapter 3 Demand-side Aspects; What do People Want?
income deciles, the dominant response (75% or more) was ‘Don’t have enough money’. There is more variation among the secondary reasons for not opening a bank account. For example, respondents in the lowest deciles cite ‘No job’ far more often than the middle- and upper-income deciles, indicating that their reasons are almost entirely economic. Among the middle- and upper-income deciles, more common responses (5-10%) were: ‘Don’t see the advantage’ and ‘Don’t understand banks’. This may indicate the potential for a marketing or education campaign by banks to attract potential customers in these categories. There are also indications that the higher income earners might be slightly more price sensitive and likely to be concerned about issues such as high bank fees than low- and middle-income customers.
Figure 23. Main Reasons for Not Opening a Bank Account, by Income Deciles
The fact that even at the lowest income deciles, at least a small proportion of respondents did have bank accounts is consistent with other studies which show that even the poor and very poor people are capable of saving. However, the fi nding that people in all income brackets identifi ed lack of income as the most important constraint to opening a bank account is somewhat surprising. In order to explore the reasons for this fi nding, Figure 24 provides a distribution of the sample across expenditure levels in Rupiah per year. This shows that the average household expenditure of the highest income decile in the survey was about Rp 50 million per year (about US$5000 per year, or about US$1250 per capita assuming an average household size of four). Of the sampled population, 80 per cent reported an annual household expenditure of Rp 25 million per year or less (less than US$ 625 per capita assuming an average household size of four). With the average national per capita expenditure standing at US$1942.1 (BPS 2007), the sample is therefore representative of lower-income households. This income distribution provides a clue as to why households across the income distribution report lack of income to be a constraint. It is likely that the majority of savings accounts in the formal banking sector held by a small segment of households that are much wealthier than the mean household in this survey. While this latter issue is not explored in detail in this report, it is clear that incomes are a major barrier to accessing formal fi nancial services. This is consistent with studies and surveys conducted in a number of other countries, such as Brazil, India, and Pakistan (The World Bank, 2004, 2006c and 2009b).

Improving Access to Financial Services in Indonesia60
Chapter 3Demand-side Aspects; What do People Want?
Figure 24. Yearly Total Household Expenditure
These results have two important implications for policy. First, the dominant reasons for not saving or holding savings accounts of any kind are economic. This implies that growth in average incomes driven by stronger, sustained economic growth is the most signifi cant factor in eliminating constraints to accessing fi nancial services and particularly to holding a bank account. Second, because results hold across all deciles levels, these results suggest that even when incomes go up, a signifi cant proportion of the population still feels that they don’t have enough money to open a bank account. These fi ndings also suggest that there are threshold income levels at which people start to become ‘fi nancially included’. This issue is explored in greater depth in Chapter 3.6. These results also suggest that consumer education aimed at convincing people of the advantages of saving, especially those who have never had a bank account, may serve a valuable purpose. Section 3.8.2 explores the possibilities for reducing the impact of these constraints.
3.4.2 Key Socio-economic Characteristics of Indonesia’s Savers
There is a great deal of interest regarding the social and economic characteristics of Indonesia’s savers. This Section describes their salient features according to the information provided by the Survey. The statistically signifi cant features are summarized in Section 3.4.3.
The use of bank savings account is clearly related to the education level of the respondent (see the upper left panel in Figure 25). For example, respondents who are university graduates are almost four times more likely to have a savings account than respondents who did not complete primary school and eight times more likely than a respondent who never went to school.
As regards an urban/rural split (the upper right panel of Figure 25), urban populations make greater use of formal and informal savings instruments compared to rural households. By contrast, the exclusive use of informal service providers is considerably higher amongst rural households than urban households. Whereas 53% of the urban population saves at a formal bank, only 32% do so in rural areas. By contrast, while 16% of the urban population saves exclusively in informal institutions, 20% of the rural population does so.
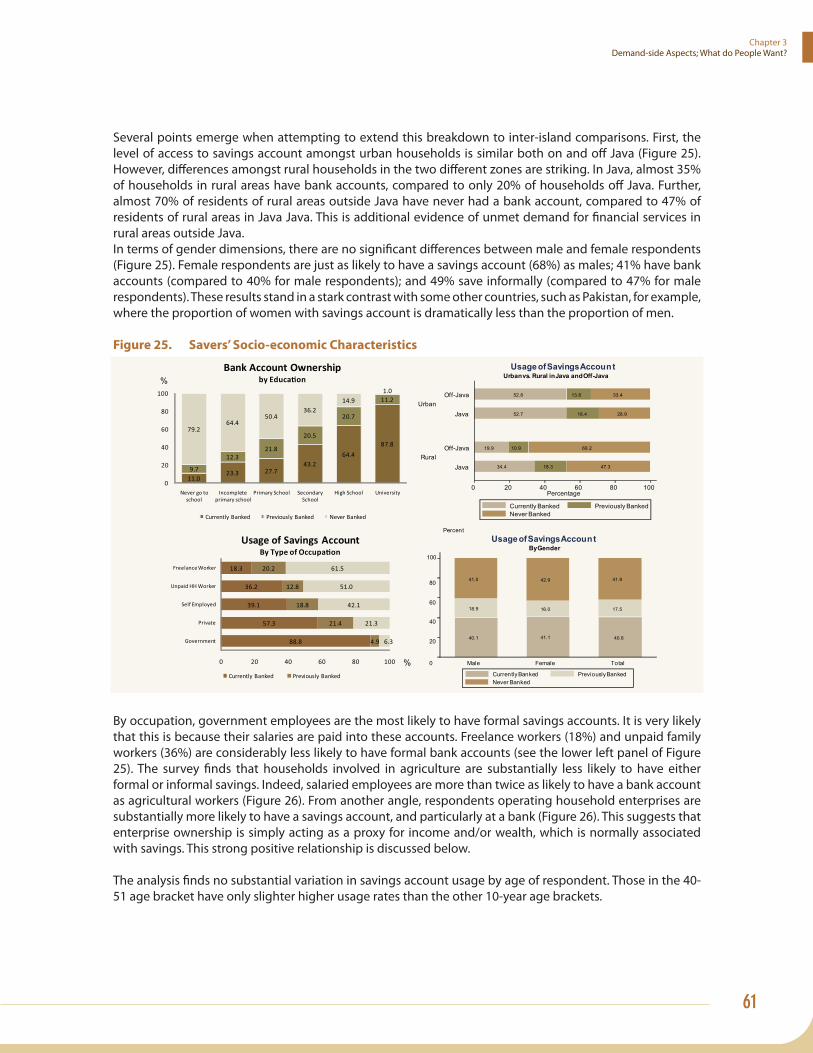
61
Chapter 3 Demand-side Aspects; What do People Want?
Several points emerge when attempting to extend this breakdown to inter-island comparisons. First, the level of access to savings account amongst urban households is similar both on and off Java (Figure 25). However, diff erences amongst rural households in the two diff erent zones are striking. In Java, almost 35% of households in rural areas have bank accounts, compared to only 20% of households off Java. Further, almost 70% of residents of rural areas outside Java have never had a bank account, compared to 47% of residents of rural areas in Java Java. This is additional evidence of unmet demand for fi nancial services in rural areas outside Java.In terms of gender dimensions, there are no signifi cant diff erences between male and female respondents (Figure 25). Female respondents are just as likely to have a savings account (68%) as males; 41% have bank accounts (compared to 40% for male respondents); and 49% save informally (compared to 47% for male respondents). These results stand in a stark contrast with some other countries, such as Pakistan, for example, where the proportion of women with savings account is dramatically less than the proportion of men.
Figure 25. Savers’ Socio-economic Characteristics
By occupation, government employees are the most likely to have formal savings accounts. It is very likely that this is because their salaries are paid into these accounts. Freelance workers (18%) and unpaid family workers (36%) are considerably less likely to have formal bank accounts (see the lower left panel of Figure 25). The survey fi nds that households involved in agriculture are substantially less likely to have either formal or informal savings. Indeed, salaried employees are more than twice as likely to have a bank account as agricultural workers (Figure 26). From another angle, respondents operating household enterprises are substantially more likely to have a savings account, and particularly at a bank (Figure 26). This suggests that enterprise ownership is simply acting as a proxy for income and/or wealth, which is normally associated with savings. This strong positive relationship is discussed below.
The analysis fi nds no substantial variation in savings account usage by age of respondent. Those in the 40-51 age bracket have only slighter higher usage rates than the other 10-year age brackets.
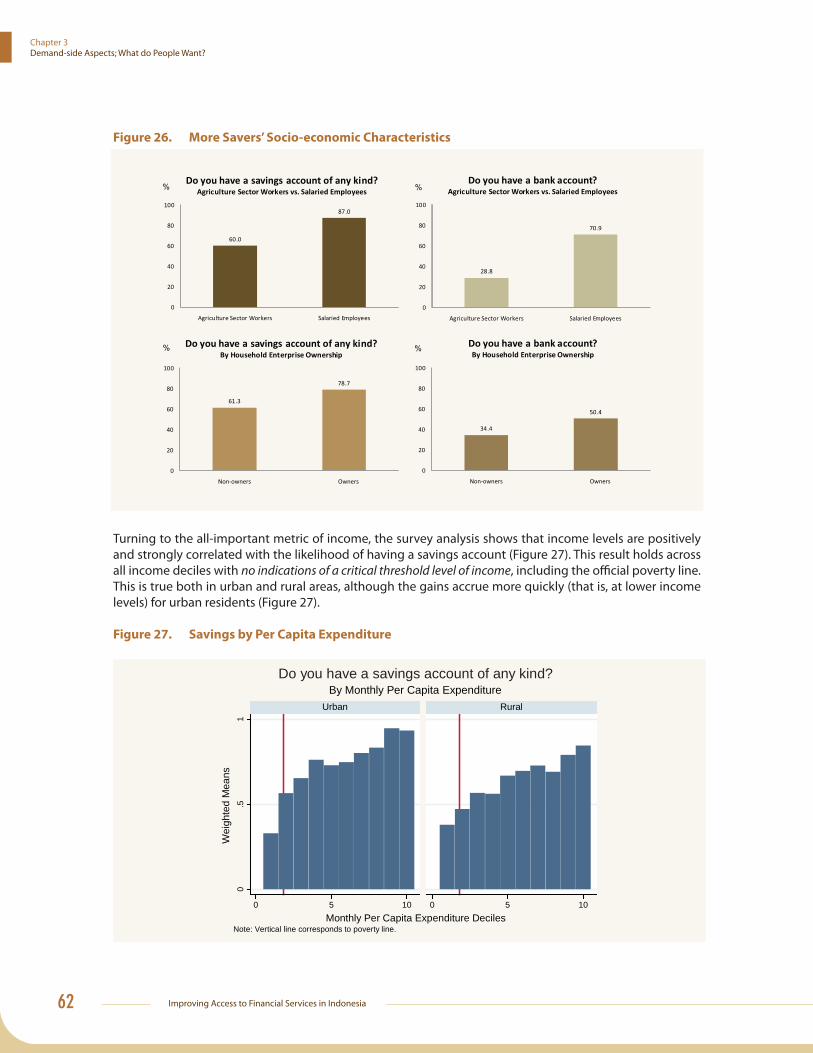
Improving Access to Financial Services in Indonesia62
Chapter 3Demand-side Aspects; What do People Want?
Figure 26. More Savers’ Socio-economic Characteristics
Turning to the all-important metric of income, the survey analysis shows that income levels are positively and strongly correlated with the likelihood of having a savings account (Figure 27). This result holds across all income deciles with no indications of a critical threshold level of income, including the offi cial poverty line. This is true both in urban and rural areas, although the gains accrue more quickly (that is, at lower income levels) for urban residents (Figure 27).
Figure 27. Savings by Per Capita Expenditure
0.5
1
0 5 10 0 5 10
Urban Rural
Wei
ghte
d M
eans
Monthly Per Capita Expenditure DecilesNote: Vertical line corresponds to poverty line.
By Monthly Per Capita ExpenditureDo you have a savings account of any kind?
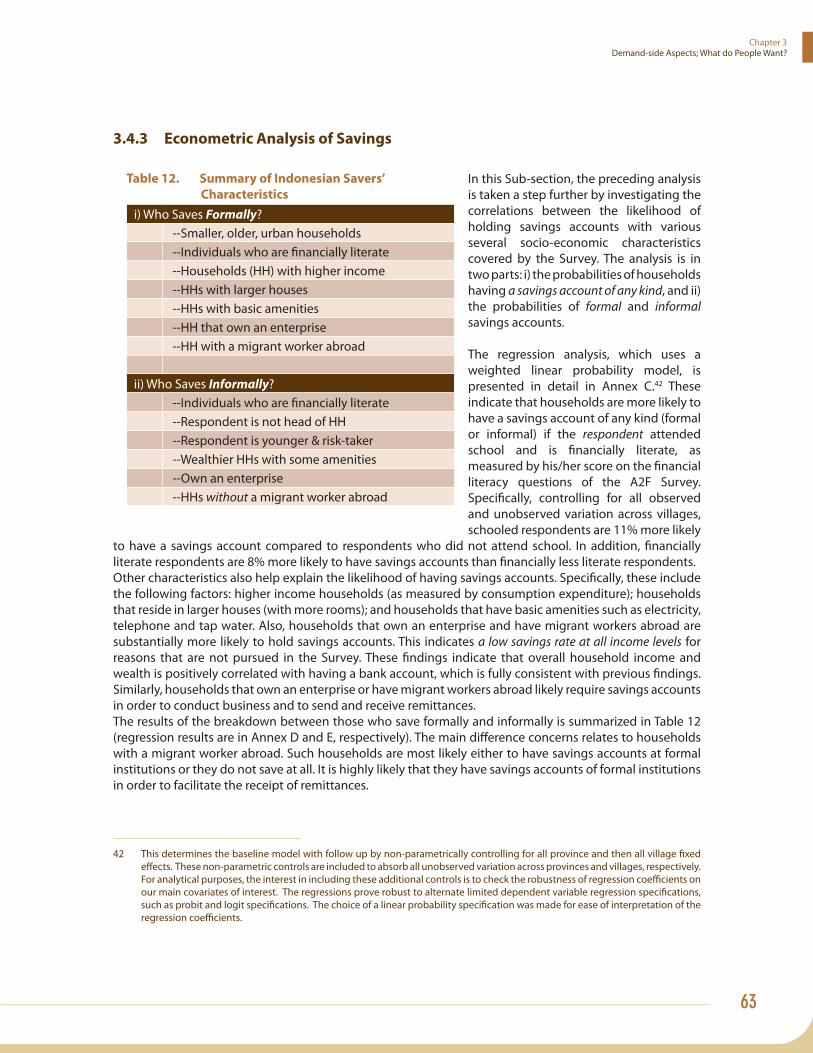
63
Chapter 3 Demand-side Aspects; What do People Want?
3.4.3 Econometric Analysis of Savings
Table 12. Summary of Indonesian Savers’
Characteristics
i) Who Saves Formally? --Smaller, older, urban households --Individuals who are fi nancially literate --Households (HH) with higher income --HHs with larger houses --HHs with basic amenities --HH that own an enterprise --HH with a migrant worker abroad
ii) Who Saves Informally? --Individuals who are fi nancially literate --Respondent is not head of HH --Respondent is younger & risk-taker --Wealthier HHs with some amenities --Own an enterprise --HHs without a migrant worker abroad
In this Sub-section, the preceding analysis is taken a step further by investigating the correlations between the likelihood of holding savings accounts with various several socio-economic characteristics covered by the Survey. The analysis is in two parts: i) the probabilities of households having a savings account of any kind, and ii) the probabilities of formal and informal savings accounts.
The regression analysis, which uses a weighted linear probability model, is presented in detail in Annex C.42 These indicate that households are more likely to have a savings account of any kind (formal or informal) if the respondent attended school and is fi nancially literate, as measured by his/her score on the fi nancial literacy questions of the A2F Survey. Specifi cally, controlling for all observed and unobserved variation across villages, schooled respondents are 11% more likely
to have a savings account compared to respondents who did not attend school. In addition, fi nancially literate respondents are 8% more likely to have savings accounts than fi nancially less literate respondents. Other characteristics also help explain the likelihood of having savings accounts. Specifi cally, these include the following factors: higher income households (as measured by consumption expenditure); households that reside in larger houses (with more rooms); and households that have basic amenities such as electricity, telephone and tap water. Also, households that own an enterprise and have migrant workers abroad are substantially more likely to hold savings accounts. This indicates a low savings rate at all income levels for reasons that are not pursued in the Survey. These fi ndings indicate that overall household income and wealth is positively correlated with having a bank account, which is fully consistent with previous fi ndings. Similarly, households that own an enterprise or have migrant workers abroad likely require savings accounts in order to conduct business and to send and receive remittances. The results of the breakdown between those who save formally and informally is summarized in Table 12 (regression results are in Annex D and E, respectively). The main diff erence concerns relates to households with a migrant worker abroad. Such households are most likely either to have savings accounts at formal institutions or they do not save at all. It is highly likely that they have savings accounts of formal institutions in order to facilitate the receipt of remittances.
42 This determines the baseline model with follow up by non-parametrically controlling for all province and then all village fi xed eff ects. These non-parametric controls are included to absorb all unobserved variation across provinces and villages, respectively. For analytical purposes, the interest in including these additional controls is to check the robustness of regression coeffi cients on our main covariates of interest. The regressions prove robust to alternate limited dependent variable regression specifi cations, such as probit and logit specifi cations. The choice of a linear probability specifi cation was made for ease of interpretation of the regression coeffi cients.
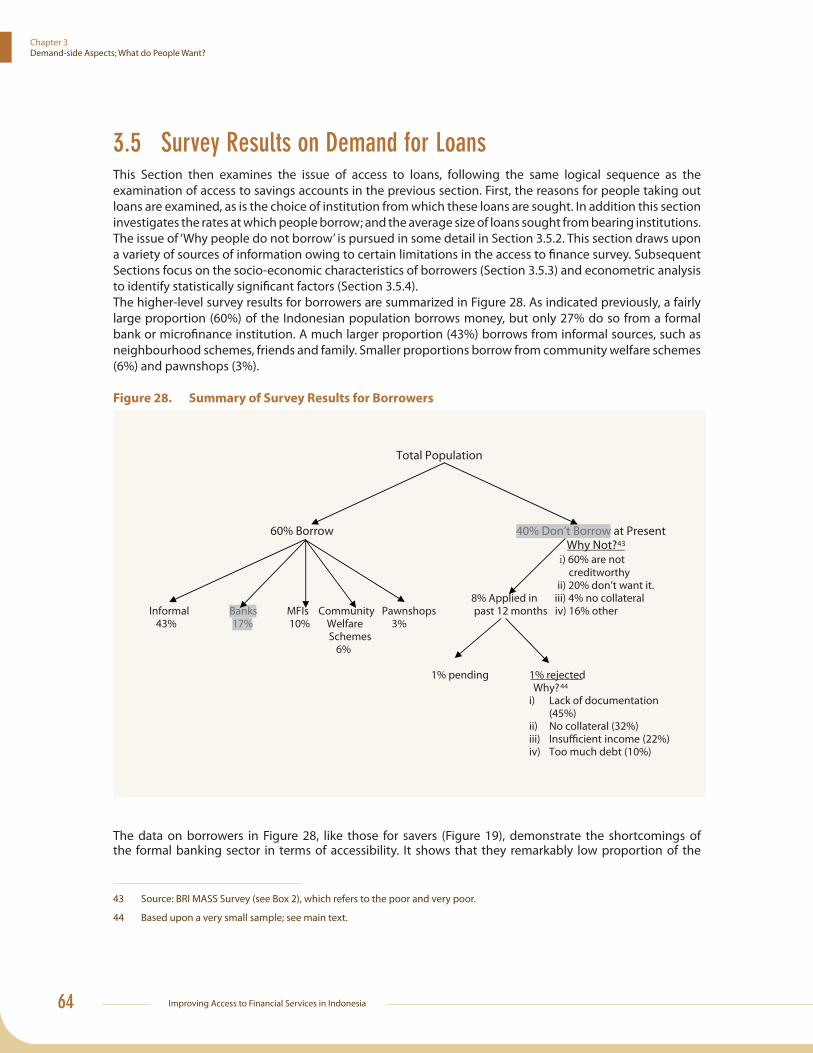
Improving Access to Financial Services in Indonesia64
Chapter 3Demand-side Aspects; What do People Want?
3.5 Survey Results on Demand for LoansThis Section then examines the issue of access to loans, following the same logical sequence as the examination of access to savings accounts in the previous section. First, the reasons for people taking out loans are examined, as is the choice of institution from which these loans are sought. In addition this section investigates the rates at which people borrow; and the average size of loans sought from bearing institutions. The issue of ‘Why people do not borrow’ is pursued in some detail in Section 3.5.2. This section draws upon a variety of sources of information owing to certain limitations in the access to fi nance survey. Subsequent Sections focus on the socio-economic characteristics of borrowers (Section 3.5.3) and econometric analysis to identify statistically signifi cant factors (Section 3.5.4).The higher-level survey results for borrowers are summarized in Figure 28. As indicated previously, a fairly large proportion (60%) of the Indonesian population borrows money, but only 27% do so from a formal bank or microfi nance institution. A much larger proportion (43%) borrows from informal sources, such as neighbourhood schemes, friends and family. Smaller proportions borrow from community welfare schemes (6%) and pawnshops (3%).
Figure 28. Summary of Survey Results for Borrowers
43 44
The data on borrowers in Figure 28, like those for savers (Figure 19), demonstrate the shortcomings of the formal banking sector in terms of accessibility. It shows that they remarkably low proportion of the
43 Source: BRI MASS Survey (see Box 2), which refers to the poor and very poor.
44 Based upon a very small sample; see main text.

65
Chapter 3 Demand-side Aspects; What do People Want?
population (17%) currently borrow from banks. Far more, roughly twice as many, borrow from the informal sector, while even more borrow from institutions like MFIs, pawnshops and community welfare schemes.
Loans from formal sources are used primarily for business loans, while loans from informal sources are more often used to fi nance consumption. This simple observation has important policy implications. Namely, policies that aim at diff erent users of credit (e.g., investment versus consumption) need to aim at diff erent fi nancial services providers (e.g., rural banks versus pawnshops).
Continuing to look at Indonesians who borrow money by moving down the left branch of Figure 28, it appears that the most popular service providers are in the informal sector. According to 40-50% of respondents , loans provided by service providers in the informal sector are generally used for consumer expenditure, while 25-40% of respondents stated that these loans were for business & investment spending. The proportion of loans for other purposes was quite small, with this pattern being relatively uniform across informal providers (the left panel of Figure 29).
The patterns for the purpose of loans taken up by those who borrow from banks and formal MFI’s (the right panel of Figure 29) is considerably diff erent.45 Most of these loans were taken out for business and investment purposes, with the proportion of loans for consumption purposes being considerably lower. Within this category of service provider, the proportion of loans taken out for business and investment purposes were somewhat higher from banks, while the proportion taken out for consumption purposes was slightly higher for MFI’s.
45 Defi nitions are important. This Survey defi nes a Micro Finance Institution (MFI) as a small credit program to fi nance small business to produce income for oneself and the family. For the survey, micro credit is disbursed by non-bank fi nance institutions, for example: BKD (Village Credit Body); savings and loan cooperatives (KSP); savings and loan unit (USP); village credit fund institution (LDKP); baitul mal wattanwil (BMT); non-governmental organization (NGO); arisan; Grameen fi nancing programs; ASA fi nancing programs; self-help groups (KSM); and credit unions. This defi nition overlaps with that discussed in Chapter 2.5.

Improving Access to Financial Services in Indonesia66
Chapter 3Demand-side Aspects; What do People Want?
Figure 29. Purpose of Loan, by Service Provider
The average size of loans vary signifi cantly according to the type of institution providing them (Figure 30). Not surprisingly, banks provide the largest loans to households, with 25% of such loans being in excess of Rp20 million, or roughly US$2,000. The average size of loans shrinks dramatically when they are provided from the informal sector. Indeed, almost 25% of loans provided through community welfare schemes were for less than Rp100,000 (about US$10).

67
Chapter 3 Demand-side Aspects; What do People Want?
Figure 30. Loan Sizes, by Institution
25.4
27.523.1
23.9
Bank Loan Size
<= 4 million >4-10 million >10-20 million >20 million
26.4
16.636.7
20.2
MFI Loan Size
<= 0.5 million >0.5-1 million >1-3 million >3 million
22.2
26.928.7
22.2
Pawn Loan Size
<= 0.2 million >0.2-0.5 million >0.5-1.3 million >1.3 million
23.4
29.118.1
29.3
Community Welfare Scheme Loan Size
<= 100 thousands >100- 300 thousands
>300- 500 thousands >500 thousands
25.3
25.224.5
25.0
Informal Loan Size
<=130 thousands >130- 600 thousands >600 thousands-9 million >9 million
Interest rates charged by the varying types of institution also vary widely (Figure 31). At the lower end, employers charge relatively low rates (less than 10% per annum); loans provided by friends and neighbours are also relatively cheap, with an average charge of approximately 17%. Banks come next, at about 25%, compared with over 40% for MFIs and Community Welfare Schemes. The most expensive are shops (that is, store credit) and daily banks (see the upper panel in Figure 31). The latter are particularly expensive because of the very short-term maturities (1 day) and these build up enormously with compounding at annual rates. For policy purposes, it is important to note that most institutions—especially banks and to a lesser extent MFIs—charge markedly less interest, if the borrower has a bank account (see the lower panel in Figure 31), Probably because this is a low-cost indicator to lenders of creditworthiness. By implication, one of the simplest ways to reduce interest costs would be for borrowers to open a bank account.
Three qualifi cations should be made regarding the survey’s fi ndings on interest rates. First, the survey respondents often did not know the interest rate that they paid for their loans or the maturity period. Usually, they seemed more concerned about the size of the monthly payments and whether they had the cash fl ow to make repayments. Second, within institutions, there is a wide range of rates charged on loans, with the upper end typically 2-3 times the mean or median. And third, some of the fi ndings are based on very small datasets, which makes a strict interpretation of these rates problematic.
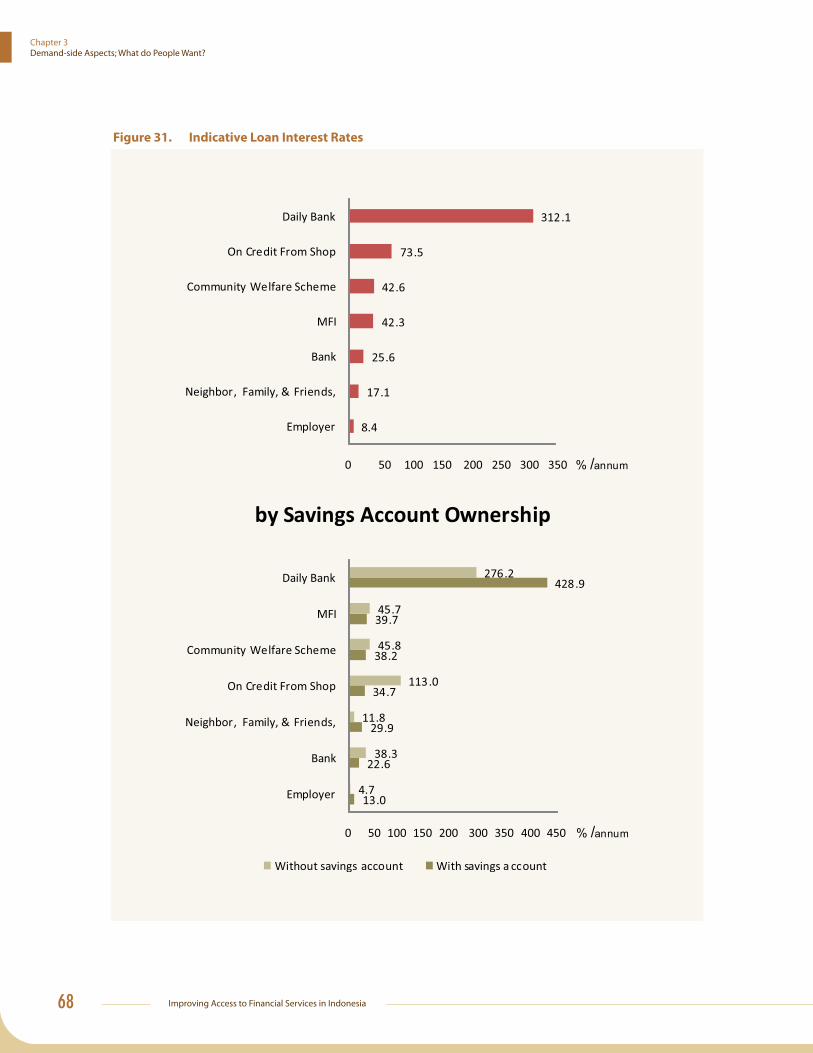
Improving Access to Financial Services in Indonesia68
Chapter 3Demand-side Aspects; What do People Want?
Figure 31. Indicative Loan Interest Rates

69
Chapter 3 Demand-side Aspects; What do People Want?
3.5.1 Who Does Not Borrow?
The Survey identifi ed several socio-economic characteristics of Indonesians who have never borrowed, namely:
1. They are relatively more concentrated in the lowest income deciles (Figure 32);
2. Concentration in the lowest income deciles is more pronounced for rural areas (Figure 32). However, on average there is virtually no urban-rural diff erence (see the lower left panel in Figure 33);
3. They tend to be poorly educated and live off -Java (see the upper panels in Figure 33);
4. They tend to be women somewhat more often than men (see the middle lower panel in Figure 33). And;
5. Usually, they are not owners of non-farm enterprises (see the lower right panel of Figure 33).
Figure 32. Non-Borrowers by Per Capita Expenditure

Improving Access to Financial Services in Indonesia70
Chapter 3Demand-side Aspects; What do People Want?
Figure 33. Non-Borrowers’ Characteristics
3.5.2 Barriers to Accessibility: Why Do People Not Borrow?
As suggested by the right-hand branch of Figure 28, the survey did not pursue the reasons as to why respondents have not borrowed. However, the Survey did probe non-borrowers who had applied for a loan within the last 12 months; if they were rejected, the Survey asks ‘Why rejected?”
As indicated in Figure 28, the principal reasons cited were:
1. Lack of documentation (45%), for example: personal identity; land ownership certifi cate; or proof of permanent address;
2. Insuffi cient collateral (32%);
3. Insuffi cient income (22%); and
4. Too much debt (10%).
It should be noted that the number of data points in these categories is very small, which undermines their statistical reliability. For instance, only 1% of population has had a loan application rejected in the past year, and each of the rejection reasons, noted immediately above, is a subset of this 1%.
To provide more insights into this critical issue, this report turns to the BRI MASS Survey, which provides the following critical results (Box 2):
1. 40% of the unbanked poor and very poor are creditworthy by the commercial standards of BRI’s examiners;
2. By implication, 60% of the unbanked poor and very poor are not creditworthy by the standards of BRI’s examiners;
3. Of the creditworthy poor and very poor, 50% do not want credit – that is, they are voluntarily self-excluded – at the prevailing price of credit; and,

71
Chapter 3 Demand-side Aspects; What do People Want?
4. Of those creditworthy, 10% were excluded owing to a lack of collateral.
What can be inferred from this? First, a very rough picture can be drawn regarding the reasons why 25% of poor or very poor households (that is, those in the 2 lowest income deciles; see Figure 32) have never borrowed. Using the MASS results, the reasons that this group have never borrowed break down as follows:
1. 15% are not creditworthy (by BRI Unit Desa standards);
2. 5% don’t want credit and are therefore are voluntarily excluded;
3. 1-2%, are excluded because they have no collateral; And,
4. The remainder, roughly 4%, are excluded for other, unknown reasons.
According to the BRI MASS Survey, lack of collateral does not look appear to be the major constraints in the face of seeking a loan by members of this group. Evidence from the Access to Finance Survey is weaker on this issue, but does not contradict the conclusions of the MASS survey. As stated previously, the signifi cance of this latter survey is doubtful given the small sample size involved (about 1/3 of 1% of the population).
Rather than lack of collateral, a more signifi cant constraint appears to be lack of documentation. This conclusion is supported by both the A2F and MASS Surveys. The fi ndings of the two surveys on other constraints, such as insuffi cient income and too much existing debt, are roughly consistent.
3.5.3 Key Socio-Economic Characteristics of Indonesia’s Borrowers
As in the case of savers, there is a great deal of interest in the main social and economic characteristics of Indonesia’s borrowers. The remainder of this Section describes their salient features according to the information gathered through the Survey. The statistically signifi cant factors are summarized in Section 3.5.4.
One important point needs to be made at the outset of this Section. Namely, the size of an average household debts in Indonesia are moderately high (see Table 13). For most socio-economic groups, household debts are on average equal to 25-30% of annual income. For those below the poverty line, average total household debts are around 19% of annual income. These levels of debt already constitute a sizable burden for households. For example, at typical rates of interest (say 30%; see Figure 31), the average household needs to spend about 1/10th of its income on interest payments, if it can continually rollover its short-term debt. If the debt has to be re-paid, repayment will consume almost 40% of an average household income in that year.

Improving Access to Financial Services in Indonesia72
Chapter 3Demand-side Aspects; What do People Want?
Table 13. Household Indebtedness
(in US$ @ 9056 Rp/US$)Total Indebtedness Average Annual As % of
Expenditure ExpenditureAverage Indebtedness $ 783 $ 2,829 27.7%
- Rural $ 680 $ 2,400 28.3%- Urban $ 926 $ 3,422 27.1%
- Male $ 796 $ 2,830 28.1%- Female $ 771 $ 2,828 27.3%
- Above poverty line $ 881 $ 3,143 28.0%- Below poverty line $ 155 $ 806 19.3%
For those below the poverty line (see Table 13), the situation is similar despite much smaller levels of debt, because they will probably need to pay considerably higher rates of interest, perhaps in excess of 50% (or more, if they need to access the services of a lintah darat; see Box 3). If the short-term debt cannot be continually rolled over, repayment of the loan would consume almost one third of the annual household income. One important limitation of the survey is that it did not explore the non-fi nancial assets of the households. Therefore, an estimate of the level of debt as a function of overall household wealth is not available. Thus, the above fi ndings will need to be interpreted with caution. However, these fi ndings suggest that there is a need to explore the level of debt of lower-income households much more closely. In terms of policy, they also suggest a need to further focus on increasing access to credit.
Turning to socio-economic characteristics, 50% of households with savings accounts also borrow from a bank (see the left panel of Figure 34). By contrast, less than 10% of households without bank savings accounts borrow from a bank. Several explanations could account for this large diff erence. Possibly it merely reaffi rms an established fi nding of loan fi nancing, that having a savings account acts as guarantee/collateral against which banks can lend money to clients. Alternatively, it could also refl ect an unwillingness of certain segments of the population to engage with the formal fi nancial sector, for religious or other reasons. On the other hand, from an economic point of view, the discrepancy might be caused by the fact that if poorer segments of society don’t have enough income to open a savings account, neither do they have enough income to establish creditworthiness, so they are unlikely to receive loans from formal providers. The evidence, presented earlier (Figure 31), supports the fi rst explanation, namely that banks and MFIs charge lower rates of interest on loans to customers who have a bank account.

73
Chapter 3 Demand-side Aspects; What do People Want?
Figure 34. Characteristics of Borrowers
On a regional basis (Figure 35), the Survey shows that loans from banks, MFIs, and pawn shops are more frequently made to households in urban areas. To a Signifi cantly higher degree, rural households rely on informal sources of loans. The volume of loans derived from Community Welfare Schemes are very similar in rural and urban regions.
Figure 35. Borrowers’ Characteristics, Urban/Rural
By gender (Table 14), there are no signifi cant diff erences, although women are slightly more likely to borrow from informal sources. As noted earlier, these fi ndings are in sharp contrast to surveys conducted another other developing countries where the majority of the population is Muslim.
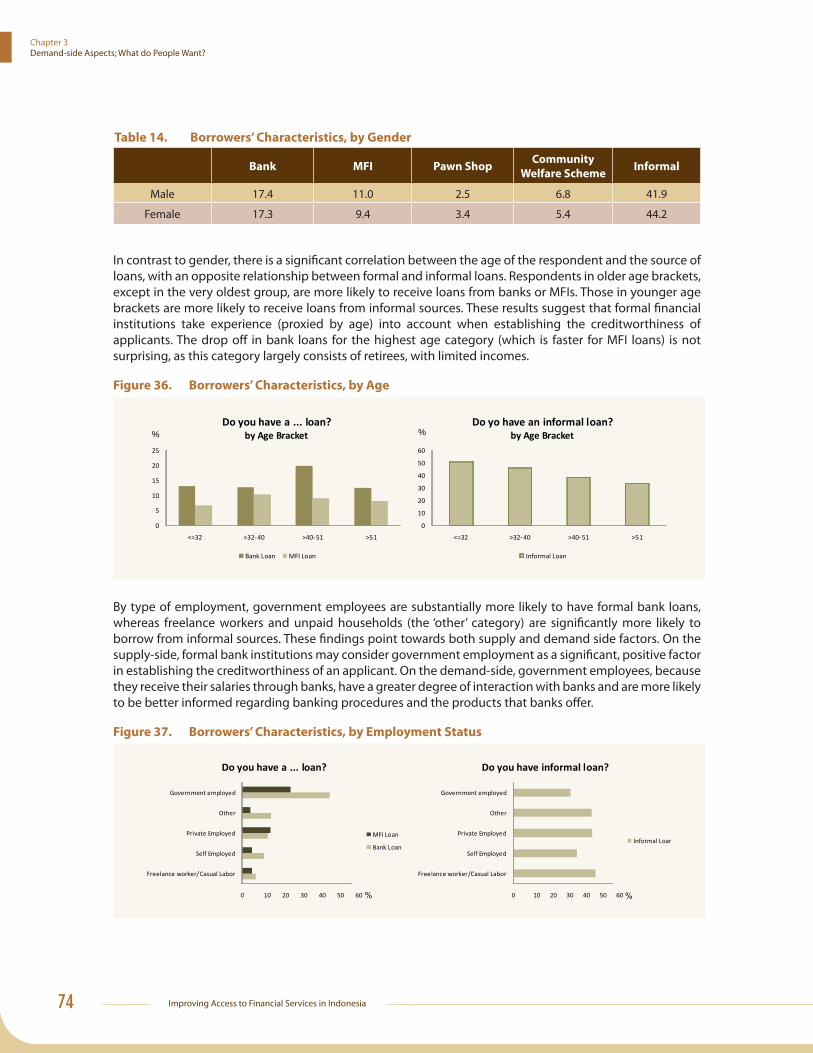
Improving Access to Financial Services in Indonesia74
Chapter 3Demand-side Aspects; What do People Want?
Table 14. Borrowers’ Characteristics, by Gender
Bank MFI Pawn ShopCommunity
Welfare SchemeInformal
Male 17.4 11.0 2.5 6.8 41.9
Female 17.3 9.4 3.4 5.4 44.2
In contrast to gender, there is a signifi cant correlation between the age of the respondent and the source of loans, with an opposite relationship between formal and informal loans. Respondents in older age brackets, except in the very oldest group, are more likely to receive loans from banks or MFIs. Those in younger age brackets are more likely to receive loans from informal sources. These results suggest that formal fi nancial institutions take experience (proxied by age) into account when establishing the creditworthiness of applicants. The drop off in bank loans for the highest age category (which is faster for MFI loans) is not surprising, as this category largely consists of retirees, with limited incomes.
Figure 36. Borrowers’ Characteristics, by Age
0
5
10
15
20
25
<=32 >32-40 >40-51 >51
Do you have a ... loan?by Age Bracket
Bank Loan MFI Loan
%
0
10
20
30
40
50
60
<=32 >32-40 >40-51 >51
Do yo have an informal loan?by Age Bracket
Informal Loan
%
By type of employment, government employees are substantially more likely to have formal bank loans, whereas freelance workers and unpaid households (the ‘other’ category) are signifi cantly more likely to borrow from informal sources. These fi ndings point towards both supply and demand side factors. On the supply-side, formal bank institutions may consider government employment as a signifi cant, positive factor in establishing the creditworthiness of an applicant. On the demand-side, government employees, because they receive their salaries through banks, have a greater degree of interaction with banks and are more likely to be better informed regarding banking procedures and the products that banks off er.
Figure 37. Borrowers’ Characteristics, by Employment Status

75
Chapter 3 Demand-side Aspects; What do People Want?
Refl ecting similar patterns for savings, salaried employees are almost three times more likely to have a formal bank sector loan and four times more likely to have an MFI loan than agricultural workers. The diff erence between the two groups when it comes to receiving loans from informal sources is far less signifi cant (Figure 38). This implies that the two types of workers have equal access to the informal market, but formal fi nancial institutions prefer regular versus irregular income fl ows, which would be a low-cost proxy for risk.
Figure 38. Borrowers’ Characteristics, by Type of Job
0
5
10
15
20
25
30
35
Agriculture Sector Workers Salaried Employee
Do you have ... loan?Agriculture Sector Workers & Salaried Employees
Bank Loan
MFI Loan
%
0
10
20
30
40
50
Agriculture Sector Workers Salaried Employee
Do you have informal loan?Agriculture Sector Workers & Salaried Employees
Informal Loan
%
Households that operate non-farm enterprises are more likely to borrow from banks, MFIs, and informal sources (Figure 39).
Figure 39. Borrowers’ Characteristics, by Enterprise Ownership
0
5
10
15
20
25
Non-Owners Owners
Do you have ... loan?by Non-farm Enterprise Ownership
Bank Loan
MFI Loan
%
0
10
20
30
40
50
Non-Owners Owners
Do you have an informal loan?by Non-farm Enterprise Ownership
Informal Loan
%
Finally, looking at the critical metric of income, there is no pronounced relationship between borrowing from any source and total household expenditure, except that borrowing declines dramatically amongst households below the poverty line (Figure 40). This is true to a very similar extent in both urban and rural areas. However, borrowers preferred fi nancial institutions to vary with income or expenditure. As income rises, borrowers (urban and rural) make a signifi cantly greater use of banks (see Figure 41). By contrast, as incomes rise, borrowers use of pawnshops and community welfare schemes drops off sharply. The drop-off at higher incomes tends to be less pronounced for MFIs and informal sources.
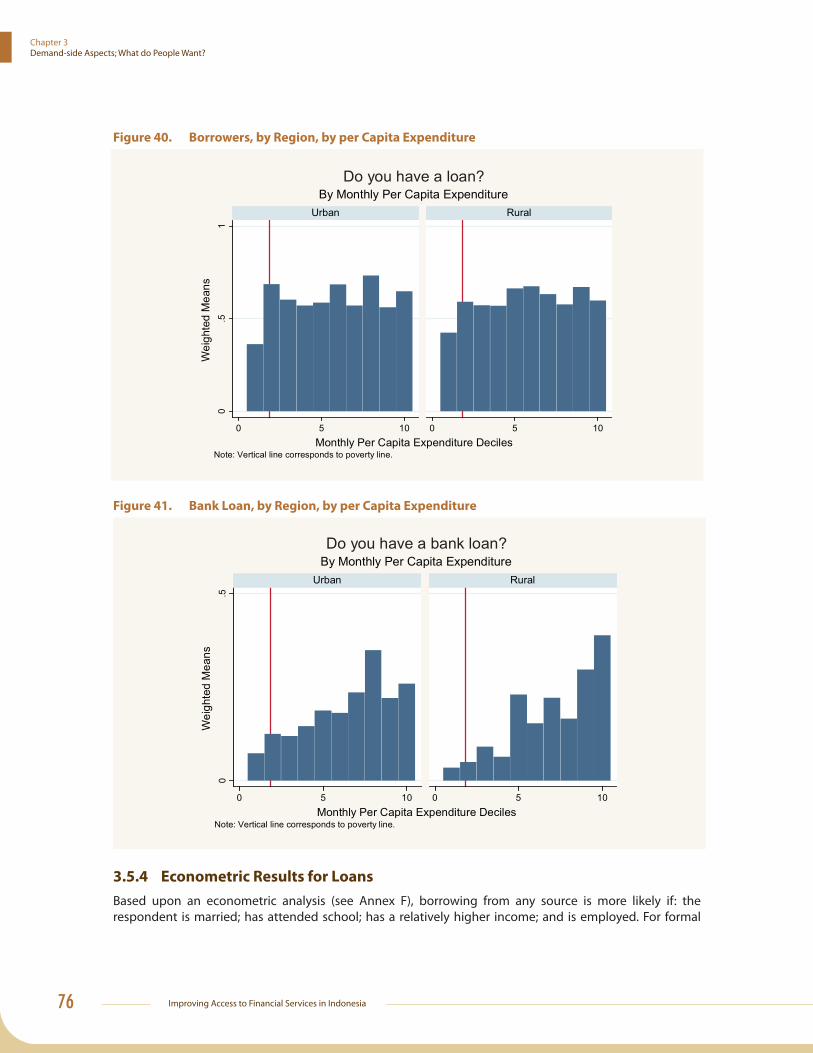
Improving Access to Financial Services in Indonesia76
Chapter 3Demand-side Aspects; What do People Want?
Figure 40. Borrowers, by Region, by per Capita Expenditure
Figure 41. Bank Loan, by Region, by per Capita Expenditure
3.5.4 Econometric Results for Loans
Based upon an econometric analysis (see Annex F), borrowing from any source is more likely if: the respondent is married; has attended school; has a relatively higher income; and is employed. For formal

77
Chapter 3 Demand-side Aspects; What do People Want?
sources (Annex G), older respondents and those with better math skills are more likely to take out loans. Household level characteristics include household wealth and access to basic amenities.
Households are more likely to borrow from informal sources if the respondent is married; employed; and if the household as a whole is wealthier but does not own property (Annex I). Borrowers that own property and are not in the formal loan market probably have other avenues for funding or chose not to borrow at all.
3.6 The ‘Truly Financially Excluded’: No Loans And No Savings AccountsThis Section looks at those Survey respondents with neither a savings account nor a loan, loosely referred to here as ‘the truly fi nancially excluded’. In total, they constitute about 17% of the (weighted) A2F sample.
In terms of the socio-economic characteristics of this group, the rural poor stand out from all other categories (see the right panel of Figure 42), with more than 20% of this group falling into the category of the truly fi nancially excluded. Indeed, improved access is almost exponential as income rises, right up to the seventh income decile. For the urban poor (see the left panel of Figure 42), the improvement is only pronounced at the lowest levels of income; after that it is relatively fl at through the fi fth income decile, when access improves again. At the middle and higher income levels, there is very little diff erence between urban and rural regions.
Figure 42. Characteristics of ‘Truly Financially Excluded’, by per Capita Expenditure
Looking at their other characteristics (Figure 43), the ‘truly fi nancially excluded’ tend to be poorly educated; they live off Java, in rural regions; and they are not owners of non-farm enterprises. Gender diff erences are relatively minor (see the lower left panel of Figure 43).

Improving Access to Financial Services in Indonesia78
Chapter 3Demand-side Aspects; What do People Want?
Figure 43. Characteristics of the ‘Truly Financially Excluded’
Among other indicators (see the fi nal panels of Figure 44), the incidence of respondents without a loan or savings account tends to increase in a pronounced way with age. By type of employment, they tend to be unemployed, self-employed and freelance workers. Furthermore, they tend to score low on the math and fi nancial literacy scores (see Section 3.8.1), probably refl ecting their relatively low levels of education.
These results have signifi cant implications for policy, providing clear evidence that policies to improve access to fi nancial services should target the rural poor and poorly educated in off -Java regions.

79
Chapter 3 Demand-side Aspects; What do People Want?
Figure 44. Characteristics of the ‘Truly Financially Excluded’, continued
3.7 Survey Results on Demand for InsuranceAt the most aggregate level, the Survey showed that approximately 50% of Indonesian households have some kind of insurance (see Figure 45). This indicates a remarkably high use of insurance products, considering the evidence on penetration and density from previous studies.46 However, the composition of coverage by type of insurance (Figure 46) is very important in this regard. It indicates that by far the most signifi cant proportion of insurance coverage was travel insurance and public sector health insurance. After further consideration (Box 9), subsequent analysis focused on only four categories of insurance (asset, education, life and private health).
46 Compare, for example, with World Bank (2006d).

Improving Access to Financial Services in Indonesia80
Chapter 3Demand-side Aspects; What do People Want?
Figure 45. Insurance Holders, by per capita Expenditure
Box 9. Some Details on Insurance in the Survey
The Questionnaire asked about seven diff erent types of insurance, as indicated in Figure 46, namely: i) public medical; ii) private medical; iii) home owners’; iv) education; v) travel/accident; vi) vehicle/asset insurance; and vii) life insurance. Beyond these seven categories, the questionnaire was not specifi c about types of insurance, leaving detailed interpretation to the discretion of the respondent. Further questions in the survey related to ownership; availability; willingness to pay; reasons for not having insurance; and risks.
As mentioned in the main text, overall results indicated a surprisingly high level of insurance coverage, with around 50% of all households having some form of insurance. However, the details of composition indicated that almost 33% of respondents have (or had) government medical coverage and almost 30% have (or had) travel or accident insurance (see the upper half of Figure 46).
The high rate of coverage with public health insurance is almost certainly accounted for by the compulsory coverage of government workers by PT ASKES and by Askeskin (which is social insurance for the identifi ed poor).a/ As for travel/accident insurance, such a high rate of coverage was not envisaged when the survey was designed, and the inclusion of fi gures for this type of coverage appeared to infl ate the overall numbers. To avoid distortions of overall results and conclusions, these two categories were excluded from further aggregate analysis. By contrast, the rate of coverage for home owners’ insurance was miniscule, at around 1%. As a result, the small statistical sample undermined detailed statistical reliability. Thus, this category of insurance was amalgamated with the much broader ‘assets insurance’ category, which also includes ‘home or vehicle insurance’. Further detailed analysis in the main text focussed on the four remaining categories, which are more representative of insurance in Indonesia.
a/ For further information on these types of insurance, see Annex S of World Bank (2008b).

81
Chapter 3 Demand-side Aspects; What do People Want?
Looking only at the four, more representative types of insurance, Indonesia has low take-up rates. Even with the low overall rate of coverage, by far the most signifi cant proportion of those with coverage belong to the urban, upper income groups (Figure 47). The take-up for those in rural and urban regions is comparable for the lowest income brackets. However, the take-up rate for urban residents rises much more quickly as income increases. The eff ect is especially noticeable for asset insurance and for life insurance. In rural regions, education insurance is particularly uncommon.
The main socio-economic characteristics of insurance policyholders are presented in Figure 47. The self-employed are the most likely to buy insurance of all for four kinds, except for life insurance. Private employees are far more likely to purchase life insurance. By gender, a far greater proportion of women purchase education insurance, whereas men prefer life insurance and, to a lesser degree, asset insurance. There is no diff erence as regards private health insurance.
Figure 46. Types of Insurance Ownership
There is a dramatic diff erence in insurance take-up between agricultural workers and salaried employees. The latter are more than ten times more likely to buy insurance—of all types—than the former. Similarly, the owners of non-farm enterprises are much more likely to buy insurance than those who do not operate such businesses. Further issues related to insurance are included in Section 3.7.1, below.

Improving Access to Financial Services in Indonesia82
Chapter 3Demand-side Aspects; What do People Want?
Figure 47. Characteristics of Holders of Insurance47
47 Note diff erence in vertical scales in the various panels of this Figure.

83
Chapter 3 Demand-side Aspects; What do People Want?
Figure 48. Characteristics of Insurance Holders, continued
3.7.1 Econometric Results for Insurance
Table 15. Summary of Insurance Holders’ Characteristics
Who Has Insurance? --Households (HH) in urban areas --HHs that are well-off --HHs without a migrant worker abroad --Civil Servants (public health insurance) --Male & older --Less likely if employed, married & head of HH --Some HH amenities, electricity detracts.
The econometric analysis for insurance (see Annex J) fi nds that households are more likely to have insurance of any kind if they are located in urban areas; if they have better than average mathematical skills; and if they are are relatively well-off with a larger house size with some amenities. It is notable that results for migrant workers are negative, indicating that households with a migrant worker abroad are less likely to hold insurance. This is a confusing result since all legal migrant workers are required to have
insurance (see Section 5.2.3). One simple explanation is that the households with family member abroad, aren’t aware of that the migrant worker has insurance, which is in line with the results of Chapter 5 concerning the fi nancial literacy of migrant workers and the families. The income from abroad may serve as insurance for many migrant worker families, substituting for formal insurance products. This would be consistent with earlier observations about lower levels of informal savings by families of migrant workers (Section 3.4.3).
Improving Access to Financial Services in Indonesia84
Chapter 3Demand-side Aspects; What do People Want?
3.8 Other Survey Results: Risks to Financial Well-Being
The A2F Survey also asked respondents about their perceptions of risks to their fi nancial well-being. The results could provide insights into the type of insurance products likely to be of interest to households in various categories. Among all categories, illness (79%) and loss of employment (56%) are the most serious perceived risks to fi nancial well-being. Damage to dwelling (33%), poor business performance (30%), death (28%) and harvest failures (26%) are other frequently identifi ed risks.
By region, illness is the greatest perceived threat to fi nancial well-being in both rural and urban areas. However, urban households fear loss of employment signifi cantly more than do rural households (62% in urban areas compared to 52% in the rural areas). Similarly, poor business performance is perceived to be signifi cantly higher risk factor in urban areas than rural ones (34% vs. 26%). For fairly obvious reasons, rural households are generally much more concerned about harvest failures than urban households (39% vs. 7%).
In terms of gender diff erences, there are signifi cant variations in the way men and women perceive risk. A signifi cantly higher proportion of women perceive illness to be a signifi cant risk than men (82% vs. 77%) with the same being true of loss of employment (60% vs. 53%). By contrast, a signifi cantly higher proportion of men perceived harvest failures to be a risk than women (32% vs. 19%). A smaller proportion of higher income households worry about illness compared to poorer households (75% vs. 84%), although a higher proportion of higher income households worry about poor business performance (33% vs. 26%). A signifi cantly higher proportion of poor households were worried about crop failure is then were richer households (30% vs. 22%).
The Survey did not seek to determine how respondents attempted to protect themselves against such risks or how they manage crisis is when they occurred. However, if these survey results are linked to those presented earlier, some answers do emerge. For example, a rural family might protect itself against crop failure by diversifying sources of income, by having one or more family members as migrant workers, either overseas or in domestic urban areas. Similarly, during good times, rural households often save non-fi nancial assets. For example, rural households may build up their personal stocks of basic foods, like rice; they may buy animals such as goats and chickens; or they may buy jewellery, preferably gold. In the event of a family crisis, when these accumulated assets prove inadequate, the poor access the informal sources to seek loans, particularly loans provided by employers; friends or family; pawnshops; or the local moneylender.
Overall, these results suggest that there is an unfulfi lled demand for formal, low-cost insurance products that provide protection against the fi nancial impact of illness, especially among poorer populations. Competitively priced asset insurance products may also be of interest to richer households in urban areas, many of whom may operate a business of their own. Results on international migrant workers suggest possible interest among them in commitment savings products (see Chapters II and V).
3.8.1 Other Survey Results: Demand for Other Financial Instruments
The survey fi nds that there is a signifi cant demand for banking services to facilitate fi nancial transactions. For example, 22% of households who have bank accounts mainly use the account either to send or receive money; 12% use their bank accounts to gain access to other banking services, such as loans. This probably refl ects the growing popularity of relatively new services off ered by banks such as cash payment, bills payments and transfer facilities through ATM machines, internet and mobile banking (Box 10 and Chapter 2).
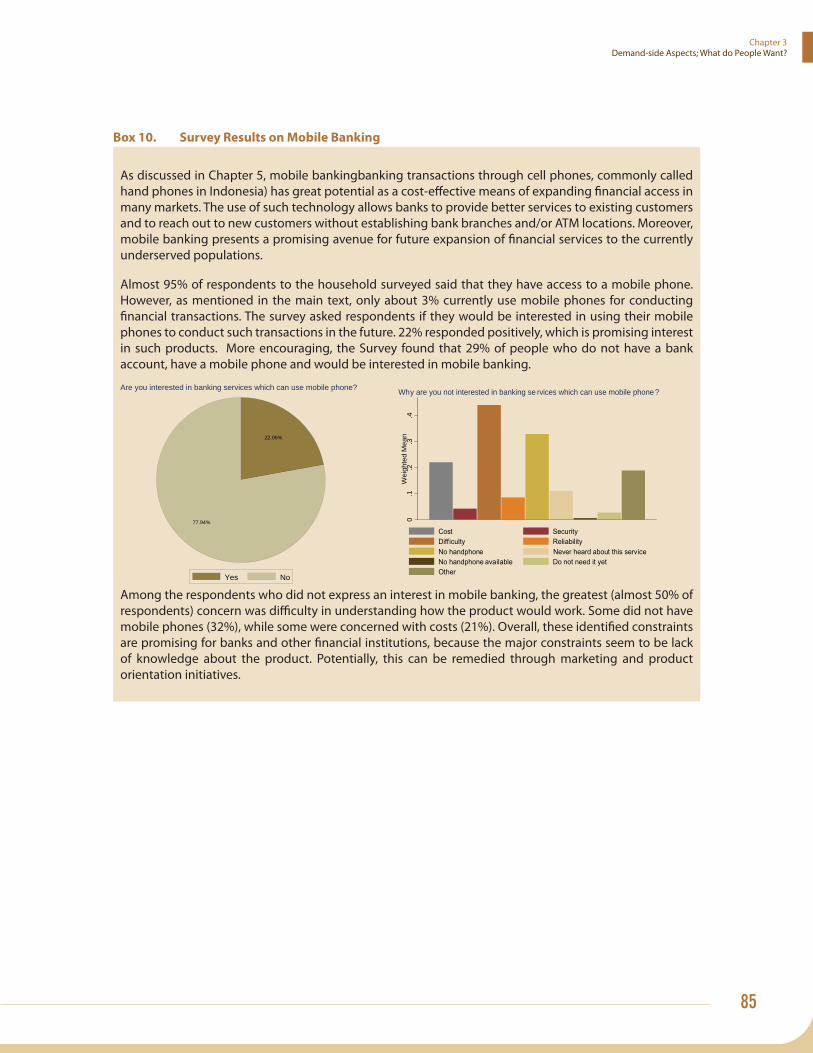
85
Chapter 3 Demand-side Aspects; What do People Want?
Box 10. Survey Results on Mobile Banking
As discussed in Chapter 5, mobile bankingbanking transactions through cell phones, commonly called hand phones in Indonesia) has great potential as a cost-eff ective means of expanding fi nancial access in many markets. The use of such technology allows banks to provide better services to existing customers and to reach out to new customers without establishing bank branches and/or ATM locations. Moreover, mobile banking presents a promising avenue for future expansion of fi nancial services to the currently underserved populations.
Almost 95% of respondents to the household surveyed said that they have access to a mobile phone. However, as mentioned in the main text, only about 3% currently use mobile phones for conducting fi nancial transactions. The survey asked respondents if they would be interested in using their mobile phones to conduct such transactions in the future. 22% responded positively, which is promising interest in such products. More encouraging, the Survey found that 29% of people who do not have a bank account, have a mobile phone and would be interested in mobile banking.
0.1
.2.3
.4W
eigh
ted
Mea
nWhy are you not interested in banking se rvices which can use mobile phone?
22.06%
77.94%
Yes No
Are you interested in banking services which can use mobile phone?
Among the respondents who did not express an interest in mobile banking, the greatest (almost 50% of respondents) concern was diffi culty in understanding how the product would work. Some did not have mobile phones (32%), while some were concerned with costs (21%). Overall, these identifi ed constraints are promising for banks and other fi nancial institutions, because the major constraints seem to be lack of knowledge about the product. Potentially, this can be remedied through marketing and product orientation initiatives.
Improving Access to Financial Services in Indonesia86
Chapter 3Demand-side Aspects; What do People Want?
Box 11. Survey Results on Financial Literacy
In recent years, there has been considerable attention in policy circles on the provision of fi nancial literacy training to poorer segments of the population. However, this push for fi nancial literacy programs has not yet been justifi ed on the basis of solid evidence regarding the needs of target groups and on the outcomes of these programs. In order to explore these issues, the survey attempted to determine current levels of fi nancial literacy. As part of this, all respondents were asked to address a set of questions on mathematics and logic (cognitive ability), which yielded a math skills score.
A signifi cant proportion of respondents scored well on tests of mathematical ability (81% correct). Among all survey respondents, 74% of households claim they are interested in fi nancial matters. Also, a large proportion (78%) were able to understand reasonably complicated fi nancial concepts, such as the concept of compound interest. However, only 52% managed to answer all fi nancial literacy questions correctly. An even smaller proportion (44%) showed a comprehension of issues related to loan portfolio choice. And an even smaller proportion again (28%) demonstrated a comprehension of the concept of risk diversifi cation. It was particularly noteworthy that the worst scores were on a question concerning an interest rate calculation on alternative loan repayment schemes, with less than half respondents choosing the correct answer.
A much higher proportion of urban households demonstrated fi nancial literacy than rural households (60% vs. 47%) with urban respondents scoring higher in all categories related to fi nancial literacy. In terms of gender diff erences, a slightly higher proportion of men demonstrated fi nancial literacy than women (54% vs. 50%), with men doing better in the mathematics test in particular (83% vs. 79%). In terms of income levels, a markedly higher proportion of better off households demonstrated fi nancial literacy than poorer households (57% vs. 47%), also demonstrating better math skills (85% vs. 76%). Finally, a far higher proportion of households with formal savings accounts demonstrated fi nancial literacy than those without (60% vs. 41%), with these households also scoring better at math (88% vs. 71%).
Taking the analysis a step further, Annex K presents econometric results where households’ fi nancial literacy score is regressed on a range of potential explanatory variables. The regression analysis shows that household heads are more likely to be fi nancially literate if they are: male; older; have attended school; and score well on the math test. Further, urban, wealthier and smaller household heads score better on fi nancial literacy, as do households that own an enterprise. Owing a house is inversely related to fi nancial literacy, but this is roughly off set by certain amenities in the house. Investing in housing by those with limited fi nancial literacy is not surprising, because it is a simple, useful way to save and invest, especially by lower-income groups who (as noted in Section 3.4.2) do not understand banks or do not see the advantage of having a bank account.
3.8.2 Other Survey Results: Expressed Demand for Financial Products
As preliminary market research, the Survey asked respondents whether they would be interested in specifi c fi nancial products. In response, 43% of the respondents stated that they would be interested in a commitment savings product, in which funds are is set aside, usually for 6 months to a year, without the option of withdrawal.48 Also, 50% of respondents expressed an interest in a retirement savings product. Furthermore, 25% of respondents stated that they would use the services of a deposit collector who, for a small fee, would come to their village or town to collect monthly savings to deposit them at a local fi nancial institution.
48 Ashraf, Karlan and Yin (2006) fi nd that such programs do lead to signifi cant gains in savings, especially for women.

87
Chapter 3 Demand-side Aspects; What do People Want?
A higher proportion of urban respondents were interested in both the commitment savings (49% vs. 39%) and retirement savings products than rural respondents (54% vs. 47%). A higher proportion of higher income earners were interested in commitment savings products (50% vs. 41%) and retirement savings products (53% vs. 47%) than were lower income earners. A higher proportion of respondents who already have bank savings accounts express a desire for both commitment savings and retirement savings products compared to the unbanked population (49% vs. 35% and 60% vs. 38% respectively). There were no signifi cant diff erences in terms of the gender of respondents. These results are potentially useful for banks and other fi nancial services companies that may be considering the development of products to meet underserviced needs. Pilot testing of these types of products would be a useful way to try to increase access to fi nancial services for the currently under-served population.
Another section of the survey questionnaire sought to determine the deterrents preventing un-banked respondents from opening a bank account. To determine how best to alleviate two of principle identifi ed constraints (cost and fi nancial literacy), hypothetical questions were posed to households who currently did not have bank accounts. The survey results show that 37% of the unbanked population would be interested in opening a bank account if the bank account fees were cut by 50%. A substantial 58% would be interested in opening a bank account if these fees were completely eliminated. In addition, 74% of the unbanked would be interested in attending fi nancial literacy training. Moreover, these results are relatively homogeneous, except that: urban populations are signifi cantly less interested in fi nancial literacy training programs; and men seem to be more willing to open bank accounts if fees are cut by 50%, although this diff erence is no longer signifi cant if fees are cut by 100% (or more). These matters are discussed further in Box 12.

Improving Access to Financial Services in Indonesia88
Chapter 3Demand-side Aspects; What do People Want?
Box 12. Evidence on Easing Constraints to Opening Bank Accounts
As noted in the main text, the survey indicated that lack of funds and limited fi nancial literacy were the main constraints to opening a bank account. A question arises as to whether addressing these constraints would induce households to open bank accounts. Using a randomized evaluation design, Cole, Sampson and Zia (2009) use survey data and unbanked respondents from the A2F Survey to answer this question.
The researchers directly tested the effi cacy of fi nancial education by off ering a course on bank accounts to a set of unbanked households that were survey respondents on Java. Among the sample of unbanked households, half were randomly invited to a group-based, 2-hour fi nancial education seminar in which participants were educated on the benefi ts of savings; of having bank accounts; and the procedures to open bank accounts. The results indicate that the fi nancial education program did not have any signifi cant overall impact on the likelihood of opening bank accounts. However, the researchers found signifi cant positive impacts for fi nancially illiterate and unschooled households. In other words, it demonstrated that providing fi nancial literacy training to people with low levels of education has signifi cant benefi ts.
A separate experiment was designed to investigate whether lower fees would increase of likelihood of opening bank accounts. Three levels of incentives were off ered to randomly selected households, with the lowest amount representing a fraction of the bank account opening and maintenance fees. The largest amount was greater than these fees.
In stark contrast to the results on fi nancial education, the research found a strong, signifi cant impact on the likelihood of opening bank accounts by off ering households fi nancial incentives to cover bank account fees. For example, the research demonstrated that more than one third of participants would be interested in opening an account, if fees were cut by 50%. This result is important because the sample size was quite large, including all those without a bank account, which is almost half of the total population. The large size of the sample boosts statistical reliability.
These results suggest that lowering banking fees could be a useful mechanism for increasing fi nancial participation. In addition, it demonstrates that well-targeted fi nancial literacy training might be useful.
3.9 Summary of Policy IssuesThis section summarizes the policy issues arising from the discussion of survey results in this Chapter. Policy recommendations are provided in Chapter 6. The discussion below addresses major service areas. In particular, it notes that few signifi cant gender diff erences are uncovered by this survey.
Limited Reach of the Formal Financial System: A recurring theme of this Chapter is the limited reach of the formal fi nancial system in Indonesia. The reach of banks, even including BPRs and BRI’s Unit Desa system, is shown to be particularly limited. The survey showed that less than half of Indonesians save at a bank and, of those who do so, two thirds also save at some type of informal institution. Similarly, the survey indicates that only 17% of the population borrows from banks, compared to the 43% that borrow from informal sources. This is striking evidence of the banks’ currently unfulfi lled potential to contribute to poverty alleviation, if suffi ciently low-cost means can be found for these markets to be commercially attractive to the banks.
In looking at the constraints to accessing banking services, physical accessibility is not generally regarded as a signifi cant problem. To be sure, customers in rural off -Java regions require long times to reach bank branches, especially if water transport is involved. However, the vast majority (over 95%) of survey respondents stated

89
Chapter 3 Demand-side Aspects; What do People Want?
that bank branches are conveniently or very conveniently located. To underscore this point, bank outlets are, on average, already more conveniently located than key public services such as basic health and education facilities. To identify constraints to accessing fi nancial services, it is necessary to look beyond physical access.
Important Financial Services: On the basis of this survey, the single most important fi nancial service is a savings account, with the most commonly stated reason for holding one being ‘security’ (Table 16). As a policy issue, this highlights the importance of policies to maintain overall fi nancial sector stability as well as to promote savings products targeted at lower-income households. Credit is important, too, but usage is currently concentrated in the local informal sector and is widely diversifi ed among diff erent types of institutions.
Savings Accounts: As mentioned, approximately two thirds of Indonesians save, although they mainly use the services of informal providers to do so. Those who do save at banks actually make greater use of non-bank service providers. Among ‘exclusive users’ (those who use only one type of service provider), the most commonly used service providers were informal providers. For policy, this implies that there is a large demand for formal fi nancial services, if conditions are right for Indonesians to move their savings out of the informal sector and into the formal fi nancial system. The primary reason for saving in banks is ‘security’ (Table 16), which underscores the vital importance of continuing to maintain confi dence in the banking sector.
Table 16. Summary of Households Use & Interest in Formal Financial Products
Use of Existing Bank Products Reasons for Using Bank Services Formal Product % use % useSavings Account 41% Provides Security 53%ATM Card 20% Saving for Future Needs 42%Loans 17% Transfer Money 37%Mobile Banking 3% Emergency Needs 31%Credit Card 2% Access to other Financial
Services 26%
Interest in Prospective Financial ProductsFormal Product % interest Notes:Retirement Savings 50% Mainly of interest to urban residents; the better-off ; and
those already holding a bank account.Contractual Savings 43%Deposit Collector Service 25% Mainly of interest to those in rural areas.Mobile Banking 22%Cheaper products If bank fees cut in half 37% For those who don’t have a bank account. If bank fees eliminated 58% For those who don’t have a bank account.
As for reasons for not saving, the highest proportion of non-savers stated that economic reasons prevented them from saving. People believe they don’t have enough money to make good use of a bank account or they state that they don’t have a job, so they do not have a savings account. This points to the importance of broad-based policies to raise incomes as the most eff ective means of eliminating constraints to accessing fi nancial services. These reasons also tend to hold across all income segments, which provide some room for targeted policy interventions in the form of public education programs.

Improving Access to Financial Services in Indonesia90
Chapter 3Demand-side Aspects; What do People Want?
Credit: The proportion of Indonesians who borrow is approximately 60%, although the great majority borrow from informal sources and a mere 17% borrow from a bank. Borrowers tend to be married; relatively well-off ; educated and older. They also to be relatively moderately indebted, which indicates that policies need to focus more on the broader provision of fi nancial services, rather than being narrowly intended to raise borrowing.
Nominal interest rates tend to be high, except for loans from employers, friends and neighbours. Informal sources are the most expensive, whereas banks and MFIs ball approximately into the middle. Both banks and MFIs charge lower rates to borrowers who have a bank account. For policy purposes, this suggests that one simple, low cost solution for borrowers who want a lower interest rate is to open a bank account. Lack of collateral does not appear to be a generalized problem. It is an issue for some banks, but these currently serve a minority of Indonesian borrowers. Among many providers, including informal providers, MFIs and BRI’s Unit Desa program, the principle of lending against income, rather than collateral, is already well-established. Other problems, such as the lack of documentation to access loans, appear to be more signifi cant constraints than lack of collateral.
The ‘Truly Excluded’: This report investigates the characteristics of a group referred to here as the ‘truly fi nancially excluded’. This group is defi ned as those who have neither a savings account of any kind nor a loan. Predominantly, those in this group are poor and uneducated; they live off -Java in rural areas; and they do not own a non-farm enterprise. There are slightly more women in this category than men, but the diff erence is relatively minor. For policy purposes, it is clear that the rural, uneducated poor in locations off -Java should be the target of specifi c interventions.
Insurance: The survey fi nds a surprisingly high rate of usage of insurance, but mainly in the form of travel insurance and public health insurance of one form or another, particularly those provided for government employees and other specifi c categories of the population. Other types of insurance tend to appeal primarily to high income earners in urban areas. Among the poor, it appears that having a household member working abroad serves as an elementary form of insurance, eff ectively substituting for formal insurance.
New Products: there is a range of products that could be developed by formal service providers and that appear to be potentially of high interest to consumers (see Table 16). For example, these include contractual savings products for urban residents or mobile savings services for rural residents. As for extending the reach of formal bank services deeper into the lower strata of society, the most promising means for achieving this appears to be mobile banking. Even the poorest residents of remote villages have access to mobile phones now. As a result of this, the survey demonstrates that there is considerable interest in mobile banking among those with a mobile phone but no bank account.
Pricing and Training: regarding the pricing of bank accounts and other fi nancial services, the Survey indicates that consumers will respond to attractive pricing of fi nancial services. However, the results also suggest that demand is marginally price inelastic, which means that it may be against the banks’ fi nancial interests to reduce fees. One policy option – that is currently being implemented by Bank Indonesia in partnership with several banks – is to off er basic banking services or ‘no frills’ accounts, an option that some banks already off er. Another option is to encourage technological advances, such as mobile banking services, that allow banks to reach more customers at lower unit cost.
With regards to fi nancial literacy training, the results of the survey suggest caution regarding recent global trends towards fi nancial literacy training programs. The experimental results show that fi nancial literacy training is an eff ective inducement to participate in the fi nancial sector amongst only specifi c subsets of the trainees. The policy lesson is that careful targeting of such programs on specifi c demographic groups would be needed to yield signifi cant positive results.
91
Chapter 4
Regulatory Impediments to Access
4.1 IntroductionThis chapter attempts to address the following questions: To what extent does the Indonesian regulatory environment promotes or restricts access to fi nancial services? What policy interventions could improve access to fi nancial services while at the same time maintaining the prudential safety of the fi nancial system?
As noted in Chapter 1, addressing issues related to access to fi nancial services involves a thorough examination of price and non-price barriers to the use of those services.49 From the regulatory side, the goal should be to establish “rules of the game” that create a conducive environment to off ering fi nancial services that fulfi l the needs of the market at a fair, market-driven prices. The regulatory environment should facilitate meeting the needs of potential customers who are voluntarily and involuntarily excluded, as discussed early in the report. In theory, consumers who choose not to use fi nancial services do not pose a regulatory issue: this relates to lack of supply, but to a lack of demand resulting from the free decision of consumers. However, in the case of Indonesia, there are large areas of unmet demand. In this case, it is clear that consumers want formal fi nancial services but are unable to obtain them, due to issues such as the lack of appropriate products and geographic isolation.
At the outset, it is also important to note that there is often a confl ict between the goal of maintaining the prudential safety of the fi nancial system and of promoting broader access. In making policy recommendations, it is very important to balance such confl icting objectives. With specifi c reference to promoting access to fi nancial services on the part of low-income households and MSMEs, diff erent countries have taken diff erent approaches. South Africa, for example, has adopted an affi rmative action approach (see Box --). Supporters of this approach claim that provides a solid policy framework for the future development of the industry, adding that it will underpin sound business practice and maintain the strength and stability of the fi nancial sector. This report bases its recommendations on the premise that these recommendations should encourage the development and maintenance of sustainable practices within the broader Indonesian fi nancial system. Thus, drawing on international experience, its recommendations for integrating low-income households and MSMEs into the overall fi nancial system assume the following: 50
49 Demirguc-Kunt, Asli; Beck, Thorsten; and Honohan, Patrick (2008), p. 27.
50 Ledgerwood (1998), p. 2-3.

Improving Access to Financial Services in Indonesia92
Chapter 4Regulatory Impediments to Access
1. Subsidized credit, policy-directed lending and debt forgiveness in general undermine economic development, including for poor households;
2. Interest rates should be set to cover costs of funding, risk, loan losses and transaction costs;
3. Interest rate caps usually limit service and encourage high arrears, especially in areas of poor fi nancial literacy; and
4. Regulation should encourage scale, effi ciency and enterprise to integrate microfi nance into the formal fi nancial sector over the long-term.
Absent these, regulation may favor low-income households and MSMEs to such an extent that the supply of fi nancial services actually deteriorates. For instance, poor regulation could disrupt informal markets that are not mature enough for formal regulations, but that reliably provide fi nancial services.
Box 13. South Africa’s Approach to Improving Access to Financial Services
In October 2003, the Banking Council of South Africa released its “Black Economic Empowerment” (BEE) charter. This charter calls for increased access to fi nancial services for poor households and communities through the direction of billions of rand into investment in transformational infrastructure, agricultural development, low-income housing and small- and medium-sized black businesses. Among other things, the charter seeks to facilitate signifi cant increases in black ownership and control, management and skills development over the next ten years.
The charter was developed by the fi nancial sector as a whole, including representatives of banks, long and short-term insurers, black professionals and black business, unit trusts, fund managers and brokerage fi rms. It is a voluntary commitment that was agreed upon unanimously by ten industry associations in the fi nancial sector. The charter states that the target should be achieved through sound business practise.
The broad-based thrust of the charter is refl ected in the fact that 81% of the charter targets relate to the employment, training and promotion of black people; improvement of access to fi nancial services by poor people; targeted investments in projects that address backlogs, underdevelopment and support job creation; and the procurement of services and goods from black businesses. The fi nancial sector committed itself to fostering new and developing BEE companies. This includes, where appropriate, referring business opportunities to, and procuring fi nancial services from, black-owned fi nancial institutions.
With specifi c reference to access to fi nancial services, there was provision for eff ective access of 80% of people in LSM 1-5 (the lower half of South Africa’s measure of living standards) to products and services in life assurance, collective investments, short-term risk insurance and banking services. There was also provision for 0.2% of the post-tax operating profi ts of the fi nancial sector for consumer education.
Concerning empowerment fi nancing, some R75bn of total empowerment fi nancing was directed towards the provision of fi nancing for or investment in targeted investments and BEE transactions. Of this, approximately two thirds will be targeted investments in low-income housing, transformational infrastructure, agriculture and black SMEs; one third would be BEE transactions.
The charter came into eff ect on 1st January 2004, with the target date for the achievement of its goals set for the end of December 2014. Companies are committed to publishing annual BEE reports, including audited scorecards. Achievements, encapsulated in an annual scorecard and charter rating, were to be one of the factors measured by government in the award of state tenders, and by businesses in their commercial dealings with each other.
A mid-term review is due in 2009 and a comprehensive review in 2015. The intention is that, while the charter targets have a fi nite 10-year life, the principles and commitment to empowerment will live on after 2014.
Source: See http://www.fscharter.co.za/page.php?p_id=1 and http://www.banking.org.za/

93
Chapter 4Regulatory Impediments to Access
4.1.1 Indonesia’s Financial Regulators & Supervisors
In Indonesia, the main regulatory and supervisory bodies are:
i) Bank Indonesia (BI) is the central bank, with the mandated role of this institution being the supervision of the banking system and the maintenance of the stability and value of the rupiah.51 To achieve this, BI implements monetary policy, governs the smooth functioning of the payment system and regulates deposit-taking institutions, particularly banks;
ii) Ministry of Finance (MoF) plays a signifi cant role in establishing and maintaining economic and fi scal policy. This ministry regulates capital markets and most non-bank fi nancial institutions, through Bapepam-LK. The MoF is also responsible for granting certain licenses that establish legal status and the issuance of tax regulations for all fi nancial institutions;
iii) Ministry of Cooperatives and Small-and-Medium Enterprises (MCSME) has jurisdiction over the establishment of cooperatives services outlets.52
In Indonesia, diff erent fi nancial providers are covered by diff erent regulators and regulations (Table 17). This is as much the result of the historical development of these diff erent institutions as it is about diff erences in the products they off er.
51 Article 7 of Bank Indonesia Act No. 23 of 1999, as subsequently amended.
52 Appendix to Minister Decision No. 351/KEP/M/XII/1998. The authority and objectives of the MCSME are detailed out in Decree No. 9/M/2005, Article 94 and 95.

Improving Access to Financial Services in Indonesia94
Chapter 4Regulatory Impediments to Access
Table 17. Financial Providers and Financial Services in Indonesia
Financial Provider Organizational Format Ownership Regulatory Status Range of Financial Services
Permitted
1st and 2nd Tier Commercial Banks (Bank Umum)
Limited Liability Company, Government Enterprise
Private sector entities, and public sector ownership
Regulated and licensed by Bank of Indonesia
Lending, small scale business loans (KUK), business development service providers (BDSP), savings facilities
People’s Credit Banks (Bank Perkreditan Rakyat or BPR)
Limited Liability Company, Government Enterprise
Private sector entities or stakeholders, no foreign ownership
As above As above
Village Credit Banks (Badan Kredit Desa or BKD, currently a sub-set of BPRs)
Limited Liability Company, Government Enterprise
Private sector entities or stakeholders
Regulated and licensed by Bank of Indonesia; supervised by BRI
Lending, small scale business loans (KUK), business development service providers (BDSP), savings facilities
Rural Credit Fund Institutions (Lembaga Dana Kredit Pedesaan or LDKP)
Limited Liability Company, Government Enterprise
Mostly owned by provincial governments
Mainly regulated and licensed by provincial govts; supervised through BPDs
Lending, small scale business loans (KUK), business development service providers (BDSP)
Non-Bank Financial Institutions (NBFI)
Limited Liability Company, Government Enterprise
Private sector entities or stakeholders; some public sector ownership
Ministry of Finance
Leasing, consumer fi nancing, credit cards and provision of funds and capital goods
Village Unit Cooperative ( KUD)
Membership-based cooperative or credit union
Members Ministry of Cooperatives and SMEs (MCSME)
Lending to members only
Saving and Loan Cooperative (KSP)
Membership-based cooperative or credit union
Members MCSME Lending, savings, time deposits to members only
Islamic Cooperatives (BMT)
Membership-based cooperative or credit union
Members MCSME Lending, savings, time deposits to members only
Pawnshop State chartered institution with branches
Government/Ministry of Finance
Government of Indonesia
Micro-loans, emergency loans and transactions-for-cash, certifi cations for minerals and stones
NGO MFIs Non-profi t association, trust or foundation
Private sector entities or organization
No regulation Savings and lending facilities and social services
Source: World Bank staff research.

95
Chapter 4Regulatory Impediments to Access
4.2 Assessment of the Current Regulatory System, by Service Provider
In reviewing the current regulatory framework to assess its impacts on access to fi nancial services, this report drew on background work related seven broad functional areas, namely:
(i) Entry into the industry: capital requirements; management qualifi cations and certifi cation; and ownership;
(ii) Activities related to asymmetric information between clients and fi nancial institutions: “Know Your Customer” principles; the debtor information system (Credit Bureau); customer protection; transparency of fi nancial conditions; transparency of fi nancial products; and deposit insurance;
(iii) Prudential supervision: regular on-site supervision; capital adequacy; statutory reserves; legal lending limits; etc;
(iv) Pricing of fi nancial products: deposit and lending interest rates.
(v) Servicing of fi nancial products: saving products; loan products; accessibility; and funding;
(vi) Exercising claims/remedies: debt restructuring; and execution of collateral; and
(vii) Sustaining the industry: unsound ratings/conditions; mergers and acquisitions; single presence policy; and liquidation.
Content summaries of the relevant regulations are presented in Annex L-N. They cover the three most important types of service provider for current purposes, these being: i) banks; ii) fi nance companies; and iii) cooperatives.
4.2.1 Regulatory Barriers to Access: Commercial Banks
With the notable exception of Bank Rakyat Indonesia (BRI; see Box 4) and a handful of other large banks that have a large branching network,53 commercial banks in Indonesia have yet to play a major role in direct access to fi nancial services for low-income households.
Current Tight Entry Restrictions
In terms of regulatory barriers, the most signifi cant of these at present concerns entry. In principle, licensing is open, but minimum capital is fairly high and it is diffi cult for a fi nancial institution to obtain a new license. For all practical purposes, newcomers must takeover an existing bank.54 As part of the API, this is explicit policy on the part of Bank Indonesia, designed to reduce the number of banks by encouraging mergers and industry consolidation.
53 As of late 2008, BRI had over 5,200 branches. The next largest, Bank Danamon, had around 1,175, including its small, regional (DSP) outlets. The others with large networks are: Mandiri (almost 1,000); BNI (962); and BCA (819). Another, Panin-ANZ, is currently implementing a major expansion in its branching network.
54 For example, HSBC has bought some 89% of Bank Ekonomi; Maybank has acquired Bank Internasional Indonesia; and Barclay’s has bought Bank Akita.
Improving Access to Financial Services in Indonesia96
Chapter 4Regulatory Impediments to Access
Monthly Fees and Minimum Balances Vary Considerably by Bank: Most Look High
Based upon the Survey results of Chapter 3, the more serious impediments to access arise from high monthly fees and high minimum account balances. As a result of such charges and conditions, the relative costs of holding a low value accounts can be extremely high, with, for example, monthly administration fees in far in excess of interest paid on small deposits.
An investigation of these issues shows that minimum balances and monthly administration fees are matters determined by internal corporate policy, not BI regulation. Minimum balances vary considerably by bank, with two of the most popular (BRI’s popular Simpedes account and Bank Danamon’s DSP Savings accounts) set at Rp100,000 (about US$10),55 which is relatively low. By contrast, BCA’s advertised opening minimum balance on their ‘Tahapan’ account for individuals is considerably higher (Rp500,000),56 and industry analysts believe that this is typical of other large commercial banks. On the basis of this evidence, minimum monthly balances do not look like a major, generalized constraint to accessing fi nancial services.57 However, some banks are certainly higher than others, which may require lower income households to be selective in choosing services appropriate to their needs (also see comments regarding fees at BPRs in the following Section).
Some Monthly Admin Fees Hurt Small Savers
While minimum opening balances may not be a major constraint to accessing fi nancial services, it appears that bank charges are often a diff erent matter.58 Most banks intentionally structure their bank charges and interest payments in a way that discourages small deposits. Indeed, the pricing structure usually ensures that with smaller account balances, charges are such that the balance eventually falls to zero.59 Banks do this because small accounts are administratively costly to maintain and because unilaterally closing a non-zero dormant account entails (contingent) fi nancial liabilities. (Also see the continued discussion concerning BPRs, immediately below). It would be helpful if BI were to establish a clear policy in this area, perhaps making it much easier for banks to close non-zero dormant accounts after an appropriate period of time - perhaps two years. One possibility would be to transfer funds from inactive accounts to a centralized account to be administered by a relevant centralized authority – that would therefore have low-cost funds available – while having the on-going responsibility to return funds to the depositor through the bank upon presentation of adequate identifi cation. Further work on this issue, including investigation into the number of dormant accounts, the total value and average sum of money lying in such accounts, and potential institutional arrangements to manage this issue would be helpful.
55 The rules vary slightly by bank. In general, the Rp100,000 is the minimum opening balance for a basic savings account and minimum subsequent deposits are Rp10,000.
56 See htt p://www.klikbca.com/individual/silver/ind/rates.html?s=3 as of 12 May 2009. Subsequent minimum deposits are Rp50,000 and the minimum balance is Rp10,000. BCA staff note that there is no minimum balance requirement for 2 years for their main TKI product.
57 As for foreign currency accounts (which are little used by poorer households), one upper-tier bank charges a monthly admin fee of US$1 on its US dollar accounts. At rates of interest on deposits in early 2009, (which were unusually low at that juncture), these charges exceed interest earnings on accounts of less than some US$950.
58 The monthly fee on BRI’s Simpedes account (without an ATM card) varies between Rp2,000 and Rp5,000, depending upon the size of the account. The smaller fee is for an account less than Rp300,000 (US$30); the larger amount is for an account above Rp1,000,000 (US$100). At BCA, the monthly admin fee is Rp5,000 for basic accounts. Bank Danamon’s DSP has no monthly admin fee for a Savings Account, if the average monthly balance is greater than Rp100,000.
59 BRI’s Simpedes account, for example, has an implicit breakeven point of Rp3 million; above this amount the balance will increase because interest paid exceeds admin charges. But below Rp3 million, the account will eventually drop-off to zero (because admin charges exceed interest paid).

97
Chapter 4Regulatory Impediments to Access
Another approach to improving access to fi nancial services would be to encourage or require banks to off er a basic or “no frills” account that include a zero (or very low) monthly administrative fee 60. This would be consistent with an approach that is being tried in several countries, where accounts are off ered with a package of free or low-cost services, with strict restrictions on the menu of services and the amounts that can be held in the accounts. In some countries, for example, these “no frills” accounts may not attract a charge provided that transactions are carried out at ATMs or in other ways that minimise the cost to the fi nancial institution.
Basic banking has been off ered in some countries for a long time, including a number of developed countries such as Canada, France, Sweden, and the United States. In the US, “lifeline” banking was introduced in the 1980s and 1990s. In Sweden, banks are not allowed to refuse applicants wishing to open a savings or a deposit account. Similar provisions exist in France and Canada.
Although there has been no rigorous evaluation of the effi cacy of these schemes in developed countries, several developing countries are trying to implement similar policies to improve the level of access to fi nancial services. Pakistan introduced a regulation requiring banks to off er basic-accounts in 2005. Mexico’s 2007 regulation provides a list of services that banks must off er free of charge to any applicant who meets certain specifi ed requirements and whose account is below a certain size. India regulation mandated the Zero Balance account in 2005. South African banks voluntarily introduced the so-called Mzansi accounts, with no minimum-balance requirements and no maintenance fees but with a minimum set of services off ered. A recent evaluation by the World Bank drew a distinction between regulations mandating the right to basic bank accounts and the availability of such accounts at banks (whether off ered because of mandatory regulation or off ered voluntarily)61. The fi nding was that the availability of basic accounts is positively associated with the level of access to fi nancial services as measured by the number of accounts held per thousand adults. However, the evaluation notes that regulations requiring banks to off er such accounts seemed to have less of an eff ect on access (although the study qualifi es this by stating that not enough time may have passed between the implementation of the regulations and the assessment for the impact to have been felt). The bottom line, therefore, appears to be that the availability of basic accounts in banks facilitates an increase in access to fi nancial services and that the practice of off ering basic bank accounts matters more than regulations mandating such a practice.
In October 2009, Bank Indonesia encouraged 22 banks to participate in the launching of a new saving product called “TabunganKu” (My Saving) in early 2010. This initiative is intended to provide access to banking services for the millions of people in Indonesia who are believed to have the fi nancial capacity to save money, even if only small amounts. As discussed above, small depositors are often discouraged by the monthly administrative fees that banks normally charge, which often results in the closing of a savings account of such depositors due to inadequate balance. To appeal to such small depositors, the initial deposit for the TabunganKu product will be IDR 20,000 (US$2) with no administrative fees. In addition, Interest will be calculated based on daily balances. To support the introduction of this product, Bank Indonesia is also promoting improved fi nancial literacy through a new theme called “3Ps”, which stands for Pastikan Manfaatnya (ensure the benefi ts), Pahami Risikonya (understand the risk), Perhatikan Biayanya (be careful of the costs).
Restrictions on New Branches: Not As Diffi cult As It Seems
Bank Indonesia sets regulations and conditions for established banks intending to open new branches. First, BI will only issue the license for a new domestic branch offi ce after an analysis of the respective bank
60 World Bank, (2008). “Banking the Poor”.
61 World Bank, (2008). “Banking the Poor”.

Improving Access to Financial Services in Indonesia98
Chapter 4Regulatory Impediments to Access
capacity and market. In principle, the criteria for BI’s assessment relate to the current level of competition among banks; the saturation level of the market; and role of the bank in national economic development. Second, expansion of a commercial bank’s branches needs to have been identifi ed in the bank’s business plan of the previous year, a condition that may seem to restrict banks’ ability to respond quickly in the face of changing market conditions.62
In fact, feedback from banks indicates that neither of these requirements create serious problems in practice, as BI has adopted a relatively liberal attitude in implementing these regulations. Representatives of Bank Indonesia do inspect the location, but their interests seem to be limited to security and IT capacity (which is used as a proxy indicator of management capability). Bankers comment that, in most cases, the site inspections do not pose serious hurdles. Regarding the second requirement, that banks must include the listing of a new branch in their annual business plans, banks with large branching networks indicate that this is not a major problem. They comment that one year is not a long planning horizon, and they note the opportunity at mid-year to modify their plans, with the qualifi cation that they can down-scale their plans at mid-year, but not up-scale them. Apparently, for a bank with good corporate governance, this limitation on branching is not a problem, while for others, it may impose a useful discipline. Banks make diff erent points about the cost of branching regulations. For example,63 they say that their major problem arises in the negotiation of rental contracts for branch locations. Potential landlords know that the banks have very limited fl exibility in location and timing, and the rental rates are priced accordingly, which unnecessarily infl ates banks’ costs. To the extent that these costs are passed on to customers, it has an adverse impact on pricing and access.
Restrictions on Relocations of Branches and ATM are More Problematic
Since early 2009, Bank Indonesia (Regulation No. 11/1/PBI/2009, regarding Public Banks) has required detailed information on the locations of existing branches and ATMs. Even relocations of ATMs to diff erent fl oors of the same building must be reported to BI. It would be helpful for BI to reassess the need for these sorts of detailed information requirements. It seems more reasonable to require descriptions of the locations of branches and ATMs in relatively general terms, which would allow the banks more fl exibility in their extension of services to customers. This would be particularly helpful for facilitating the development of branchless banking models, in which ATMs are often a prime point of access for the withdrawal of funds.
Currently, ‘Directed Lending’ is Not a Substantive Policy Instrument
Following an unsatisfactory experience with directed, small-scale lending in the 1990s, in recent years Bank Indonesia has been using ‘moral suasion’ to encourage bank lending to MSMEs (see Section 5 of Annex L). Specifi cally, self-determined targets for MSME lending must be published in the bank’s annual business plan, which looks like the opportunity for BI to encourage greater small-scale lending. As a matter of regulatory reform, it looks more cost effective for banks—and would serve the same purpose for BI—if this information were published in the banks’ audited accounts at year-end. For purposes of the business plan, a general statement of intentions should suffice. Publication at year-end affords banks the flexibility to respond in the course of the year to changing market conditions. Feedback from banks indicates that Bank Indonesia is generally implementing this policy in a liberal way and thus, in practice, it is not a signifi cant issue for access to fi nancial services.
62 Indeed, the time horizon could be 18 months or longer, depending upon the timing of the bank’s internal decision to go ahead with a new branch.
63 There may also be a problem of policy consistency as between Bank Indonesia’s head offi ce and BI’s regional offi ces, which do most of the on-site inspections for new branch offi ce locations. Bankers indicate that exact procedures for local inspections vary markedly by BI regional offi ce.

99
Chapter 4Regulatory Impediments to Access
Despite the fact that only a few banks play a signifi cant direct role in facilitating access to fi nancial services on the part of low-income households and MSMEs, the commercial banks nonetheless played a pivotal role in ensuring open, competitive fi nancial markets. In particular, the commercial banks are most likely to be the aggressive newcomers in any promising markets, and they will put competitive pressure on existing entities to lower prices and improve service. In addition, commercial banks are developing important linkages with BPRs (see Section 5.5 of Annex L), thereby providing indirect fi nancing for medium- and small-scale loans. Most importantly, the commercial banks are profi t-driven institutions that extremely likely to actively pursue opportunities in the smaller end of the market, if those opportunities are fi nancially attractive. As technology advances (see Chapter 5, Box 22) and the cost of servicing small customers declines, the commercial banks—including foreign-owned banks—will move into commercially viable segments of this sub-sector, if the regulatory environment permits.
4.2.2 Regulatory Barriers to Access: Bank Perkreditan Rakyat (BPRs)
In contrast to commercial banks, rural banks (BPRs) play a signifi cant and direct role in providing access to fi nancial services for low-income households and MSMEs in Indonesia. By defi nition, these rural banks are relatively small and serve local areas. Often BPRs are the frontline of fi nancial services between this segment and the wider fi nancial system. Since they are rarely—if ever—large enough to pose systemic risk,64 the regulation of BPRs is light in comparison with the commercial banks. Nonetheless, systems to ensure that adequate depositor protection is in place have been implemented (see Section 4.2.4).
Minimum Capital Is Reasonable, Although Too High for Some Regions
The minimum paid-up capital for BPRs was increased by a factor of 10 or more in 1999. However, it is still not prohibitively high, ranging up to a maximum of US$ 500,000 for Jakarta (see Table 18). The minimum paid-up capital varies signifi cantly by location, with less populous areas (smaller markets) requiring smaller amounts of start-up capital (Table 18). This graduated system of minimum capital requirements appears to be a reasonable policy in terms of facilitating access, because it ensures low entry costs into small markets in remote regions of the country. Sharia BPRs enjoy even lower minimum capital requirements in certain areas (Table 18), although the economic rationale for this is unclear. It would be appropriate to reconsider the capital requirement for Sharia BPRs on the basis of risks that they face and the regions in which they operate, and to bring these back in line with those for non-Sharia BPRs. In general, strengthening the existing BPR sector while at the same time easing entry for BPRs would be likely to contribute to increasing access to fi nancial services.
Table 18. BPR Start-up Capital Requirement
Conditions BPR (conventional) Sharia BPRCapital City Territory of Jakarta Rp5 billion Rp2 billionThe districts/municipalities of Bogor, Depok, Tangerang and Bekasi
Rp2 billion Rp2 billion
A provincial capital in Java and Bali Rp2 billion Rp1 billionProvincial capital outside the area referred above Rp1 billion Rp1 billionOutside the area referred to above Rp500 million Rp500 million
Source: Bank Indonesia
64 This said, particular supervisory attention would be appropriate, if the BPR has business relationships with commercial banks, other BPRs and/or cooperatives.
Improving Access to Financial Services in Indonesia100
Chapter 4Regulatory Impediments to Access
Minimum Balances and Monthly Admin Fees are Variable
Field interviews indicate that minimum balances and monthly administrative fees at BPRs are quite low. Indeed, they are roughly half—or less—than similar fees and balances at commercial banks, with some accounts, including products intended for students, having no administrative fees whatsoever.65
compared to savings accounts or regular commercial banks, it could be argued that typical accounts at BPRs would all be classifi ed as ‘no frills accounts’. Typically, these institutions off er passbook savings accounts with no minimum number of transactions per month. Perhaps surprisingly, some BPRs also have forms of ‘contractual savings accounts’. With these products, every month a customer deposits a certain amount and receives the cash at the end of the term of the contract. There are also ‘mandatory savings accounts’ for loan customers: with these products, when a new loan is approved, the money is deposited in the account and the customer withdraws only the amount needed at the moment, leaving the rest to earn interest until it is needed. Issues concerning dormant accounts are similar to those at commercial banks.66
Signifi cant Ownership Restrictions
At present, the ownership of BPRs is restricted to Indonesian citizens (see Annex L). In particular, foreign ownership and ownership by foundations, including NGOs, is not allowed. This has worked to the disadvantage of BPRs, which often require capital, management skills and technical knowledge that could be acquired in cooperation with foreign owners and/or NGOs. While it is not clear that a large number of foreign investors would be interested in such businesses, it is diffi cult to see what the advantages in closing this possibility to the management of BPR.
Relatively Easy to Open New Accounts
Currently, customers can only open new accounts at the BPR’s heads offi ce, branches offi ces or cash offi ces. Independent of KYC regulations (see immediately below), BPRs are cautious in this regard because of the risk of fraud. In particular, there may be some legitimate concern that fake employees of BPRs may solicit new customers and abscond with the proceeds.67 Nonetheless, despite these conditions, opening a new account appears to be a quick and convenient process. In addition, special arrangements can be made, with BPR account offi cers being able to come to new depositors homes, places of work or schools to open a new account and pick up the money if so requested.
65 A typical opening minimum deposit for a BPR is Rp50,000 (US$5) which is half that at a regular commercial bank (Section 4.2.1). Often there are no minimums on subsequent deposits. Monthly admin fees are normally Rp1,000 to Rp2,000 which is less than half of commercial banks.
66 For example, the BPR will close an account unilaterally if the balance has fallen to zero and if there has been no activity for 6 months. For non-zero accounts, if the account has been inactive for a long period of time, the account will be temporarily de-activated. It will be re-activated if the customer wants to perform a transaction, but the customer must present adequate personal identifi cation to prevent fraud.
67 One BPR owner specifi cally made the point that their customers are mainly low-income with little or no educational background. This segment of customers looks especially vulnerable to this kind of crime.
101
Chapter 4Regulatory Impediments to Access
Box 14. Some History on the Regulation of Other Microfi nance Institutions
Microfi nance in Indonesia dates back more than a century to the establishment of the Priyayi Bank of Purwokerto in 1895 and the Poerwokertosche Hulp- Spaar en Landbouwcredietbank established one year later. The early Volkscredietwezen (popular credit system) fostered the emergence of thousands of small village banks with millions of micro-borrowers. The movement culminated in the foundation of the Algemeene Volkscredietbank (AVB-Bank) in 1934, which later became Bank Rakyat Indonesia (BRI). It is worth noting that the founders of BRI’s Unit Desa system consulted extensively the credit manuals of the AVB-Bank to design the now famous Kupedes loan and Simpedes savings products. a/
Other fi nancial activities of MFIs have traditionally been conducted by Village Credit Banks (BKDs) and Rural Fund and Credit Institutions (LDKPs). BKDs were formed at the end of the 19th century under Dutch colonial rule in Java and Madura as ‘village banks’ and ‘paddy banks’. LKDPs refer to various regional MFIs, most of them established between 1970 and 1990 by provincial administrations.
The Banking Act of 1992 led to a fundamental change in the regulation of micro-fi nance, with BKDs and LKDPs being required to convert into BPRs. For BKDs, the conversion was relatively simple, with the Ministry of Finance granting them a collective BPR licence, with certain exemptions from BPR regulatory requirements (e.g. minimum capital requirements, compliance with soundness ratings and the submission of standardized reports). Also, supervision was turned over to Bank Indonesia, which out-sourced this function to BRI, which had had previously supervised BKDs. BI continues to supervise commercial banks that conduct micro-fi nance operations.
For LKDPs, the transition was far more diffi cult, due to a number of factors, including confusing regulations; special exemptions; and splintered supervisory authority, including involvement by the Ministry of Home Aff airs and some provincial governments (e.g., Central Java, through its Regional Development Bank (BPD)). In the end, an estimated 27% of LKDPs converted to BPRs (or cooperatives or other permitted institutions). Others closed down or became illegal operations. At the present time, an unknown number of these institutions continue to operate on the fringes of the fi nancial system.
It is worth noting that many of these institutions that were forced out of existence were some of the fi rst institutions in Indonesia to off er Micro fi nance products. Usually, they did this sustainably and on a commercial basis, without subsidies from the government. Also, the managers of BKDs and LKDPs were prominent village members who knew their customers well, meaning that these institutions operated according to KYC principles. The fact that managers were well known in villages also improved transparency of product information, in that these managers were well positioned to explain the terms of loans to borrowers in a manner that they could understand. Finally, a strong BKD or LKDP in a village was often well-positioned to open eff ective branches, thereby expanding sustainable outreach. Given the many advantages of these institutions, it is perhaps worth refl ecting on the rationale for the regulations that have pushed many of them into an unclear, probably illegal status.
At this point, there are legitimate issues as to whether it is worth trying to formally clarify this situation until a new MFI Law can be drafted and passed by Parliament. A ‘hands off ’ approach is one serious possibility, and probably the default case. Other options might include:
• Acknowledgement of the situation by the authorities, with the licensing of these institutions as semi-formal institutions that abide by non-prudential regulation
• Adding a new licensing tier for MFIs that accommodates the functions performed by these institutions.
a/ This paragraph is borrowed from Bank Indonesia and GTZ (2000). The same source is used elsewhere in the Box.
Know Your Customer Principles (KYC) Requirements May be Problematic
In 2001, BI mandated the implementation of Know Your Customer Principles (KYC) for commercial banks

Improving Access to Financial Services in Indonesia102
Chapter 4Regulatory Impediments to Access
and BPRs in an eff ort to improve transparency and to achieve compliance with international Anti-Money Laundering (AML) standards. Unfortunately, the implementation of these principles may have reduced access to fi nancial services for low-income households.68 As an example of a new mandated requirement that may have reduced access for low income households, it is now a requirement that new depositors must sign-up in a branch offi ce. This limits the ability of banks to implement outreach services and to off er eff ective mobile banking products (see Chapter 5). In addition, more stringent identifi cation requirements have been implemented, with acceptable documents including identity cards (KTP), driver’s license or passport and other documents that list date of birth, permanent address, nationality and taxpayer identifi cation number.69 These regulations adversely aff ect fi nancial access by low-income households, especially the requirement that depositors have a taxpayer number (NPWP), as obtaining a taxpayer number is a burdensome process that may require unoffi cial payments to acquire.
However, some observers have claimed that the KYC and AML requirements in Indonesia have had no signifi cant negative impact on fi nancial inclusion. From the demand side, there seems to be no real issue concerning identifi cation cards,70 which are widely available and come in variety of obtainable forms. On the supply side, many of the KYC and AML standards coincide with normal business practices, so that the added costs to fi nancial services providers have been minimal. As evidence, they point to Bank Indonesia’s Survey of MSMEs, which indicates that most MSMEs do not have a problem achieving compliance with legal business requirements, such as the requirement to have licenses and taxpayer numbers, when applying for credit.71
To ensure that the implementation of KYC requirements do not act as a constraint to accessing fi nancial services, a number of steps might be taken to increase access without compromising security signifi cantly. For example, BI could exempt small business loans and personal loans under, say, Rp50 million from the NPWP requirement. For larger loans, BI might try linking NPWPs into a public credit registry, preferably working with the Directorate General of Taxation of the Ministry of Finance.
Burdensome Reporting Requirements for Small BPRs in Remote Regions
BPRs of all sizes are subject to relatively burdensome reporting requirements. For example,72 they are required to submit monthly fi nancial reports; quarterly budgets and progress reports against those budgets; semi-annual reports from the Board of Commissioners; and An annual business plan and budget to BI. In addition, they are required to publish courtly fi nancial statements in local newspapers and/or to post these statements in public places. They are also required to prepare an annual report and to submit KYC reports to BI and STR reports to PPATK (the fi nancial intelligence agency).
For BPRs with good IT systems, these requirements may not be a serious problem. But for smaller BPRs with limited access to on-line services, they may represent a signifi cant burden. This is particularly the case if the BPR operates in a remote location, because management may need to deliver soft copies by hand to the regional offi ce of Bank Indonesia.73 Clearly there is a trade-off between easing reporting or disclosure
68 If the amount is greater than Rp100 million, remittances are subjected to KYC principles, usually by way of identifi cation of both the recipient and sender of monies.
69 Notably, village credit banks, cooperatives, LKDP and other MFIs are exempt from these requirements.
70 For example, everyone has a KTP card. Indeed, many people have more than one.
71 See p. 34 of Bank Indonesia (2005).
72 Source: fi eld interviews by World Bank staff .
73 To be sure, there are very few BPRs in this category, perhaps only 1% of the total. Still, they are exactly the ones that are most needed to extend fi nancial services into Indonesia’s most isolated regions.

103
Chapter 4Regulatory Impediments to Access
requirements and prudential requirements. It is important to look at this issue closely and identify any scope for steps in this area that would help increase access by reducing some of the burdens on BPRs without signifi cantly compromising the principles of prudence.
Some Demanding Management Requirements
Bank Indonesia requirements state that a BPR’s Board of Commissioners must consist of at least two people, as must its Board of Directors. The individuals on these boards must fulfi ll certain educational and professional requirements. Industry sources say that it is diffi cult for some BPRs to meet these requirements, especially in remote locations of the country. Bank Indonesia could examine ways to address these issues in regions where management resources are hard to fi nd.
Doubtful Benefi ts from Disclosure Regulations
As mentioned, regulations to promote good corporate governance in general and transparency in particular in Indonesia require BPRs and commercial banks to publish a full range of fi nancial statements and product information (see Annex L). The usefulness of these regulations for BPRs is highly questionable, because BPR clients often have limited levels of fi nancial literacy and may be unable to understand the publications. For most of these clients, the reputation of the fi nancial institution and their personal relationships with its managers are far more important than written information. While maintaining certain minimum disclosure requirements to ensure that it receives adequate information from BPRs, BI could consider loosening these requirements.
Adding Metrics of Access to CAMEL
Prudential supervision of BPRs (and commercial banks) is implemented utilising the CAMEL method, (see Box 15). This method does not include any metrics to determine an institution’s level of accessibility. Notwithstanding recent crisis-driven concerns over international standards of supervision, the current CAMEL methodology is a reasonable starting point for these institutions. However, the fact that that the system does not incorporate any measurement (or proxy) relating to the level of accessibility of fi nancial services is a disincentive for banks to expand access to fi nancial services. In order to address this, this framework might be revised to include indicators of access while at the same time continuing to implement a Soundness Rating System. Some suggestions as to how this might be achieved are set out in Table 19.
Table 19. Access to Finance Indicators-Loans and Deposits
FinancialService Physical Access Aff ordability (% of GDP per capita) Eligibility
DepositsNumber
ofbanks
Deposit market share
of bank
Locations to open a deposit
minimum amount to open a checking/
savings account
minimum account balance in checking/savings account
annual fees in checking/savings account
Number of documents to open checking/savings
account
LoansNumber
ofbanks
Loan market share
Locations to submit loan applications
minimum amount consumer loan
Fees consumer
loan
minimum amount mortgage loan
Fees Mortgage
loan
Days to process consumer/mortgage loan
Sources: World Bank (2008d)
Restrictions on Opening New Branches: Very Restrictive in Theory, Not so Onerous in Practice
BPRs are subject to more restrictions on the opening of new branches than are commercial banks, described above. For instance, branches may only be opened in the same province as the BPR’s main offi ce; in order to open a new branch, the BPR must have been fi nancially sound over the past year while maintaining a capital adequacy of at least 10 percent; and the BPR must have current information technology. Again, Bank Indonesia seems to be interpreting these rules in a liberal manner. As an example of this liberality, BPRs located in border areas are allowed to conduct operations (that is, to have clients and supervise lending to clients) in
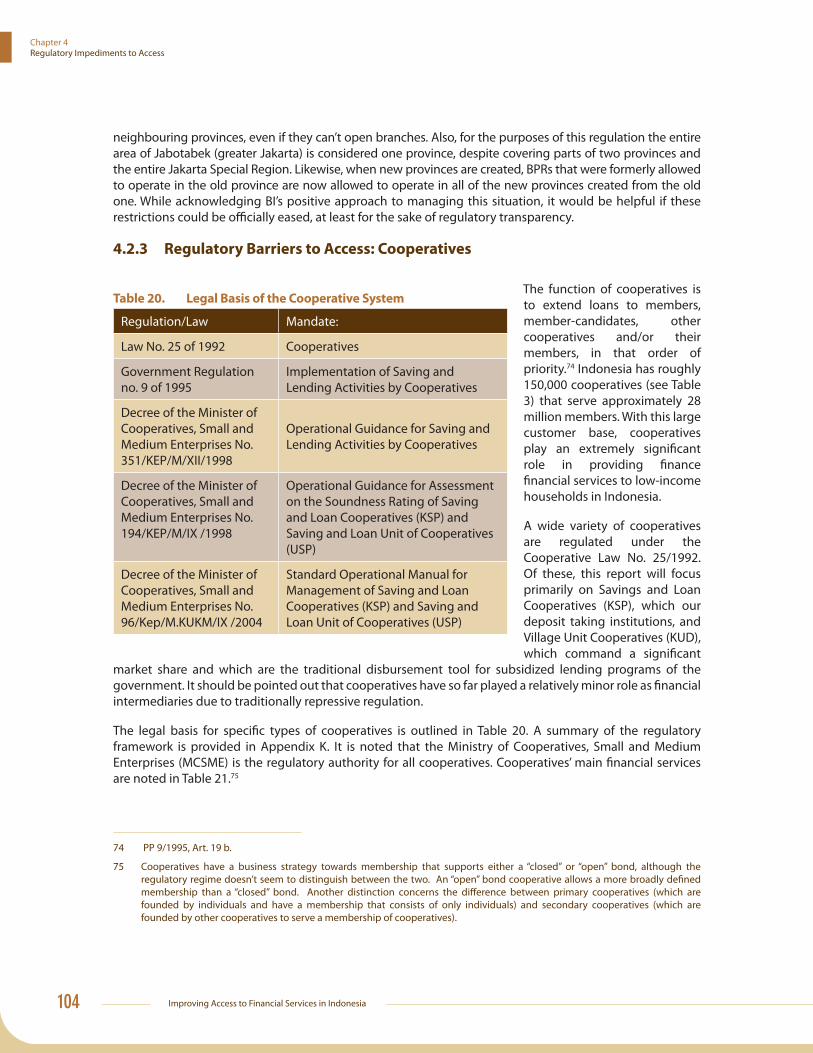
Improving Access to Financial Services in Indonesia104
Chapter 4Regulatory Impediments to Access
neighbouring provinces, even if they can’t open branches. Also, for the purposes of this regulation the entire area of Jabotabek (greater Jakarta) is considered one province, despite covering parts of two provinces and the entire Jakarta Special Region. Likewise, when new provinces are created, BPRs that were formerly allowed to operate in the old province are now allowed to operate in all of the new provinces created from the old one. While acknowledging BI’s positive approach to managing this situation, it would be helpful if these restrictions could be offi cially eased, at least for the sake of regulatory transparency.
4.2.3 Regulatory Barriers to Access: Cooperatives
Table 20. Legal Basis of the Cooperative System
Regulation/Law Mandate:
Law No. 25 of 1992 Cooperatives
Government Regulation no. 9 of 1995
Implementation of Saving and Lending Activities by Cooperatives
Decree of the Minister of Cooperatives, Small and Medium Enterprises No. 351/KEP/M/XII/1998
Operational Guidance for Saving and Lending Activities by Cooperatives
Decree of the Minister of Cooperatives, Small and Medium Enterprises No. 194/KEP/M/IX /1998
Operational Guidance for Assessment on the Soundness Rating of Saving and Loan Cooperatives (KSP) and Saving and Loan Unit of Cooperatives (USP)
Decree of the Minister of Cooperatives, Small and Medium Enterprises No. 96/Kep/M.KUKM/IX /2004
Standard Operational Manual for Management of Saving and Loan Cooperatives (KSP) and Saving and Loan Unit of Cooperatives (USP)
The function of cooperatives is to extend loans to members, member-candidates, other cooperatives and/or their members, in that order of priority.74 Indonesia has roughly 150,000 cooperatives (see Table 3) that serve approximately 28 million members. With this large customer base, cooperatives play an extremely signifi cant role in providing fi nance fi nancial services to low-income households in Indonesia.
A wide variety of cooperatives are regulated under the Cooperative Law No. 25/1992. Of these, this report will focus primarily on Savings and Loan Cooperatives (KSP), which our deposit taking institutions, and Village Unit Cooperatives (KUD), which command a signifi cant
market share and which are the traditional disbursement tool for subsidized lending programs of the government. It should be pointed out that cooperatives have so far played a relatively minor role as fi nancial intermediaries due to traditionally repressive regulation.
The legal basis for specifi c types of cooperatives is outlined in Table 20. A summary of the regulatory framework is provided in Appendix K. It is noted that the Ministry of Cooperatives, Small and Medium Enterprises (MCSME) is the regulatory authority for all cooperatives. Cooperatives’ main fi nancial services are noted in Table 21.75
74 PP 9/1995, Art. 19 b.
75 Cooperatives have a business strategy towards membership that supports either a “closed” or “open” bond, although the regulatory regime doesn’t seem to distinguish between the two. An “open” bond cooperative allows a more broadly defi ned membership than a “closed” bond. Another distinction concerns the diff erence between primary cooperatives (which are founded by individuals and have a membership that consists of only individuals) and secondary cooperatives (which are founded by other cooperatives to serve a membership of cooperatives).

105
Chapter 4Regulatory Impediments to Access
Table 21. Financial Services of Savings and Loan Cooperatives
Type of Service Purpose Decree Description
Loans
Consumption LoanTerm
Short-term (less than one year)Medium-term (1-3 years)Long-term (more than 3 years)
Decree 96/2004, Art. 21
Amount of consumption loan is 3 times of savings and not more than 30% of income of the applicant
Working Capital and Investment LoanSectoral
Trade, industry, agriculture, livestock or services
Decree 96/2004, III.1.3.2
Amount of productive loan backed up with collateral is 75% of the value of collateral
Savings
DepositsTimeShare
Mobilize savings for members
Art. 19 a.PP No. 9/1995Decree 96/2004, III.1.1.2
Interest rate on savings for members is higher than non-members
Background work for this report revealed several areas of weakness in the regulatory framework to ensure the prudential oversight of cooperatives, although these weaknesses are not discussed in this report in detail. These weaknesses should be addressed in order to ensure a healthy cooperative sector that provides greater access to fi nancial services to its members. This is particularly important, given the danger that widespread insolvency of cooperatives poses to the poor and to MSMEs.76 The main regulatory barriers to access are as follows:
1. The establishment of cooperatives services outlets (branch offi ces, sub-branches or cash offi ces) must comply with the strict licensing standards of the MCSME (see Annex M). The requirement that a primary cooperative must be in operation for two years appears to be excessively burdensome. For example, if a fi nancially sound cooperative wants to open a branch to serve a broader membership, the two year time limit may allow competitors to move into that market space, thereby resulting in a lost investment opportunity. The regulation should perhaps also be modifi ed to correlate the time limit with the function and size of the branch that the cooperative intends to open;
2. In an eff ort to improve transparency, cooperatives are required to fulfi l substantial reporting requirements, with requirements to submit and publish standardised fi nancial reports and product information.77 Given the limited fi nancial literacy of the clientele served by cooperatives, it is highly
76 Recent reports of widespread insolvencies in East Java and high NPLs are particularly worrisome in this regard. See ‘Hundreds of cooperatives in Malang liquidated’, The Jakarta Post 05/04/2009.
77 Under the Operational Standard for Financial Reporting (Attachment of Decree No. 96/2004), fi nancial statements must be understandable, reliable, relevant and up to industry standards in order to provide a reliable source of information for members, potential creditors and regulatory bodies. More specifi cally, the regulation states that annual fi nancial statements for KSP that disburse more than Rp1 billion per year must be audited by an independent auditor or by the Auditing Department of the

Improving Access to Financial Services in Indonesia106
Chapter 4Regulatory Impediments to Access
unlikely that this requirement fulfi ls its intended purpose. Rather, it might be more helpful if the regulatory authorities paid a stronger role in informing the public about potential problems with specifi c institutions;
3. The management of cooperatives and the Board of Supervisors establish the interest rates and administrative fees on loan products in the Member Meetings. These are established according to three prescribed methodologies.78 A regulatory framework to better promote access to fi nancing would endorse fl exible and market-based interest rates that facilitate the development of sound business strategies for cooperatives.
4. Cooperative regulations set the criteria for lending.79 Currently, it is diffi cult for a cooperative to determine the credit history of a loan applicant, with very few cooperatives being able to implement systems such as the commercial banks’ Debtor Information Systems. More importantly, in a group lending model, it is the strength of the relationship among the members and not necessarily the creditworthiness of an individual that determines the success of cooperative operations.
In summary, cooperatives in Indonesia seem to be challenged by a large number of issues that extend well those relating to access to credit. These problems mainly relate to prudential supervision, with the current system creating the risk of insolvencies, which would reduce existing access to credit among cooperative members. These issues need to be addressed as a matter of priority. Once these matters are addressed, there are several smaller steps that could be taken to broaden access, including a regulatory framework that endorses more fl exible, market-based interest rates; less stringent criteria for establishing new service outlets; and less onerous reporting and disclosure requirements.
4.2.4 LPS’s Role in the Regulatory Environment
The Indonesian Deposit Insurance Corporation (IDIC, or LPS by its Indonesian initials) plays a very important role in the structure of the Indonesian fi nancial system. Law No 24 of 2004 provides the legal basis for LPS’s operations, with this law clearly detailing its functions and responsibilities 80 Issues related to the LPS and its role in the banking system are discussed in a separate document. 81 Rather, this report focuses on LPS’s relationship with the BPRs and other microfi nance institutions. Several points are notable in this regard:
1. LPS’s responsibilities cover only commercial banks and BPRs; they do not include, for example, cooperatives that take deposits;
2. Because of their limited size, BPRs are all considered ‘non-systemic risks’, so the authority for problem resolution rests entirely with LPS;
MCSME. Cooperatives are mandated to publish product information on savings facilities and loans (Decree 96/2004 para III.1.2.3 and Decree 96/2004 para III.1.3.8, respectively). Particular to savings, cooperatives are required to detail how deposit interest rates are determined, reward policy for participation and what – if any deposit protection practices are used for members. On the lending side, information includes a written policy on interest rate calculation, membership rewards for participation, types of loans, preconditions for applications and terms of loan.
78 These are: a) expected interest margin based on computation of total costs borne by the KSP; b) an indexed market pricing mechanism; and c) rates to attract new members or restrict current membership.
79 In terms of borrowers, cooperatives screen loan applicants based on the stipulations in Decree No. 96/2004, Art. 19, which state a) members and member candidates must reside in the operational area of a cooperative; b) have a business/fi xed income; c) have active savings deposits; d) have no arrears in lending from other cooperative or other party; e) have never been involved in crime; f ) have good morality; and f ) take a part in a pre-disbursement initiation program.
80 ‘The Bank Resolution Process Undertaken by the Indonesia Deposit Insurance Corporation’ Powerpoint presentation by LPS in April, 2009.
81 See Hanson (2009).

107
Chapter 4Regulatory Impediments to Access
3. Decisions regarding resolution of issues lies with LPS’s six person Board of Commissioners;
4. Since September 2005 (when LPS was established), it has closed 16 BPRs, including PT BPR Tripanca Setiadana (see Chapter 2), which was the third largest BPR in the country. 82 To date, LPS reports that all rules (regarding, for example, maximum deposit size and interest rates) have been observed during liquidation processes. Dissatisfaction among uninsured depositors looks like it has been relatively limited and well managed;
5. LPS staff acknowledge that their rules regarding deposit and interest rate limitations are probably not well understood among depositors at the village level. However, they believe that the BPRs themselves are primarily responsible for addressing this issue through the provision of information, while BI is responsible for enforcement;
6. A signifi cant proportion of closures of BPR have been in populous urban locations, with at least two in the area around Jakarta and seven in Bandung;
7. The most signifi cant problems that LPS must address probably relate to the fi nancial cost of resolving failures that might occur among much larger commercial banks.83
Field interviews indicated that LPS has a good track record in the management of the liquidation of BPRs, including relatively large BPRs in major urban areas, with these liquidations being handled without triggering wider problems in the banking system. There is no evidence of regulatory issues that could compromise LPS’s capacity to close insolvent BPRs and to pay off eligible depositors. In this regard, the fi nancial costs of failures among the commercial banks, which are much larger and therefore more expensive to liquidate, appear to be far more signifi cant, although such problems could ultimately spill over to aff ect the BPRs. There may also be issues related to the adequacy of information being provided to depositors with limited fi nancial literacy.
4.2.5 Regulatory Barriers to Access: Finance Companies
In Indonesia, fi nance companies (sometimes referred to as ‘multi-fi nance companies’) off er a wide range of services, including leasing, consumer fi nancing, mutual funds, factoring, credit card fi nancing, and securities trading (see World Bank (2006)). Their common characteristic is that they are non-deposit taking84 and they fall under the jurisdiction of Bapepam-LK, the regulatory arm of the Ministry of Finance (for a brief description of their legal basis, see Table 22). The regulatory objectives of Bapepam-LK in its management and supervision of fi nance companies is similar to that with commercial banks, this being to improve the role of fi nance companies as engines of national economic growth and support the effi ciency of economic activities in Indonesia. It should also be noted that the operations of fi nance companies in Indonesia are usually relatively sophisticated and are less likely to be designed to serve the needs of MSMEs and low-income households (with the exception of those that provide certain leasing and insurance products, as mentioned in Chapter 2).
82 The closure of Tripanca created temporary, local spill over eff ects on other BPRs in the Lampung area, but LPS was able to calm the situation by direct discussions with depositors.
83 See Hanson (2009).
84 It is notable that venture capital activities are no longer regulated as fi nance companies as of 2000 (Decree No. 448/KMK.017).
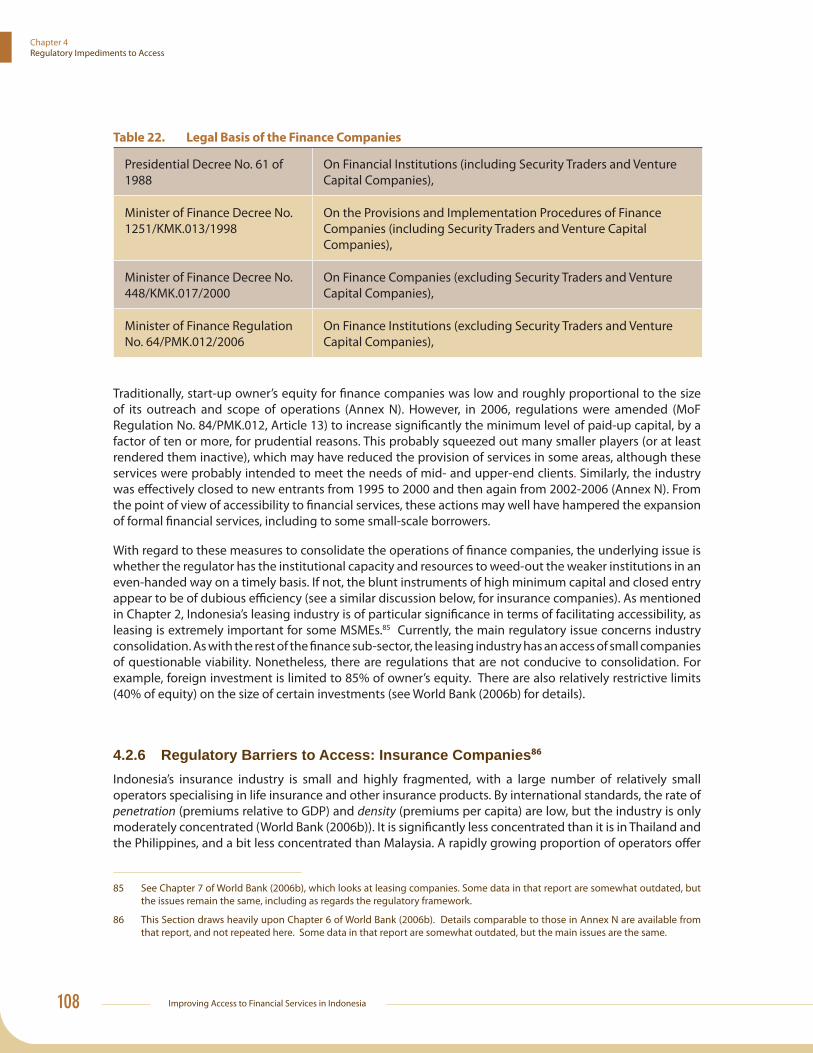
Improving Access to Financial Services in Indonesia108
Chapter 4Regulatory Impediments to Access
Table 22. Legal Basis of the Finance Companies
Presidential Decree No. 61 of 1988
On Financial Institutions (including Security Traders and Venture Capital Companies),
Minister of Finance Decree No. 1251/KMK.013/1998
On the Provisions and Implementation Procedures of Finance Companies (including Security Traders and Venture Capital Companies),
Minister of Finance Decree No. 448/KMK.017/2000
On Finance Companies (excluding Security Traders and Venture Capital Companies),
Minister of Finance Regulation No. 64/PMK.012/2006
On Finance Institutions (excluding Security Traders and Venture Capital Companies),
Traditionally, start-up owner’s equity for fi nance companies was low and roughly proportional to the size of its outreach and scope of operations (Annex N). However, in 2006, regulations were amended (MoF Regulation No. 84/PMK.012, Article 13) to increase signifi cantly the minimum level of paid-up capital, by a factor of ten or more, for prudential reasons. This probably squeezed out many smaller players (or at least rendered them inactive), which may have reduced the provision of services in some areas, although these services were probably intended to meet the needs of mid- and upper-end clients. Similarly, the industry was eff ectively closed to new entrants from 1995 to 2000 and then again from 2002-2006 (Annex N). From the point of view of accessibility to fi nancial services, these actions may well have hampered the expansion of formal fi nancial services, including to some small-scale borrowers.
With regard to these measures to consolidate the operations of fi nance companies, the underlying issue is whether the regulator has the institutional capacity and resources to weed-out the weaker institutions in an even-handed way on a timely basis. If not, the blunt instruments of high minimum capital and closed entry appear to be of dubious effi ciency (see a similar discussion below, for insurance companies). As mentioned in Chapter 2, Indonesia’s leasing industry is of particular signifi cance in terms of facilitating accessibility, as leasing is extremely important for some MSMEs.85 Currently, the main regulatory issue concerns industry consolidation. As with the rest of the fi nance sub-sector, the leasing industry has an access of small companies of questionable viability. Nonetheless, there are regulations that are not conducive to consolidation. For example, foreign investment is limited to 85% of owner’s equity. There are also relatively restrictive limits (40% of equity) on the size of certain investments (see World Bank (2006b) for details).
4.2.6 Regulatory Barriers to Access: Insurance Companies86
Indonesia’s insurance industry is small and highly fragmented, with a large number of relatively small operators specialising in life insurance and other insurance products. By international standards, the rate of penetration (premiums relative to GDP) and density (premiums per capita) are low, but the industry is only moderately concentrated (World Bank (2006b)). It is signifi cantly less concentrated than it is in Thailand and the Philippines, and a bit less concentrated than Malaysia. A rapidly growing proportion of operators off er
85 See Chapter 7 of World Bank (2006b), which looks at leasing companies. Some data in that report are somewhat outdated, but the issues remain the same, including as regards the regulatory framework.
86 This Section draws heavily upon Chapter 6 of World Bank (2006b). Details comparable to those in Annex N are available from that report, and not repeated here. Some data in that report are somewhat outdated, but the main issues are the same.
109
Chapter 4Regulatory Impediments to Access
Sharia related products. The legal framework for the insurance industry is established by the Insurance Law of 1992, which was signifi cantly modifi ed in 1999/2000 to introduce risk-based capital requirements.
Bapepam-LK, the regulatory arm of the Ministry of Finance, regulates and supervises the insurance sector. There are also important issues of transparency in the industry, with public disclosure requirements being particularly important in the insurance business.87 At present, companies are required to publish their fi nancial information, including their risk-based capital ratio, but a complete set of all risk-based capital ratings is not available from the regulator and there are no private sector ratings of insurance companies available in Indonesia. The regulator monitors company information and validates the companies’ reports, but it does not publish risk-based capital ratios. Measures to increase the level of transparency by the publication of such information, possibly implemented in cooperation with the industry associations, would be a useful step in broadening access to insurance services.
The weak prudential state of the industry creates signifi cant complications in terms of establishing policy to facilitate broader access to insurance services in Indonesia. Some large companies in the industry are widely considered to be insolvent. These companies could potentially pose a systemic risk. On the other hand, many smaller companies are undercapitalized and seem unlikely to be able to withstand stiff er market competition in the future. In this situation, the top priorities for policy should be the development of measures to achieve industry consolidation and to address these systemic risk created by weak and bankrupt fi rms. In addition, policy should strive to facilitate the upgrading of the institutional capacity as of regulators and improvements in enforcement. Until matters such as these are addressed, issues of broader access to insurance services are of secondary importance. At present, it is more important to facilitate the development of reliability and focus on broadening access.
In particular, virtual absence of an appropriate regulatory framework has created a great deal of uncertainty in the development of the micro-insurance segment (discussed in Chapter 2.7).
4.2.7 Barriers to Access: Pawnshops
Pawnshops in Indonesia have been an important source of fi nancial services for low-income households and MSMEs since 1928 (Government Regulation No. 81, Staatsblad Nomor 81/1928). They are often the most convenient and trusted source of quick, short-term liquidity for low-income households and MSMEs, particularly as a source of funds for personal purposes in times of individual or family crisis. Pawnshops are relatively insignifi cant as a source of fi nance for business,88 and the only offi cial pawnshop, Perum Pegadaian (PP), is a state-owned monopoly.
Since 2004, PP has scaled up micro-lending and its outreach eff orts by opening a signifi cant number of new branches. As of December 2007, the state-owned monopoly had 900 branches throughout Indonesia, concentrated in urban areas. These 900 branches (of which 52 are sharia-based) serviced 17 million people in 2007, an increase from 797 branches servicing 10.8 million customers at end-2004. In early 2008, PP began to off er money transfer services in cooperation with Western Union. The Government has been discussing the possibility of listing this company on the Indonesian Stock Exchange in the near future89.
87 Unlike other fi nance companies (where the public can react to worsening news by slowly withdrawing its business), clients of insurance companies enter into long-term arrangements that normally cannot be broken without signifi cant penalties. Consequently, disclosure and transparency at the outset are especially important for consumer protection.
88 About 25% of customers use the fi nancing for business activities; another 15% use the fi nancing for both personal and business purposes. Women use much more of the fi nancing for personal purposes than men. (World Bank (2008c)).
89 The Jakarta Post, 15 May 2009.
Improving Access to Financial Services in Indonesia110
Chapter 4Regulatory Impediments to Access
Regulation and supervision of the state pawnshop is the responsibility of the Bapepam-LK (Government Regulation No. 103 of 2000). As a state-owned enterprise, the management of pawnshops is given considerable independence by the Ministry of Finance. In general, fi nancial services it off ers loans according to the terms set by the State Pawnshop Law; fi duciary guarantees; the provision of deposit boxes; and certifi cation of precious minerals and stones.
To ensure the fi nancial integrity and performance of PP, management is required to demonstrate that 45 percent of the company’s profi ts for each fi scal year is allocated for: a) general reserve until this amount reaches 200 percent of owner’s equity; b) social purposes and education; c) bonuses; d) contributions to pension funds; and e) provisions for loan losses. Levels of capital adequacy and owner’s equity established through decisions of the Finance Minister (Art. 10, PP No 103/ 2000). Operationally, the most important operation is the valuation of the goods at hand rather than the determination of the creditworthiness of the customer; the main risk for PP is that pawned articles are stolen. Local pawnshop procedures established that the branch level determine the penalty rates for failure to repay loans on time.90
As mentioned previously, the pawnshop business is offi cially a state-owned monopoly. However, unlicensed (and therefore technically illegal) private outlets have operated in relatively open competition with Perum Pegadaian for a long time, usually working out of local gold and jewellery stores. For example, a 1986 SEACEN study on informal markets estimated that the proportion of Indonesia’s pawnshop industry controlled by the government was 42%, while the proportion controlled by private operators was around 58%.91
The state-owned pawnshop has expanded its branch network steadily over the past decade, with the number of branches increasing by approximately 4% per year from 2000 to 2007. In addition, it has plans for a major expansion in the number of its branches in the next year or so. This is an important step towards improved access for the poor. However, compared to BRI, which itself has come under criticism for not reaching deeply enough into the nation’s remote kabupatens, PP has signifi cantly fewer branches than this bank (5,214 branches as of September 2008) and is concentrated in urban areas to a far more signifi cant degree.
If the state-owned pawnshop maintains its current rate of branch expansion of recent years, it will be another decade or more before it has the same regional reach as BRI, even allowing for a major expansion this year and next. To accelerate the process, other options could be considered. For example, regulations could be reformed to allow the offi cial participation of the private sector.92 Considering the success with which the banking sector has been opened up to the private sector over the past two decades, there is little justifi cation for not opening up the pawnshop sector in the same way. Private sector participation may well be an eff ective means of ensuring more competitive pricing (that is, higher appraisal values and lower interest rates) and better services for the poor. The sector might even be opened up to a broader set of private investors.93 Needless to say, a stronger supervisory framework would need to be established in order to ensure the integrity of such a liberalised environment.
90 For instance, late payment usually results in the borrower losing ownership of the pawned good, which is essentially collateral. With this in mind, precise records of transactions are important. In most cases, procedures for delinquent borrowers are quickly handled with collateral already in custody. A unique feature of PP concerns offi cial policy regarding proceeds from auctions. If these proceeds exceed the value of the outstanding loan, the diff erence is returned to the delinquent borrower. However, no data are available on how often this happens and actual practice has not been confi rmed with defaulting clients or with bidders in the auctions.
91 The work is cited in Skully (1994).
92 In 2007-08, a Law was being drafted to open up this business to private participants.
93 Weak management and low profi tability of the state-owned pawnshop do not appear to be major issues, which reduces the case for steps like partial privatization of PP. Likewise, surveys indicate high levels of satisfaction among customers (World Bank (2008c)).
111
Chapter 4Regulatory Impediments to Access
Box 15. Legal Framework for Microfi nance Institutions in Indonesia
There are number of factors which prevent micro-fi nance institutions (MFIs) in Indonesia from eff ectively providing fi nancial services to the poor. Three primary reasons are as follows; 1) the legal framework for non-bank and non-cooperative type of MFIs is uncertain. This may well make existing MFIs reluctant to expand their services to new and potential clients and markets; 2) the cost of reaching out to many small and potentially high risk customers is still a signifi cant barrier; and 3) many MFIs lack suffi cient access to capital. The Indonesian government has recognized the constraints the MFIs are facing and is eager to address the issue of strengthening the legal framework for MFIs in order to foster the development of a vibrant and comprehensive national fi nancial system. The government also recognises that, along with other partners, it can play a signifi cant role in providing guidance, support, and strategies to ensure that MFIs play their role in providing needed fi nancial services to lower income earners. Moreover, it is clear that there is a need for a strong policy framework to create an environment in which MFIs can become sustainable and off er a diverse range of products while at the same time protecting small depositors and creating stability and integrity in the microfi nance sectors. A micro-fi nance law has been under debate for the better part of a decade and has gone through various revisions, a number of which have been submitted to Parliament. However, the law has not yet been approved and questions remain regarding the role of the various institutions that will be involved in supervising and regulating the MFIs. In early 2009, under the leadership of the Coordinating Ministry of Economic Aff airs (CMEA), a joint decree was signed between the Ministries of Finance, Cooperatives, Home Aff airs and Bank Indonesia to provide a regulatory framework under the existing laws to the non-bank and non-cooperative MFIs that currently operate outside such a framework. The Joint Decree aims to formalize MFIs into one of four categories: (1) people business credit, or BPR; (2) saving and loan cooperatives; (3) village-owned microfi nance institutions or bum desa; or (4) venture capital companies. To implement the above decree, detailed activities for improving the legal framework for MFIs in the period from 2009 – 2011 have been developed. A working group consisting of the representatives from the technical ministries, BI, and CMEA has been established and is expected to work to establishing implementing regulations so that MFIs could improve fi nancial inclusion in Indonesia.
4.3 Summary of Policy Issues, by Service ProviderThere are several aspects of Indonesia’s regulatory framework which could be reformed to improve the level of accessibility to fi nancial services for low income households are MSMEs, as discussed below.
At present, the biggest issue is entry barriers that act as a constraint against the establishment and expansion of commercial banks; BPRs; insurance; other fi nance companies; and pawnshops. In most cases, little can be done about this, because offi cial policy is currently focused on promoting industry consolidation as a means of eliminating or reducing the number of weak companies. This policy is something of a blunt instrument, refl ecting the diffi culty of weeding-out the weaker institutions—large and small—in an even-handed, timely manner. Until this policy of consolidation runs its course, the most realistic means for new entrants to these industries is participation in existing—and perhaps failing—companies.
Commercial Banks: Current banking policy is controversial for at least two reasons: i) licensing policies are largely designed to reduce the number of banks; and ii) minimum capital requirements are intended to ensure the emergence of larger banks. It is debatable whether either of these policies increases access to

Improving Access to Financial Services in Indonesia112
Chapter 4Regulatory Impediments to Access
fi nancial services by poorer households and MSMEs. However, it appears unlikely that the direction of this policy will be changed in the near future.
In the meantime—and with the exception of mobile banking (which is discussed in Chapter 5) —there are no easy regulatory reforms that can signifi cantly increase access to fi nancial services via commercial banks. For example, oversight concerning ‘directed lending’ to MSMEs and the rules on opening new branches look restrictive, but BI is enforcing them in a relatively liberal manner. Regulatory easing in both areas would be helpful, but it would simply bring offi cial policy into line with actual practice.
Recent regulations regarding the relocation of branches and ATM machines are somewhat more problematic, with these regulations appearing to be unnecessarily restrictive. Rather than requiring extremely specifi c reports on the location of ATMs, it would be much less burdensome on banks if they could report these locations in more general terms. Also, there is a considerable degree of reduplication in reporting requirements, which adds to the burden of banks. This could be reduced, for example, by making the annual business plan a part of the company’s annual report, rather than requiring the submission of two separate reports, as is currently required.
The constraints to access created by banks’ minimum balances and monthly administration fees are not an outcome of the regulatory environment, because those fees are set according to internal corporate policies of individual banks. For both minimum balances and administrative fees, there is considerable variation among the commercial banks, but good low-cost options are available through BRI and BPRs.
The lack of offi cial policy on dormant accounts may be contributing to higher-than-necessary administrative fees on small accounts, because banks are reluctant to close dormant accounts unilaterally unless the balance falls to zero. Consequently, banks establishe pricing formula to ensure that the balance in small accounts eventually falls to zero. It might be useful if Bank Indonesia were to set an offi cial policy in this area, with a view to making it easier for banks unilaterally to close dormant, non-zero accounts. As part of the new BI policy, the responsibility for administration could be transferred to a centralized account after a certain well-defi ned time period, with the central authority assuming responsibility for the administration of such accounts.
Another possibility is to introduce basic banking or ‘no frills accounts’, which would feature very low monthly administrative fees while at the same time off ering a limited range of services and imposing upper limits on the value of accounts. Bank Indonesia has already implemented measures to develop such products, which are expected to be available in early 2010. International experience has shown that when commercial banks off er basic, low-cost banking services, the rate of uptake is signifi cant.
BPRs: Bank Indonesia could address a number of issues to ease the regulatory burden on BPRs, especially for small ones in remote regions. For example, the restriction on ownership by individuals or entities other than Indonesian citizens creates unnecessary limitations. The sector could usefully be opened up to NGOs and foreign ownership, possibly on a joint venture basis. Also, a new, lower tier of minimum start-up capital could be set for particularly small BPRs. Minimum standards for managerial resources of BPRs could be eased, especially for regions where management expertise is in short supply. Reporting requirements are currently excessively burdensome for BPRs in regions without good IT services, and BPR managers may actually have to hand-deliver reports to the closest Bank Indonesia regional offi ce. As part of reporting requirements, disclosure requirements should be examined to determine their eff ectiveness in the context of the low levels of fi nancial literacy of their clientele, with better alternatives being developed.
As for commercial banks, theoretically, the regulations on the expansion of branch networks currently appears to be too tight, although bank Indonesia is implementing these regulations in a liberal fashion. Still, these could be eased for the sake of regulatory transparency. In the case of both commercial banks and BPRs,
113
Chapter 4Regulatory Impediments to Access
KYC requirements may act as a constraint to accessibility. In particular, MSMEs may have their own reasons for not wanting to other tax number. Since KYC requirements mandate possession of a tax number foe MSMEs seeking credit, this may act as a constraint., This is particularly the case for credit to MSMEs who have their own reasons for potentially not wanting a taxpayer number. An exemption from these requirements, with a relatively low threshold, could alleviate this problem. Bank Indonesia is currently considering a revision of its regulatory policies on BPRs, which creates an opportunity to put in place a framework that will allow these institutions to extend and improve access on a sustainable basis.
Other MFIs: Many of these institutions operate with no formal legal status. Probably, the most productive thing that can be done is to restore momentum to the process of drafting a new Micro-Finance Law. One vital step towards this would be to encourage public debate and discussion on the relevant issues. It is important that the new Law facilitates increased access on the basis of best practice from international experience. In the meantime, it is important to ensure that the vital services these institutions provide continued to function.
Cooperatives: Cooperatives play a key role in providing access to fi nancial services to a large segment of the population. Their ability to perform this role should be strengthened to ensure sustainable operations. There are some regulatory impediments in this area, particularly in relation to issues such as the establishment of branches, pricing and reporting processes. However, more fundamental reforms are needed in many areas, preferably before the sector faces any major diffi culties that may jeopardize members’ existing access to fi nancial services.
Insurance and Finance Companies: By and large, these sectors currently cater mainly to higher income earners in urban areas. With some signifi cant exceptions amongst providers off ering leasing and micro-insurance products, it appears unlikely that this sub-sector’s reach will extend the services it off ers so that they are particularly signifi cant for lower-income households. However, if the industry could be consolidated eff ectively, the foundation would be laid for these sectors to provide better access to a larger share of Indonesians. The micro-insurance business has signifi cant potential to provide valuable services for lower income households. A regulatory framework more focussed on micro issues would give the industry a boost.

Improving Access to Financial Services in Indonesia114
Chapter 4Regulatory Impediments to Access

115
Chapter 5
Special Topics Concerning Access to Finance
This Chapter looks at three special topics that are closely connected to issues of access to fi nancial services, namely:
1. Micro- Small- and Medium-sized Enterprises (MSMEs);
2. International workers’ remittances; and
3. Mobile banking.
Each of these areas is characterised by specifi c issues, which in each case must be addressed through specifi c policy options.
5.1 MSMEs and Access to Finance94
MSMEs play a critically important role in a country’s economic development. International evidence indicates that around the world, in numerical terms, they account for approximately 98% of all enterprises; they employ about 60% or more of the private sector workforce; they create about 50% of value added; and they account for about 30% of direct exports.95 In rural areas of developing countries such as Indonesia, where large enterprises are few in number, development of MSMEs is almost synonymous with sustainable
94 On Government of Indonesia defi nitions, a Micro Enterprise is a productive business unit owned by an Indonesian family or individual and with turnover up to Rp100 million per annum (Decree of the Minister of Finance No. 40/KMK.06/2003, issued on January 29, 2003). A Small Enterprise is any kind of business unit with net assets up to Rp200 million (excluding land and building for business site), or with turnover up to Rp1 billion per year, owned by an Indonesian, independent and not a branch or subsidiary of certain fi rms (Law No. 9 Year 1995 on Small Businesses). A Medium Enterprise is a business that has annual turnover of between Rp1 billion to Rp50 billion and with net assets between Rp200 million and Rp10 billion, excluding land and building for business location (Presidential Instruction No. 10/1999 on the Empowerment of Medium Businesses).
95 See APEC (2002).

Improving Access to Financial Services in Indonesia116
Chapter 5Special Topics Concerning Access to Finance
poverty alleviation. Moreover, the micro enterprise component is the backbone of the informal sector, which accounts for some 70% of total employment in Indonesia.96
Several international surveys have found that fi nancing issues create some of the worst critical constraints faced by MSMEs, with cost of and access to credit usually being a major problem. In the specifi c case of Indonesia, a Bank Indonesia survey, described in Section 5.1.1, took a broader perspective and found that micro and medium enterprises have diff erent problems when it comes to accessing credit.97 For its part, The World Bank/IFC’s ‘Doing Business’ indicator98 for 2009 ranked Indonesia 109th out of 181 countries in terms of access to credit, putting it on a par with countries such as Uganda, Nepal, Bolivia and Belarus. The OECD, in its pioneering Survey of Indonesia,99 asserted that access to credit is particularly diffi cult for SMEs, especially those operating in the informal sector, and highlighted that lack of collateral was a signifi cant constraint.
Large
MediumEnterprises
Small Enterprises
Micro EnterprisesHousehold Level (informal Economy)
As suggested by the preceding discussion, most fi nancial studies of MSMEs focus almost exclusively on access to credit. By contrast, this study considers access to a much wider range of fi nancial services, especially for micro-enterprises, which often operate in the informal economy at the household level (as indicated in the pyramid diagram, above).
5.1.1 Key Findings of Bank Indonesia’s Survey of MSMEs
The survey discussed in Chapter 3 focused specifi cally on households’ access to fi nancial services rather than MSMEs’ access to such services. However, much of the data reported in Chapter 3 is relevant to a
96 For August 2008 on OECD defi nitions. See footnotes to Table 3.1 of OECD (2008) and http://wwww.bps.go.id/sector/employ/table3.shtml.
97 For example, almost all micro and small businesses, and all medium businesses, have used banking services. For credits, the main considerations are the interest rate and location; the main obstacle for micro businesses is collateral whereas for small and medium businesses, it is high interest rates.
98 See http://www.doingbusiness.org.
99 OECD (2008).
117
Chapter 5Special Topics Concerning Access to Finance
discussion on micro- and small enterprises, because these enterprises are usually operated by family units at the household level. To broaden the results—so as to include medium enterprises or to ensure that only enterprises are included—it is useful to examine a survey directly targeting MSMEs.
In 2005, Bank Indonesia conducted such a survey of MSMEs and their characteristics in Indonesia.100 The survey polled 11,000 respondents in eleven provinces and covered a wide range of topics, including those related to managerial issues, inputs and production, marketing, and manpower. The survey also included a review of six other studies into issues related to the problems faced by MSME in Indonesia. For the purposes of this report, the BI study serves as the main source of descriptive information on MSME and the problems they face in Indonesia. The highlights of the study are summarized immediately below, by topic area of special interest to this report. The interested reader is referred to Bank Indonesia (2005) for moreextensive details.
BI Survey Results: Legal Issues & Business Development
• Most MSMES, especially at the micro level, do not have an offi cial legal status;
• Most micro businesses don’t have business licenses (TDI/TDP and SIUP) or a Tax Registry Number (NPWP); half of small businesses have them; most medium-scale businesses have them;
• Costs, procedure and administrative requirements are not obstacles to obtaining business licenses and NPWP;
• The main reasons for having business licenses and NPWP is to obey government regulations and to obtain credit;
• Few micro and small businesses have cooperative agreements with big businesses, despite the fact that they are aware of the advantages of such arrangements;
• Few MSMEs believe that they benefi t from existing government programs;
• MSMEs overwhelmingly state that the assistance they require from the government relates to credit, training and market information.
BI Survey Results: Financing Issues
• Most MSMEs conduct the vast majority of their transactions in cash. Nonetheless, almost all micro and small businesses, and all medium businesses, have used banking services;
• In choosing banks, the vast majority of MSMEs state that security and safety is their main consideration when depositing funds of a bank. On the other hand, when seeking loans, their main considerations relate to interest rates and collateral;
• For micro businesses the main obstacle to seeking fi nance is collateral requirements. For small to medium businesses, the main obstacle to seeking fi nance is high interest rates;
• Most micro and small businesses believe that banks allocate insuffi cient credit for MSMEs. Medium businesses believe that the level of allocations is fair.
100 See Bank Indonesia (2005).
Improving Access to Financial Services in Indonesia118
Chapter 5Special Topics Concerning Access to Finance
BI Survey Results: Banks’ Policies towards MSMEs
• To increase the level of credit provided to MSMEs, commercial banks believe that better credit analysis is vital, with measures to achieve this including elements such as training of their staff . BPRs believe the most vital step is the development of systems for supervision and collection of payments;
• The external key for banks is linkage programs with BPRs and cooperation with the credit guarantee institution;
• For loans to micro-businesses, most banks do not require complete documentation (SIUP, NPWP, etc.). For small businesses, requirements are tighter; for medium businesses, almost all banks require all types of licenses;
• For micro businesses, most collateral is in the form of movable assets, such as cars and motorcycles. For small and medium businesses, land and buildings are most commonly used as collateral for loans;
BI Survey Results: The Main Constraints
• Lack of human resources and a number of areas, including in fi nance, marketing and production;
• A non-conducive legal environment, particularly in the area of licensing and permits;
• The credit guarantor institution (e.g., offi ces, premiums, and claim procedures)
In reviewing these results, three main points stand out from the rest. First, access to fi nance becomes increasingly problematic as the scale of the business decreases, despite eff orts at increased fl exibility on the part of the banks. Second, existing government programs are not working well. And third, human resources defi ciencies (on the sides of the MSMEs, banks and possibly government institutions) are probably the root of many of the most basic problems.
5.1.2 MSME Lending & Policies in Indonesia
Notwithstanding the many problems mentioned in the previous Section, loans to MSMEs in Indonesia comprise a signifi cant proportion of banks’ total loans portfolios. The proportion of such loans has been climbing in recent years, but may have stabilized around 50% (see Figure 49). This is just a bit lower than the 55% of GDP which they produce, according to the Minister of Cooperatives and Bank Indonesia. In addition, the quality of loans to MSMEs compares favorably with conventional loans, using the metric of non-performing loans (Figure 49, and a presentation by Bank Indonesia staff during fi eld work for this report). This is consistent with the experience of BRI, where loans to MSMEs comprise a total of 86% of the banks total loan portfolio and where the NPL ratio is considerably below the industry average (2.9% vs. industry’s 3.3%, as of September 2008).

119
Chapter 5Special Topics Concerning Access to Finance
Figure 49. MSME Lending
545250484644424038
43
4749
5152
50
2002 2003 2004 2005 2006 2007 2008
Source: Bank Indonesia Source: Bank Indonesia; data for end 2008
For Indonesia’s policymakers, the issue of the availability of fi nance to SMEs has long been on the policy agenda. For example, in 1992, regulations were promulgated to require banks to lend at least 20% of their credit portfolio to SMEs, although this policy was abandoned in 2001. Instead, banks were asked to establish self-determined targets, and to report against them (see Chapter 4; for other government programs, see Chapter 2). In late 2007, the Government launched its People’s Business Credit program (KUR), which is guaranteed by PT Asuransi Kredit Indonesia (Askrindo) and Perum Sarana Pengembangan Usaha (SPU) up to a limit of Rp500 million per small business unit. In parallel, Askrindo and SPU were recapitalized (at a cost of Rp850 billion and Rp600 billion respectively) to allow them to increase the level of loans insurance that they off ered to banks for protection against non-performing loans amongst the SME sector.
Despite its short lifetime, anecdotal evidence suggests that the KUR program is already encountering challenges.101 By way of examples, in early 2009, only six banks102 were eligible for the guarantee program, which gives these six banks a considerable competitive advantage over others, most notably the BPRs. It is unclear how the guarantee program’s terms (e.g., coverage for fi rst time, unbanked borrowers starting up new businesses) are being enforced. It is also unclear how the authorities can ensure that banks aren’t channeling bankable projects into the KUR program in order to benefi t from the guarantee program. In responding to these points, BI notes that the Government is considering expanding the KUR program to include the Regional Development Banks (Bank Pembangunan Daerah; BPDs). Regarding enforcement of KUR terms, BI appears to rely heavily upon its Debtor Information System (SID) to check the borrower’s credit history and to see if the project has already received credit. In the course of its review of the KUR program, the government might consider allowing more banks to qualify for the program, including a good mixture of private banks and BPRs, rather than just state-owned banks. Also, the pricing structure of the guarantee could provide an incentive to increase the quantity and quality of small loans, with the terms being designed to ultimately convince bank management that the guarantee is not needed.103 An exit strategy for the program should also be implemented.
As a next step, the Government could look at the other programs run out of various ministries that attempt to channel fi nancing into preferred sectors (see Chapter 2.5). These programs are heavily dependent upon
101 The Government of Indonesia is currently undertaking a review of the KUR program. The KUR program has been doubled in size in 2009 from that in 2008.
102 These were Mandiri, BRI, BNI, BTN, a Sharia arm of a state bank and Bukopin. Notably, all are state banks except for Bukopin, which historically has been very close to Bulog, the state logistics company. It’s also notable that the BPDs (under consideration for expansion of the KUR program, as noted in the main text) are also state banks, because they are owned by the provincial governments.
103 For example, the price of the guarantee could be proportional to the size of the MSME portfolio. And, the guarantee could only kick-in after a time threshold (say 3 months) when NPLs exceeded some pre-determined ratio (say 3%).
Improving Access to Financial Services in Indonesia120
Chapter 5Special Topics Concerning Access to Finance
government fi nancing. Often, they crowd-out other micro-fi nance operations that may be struggling to be self-sustaining. Also, these programs’ subsidized nature invites corrupt administrative practices and encourages a culture of non-repayment. Like the KUR program, these would benefi t from an independent, external assessment of their eff ectiveness. Participation in such an assessment could include local think tanks, industry associations and NGOs with special interests in the area.
Refl ecting the ineff ectiveness of many of these programs, there are continuing controversies as to whether MSMEs have adequate access to fi nance, with some observers arguing that this sector is under fi nanced because while MSMEs account for 99% of all business units and employ 96% of the employed labor force (Figure 50), they receive only around half of bank credits. Comparing output to lending by sector (Figure 50), SMEs operating in the agriculture, construction, trade, transportation and business (fi nancial) services sectors are often said to be particularly underserviced in terms of access to fi nance. Proponents of this view conclude that there are many untapped, potential investments that could be undertaken by MSMEs, if the fi nancing were available. Foreign-owned and joint venture banks are often seen as being particularly prejudiced against businesses of this type and in these sectors, with these banks accounting for 14% of total lending, but only 4% of lending to MSMEs 104. Proponents believe that actively supporting the provision of fi nancing to SMEs would boost job creation and real sector growth in Indonesia.
It should be pointed out that Bank Indonesia’s defi nitions do not match those of the Government.105 For practical reasons,106 Bank Indonesia currently defi nes small-scale credits by size of credit, not by size of the borrower. Consequently, roughly half of MSME credits are for consumption (that is, for consumer loans), not for investment.107 Eff ectively then, lending to MSMEs is only about half the amounts normally cited from offi cial sources.
104 State-owned banks (SoB) are sometimes cited as neutral is this regard (see Figure 50), but this is only true for them as a group. The great majority of SoB lending to MSMEs is accounted for by BRI.
105 BI defi nes a micro credit as up to Rp50 million; a small credit is between Rp50 million and Rp500 million; and a medium-sized credit is between Rp500 million and Rp5 billion. (p. 79 of Bank Indonesia (2005)). According to BI staff , this defi nition is under review, with the intention of bringing it into line with the government’s defi nition. For GoI’s defi nition of an MSME, see footnote 116.
106 For example, it is very diffi cult to tell the diff erence between a motorcycle purchased for personal use and one that is purchased for small business purposes, like an ojek (a motor cycle taxi).
107 See Table 9.5 in Bank Indonesia (2007).

121
Chapter 5Special Topics Concerning Access to Finance
Figure 50. MSME Characteristics
MSME & Large Enterprise Business Units MSME & Large Enterprise Employees
Electricity , Gas, and Water
0%
Construction0%
Trade, Restaurants, and
Hotel27%
Transp ortationand
Communication6% Agriculture
53%
Services6% LEs
0.01%
Financial, Rental, and Business
Services0%
ManufactureIndustry
7%
Mining1% Electricity, Gas,
and Water0%
Construction1%
Trade, Restaurants, and
Hotel24%
Transp ortationand
Communication4%
Agriculture43%
Services11%
LEs4%
Financial, Rental, and Business
Services1%
ManufactureIndustry
11%
Mining1%
Breakdown by Loans Breakdown by Output
By Lending
31%9% 20% 21% 31%
64%
25% 30%52%
90%
69%91% 80% 79% 69%
36%
75% 70%48%
10%
0%
20%
40%
60%
80%
100%
Agr
icul
ture
Min
ing
Man
ufac
turin
g
Elec
tric
ity,
Gas
, and
Wat
er
Cons
truc
tion
Trad
e
Tran
spor
tatio
n
Busi
ness
Serv
ices
Sosi
al S
ervi
ces
Oth
ers
(%)
SME LEs By GDP
87%
8% 13%1%
44%75%
30%17%
40%
9%
3% 12%8%
22%
21%
24% 47% 8%
4%
89% 75%92%
34%4%
46% 36%52%
0%
20%
40%
60%
80%
100%
Agr
icul
ture
Min
ing
Man
ufac
ture
Indu
stry
Elec
tric
ity, G
as,
and
Wat
er
Build
ings
Trad
e,
Rest
aura
nts,
and
Tran
spor
tatio
n
and
Fina
ncia
l,
Rent
al, a
nd
Serv
ices
(%)
SEs MEs LEs
Breakdown of SME Lending by Type of Bank
Source: Bank Indonesia. Data for June 2007
Another factor concerns the high overheads associated with conventional commercial bank lending to MSMEs, in part because they are subject to relatively strict regulatory oversight. More to the point, MSME lending is still risky unless there is a strong supervision of loans, which entails high administrative costs that

Improving Access to Financial Services in Indonesia122
Chapter 5Special Topics Concerning Access to Finance
can only be borne by institutions with a strong local presence. Even BRI, with one of the largest branching networks in the world, leaves the lower end of this segment to other players. For most conventional commercial banks, especially foreign and joint venture banks, this business is diffi cult, because they lack the requisite neighbourhood knowledge, relationships and trust. As technology brings costs down (see Box 56), the more aggressive commercial banks can be counted upon to move into these segments, because they will be attracted by the opportunities for profi t. In the meantime, the real issue is how to bring down artifi cial barriers to faster progress; how to rationalize existing ineff ective government programs; and how to fi nd better ways to deliver fi nancial services by institutions better-equipped to do the business.
5.2 Migrant Workers and Access to FinanceAs mentioned in Chapter 2, large numbers of Indonesians work abroad. In 2006, approximately 680,000 Indonesian migrant workers left Indonesia to work overseas, bringing the estimated total to about 4.3 million (World Bank, 2008). This section examines two aspects of the phenomenon of migrant workers that are relevant to the subject of this report, these being the socio-economic characteristics of these migrant workers, using results of the household survey of Chapter 3; and their diffi culties in accessing fi nancial services at diff erent stages of their migration.
It is notable that there is a strong disconnect between existing TKI fi nancial products (e.g., insurance and savings) and the needs for fi nancial products as expressed by the migrant workers themselves. In this context, it should be noted that the World Bank conducted a more extensive survey devoted expressly to migrant workers in late 2008. Material from the survey will add substantially to the survey material of Chapter 3.
5.2.1 A2F Findings on Indonesian Migrant Workers
This Section expands upon previous studies (e.g., World Bank (2008a)), using data derived from the survey described in Chapter 2. This survey provides information on households that have a migrant worker living abroad, with the sample size consisting of about 10% of total respondents (see the upper left panel in Figure 51). It is not a survey of migrant workers per se, and for some sub-categories the number of observations is small, which reduces statistical reliability. With these qualifi cations in mind, the main patterns of these workers are as follows:
• About 80% of the legal migrant workers are female, and more than 85% of them work in informal sector in relatively unskilled jobs, such as household domestics, maids and nannies (Figures 51 and 52);
• By education level, just over half (53%) have a primary school education or below, with males dominating the extreme ranges, making up the majority of both the least and most well-educated educated (see the middle panel of Figure 51);
• Of all the respondents, 45% have worked overseas more than once, with Kuwait, Saudi Arabia, Hong Kong and Taiwan being the most popular repeat destinations. Singapore is the least popular repeat destination (the lower panel in Figure 51).
The limited, available data suggest that many Indonesians work abroad illegally, which greatly complicates

123
Chapter 5Special Topics Concerning Access to Finance
policy in this area.108 As illegal workers, they simply cross the border on foot or by boat, usually to a neighboring country, such as Malaysia. Results of this survey indicate that 10% are illegal workers, but that looks low based upon other available information.109 Most seem to be men in Asia-Pacifi c destinations, dominantly Malaysia. It appears that they tend to work on construction projects, in plantations and service industries, including as domestic workers (Figure 52).
108 Legal migrant workers are defi ned as those who register as a migrant worker to Ministry of Manpower and Transmigration, and hold a proper migrant workers’ passport and working permit in the destination country.
109 For example, see htt p://www.reliefweb.int where 600,000 were estimated to be in the state of Sabah alone in 2002. In 2005, the Government of Malaysia estimated that there were more than 1 million illegal migrant workers in the country, mainly from Indonesia and other countries in South and SE Asia (reported on http//burmalibrary.org). Joseph Liow (‘Malaysia’s Illegal Indonesian Migrant Labour Problem: In Search of Solutions’, on htt p://www.questi a.com) writes that Indonesians into Malaysia are arguably the second largest fl ow of illegal immigrants in the world (after Mexicans into the United States).

Improving Access to Financial Services in Indonesia124
Chapter 5Special Topics Concerning Access to Finance
Figure 51. Characteristics of Migrant Workers

125
Chapter 5Special Topics Concerning Access to Finance
Figure 52. Migrant Workers, by Type of Work and Legal Status (in per cent)
5.2.2 Migrants & Access to Financial Services
For purposes of this report, issues of migrant workers’ access to fi nancial services are reviewed according to the diff erent stages of the migration process, namely: i) pre-departure (pre-migration); ii) during migration; and iii) post-migration. This approach is useful because migrants’ needs are diff erent at diff erent stages of the process (see Figure 53).
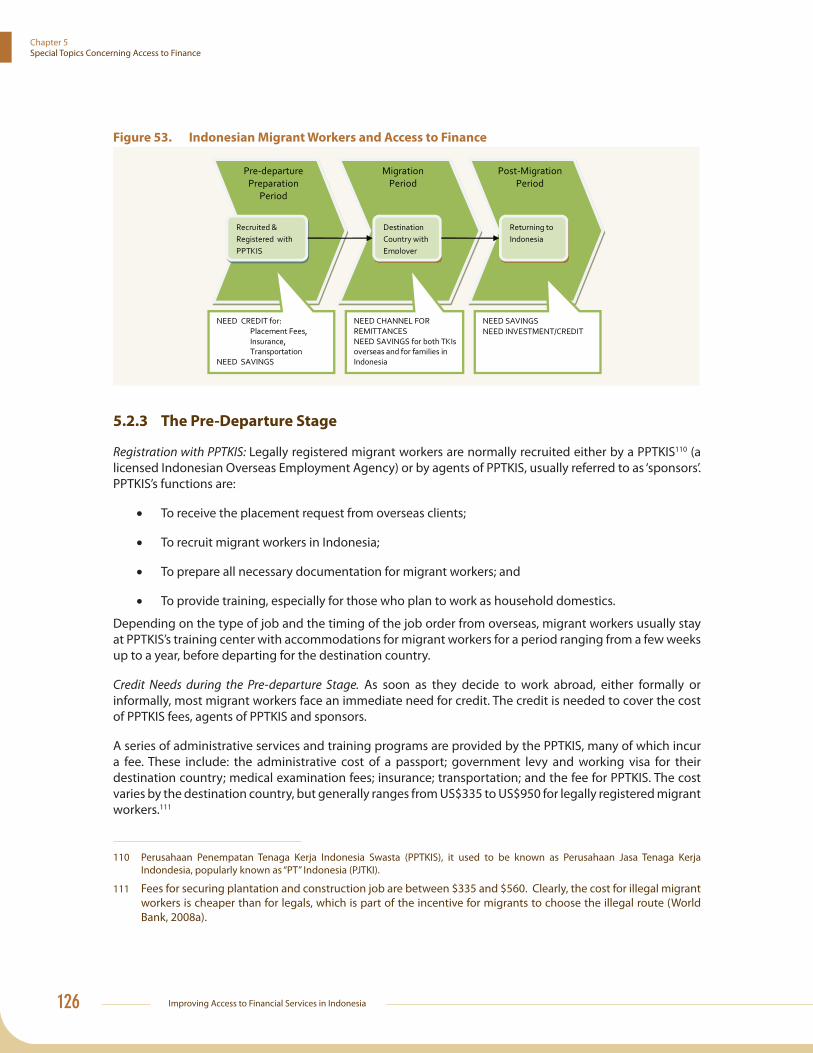
Improving Access to Financial Services in Indonesia126
Chapter 5Special Topics Concerning Access to Finance
Figure 53. Indonesian Migrant Workers and Access to Finance
5.2.3 The Pre-Departure Stage
Registration with PPTKIS: Legally registered migrant workers are normally recruited either by a PPTKIS110 (a licensed Indonesian Overseas Employment Agency) or by agents of PPTKIS, usually referred to as ‘sponsors’. PPTKIS’s functions are:
• To receive the placement request from overseas clients;
• To recruit migrant workers in Indonesia;
• To prepare all necessary documentation for migrant workers; and
• To provide training, especially for those who plan to work as household domestics.
Depending on the type of job and the timing of the job order from overseas, migrant workers usually stay at PPTKIS’s training center with accommodations for migrant workers for a period ranging from a few weeks up to a year, before departing for the destination country.
Credit Needs during the Pre-departure Stage. As soon as they decide to work abroad, either formally or informally, most migrant workers face an immediate need for credit. The credit is needed to cover the cost of PPTKIS fees, agents of PPTKIS and sponsors.
A series of administrative services and training programs are provided by the PPTKIS, many of which incur a fee. These include: the administrative cost of a passport; government levy and working visa for their destination country; medical examination fees; insurance; transportation; and the fee for PPTKIS. The cost varies by the destination country, but generally ranges from US$335 to US$950 for legally registered migrant workers.111
110 Perusahaan Penempatan Tenaga Kerja Indonesia Swasta (PPTKIS), it used to be known as Perusahaan Jasa Tenaga Kerja Indondesia, popularly known as “PT” Indonesia (PJTKI).
111 Fees for securing plantation and construction job are between $335 and $560. Clearly, the cost for illegal migrant workers is cheaper than for legals, which is part of the incentive for migrants to choose the illegal route (World Bank, 2008a).
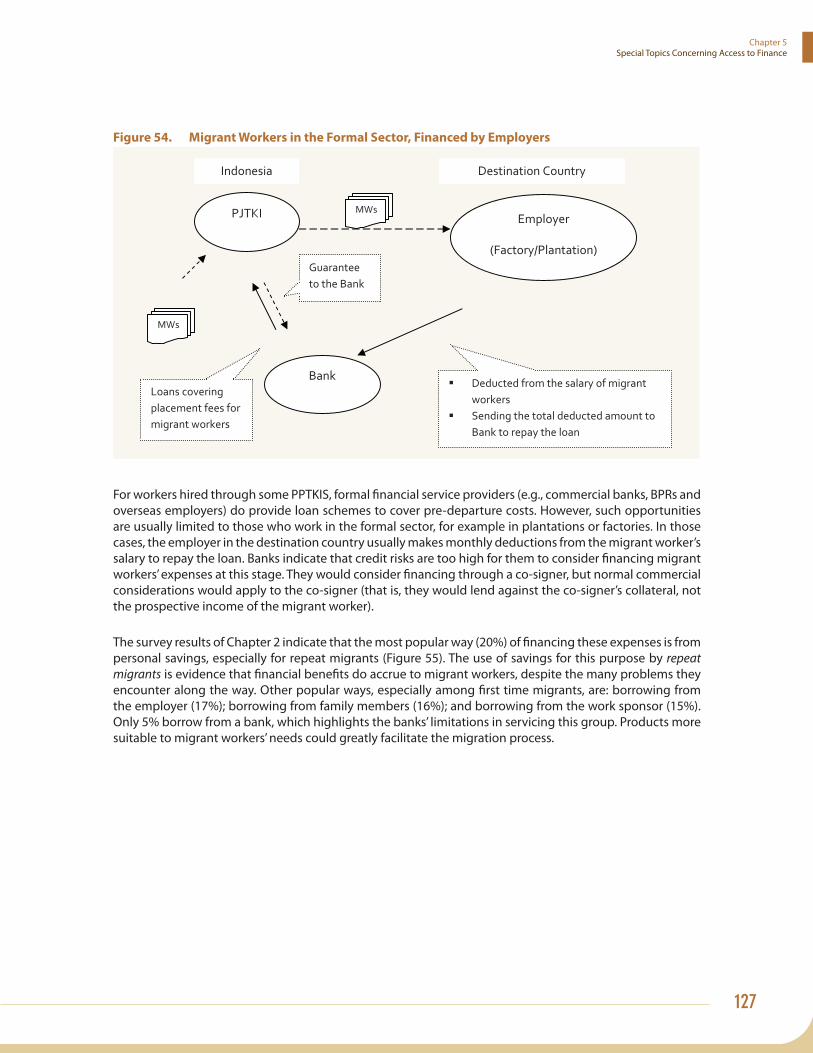
127
Chapter 5Special Topics Concerning Access to Finance
Figure 54. Migrant Workers in the Formal Sector, Financed by Employers
For workers hired through some PPTKIS, formal fi nancial service providers (e.g., commercial banks, BPRs and overseas employers) do provide loan schemes to cover pre-departure costs. However, such opportunities are usually limited to those who work in the formal sector, for example in plantations or factories. In those cases, the employer in the destination country usually makes monthly deductions from the migrant worker’s salary to repay the loan. Banks indicate that credit risks are too high for them to consider fi nancing migrant workers’ expenses at this stage. They would consider fi nancing through a co-signer, but normal commercial considerations would apply to the co-signer (that is, they would lend against the co-signer’s collateral, not the prospective income of the migrant worker).
The survey results of Chapter 2 indicate that the most popular way (20%) of fi nancing these expenses is from personal savings, especially for repeat migrants (Figure 55). The use of savings for this purpose by repeat migrants is evidence that fi nancial benefi ts do accrue to migrant workers, despite the many problems they encounter along the way. Other popular ways, especially among fi rst time migrants, are: borrowing from the employer (17%); borrowing from family members (16%); and borrowing from the work sponsor (15%). Only 5% borrow from a bank, which highlights the banks’ limitations in servicing this group. Products more suitable to migrant workers’ needs could greatly facilitate the migration process.

Improving Access to Financial Services in Indonesia128
Chapter 5Special Topics Concerning Access to Finance
Figure 55. How Migrant Workers Finance Pre-departure Expenses
As mentioned, the majority of Indonesian migrant workers work in the informal sector in jobs such as housemaids, baby-sitters or drivers. Very few formal fi nancial institutions of loan products to migrant workers in these categories. Despite their good income prospects, the migrants are usually forced to obtain credit from informal providers who charge relatively high interest rates. From the banks’ perspective, these potential clients are very risky, because the loan recipient is physically abroad, which risks default without recourse by the lender. Also, the loan amounts are small, probably only Rp3-5 million, so the interest payments may not cover the bank’s administrative costs. This said, a few banks view migrant workers as a potential market and do have a special department to deal with the needs of migrant workers, although most of these are involved in the supervision of remittance payments services.
To assist with the shortage of credit for migrant workers, especially those working in informal sector (i.e. housemaid, babysitter etc), government of Indonesia through BP2TKI (The National Commission for Placement and Protection of Indonesian Migrant Workers), has initiated a credit scheme for Indonesian migrant workers going to work in Taiwan (see Box 16). Interest rates and charges appear to be quite expensive.
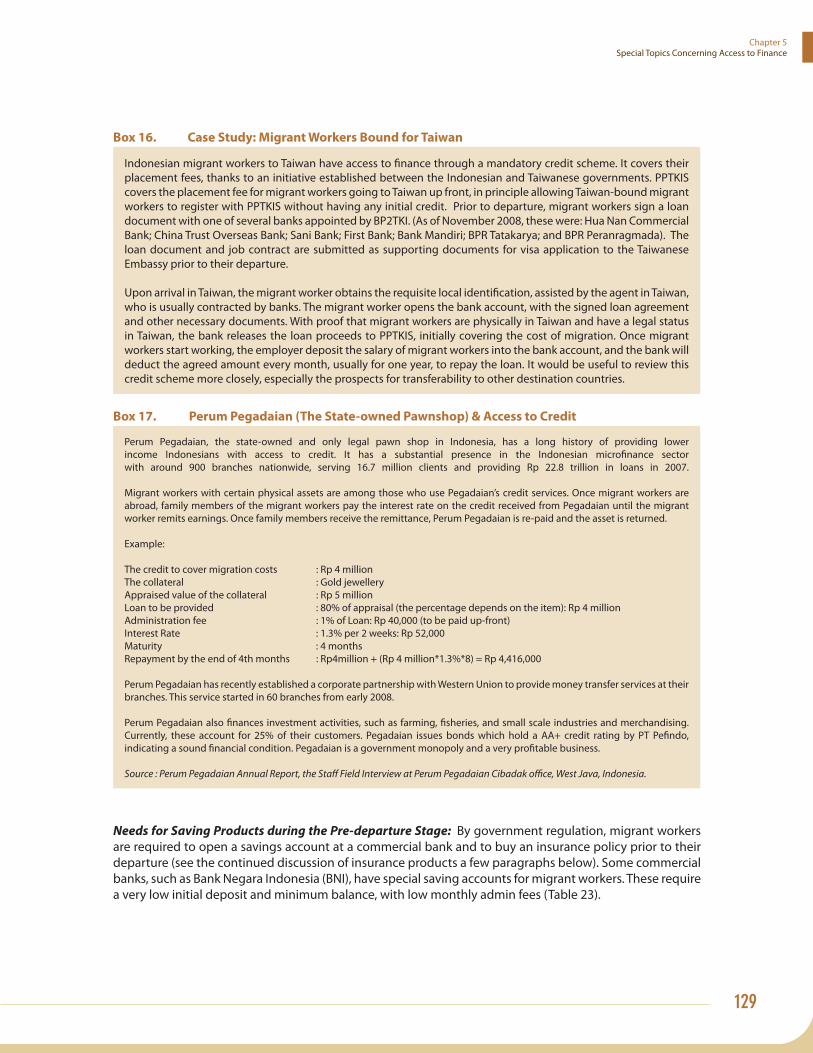
129
Chapter 5Special Topics Concerning Access to Finance
Box 16. Case Study: Migrant Workers Bound for Taiwan
Indonesian migrant workers to Taiwan have access to fi nance through a mandatory credit scheme. It covers their placement fees, thanks to an initiative established between the Indonesian and Taiwanese governments. PPTKIS covers the placement fee for migrant workers going to Taiwan up front, in principle allowing Taiwan-bound migrant workers to register with PPTKIS without having any initial credit. Prior to departure, migrant workers sign a loan document with one of several banks appointed by BP2TKI. (As of November 2008, these were: Hua Nan Commercial Bank; China Trust Overseas Bank; Sani Bank; First Bank; Bank Mandiri; BPR Tatakarya; and BPR Peranragmada). The loan document and job contract are submitted as supporting documents for visa application to the Taiwanese Embassy prior to their departure.
Upon arrival in Taiwan, the migrant worker obtains the requisite local identifi cation, assisted by the agent in Taiwan, who is usually contracted by banks. The migrant worker opens the bank account, with the signed loan agreement and other necessary documents. With proof that migrant workers are physically in Taiwan and have a legal status in Taiwan, the bank releases the loan proceeds to PPTKIS, initially covering the cost of migration. Once migrant workers start working, the employer deposit the salary of migrant workers into the bank account, and the bank will deduct the agreed amount every month, usually for one year, to repay the loan. It would be useful to review this credit scheme more closely, especially the prospects for transferability to other destination countries.
Box 17. Perum Pegadaian (The State-owned Pawnshop) & Access to Credit
Perum Pegadaian, the state-owned and only legal pawn shop in Indonesia, has a long history of providing lower income Indonesians with access to credit. It has a substantial presence in the Indonesian microfi nance sector with around 900 branches nationwide, serving 16.7 million clients and providing Rp 22.8 trillion in loans in 2007.
Migrant workers with certain physical assets are among those who use Pegadaian’s credit services. Once migrant workers are abroad, family members of the migrant workers pay the interest rate on the credit received from Pegadaian until the migrant worker remits earnings. Once family members receive the remittance, Perum Pegadaian is re-paid and the asset is returned.
Example:
The credit to cover migration costs : Rp 4 millionThe collateral : Gold jewelleryAppraised value of the collateral : Rp 5 millionLoan to be provided : 80% of appraisal (the percentage depends on the item): Rp 4 millionAdministration fee : 1% of Loan: Rp 40,000 (to be paid up-front)Interest Rate : 1.3% per 2 weeks: Rp 52,000Maturity : 4 monthsRepayment by the end of 4th months : Rp4million + (Rp 4 million*1.3%*8) = Rp 4,416,000
Perum Pegadaian has recently established a corporate partnership with Western Union to provide money transfer services at their branches. This service started in 60 branches from early 2008.
Perum Pegadaian also fi nances investment activities, such as farming, fi sheries, and small scale industries and merchandising. Currently, these account for 25% of their customers. Pegadaian issues bonds which hold a AA+ credit rating by PT Pefi ndo, indicating a sound fi nancial condition. Pegadaian is a government monopoly and a very profi table business.
Source : Perum Pegadaian Annual Report, the Staff Field Interview at Perum Pegadaian Cibadak offi ce, West Java, Indonesia.
Needs for Saving Products during the Pre-departure Stage: By government regulation, migrant workers are required to open a savings account at a commercial bank and to buy an insurance policy prior to their departure (see the continued discussion of insurance products a few paragraphs below). Some commercial banks, such as Bank Negara Indonesia (BNI), have special saving accounts for migrant workers. These require a very low initial deposit and minimum balance, with low monthly admin fees (Table 23).

Improving Access to Financial Services in Indonesia130
Chapter 5Special Topics Concerning Access to Finance
Table 23. Sample Savings Product Off ered by Banks and the Post Offi ce
Savings Product Initial Deposit
Minimum Balance
Monthly Cost Notes
e-Batara Pos Rp20,000 Rp20,000 Rp1,500
Product of BTN Bank jointly operationalized with PT Pos IndonesiaATM card available
Simpedes Rp100,000 Rp50,000
Product of BRI BankATM card available (with an additional monthly cost of Rp 3,000)
Tabungan Mandiri Rp50,000 Rp50,000 Rp9,000
Product of Mandiri BankATM card mandatoryMinimum deposit Rp 10,000
BNI TKI Rp10,000 Rp250
Product of BNI Should be requested collectively (minimum 10 persons) and coordinated or recommended by the PPTKIS
BNI Taplus Rp200,000 Rp6,000 Product of BNI ATM card available
Source: Interview with banks & post offi ce, Cirebon, September 2007, www.posindonesia.co.id, www.btn.co.id, www.bri.co.id, www.bankmandiri.co.id, www.bni.co.id.
PPTKIS normally have a partnership with a bank. As part of pre-departure preparations, an offi cial of that bank usually provides a short (1-hour) training program for migrant workers, including details on opening a special savings account and providing a bank book to migrant workers before departure.112 This saving account constitutes proof of migrant worker status at the airport, where the migrant worker is exempted from paying the exit tax (of Rp1 million, commonly known as ‘fi skal’).
There are limitations on the use of this saving account by migrant workers. For example, the account is created only under the migrant worker’s name, so that family does not have an access to this account while the worker is abroad.113 Eff ectively, this prohibits use of the account for remittance purposes. Also, these
112 Such savings accounts for migrant workers are not available at the branch level. The support given by bank offi cials is mainly administrative; there is no fi nancial literacy training or explanation of bank products.
113 BRI recently started a pilot program for a migrant worker’s savings account, which can be accessed by his/her family members with little administration process. There are also special migrant workers’ loan products that can be extended to a migrant worker’s family, once migrant worker repay a certain percentage of loan. This is a promising step that needs to be investigated further, and possibly adopted by more banks.
131
Chapter 5Special Topics Concerning Access to Finance
accounts still require a minimum balance, and monthly admin fees can result in the account being closed by the bank while the migrant worker is abroad.
Insurance Products for Migrant Workers: As mentioned, legal migrant workers going abroad through PPTKIS are required to have an insurance policy for the duration of their time overseas, as well as during the pre- and post-migration periods. As of early 2009, fi ve consortiums of insurance companies provided insurance products for migrant workers.114
By regulation, every departing Indonesian migrant worker must pay Rp400,000 for insurance, which is included in his or her placement fee.115 However, it is highly debatable whether these insurance policies are of signifi cant value to the migrant worker. For instance, migrant workers are often unfamiliar with insurance products. They are often unaware of the terms of their coverage and tend to treat premiums as just an overheard cost of working abroad. Consequently, in case of accident, illness or death during the insurance coverage period, claims are rarely submitted by the migrant worker and his/her family. Even if migrant workers do submit a claim, the process is often too long or too complicated for migrant workers.116 As a result, the claim rate by migrant workers and their families is low, according to discussions with representatives of the insurance consortium.
5.2.4 Financial Service Needs During Migration
The typical period spent overseas by Indonesian migrant workers is two years. However, if both the employer and the migrant worker agree, there is the possibility of extending the contract for another one or two years. During the migration period, the workers often send some of their earnings back to their family in Indonesia, probably after having saved up for 2-3 months or more (Box 18).
114 The biggest is Consortium Jasindo with 7 member of insurance companies lead by the Asuransi Jasindo. Another is the Konsorsium Asurasi TKI “Mitra Dhana Atmharakhsa”, currently a consortium of six insurance companies (PT. Asuransi Ramayana Tbk., Jasa Tania, General Insurance, BNI life, PT Asuransi Asoka Mas, PT. Fadent Mahkota Sahid General Insurance and Megalife Asuransi Jiwa). It has 19 offi ces throughout Indonesia and 6 international offi ces, in Kuwait, Bahrain, Malaysia, Singapore, Hong Kong and Taiwan.
115 This covers a total of 30 months of insurance, including the pre-departure, placement and post-placement stages. In the pre-departure stage, the insurance program covers death due to accidents or illness during training period; permanent partial disability; and medical treatment due to illness or accident. In the placement stage, insurance will cover accidents during and outside working hours; medical treatment expenses; death due to accident or illness (including expenses for burial and corpse repatriation); unpaid wages; and premature contract termination by the employer. During the post-placement stage, the insurance covers death due to accident or illness; permanent partial and total disabilities; and medical expenses due to accident. (Manpower and Transmigration Ministerial Decree no 157/MEN/2003, dated 9 June 2003).
116 There are instances where the PJTKI assists the migrant workers with the claim, but this is rare because the PJTKI’s responsibilities end when the migrant worker departs Indonesia for the destination country.
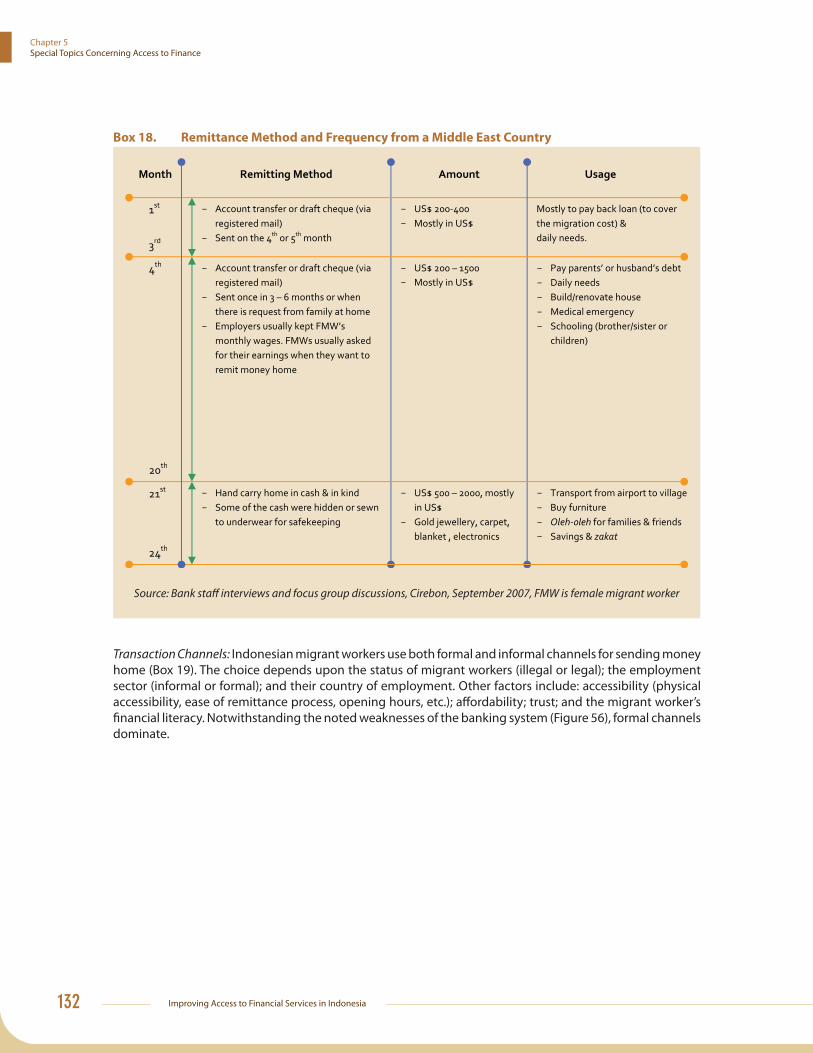
Improving Access to Financial Services in Indonesia132
Chapter 5Special Topics Concerning Access to Finance
Box 18. Remittance Method and Frequency from a Middle East Country
Source: Bank staff interviews and focus group discussions, Cirebon, September 2007, FMW is female migrant worker
Transaction Channels: Indonesian migrant workers use both formal and informal channels for sending money home (Box 19). The choice depends upon the status of migrant workers (illegal or legal); the employment sector (informal or formal); and their country of employment. Other factors include: accessibility (physical accessibility, ease of remittance process, opening hours, etc.); aff ordability; trust; and the migrant worker’s fi nancial literacy. Notwithstanding the noted weaknesses of the banking system (Figure 56), formal channels dominate.
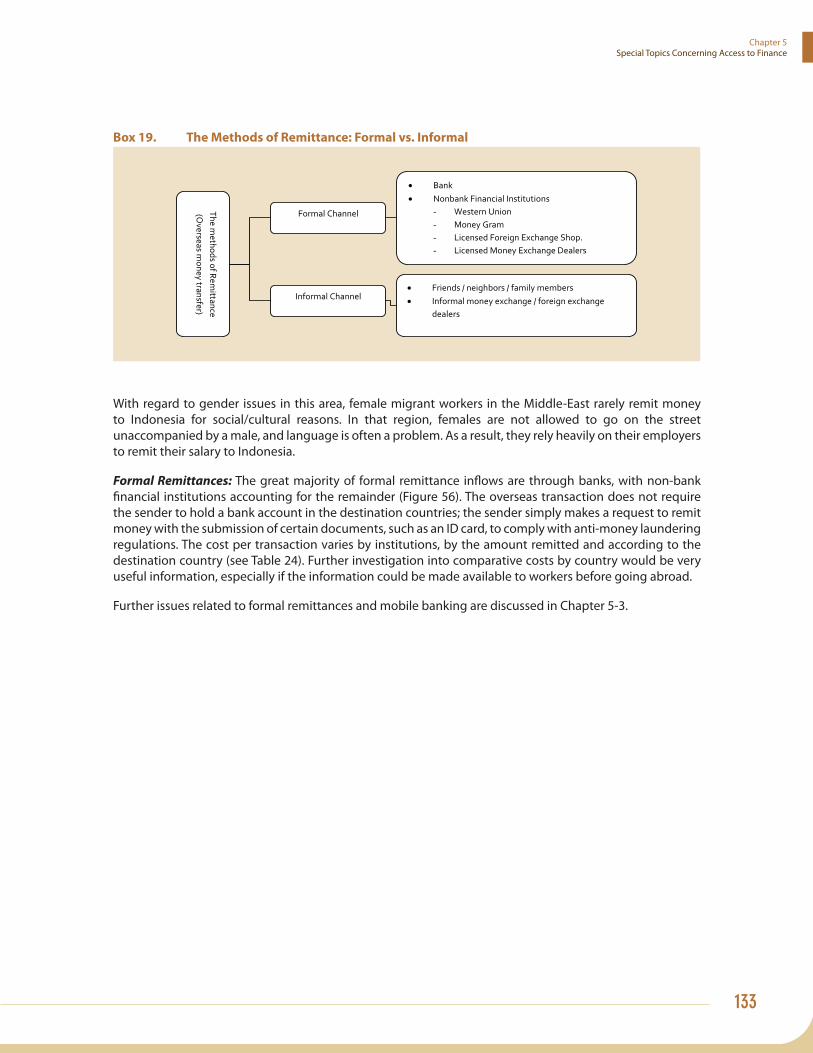
133
Chapter 5Special Topics Concerning Access to Finance
Box 19. The Methods of Remittance: Formal vs. Informal
With regard to gender issues in this area, female migrant workers in the Middle-East rarely remit money to Indonesia for social/cultural reasons. In that region, females are not allowed to go on the street unaccompanied by a male, and language is often a problem. As a result, they rely heavily on their employers to remit their salary to Indonesia.
Formal Remittances: The great majority of formal remittance infl ows are through banks, with non-bank fi nancial institutions accounting for the remainder (Figure 56). The overseas transaction does not require the sender to hold a bank account in the destination countries; the sender simply makes a request to remit money with the submission of certain documents, such as an ID card, to comply with anti-money laundering regulations. The cost per transaction varies by institutions, by the amount remitted and according to the destination country (see Table 24). Further investigation into comparative costs by country would be very useful information, especially if the information could be made available to workers before going abroad.
Further issues related to formal remittances and mobile banking are discussed in Chapter 5-3.

Improving Access to Financial Services in Indonesia134
Chapter 5Special Topics Concerning Access to Finance
Table 24. Indicative Cost of Remitting Money from a Middle-East Country
Sending Method
Cost Borne byDuration Notes
Remitter Recipient
Hand Carry
None None 1-2 days In the form of cash, gold, goodsPolicy on maximum amount of currencies leaving a destination country applies
Draft Cheque
20 Riyal6 Riyal for mail
Revenue stampID photocopyIndicative ‘gratitude tip’ for post offi ce
2-4 weeks
Cheque is sent via registered mailNeed valid ID to cash outPost offi ce called or sms migrant family for incoming registered mail
Account Transfer
25 Riyal None 2-3 days Need bank account & valid ID
Western Union
Rp 100 000 to transfer home Rp 1 million
Formally noneIndicative ‘gratitude tip’ for post offi ce
1 hour Need valid ID & PIN codeCan be cashed out in any WU outlet (banks, post offi ces)For post offi ces that are not yet online, PIN code confi rmation is done through phone calls with the Cirebon City Central Post Offi ce
Source: Interviews and focus group discussions, Cirebon, September 2007

135
Chapter 5Special Topics Concerning Access to Finance
Figure 56. Method of Receiving Remittances, by Host Country (in percent)
Informal Remittances. The use of informal channels for overseas transactions is common for Indonesian migrant workers in Malaysia, where they are often illegal. The informal channels include hand delivery, informal agents, informal money changers and shops. The process tends to be simpler and quicker although the fi nancial costs are usually higher. Illegal migrant workers are likely to use such informal channels due to the lack of proper ID, which is required by the formal channel.
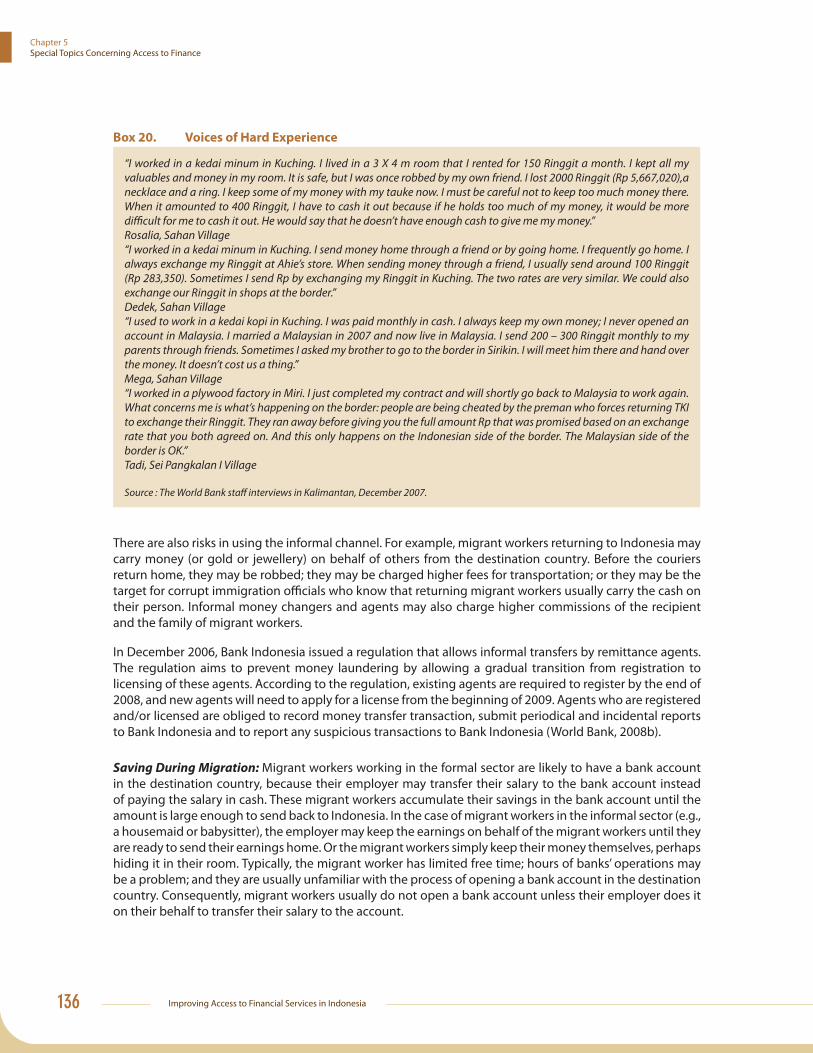
Improving Access to Financial Services in Indonesia136
Chapter 5Special Topics Concerning Access to Finance
Box 20. Voices of Hard Experience
“I worked in a kedai minum in Kuching. I lived in a 3 X 4 m room that I rented for 150 Ringgit a month. I kept all my valuables and money in my room. It is safe, but I was once robbed by my own friend. I lost 2000 Ringgit (Rp 5,667,020),a necklace and a ring. I keep some of my money with my tauke now. I must be careful not to keep too much money there. When it amounted to 400 Ringgit, I have to cash it out because if he holds too much of my money, it would be more diffi cult for me to cash it out. He would say that he doesn’t have enough cash to give me my money.”Rosalia, Sahan Village “I worked in a kedai minum in Kuching. I send money home through a friend or by going home. I frequently go home. I always exchange my Ringgit at Ahie’s store. When sending money through a friend, I usually send around 100 Ringgit (Rp 283,350). Sometimes I send Rp by exchanging my Ringgit in Kuching. The two rates are very similar. We could also exchange our Ringgit in shops at the border.”Dedek, Sahan Village“I used to work in a kedai kopi in Kuching. I was paid monthly in cash. I always keep my own money; I never opened an account in Malaysia. I married a Malaysian in 2007 and now live in Malaysia. I send 200 – 300 Ringgit monthly to my parents through friends. Sometimes I asked my brother to go to the border in Sirikin. I will meet him there and hand over the money. It doesn’t cost us a thing.”Mega, Sahan Village“I worked in a plywood factory in Miri. I just completed my contract and will shortly go back to Malaysia to work again.What concerns me is what’s happening on the border: people are being cheated by the preman who forces returning TKI to exchange their Ringgit. They ran away before giving you the full amount Rp that was promised based on an exchange rate that you both agreed on. And this only happens on the Indonesian side of the border. The Malaysian side of the border is OK.”Tadi, Sei Pangkalan I Village
Source : The World Bank staff interviews in Kalimantan, December 2007.
There are also risks in using the informal channel. For example, migrant workers returning to Indonesia may carry money (or gold or jewellery) on behalf of others from the destination country. Before the couriers return home, they may be robbed; they may be charged higher fees for transportation; or they may be the target for corrupt immigration offi cials who know that returning migrant workers usually carry the cash on their person. Informal money changers and agents may also charge higher commissions of the recipient and the family of migrant workers.
In December 2006, Bank Indonesia issued a regulation that allows informal transfers by remittance agents. The regulation aims to prevent money laundering by allowing a gradual transition from registration to licensing of these agents. According to the regulation, existing agents are required to register by the end of 2008, and new agents will need to apply for a license from the beginning of 2009. Agents who are registered and/or licensed are obliged to record money transfer transaction, submit periodical and incidental reports to Bank Indonesia and to report any suspicious transactions to Bank Indonesia (World Bank, 2008b).
Saving During Migration: Migrant workers working in the formal sector are likely to have a bank account in the destination country, because their employer may transfer their salary to the bank account instead of paying the salary in cash. These migrant workers accumulate their savings in the bank account until the amount is large enough to send back to Indonesia. In the case of migrant workers in the informal sector (e.g., a housemaid or babysitter), the employer may keep the earnings on behalf of the migrant workers until they are ready to send their earnings home. Or the migrant workers simply keep their money themselves, perhaps hiding it in their room. Typically, the migrant worker has limited free time; hours of banks’ operations may be a problem; and they are usually unfamiliar with the process of opening a bank account in the destination country. Consequently, migrant workers usually do not open a bank account unless their employer does it on their behalf to transfer their salary to the account.

137
Chapter 5Special Topics Concerning Access to Finance
5.2.5 The Post-Migration Period
Based on the evidence of this study, remittances are generally not used for investment, with the notable exception of building or renovating a house. Rather they go towards meeting the daily needs of family life in the village, re-paying loans, school and medical expenses and so forth. After returning home, many migrant workers fi nd that their remitted earnings have been fully used up. Repeat migrant workers are likely to accumulate some assets (such as some savings or a better home) but there is limited evidence that their post-migration livelihood has improved much on a self-sustaining basis. Indeed, less than half (41%) of respondents reported that they had saved money from abroad.
In part, this refl ects the dire on-going needs at home as well as the capacity of dependent family members to consume transfers from abroad virtually as fast as the migrant worker can remit them. But it is also due to a lack of fi nancial planning and fi nancial management. As mentioned, the great majority of Indonesian migrant workers are from poor rural areas, with a low level of education. These migrant workers and their families tend to have limited knowledge of fi nancial services and products. This problem of low fi nancial literacy is one of key constraints to improving migrant workers’ livelihood recognized by the Indonesian Government. Still, there are very few fi nancial literacy education programs for migrant workers. Such information as migrant workers obtain comes from their own experience, friends, family members, the employer, neighbors or other migrant workers in the same destination country. Rarely does it arise from any form of established, formal training intended to assist with making the best choices regarding the available fi nancial services and products. Uninformed decisions early in the process often appear to trap the migrant into unfavorable loan arrangements are often compel them to spend the bulk of their earnings to repay loans, rather than spending to improve their livelihood.
5.3 Mobile Banking5.3.1 The International Context
Branchless banking,117 whether it involves telephone-based mobile banking118 or card-based transactions,119 has considerable potential to extend access to fi nancial services to the ‘unbanked’. For the purposes of this study, mobile phone technology is particularly interesting, because it provides a method for the unbanked to access fi nancial services easily, conveniently and securely through a popular, existing delivery channel. Customers no longer have to travel a distance or wait for a long time to conduct a fi nancial transaction, they can conduct this transaction through their mobile phone, perhaps followed by a visit a nearby cash-in and cash-out agent.
There are two basic models of branchless banking, bank-based and non-bank based. Both models deliver fi nancial services through channels other than traditional bank branches. In the bank-based model, every customer has a direct contractual relationship with a prudentially licensed and supervised fi nancial
117 The term ‘branchless banking’ refers to fi nancial transactions conducted by means other than formal bank branches or their fi eld offi ces. For example, the transaction may be done through post offi ces or common retail outlets, like grocery stores or gas stations.
118 There is some disagreement over the term ‘mobile banking’. Some experts defi ne mobile banking as any fi nancial transactions conducted with the use of mobile phones, regardless of who provides the services. Others argue that banks must provide the underlying service; they believe that, if telecommunication companies provide the service, it should be called an ‘m-payment’ or something similar.
119 ard-based transactions include debit card or prepaid card transactions using a device that can transmit data over a network such as electronic data capturer (EDC) or by using a mobile phone.

Improving Access to Financial Services in Indonesia138
Chapter 5Special Topics Concerning Access to Finance
institution. In the non-bank based model, the customer buys an electronic store of value, the current value of which is tracked on the server of a non-bank institution such a mobile phone operator or telecommunications company. If the system is mobile-phone based, customers only need to visit a retail agent to top-up the stored value or to convert the stored value back into cash (i.e., ‘cash-out’). These stored value instruments are referred to as e-money, eff ectively substituting for cash.
Recent years have seen a boom in mobile banking operations in a number of developing countries. In Kenya, a country of roughly 39 million people, where fewer than 4 million have bank accounts, the M-PESA mobile wallet service off ered by Safaricom attracted 1 million registered users in 10 months.120 In the Philippines, the country’s two mobile network operators off er the functional equivalent of small-scale transaction banking to an estimated 5.5 million customers.121 For the unbanked poor in countries such as these, conducting transactions using a mobile phone is far cheaper than going to a bank branch in terms of both time and out-of-pocket expenses.
These Kenyan and Filipino examples illustrate telco-led mobile banking operations that specifi cally target the unbanked; they are known as “transformational mobile banking”. Variations on this model include a joint venture between a telco and a bank, or a technology company with a bank, such as WIZZIT in South Africa (Box 21).
Box 21. Promising Technologial Advances – South Africa’s WIZZIT
There are good economic reasons to believe that the formal banking sector will extend its services to remote regions if the cost of providing those services is suffi ciently low. One promising technological advance in this regard is cell phone banking, introduced into South Africa under the branding of ‘WIZZIT’. The service is premised on the simple observation that even the poor in remote regions of the country have access to a cell phone these days (As indicated in Chapter 3, almost 95% of survey respondents said they have access to a cellphone.)
In South Africa, branchless banking through retail agents is permitted only for licensed fi nancial institutions, with non-bank institutions being prohibited from accepting public deposits. Consequently, mobile operators interested in branchless banking have created joint ventures with licensed banks to off er cell phone-based banking. WIZZIT, a third party technology company, became a division of the South African Bank of Athens in order to be able to off er cell phone- and card-based bank accounts for the unbanked.
WIZZIT’s resulting product is a cellphone-based banking facility whose immediate target market is the estimated 16 million unbanked or underbanked South Africans (about 60 percent of the country’s population). The initiative was conceived in early 2002 and commercially launched in March 2005. Once successful, the company plans to expand into the rest of Africa. In addition, the company reports having received enquiries from as far afi eld as Latin America and Asia. Because it is bank-based, WIZZIT can provide a wide range of regular bank services, such as deposit, withdrawal, payment and airtime reload services, through a mobile phone interface, ATMs, bank branches and post offi ces.
WIZZIT is compatible with early generation cell phones, which are popular in low-income communities. In addition, the services can be accessed through pay-as-you-go cellphones. As part of the service, WIZZIT account holders are issued debit cards that can be used at any ATM or in the formal retail sector. WIZZIT charges per-transaction fees that range from 99c (US$0.15) to R4.99 (US$0.78); it does not charge a monthly fee; there are no transaction limitations; and it does not require a minimum balance. WIZZIT employs over 800 “Wizz Kids”, typically unemployed university graduates from low-income communities, to promote the product and help unbanked customers open accounts.
Sources: The World Resources Institute, http://www.nextbillion.net/archive/activitycapsule/wizzit and http://www.wizzit.co.za/
120 See http://www.safaricom.co.ke/index.php?id=745.
121 See Lyman, Porteous and Pickens (2008).
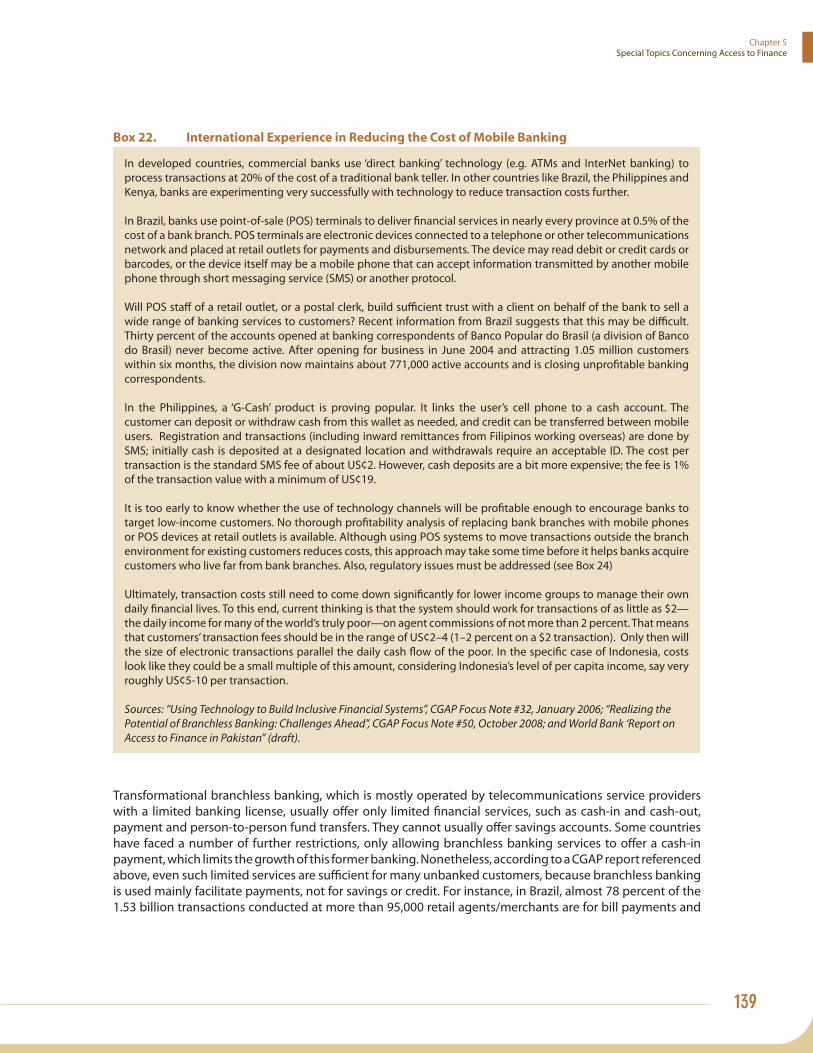
139
Chapter 5Special Topics Concerning Access to Finance
Box 22. International Experience in Reducing the Cost of Mobile Banking
In developed countries, commercial banks use ‘direct banking’ technology (e.g. ATMs and InterNet banking) to process transactions at 20% of the cost of a traditional bank teller. In other countries like Brazil, the Philippines and Kenya, banks are experimenting very successfully with technology to reduce transaction costs further.
In Brazil, banks use point-of-sale (POS) terminals to deliver fi nancial services in nearly every province at 0.5% of the cost of a bank branch. POS terminals are electronic devices connected to a telephone or other telecommunications network and placed at retail outlets for payments and disbursements. The device may read debit or credit cards or barcodes, or the device itself may be a mobile phone that can accept information transmitted by another mobile phone through short messaging service (SMS) or another protocol.
Will POS staff of a retail outlet, or a postal clerk, build suffi cient trust with a client on behalf of the bank to sell a wide range of banking services to customers? Recent information from Brazil suggests that this may be diffi cult. Thirty percent of the accounts opened at banking correspondents of Banco Popular do Brasil (a division of Banco do Brasil) never become active. After opening for business in June 2004 and attracting 1.05 million customers within six months, the division now maintains about 771,000 active accounts and is closing unprofi table banking correspondents.
In the Philippines, a ‘G-Cash’ product is proving popular. It links the user’s cell phone to a cash account. The customer can deposit or withdraw cash from this wallet as needed, and credit can be transferred between mobile users. Registration and transactions (including inward remittances from Filipinos working overseas) are done by SMS; initially cash is deposited at a designated location and withdrawals require an acceptable ID. The cost per transaction is the standard SMS fee of about US¢2. However, cash deposits are a bit more expensive; the fee is 1% of the transaction value with a minimum of US¢19.
It is too early to know whether the use of technology channels will be profi table enough to encourage banks to target low-income customers. No thorough profi tability analysis of replacing bank branches with mobile phones or POS devices at retail outlets is available. Although using POS systems to move transactions outside the branch environment for existing customers reduces costs, this approach may take some time before it helps banks acquire customers who live far from bank branches. Also, regulatory issues must be addressed (see Box 24)
Ultimately, transaction costs still need to come down signifi cantly for lower income groups to manage their own daily fi nancial lives. To this end, current thinking is that the system should work for transactions of as little as $2—the daily income for many of the world’s truly poor—on agent commissions of not more than 2 percent. That means that customers’ transaction fees should be in the range of US¢2–4 (1–2 percent on a $2 transaction). Only then will the size of electronic transactions parallel the daily cash fl ow of the poor. In the specifi c case of Indonesia, costs look like they could be a small multiple of this amount, considering Indonesia’s level of per capita income, say very roughly US¢5-10 per transaction.
Sources: “Using Technology to Build Inclusive Financial Systems”, CGAP Focus Note #32, January 2006; “Realizing the Potential of Branchless Banking: Challenges Ahead”, CGAP Focus Note #50, October 2008; and World Bank ‘Report on Access to Finance in Pakistan” (draft).
Transformational branchless banking, which is mostly operated by telecommunications service providers with a limited banking license, usually off er only limited fi nancial services, such as cash-in and cash-out, payment and person-to-person fund transfers. They cannot usually off er savings accounts. Some countries have faced a number of further restrictions, only allowing branchless banking services to off er a cash-in payment, which limits the growth of this former banking. Nonetheless, according to a CGAP report referenced above, even such limited services are suffi cient for many unbanked customers, because branchless banking is used mainly facilitate payments, not for savings or credit. For instance, in Brazil, almost 78 percent of the 1.53 billion transactions conducted at more than 95,000 retail agents/merchants are for bill payments and

Improving Access to Financial Services in Indonesia140
Chapter 5Special Topics Concerning Access to Finance
for the payment of government benefi ts to individuals. Similarly, and even though WIZZIT off ers a broader range of services, most of its customers use the service to buy airtime twice as often as they withdrew funds from a branch or ATM, and fi ve times as often as they conduct money transfers.
With the number of people connected to mobile networks greatly exceeding the number of people with bank accounts, there is great potential for branchless banking, especially mobile banking, to extend at least a limited range of banking services to unbanked customers. The main questions are: Will the cost/unit of this service be reduced low enough to attract the unbanked poor (see Box 22)? And will the unbanked poor actually use these services once they are readily available on a cost-eff ective basis? Public education (by industry players) and transfer of knowledge (by early adopters of branchless banking) have a signifi cant role to play in this regard.
5.3.2 The State of Mobile Banking in Indonesia
Indonesia is moving ahead quickly with the development of mobile banking services (see Box 23). For instance, Bank Indonesia is relatively advanced in its thinking about e-money, and Indonesia is among the few countries with regulations allowing non-banks to issue e-money (As this report was being drafted, BI had just amended its current regulations, as discussed in Box 24).
By the end of 2007, twenty-three banks off ered bearing kinds of mobile banking services to their customers.122 In addition, two mobile telecommunications service providers have been licensed by Bank Indonesia to off er mobile payment services to their customers, albeit with some limitations.
The rate of mobile phone penetration is quite high in Indonesia, at 37 percent compared to 8.4 percent for fi xed-line telephones.123 Twelve mobile network operators are now competing for market share in Indonesia, with the big three (Telkomsel, Indosat and Excelcom) accounting for about 85% of the market, with a total of 75 million customers by the end of 2007.
122 Information gathered in www.informasi-media.blogspot.com.
123 Paul Budde Communication. 2008. “Indonesia – Key Statistics, Telecommunications Market and Regulatory Overview.”
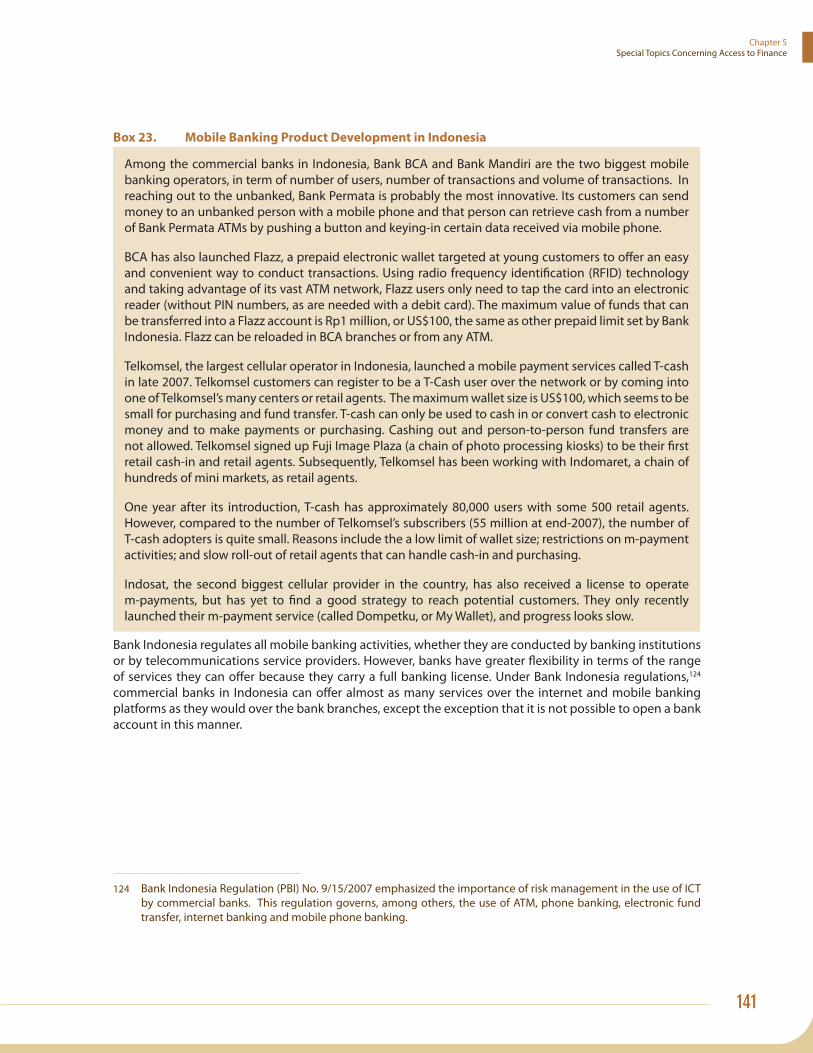
141
Chapter 5Special Topics Concerning Access to Finance
Box 23. Mobile Banking Product Development in Indonesia
Among the commercial banks in Indonesia, Bank BCA and Bank Mandiri are the two biggest mobile banking operators, in term of number of users, number of transactions and volume of transactions. In reaching out to the unbanked, Bank Permata is probably the most innovative. Its customers can send money to an unbanked person with a mobile phone and that person can retrieve cash from a number of Bank Permata ATMs by pushing a button and keying-in certain data received via mobile phone.
BCA has also launched Flazz, a prepaid electronic wallet targeted at young customers to off er an easy and convenient way to conduct transactions. Using radio frequency identifi cation (RFID) technology and taking advantage of its vast ATM network, Flazz users only need to tap the card into an electronic reader (without PIN numbers, as are needed with a debit card). The maximum value of funds that can be transferred into a Flazz account is Rp1 million, or US$100, the same as other prepaid limit set by Bank Indonesia. Flazz can be reloaded in BCA branches or from any ATM.
Telkomsel, the largest cellular operator in Indonesia, launched a mobile payment services called T-cash in late 2007. Telkomsel customers can register to be a T-Cash user over the network or by coming into one of Telkomsel’s many centers or retail agents. The maximum wallet size is US$100, which seems to be small for purchasing and fund transfer. T-cash can only be used to cash in or convert cash to electronic money and to make payments or purchasing. Cashing out and person-to-person fund transfers are not allowed. Telkomsel signed up Fuji Image Plaza (a chain of photo processing kiosks) to be their fi rst retail cash-in and retail agents. Subsequently, Telkomsel has been working with Indomaret, a chain of hundreds of mini markets, as retail agents.
One year after its introduction, T-cash has approximately 80,000 users with some 500 retail agents. However, compared to the number of Telkomsel’s subscribers (55 million at end-2007), the number of T-cash adopters is quite small. Reasons include the a low limit of wallet size; restrictions on m-payment activities; and slow roll-out of retail agents that can handle cash-in and purchasing.
Indosat, the second biggest cellular provider in the country, has also received a license to operate m-payments, but has yet to fi nd a good strategy to reach potential customers. They only recently launched their m-payment service (called Dompetku, or My Wallet), and progress looks slow.
Bank Indonesia regulates all mobile banking activities, whether they are conducted by banking institutions or by telecommunications service providers. However, banks have greater fl exibility in terms of the range of services they can off er because they carry a full banking license. Under Bank Indonesia regulations,124 commercial banks in Indonesia can off er almost as many services over the internet and mobile banking platforms as they would over the bank branches, except the exception that it is not possible to open a bank account in this manner.
124 Bank Indonesia Regulation (PBI) No. 9/15/2007 emphasized the importance of risk management in the use of ICT by commercial banks. This regulation governs, among others, the use of ATM, phone banking, electronic fund transfer, internet banking and mobile phone banking.
Improving Access to Financial Services in Indonesia142
Chapter 5Special Topics Concerning Access to Finance
Box 24. Weaknesses in the Regulatory Environment for Branchless Banking in Indonesia
Despite Bank Indonesia’s relatively advanced position on e-money (described in the main text), there are few examples to date of the successful provision of fi nancial services to low-income Indonesians through branchless banking. Some constraints relate to existing regulations, as summarized below. Policy recommendations to relieve these constraints are provided in Chapter 6.
First, until very recently the regulatory regime limited the use of e-money to making retail payments. This was the case because BI’s regulations treated e-money as being in the same category as prepaid card payment instruments such as credit, debit and ATM cards. BI changed its regulations in April 2009 (BI Regulation 11/12/2009), and the result appears to be a considerable improvement. However, the regulations do not secure the preferential claim of agents and customers over issuer creditors (for instance, in the case of bankruptcy of the e-money issuer). Also, non-banks are allowed to issue e-money, but its use is still restricted to retail purchases.
Second, any non-bank e-money provider that wants to extend its services to person-to-person (P2P) transfers (domestically or internationally) needs a remittance license from BI, and eligibility requirements are very tight. For example, potential providers may need to change their articles of association, which may be diffi cult. Eff ectively, the eligibility requirements are restricting new entry.
Third, neither banks nor non-banks are currently allowed to use agents to provide fi nancial services, like cash-out transactions. A network of agents is vital to operate on a suffi ciently large scale to make a low-value transactions business commercially viable.
Fourth, current Know Your Customer (KYC) regulations require banks that provide electronic banking services to meet the prospective customer, at least when the account is opened. This poses a barrier because sign-up of new customers can only be done in bank branch offi ces (or mobile branch offi ces). Eff ectively, banks cannot out-source their KYC procedures, which precludes customer acquisition beyond the reach of bank branches. Likewise, mobile banking cannot leverage off agents’ networks (or telecos) to sign up unbanked customers who are unable or unwilling to visit a traditional bank branch.
Source: ‘Diagnostic Report on the Legal and Regulatory Environment for Branchless Banking in Indonesia”, June 2009, by CGAP in cooperation with IFC and GTZ.
Looking at mobile banking services provided both by banking institutions and by telecommunications service providers under current regulations, bank-led mobile banking appears to be more likely to provide a wide range of services to unbanked users. Nonetheless, most banks seem unable to extend these services beyond their existing customer base, partly because of regulatory issues (see Box 24). One of the solutions may lie in the Sharia banking system (see Box 6); important innovations are taking place in this segment and, because it is Sharia-based, some previously unbanked segments are being attracted by the service.
5.3.3 Mobile Banking to Improve Access to Financial Services
By contrast, the telecommunications service provider model off ers greater potential for reaching the unbanked poor in rural areas because of existing wide mobile network coverage. However, the way the regulatory environment is currently constructed, the services these providers can off er do not meet the needs of the poor. Specifi cally, these limitations include no cash-out; no person-to-person fund transfer capabilities; and small wallet size.
With Indonesia’s wide geographical spread, the main issue is how to reach the unbanked poor in remote, rural areas in a cost effi cient fashion. Because of its reach, mobile banking off ers is much more promising than either internet banking or services off ered through brick and mortar venues. Telkomsel (which has applied

143
Chapter 5Special Topics Concerning Access to Finance
to be a remittance agent) claims that its network covers almost all districts (kacamatans) in Indonesia. The other players are currently expanding their networks rapidly, sometimes through means such as sharing base transceivers in the rural areas. These developments look likely to further reduce service providers’ costs signifi cantly, especially for smaller players that want to focus their reach into rural areas.
On the side of customers, the price of handsets has dropped in recent years, making mobile phones more aff ordable for low income earners. These days, many operators even off er a bundling program, whereby the customer gets a low cost handset if s/he buys Rp300 thousand (US$30) worth of airtime.
These factors, of course, have to be supported by the regulatory environment (see Box 24) and by the services on off er, which must make conducting mobile banking transactions convenient if they are to succeed. Most people want the ability to cash-in and cash-out; send money to their families; make balance inquiries; reload airtime; and purchase goods. Considering the popularity of short messaging services (SMS), if banks or telecommunications service providers were to off er mobile banking services using SMS as the transactions mechanism, there could be a huge take up, including from the unbanked poor segment of the market. Further work is needed to better access the prospects, including for helpful interventions of one form or another.
Remittances Using Mobile Banking: In some countries, person-to-person fund transfers are allowed under current regulations. For example, in the Philippines, remittances are one of the driving forces behind the success of mobile banking, with Filipino migrant workers in Singapore, Hong Kong and the Middle East send in millions of US dollars back home every month.
This could also be the case in Indonesia, if the regulatory framework permits. Currently, telecommunications service provider led mobile banking players are not allowed to conduct person-to-person fund transfer, with only bank-account-to-bank-account transfers being permitted. Maxis, a cellular operator in Malaysia is able to provide remittance services to Indonesian migrant workers in Malaysia and Singapore. Indonesian migrant workers in the two countries can use Maxis services by sending money to their relatives providing their relatives have bank account in one of fi ve banks that cooperate with Maxis in Indonesia.
At the drafting of this report, two operators in Indonesia were working on a pilot with Indonesian banks to allow Indonesian migrant workers in Malaysia and Hong Kong to remit money using Indonesian mobile operators. Beyond that, the mobile operators would need to build a chain of cash-out agents to allow for easy and convenient cash withdrawal. Under current circumstances, it looks quite diffi cult for small shops to apply to become remittance agents. To accelerate the process, there may be a role for a pilot program of some type, possibly in the form of a public-private partnership.
5.4 Policy IssuesMSMEs and Access to Finance: Unlike other parts of this report, the MSME issues of access to fi nancial services are virtually one-dimensional: they are almost exclusively related to credit. On the basis of available evidence, the problems of MSMEs in this regard are in inverse proportion to the size of the enterprise, with problems of access mainly arising at the micro level. At the micro-enterprise level, there are many problems, only one of which concerns their access to fi nance. Resolution of access-to-fi nance issues would certainly help micro-enterprises, but other, more basic problems need to be addressed, too, such as constraints related to human resources.
Indonesia has proactively formulated and implemented policies to promote the development of MSME in this area for many years, but the past emphasis has been on subsidized credit programs. In general,

Improving Access to Financial Services in Indonesia144
Chapter 5Special Topics Concerning Access to Finance
Indonesia has not been well-served by most of these programs, and some have already been abandoned. In a welcome step, the Government is undertaking a review of one of these, the relatively new KUR program. As part of its review, the Government might consider allowing more banks to qualify for the program (including more private banks and BPRs); pricing the guarantee to provide an incentive to increase the quantity and quality of small loans; and designing an exit strategy. Depending upon the outcome of this assessment, the government could review similar programs.
Another useful step forward would be the drafting of the Micro-Finance law to re-gain some momentum under strong leadership from key stakeholders such as the Coordinating Ministry of Economic Aff airs, Bank Indonesia, or the Ministry of Finance. As part of the process, linkage programs between commercial banks and BPRs could be expanded to include non-bank MFIs. It would also be helpful And if a similar role could be defi ned for NGOs. At present, there is no obvious vehicle for linking NGOs with MFIs or lower-end BPRs, even if the NGO is prepared to take an equity position.
Migrant Workers and Remittances: The systems of remittance payments used by Indonesian migrant workers are, of course, usually regulated by governments outside Indonesia. Nonetheless, many policy issues in this area could legitimately be raised by the Indonesian government in international fora. For example, policy issues related to this matter could be addressed during discussions to reduce foreign barriers to exports of Indonesian labor services in the course of international negotiations for trade in services, especially in bilateral and regional agreements, or in negotiating its Memoranda of Understanding on Migrant Workers with host countries.
The objective of such bilateral discussions should be to better balance protection of the interests of the workers themselves with interests of employers and recruitment agencies. World Bank (2008b) makes several practical suggestions in this regard, regarding matters such as acceptable forms of identifi cation that do not constrain worker access to formal sector services and exemptions from formal identifi cation requirements for small transfers (such a policy was implemented successfully in the Korea-Mongolia migrant worker corridor, for example). The World Bank (2008b) also recommends the development of customized products for Indonesian workers and their families during their three phases of migration and the appropriate regulation of informal service providers, in such a fashion as to stimulate healthy competition between on and that their services remain accessible to workers.
To make signifi cant, sustainable progress, it is vital to convince the commercial banks that this business is suffi ciently profi table. One practical possibility would be to explore the wider use of domestic guarantors (or co-signers) for loans granted to migrant workers. In this regard, at one possibility would be to encourage international institutions or NGOs with particular interests in Indonesian migrant workers to implement a pilot project in which the institution NGO acts as the guarantor through a public-private partnership. This may be a viable and eff ective means of convincing private participants that the provision of loans to Indonesian migrant workers is a commercially viable business.
An issue that will be explored in greater detail in the Bank’s follow-up study on migrant workers is the degree to which Indonesian banks are missing a commercial opportunities by not expanding the services that they off er to migrant workers and developing new products in addition to remittance systems. To determine this, it would be useful to know the distribution of migrant workers’ net incomes (that is, their gross overseas salaries less overseas expenses like travel and admin costs) and the number of their dependents back in the village. This distribution could be compared to the income distribution of bank account holders in Indonesia by way of comparison to assess their individual commercial potential. In order to determine their overall market potential, it would also need to consider other factors, such as their total numbers; their geographical concentration in the overseas market; and possibly their income distribution relative to other residents in the overseas market.

145
Chapter 5Special Topics Concerning Access to Finance
Anti-money laundering and anti-terrorism regulations are another barrier to the further development of international remittance systems, because migrant workers often have diffi culty meeting Know Your Customer (KYC) regulations. The World Bank (2008b) advocates a well-targeted fi nancial regulatory framework in Malaysia and Indonesia that ensures remittances are not used for illegal purposes, while at the same time better meeting the needs of migrant workers. As a practical fi rst step, the government could consider negotiating exemptions in requirements that migrant workers making small transfers present a full range of documentation, or at least ensuring that these requirements are reasonably easily for the majority of migrant workers to fulfi l. It is possible that such measures could be piloted in countries that are not considered high-risk conduits for terrorist fi nancing, such as Singapore, Hong Kong and Japan.
Mobile Banking: The policy issues in this area mainly concern the management of prudential risk in a fashion that nonetheless facilitates the development of low-cost ways to deliver services that lower-end consumers want. Very recently, Bank Indonesia has made some signifi cant progress in the reform of regulation in this issue, although much still remains to be done. For example, potential non-bank fi nancial service providers are still subject to special licensing and regulatory regimes that are often unnecessarily burdensome and restrict new entrants into the sector. Also, to deliver mobile banking services cheaply, the economies of scale off ered by a network of retail agents is probably vital in order to get unit costs down to a commercially viable level. This may entail allowing banks the discretion to out-source services to non-bank third parties, while holding the banks responsible for agent activities. For mobile banking to be able to serve the needs of the ‘unbanked’, there are also signifi cant KYC issues to be addressed. For example, it may be necessary to simplify KYC requirements for low-risk, low-value accounts and transactions. In particular, it may be necessary to permit the remote opening of bank accounts in isolated areas and to allow non-bank agents to facilitate the opening of new accounts. Policy recommendations in all these areas are outlined in the following Chapter.

Improving Access to Financial Services in Indonesia146
Chapter 5Special Topics Concerning Access to Finance
147
Chapter 6
Policy Recommendations for Improved Access to Financial Services
This Chapter pulls together key policy recommendations from the diverse material of the preceding chapters of this report, off ering practical suggestions for improving access to fi nancial services by low income households.
6.1 General Strategic MattersThe Government of Indonesia recognises that lack of access to fi nancial services by a signifi cant proportion of the population, particularly low income earners and most especially those in rural areas, and by MSMEs, is a constraint to development and has made improving access a matter of high priority. The evidence of this report indicates that it is important for policymakers to maintain certain broad, strategic objectives when addressing issues of access to fi nancial services. Among the most important of these strategic objectives is the promotion of economic growth in a manner that generates increases in average and median incomes. It is noteworthy that these increases are the single biggest determinant of access to fi nancial services.
Likewise, it is vital to maintain the stability of the fi nancial sector in order to ensure confi dence in the fi nancial system on the part of the population at large and all signifi cant stake holders . Policies aimed at increasing access to fi nancial services are likely to be much more eff ective if based on the foundation of policies aimed at sustainable growth and fi nancial sector stability.
Policy should be focused on facilitating broader access to a full range of fi nancial services for lower income users as opposed to merely facilitating access to credit. Access to credit is important for the poor, but access to savings facilities are much higher priority. A signifi cant proportion of lower income earners fi nd existing fi nancial products to be inappropriate to their needs. Designing and pilot testing appropriate products through partnerships could facilitate access to services provided by the formal fi nancial sector for lower

Improving Access to Financial Services in Indonesia148
Chapter 6Policy Recommendations for Improved Access to Financial Services
income earners, potentially benefi ting the fi nancial sector through improved profi ts derived from opening up new markets in addition to benefi ting the clients themselves. However, wider access to fi nancial services by lower-income Indonesians needs both public and private sector interventions as well as some innovative public-private partnerships.
In terms of the proportion of assets that they control, commercial banks dominate Indonesia’s fi nancial system. However, survey results indicate that they currently service a relatively small proportion of the population. Most Indonesians still rely on the informal sector for fi nancial services. Expanding the formal sector’s reach should be a priority: the key to achieving this will be to reduce unit costs to the point where relatively expensive formal-sector services are available at aff ordable prices to low-income Indonesians, who often live in remote, costly locations.
Regulatory reform, detailed below, off ers a low cost solution to addressing many of these issues. In refi ning this strategy, commercial banks (especially those with a wide regional reach) have an important role to play because they will be the aggressive entrants into new, profi table markets. Also, they are most likely to introduce new technologies (like mobile banking) and they will put competitive pressure on other providers to improve their services and reduce prices. However, they are unlikely to be the primary means of addressing the short- to medium-term issues of better access to fi nance, because the commercial banks do not reach deeply enough into poorer, more isolated parts of Indonesia. As mentioned, the informal sector currently supplies most Indonesian lower-end households with their fi nancial service needs.
This report fi nds that improved access to fi nancial services by lower-end households would be better served by working on the legal and regulatory framework for BPRs, MFIs, cooperatives and pawnshops. Reforms to the legal and regulatory framework could also facilitate the development of mobile banking, which holds considerable promise for reducing costs and extending reach for all service providers. In considering targeted interventions, survey results indicate that the target for improved access to fi nancial services should be the rural, uneducated poor who live off Java. The need to prioritise this segment is indicated by the fact that off Java residents are more than twice as likely to have neither a bank account nor a loan, than are on Java residents.
6.2 Regulatory IssuesIn terms of reform to the regulatory environment, the most signifi cant gains that can be achieved without recourse to sizeable amounts of public fi nancing are outlined in the following sections, by major topic area.
6.2.1 Mobile Banking
This area holds great promise for extending access because of the low unit costs involved. In addition, mobile banking can build upon the existing widespread use of mobile phones, even among the poor. However, a necessary condition for success is a regulatory framework that permits commercial agencies to operate on a large scale. In terms of willingness to implement such reforms, Indonesia is relatively advanced. Very recently, signifi cant reforms have been made to facilitate an expansion of this sector.
However, there is still room for major improvements. For instance, at present, non-bank service providers can issue e-money, but only for payment purposes. If such service providers want to off er person-to-person services, they need a remittance license. The eligibility requirements for such a licence currently act as a major barrier to entry. BI needs to defi ne eligibility in simpler ways. Also, the regulatory framework should allow e-money providers to use networks of agents to off er and maintain their products. Furthermore, KYC

149
Chapter 6Policy Recommendations for Improved Access to Financial Services
regulations should be made less restrictive to allow third-party agents to sign-up new customers or even to allow remote applications, at least for accounts below a relatively low threshold, rather than, as at present, requiring customers to present at the offi ces of the fi nancial institutions involved.
6.2.2 Commercial Banks
For the time being, the possibility of the expansion of access to services off ered by commercial banks through the expansion of outlets is limited, owing to current policies that emphasize the consolidation of numbers and larger size of institutions. However, commercial banks can play a vital role in the expansion and access through other means, most notably through mobile banking, as has already been mentioned. However, regulatory reform would assist in other areas, as well. For example, monthly administration fees are often a major issue for small accounts holders. It appears that the absence of an offi cial policy on dormant accounts contributes to these high monthly administrative fees. Policies that make it easier for banks to close-out inactive, non-zero accounts could be introduced. Basic banking services, or ‘no frills accounts’, with low administration fees could be further encouraged, building on the initiatives of Bank Indonesia and some commercial banks that have already begun off ering such services.
Overall, they have been a few slightly regressive steps in terms of regulatory reform. In particular, recent regulations concerning the relocation of bank branches and ATMs appears to be unnecessarily restrictive. Rather than requiring approval before a change of location even within a very small geographical area, general descriptions of location should suffi ce, thereby giving banks more fl exibility to adapt quickly to local market conditions. It would also be useful to ease offi cial regulations on the establishment of new branches. While in practice Bank Indonesia is currently interpreting existing regulations in a very liberal manner, it would be useful to reform regulations so that they refl ect this actual practice.
6.2.3 BPRs
Through regulatory reform, it may be possible to signifi cantly expand the role played by BPRs facilitating access to fi nancial services, particularly in the case of the all-important small BPRs that operate in remote locations. Bank Indonesia seems to be re-thinking its policies in this area, possibly moving towards stratifying its regulation of BPRs according to size of the BPR. This would be a welcome move away from the current one-size-fi ts-all-BPRs approach to regulation.
Other useful regulatory changes could involve the establishment of a lower tier of minimum start-up capital for small BPRs in remote locations. Foreign investors and NGOs could be allowed to participate in larger BPRs that are looking for capital. For small BPRs, especially those in locations without adequate communications services, some reporting requirements that may be costly and ineff ective could be eased. Furthermore, written disclosure requirements could be waived in areas of low fi nancial literacy, to be replaced by oral briefi ngs of new (or potential) customers, including in the local language, if necessary. Moreover, the possibility of easing KYC regulations for opening small accounts and waiving the requirement of taxpayer numbers for small loans would make formal sector accessible for larger numbers of poor and MSMEs. Finally, for the sake of regulatory transparency, the current tight branching requirements could be brought into line with the spirit of BI’s liberal approach to implementation.
At present, BI’s capacity to supervise BPRs appears to be over-stretched, despite strong eff orts to strengthen the function. BI might consider seeking additional, temporary assistance by contracting fi rms that specialize in micro-fi nance, similar to the manner in which it has out-sourced supervision of the former BKDs to BRI.

Improving Access to Financial Services in Indonesia150
Chapter 6Policy Recommendations for Improved Access to Financial Services
6.2.4 LPS
The Indonesian Deposit Insurance Corporation, LPS, has an important role to play in providing security for depositors. This is so because bank deposits are the single most important fi nancial service and because ‘security’ is bank clients’ main concern and therefore one of the main cornerstones in building confi dence in the banking system. Since it was formed in 2005, LPS has adequately demonstrated its capacity to reimburse insured deposits and close BPRs, without loss of public confi dence in Indonesia’s fi nancial system. At this juncture, the main policy requirement is a continuation of adequate fi nancing, so that it is able to continue to play an eff ective role. This is particularly necessary in the event that LPS gets involved in the larger, more expensive commercial bank system. Also, it would be useful to fi nd better ways of informing depositors of the limits to their coverage, especially in regions of limited fi nancial literacy.
6.2.5 Cooperatives
There are a large number of issues related to cooperatives, the most important of which appear to be prudential. These need to be addressed on a timely basis as a defensive measure against memberships losing their existing access to fi nancial services. Concurrently, there needs to be an upgrading of the Ministry’s regulatory and supervisory capacity. If necessary, this could include temporary outsourcing of the function to fi rms specializing in micro-fi nance. In due course, the government could also consider moving regulation and supervision of deposit-taking cooperatives to a consolidated supervisory authority (OJK) and providing the members with deposit insurance under LPS.
6.2.6 Pawnshops
The only legal pawnshop in Indonesia is currently a profi table, state-owned monopoly. This area should be offi cially opened up to the private participation. In parallel, the Ministry of Finance would need to upgrade its capacity to supervise a liberalised pawnshop sector.
6.2.7 Other Financial Institutions
The most productive way forward for this diverse group would be a restoration of momentum to the drafting of a new Micro-Finance Law. It is also vital to encourage public debate during the process. It is important that the new Law emphasises facilitation and access. It is also important that regulation be formulated to encourage the extension of the reach of such institutions beyond their traditional base of Java and Bali. Implementation of the recent joint decree regarding micro-fi nance institutions would ensure continued access to fi nancial services on the part of those who need it most, namely, the rural poor.
6.3 MSMEsIndonesia has a long history of providing support to MSMEs. However, policy needs to move towards more eff ective delivery vehicles, including wider access to fi nancing. The process has already begun, with the Indonesian government initiating a review of its KUR credit guarantee program. Depending upon the results of the KUR review, the Indonesian government might consider independent, external assessments of its remaining subsidized credit schemes. These could be conducted under the auspices of the Coordinating
151
Chapter 6Policy Recommendations for Improved Access to Financial Services
Ministry of Economic Aff airs or the Ministry of Finance and might include input from local universities, think tanks, the private sector and other stakeholders.
6.4 Overseas Workers and RemittancesThe Government could help to facilitate migrant workers’ access to fi nancial services by taking up certain key issues in negotiations of bilateral (or regional) trade in services agreements and Memoranda of Understanding on Migrant Workers. The objective would be to better balance the interests of the workers themselves with the interests of employers and recruitment agencies. Details could focus such as acceptable forms of identifi cation that do not constrain worker access to formal sector services and exemptions from formal identifi cation requirements for small transfers. Initially, eff orts could be make and to ensure the implementation of such measures in countries that are low-risk terrorist threats, for example Hong Kong and Taiwan.
To provide better access to loans during the pre-departure phase, banks could make greater use of co-signers, probably family members who remain resident in Indonesia. Indonesia’s development partners with special interests in this area might consider acting as the co-signer for pilot projects to demonstrate the commercial attractiveness of this market in some form of public-private partnership. During the pre-departure phase, fi nancial literacy training may well be helpful, as would fi nancial counselling services in the host country. Ultimately, these services should be provided by the Indonesian government and its agencies. However, donors and NGOs may have to take the initiative, at least initially. At the village level, it may be possible to recruit returned workers to assist with the pre-departure training of their less experienced peers.
6.5 Matters of More Limited ConcernBased upon the evidence of this report, note should be taken of several issues that are currently of less concern for policymakers. This is important because many of these areas are considered problematic in other countries, or because they are generally believed to be problematic in the Indonesian context. These include the following points:
• The number of banks has fallen markedly in the past decade. Despite this, the reach of fi nancial services has still increased signifi cantly due to ATMs, the opening of new branches and the expansion of lower-end fi nancial institutions;
• Physical access is not a generalized problem: The exception is rural off -Java, especially if travel entails water transport. However, in most of Indonesia, the availability of fi nancial services is actually better than access to key public services such as health and education services;
• Credit is not, as is sometimes assumed, the most sought-after product by low income households: rather, a savings account is the single most important fi nancial service sought by Indonesians, with credit from banks ranking well down the list. Other forms of credit are widely dispersed among service providers;
• Lack of collateral does not appear to be a very signifi cant constraint in terms of access to credit: lack of collateral is problematic for some banks, but banks are not the main source of credit. Some banks, like many MFIs, already lend against income rather than against collateral;
Gender is not a signifi cant constraint in terms of access to fi nancial services in almost all areas covered by the survey of Chapter 3.
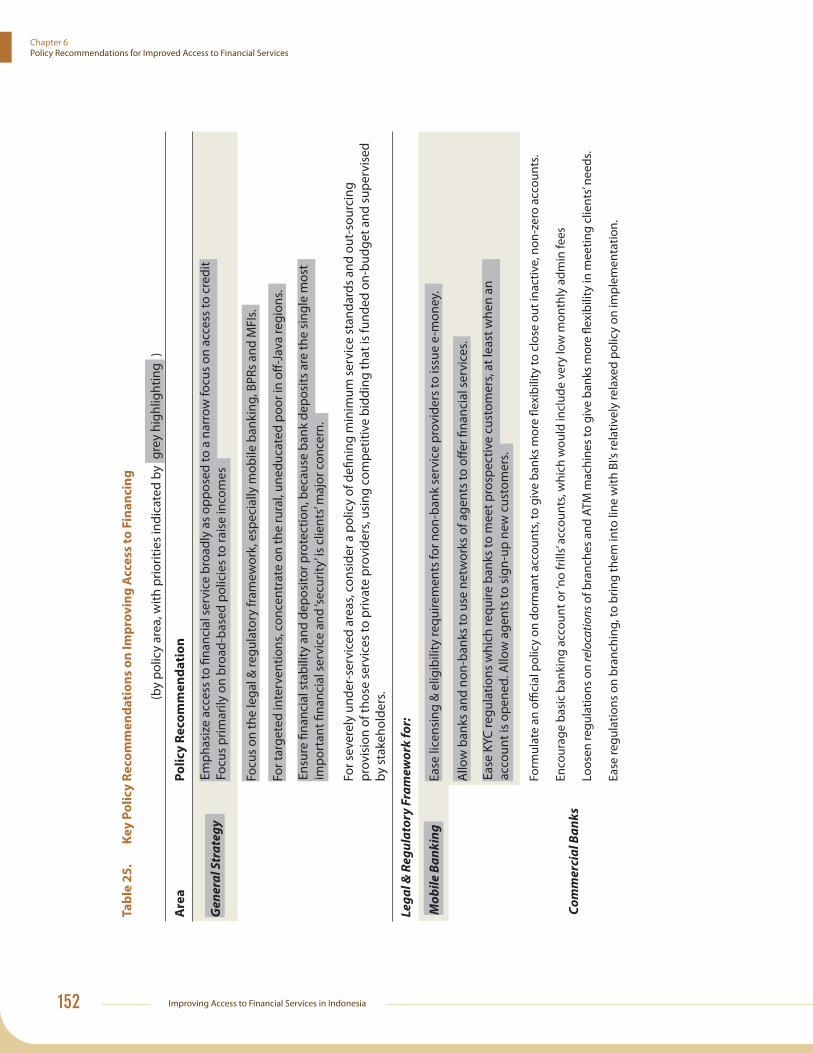
Improving Access to Financial Services in Indonesia152
Chapter 6Policy Recommendations for Improved Access to Financial Services
Ta
ble
25
. K
ey
Po
lic
y R
eco
mm
en
da
tio
ns
on
Im
pro
vin
g A
cce
ss t
o F
ina
nc
ing
(by
polic
y ar
ea, w
ith p
riorit
ies
indi
cate
d by
gre
y hi
ghlig
htin
g )
Are
aP
oli
cy
Re
com
me
nd
ati
on
Ge
ne
ral
Str
ate
gy
Emph
asiz
e ac
cess
to fi
nanc
ial s
ervi
ce b
road
ly a
s op
pose
d to
a n
arro
w fo
cus
on a
cces
s to
cre
dit
Focu
s pr
imar
ily o
n br
oad-
base
d po
licie
s to
rais
e in
com
es
Focu
s on
the
lega
l & re
gula
tory
fram
ewor
k, e
spec
ially
mob
ile b
anki
ng, B
PRs
and
MFI
s.
For t
arge
ted
inte
rven
tions
, con
cent
rate
on
the
rura
l, un
educ
ated
poo
r in
off -J
ava
regi
ons.
Ensu
re fi
nanc
ial s
tabi
lity
and
depo
sito
r pro
tect
ion,
bec
ause
ban
k de
posi
ts a
re th
e si
ngle
mos
t im
port
ant fi
nan
cial
ser
vice
and
‘sec
urity
’ is c
lient
s’ m
ajor
con
cern
.
For s
ever
ely
unde
r-se
rvic
ed a
reas
, con
side
r a p
olic
y of
defi
nin
g m
inim
um s
ervi
ce s
tand
ards
and
out
-sou
rcin
g pr
ovis
ion
of th
ose
serv
ices
to p
rivat
e pr
ovid
ers,
usin
g co
mpe
titiv
e bi
ddin
g th
at is
fund
ed o
n-bu
dget
and
sup
ervi
sed
by s
take
hold
ers.
Le
ga
l &
Re
gu
lato
ry F
ram
ew
ork
fo
r:
Mo
bil
e B
an
kin
g
Ease
lice
nsin
g &
elig
ibili
ty re
quire
men
ts fo
r non
-ban
k se
rvic
e pr
ovid
ers
to is
sue
e-m
oney
.
Allo
w b
anks
and
non
-ban
ks to
use
net
wor
ks o
f age
nts
to o
ff er fi
nan
cial
ser
vice
s.
Ease
KYC
regu
latio
ns w
hich
requ
ire b
anks
to m
eet p
rosp
ectiv
e cu
stom
ers,
at le
ast w
hen
an
acco
unt i
s op
ened
. Allo
w a
gent
s to
sig
n-up
new
cus
tom
ers.
Co
mm
erc
ial
Ba
nk
s
Form
ulat
e an
offi
cial
pol
icy
on d
orm
ant a
ccou
nts,
to g
ive
bank
s m
ore
fl exi
bilit
y to
clo
se o
ut in
activ
e, n
on-z
ero
acco
unts
.
Enco
urag
e ba
sic
bank
ing
acco
unt o
r ‘no
frill
s’ ac
coun
ts, w
hich
wou
ld in
clud
e ve
ry lo
w m
onth
ly a
dmin
fees
Loos
en re
gula
tions
on
relo
catio
ns o
f bra
nche
s an
d AT
M m
achi
nes
to g
ive
bank
s m
ore
fl exi
bilit
y in
mee
ting
clie
nts’
need
s.
Ease
regu
latio
ns o
n br
anch
ing,
to b
ring
them
into
line
with
BI’s
rela
tivel
y re
laxe
d po
licy
on im
plem
enta
tion.

153
Chapter 6Policy Recommendations for Improved Access to Financial Services
Ke
y P
oli
cy
Re
com
me
nd
ati
on
s o
n I
mp
rov
ing
Acc
ess
to
Fin
an
cin
g (
con
tin
ue
d)
(by
polic
y ar
ea, w
ith p
riorit
ies
indi
cate
d by
gre
y hi
ghlig
htin
g )
Are
aP
oli
cy
Re
com
me
nd
ati
on
BP
Rs
Impl
emen
t the
pro
pose
d ‘ti
erin
g’ s
yste
m fo
r reg
ulat
ion,
with
redu
ced
repo
rtin
g an
d m
anag
emen
t req
uire
men
ts,
espe
cial
ly fo
r sm
all B
PRs
in re
mot
e lo
catio
ns
Allo
w p
artia
l ow
ners
hip
by fo
reig
n in
vest
ors
and
by N
GO
s in
poo
r rem
ote
regi
ons.
Cons
ider
low
er m
inim
um s
tart
-up
capi
tal r
equi
rem
ents
for s
mal
l BPR
s in
rem
ote
loca
tions
.
Ease
repo
rtin
g re
quire
men
ts fo
r sm
all B
PRs
in re
gion
s w
ith p
oor I
T in
fras
truc
ture
.
Ease
writ
ten
disc
losu
re re
quire
men
ts in
regi
ons
of lo
w fi
nanc
ial l
itera
cy, r
epla
cing
them
with
ora
l brie
fi ngs
to n
ew
acco
unt h
olde
rs in
the
loca
l lan
guag
e.
Ease
KYC
regu
latio
ns, e
spec
ially
as
they
app
ly to
pot
entia
l clie
nts’
taxp
ayer
num
bers
.
Ease
offi
cial
bra
nchi
ng re
quire
men
ts, t
o br
ing
them
into
line
with
the
curr
ent s
pirit
of B
I’s im
plem
enta
tion
polic
y.
LP
SEn
sure
that
ade
quat
e fi n
anci
ng is
ava
ilabl
e fo
r pro
mpt
reso
lutio
n of
BPR
/ban
k fa
ilure
s.
Find
bet
ter w
ays
to in
form
dep
osito
rs o
f lim
its to
LPS
’s co
vera
ge, f
or e
xam
ple,
a p
ublic
edu
catio
n pr
ogra
m.
---O
the
r M
FIs
Rest
ore
mom
entu
m to
the
draf
ting
of a
Mic
ro-F
inan
ce L
aw, w
hich
nee
ds to
em
phas
ize
faci
litat
ion
and
acce
ss. ,
In th
e m
eant
ime,
impl
emen
t the
join
t dec
ree
on m
icro
-fi na
nce
to e
nsur
e co
ntin
ued
acce
ss to
ser
vice
s.
---P
aw
nsh
op
sO
ffi ci
ally
ope
n th
is s
ub-s
ecto
r to
priv
ate
owne
rshi
p.
---C
oo
pe
rati
ve
sAd
dres
s is
sues
of p
rude
ntia
l reg
ulat
ion
and
inst
itutio
nal w
eakn
esse
s to
pro
tect
mem
bers
’ exi
stin
g ac
cess
to fi
nanc
ing.
Up-
grad
e su
perv
isor
y ca
paci
ty. I
n th
e sh
ort-
term
, the
func
tion
coul
d be
out
-sou
rced
to fi
rms
spec
ializ
ing
in m
icro
-fi na
nce.

Improving Access to Financial Services in Indonesia154
Chapter 6Policy Recommendations for Improved Access to Financial Services
Ke
y P
oli
cy
Re
com
me
nd
ati
on
s o
n I
mp
rov
ing
Acc
ess
to
Fin
an
cin
g (
con
tin
ue
d)
(by
polic
y ar
ea, w
ith p
riorit
ies
indi
cate
d by
gre
y hi
ghlig
htin
g )
Are
aP
oli
cy
Re
com
me
nd
ati
on
Follo
w th
e re
view
of K
UR
by a
n in
depe
nden
t ass
essm
ent o
f rem
aini
ng G
oI s
ubsi
dize
d cr
edit
prog
ram
s.
Ease
pol
icie
s as
rega
rds
iden
tifi c
atio
n re
quire
men
ts fo
r bor
row
ing
from
ban
ks &
BPR
s, pa
rtic
ular
ly a
s co
ncer
ns
taxp
ayer
num
bers
.
Ov
ers
ea
s W
ork
ers
&
Re
mit
tan
ces
Redu
ce o
ther
cou
ntrie
s’ im
pedi
men
ts to
rem
ittan
ces
durin
g th
e ne
gotia
tion
of M
emor
anda
of U
nder
stan
ding
on
Gue
st W
orke
rs o
r bila
tera
l (or
regi
onal
) tra
de a
gree
men
ts o
n se
rvic
es
In th
ese
foru
m, s
eek
bett
er b
alan
ce b
etw
een
the
inte
rest
s of
the
wor
kers
them
selv
es w
ith th
ose
of re
crui
ters
and
s em
ploy
men
t age
ncie
s. D
etai
ls c
ould
focu
s on
issu
es li
ke: a
ccep
tabl
e w
orke
r ID
; lim
its o
n KY
C re
port
ing;
and
ID
exem
ptio
ns fo
r sm
all r
emitt
ance
s.
Inve
stig
ate
poss
ibili
ties
for g
reat
er u
se o
f co-
sign
ers
of p
re-d
epar
ture
loan
s fo
r mig
rant
wor
kers
. Ini
tiate
pilo
t pro
ject
s in
par
tner
ship
with
ban
ks a
nd (a
s ne
cess
ary)
dev
elop
men
t par
tner
s
Pre-
depa
rtur
e tr
aini
ng n
eeds
to in
clud
e br
iefi n
gs o
n ac
cess
to fi
nanc
ing;
NG
Os
in p
opul
ar d
estin
atio
n co
untr
ies
mig
ht c
onsi
der o
ff erin
g co
unse
lling
ser
vice
s to
mig
rant
wor
kers
; ret
urne
es in
hom
e vi
llage
s m
ight
be
anot
her l
ow-
cost
sou
rce
of a
ssis
tanc
e.

155
Chapter 6Policy Recommendations for Improved Access to Financial Services
Annexes
Annex A: Access vs. Use of fi nancial services –Some Defi nitions, Distinctions, and Concepts
Annex B: Some Technical Details of the Survey
Annex C: Predictors of Financial Participation; Linear Probability Regressions for Savings of Any Kind
Annex D: Predictors of Financial Participation; Linear Probability Regressions for Formal Savings
Annex E: Predictors of Financial Participation; Linear Probability Regressions for Informal Savings
Annex F: Predictors of Financial Participation; Linear Probability Regressions for Loans from Any Source
Annex G: Predictors of Financial Participation; Linear Probability Regressions for Formal Loans
Annex H: Predictors of Financial Participation; Linear Probability Regressions for Semi-Formal Loans
Annex I: Predictors of Financial Participation; Linear Probability Regressions for Informal Loans
Annex J: Predictors of Financial Participation; Linear Probability Regressions for All Types of Insurance
Annex K: Predictors of Financial Participation; Linear Probability Regressions for Financial Literacy
Annex L: Summary of Regulatory Framework for Banks, with Attention to Issues of Access
Annex M: Summary of Regulatory Framework for Cooperatives, with Attention to Issues of Access
Annex N: Summary of Regulatory Framework for Finance Companies, with Attention to Issues of Access
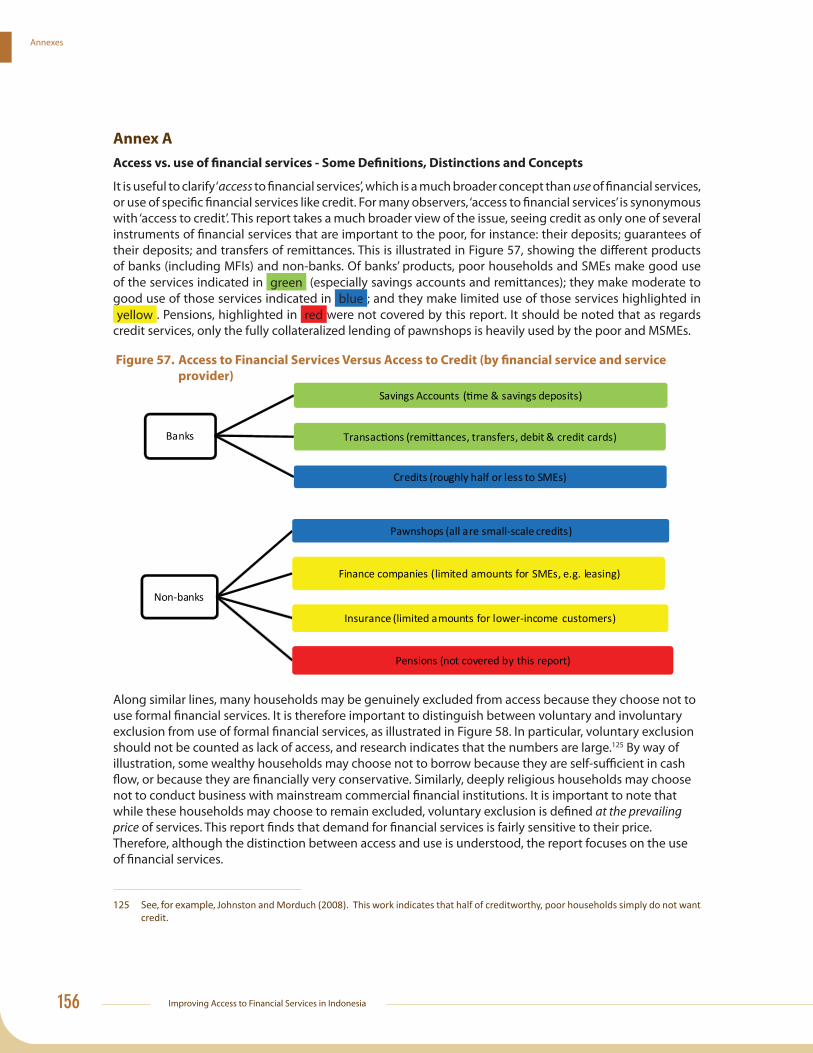
Improving Access to Financial Services in Indonesia156
Annexes
Annex A
Access vs. use of fi nancial services - Some Defi nitions, Distinctions and Concepts
It is useful to clarify ‘access to fi nancial services’, which is a much broader concept than use of fi nancial services, or use of specifi c fi nancial services like credit. For many observers, ‘access to fi nancial services’ is synonymous with ‘access to credit’. This report takes a much broader view of the issue, seeing credit as only one of several instruments of fi nancial services that are important to the poor, for instance: their deposits; guarantees of their deposits; and transfers of remittances. This is illustrated in Figure 57, showing the diff erent products of banks (including MFIs) and non-banks. Of banks’ products, poor households and SMEs make good use of the services indicated in green (especially savings accounts and remittances); they make moderate to good use of those services indicated in blue ; and they make limited use of those services highlighted in yellow . Pensions, highlighted in red were not covered by this report. It should be noted that as regards
credit services, only the fully collateralized lending of pawnshops is heavily used by the poor and MSMEs.
Figure 57. Access to Financial Services Versus Access to Credit (by fi nancial service and service
provider)
Banks
Credits (roughly half or less to SMEs)
Non-banks
Pawnshops (all are small-scale credits)
Finance companies (limited amounts for SMEs, e.g. leasing)
Insurance (limited amounts for lower-income customers)
Pensions (not covered by this report)
Along similar lines, many households may be genuinely excluded from access because they choose not to use formal fi nancial services. It is therefore important to distinguish between voluntary and involuntary exclusion from use of formal fi nancial services, as illustrated in Figure 58. In particular, voluntary exclusion should not be counted as lack of access, and research indicates that the numbers are large.125 By way of illustration, some wealthy households may choose not to borrow because they are self-suffi cient in cash fl ow, or because they are fi nancially very conservative. Similarly, deeply religious households may choose not to conduct business with mainstream commercial fi nancial institutions. It is important to note that while these households may choose to remain excluded, voluntary exclusion is defi ned at the prevailing price of services. This report fi nds that demand for fi nancial services is fairly sensitive to their price. Therefore, although the distinction between access and use is understood, the report focuses on the use of fi nancial services.
125 See, for example, Johnston and Morduch (2008). This work indicates that half of creditworthy, poor households simply do not want credit.

157
Annexes
Figure 58. Diff erence Between Access to and Usage of Services
Population
Using Financial services
Not Using Financial Services
Voluntarily Excluded
price or income constraint. Assume
will be rejected
No need or N o Awareness
Involuntarily Excluded
Due to high risk/bad c redit
Due to discrimination
Due to other product or c lient
features
Financially Excluded
Source: Claessens (2005)
Financially Included
Another important distinction regarding access concerns the diff erence between: ‘add-on’ services for existing clients; and ‘adding-on new clients’, by reaching more deeply into the population base, possibly via new channels for delivery of services. This report recognizes the commercial importance of the former, especially to traditional fi nancial intermediaries, but is more concerned with the latter, essentially because it is an instrument for poverty alleviation. Credit and debit card and InterNet banking are examples of add-on services that are essentially only relevant to existing, higher-end fi nancial service providers. Mobile banking is an example of a new delivery channel with considerable promise to extend services to new, lower-end customers.
Improving Access to Financial Services in Indonesia158
Annexes
Annex B:Survey methodology
Survey Unit of Observation
The Indonesian Access to Finance Survey (A2F) is a hybrid household and individual level survey that blends individual level socio-economic characteristics with household level fi nancial statistics. Whereas the survey recorded socio-economic data (such as, education level and employment status) for all household members above the age of 15, questions about fi nances were recorded for each household as a whole. The interviewee in the household was the person with fi nancial decision-making power, referred to the ‘head of household’; 59% of the time, this person was also the fi gurative head of the household.126
Although individual level data are arguably more reliable and permit analysis of within-household heterogeneity, several factors led to the choice of the above survey design. First, individual level surveys are time-consuming and costly. By focusing the A2F survey only on the head of household, the survey was expanded substantially in scope and scale. Second, the overarching theme of the survey is access to fi nance, which is generally a household-level decision.
Recent research in household survey design seems to justify a head of household survey. Specifi cally, Cull and Scott (2009) investigate whether asking fi nancial access questions only to the head of household leads to systematic inaccuracies as compared to obtaining this information individually from all household members.127 The concern is that not all individuals’ use of fi nancial services is known to the head of the household. Their preliminary results show that for basic fi nancial access questions, there were no signifi cant diff erences between answers obtained from the sum of individuals within the household and answers obtained only from the household head, although the randomly selected household member did provide less complete data.
Sampling Methodology of the Indonesian Survey
The sample selection methodology was designed to ensure national representation. Multi-stage random sampling was employed with population-weighted selection occurring fi rst at the province level, next at the sub-province (Kabupaten/Kota) level, and fi nally at the village (RW) level. Overall, 4 provinces on Java and 6 provinces off Java were selected, namely Banten, West Java, Central Java, East Java (all provinces on Java); and Aceh, Jambi, West Kalimantan, North Sulawesi, Maluku, and Nusa Tenggara Barat (off Java provinces).
On Java, excluding Jakarta and Yogyakarta 4 provinces were selected: 1) Banten, 2) West Java, 3) Central Java, and 4). East Java. Out of the 4 selected provinces, 16 population-weighted sub-provinces were chosen at random. Within each of these 16 sub-provinces, 4 population-weighted villages (RW) were chosen at random, resulting in a total sample of 64 villages. The selection was stratifi ed by urban/rural, with the fi nal sample containing 34 urban villages and 30 rural villages.
Off Java, one population-weighted province was chosen within each 6 regions: 1) Northern part of Sumatra, 2) Southern part of Sumatra, 3) Bali-Nusa Tenggara, 4) Kalimantan, 5) Sulawesi, and 6) Maluku-Papua. Next, within each of these provinces, 2 population-weighted sub-provinces were chosen at random. Finally, within
126 The ‘fi gurative head’ is usually the eldest person in the family. Typically, Indonesian households are joint-family setups where parents live with their children and the children’s respective families. Under such cases, the fi gurative head would be the father, whereas the eldest son may be the fi nancial head of the household who is responsible for all fi nancial decision making.
127 In order to understand and quantify potential errors and biases, the authors conducted a methodological experiment in Ghana in 2007 where they randomly implemented individual and household head only data collection methods along with a third method using a randomly selected household member.
159
Annexes
each of these 12 sub-provinces, 4 population-weighted villages (RW) were chosen at random, resulting in a sample of 48 villages. The urban/rural stratifi cation resulted in a fi nal sample of 18 urban villages and 30 rural villages, owing to the overwhelming rural nature of off -Java villages.
Within each of the 112 villages in the survey, 30 households were randomly selected in each village for survey interviews, resulting in our fi nal sample of 3,360 survey household respondents (1,920 on Java and 1,440 off Java closely equal to 60:40 ratios).
Sampling Weights
The results from the Nationwide Access to Finance survey can be extrapolated to represent the whole population in Indonesia by weighting the result for each household with its probability of being selected out of the whole household population.
The sample weights are calculated separately for Java and Non-Java households since sample selection is stratifi ed this way. The probability of a household being selected is calculated as a function of the probability of the province being selected, the probability of the kabupaten/kotamadya (regency/municipality) being selected, the probability of the desa/RW (village) being selected, and the probability of the household being selected within the desa/RW.
Let p1 denote the probability of the province being selected out of all the provinces in Java and Non-Java, respectively. Let p2 denote the probability of the kabupaten/municipality being chosen out of all kabupaten/municipality within the province (with Java and off Java division). Let p3 denote the probability of the desa/RW being chosen out of all the desa/RW within the kabupaten/kotamadya (with Java and off Java division). Finally, let p4 denote the probability of the household being chosen out of all the households in the desa/RW (with Java and off Java division).
The sample weight for each household is then denoted by the expression:
1 / (p1*p2*p3*p4)
or, the inverse probability of selection. The interpretation of the sampling weight is that it characterizes the number of households in the entire population that are represented by this particular sample household.
Comparison of A2F with PODES and SUSENAS
This section presents some basic comparisons of survey characteristics between the A2F survey and two existing sources of fi nancial data in Indonesia, namely the PODES and SUSENAS, supply-side census and demand-side surveys, respectively, both conducted by the National Statistics Bureau (BPS).
Village Potential Statistics (PODES) is a nation-wide census of all villages in Indonesia and contains information on various socio-economic conditions at the village level.128 SUSENAS is a nationally representative socio-economic survey conducted annually by the BPS.
128 The PODES is conducted three times every ten years. The main topic of each of these three corresponds to the periodic censuses (population, year ended with 0; agriculture, year ended with 3; economic, year ended with 6).
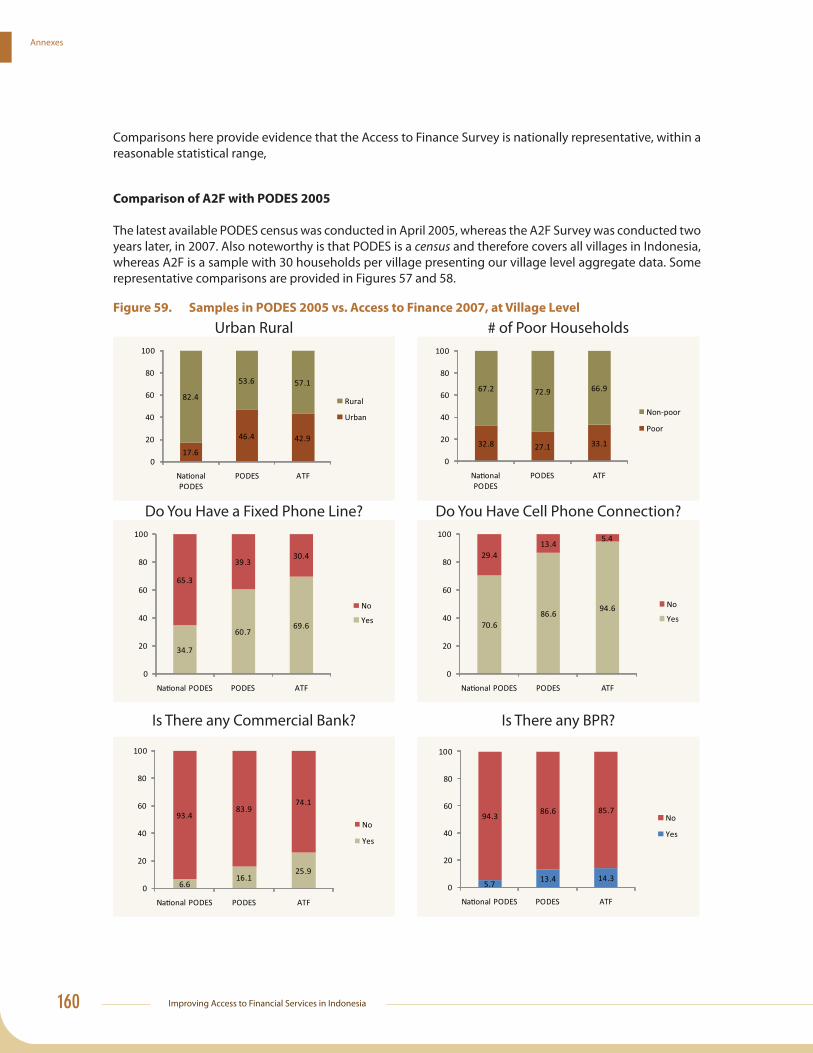
Improving Access to Financial Services in Indonesia160
Annexes
Comparisons here provide evidence that the Access to Finance Survey is nationally representative, within a reasonable statistical range,
Comparison of A2F with PODES 2005
The latest available PODES census was conducted in April 2005, whereas the A2F Survey was conducted two years later, in 2007. Also noteworthy is that PODES is a census and therefore covers all villages in Indonesia, whereas A2F is a sample with 30 households per village presenting our village level aggregate data. Some representative comparisons are provided in Figures 57 and 58.
Figure 59. Samples in PODES 2005 vs. Access to Finance 2007, at Village Level
Urban Rural # of Poor Households
Do You Have a Fixed Phone Line? Do You Have Cell Phone Connection?
Is There any Commercial Bank? Is There any BPR?
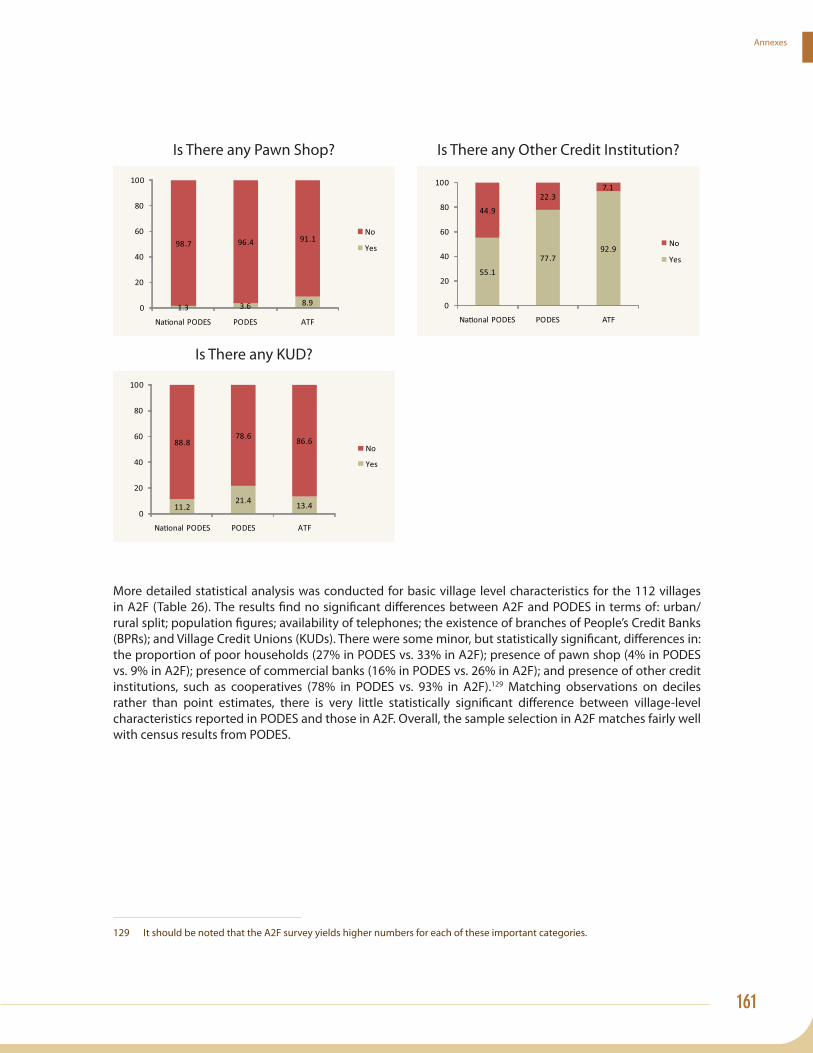
161
Annexes
Is There any Pawn Shop? Is There any Other Credit Institution?
Is There any KUD?
More detailed statistical analysis was conducted for basic village level characteristics for the 112 villages in A2F (Table 26). The results fi nd no signifi cant diff erences between A2F and PODES in terms of: urban/rural split; population fi gures; availability of telephones; the existence of branches of People’s Credit Banks (BPRs); and Village Credit Unions (KUDs). There were some minor, but statistically signifi cant, diff erences in: the proportion of poor households (27% in PODES vs. 33% in A2F); presence of pawn shop (4% in PODES vs. 9% in A2F); presence of commercial banks (16% in PODES vs. 26% in A2F); and presence of other credit institutions, such as cooperatives (78% in PODES vs. 93% in A2F).129 Matching observations on deciles rather than point estimates, there is very little statistically signifi cant diff erence between village-level characteristics reported in PODES and those in A2F. Overall, the sample selection in A2F matches fairly well with census results from PODES.
129 It should be noted that the A2F survey yields higher numbers for each of these important categories.

Improving Access to Financial Services in Indonesia162
Annexes
Table 26. Statistical Comparison of Village-Level Variables in the A2F Survey and PODES
Variable Survey Obs. Mean Std. Dev. Sig. Diff .
Urban Village?
PODES 112 0.46 0.50
A2F 112 0.43 0.50
Diff 0.04
Populati on Size
PODES 112 5,824 4,854
A2F 112 6,049 5,200
Diff (225)
Number of Poor Households
PODES 112 390.80 452.63
A2F 108 542.43 468.06
Diff -151.63 *
Village has fi xed phone line?
PODES 112 0.61 0.49
A2F 112 0.70 0.46
Diff -0.09
Village has cell phone coverage?
PODES 112 0.87 0.34
A2F 112 0.95 0.23
Diff -0.08 **
Village has commercial bank?
PODES 112 0.16 0.37
A2F 112 0.26 0.44
Diff -0.10 *
Village has BPR?
PODES 112 0.13 0.34
A2F 112 0.14 0.35
Diff -0.01
Village has pawn shop?
PODES 112 0.04 0.19
A2F 112 0.09 0.29
Diff -0.05 *
Village has another kind of credit insti tuti on?
PODES 112 0.78 0.42
A2F 112 0.93 0.26
Diff -0.15 ***
Village has a KUD?
PODES 112 0.21 0.41
A2F 112 0.13 0.34
Diff 0.08
Note: * = signifi cant at 10%; ** = signifi cant at 5%; ** * = signifi cant at 1%.
Comparison of A2F with SUSENAS 2007
SUSENAS is also a nationally representative 2007 survey, but with a much larger sample size of 227,202 households, and comparisons are possible between socio-economic characteristics between SUSENAS and A2F at the household level.
When comparing households in SUSENAS with A2F (Table 27), there were signifi cant—albeit small—diff erences in gender of household head, age composition, education levels, monthly non-food consumption, and usage of formal credit. These diff erences are not likely to indicate any systematic sample selection bias.
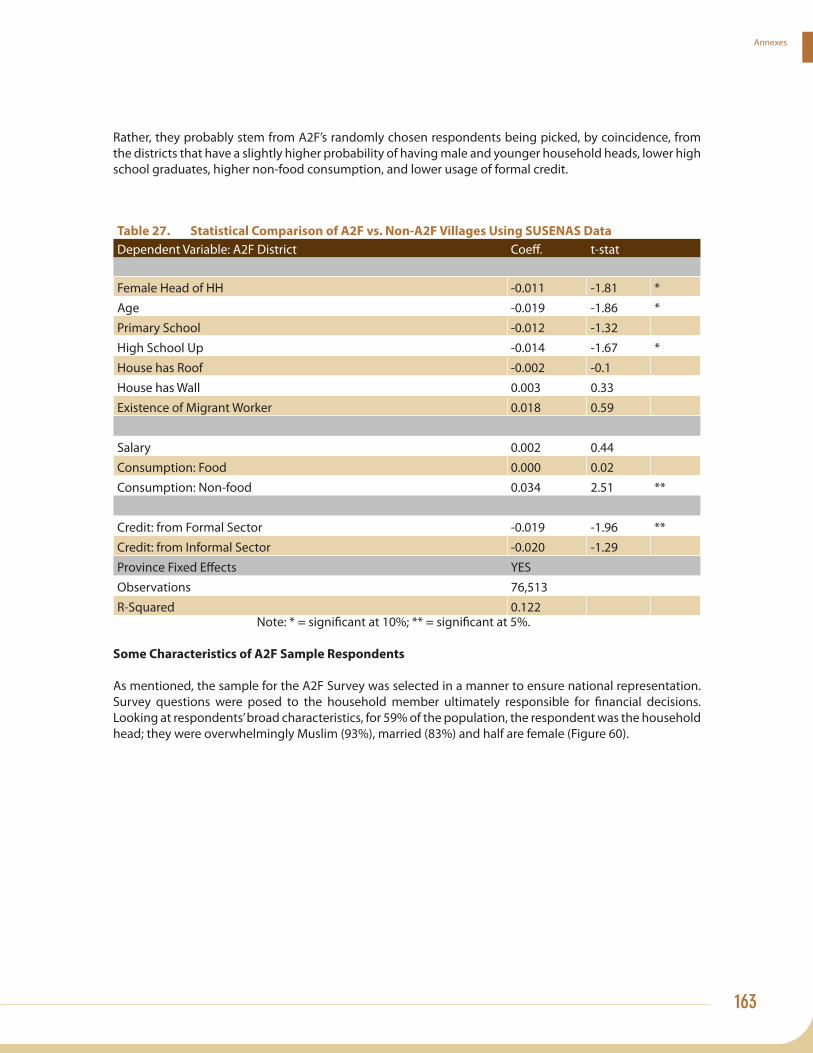
163
Annexes
Rather, they probably stem from A2F’s randomly chosen respondents being picked, by coincidence, from the districts that have a slightly higher probability of having male and younger household heads, lower high school graduates, higher non-food consumption, and lower usage of formal credit.
Table 27. Statistical Comparison of A2F vs. Non-A2F Villages Using SUSENAS Data
Dependent Variable: A2F District Coeff . t-stat
Female Head of HH -0.011 -1.81 *Age -0.019 -1.86 *Primary School -0.012 -1.32High School Up -0.014 -1.67 *House has Roof -0.002 -0.1House has Wall 0.003 0.33Existence of Migrant Worker 0.018 0.59
Salary 0.002 0.44Consumption: Food 0.000 0.02Consumption: Non-food 0.034 2.51 **
Credit: from Formal Sector -0.019 -1.96 **Credit: from Informal Sector -0.020 -1.29Province Fixed Eff ects YESObservations 76,513R-Squared 0.122
Note: * = signifi cant at 10%; ** = signifi cant at 5%.
Some Characteristics of A2F Sample Respondents
As mentioned, the sample for the A2F Survey was selected in a manner to ensure national representation. Survey questions were posed to the household member ultimately responsible for fi nancial decisions. Looking at respondents’ broad characteristics, for 59% of the population, the respondent was the household head; they were overwhelmingly Muslim (93%), married (83%) and half are female (Figure 60).

Improving Access to Financial Services in Indonesia164
Annexes
Figure 60. A2F Sample Characteristics
40.5%
59.5%
No Yes
Respondent is HH Head
49.5%50.5%
Female Male
Gend er of Respondent
Continuing with the broad picture, respondents indicate that the national population is 42% urban, with substantial variation on and off Java (Figure 60). On Java, almost 45% of the population is urban whereas, off Java only 22% is urban (Figure 61).
Figure 61. Urban/Rural Split
77.7%
22.3%
55.1%
44.9%
Off Java Respondents On Java Respondents
Rural RuralUrban
Urban
By regional distribution, most respondents are from Java; 35% of respondents from East Java, 33% from West Java, and 17% from Central Java. Off Java provinces account for the remaining 15% (Figure 62).

165
Annexes
Figure 62. Respondents, by Province
.0.7
1.8
3.1
2.8
1.8
35.0
17.3
33.3
1.6
2.8
N-MALUKU
N-SULWS
W-KALIMAN
W-NUSATENG
BANTEN
E-JAVA
C-JAVA
W-JAVA
JAMBI
ACEH
Respondents by Provinces (%)
By age, 90% of the sample respondents are above 25 years old, with the average respondent around 40 years of age, both on and off Java (Figure 63). Splitting the sample by gender, we fi nd that the median age for female respondents is much younger than male respondents, though both distributions look quite similar (also Figure 63).
Figure 63. Sample Characteristics, Age by Gender
Most respondents have attended at least primary school (89%), and only 10% have education beyond high school (Figure 64). These fi gures are very similar for on and off Java residents.

Improving Access to Financial Services in Indonesia166
Annexes
Figure 64. Respondents, by Employment & Education
8.9%
14.3%
45.6%
1.8%
25.6
3.8%
Government employee Private emplo yeeSelf employed Emplo yerFreelance/Casual labor HH worker not being paid
Respondents by Employment
19.6%
30.0%
17.1%
23.1%
10.2%
No formal education Primary school/ equivalentSecond ary school/e qui valent Senior High school/e qui valentUni versity
Respondents b y Education Level
A large proportion of respondents are employed (73%) and nearly half of them (47%) are self-employed. Around 49% are wage earners, and 36% work in agriculture and 22% in trade. As would be expected, there is substantial variation between and Java and off Java residents; whereas wage income dominates farm income on Java (51% vs. 33%), these fi gures are reversed off Java (34% vs. 56%). The large urban-rural divide is the likely explanation for more farm based activities off Java.
Figure 65. Respondent Wage Composition
At the national level, the wage composition of respondents presents a complicated pattern (Figure 65). Only 23% receive a regular monthly wage; 32% receive wages on a daily basis; another 8% are paid regularly, but at diff erent frequencies; and 28% have irregular compensation schedules.
Some 39% of households own and operate a household-level enterprise, whereas only 10% have a migrant worker abroad, which matches the percentage reported in PODES.130
Home ownership is quite high in the sample--around 3/4s of the population owns their residence, both
130 There are regions in the Indonesia where large proportions of the local population have migrant workers abroad, and the sample was not stratifi ed according to migrant worker status. This could explain why we fi nd such a low proportion of the national household population as having migrant workers abroad. The World Bank Indonesia offi ce recently conducted another household survey focusing on access to fi nance for migrant workers and their families in East Java, Nusa Tengga Barat and Nusa Tengga Timur in late 2008. This survey will likely provide a better picture of access to fi nance issues for migrant worker families. The data from this survey are currently being collected and analyzed.
167
Annexes
on and off Java. Most houses are permanent buildings made from brick-walls (75%), tile-roofs (86%), and tile-fl oors (54%), with the average number of rooms per home is 5. Brick houses are much more common on Java (79%) as compared to off Java (59%). Of these homes, 99% on Java have electricity and 87% have telephone service. By comparison, 87% of homes off Java have electricity and only 43% have telephone service. Access to tap water is low both on and off Java with an average of only 23% of homes having access to tap water as their main source of drinking water.
Yearly per capita consumption expenditure equals $1,068, and is expectedly higher on Java than off Java. This average national consumption expenditure fi gure is roughly half of Indonesia’s GDP per capita ($1,918).

Improving Access to Financial Services in Indonesia168
Annexes
Annex C: Predictors of Financial Participation131132
Linear Probability Regressions for Savings of Any Kind
Basic Province Fixed Village Fixed
Results Eff ects131 Eff ects132
Urban household 0.032 0.032 --
(0.023) (0.023) --
Household size -0.010 -0.001 0.002
(0.006) (0.006) (0.006)
Respondent is head of household -0.094 -0.070 -0.066
(0.030)*** (0.030)** (0.028)**
Male 0.019 0.008 0.009
(0.029) (0.028) (0.027)
Age 0.003 0.001 -0.002
(0.004) (0.003) (0.004)
Age squared 0.000 0.000 0.000
(0.000) (0.000) (0.000)
Married 0.010 0.006 0.004
(0.028) (0.028) (0.027)
Attended school 0.045 0.073 0.106
(0.040) (0.039)* (0.039)***
Muslim -0.072 -0.037 -0.018
(0.027)** (0.028) (0.032)
Log of consumption expenditure 0.100 0.103 0.091
(0.009)*** (0.009)*** (0.010)***
Employed 0.057 0.022 0.026
(0.026)** (0.026) (0.026)
Own house -0.011 -0.015 -0.001
131 Exploits within-province variability and controls for heterogeneity across provinces.
132 Restricts analysis to within-village variation and controls for variation across villages.

169
Annexes
(0.024) (0.023) (0.025)
Number of rooms 0.013 0.012 0.016
(0.005)** (0.006)** (0.006)***
Have electricity 0.142 0.107 0.086
(0.046)*** (0.045)** (0.053)
Have telephone 0.145 0.109 0.167
(0.029)*** (0.033)*** (0.035)***
Have tap water 0.064 0.057 0.057
(0.021)*** (0.021)*** (0.026)**
Own enterprise 0.055 0.061 0.068
(0.020)** (0.020)*** (0.020)***
Household has migrant worker abroad 0.103 0.125 0.080
(0.033)*** (0.034)*** (0.037)**
Financial literacy score 0.155 0.114 0.087
(0.038)*** (0.038)*** (0.038)**
Cognitive/Math skills score 0.224 0.196 0.188
(0.056)*** (0.056)*** (0.055)**
Risk averse -0.026 -0.015 -0.007
(0.020) (0.020) (0.019)
Time consistent preferences 0.013 0.012 0.008
(0.029) (0.028) (0.027)
Constant -1.480 -1.438 -1.253
(0.141)*** (0.147)*** (0.156)***
Observation 3360 3360 3360
R-squared 0.267 0.297 0.372
Standard errors in parentheses: * signifi cant at 10%; ** signifi cant at 5%; ***signifi cant at 1%
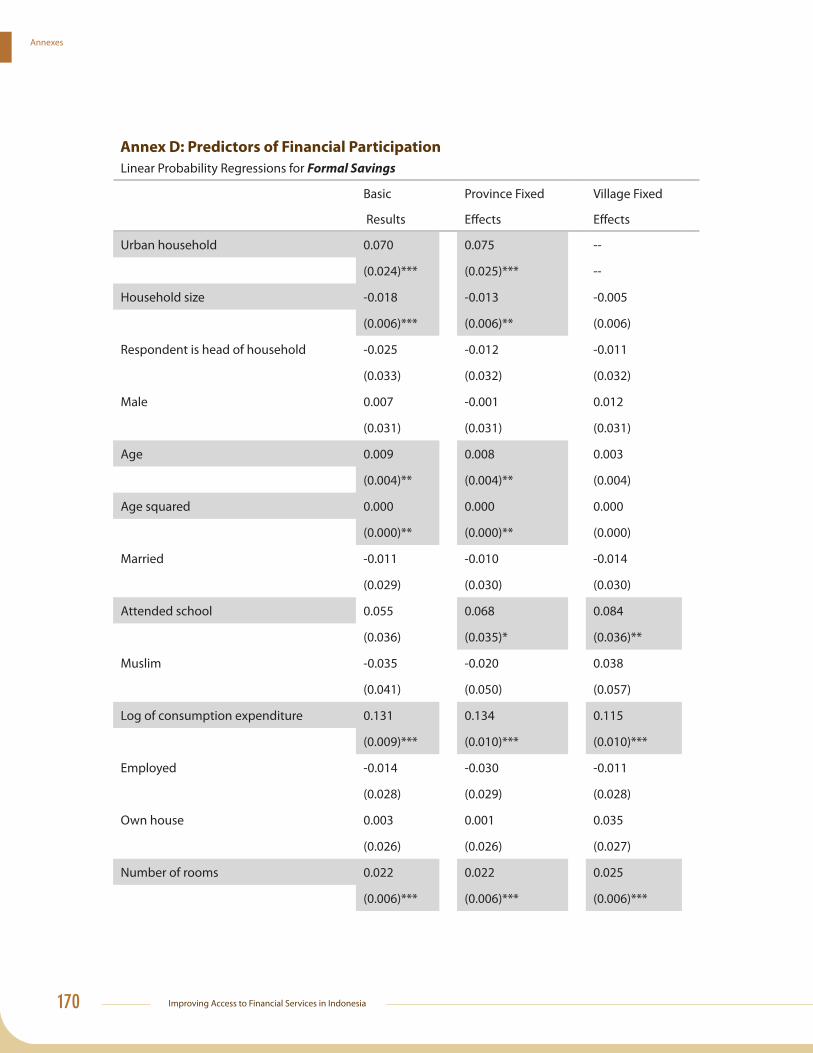
Improving Access to Financial Services in Indonesia170
Annexes
Annex D: Predictors of Financial Participation
Linear Probability Regressions for Formal Savings
Basic Province Fixed Village Fixed
Results Eff ects Eff ects
Urban household 0.070 0.075 --
(0.024)*** (0.025)*** --
Household size -0.018 -0.013 -0.005
(0.006)*** (0.006)** (0.006)
Respondent is head of household -0.025 -0.012 -0.011
(0.033) (0.032) (0.032)
Male 0.007 -0.001 0.012
(0.031) (0.031) (0.031)
Age 0.009 0.008 0.003
(0.004)** (0.004)** (0.004)
Age squared 0.000 0.000 0.000
(0.000)** (0.000)** (0.000)
Married -0.011 -0.010 -0.014
(0.029) (0.030) (0.030)
Attended school 0.055 0.068 0.084
(0.036) (0.035)* (0.036)**
Muslim -0.035 -0.020 0.038
(0.041) (0.050) (0.057)
Log of consumption expenditure 0.131 0.134 0.115
(0.009)*** (0.010)*** (0.010)***
Employed -0.014 -0.030 -0.011
(0.028) (0.029) (0.028)
Own house 0.003 0.001 0.035
(0.026) (0.026) (0.027)
Number of rooms 0.022 0.022 0.025
(0.006)*** (0.006)*** (0.006)***

171
Annexes
Have electricity -0.028 -0.031 -0.034
(0.044) (0.042) (0.050)
Have telephone 0.059 0.040 0.167
(0.029)** (0.033) (0.038)***
Have tap water 0.094 0.082 0.063
(0.026)*** (0.027)*** (0.033)*
Own enterprise 0.064 0.068 0.074
(0.023)*** (0.023)*** (0.022)***
Household has migrant worker abroad 0.217 0.215 0.207
(0.035)*** (0.036)*** (0.039)***
Financial literacy score 0.143 0.123 0.072
(0.042)*** (0.042)*** (0.040)*
Cognitive/Math skills score 0.231 0.219 0.190
(0.054)*** (0.055)*** (0.055)***
Risk averse 0.025 0.034 0.031
(0.021) (0.021) (0.021)
Time consistent preferences 0.022 0.022 0.019
(0.031) (0.031) (0.030)
Constant -2.093 -2.100 -1.869
(0.148)*** (0.160)*** (0.174)***
Observation 3360 3360 3360
R-squared 0.297 0.309 0.381
Standard errors in parentheses: * signifi cant at 10%; ** signifi cant at 5%; ***signifi cant at 1%

Improving Access to Financial Services in Indonesia172
Annexes
Annex E: Predictors of Financial Participation
Linear Probability Regressions for Informal Savings
Basic Province Fixed Village Fixed
Results Eff ects Eff ects
Urban household 0.026 0.017 --
(0.034) (0.033) --
Household size -0.002 0.007 0.007
(0.008) (0.008) (0.008)
Respondent is head of household -0.167 -0.123 -0.123
(0.044)*** (0.044)*** (0.043)***
Male 0.016 0.000 -0.009
(0.043) (0.044) (0.043)
Age -0.003 -0.005 -0.007
(0.005) (0.005) (0.005)
Age squared 0.000 0.000 0.000
(0.000) (0.000) (0.000)*
Married 0.013 0.013 0.006
(0.039) (0.037) (0.037)
Attended school -0.012 0.021 0.052
(0.044) (0.044) (0.045)
Muslim -0.134 -0.079 -0.048
(0.043)*** (0.053) (0.093)
Log of consumption expenditure 0.063 0.063 0.058
(0.015)*** (0.015)*** (0.015)***
Employed 0.129 0.077 0.072
(0.037)*** (0.038)** (0.036)**
Own house -0.036 -0.061 -0.043
(0.037) (0.036)* (0.037)
Number of rooms 0.008 0.007 0.013
(0.010) (0.010) (0.010)
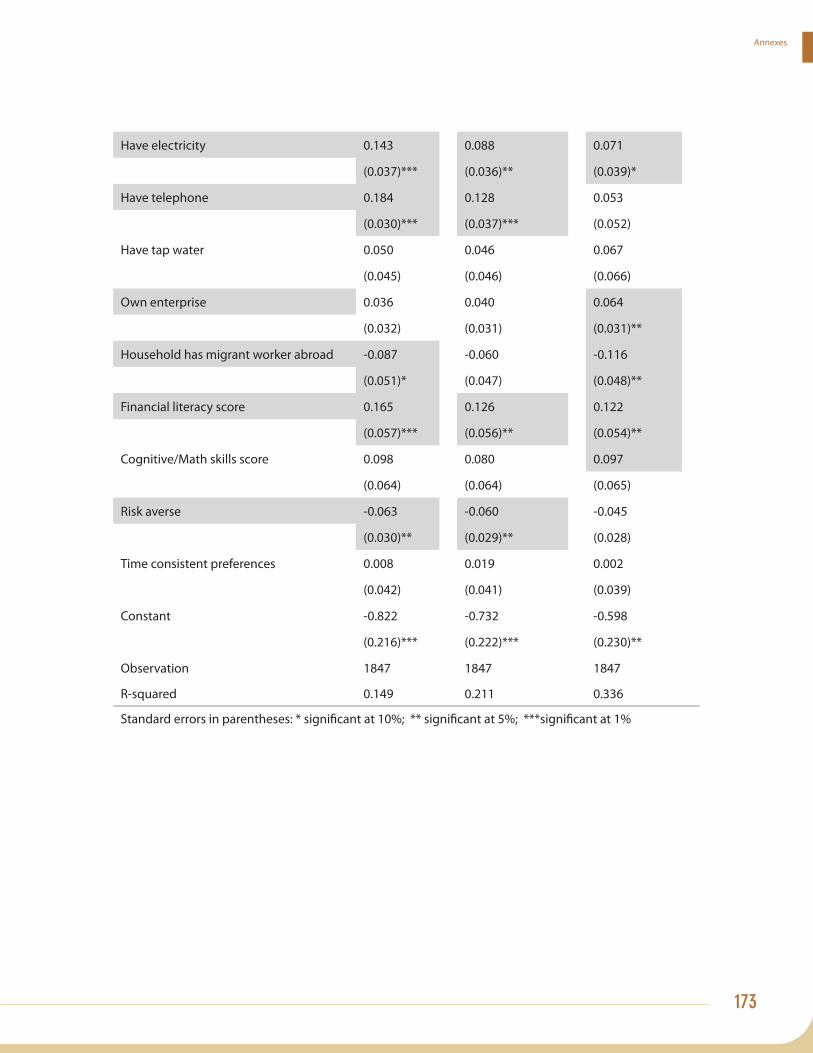
173
Annexes
Have electricity 0.143 0.088 0.071
(0.037)*** (0.036)** (0.039)*
Have telephone 0.184 0.128 0.053
(0.030)*** (0.037)*** (0.052)
Have tap water 0.050 0.046 0.067
(0.045) (0.046) (0.066)
Own enterprise 0.036 0.040 0.064
(0.032) (0.031) (0.031)**
Household has migrant worker abroad -0.087 -0.060 -0.116
(0.051)* (0.047) (0.048)**
Financial literacy score 0.165 0.126 0.122
(0.057)*** (0.056)** (0.054)**
Cognitive/Math skills score 0.098 0.080 0.097
(0.064) (0.064) (0.065)
Risk averse -0.063 -0.060 -0.045
(0.030)** (0.029)** (0.028)
Time consistent preferences 0.008 0.019 0.002
(0.042) (0.041) (0.039)
Constant -0.822 -0.732 -0.598
(0.216)*** (0.222)*** (0.230)**
Observation 1847 1847 1847
R-squared 0.149 0.211 0.336
Standard errors in parentheses: * signifi cant at 10%; ** signifi cant at 5%; ***signifi cant at 1%

Improving Access to Financial Services in Indonesia174
Annexes
Annex F: Predictors of Financial Participation
Linear Probability Regressions for Loans From Any Source
Basic Province Fixed Village Fixed
Results Eff ects Eff ects
Urban household -0.013 -0.035 --
(0.027) (0.028) --
Household size 0.018 0.021 0.019
(0.007)*** (0.007)*** (0.007)***
Respondent is head of household 0.006 0.000 -0.004
(0.039) (0.039) (0.039)
Male -0.034 -0.027 -0.029
(0.038) (0.038) (0.038)
Age 0.002 0.003 0.004
(0.005) (0.005) (0.005)
Age squared 0.000 0.000 0.000
(0.000) (0.000) (0.000)
Married 0.088 0.074 0.060
(0.037)** (0.038)* (0.038)
Attended school 0.079 0.090 0.077
(0.044)* (0.044)** (0.046)*
Muslim 0.148 0.095 0.073
(0.047)*** (0.059) (0.073)
Log of consumption expenditure 0.045 0.053 0.056
(0.011)*** (0.012)*** (0.012)***
Employed 0.076 0.080 0.072
(0.033)** (0.033)** (0.033)**
Own house -0.047 -0.054 -0.063
(0.030) (0.030)* (0.033)*
Number of rooms -0.003 -0.005 -0.001
(0.007) (0.007) (0.008)

175
Annexes
Have electricity 0.099 0.044 0.010
(0.053)* (0.053) (0.065)
Have telephone 0.047 0.023 0.062
(0.030) (0.035) (0.041)
Have tap water -0.042 -0.023 -0.043
(0.031) (0.032) (0.042)
Own enterprise 0.011 0.005 0.014
(0.025) (0.025) (0.026)
Household has migrant worker abroad 0.028 0.022 -0.004
(0.039) (0.040) (0.043)
Financial literacy score 0.076 0.060 0.071
(0.049) (0.049) (0.049)
Cognitive/Math skills score 0.088 0.071 0.075
(0.063) (0.064) (0.066)
Risk averse 0.003 0.000 0.002
(0.025) (0.025) (0.025)
Time consistent preferences 0.001 0.005 -0.004
(0.034) (0.034) (0.035)
Constant -0.669 -0.639 -0.691
(0.175)*** (0.187)*** (0.206)***
Observation 3360 3360 3360
R-squared 0.085 0.098 0.147
Standard errors in parentheses: * signifi cant at 10%; ** signifi cant at 5%; ***signifi cant at 1%

Improving Access to Financial Services in Indonesia176
Annexes
Annex G: Predictors of Financial Participation
Linear Probability Regressions for Formal Loans
Basic Province Fixed Village Fixed
Results Eff ects Eff ects
Urban household -0.001 -0.004 --
(0.023) (0.023) --
Household size 0.004 0.004 0.010
(0.006) (0.006) (0.006)*
Respondent is head of household -0.040 -0.043 -0.041
(0.026) (0.026) (0.027)
Male 0.030 0.033 0.033
(0.027) (0.027) (0.027)
Age 0.006 0.006 0.004
(0.003)* (0.003)* (0.003)
Age squared 0.000 0.000 0.000
(0.000) (0.000) (0.000)
Married 0.002 -0.002 -0.024
(0.028) (0.028) (0.028)
Attended school 0.011 0.010 0.011
(0.025) (0.026) (0.026)
Muslim 0.030 0.040 0.036
(0.038) (0.050) (0.059)
Log of consumption expenditure 0.057 0.060 0.050
(0.009)*** (0.010)*** (0.010)***
Employed -0.019 -0.015 0.004
(0.028) (0.028) (0.028)
Own house 0.041 0.041 0.049
(0.024)* (0.024)* (0.026)*
Number of rooms 0.012 0.011 0.017
(0.006)* (0.006)* (0.006)***

177
Annexes
Have electricity -0.001 -0.005 -0.031
(0.022) (0.018) (0.023)
Have telephone 0.041 0.031 0.096
(0.021)** (0.026) (0.035)***
Have tap water 0.033 0.039 0.074
(0.029) (0.030) (0.041)*
Own enterprise 0.020 0.020 0.043
(0.023) (0.023) (0.023)*
Household has migrant worker abroad 0.001 -0.004 0.009
(0.032) (0.034) (0.036)
Financial literacy score 0.065 0.063 0.041
(0.037)* (0.037)* (0.037)
Cognitive/Math skills score 0.086 0.081 0.126
(0.041)** (0.042)* (0.044)***
Risk averse 0.031 0.029 0.024
(0.021) (0.021) (0.020)
Time consistent preferences 0.009 0.009 0.003
(0.030) (0.031) (0.029)
Constant -1.111 -1.136 -1.057
(0.146)*** (0.158)*** (0.164)***
Observation 3360 3360 3360
R-squared 0.103 0.106 0.219
Standard errors in parentheses: * signifi cant at 10%; ** signifi cant at 5%; ***signifi cant at 1%
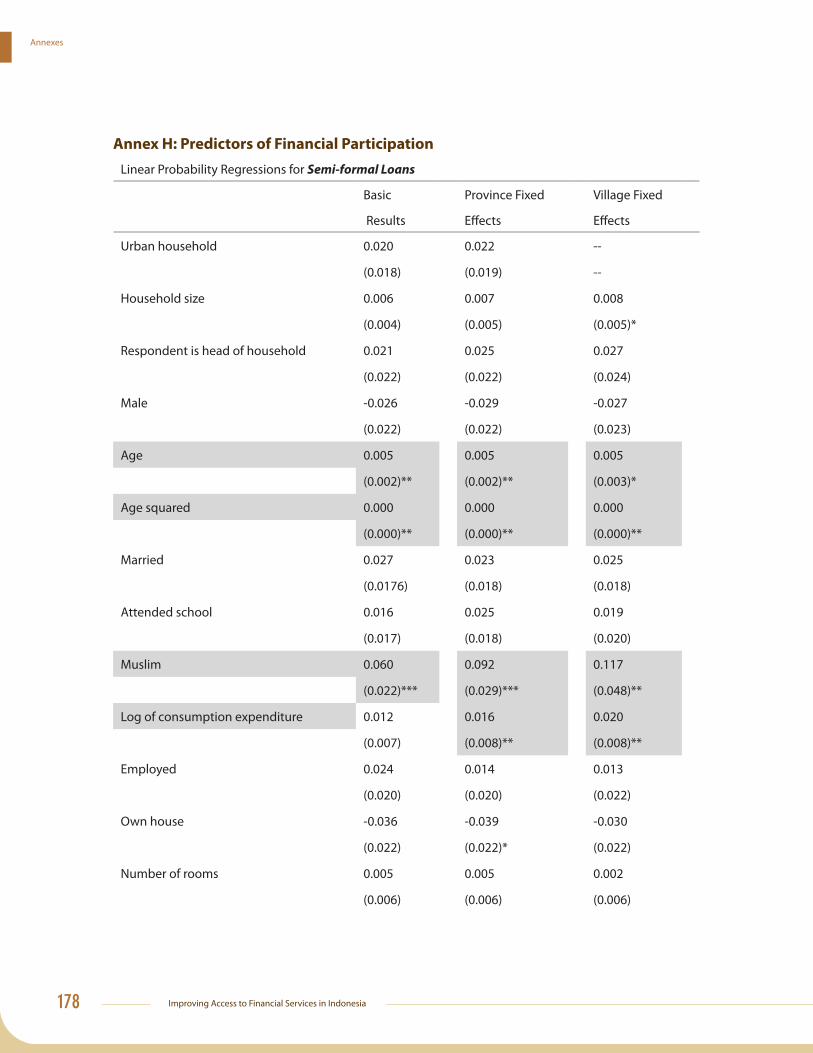
Improving Access to Financial Services in Indonesia178
Annexes
Annex H: Predictors of Financial Participation
Linear Probability Regressions for Semi-formal Loans
Basic Province Fixed Village Fixed
Results Eff ects Eff ects
Urban household 0.020 0.022 --
(0.018) (0.019) --
Household size 0.006 0.007 0.008
(0.004) (0.005) (0.005)*
Respondent is head of household 0.021 0.025 0.027
(0.022) (0.022) (0.024)
Male -0.026 -0.029 -0.027
(0.022) (0.022) (0.023)
Age 0.005 0.005 0.005
(0.002)** (0.002)** (0.003)*
Age squared 0.000 0.000 0.000
(0.000)** (0.000)** (0.000)**
Married 0.027 0.023 0.025
(0.0176) (0.018) (0.018)
Attended school 0.016 0.025 0.019
(0.017) (0.018) (0.020)
Muslim 0.060 0.092 0.117
(0.022)*** (0.029)*** (0.048)**
Log of consumption expenditure 0.012 0.016 0.020
(0.007) (0.008)** (0.008)**
Employed 0.024 0.014 0.013
(0.020) (0.020) (0.022)
Own house -0.036 -0.039 -0.030
(0.022) (0.022)* (0.022)
Number of rooms 0.005 0.005 0.002
(0.006) (0.006) (0.006)
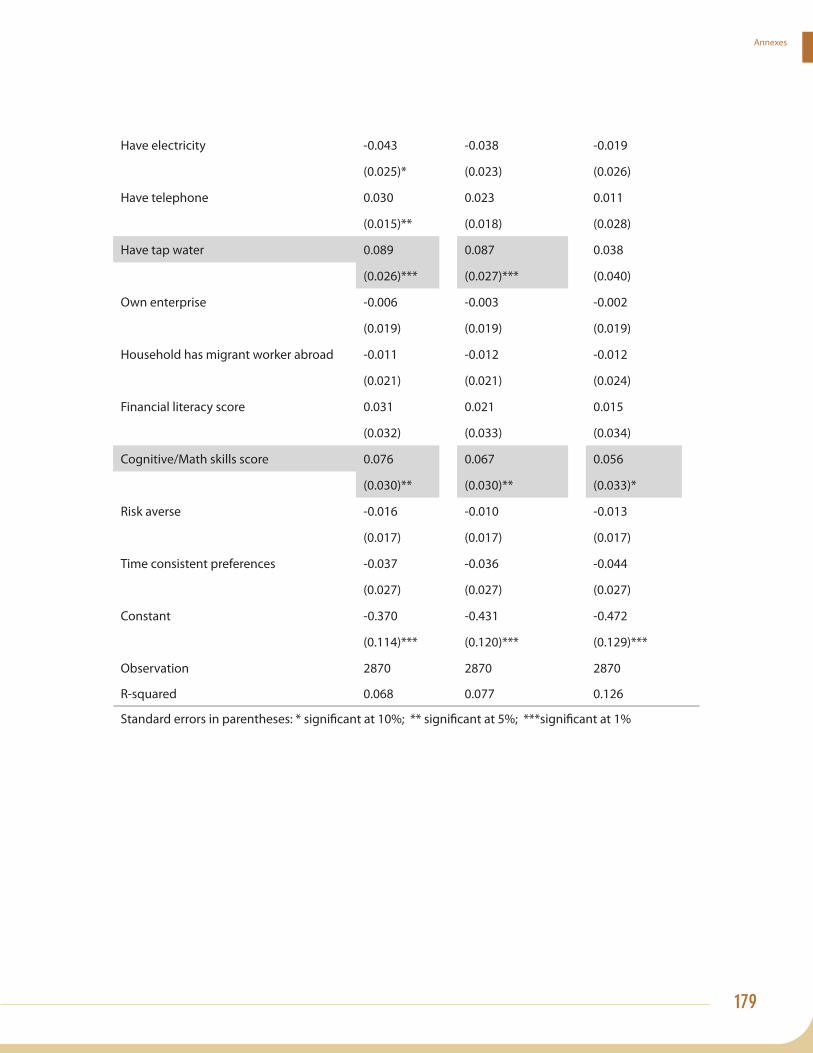
179
Annexes
Have electricity -0.043 -0.038 -0.019
(0.025)* (0.023) (0.026)
Have telephone 0.030 0.023 0.011
(0.015)** (0.018) (0.028)
Have tap water 0.089 0.087 0.038
(0.026)*** (0.027)*** (0.040)
Own enterprise -0.006 -0.003 -0.002
(0.019) (0.019) (0.019)
Household has migrant worker abroad -0.011 -0.012 -0.012
(0.021) (0.021) (0.024)
Financial literacy score 0.031 0.021 0.015
(0.032) (0.033) (0.034)
Cognitive/Math skills score 0.076 0.067 0.056
(0.030)** (0.030)** (0.033)*
Risk averse -0.016 -0.010 -0.013
(0.017) (0.017) (0.017)
Time consistent preferences -0.037 -0.036 -0.044
(0.027) (0.027) (0.027)
Constant -0.370 -0.431 -0.472
(0.114)*** (0.120)*** (0.129)***
Observation 2870 2870 2870
R-squared 0.068 0.077 0.126
Standard errors in parentheses: * signifi cant at 10%; ** signifi cant at 5%; ***signifi cant at 1%

Improving Access to Financial Services in Indonesia180
Annexes
Annex I: Predictors of Financial Participation
Linear Probability Regressions for Informal Loans
Informal loans Basic Province Fixed Village Fixed
Results Eff ects Eff ects
Urban household -0.029 -0.059 --
(0.033) (0.034)* --
Household size 0.018 0.022 0.013
(0.008)** (0.008)*** (0.008)
Respondent is head of household 0.019 0.011 -0.001
(0.041) (0.041) (0.041)
Male -0.052 -0.043 -0.046
(0.040) (0.040) (0.039)
Age -0.005 -0.005 -0.001
(0.005) (0.005) (0.006)
Age squared 0.000 0.000 0.000
(0.000) (0.000) (0.000)
Married 0.096 0.082 0.083
(0.038)** (0.039)** (0.037)**
Attended school 0.073 0.083 0.074
(0.044) (0.045)* (0.046)
Muslim 0.126 0.027 -0.022
(0.047)*** (0.060) (0.079)
Log of consumption expenditure 0.016 0.021 0.028
(0.013) (0.014) (0.014)**
Employed 0.102 0.108 0.088
(0.036)*** (0.037)*** (0.035)**
Own house -0.060 -0.069 -0.094
(0.035)* (0.035)* (0.035)***
Number of rooms -0.016 -0.018 -0.015
(0.008)* (0.009)** (0.009)*

181
Annexes
Have electricity 0.133 0.070 0.039
(0.055)** (0.054) (0.068)
Have telephone 0.018 -0.009 0.030
(0.032) (0.038) (0.048)
Have tap water -0.137 -0.113 -0.159
(0.037)*** (0.038)*** (0.047)***
Own enterprise 0.008 -0.002 -0.005
(0.030) (0.031) (0.031)
Household has migrant worker abroad 0.038 0.036 0.006
(0.044) (0.046) (0.050)
Financial literacy score 0.044 0.028 0.054
(0.052) (0.052) (0.051)
Cognitive/Math skills score 0.008 -0.006 -0.037
(0.065) (0.066) (0.068)
Risk averse -0.004 -0.011 -0.015
(0.028) (0.029) (0.028)
Time consistent preferences 0.016 0.022 0.022
(0.040) (0.041) (0.040)
Constant -0.021 0.084 0.008
(0.201) (0.217) (0.237)
Observation 2587 2587 2587
R-squared 0.067 0.087 0.162
Standard errors in parentheses: * signifi cant at 10%; ** signifi cant at 5%; ***signifi cant at 1%
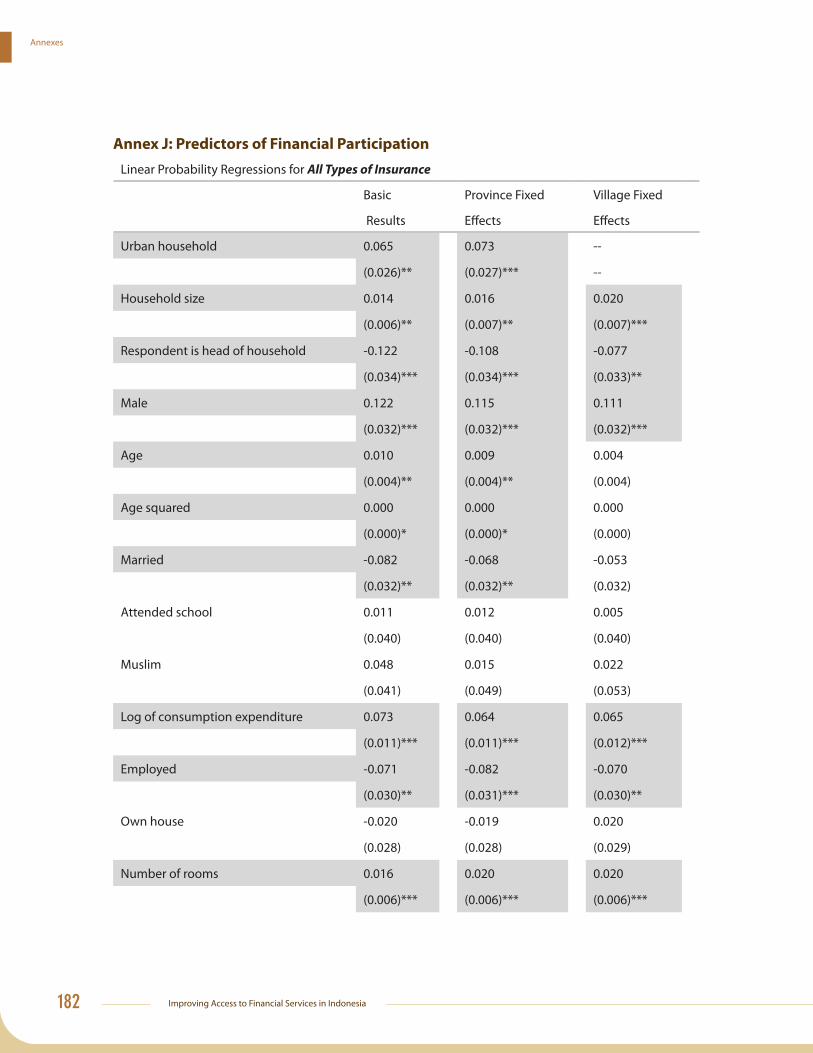
Improving Access to Financial Services in Indonesia182
Annexes
Annex J: Predictors of Financial Participation
Linear Probability Regressions for All Types of Insurance
Basic Province Fixed Village Fixed
Results Eff ects Eff ects
Urban household 0.065 0.073 --
(0.026)** (0.027)*** --
Household size 0.014 0.016 0.020
(0.006)** (0.007)** (0.007)***
Respondent is head of household -0.122 -0.108 -0.077
(0.034)*** (0.034)*** (0.033)**
Male 0.122 0.115 0.111
(0.032)*** (0.032)*** (0.032)***
Age 0.010 0.009 0.004
(0.004)** (0.004)** (0.004)
Age squared 0.000 0.000 0.000
(0.000)* (0.000)* (0.000)
Married -0.082 -0.068 -0.053
(0.032)** (0.032)** (0.032)
Attended school 0.011 0.012 0.005
(0.040) (0.040) (0.040)
Muslim 0.048 0.015 0.022
(0.041) (0.049) (0.053)
Log of consumption expenditure 0.073 0.064 0.065
(0.011)*** (0.011)*** (0.012)***
Employed -0.071 -0.082 -0.070
(0.030)** (0.031)*** (0.030)**
Own house -0.020 -0.019 0.020
(0.028) (0.028) (0.029)
Number of rooms 0.016 0.020 0.020
(0.006)*** (0.006)*** (0.006)***
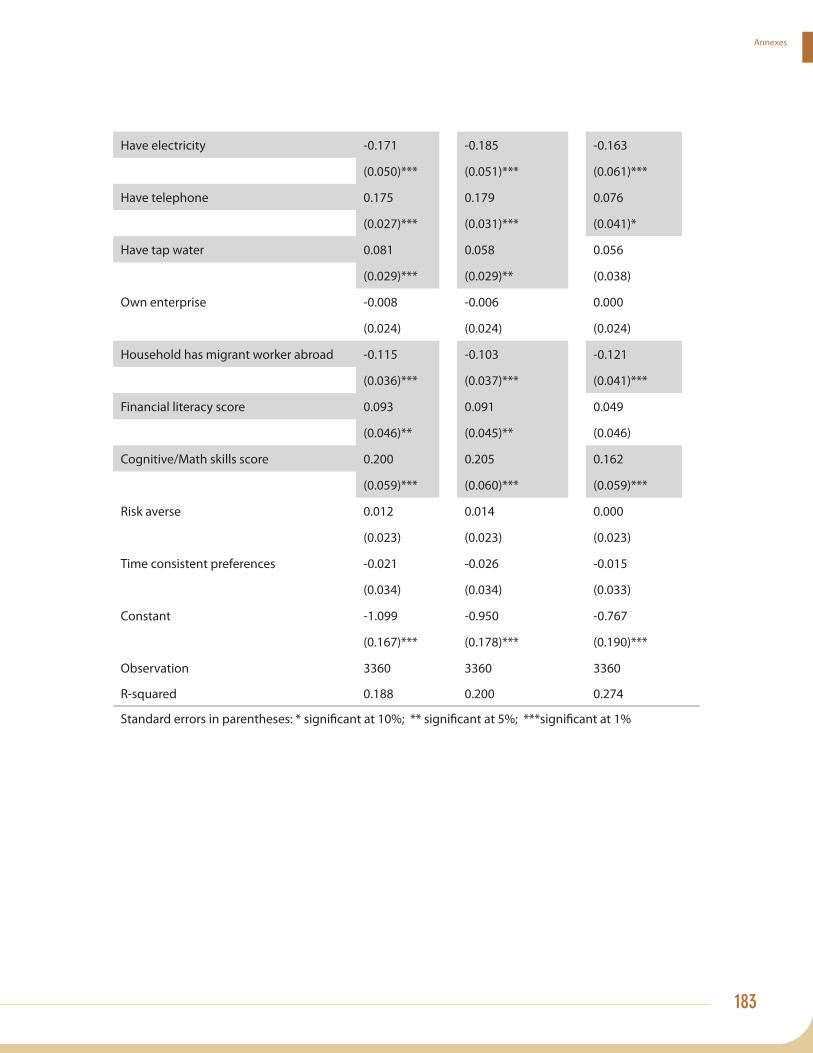
183
Annexes
Have electricity -0.171 -0.185 -0.163
(0.050)*** (0.051)*** (0.061)***
Have telephone 0.175 0.179 0.076
(0.027)*** (0.031)*** (0.041)*
Have tap water 0.081 0.058 0.056
(0.029)*** (0.029)** (0.038)
Own enterprise -0.008 -0.006 0.000
(0.024) (0.024) (0.024)
Household has migrant worker abroad -0.115 -0.103 -0.121
(0.036)*** (0.037)*** (0.041)***
Financial literacy score 0.093 0.091 0.049
(0.046)** (0.045)** (0.046)
Cognitive/Math skills score 0.200 0.205 0.162
(0.059)*** (0.060)*** (0.059)***
Risk averse 0.012 0.014 0.000
(0.023) (0.023) (0.023)
Time consistent preferences -0.021 -0.026 -0.015
(0.034) (0.034) (0.033)
Constant -1.099 -0.950 -0.767
(0.167)*** (0.178)*** (0.190)***
Observation 3360 3360 3360
R-squared 0.188 0.200 0.274
Standard errors in parentheses: * signifi cant at 10%; ** signifi cant at 5%; ***signifi cant at 1%

Improving Access to Financial Services in Indonesia184
Annexes
Annex K: Predictors of Financial Participation
Linear Probability Regressions for Financial Literacy
Basic Province Fixed Village Fixed
Results Eff ects Eff ects
Urban household 0.051 0.042 --
(0.013)*** (0.013)*** --
Household size -0.007 -0.003 -0.001
(0.003)** (0.003) (0.003)
Respondent is head of household 0.000 0.006 0.010
(0.019) (0.019) (0.019)
Male 0.031 0.028 0.028
(0.018)* (0.018) (0.018)
Age 0.005 0.004 0.003
(0.002)** (0.002) (0.002)
Age squared 0.000 0.000 0.000
(0.000)*** (0.000)** (0.000)*
Married -0.022 -0.026 -0.018
(0.018) (0.018) (0.018)
Attended school 0.094 0.106 0.093
(0.022)*** (0.023)*** (0.023)***
Muslim -0.039 -0.054 -0.053
(0.025) (0.031)* (0.038)
Log of consumption expenditure 0.019 0.021 0.019
(0.006)*** (0.006)*** (0.006)***
Employed -0.015 -0.025 -0.016
(0.016) (0.016) (0.016)
Own house -0.033 -0.033 -0.015
(0.014)** (0.014)** (0.015)
Number of rooms 0.001 0.000 -0.002
(0.003) (0.004) (0.004)
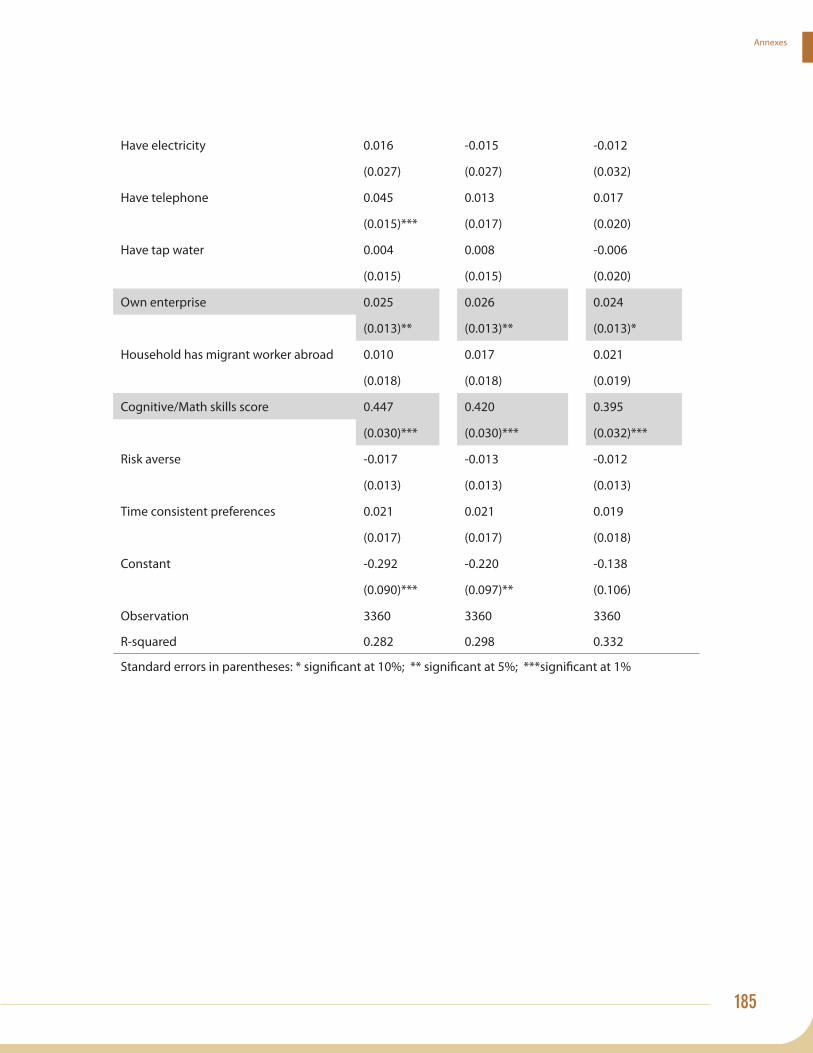
185
Annexes
Have electricity 0.016 -0.015 -0.012
(0.027) (0.027) (0.032)
Have telephone 0.045 0.013 0.017
(0.015)*** (0.017) (0.020)
Have tap water 0.004 0.008 -0.006
(0.015) (0.015) (0.020)
Own enterprise 0.025 0.026 0.024
(0.013)** (0.013)** (0.013)*
Household has migrant worker abroad 0.010 0.017 0.021
(0.018) (0.018) (0.019)
Cognitive/Math skills score 0.447 0.420 0.395
(0.030)*** (0.030)*** (0.032)***
Risk averse -0.017 -0.013 -0.012
(0.013) (0.013) (0.013)
Time consistent preferences 0.021 0.021 0.019
(0.017) (0.017) (0.018)
Constant -0.292 -0.220 -0.138
(0.090)*** (0.097)** (0.106)
Observation 3360 3360 3360
R-squared 0.282 0.298 0.332
Standard errors in parentheses: * signifi cant at 10%; ** signifi cant at 5%; ***signifi cant at 1%

Improving Access to Financial Services in Indonesia186
Annexes
An
ne
x L
: S
um
ma
ry o
f R
eg
ula
tory
Fra
me
wo
rk f
or
Ba
nk
s, W
ith
Att
en
tio
n t
o I
ssu
es
of
Acc
ess
Regu
latio
ns C
once
rnin
g:Au
thor
ity 1
/Su
mm
ary
of M
ain
Cont
ent
Not
es o
n Im
plic
atio
ns fo
r poo
rer h
ouse
hold
s &
MSM
Es
1. E
ntry
into
Indu
stry
1.1
Min
imum
Cap
ital R
equi
rem
ents
BI R
egul
atio
nsVa
ry b
y ty
pe o
f ban
k; h
igh
for n
ew b
anks
; Tie
r 1 fo
r ex
istin
g ba
nks
risin
g th
ru 2
010
Acts
as
barr
ier f
or n
ew, s
mal
l ban
ks. L
ess
rest
rictiv
e fo
r BP
Rs &
Sha
ria
1.2
Ow
ners
hip
Requ
irem
ents
BI R
egul
atio
nsVe
ry o
pen
for c
onve
ntio
nal b
anks
. No
fore
ign
owne
rshi
p fo
r BPR
sN
o fo
reig
n ow
ners
hip
(incl
. NG
Os)
hur
ts B
PRs,
whi
ch
lack
hum
an re
sour
ces
and
fi nan
cing
.
1.3
Man
agem
ent R
equi
rem
ents
BI R
egul
atio
nsSi
ze, c
ompo
sitio
n &
com
pete
nce
of D
irect
ors,
Com
mis
sion
ers
& S
uper
viso
rs (f
or S
haria
) E
duca
tion,
num
bers
& S
uper
viso
ry B
oard
(for
Sha
ria)
exce
ssiv
e fo
r sm
all B
PRs.
1.4
Fit
& Pr
oper
Test
sBI
Reg
ulat
ions
Revi
ew o
f con
trol
ling
shar
ehol
ders
, man
ager
s &
ex
ecut
ives
.N
ot s
igni
fi can
t.
1.5
Ris
k M
anag
emen
t Cer
tifi c
atio
nBI
Reg
ulat
ions
For m
anag
emen
t & e
xecu
tives
; sep
arat
e re
quire
men
ts fo
r In
terN
et b
anki
ng &
mut
ual f
unds
.Re
stric
tive
cert
ifi ca
tion
look
s di
ffi cu
lt fo
r sm
alle
r ba
nks,
but n
ot a
pplic
able
to B
PRs.
1.6
Com
plia
nce
Dire
ctor
BI R
egul
atio
nsA
mem
ber
of t
he B
oard
of
Dire
ctor
s m
ust
be a
ppoi
nted
Co
mpl
ianc
e D
irect
or.
Not
sig
nifi c
ant.
2. A
sym
met
ric In
form
atio
n
2.1
Kno
w Y
our C
usto
mer
(KYC
)BI
Reg
ulat
ions
App
licat
ion
is p
art o
f ‘m
anag
emen
t’ co
mpo
nent
of b
ank
ratin
g. C
an e
ntai
l
serio
us s
anct
ions
.
Dis
mis
sal o
f man
ager
is o
ne s
anct
ion;
ver
y se
rious
for
a sm
all b
ank
or B
PR.
2.2
Tra
nspa
renc
y of
Fin
ance
sBI
Reg
ulat
ions
Fina
ncia
ls p
ublis
hed
(& o
n BI
web
site
) reg
ular
ly; l
ess
freq
uent
ly fo
r BPR
s.D
oubt
ful e
ff ect
iven
ess
for B
PRs
beca
use
of lo
w
fi nan
cial
lite
racy
in p
oor,
rem
ote
area
s.
2.3
Tra
nspa
renc
y in
Pro
duct
s BI
Reg
ulat
ions
Requ
ires
tran
spar
ency
in b
ank
prod
ucts
and
use
of
cust
omer
dat
a in
writ
ten
form
. W
ritte
n in
fo in
eff e
ctiv
e fo
r BPR
s be
caus
e of
low
lit
erac
y in
poo
r rem
ote
area
s.
2.4
Deb
tor I
nfor
mat
ion
Syst
emBI
Reg
ulat
ions
Requ
ires
repo
rtin
g of
sub
stan
tial i
nfo
on lo
ans
of a
ll si
zes.
Unn
eces
sary
for v
ery
smal
l bor
row
ers;
que
stio
nabl
e if
taxp
ayer
# &
bus
ines
s lic
ense
nee
ded.
2.5
Dep
osit
Insu
ranc
eAc
t No.
24
of
2004
In p
rinci
ple,
pla
ces
a ce
iling
on
insu
red
depo
sit r
ates
.U
ncle
ar if
the
ceili
ng is
ope
rativ
e.
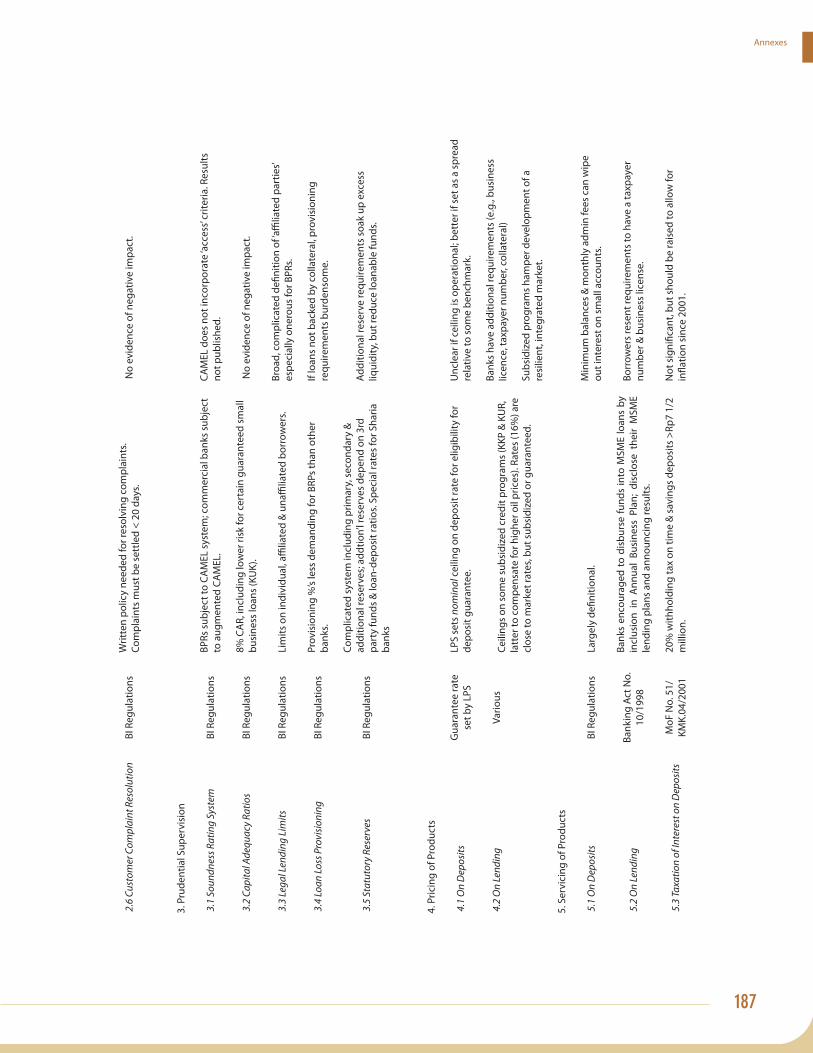
187
Annexes
2.6
Cus
tom
er C
ompl
aint
Res
olut
ion
BI R
egul
atio
nsW
ritte
n po
licy
need
ed fo
r res
olvi
ng c
ompl
aint
s.
Com
plai
nts
mus
t be
sett
led
< 20
day
s. N
o ev
iden
ce o
f neg
ativ
e im
pact
.
3. P
rude
ntia
l Sup
ervi
sion
3.1
Sou
ndne
ss R
atin
g Sy
stem
BI R
egul
atio
nsBP
Rs s
ubje
ct to
CA
MEL
sys
tem
; com
mer
cial
ban
ks s
ubje
ct
to a
ugm
ente
d CA
MEL
.CA
MEL
doe
s no
t inc
orpo
rate
‘acc
ess’
crite
ria. R
esul
ts
not p
ublis
hed.
3.2
Cap
ital A
dequ
acy
Ratio
sBI
Reg
ulat
ions
8% C
AR,
incl
udin
g lo
wer
risk
for c
erta
in g
uara
ntee
d sm
all
busi
ness
loan
s (K
UK)
. N
o ev
iden
ce o
f neg
ativ
e im
pact
.
3.3
Lega
l Len
ding
Lim
itsBI
Reg
ulat
ions
Lim
its o
n in
divi
dual
, affi
liate
d &
una
ffi lia
ted
borr
ower
s.Br
oad,
com
plic
ated
defi
niti
on o
f ‘affi
liate
d pa
rtie
s’ es
peci
ally
one
rous
for B
PRs.
3.4
Loan
Loss
Pro
visi
onin
gBI
Reg
ulat
ions
Prov
isio
ning
%’s
less
dem
andi
ng fo
r BRP
s th
an o
ther
ba
nks.
If lo
ans
not b
acke
d by
col
late
ral,
prov
isio
ning
re
quire
men
ts b
urde
nsom
e.
3.5
Sta
tuto
ry R
eser
ves
BI R
egul
atio
ns
Com
plic
ated
sys
tem
incl
udin
g pr
imar
y, s
econ
dary
&
addi
tiona
l res
erve
s; a
ddtio
n’l r
eser
ves
depe
nd o
n 3r
d pa
rty
fund
s &
loan
-dep
osit
ratio
s. Sp
ecia
l rat
es fo
r Sha
ria
bank
s
Addi
tiona
l res
erve
requ
irem
ents
soa
k up
exc
ess
liqui
dity
, but
redu
ce lo
anab
le fu
nds.
4. P
ricin
g of
Pro
duct
s
4.1
On
Dep
osits
Gua
rant
ee ra
te
set b
y LP
SLP
S se
ts n
omin
al c
eilin
g on
dep
osit
rate
for e
ligib
ility
for
depo
sit g
uara
ntee
.U
ncle
ar if
cei
ling
is o
pera
tiona
l; be
tter
if s
et a
s a
spre
ad
rela
tive
to s
ome
benc
hmar
k.
4.2
On
Lend
ing
Vario
usCe
iling
s on
som
e su
bsid
ized
cre
dit p
rogr
ams
(KKP
& K
UR,
la
tter
to c
ompe
nsat
e fo
r hig
her o
il pr
ices
). Ra
tes
(16%
) are
cl
ose
to m
arke
t rat
es, b
ut s
ubsi
dize
d or
gua
rant
eed.
Bank
s ha
ve a
dditi
onal
requ
irem
ents
(e.g
., bu
sine
ss
licen
ce, t
axpa
yer n
umbe
r, co
llate
ral)
Subs
idiz
ed p
rogr
ams
ham
per d
evel
opm
ent o
f a
resi
lient
, int
egra
ted
mar
ket.
5. S
ervi
cing
of P
rodu
cts
5.1
On
Dep
osits
BI R
egul
atio
nsLa
rgel
y de
fi niti
onal
.M
inim
um b
alan
ces
& m
onth
ly a
dmin
fees
can
wip
e ou
t int
eres
t on
smal
l acc
ount
s.
5.2
On
Lend
ing
Bank
ing
Act N
o.
10/1
998
Bank
s en
cour
aged
to
disb
urse
fund
s in
to M
SME
loan
s by
in
clus
ion
in A
nnua
l Bu
sine
ss P
lan;
dis
clos
e th
eir
MSM
E le
ndin
g pl
ans
and
anno
unci
ng re
sults
.
Borr
ower
s re
sent
requ
irem
ents
to h
ave
a ta
xpay
er
num
ber &
bus
ines
s lic
ense
.
5.3
Taxa
tion
of In
tere
st o
n D
epos
itsM
oF N
o. 5
1/KM
K.04
/200
120
% w
ithho
ldin
g ta
x on
tim
e &
sav
ings
dep
osits
>Rp
7 1/
2 m
illio
n.N
ot s
igni
fi can
t, bu
t sho
uld
be ra
ised
to a
llow
for
infl a
tion
sinc
e 20
01.
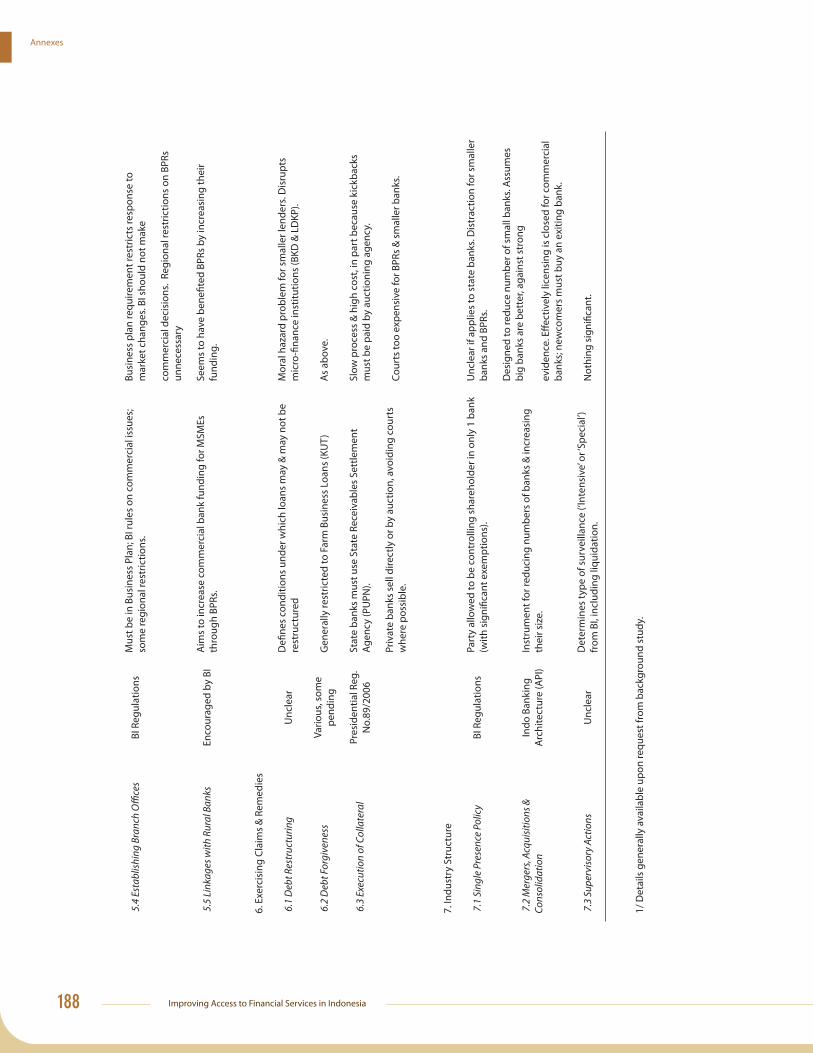
Improving Access to Financial Services in Indonesia188
Annexes
5.4
Est
ablis
hing
Bra
nch
Offi
ces
BI R
egul
atio
nsM
ust b
e in
Bus
ines
s Pl
an; B
I rul
es o
n co
mm
erci
al is
sues
; so
me
regi
onal
rest
rictio
ns.
Busi
ness
pla
n re
quire
men
t res
tric
ts re
spon
se to
m
arke
t cha
nges
. BI s
houl
d no
t mak
e
com
mer
cial
dec
isio
ns.
Regi
onal
rest
rictio
ns o
n BP
Rs
unne
cess
ary
5.5
Lin
kage
s with
Rur
al B
anks
Enco
urag
ed b
y BI
Aim
s to
incr
ease
com
mer
cial
ban
k fu
ndin
g fo
r MSM
Es
thro
ugh
BPRs
.Se
ems
to h
ave
bene
fi ted
BPR
s by
incr
easi
ng th
eir
fund
ing.
6. E
xerc
isin
g Cl
aim
s &
Rem
edie
s
6.1
Deb
t Res
truc
turin
gU
ncle
arD
efi n
es c
ondi
tions
und
er w
hich
loan
s m
ay &
may
not
be
rest
ruct
ured
M
oral
haz
ard
prob
lem
for s
mal
ler l
ende
rs. D
isru
pts
mic
ro-fi
nanc
e in
stitu
tions
(BKD
& L
DKP
).
6.2
Deb
t For
give
ness
Vario
us, s
ome
pend
ing
Gen
eral
ly re
stric
ted
to F
arm
Bus
ines
s Lo
ans
(KU
T)A
s ab
ove.
6.3
Exe
cutio
n of
Col
late
ral
Pres
iden
tial R
eg.
No.
89/2
006
Stat
e ba
nks
mus
t use
Sta
te R
ecei
vabl
es S
ettle
men
t Ag
ency
(PU
PN).
Slow
pro
cess
& h
igh
cost
, in
part
bec
ause
kic
kbac
ks
mus
t be
paid
by
auct
ioni
ng a
genc
y.
Priv
ate
bank
s se
ll di
rect
ly o
r by
auct
ion,
avo
idin
g co
urts
w
here
pos
sibl
e.Co
urts
too
expe
nsiv
e fo
r BPR
s &
sm
alle
r ban
ks.
7. In
dust
ry S
truc
ture
7.1
Sin
gle
Pres
ence
Pol
icy
BI R
egul
atio
nsPa
rty
allo
wed
to b
e co
ntro
lling
sha
reho
lder
in o
nly
1 ba
nk
(with
sig
nifi c
ant e
xem
ptio
ns).
Unc
lear
if a
pplie
s to
sta
te b
anks
. Dis
trac
tion
for s
mal
ler
bank
s an
d BP
Rs.
7.2
Mer
gers
, Acq
uisi
tions
&
Cons
olid
atio
nIn
do B
anki
ng
Arc
hite
ctur
e (A
PI)
Inst
rum
ent f
or re
duci
ng n
umbe
rs o
f ban
ks &
incr
easi
ng
thei
r siz
e.
Des
igne
d to
redu
ce n
umbe
r of s
mal
l ban
ks. A
ssum
es
big
bank
s ar
e be
tter
, aga
inst
str
ong
evid
ence
. Eff e
ctiv
ely
licen
sing
is c
lose
d fo
r com
mer
cial
ba
nks;
new
com
ers
mus
t buy
an
exiti
ng b
ank.
7.3
Sup
ervi
sory
Act
ions
Unc
lear
Det
erm
ines
type
of s
urve
illan
ce (‘
Inte
nsiv
e’ or
‘Spe
cial
’) fr
om B
I, in
clud
ing
liqui
datio
n.N
othi
ng s
igni
fi can
t.
1/ D
etai
ls g
ener
ally
ava
ilabl
e up
on re
ques
t fro
m b
ackg
roun
d st
udy.

189
Annexes
An
ne
x M
: S
um
ma
ry o
f R
eg
ula
tory
Fra
me
wo
rk f
or
Co
op
era
tiv
es,
Wit
h A
tte
nti
on
to
Iss
ue
s o
f A
cce
ss
Regu
latio
ns C
once
rnin
gAu
thor
ity 1
/Su
mm
ary
of C
onte
ntN
otes
on
Impl
icat
ions
for p
oore
r hou
seho
lds
&
MSM
Es
1. E
ntry
into
Indu
stry
1.1
Min
imum
Cap
ital R
equi
rem
ents
Dec
ree
of
Min
Co
ops
& S
MEs
Se
ts m
inim
um p
aid-
up c
apita
l for
prim
ary
and
seco
ndar
y co
ops.
Very
low
min
imum
(Rp1
5 m
illio
n); n
o si
gnifi
cant
im
pedi
men
t.
1.2
Ow
ners
hip
Requ
irem
ents
Law
25/
1992
Sets
citi
zens
hip
& m
in.s
ize
of p
rimar
y (2
0 pe
rson
s) a
nd
seco
ndar
y co
ops
(3 c
oops
). N
o si
gnifi
cant
impe
dim
ents
.
1.3
Man
agem
ent R
equi
rem
ents
Dec
rees
& P
Ps.
May
be
man
aged
by
Boar
d or
out
-sou
rced
to p
rofe
ssio
nal.
No
sign
ifi ca
nt im
pedi
men
ts.
1.4
Fit
& Pr
oper
Test
sN
/AN
/AN
/A
1.5
Ris
k M
anag
emen
t Cer
tifi c
atio
nN
/AN
/AN
/A
1.6
Com
plia
nce
Dire
ctor
N/A
N/A
N/A
2. A
sym
met
ric In
form
atio
n
2.1
Kno
w Y
our C
usto
mer
(KYC
)D
ecre
eD
eter
min
es re
quire
men
ts fo
r loa
n ap
plic
ants
; not
sp
ecifi
cally
AM
L.N
o si
gnifi
cant
impe
dim
ents
.
2.2
Tra
nspa
renc
y of
Fin
anci
al
Cond
ition
Dec
ree
Det
erm
ines
use
rs, t
ypes
& d
iscl
osur
e of
fi na
ncia
l inf
o. S
ets
thre
shol
d fo
r for
mal
aud
it.D
iscl
osur
e un
likel
y to
be
eff e
ctiv
e du
e to
low
fi n
anci
al li
tera
cy.
2.3
Tra
nspa
renc
y in
Pro
duct
s D
ecre
eRe
quire
s co
op to
hav
e po
licy
man
ual c
over
ing
spec
ifi c
area
s.U
nlik
ely
to b
e eff
ect
ive
due
to lo
w li
tera
cy ra
tes
in
poor
rem
ote
regi
ons.
2.4
Deb
tor I
nfor
mat
ion
Syst
emN
/AIn
form
atio
n av
aila
ble
in m
embe
rs’ b
ook.
No
sign
ifi ca
nt im
pedi
men
ts.
2.5
Dep
osit
Insu
ranc
eN
/AN
/APo
tent
ially
a c
once
rn.
2.6
Cus
tom
er C
ompl
aint
Res
olut
ion
N/A
N/A
No
sign
ifi ca
nt im
pedi
men
ts.
3. P
rude
ntia
l Sup
ervi
sion
3.1
Sou
ndne
ss R
atin
g Sy
stem
PP &
Dec
ree
Impl
icitl
y us
es C
AM
EL &
sim
ple
ratin
g sy
stem
No
sign
ifi ca
nt im
pedi
men
ts.

Improving Access to Financial Services in Indonesia190
Annexes
3.2
Cap
ital A
dequ
acy
Ratio
sN
/AN
one,
but
sho
uld
‘rem
ain
unch
ange
d ov
er ti
me’.
Prud
entia
lly w
eak,
but
no
sign
ifi ca
nt im
pedi
men
ts
for M
SMEs
.
3.3
Lega
l Len
ding
Lim
itsN
/ALi
mits
are
dec
ided
by
the
Boar
d.Pr
uden
tially
wea
k bu
t no
sign
ifi ca
nt im
pedi
men
ts
for M
SMEs
.
3.4
Ass
et Q
ualit
yD
ecre
eSc
orin
g sy
stem
for M
embe
rs’ L
oans
/Ttl
Loan
s; N
PLs;
and
Ba
d de
bts/
NPL
s
Loan
s to
mem
bers
mus
t be
>60%
of T
tl lo
ans.,
but
no
real
impe
dim
ent
to
MSM
Es.
3.5
Loan
Loss
Pro
visi
onin
gN
/ASc
orin
g sy
stem
for L
oan
Loss
Pro
visi
ons/
NPL
s.Pr
uden
tially
wea
k bu
t no
sign
ifi ca
nt im
pedi
men
t.
3.6
Sta
tuto
ry R
eser
ves
N/A
N/A
N/A
3.7
Cre
dit P
olic
yPP
Mus
t uph
old
good
lend
ing
polic
ies
by fe
asib
ility
as
sess
men
t & re
paym
ent c
apac
ity.
No
sign
ifi ca
nt im
pedi
men
ts.
3.8
Goo
d Co
rpor
ate
Gov
erna
nce
N/A
Impl
icit
in p
oint
1.3
abo
ve.
No
sign
ifi ca
nt im
pedi
men
ts.
3.9
Qua
lifi c
atio
ns o
f Aud
itors
Unc
lear
Cove
rs q
ualifi
cat
ions
& a
ppoi
ntm
ents
of ‘
Soun
dnes
s Ev
alua
tors
’.N
o si
gnifi
cant
impe
dim
ents
.
4. P
ricin
g of
Pro
duct
s
4.1
On
Dep
osits
PP &
Dec
ree
Sets
met
hod
of d
istr
ibut
ing
‘Rew
ards
’ , to
tal o
f whi
ch is
de
cide
d by
the
Boar
d.
No
sign
ifi ca
nt im
pedi
men
ts.
4.2
On
Lend
ing
Dec
ree
Rate
s &
fees
dec
ided
by
Boar
d. P
rovi
des
optio
ns fo
r de
term
inin
g ra
tes.
No
sign
ifi ca
nt im
pedi
men
ts.
5. S
ervi
cing
of P
rodu
cts
5.1
On
Dep
osits
PP &
Dec
ree
Mai
n de
fi niti
ons;
inte
rest
rate
s pa
id to
mem
bers
mus
t be
high
er th
an o
ther
s.N
o si
gnifi
cant
impe
dim
ents
.
5.2
On
Lend
ing
PP &
Dec
ree
Defi
nes
le
ndin
g pr
iorit
ies;
m
atur
ities
; an
d co
llate
ral
requ
irem
ents
.N
o si
gnifi
cant
impe
dim
ents
.
5.3
Taxa
tion
of In
tere
st o
n D
epos
itsD
ecre
eN
o w
ithho
ldin
g ta
x on
inte
rest
inco
me
<Rp2
40,0
00/
mon
thN
o si
gnifi
cant
impe
dim
ents
.
5.4
Est
ablis
hing
Bra
nch
Offi
ces
Min
iste
ria
l D
ecis
ion
Min
imum
tim
e be
fore
ope
ning
, and
min
imum
equ
ity,
wor
king
cap
ital &
mem
bers
.M
inim
um ti
me
look
s to
o re
stric
tive.

191
Annexes
5.5
Fun
ding
Law
25/
1992
&
PP
Allo
ws
fund
ing
from
wid
e ra
nge
of s
ourc
es.
No
sign
ifi ca
nt im
pedi
men
ts.
5.6
Pla
cem
ent
PP &
Dec
ree
Allo
ws
exce
ss li
quid
ity to
be
plac
ed in
wid
e ra
nge
of
inst
rum
ents
.N
o si
gnifi
cant
impe
dim
ents
.
6. E
xerc
isin
g Cl
aim
s &
Rem
edie
s
6.1
Deb
t Res
truc
turin
gD
ecre
eW
ays
of d
ealin
g w
ith lo
an d
efau
lts, i
nclu
ding
re
sche
dulin
g &
sal
e of
col
late
ral
Odd
that
writ
e-off
s a
re a
n op
tion
with
no
LLPs
; no
sign
ifi ca
nt im
pedi
men
ts f
or M
SMEs
6.2
Deb
t For
give
ness
See
6.1
See
6.1
See
6.1
6.3
Exe
cutio
n of
Col
late
ral
See
6.1
See
6.1
See
6.1
7. In
dust
ry S
truc
ture
7.1
Sin
gle
Pres
ence
Pol
icy
N/A
N/A
N/A
7.2
Mer
gers
, Acq
uisi
tions
& C
onso
lidat
ion
PPG
ives
the
Min
iste
r the
righ
t to
inte
rven
e if
a co
op’s
oper
atio
ns b
ecom
e un
sust
aina
ble.
Be
ars
no re
latio
n to
sou
ndne
ss ra
ting,
but
no
sign
ifi ca
nt im
pedi
men
t to
MSM
Es
7.3
Sup
ervi
sory
Act
ions
: Liq
uida
tion
PPM
inis
ter o
r the
Boa
rd m
ay li
quid
ate
a co
op.
Rare
that
pro
blem
coo
pera
tives
are
iden
tifi e
d by
a
supe
rvis
ion.
No
impe
dim
ent o
r MSM
Es.
7.4
Pro
tect
ion
of C
oope
rativ
esLa
w 2
5/19
92Pr
ovis
ion
for c
erta
in a
ctiv
ities
to b
e m
anag
ed o
nly
by
coop
s.Po
tent
ially
pro
blem
atic
for M
SMEs
.
1/ D
etai
ls g
ener
ally
ava
ilabl
e up
on re
ques
t fro
m b
ackg
roun
d st
udy.

Improving Access to Financial Services in Indonesia192
Annexes
An
ne
x N
: S
um
ma
ry o
f R
eg
ula
tory
Fra
me
wo
rk f
or
Fin
an
ce C
om
pa
nie
s, W
ith
Att
en
tio
n t
o I
ssu
es
of
Acc
ess
Regu
latio
ns C
once
rnin
gAu
thor
ity 1
/Su
mm
ary
of M
ain
Cont
ent
Not
es o
n Im
plic
atio
ns fo
r poo
rer h
ouse
hold
s an
d M
SMEs
1. E
ntry
into
Indu
stry
1.1
Min
imum
Cap
ital R
equi
rem
ents
MoF
Dec
ree
In 2
006,
min
imum
cap
ital i
ncre
ased
dra
stic
ally
(by
10x
or
mor
e) to
forc
e co
nsol
idat
ion.
For c
oops
, min
. cap
ital r
equi
rem
ent a
re h
alf r
egul
ar. N
o en
try
from
199
5-20
00 a
nd 2
002-
2006
..
1.2
Ow
ners
hip
Requ
irem
ents
MoF
Dec
ree
Indo
nesi
ans
or jo
int v
entu
res
(up
to 8
5% fo
reig
n).
Not
hing
sig
nifi c
ant.
1.3
Man
agem
ent R
equi
rem
ents
MoF
Dec
ree
Not
on
blac
k lis
ts; (
limite
d) e
xper
ienc
e ne
eded
. Spe
cial
pr
oces
s fo
r Sha
ria.
Not
hing
sig
nifi c
ant.
1.4
Fit
& Pr
oper
Test
sM
oF D
ecre
eRe
quire
d of
Dire
ctor
s, Co
mm
issi
oner
s &
Bra
nch
Man
ager
sN
othi
ng s
igni
fi can
t.
1.5
Ris
k M
anag
emen
t Cer
tifi c
atio
nN
/AN
/AN
/A
1.6
Com
plia
nce
Dire
ctor
N/A
N/A
Look
s da
nger
ous,
but d
oes
not a
ff ect
MSM
Es.
2. A
sym
met
ric In
form
atio
n
2.1
Kno
w Y
our C
usto
mer
(KYC
)M
oF D
ecre
eTi
ghte
ned
up re
cent
ly. S
ome
area
s (e
.g.,
leas
ing)
requ
ire a
ta
xpay
er n
umbe
r.Re
quire
men
t for
tax
num
ber m
ay h
inde
r acc
ess
for t
he
poor
.
2.2
Tra
nspa
renc
y of
Fin
ance
sM
oF D
ecre
eRe
quire
s tim
ely
publ
icat
ion
of c
onde
nsed
bal
ance
she
et
and
P&L
stat
emen
t.D
oubt
ful e
ff ect
iven
ess
for p
oor b
ecau
se o
f low
fi n
anci
al li
tera
cy.
2.3
Tra
nspa
renc
y in
Pro
duct
s N
/AN
/AM
ore
the
impo
rtan
t tha
n Fi
nanc
ial T
rans
pare
ncy
for
the
poor
.
2.4
Deb
tor I
nfor
mat
ion
Syst
emN
/AN
/AN
ot s
igni
fi can
t for
MSM
Es.
2.5
Dep
osit
Insu
ranc
eN
/AN
/AN
/A
2.6
Cus
tom
er C
ompl
aint
Res
olut
ion
N/A
N/A
N/A
3. P
rude
ntia
l Sup
ervi
sion
3.1
Sou
ndne
ss R
atin
g Sy
stem
N/A
Som
e lim
ited
over
sigh
t of b
orro
win
gs b
y BI
.N
o si
gnifi
cant
impe
dim
ents
.
3.2
Cap
ital A
dequ
acy
Ratio
sM
oF D
ecre
eN
et W
orth
of 5
0% o
f pai
d-up
cap
ital.
No
sign
ifi ca
nt im
pedi
men
ts.
3.3
Lega
l Len
ding
Lim
itsN
/AN
/A; a
mat
ter o
f int
erna
l cor
pora
te ri
sk p
olic
y.N
/A
3.4
Loan
Loss
Pro
visi
onin
gM
oF D
ecre
eN
/A e
xcep
t for
Lea
sing
com
pani
es, w
hich
has
a m
axim
um
dedu
ctio
n ag
ains
t inc
ome.
No
sign
ifi ca
nt im
pedi
men
ts.
3.5
Sta
tuto
ry R
eser
ves
N/A
N/A
N/A
3.6
No
On-
site
Insp
ectio
nsN
/AD
irect
ove
rsig
ht o
nly
whe
n th
ere
is in
dica
tion
of n
on-
com
plia
nce.
Look
s da
nger
ous,
but d
oesn
’t hi
nder
MSM
Es.
4. P
ricin
g of
Pro
duct
sM
oF D
ecre
eSo
me
limits
on
leas
ing;
non
e ot
herw
ise.
No
sign
ifi ca
nt im
pedi
men
ts.
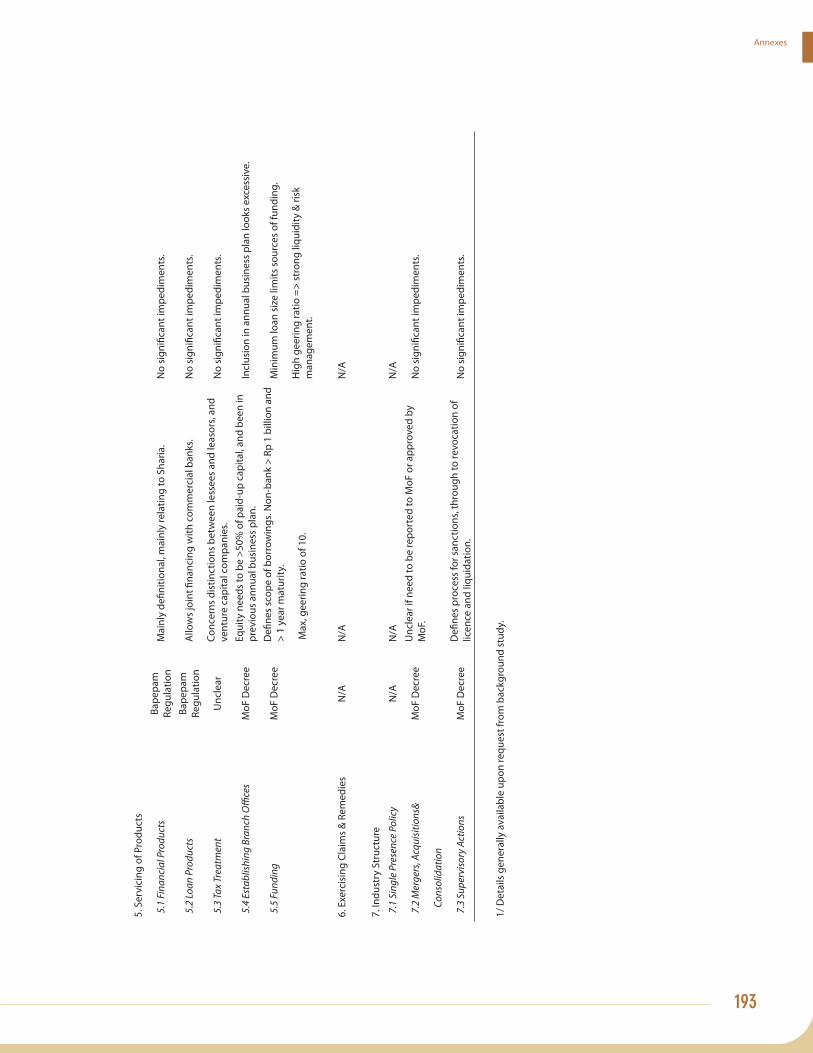
193
Annexes
5. S
ervi
cing
of P
rodu
cts
5.1
Fin
anci
al P
rodu
cts
Bape
pam
Re
gula
tion
Mai
nly
defi n
ition
al, m
ainl
y re
latin
g to
Sha
ria.
No
sign
ifi ca
nt im
pedi
men
ts.
5.2
Loan
Pro
duct
sBa
pepa
m
Regu
latio
nA
llow
s jo
int fi
nan
cing
with
com
mer
cial
ban
ks.
No
sign
ifi ca
nt im
pedi
men
ts.
5.3
Tax
Trea
tmen
tU
ncle
arCo
ncer
ns d
istin
ctio
ns b
etw
een
less
ees
and
leas
ors,
and
vent
ure
capi
tal c
ompa
nies
.N
o si
gnifi
cant
impe
dim
ents
.
5.4
Est
ablis
hing
Bra
nch
Offi
ces
MoF
Dec
ree
Equi
ty n
eeds
to b
e >5
0% o
f pai
d-up
cap
ital,
and
been
in
prev
ious
ann
ual b
usin
ess
plan
.In
clus
ion
in a
nnua
l bus
ines
s pl
an lo
oks
exce
ssiv
e.
5.5
Fun
ding
MoF
Dec
ree
Defi
nes
sco
pe o
f bor
row
ings
. Non
-ban
k >
Rp 1
bill
ion
and
> 1
year
mat
urity
.M
inim
um lo
an s
ize
limits
sou
rces
of f
undi
ng.
Max
, gee
ring
ratio
of 1
0.H
igh
geer
ing
ratio
=>
stro
ng li
quid
ity &
risk
m
anag
emen
t.
6. E
xerc
isin
g Cl
aim
s &
Rem
edie
sN
/AN
/AN
/A
7. In
dust
ry S
truc
ture
7.1
Sin
gle
Pres
ence
Pol
icy
N/A
N/A
N/A
7.2
Mer
gers
, Acq
uisi
tions
&M
oF D
ecre
eU
ncle
ar if
nee
d to
be
repo
rted
to M
oF o
r app
rove
d by
M
oF.
No
sign
ifi ca
nt im
pedi
men
ts.
C
onso
lidat
ion
7.3
Sup
ervi
sory
Act
ions
MoF
Dec
ree
Defi
nes
pro
cess
for s
anct
ions
, thr
ough
to re
voca
tion
of
licen
ce a
nd li
quid
atio
n.N
o si
gnifi
cant
impe
dim
ents
.
1/ D
etai
ls g
ener
ally
ava
ilabl
e up
on re
ques
t fro
m b
ackg
roun
d st
udy.

Improving Access to Financial Services in Indonesia194
References
Asia Pacifi c Economic Cooperation. 2002. “Profi les of SMEs and SME Issues in APEC, 1999-2000”, Report of the APEC Small and Medium Enterprises Working Group, World Scientifi c Publishing.
Ashraft, N., D. Karlin and W Lin. 2006. “Tying Odysseus to the Mast: Evidence from a Commitment Savings Product in the Philippines”. Quarterly Journal of Economics, 121(2): 673-697.
Asian Development Bank. 2007. “Low Income Households’ Access to Financial Services.”
. 2000. “Rural Financial Markets in Asia: Policies, Paradigms and Performance.”
Bank Indonesia and GTZ under Project ProFI. 2000. “Legislation, Regulation and Supervision of Microfi nance Institutions in Indonesia.” Jakarta, Indonesia.
Bank Indonesia. 2004. Annual Report
. 2005. “Results of Study of Micro, Small and Medium Businesses (MSMEs) Profi le”.
. 2007. Annual Report.
. 2008. “Laporan Survei Nasional Pola Remitansi TKI Tahun 2008”. Bureau of Balance of Paymen, Directorate of Statistics and Monetary, Jakarta, Indonesia.
Beck, T., A. Demirguc-Kent and S. Martinez Peria. 2004. “Finance, Inequality and Poverty: Cross-country Evidence.” Policy Research Working Paper 3338. World Bank, Washington, D.C.
. 2005. “Reaching Out: Access to and Use of Banking Services across Countries.” Policy Research Working Paper 3754. World Bank, Washington, D.C.
. 2006. “Banking Services for Everyone? Barriers to Bank Access around the World.” Policy Research Working Paper 4079. World Bank, Washington, D.C.
Binhadi, 1995. “Financial Sector Deregulation, Banking Development and Monetary Policy: The Indonesian Experience, 1983-1993.” Institut Bankir Indonesia, Jakarta.
Cole, David C. and B. F. Slade, “Building a Modern Financial System; The Indonesian Experience”Cambridge University Press
CGAP, IFC, and GTZ. 2009. “Diagnostic Report on the Legal and Regulatory Environment for Branchless Banking in Indonesia”. Notes on Regulation of Branchless Banking in Indonesia
Claessens, S. 2005. “Access to Financial Services: a Review of the Issues and Public Policy Objectives”. Policy Research Working Paper Series, the World Bank, Washington, D.C.
Conroy, John D. 2008. “Financial Inclusion, A new microfi nance initiative for APEC”. The Foundation for Development Cooperation, presented at Microfi nance Workshop, the APEC Business Advisory Council, Jakarta, Indonesia, 23 January 2008.
GTZ. 2001. “ProFi Microfi nance Institutions Study”, in cooperation with Bank Indonesia.

195
. “Regulation, Supervision & Support of Non-Bank, Non-Cooperative Micro-Finance Institutions”, prepared by ProFi in cooperation with Bank Indonesia and the Ministry of Finance.
. 2007. “Complementing Microfi nance Services in Indonesia Through Providing Microinsurance”, GTZ Promotion of Small Financial Institutions (ProFI) project, Jakarta, Indonesia.
Haggard, Stephan. 2000. “The Political Economy of the Asian Financial Crisis.” Institute for International Economics, Washington, D.C.
Hanson, J. 2009. “Indonesian Banks: Major Issues and Policies in the International Financial Tsunami”, World Bank mimeo.
Johnston, Don, Jr. and Jonathan Morduch. 2007. “Microcredit and Microsaving: Evidence from Indonesia”, with support from USAID, the Ford Foundation and the Gates Foundatiom. Draft dated March 12, 2007.
. 2008. “The Unbanked: Evidence from Indonesia”. Oxford University Press.
Ledgerwood, J. 1998. “Microfi nance Handbook: An Institutional and Financial Perspective”. World Bank, Washington D.C.
Lyman, T., David Porteous, and Mark Pickens. 2008. “Regulating Transformational Branchless Banking: Mobile Phones and Other Technology to Increase Access to Finance.” CGAP Focus Note 43. Washington, D.C.
Manning, C. 2000. “Labour Market Adjustment to Indonesia’s Economic Crisis: Context, Trends and Implications”, Bulletin of Indonesian Economic Studies, 36(1), 2000, 103-36.
and M. Cronin. 2008. “Indonesia’s Interests in Labour Services at International Trade Negotiations”. A report funded by AusAID for the Ministry of Trade and the Ministry of Finance in Indonesia.
Organization for Economic Cooperation and Development. 2008. “Indonesia Economic Assessment”. OECD Economic Surveys. Paris.
Schwarz, Adam. 1994. “A Nation in Waiting; Indonesia in the 1990s.” Westview Press, Boulder and San Francisco.
Skully, M.T. 1994. “The Development of the Pawnshop Industry in East Asia.” The Mansholt Graduate School of Social Studies, The Netherlands.
World Bank. 1993. “The East Asian Miracle”. New York: Oxford University Press.
. 2001. “Rethinking the East Asian Miracle”. New York: Oxford University Press.
. 2004. “Brazil: Access to Financial Services”, World Bank Report No. 27773-BR.
. 2005. “AML/CFT Regulation: Implications for Financial Services Providers That Serve Low Income People”, CGAP, Focus Note No. 29
. 2006a. “East Asian Finance: The Road to Robust Markets”, Washington, D.C.
. 2006b. “Unlocking Indonesia’s Domestic Financial Resources: The Role of Non-Bank Financial Institutions”, Poverty Reduction and Economic Management, Finance and Private Sector Development, Indonesia Country Management Unit.

Improving Access to Financial Services in Indonesia196
. 2006c. “Improving Access to Finance for India’s Rural Poor”, Washington, D.C.
. 2006d. “Revitalizing the Rural Economy: An assessment of the investment climate faced by non-farm enterprises at the District level” Consultative Draft, the World Bank Offi ce Jakarta.
. 2006d. “Strengthening Pensions and Insurance Markets in Indonesia”. Proceedings of an International Workshop, Jakarta March 21-22, 2006, the Ministry of Finance and the World Bank.
. 2006e. “Making the New Indonesia Work for the Poor”, The World Bank Offi ce, Jakarta.
. 2007a. “Access to Finance and Economic Growth in Egypt”, the World Bank, Washington, D.C.
. 2007b. “Access to Financial Services in Nepal”, the World Bank, Washington, D.C.
. 2008a. “The Malaysia-Indonesia Remittance Corridor: Making Formal Transfers the Best Option for Women and Undocumented Migrants”. World Bank Working Paper 149. Washington, D.C.
. 2008b. “Investing in Indonesia’s Health: Challenges and Opportunities for Future Public Spending.” Health Public Expenditure Review. The World Bank Offi ce Jakarta.
. 2008c. “The Study on State-Owned Pawn Company: Perum Pegadaian, Their role of improving access to fi nance”, PowerPoint presentation to the World Bank Country Offi ce in Jakarta, dated October 22, 2008.
. 2008d. “Finance for All: Policies and Pitfalls in Expanding Access”. World Bank Policy Research Report, the World Bank, Washington, D.C.
. 2009a. “Access to Finance in Nigeria: Microfi nance, Branchless Banking and SME Finance”, CGAP, World Bank, Washington D.C.
. 2009b. “Bringing Finance to Pakistan’s Poor, Access to Finance for Small Enterprise and the Underserved”, World Bank, Washington, D.C.
. 2009c. “Banking the Poor, Measuring Access in 54 Economies”, World Bank, Washington, D.C.