Embed Size (px)
Citation preview
Supplier performance
MSc Thesis Management studies
Ruud Coppens
July 2014
An advice on the improvement of
supplier performance
Supplier performance An advice on the improvement of supplier performance
“If you cannot measure it, you cannot
manage it” (Garvin, 1993)
MSc Thesis Management studies
Ruud Coppens 890220162130
June 2014
Supervisors:
Prof. Dr. J. Trienekens, Professor in Chain and Network Management, Wageningen University Prof. Dr. P. van Beek, Em., Professor in Operational Research and Logistics, Wageningen University
Commissioner:
H. Jacobs, manager production and logistics, Vencomatic
II
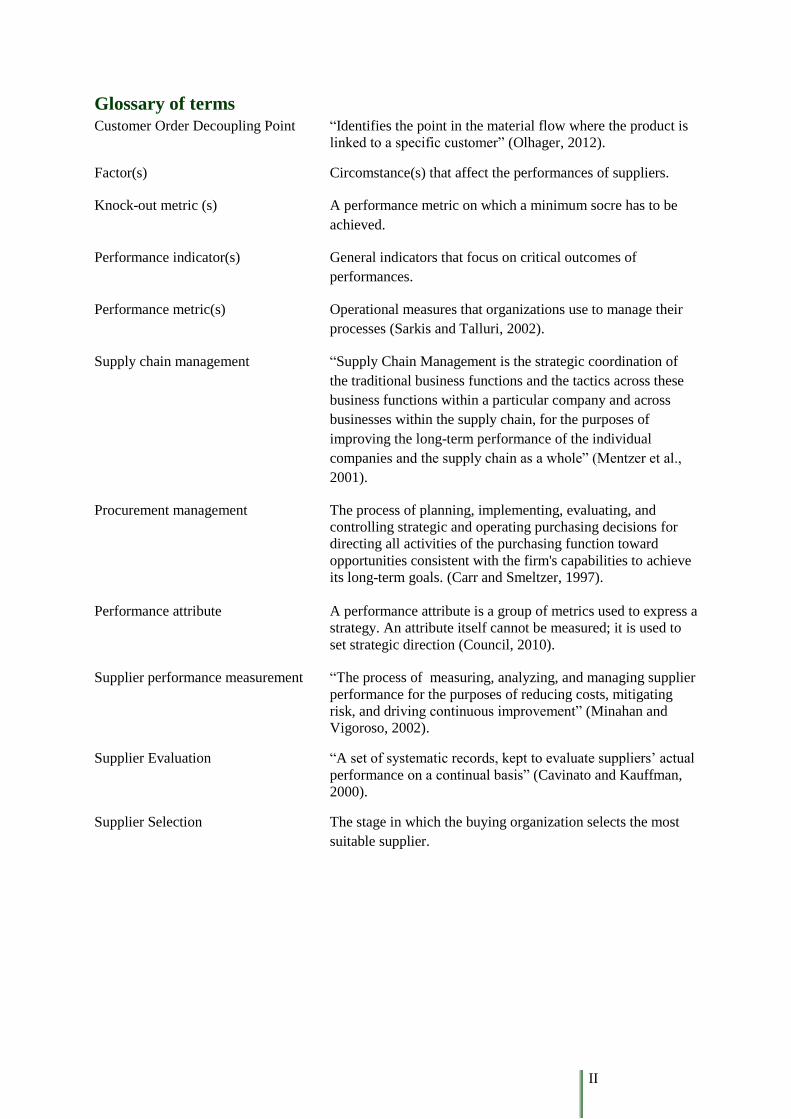
Glossary of terms Customer Order Decoupling Point “Identifies the point in the material flow where the product is
linked to a specific customer” (Olhager, 2012).
Factor(s) Circomstance(s) that affect the performances of suppliers.
Knock-out metric (s) A performance metric on which a minimum socre has to be
achieved.
Performance indicator(s) General indicators that focus on critical outcomes of
performances.
Performance metric(s) Operational measures that organizations use to manage their
processes (Sarkis and Talluri, 2002).
Supply chain management “Supply Chain Management is the strategic coordination of
the traditional business functions and the tactics across these
business functions within a particular company and across
businesses within the supply chain, for the purposes of
improving the long-term performance of the individual
companies and the supply chain as a whole” (Mentzer et al.,
2001).
Procurement management The process of planning, implementing, evaluating, and
controlling strategic and operating purchasing decisions for
directing all activities of the purchasing function toward
opportunities consistent with the firm's capabilities to achieve
its long-term goals. (Carr and Smeltzer, 1997).
Performance attribute A performance attribute is a group of metrics used to express a
strategy. An attribute itself cannot be measured; it is used to
set strategic direction (Council, 2010).
Supplier performance measurement “The process of measuring, analyzing, and managing supplier
performance for the purposes of reducing costs, mitigating
risk, and driving continuous improvement” (Minahan and
Vigoroso, 2002).
Supplier Evaluation “A set of systematic records, kept to evaluate suppliers’ actual
performance on a continual basis” (Cavinato and Kauffman,
2000).
Supplier Selection The stage in which the buying organization selects the most
suitable supplier.
III
Abstract In this study a research is performed on the factors that have an influence on the performances of
suppliers. The aim of this study was to create insight in the performance of the suppliers and come up
with an advice on the improvement of supplier performance.
An extensive literature study is executed to create insight in the factors that influence the
performance of suppliers. By conducting a literature study on different subjects, like: supply chain
management, procurement management, buyer-supplier relationship and supplier performance, insight
is created in the aspects that influence the performance of suppliers. The outcome of the literature
study suggests supplier selection and evaluation can create insight in the performances of suppliers
and potentially increase them. During the empirical part of this study, interviews are conducted to
establish performance metrics to select and evaluate suppliers in order to create insight in their
performances.
The results of this case study show that the product type, supplier characteristics and the
relationship with the supplier determine the procurement strategy that should be applied by the buying
organization. Different procurement strategies emphasize different performance metrics, which are
defined by discussion with internal stakeholders and suppliers.
Suppliers stated to perform worst on the metrics regarding quick ratio and research and
development. Additionally, suppliers stated to perform best on the metrics technical capability and
management and organization. Assessment of the suppliers showed that the performance of the
suppliers on delivery performance are considerably lower as stated on forehand by the suppliers
themselves.
Key words: Supplier(s), Supplier(s) performance, Performance(s) metric(s), Performance attribute(s),
Performance indicator(s),Supplier performance metric(s), Supplier selection, Supplier evaluation,
Product type, Supplier characteristic(s), Supplier relation(s), Procurement strategy.
IV
Preface In the past six months I have been conducting this Master thesis in the field of supplier performance.
This thesis is part of my Master in: Management, Economics and Consumer studies which I pursued in
the last two years. The thesis is performed at the chair group Management studies of Wageningen
University and the organization Vencomatic.
Vencomatic, is an internationally operating organization with a product portfolio containing a full
range of products for the modern poultry farm. This organization provided a subject for my master
thesis about supplier performanceses. The research focused on the performances of the suppliers of
Vencomatic and how to imporve them. By conducting interviews with internal stakeholders as well as
with suppliers, insight was created in the focus of the suppliers and Vencomatic regarding these
performances.
During this research I have had valuable guidance and support of several persons. I am very
thankful for the opportunity the chair group of Wageningen University and Vencomatic provided me,
to enrich my knowledge within this field of study. Foremost, I would like to thank my commisioner H.
Jacobs and suppervisors Prof. Dr. J. Trienekens and Prof. Dr. P. van Beek, Em., for their supervision
and solid advice during the research process.
Additionally, I would like to thank my parents and girlfriend in motivating, supporting and
helping me whenever necessary.
Finally, I would like to thank all the stakeholders who provided me with valuable information
during the interviews.
Ruud Coppens
June, 2014
Wageningen
V
Management summary As a consequence of globalization, organizations need to deliver an increasingly high level of
performance. The performances on which the organization is not able to deliver in line with the
requirements of the client, should be outsourced. In line with this development and the trend of
focussing on the core activities, the level of procured products at organizations increased. As a
consequence, dependency on suppliers enlarged. This puts the focus on supplier performances since
the results of the organization are directly depending on it.
This study is conducted on behalf of Vencomatic, a supplier of equipment related to poultry
farms. In this study a number of performance metrics were developed to improve the performances of
the suppliers of Vencomatic. The performance metrics were determined in order to select new
suppliers and to evaluate current suppliers on their performances. The latter purpose is also carried out
within this study.
Literature showed the performances of a supplier, measured by the buying organization, are
directly related to the procurement strategy that is applied by this organization. Determination of the
procurement strategy that should be applied by the buying organization is based on a number of
factors that influence this procurement strategy. These factors are in the form of: supplier
characteristics, product type and relationship.
Three different elements of supplier characteristics can be defined. Culture (1) determines the
values which are handled within an organization. The technology (2) determines if the supplier is
capable of meeting the technical requirements of the buying organization. Both the culture and the
technology influence the relationship (3) the buying organization has with the supplier.
The product type influences the procurement strategy applied by the buying organization since
different products put emphasis on different performances of the suppliers. Four different types of
items are differentiated in this study, in line with the Kraljic matrix. The non-critical items (1)
emphasize product standarization and therefore price is an important aspect. Leverage items (2)
require optimum order volumes and allow the buying organization to exploit buying power.
Bottleneck items (3) are crucial for the buying organization since the supply chain risk of these
products is high. Because of this essence for the buying organization, backup plans need to be
conducted. Strategic items (4) demand accurate forecast and long-term relationships, since these items
are valuable and hard to procure.
Furthermore, the relationship between the buying organization and the supplier is of influence on
the procurement strategy that will be applied by the buying organization. This relationship is
determined by the level of trust the buying organization has towards the supplier. The level of trust the
buying organization has, directly influences commitment of the supplier towards the buying
organization.
Besides analyzing literature, research has been performed on performance metrics used for
creating insight in the performances of suppliers. The performance metrics of the SCOR-model and
the selection criteria defined by Dickson were best applicable in the case of Vencomatic. Though,
literature stated that no list is directly applicable and each organization should decide upon this list
themselves. In line with this statement, a number of interviews are organized. These intervieuws are
held with employees of Vencomatic, internal stakeholders, comparable organizations and suppliers to
ensure all these different parties agreed upon the formulated performance metrics.
VI
Additionally, different suppliers are assessed on the performance metrics to create insight in the
performances of the suppliers of Vencomatic. The results of these assessments showed the
performances of the suppliers regarding quick ratio and the level of investments in research and
development did not cope with the demands of Vencomatic. Although these performances did not
cope with the requirements of Vencomatic, it is very hard for Vencomatic to influence these
performances. This is due to the fact that the financial health and the level of investment in research
and development done by a supplier cannot directly be affected by a buying organization. Consulting
internal information on the delivery performance of the supplier showed that the suppliers stated
higher performances than they actually delivered.
To improve the performances of the suppliers of Vencomatic, a number of recommendations are
formulated. These recommendations are based on the interviews held with the different stakeholders,
comparable organizations and employees and suppliers of Vencomatic.
In total six recommendations are formulated. First, the procurement strategy has to be defined to
create clarity on the requirements regarding the supplier. Next, supplier selection should be applied to
come up with the supplier that is best able to meet the requirements of Vencomatic. By assessing
potential suppliers, insight in the performances is increased and therefore the newly selected suppliers
will be better able to meet the demands from Vencomatic. Subsequently, communication towards the
supplier has to be clear in order to ensure the supplier knows what the demands of Vencomatic are. By
clear and frequent communication, shortcomings can be observed timely and actions can be
undertaken. Fourth, supplier performance measurement should be applied to create insight in whether
the supplier is capable of meeting the requirements of Vencomatic. Furthermore, if the suppliers do
not meet the agreed performances, it should be clear which actions can be undertaken and by whom.
These consequences should be clear for the employees of Vencomatic as well as for its suppliers. Last,
cooperation with suppliers should be more structured and the procurement strategy applied should be
taken into account.
VII
Table of Contents
Glossary of terms .................................................................................................................................. II
Abstract ................................................................................................................................................ III
Preface .................................................................................................................................................. IV
Management summary .........................................................................................................................V
1. Introduction ............................................................................................................................. - 1 -
1.1. Problem analysis.................................................................................................................. - 1 -
1.2. Case description .................................................................................................................. - 2 -
1.3. Research objective ............................................................................................................... - 3 -
1.4. Research question ................................................................................................................ - 3 -
2. Supply Chain Management .................................................................................................... - 4 -
2.1. Supplier characteristics ........................................................................................................ - 6 -
2.1.1. Culture ......................................................................................................................... - 6 -
2.1.2. Technology .................................................................................................................. - 6 -
2.1.3. Relationship ................................................................................................................. - 6 -
2.2. Customer Order Decoupling Point ...................................................................................... - 6 -
3. Procurement management ..................................................................................................... - 8 -
3.1. Procurement portfolio models ............................................................................................. - 9 -
3.2. Critiques ............................................................................................................................ - 11 -
3.3. Procurement strategies ...................................................................................................... - 11 -
3.4. Procurement portfolio model choice ................................................................................. - 12 -
4. Buyer-supplier relationships ................................................................................................ - 13 -
4.1. Trust .................................................................................................................................. - 13 -
4.2. Commitment ...................................................................................................................... - 13 -
4.3. Relationship strategy ......................................................................................................... - 14 -
5. Supplier performance ........................................................................................................... - 16 -
5.1. Supplier selection .............................................................................................................. - 16 -
5.1.1. Problem definition phase ........................................................................................... - 16 -
5.1.2. Criteria definition phase ............................................................................................ - 16 -
5.1.3. Pre-qualification suppliers phase ............................................................................... - 18 -
5.1.4. Final choice phase ..................................................................................................... - 19 -
5.2. Supplier evaluation ............................................................................................................ - 21 -
5.2.1. Preparation stage ....................................................................................................... - 21 -
5.2.2. Evaluation stage ........................................................................................................ - 22 -
5.2.3. Feedback stage .......................................................................................................... - 22 -
VIII
5.3. Supplier development program ......................................................................................... - 23 -
5.4. Conclusion ......................................................................................................................... - 24 -
6. Conclusion literature study .................................................................................................. - 25 -
7. Theoretical framework ......................................................................................................... - 26 -
8. Methodology .......................................................................................................................... - 29 -
8.1. Research design ................................................................................................................. - 29 -
8.2. Data sources ...................................................................................................................... - 29 -
8.2.1. Literature ................................................................................................................... - 29 -
8.2.2. Interviews .................................................................................................................. - 29 -
8.2.3. Discussions ................................................................................................................ - 31 -
8.2.4. Additional data sources ............................................................................................. - 32 -
8.3. Case study stages ............................................................................................................... - 32 -
8.4. Validity .............................................................................................................................. - 37 -
8.5. Reliability .......................................................................................................................... - 38 -
9. Determination of performance metrics ............................................................................... - 39 -
9.1. Formulation performance metrics ..................................................................................... - 39 -
9.1.1. Literature study .......................................................................................................... - 39 -
9.1.2. Case studies ............................................................................................................... - 39 -
9.1.3. Interviews comparable organizations ........................................................................ - 40 -
9.1.4. Interviews employees of Vencomatic ....................................................................... - 40 -
9.2. Proposed performance metrics .......................................................................................... - 41 -
9.3. Final performance metrics ................................................................................................. - 41 -
10.3.1. Finalizing performance metrics internal stakeholders ............................................... - 41 -
10.3.2. Finalizing performance metrics suppliers.................................................................. - 41 -
9.4. Weights .............................................................................................................................. - 43 -
10. Supplier assessment .............................................................................................................. - 44 -
10.1. Kraljic matrix ................................................................................................................ - 44 -
10.2. Assessing suppliers on performance metrics ................................................................. - 45 -
10.2.1. Supplier performances delivered to Vencomatic....................................................... - 45 -
10.2.2. Analysing scores ........................................................................................................ - 46 -
10.2.3. Data from the database of income inspection ............................................................ - 49 -
10.2.4. Conclusion on the performances of the suppliers ...................................................... - 51 -
10.3. Decision making ............................................................................................................ - 52 -
11. Supplier performance improvement ................................................................................... - 55 -
11.1. Supplier performance improvement .............................................................................. - 55 -
11.1.1. Strategic items ........................................................................................................... - 55 -
IX
11.1.2. Bottleneck items ........................................................................................................ - 55 -
11.1.3. Leverage items .......................................................................................................... - 56 -
11.1.4. Non-critical items ...................................................................................................... - 56 -
11.1.5. Conclusion improvement performances suppliers .................................................... - 57 -
11.2. Recommendations ......................................................................................................... - 57 -
12. Discussion ............................................................................................................................... - 60 -
13. Conclusion.............................................................................................................................. - 61 -
References ........................................................................................................................................ - 64 -
Appendices ....................................................................................................................................... - 68 -
Appendix 1 Overview selection criteria .................................................................................... - 69 -
Appendix 2 Multi criteria decision making techniques ........................................................... - 71 -
Appendix 3 Case studies ............................................................................................................. - 73 -
Appendix 4 Interview guide comparable organization ............................................................ - 75 -
Appendix 5 Interviews comparable organizations ................................................................... - 76 -
Appendix 6 Interview guide employees Vencomatic ................................................................ - 81 -
Appendix 7 Interviews employees Vencomatic ........................................................................ - 82 -
Appendix 8 Argumentation performance metrics ................................................................... - 88 -
Appendix 9 Comments internal stakeholders ........................................................................... - 91 -
Appendix 10 Comments suppliers ............................................................................................ - 92 -
Appendix 11 Final performance metrics.................................................................................. - 94 -
Appendix 12 Weighting performance metrics ......................................................................... - 98 -
Appendix 13 Remarks practical determination .................................................................... - 103 -
Appendix 14 Kraljic matrix all product groups Vencomatic ............................................... - 105 -
Appendix 15 Selection suppliers included in the study ......................................................... - 106 -
Appendix 16 Overview information suppliers included in the study .................................. - 108 -
X
Figures
Figure 1 Value chain ........................................................................................................................... - 5 -
Figure 2 Kraljic matrix ........................................................................................................................ - 9 -
Figure 3 Relationship strategy ........................................................................................................... - 14 -
Figure 4 Theoretical framework ........................................................................................................ - 26 -
Figure 5 Stages of supplier selection and -evaluation: ...................................................................... - 26 -
Figure 6 'Grando' Breeder housing .................................................................................................... - 33 -
Figure 7 Kraljic matrix 'Grando' breeder housing ............................................................................. - 45 -
Figure 8 Supplier performance .......................................................................................................... - 61 -
Figure 9 Kraljic matrix, product groups Vencomatic ....................................................................... -105 -
XI
Tables
Table 1: Different Procurement strategies ......................................................................................... - 12 -
Table 2: Development of criteria in literature .................................................................................. - 17 -
Table 3: Overview decision techniques final choice phase ............................................................... - 19 -
Table 4: Applicability decision techniques in final choice phase ..................................................... - 20 -
Table 5: Procurement strategy and supplier development program .................................................. - 23 -
Table 6: Overview different related organizations ............................................................................ - 30 -
Table 7: Overview interviewed employees Vencomatic ................................................................... - 31 -
Table 8: Overview internal stakeholders Vencomatic ....................................................................... - 31 -
Table 9: Product groups Vencomatic versus product groups ‘Grando’ breeder housing .................. - 33 -
Table 10: Performance attributes and metrics SCOR model ............................................................ - 34 -
Table 11: Suppliers included in the analysis ..................................................................................... - 35 -
Table 12: Most important outcomes of case studies ......................................................................... - 35 -
Table 13: Most important outcomes of interviews with comparable organizations .......................... - 40 -
Table 14: Most important outcomes of interviews with employees of Vencomatic ......................... - 40 -
Table 15: Processing comments internal stakeholders ...................................................................... - 40 -
Table 16: Processing comments suppliers ......................................................................................... - 40 -
Table 17: Weighting performance attributes and metrics ................................................................. - 43 -
Table 18: Performances of the supplier on the different performance metric ................................... - 46 -
Table 19: Key numbers performance metrics ................................................................................... - 47 -
Table 20: Average scores quadrants Kraljic matrix .......................................................................... - 47 -
Table 21: Delivery performance according to data Vencomatic ....................................................... - 50 -
Table 22: Specification comments database Vencomatic ................................................................. - 51 -
Table 23: Knock-out metrics ............................................................................................................. - 52 -
Table 24: Overview of the quarterly evaluation metrics ................................................................... - 53 -
Table 25: Types of supplier evaluation applied by Vencomatic ....................................................... - 54 -
Tables in Appendices
Table 26: Overview selection criteria................................................................................................ - 70 -
Table 27: Overview defined performance metrics case studies ........................................................ - 74 -
Table 28: Overview final supplier selection metrics ......................................................................... - 97 -
Table 29: Scaling AHP model ........................................................................................................... - 98 -
Table 30: Pair-wise comparison between the different attributes ..................................................... - 98 -
Table 31: Outcome pair-wise comparison between different ............................................................ - 98 -
Table 32: Assigned percentage attributes .......................................................................................... - 99 -
Table 33: Calculation consistency ratio ............................................................................................ - 99 -
Table 34: Random index table .......................................................................................................... - 99 -
Table 35: Outcome pair-wise comparisons ..................................................................................... - 100 -
Table 36: Normalized values and percentage allocation ................................................................. - 101 -
Table 37: Calculation consistency ratio performance metrics......................................................... - 102 -
Table 38: Financial distribution suppliers Vencomatic > €10.000,- ............................................... - 106 -
Table 39: Suppliers ‘Grando’ breeder housing including the turnover with Vencomatic in 2013 .. - 106 -
Table 40: Geographical distribution suppliers Vencomatic > €10.000,- ......................................... - 107 -
Table 41: Geographical distribution suppliers ‘Grando’ breeder housing ...................................... - 107 -
Table 42: Different suppliers of components for the ‘Grando’ breeder housing ............................ - 108 -
- 1 -
1. Introduction In this chapter an introduction is given on the topic of this study. Furthermore, the problem analysis is
proposed including research objective and research questions. A description of the case is provided to
create insight in the context of the study.
1.1. Problem analysis
The word ‘logistics’ was already used by the ancient Greeks and referred to the officers who were in
charge of the financial, supply and distribution belongings. Since the 1960s, business logistics is a
scientific discipline. Nowadays the word logistics refers to the aspect of providing cost and time
effective services including transport, warehousing, inventory, packaging and administrative activities
(Islam et al., 2013). According to Langley et al., in Islam et al., (2013), “logistics management is the
most widely used term and encompasses logistics not only in the private business sector but also in the
public/government and non-profit sector”.
Lambert et al., state that supply chain management is often referred to as the management of
multiple relationships (Svensson, 2003). Additionally Forrester (1958), addresses how the success of
an organization depends on how information, material, money, manpower and capital equipment
interlock on each other. This causes a higher complexity in management decisions regarding the
structure of operations, locating the activities and processes, the power of the different supply chain
members and the collaboration between the supply chain members (Halldorsson et al., 2007).
Therefore organizations seek to develop partnerships and more efficient information links with
partners, which span the traditional boundaries of organizations. The physical distribution of products
becomes more dependent on these information links (Power, 2005). In order to crate in-depth insight
into this topic, it is important to first define one general accepted definition on supply chain
management. The difficulty with supply chain literature is that there is confusing and overlapping
terminology and meanings. According to Burgess et al., (2006) and Naslund and Williamson (2010),
the definition of the supply chain management is unclear. Therefore, Mentzer et al., (2001) (Park et
al., 2013; Burgess et al., 2006) stated a widely used definition:
“Supply Chain Management is the strategic coordination of the traditional business functions
and the tactics across these business functions within a particular company and across businesses
within the supply chain, for the purposes of improving the long-term performance of the individual
companies and the supply chain as a whole”.
It is essential to ensure the alignment the supply chain partner activities with the strategy of the
buying organization. Additionally, the activities should be harmonised with the structure, processes,
culture, incentives and people (Abell, 1999) of the buying organization.
An important part of the supply chain partners are the suppliers. Improvements in the supplier
performance can create significant benefits. It has been shown that a positive relationship between
buyer and supplier increases the supplier logistical performance (Morris and Carter, 2005).
To manage the relationship with the supplier it is important to have insight in the performance of
the supplier. Creating insight in the performance of the suppliers is done by supplier performance
measurement. Referring to the opening statement “If you cannot measure it, you cannot manage it”, it
is suggested that you need to be able to measure performance in order to be able to increase the
performances. Research on the practice how to measure the performance of the suppliers is rather rare
(Schmitz and Platts, 2004). This is strange because, according to Muralidharan et al., (2002), the costs
- 2 -
of the purchased goods and services account for substantial costs of the goods sold by the
organization.
There are different ways to manage the supplier performance. Assessing the potential suppliers
during the selection on a number of criteria should ensure the supplier is able to cope with the
standards applied by the buying organization. This assessment can be seen as the management of the
performances of potential suppliers. A prerequisite for effective supplier selection is the determination
of appropriate performance metrics. Traditionally in academic research: price, quality and delivery
reliability are the most important criteria on which suppliers are assessed (Dickson as stated in Wu,
2010). Depending on the circumstances, factors like technical capability, flexibility and willingness to
work in a collaborative manner can be additional supplier selection criteria (Kannan and Tan, 2006).
Considering supplier selection is a multi-criteria decision problem containing quantitative and
qualitative criteria, there is a need for developing a systematic supplier selection method of identifying
and prioritizing relevant criteria.
Applying supplier selection by making use of performance metrics, enables the buying
organization to gain in the long term on product quality, performance, and availability (Fawcett and
Fawcett; Manson and Morgan as stated in Vonderembse and Tracey, 1999). By good management of
the relationships, the organization can create synergy regarding: product quality, performance and
availability (Kannan and Tan, 2006).
Additionally, the evaluation of the suppliers’ performance is an important aspect. Evaluation
enables managers to focus on priority areas. By the data of evaluation, decisions can be made to
enhance performance, create better relationships by isolating problem areas, provide information to the
senior management and the organizations that perform better than average can be rewarded to
stimulate them even further (Wu, 2010). Evaluating the performances is an important part of supplier
relationship management, to ensure regular interaction between buyer and supplier. This regular
interaction increases the level of trust, respect and improves the performances of the relationship
(Schmitz and Platts, 2004).
1.2. Case description
This study is conducted on behalf of Vencomatic. Vencomatic is part of the Venco group and based in
Eersel, the south of the Netherlands. Vencomatic carries a product portfolio containing the interior of
poultry stables including breeder and broiler housing. Most of the goods used by Vencomatic are not
produced by Vencomatic but are purchased at suppliers. Therefore, Vencomatic makes use of a large
number of suppliers which are located for 75% to 80% in the Netherlands and Belgium. In line with
the stagnating growth of the organization the last years, Vencomatic is now increasingly looking for
suppliers – both on national and international level – who can deliver the same quality products for a
lower price. A number of suppliers of Vencomatic are already located in foreign countries like:
Germany, Italy, England, but also countries like Israel, India, Indonesia and South Africa which
nowadays deliver around 10% of input products. In addition, the main supplier of Vencomatic is
located in Belgium and delivers around 7% of the input products. The percentage of input products is
based on the percentage of the total purchasing amount in Euro’s. The total amount purchased by
Vencomatic in 2013 is around 61 million euro’s.
To ensure the suppliers of Vencomatic are able to cope with the standards of Vencomatic, insight
in the performances of the suppliers needs to be created. This insight will be created by formulating
performance metrics and assessing suppliers to these metrics. The aim of this study is to formulate
performance metrics to assess the suppliers on, create insight in the performances of the suppliers of
Vencomatic and to come up with recommendations to improve the performances of the suppliers.
- 3 -
1.3. Research objective
The research objective of this study is to give recommendations to Vencomatic to further improve the
performances of its suppliers. These recommendations will be formulated by making use of
performance metrics which are used to analyse the performances of the suppliers of Vencomatic. This
study will focus on the formulation of the performance metrics used to assess suppliers on. By
assessing a limited, but representative amount of suppliers to the formulated performance metrics,
useful results and conclusions can be formulated.
1.4. Research question
Vencomatic wants to increase the performance of its suppliers. To increase the efficiency of the
suppliers this study is conducted. First a literature study is conducted to gain insight in which factors
influence the supplier performance. Vonderembse and Tracey (1999), state that supplier selection has
an influence on financial, qualitative, technological, delivery and flexibility (Krause et al., 2000)
performances of the supplier. Considering these quantitative and qualitative aspects, supplier
performance is a multi-dimensional problem. The factors, derived from the different inputs, are
formulated into performance metrics on which suppliers are assessed. By assessing the suppliers,
insight is created in whether the suppliers perform in line with the standards applied by Vencomatic.
By assessing the suppliers, suggestions can be done to improve performances. Finally,
recommendations will be given, which outline how to improve the performances of the suppliers of
Vencomatic.
Main research question:
In what way can Vencomatic improve the performance of its suppliers?
Sub-research questions:
- Which factors do have an influence on the performance of the suppliers?
- What performance metrics can be applied to assess the performances of the suppliers?
- How do the suppliers perform considering the performance metrics?
- How can the performances of the suppliers be improved?
- Which recommendations can be made to improve the performances of the suppliers of
Vencomatic?
- 4 -
2. Supply Chain Management Supply chain management is constantly changing corresponding to the change in competitiveness of
(international) companies. Many organizations have broken down the intra- and inter firm barriers to
reduce uncertainty and enhance control of the supply chain (Gunasekaran et al., 2004). By
cooperation with suppliers, organizations are looking to improve services, technical innovation and
product design. This development is caused by, for example, increasing globalisation and reduced
barriers of international trade (Gunasekaran et al., 2004, Mentzer et al., 2001).
These developments have encouraged the discussion of supply chain management in literature for
many years (Burgess et al., 2006), it has become a comprehensive concept. Increased interest in
supply chain management is caused by organizations who find themselves more frequently heavily
dependent on an effective supply chain (Naslund and Williamson, 2010) to be able to compete in the
global market economy. Lambert et al., in Svensson (2003) states that supply chain management is
often referred to as the management of multiple relationships. Additionally, Forrester (1958) addresses
how the success of an organization depends on how information, material, money, manpower and
capital equipment interlock with each other. Herewith higher complexity is caused in management
decisions regarding the structure of operations, locating the activities and processes, the power of and
the collaboration between supply chain members (Halldorsson et al., 2007). Therefore organizations
seek to develop partnerships and more efficient information links which span the traditional
boundaries of organizations. The physical distribution of goods becomes more dependent on these
information links (Power, 2005). In line with this, performances can no longer be determined by
decisions and actions of a single organization but rather needs to be determined upon the supply chain
as a whole (Naslund and Williamson, 2010).
Considering the breadth of the concept, it is important to have one general accepted definition on
supply chain management. The difficulty in finding such a definition is that within supply chain
literature confusing and overlapping terminology and meanings come across. According to Burgess et
al., (2006) and Naslund and Williamson (2010), the definition of supply chain management is unclear.
In response Mentzer et al., (2001) stated a widely used definition (Park et al., 2013; Burgess et al.,
2006):
“Supply Chain Management is the strategic coordination of the traditional business functions
and the tactics across these business functions within a particular company and across businesses
within the supply chain, for the purposes of improving the long-term performance of the individual
companies and the supply chain as a whole”.
The definition refers to the traditional business functions, which can be described as the core
business of the organization. As stated by Van Weele (2005), the activities in which an organization
cannot offer a world class achievement should be outsourced. In line with the generic strategies of
Porter (Johnson et al., 2012) an organization needs to focus on a few core activities (Prahalad and
Hamel, 2008). Porter developed a model (value chain) which creates insight in all activities of an
organization, including the core activities as well as supporting activities. The value chain (Figure 1)
of Porter assists organizations to concentrate on the core activities, by creating insight in the inter-
organizational links and relationships needed to create the physical product.
- 5 -
Margin
Firm Infrastructure
Human Resource Management
Technology
Procurement
Inbound
Logistics Operations
Outbound
Logistics
Marketing
& Sales Service
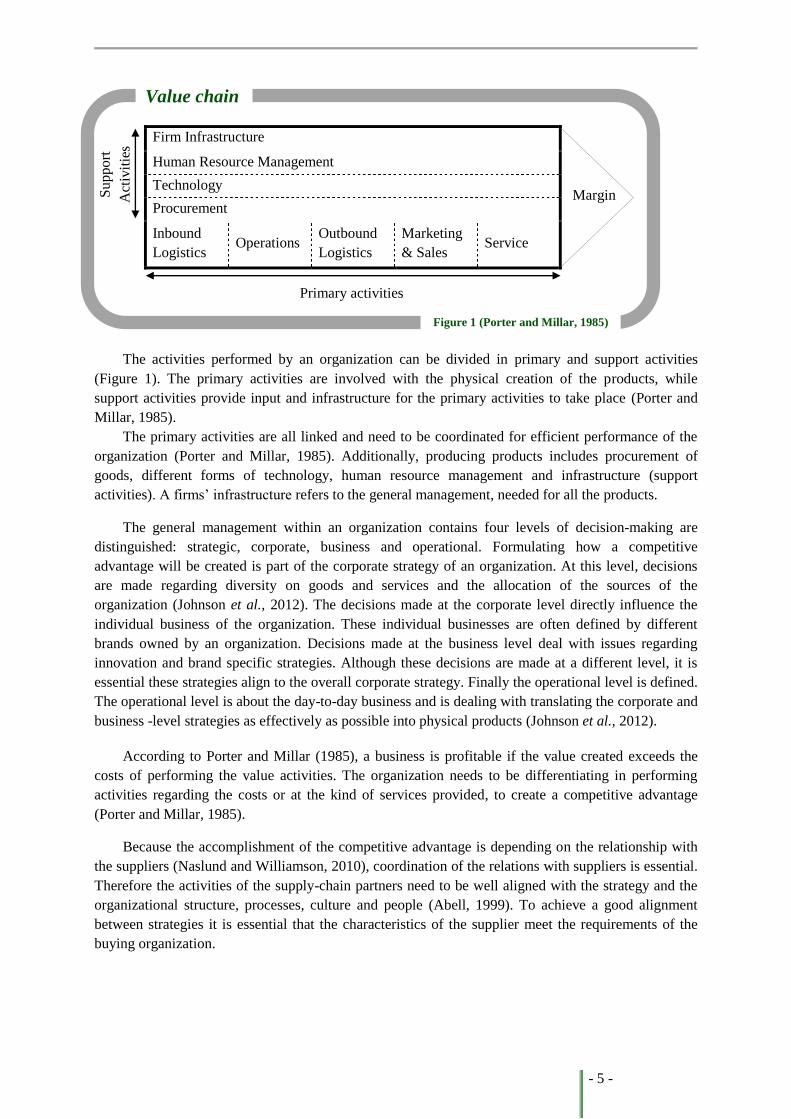
The activities performed by an organization can be divided in primary and support activities
(Figure 1). The primary activities are involved with the physical creation of the products, while
support activities provide input and infrastructure for the primary activities to take place (Porter and
Millar, 1985).
The primary activities are all linked and need to be coordinated for efficient performance of the
organization (Porter and Millar, 1985). Additionally, producing products includes procurement of
goods, different forms of technology, human resource management and infrastructure (support
activities). A firms’ infrastructure refers to the general management, needed for all the products.
The general management within an organization contains four levels of decision-making are
distinguished: strategic, corporate, business and operational. Formulating how a competitive
advantage will be created is part of the corporate strategy of an organization. At this level, decisions
are made regarding diversity on goods and services and the allocation of the sources of the
organization (Johnson et al., 2012). The decisions made at the corporate level directly influence the
individual business of the organization. These individual businesses are often defined by different
brands owned by an organization. Decisions made at the business level deal with issues regarding
innovation and brand specific strategies. Although these decisions are made at a different level, it is
essential these strategies align to the overall corporate strategy. Finally the operational level is defined.
The operational level is about the day-to-day business and is dealing with translating the corporate and
business -level strategies as effectively as possible into physical products (Johnson et al., 2012).
According to Porter and Millar (1985), a business is profitable if the value created exceeds the
costs of performing the value activities. The organization needs to be differentiating in performing
activities regarding the costs or at the kind of services provided, to create a competitive advantage
(Porter and Millar, 1985).
Because the accomplishment of the competitive advantage is depending on the relationship with
the suppliers (Naslund and Williamson, 2010), coordination of the relations with suppliers is essential.
Therefore the activities of the supply-chain partners need to be well aligned with the strategy and the
organizational structure, processes, culture and people (Abell, 1999). To achieve a good alignment
between strategies it is essential that the characteristics of the supplier meet the requirements of the
buying organization.
Primary activities
Su
pp
ort
Act
ivit
ies
Value chain
Figure 1 (Porter and Millar, 1985)
- 6 -
2.1. Supplier characteristics
According to Sarkis and Talluri (2002), the characteristics of an organization can be categorized in
three different groups: culture, technology and relationship. The characteristics of the suppliers
influence the values within an organization and therewith the way of doing business.
2.1.1. Culture
The organizational culture involves all the employees of the organization and is established during and
by the history of the organization. The culture within an organization is influenced by artifacts, values
and assumptions according to Schein in Hatch (1993). Artifacts are visible and physical results of
actions that come forward out of norms and values. Values are the social principles that are considered
to have a fundamental importance. Assumptions stand for the confidence in reality and human nature.
According to Schein in Hatch (1993), these different levels of culture all interact with each other and
together form the culture within an organization. The basis of this culture is defined by the founder of
the organization and one’s personal beliefs and values who transfers these to the new employees of the
organization (Hatch, 1993).
2.1.2. Technology
The capabilities of the suppliers become increasingly important, since the requirements to the
suppliers increase. Suppliers are increasingly involved more early in the process to assist during the
design and technical development of products. By this trend the technical capabilities of the suppliers
become gradually more important and need to cope with the demand of the buying organization (Choi
and Hartley, 1996).
2.1.3. Relationship
Since organizations are increasingly relying on their suppliers, the relationship with the supplier
becomes increasingly important. According to Choi and Hartley (1996), a strong relationship with the
supplier can be one of the strongest barriers for competitors to enter a new market (Christopher in
Choi and Hartley, 1996). Additionally the type of buyer-supplier relationship has an influence on the
motivation of the supplier to deliver on time (Paulraj and Chen, 2007). The relationship between a
buyer and supplier organization has a significant influence on the performances of the supplier as well
as on the amount of business that is done with a supplier.
2.2. Customer Order Decoupling Point
Since different markets have different requirements, organizations have different options on dealing
with the market demands. Depending on the market in which the organization is operating, the
organization can produce the products to stock or by order. Additionally, the organization can engineer
the products customer specific. The way of how the organization deals with the demand depends on
the market demand and the resources of the organization. By ascertaining the manufacturing strategy,
handled by the organization, the Customer Order Decoupling Point (CODP) can be determined.
According to Berry and Hill in Olhager and Selldin (2007), the make-to-stock strategy should be
handled with products that are highly standardized and have a high volume. The make-to-order
strategy should be applied to customer specific products that have a low volume (Berry and Hill in
Olhager, 2012). Engineer-to-order should be applied when both standardized and customer specific
products are produced (Olhager and Selldin, 2007).
- 7 -
The location of the COPD has a direct influence on the requirements of a buying organization
towards the performances of its suppliers. If the products are make-to-stock, the organization is able to
make a forecast and the suppliers know further up-front when delivery is required. When the product
is make-to-order, the lead time is shorter which requires the supplier to deliver in a shorter period of
time.
By deciding on the manufacturing strategies, firms are essentially looking for a way to manage their
inside flow of materials in the most effective way. Key to such coordination is the flow of materials
coming into the organization (Mentzer et al., 2001). According to Mentzer et al., (2001), customers
are expecting products consistently delivered faster, on time and without damage. To meet these
increasing customer demands organizations can make use of procurement management.
- 8 -
3. Procurement management Since organizations have to deal with globalisation and start focussing on their core competences,
procurement management has become increasingly important (Van Weele, 2005). As an effect to that,
purchasing models have been developed. The traditional purchasing model was based on an efficient
material flow and focused on the required quantity at the right time for the best price. Since in 1979
the five forces model was published, the procurement activities of an organization began to receive
scientific recognition (Ellram and Carr, 1994).
In line with the value chain (Figure 1), procurement has started to play a more important role in
the strategy of an organization (Ellram and Carr, 1994). As stated by Porter (2000), the strongest
competitive force determines the profitability of an organization. Additionally, Porter (2000) stated:
powerful suppliers are able to keep more value for themselves by charging higher prices. Since
different suppliers, have different levels of bargaining power, as a consequence of their characteristics,
the type of products they deliver and the type of relationship they have with the buying organization,
different procurement strategies can be handled (Porter, 2000). Since not all the products and buyer-
supplier relationships can be handled in the same way (Gelderman and Van Weele, 2003), Lilliecreutz
and Ydreskog as stated in Gelderman (2003) stated some sort of classification is needed to effectively
apply procurement strategies. This classification can be provided by the use of purchasing portfolio
models, since purchasing portfolio models seek to develop different purchasing strategies (Gelderman
and Van Weele, 2003).
The article published by Kraljic (1983), pointed out the essence of purchasing portfolio models.
To underpin the essence, Carr and Smeltzer (1997) stated that by acknowledging the strategic interest
of procurement by the top management, the procurement strategy can contribute to achieving
competitive advantage (Ellram and Carr, 1994).
This competitive advantage can be achieved by the selection and evaluation of suppliers, which
can support the organizations long-term strategy. Additionally, profitability can be increased by
decreasing the costs of procured goods, involvement of suppliers in product development, supporting
the production process and forecasting the availability and costs of materials needed in the future
(Ellram and Carr, 1994). Saving possibilities on procurement have led to increased investments in the
procurement management area (Cousins and Spekman, 2003).
Purchasing portfolio models can be applied in various situations at different levels within the
organization. By making use of a right balance between complex and simple variables, the full
potential of portfolio models can be utilized (Olsen and Ellram, 1997b). By applying the purchasing
portfolio model a graphic presentation can be created on the current and desired position of the
organization (Olsen and Ellram, 1997b). Furthermore, portfolio models can be used to allocate
valuable resources to an optimal combination, which will maximize long-term returns (Olsen and
Ellram, 1997b; Turnbull, 1990).
- 9 -
According to Dubois and Pedersen (Dubois and Pedersen, 2002), the fundamental assumptions
for purchasing portfolio models are power-dependence assumptions, although these relationships are
seldom discussed in purchasing portfolio models. Because of these fundamental assumptions, it is
crucial that the power and dependence positions of buyers and suppliers in the different strategies are
defined (Svensson, 2002 Caniels and Gelderman, 2005). The dependence position of an organization
is expressed by the interdependency aspects. A known definition of this aspect is: “the relative power
of an organization over another is the result of the net dependence of one on the other” (Svensson,
2002, based on Pfeffer). The content of the fundamental assumptions and the effect of the
interdependency on the buyer-supplier relation will be further discussed in chapter four.
3.1. Procurement portfolio models
Different procurement portfolio models have been developed. A number of portfolio models will be
discussed.
The ABC analysis was developed for the allocation of inventories. The ‘significant items’ (A) and
the ‘trivial items’ (C) have to be identified. The significant items are a few products which generate
the most turnover. The trivial items form the largest group although generate the least amount of
turnover. As stated by Flores and Whybark (1987) there was very little guidance on how to improve
the managerial performance. General recommendations are given like manage ‘A’ items very closely
and spend less time on ‘C’ items. Considering the critique of Flores and Whybark (1987) and the fact
that this approach only considers financial aspects, ignoring the quality (Gelderman and Van Weele,
2005), performance risk and other components, makes that this analysis is not further discussed during
this study.
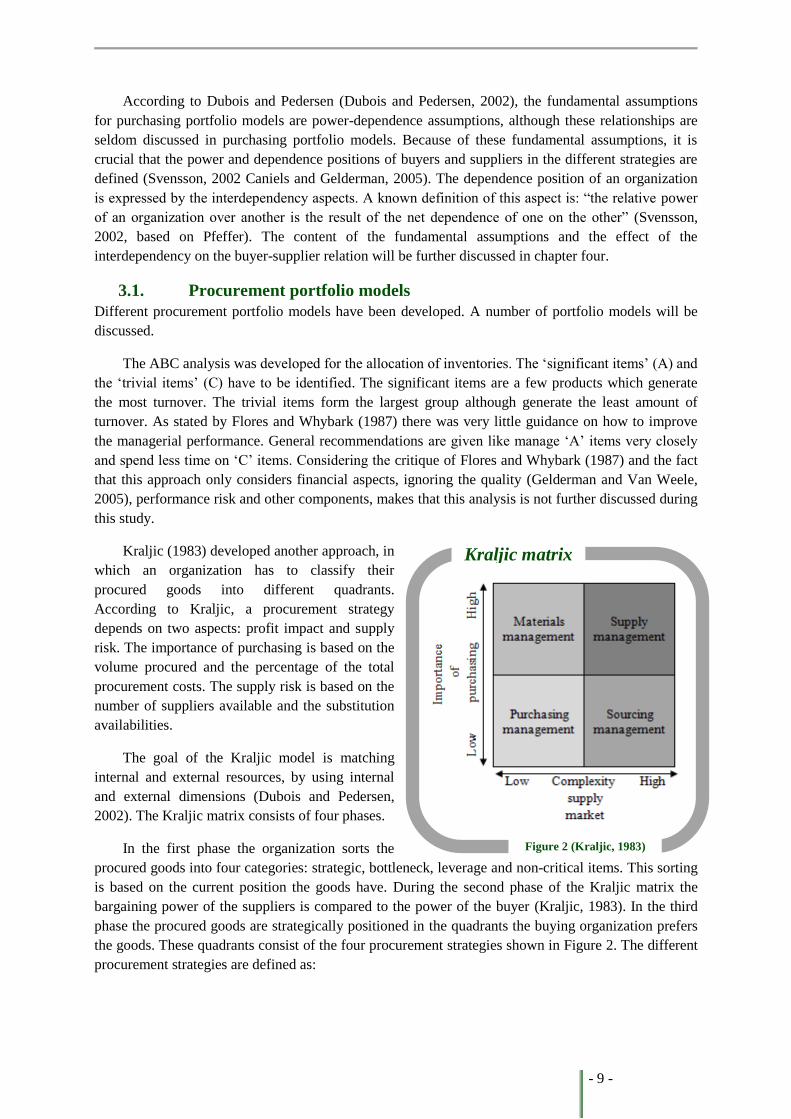
Kraljic (1983) developed another approach, in
which an organization has to classify their
procured goods into different quadrants.
According to Kraljic, a procurement strategy
depends on two aspects: profit impact and supply
risk. The importance of purchasing is based on the
volume procured and the percentage of the total
procurement costs. The supply risk is based on the
number of suppliers available and the substitution
availabilities.
The goal of the Kraljic model is matching
internal and external resources, by using internal
and external dimensions (Dubois and Pedersen,
2002). The Kraljic matrix consists of four phases.
In the first phase the organization sorts the
procured goods into four categories: strategic, bottleneck, leverage and non-critical items. This sorting
is based on the current position the goods have. During the second phase of the Kraljic matrix the
bargaining power of the suppliers is compared to the power of the buyer (Kraljic, 1983). In the third
phase the procured goods are strategically positioned in the quadrants the buying organization prefers
the goods. These quadrants consist of the four procurement strategies shown in Figure 2. The different
procurement strategies are defined as:
Figure 2 (Kraljic, 1983)
Kraljic matrix
- 10 -
- Purchasing management contains non-critical items and requires product standardisation,
efficient processing and optimizing inventory. Referring to the interdependency, purchasing
management is a form of interdependence asymmetry, since there is no sharing of strategic
and vital information. Therefore, the level of trust and commitment of the supplier of these
items is low.
- Material management includes leverage items and allow the buying organization to exploit
the full purchasing power by product substitution, optimizing order volume and supplier
selection.
- Sourcing management concerns bottleneck products that are crucial. There has to be control of
suppliers and inventories and a backup plan has to be conducted.
- Supply management encloses strategic items. Strategic items demand accurate forecasting and
detailed market research. Additionally, development of long-term relationships and risk
analysis has to take place (Kraljic, 1983; Olsen and Ellram, 1997b). Regarding the
interdependency, supply management is referring to total interdependence, since strategic and
vital information is shared with the supplier. By doing this, the level of trust and commitment
increases (Kumar et al., 1995).
By placing the items in the preferred quadrant, opportunities and vulnerabilities can be identified.
In the fourth phase of the Kraljic matrix an action plan is determined on how to deal with these
opportunities and vulnerabilities. Strategic decisions are made regarding volume, price, supplier,
material substitution and inventory policy (Kraljic, 1983).
In line with the statement of Kumar et al., (1995) an organization should procure goods on which
purchasing management is being applied, as well as products on which supply management is applied.
A different approach towards procurement management is developed by Olsen and Ellram
(1997b). Their approach contains three phases for analyzing the procured goods. In the first phase the
procured goods are classified on two dimensions: difficulty of the procurement situation and the
strategic importance of the procurement (Olsen and Ellram, 1997b). In the second phase a distinction
is made based on the current relationship with the supplier and the attractiveness of the supplier. In
which quadrant the suppliers are located depends on the financial performance, technological and
strategic factors. During the third phase there is determined if the procured goods are located (second
phase) in the quadrant in which they are classified (first phase). In this phase an action plan will be
formulated on how to relocate the products to the right quadrant.
In the second phase, Olsen and Ellram assess the suppliers on the relative attractiveness of the
supplier and the strength of the buyer-supplier relationship. This phase is comparable with the second
phase of the Kraljic approach. Although it is comparable, the approach of Olsen and Ellram has
identified approximately fifty factors that can have an influence on the management of the supplier
relationship. Taking into account these supplementary aspects, creates additional measurements and
therefore implementation problems (Gelderman, 2003).
The third phase of Olsen and Ellram’s approach is also comparable, although the Kraljic approach
defines a fourth phase, which is included in the third phase at the Olsen and Ellram approach.
It can be questioned why there is much similarity between these approaches. As stated by
Svensson (2002), the Olsen and Ellram approach is derived from the Kraljic approach. However, the
Olsen and Ellram approach is using a relationship perspective while the Kraljic matrix uses a power
perspective approach to make recommendations on the procurement strategy (Gelderman, 2003).
Gelderman and Van Weele (2003) state that a number of procurement portfolio models are developed
by other scholars based on the Kraljic matrix.
- 11 -
3.2. Critiques
There are also some critiques regarding the procurement portfolio models. Dubois and Pedersen
(2002) state that the aspect of interdependencies between relationships is seldom discussed. The
research on buyer-supplier relationships is focusing on a single relationship or one type of
relationship; not on how to manage the entire supplier portfolio (Olsen and Ellram, 1997a). Since most
organizations are involved in different relationships and relationships can influence each other, this is
an important critique to take into consideration.
Nellore and Söderquist (2000) state that portfolio models do not take into account the link
between engineering, the actual product and the supplier during the process of product development.
Because of this missing link there is a potential risk that the resulting strategies of the portfolio models
are contradictory, because of sub optimization. Additional criticism of Nellore and Söderquist (2000)
is regarding the variables used to measure the different dimensions. They state that the variables used
are estimations of parameters by approximations, e.g. market share should be a good approximation of
the competitive position. According to the Competitive Strategy of Porter, this is often not true
(Nellore and Söderquist, 2000). Therefore, Nellore and Söderquist (2000) argue the relation between
the category in which the supplier is located and in which category the buying organization preferably
locates the supplier, is more important than the initial classification of the different components.
Olsen and Ellram (1997b) state that determination of the weights regarding the variables is one of
the most important parts of the implementation process. Considering this, it is also one of the most
subjective aspects (Narasimhan et al., 2001), though the subjectivity has the advantage of
incorporating the experience and knowledge of the procurement staff.
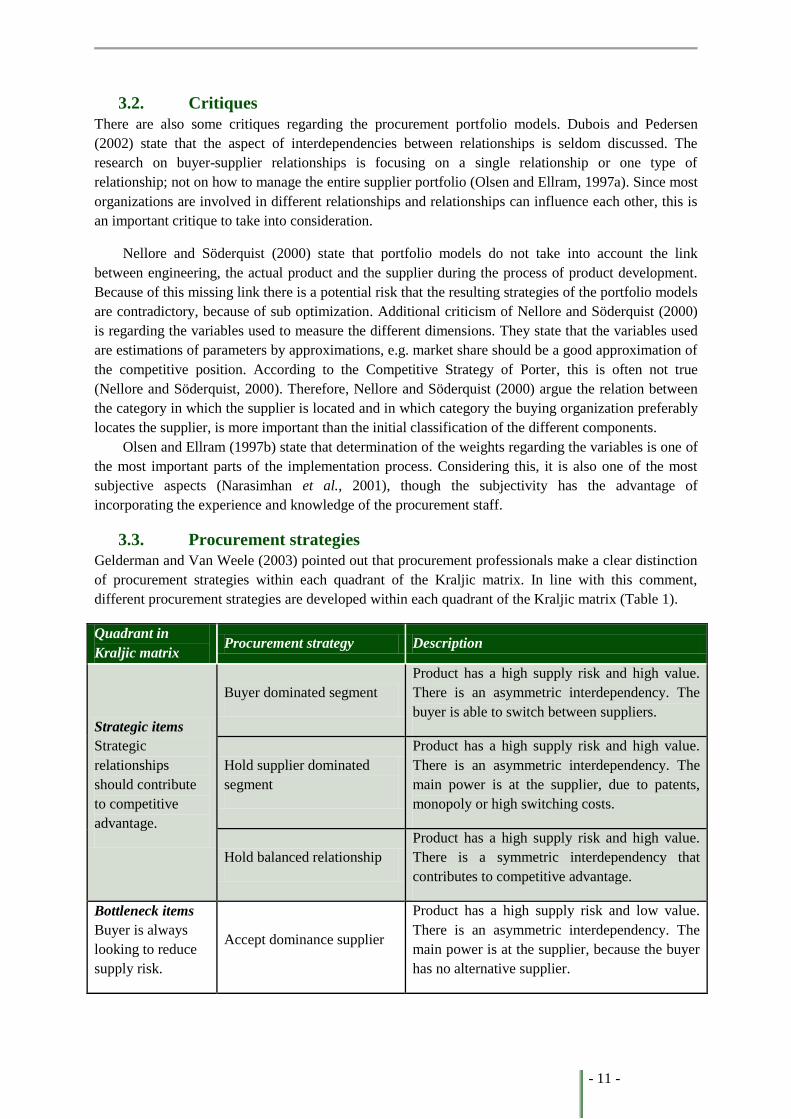
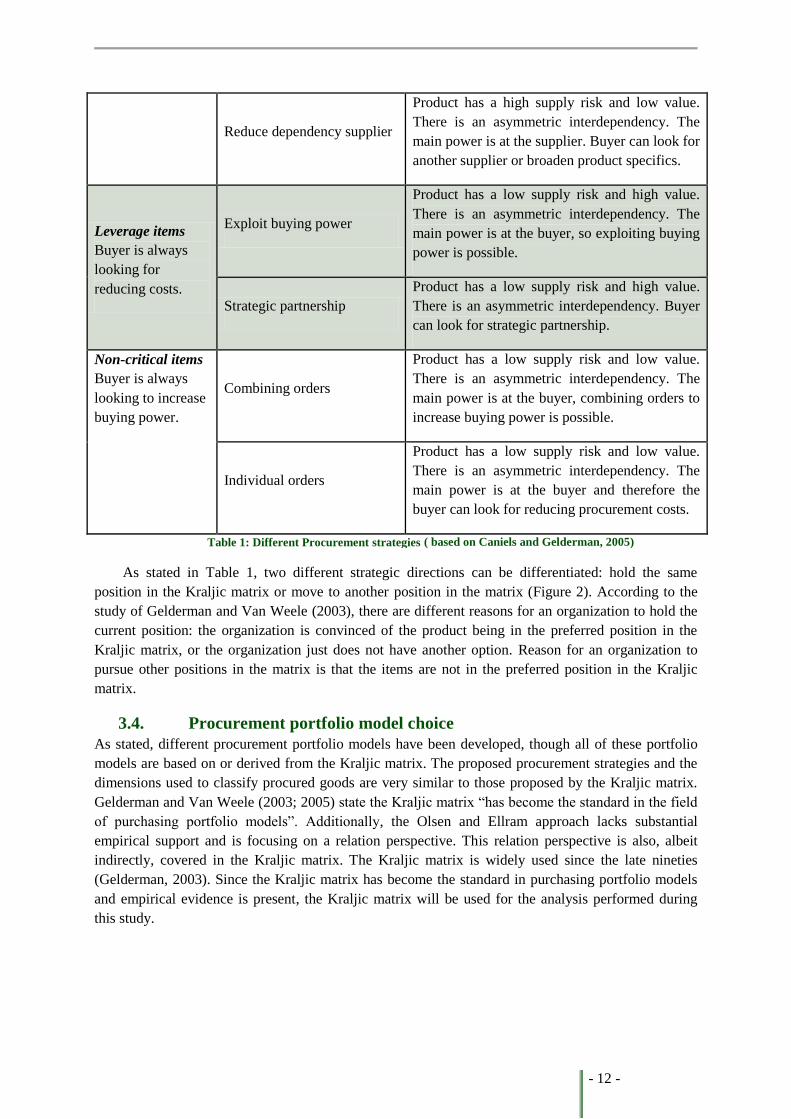
3.3. Procurement strategies
Gelderman and Van Weele (2003) pointed out that procurement professionals make a clear distinction
of procurement strategies within each quadrant of the Kraljic matrix. In line with this comment,
different procurement strategies are developed within each quadrant of the Kraljic matrix (Table 1).
Quadrant in
Kraljic matrix Procurement strategy Description
Strategic items
Strategic
relationships
should contribute
to competitive
advantage.
Buyer dominated segment
Product has a high supply risk and high value.
There is an asymmetric interdependency. The
buyer is able to switch between suppliers.
Hold supplier dominated
segment
Product has a high supply risk and high value.
There is an asymmetric interdependency. The
main power is at the supplier, due to patents,
monopoly or high switching costs.
Hold balanced relationship
Product has a high supply risk and high value.
There is a symmetric interdependency that
contributes to competitive advantage.
Bottleneck items
Buyer is always
looking to reduce
supply risk.
Accept dominance supplier
Product has a high supply risk and low value.
There is an asymmetric interdependency. The
main power is at the supplier, because the buyer
has no alternative supplier.
- 12 -
Reduce dependency supplier
Product has a high supply risk and low value.
There is an asymmetric interdependency. The
main power is at the supplier. Buyer can look for
another supplier or broaden product specifics.
Leverage items
Buyer is always
looking for
reducing costs.
Exploit buying power
Product has a low supply risk and high value.
There is an asymmetric interdependency. The
main power is at the buyer, so exploiting buying
power is possible.
Strategic partnership
Product has a low supply risk and high value.
There is an asymmetric interdependency. Buyer
can look for strategic partnership.
Non-critical items
Buyer is always
looking to increase
buying power.
Combining orders
Product has a low supply risk and low value.
There is an asymmetric interdependency. The
main power is at the buyer, combining orders to
increase buying power is possible.
Individual orders
Product has a low supply risk and low value.
There is an asymmetric interdependency. The
main power is at the buyer and therefore the
buyer can look for reducing procurement costs.
( based on Caniels and Gelderman, 2005)
As stated in Table 1, two different strategic directions can be differentiated: hold the same
position in the Kraljic matrix or move to another position in the matrix (Figure 2). According to the
study of Gelderman and Van Weele (2003), there are different reasons for an organization to hold the
current position: the organization is convinced of the product being in the preferred position in the
Kraljic matrix, or the organization just does not have another option. Reason for an organization to
pursue other positions in the matrix is that the items are not in the preferred position in the Kraljic
matrix.
3.4. Procurement portfolio model choice
As stated, different procurement portfolio models have been developed, though all of these portfolio
models are based on or derived from the Kraljic matrix. The proposed procurement strategies and the
dimensions used to classify procured goods are very similar to those proposed by the Kraljic matrix.
Gelderman and Van Weele (2003; 2005) state the Kraljic matrix “has become the standard in the field
of purchasing portfolio models”. Additionally, the Olsen and Ellram approach lacks substantial
empirical support and is focusing on a relation perspective. This relation perspective is also, albeit
indirectly, covered in the Kraljic matrix. The Kraljic matrix is widely used since the late nineties
(Gelderman, 2003). Since the Kraljic matrix has become the standard in purchasing portfolio models
and empirical evidence is present, the Kraljic matrix will be used for the analysis performed during
this study.
Table 1: Different Procurement strategies
- 13 -
4. Buyer-supplier relationships As stated in the conclusion of chapter three, the buyer-supplier relationship is an important aspect of
the procurement strategy. Even though the Kraljic matrix does cover this relationship indirectly for
the different strategies mentioned for different types of products, it is not outlined specifically. In this
part, the buyer-supplier relation is explained more deeply, to create insight in this aspect.
The buyer-supplier relationship can be interdependent asymmetric as well as interdependent
symmetric. The relationship which is interdependent asymmetric refers to the difference between the
buying organizations dependence on the supplier and the supplier dependence on the buying
organization. Additionally, the interdependent symmetric relationship is characterized by two
organizations being equally dependent on each other (Kumar et al., 1995).
The level of interdependency between two organizations is often determined by the replacebility
of the buying organizations suppliers by one another (Brown, Lusch and Muchling as stated in Kumar
et al., 1995). According to Kumar et al., (1995), relationships with greater interdependence symmetry
embrace a higher level of trust, strong commitment and -as a consequence- less conflicts. Trust and
commitment are essential elements of a relationship to ensure the success of the relationship (Kumar
et al., 1995; Morgan and Hunt, 1994), since it encourages partners to perceive the relationship, go for
the long-term benefits instead of the short-term benefits and the believe that partners will not act
opportunistically (Morgan and Hunt, 1994). Morgan and Hunt, (1994) have developed the Key Media
Variable (KMV) model that focuses on relational sharing of trust and commitment.
4.1. Trust
Trust can be defined as the “willingness to rely on the supplier of who the organization is doing
business with and has confidence in” (Moorman, Deshpandé and Zaltman in Morgan and Hunt, 1994).
There are a number of aspects which have an influence on trust. The following aspects have a positive
impact on the trust between the buying organization and the supplier (Morgan and Hunt, 1994):
- Shared value: The point to which the buying organization and the supplier have the same
attitude towards important behaviour, goals and policies.
- Communication: “Formal and informal sharing of meaningful information between an
organization and the supplier” (Anderson and Narus 1990, p 44 in Morgan and Hunt, 1994).
Additionally, there is an aspect that has a negative influence on the level of trust between the
buying organization and the supplier (Morgan and Hunt, 1994):
- Opportunistic behaviour: The violation of promises or agreements between the organization
and the supplier (Archrol and Stern in Morgan and Hunt, 1994).
4.2. Commitment
Commitment can be defined as: believe that a continuing relationship between the buying organization
and the supplier is of the importance that maximum efforts will be embedded in maintaining the
relationship. The following aspects have a positive aspect on commitment between the supplier and
the buying organization (Morgan and Hunt, 1994):
- Relationship termination costs: The costs that have to be made by the buying organization to
switch to another supplier.
- Relationship benefits: The added value the relationship between the buying organization and
the supplier offers for the buying organization.
- 14 -
- Shared value: The point to which the buying organization and the supplier have the same
attitude towards important behaviour, goals and policies.
Additionally, there is an aspect that has a negative influence on the level of commitment between
the buying organization and the supplier (Morgan and Hunt, 1994):
- Tendency to leave: The propensity to leave is the tendency the supplier has to end the
relationship in the near future.
Furthermore, trust between the buying organization and the supplier has a positive influence on
the commitment the supplier has towards the buying organization. Trust and commitment lead directly
to cooperative behaviour which is favourable for relationships (Morgan and Hunt, 1994).
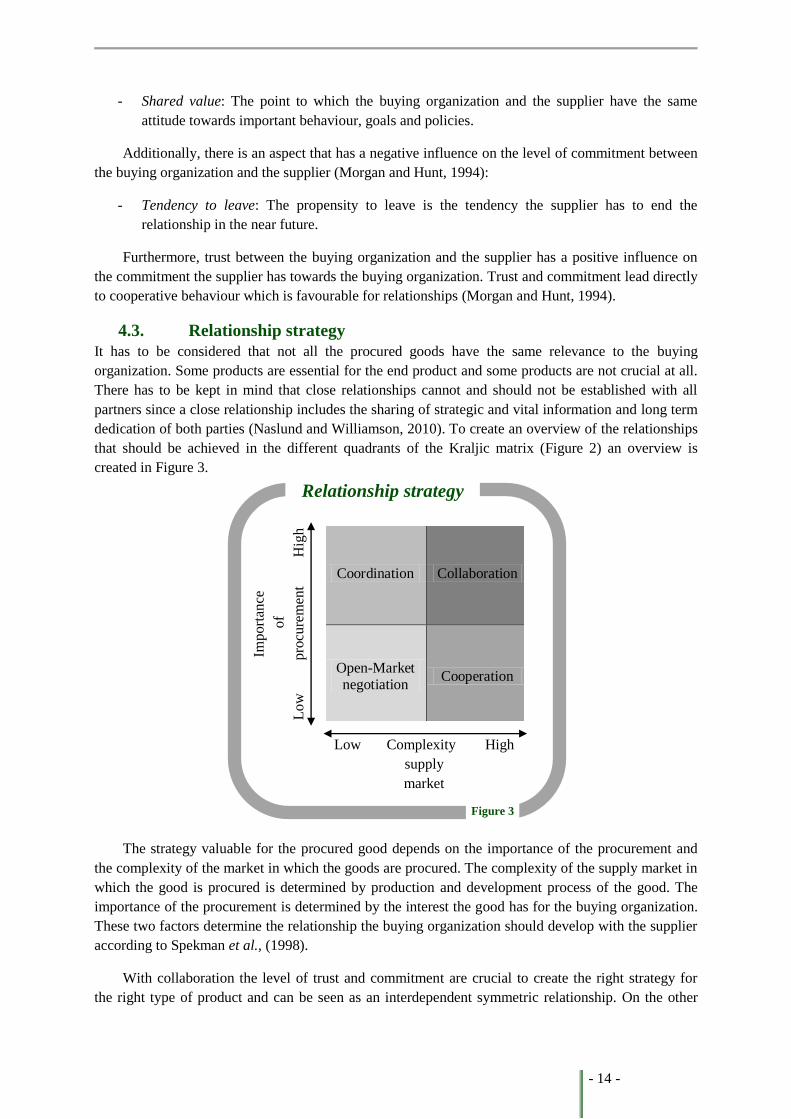
4.3. Relationship strategy
It has to be considered that not all the procured goods have the same relevance to the buying
organization. Some products are essential for the end product and some products are not crucial at all.
There has to be kept in mind that close relationships cannot and should not be established with all
partners since a close relationship includes the sharing of strategic and vital information and long term
dedication of both parties (Naslund and Williamson, 2010). To create an overview of the relationships
that should be achieved in the different quadrants of the Kraljic matrix (Figure 2) an overview is
created in Figure 3.
The strategy valuable for the procured good depends on the importance of the procurement and
the complexity of the market in which the goods are procured. The complexity of the supply market in
which the good is procured is determined by production and development process of the good. The
importance of the procurement is determined by the interest the good has for the buying organization.
These two factors determine the relationship the buying organization should develop with the supplier
according to Spekman et al., (1998).
With collaboration the level of trust and commitment are crucial to create the right strategy for
the right type of product and can be seen as an interdependent symmetric relationship. On the other
Low Complexity High
supply
market
Import
ance
of
Low
pro
cure
men
t
Hig
h
Coordination Collaboration
Open-Market negotiation
Cooperation
Relationship strategy
Figure 3
- 15 -
hand, in an interdependent asymmetric relationship, trust and commitment are likely to be less present,
because these aspects are less important for the functioning of this relationship (open-market
negotiation). In line with the open-market negotiation, the buying organization is less motivated to
avoid conflicts because the buying organization can inflict more damage to the supplier. These
asymmetric relationships are less likely to function well and are less stable (Stern and Reve’s as stated
in Kumar et al., 1995).
Since an organization procures different types of products, the required relationships with
suppliers differ and therefore also the interdependency between the buying organization and suppliers.
Additionally, the buying organization and the supplier should be aware of the needs of the other party
and alignment in the goals and expectations should be achieved (Spekman et al., 1998).
- 16 -
5. Supplier performance Many organizations concentrate themselves on their core activities (Van Weele, 2005), which makes
that they increasingly rely on their suppliers capabilities (Krause and Ellram, 1997). As a
consequence, the performances of the suppliers have a direct impact on the performances of the
organization. To ensure the performances of the supplier positively affect the results of the
organization, a supplier needs to be selected of which the goals are aligned with the goals of the
organization.
5.1. Supplier selection
The aspect of supplier selection has gained interest since the 1960s. The performance metrics used for
supplier selection in that time where mostly based on quantitative metrics. Interest grew on using
qualitative metrics for supplier selection (Tahriri et al., 2008). Nowadays, mostly a combination of
both quantitative and qualitative metrics has been used. Because of this combination, supplier
selection has evolved to a multiple criteria decision-making problem. As a consequence of this
development, a suitable method has to be selected, which is capable of dealing with both qualitative
and quantitative problems (Tahriri et al., 2008).
In 2001, De Boer et al., published a review on the different techniques used for supplier selection.
Within the review, a division is made on different selection methods, based on the complexity and
importance of the procurement decision: new procurement actions, modified rebuy actions (leverage
items), straight rebuy action (non-critical items) and straight rebuy (strategic and bottleneck items).
This division is based on the Kraljic matrix (Figure 2). In this study a division between different
methods is based on the different stages in the supplier selection process. The phases defined are:
Problem definition, Criteria definition, Pre-qualification of the suppliers and the Final choice (De Boer
et al., 2001).
5.1.1. Problem definition phase
In this phase the decision-maker needs to determine the need and the alternatives that are available.
The need for a supplier is based on the demand of an organization: why one or more suppliers are
necessary (De Boer et al., 2001). Referring to the problem definition phase, Vokurka et al., (1996)
state that the sourcing demand can come from different departments in the organization. Since this
phase is not very complex and no publications have been found about the problem definition phase
(De Boer et al., 2001), this phase is not further discussed in this study.
5.1.2. Criteria definition phase
Only a few methods have been published on the definition of the criteria regarding supplier selection:
- Mandal and Deshmukh (1994) propose the use of Interpretive Structural Modelling (ISM), to
gain insight in the necessity and significance of each indicator. A division is made on
dependent and independent criteria, which is based on the relation the different criteria have
with each other.
- Vokurka et al., (1996) suggests using an expert system to generate the selection criteria. This
system is developed by means of a senior purchasing manager, so other non-expert users can
obtain the system for suggestions.
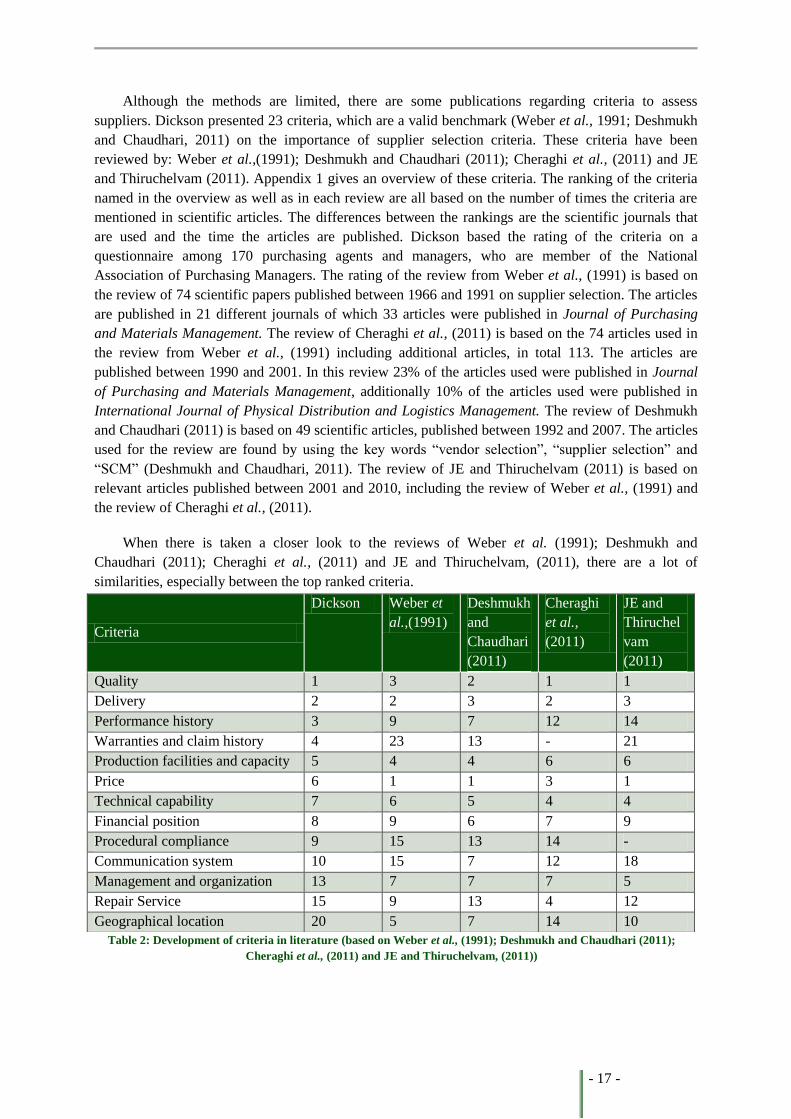
- 17 -
Although the methods are limited, there are some publications regarding criteria to assess
suppliers. Dickson presented 23 criteria, which are a valid benchmark (Weber et al., 1991; Deshmukh
and Chaudhari, 2011) on the importance of supplier selection criteria. These criteria have been
reviewed by: Weber et al.,(1991); Deshmukh and Chaudhari (2011); Cheraghi et al., (2011) and JE
and Thiruchelvam (2011). Appendix 1 gives an overview of these criteria. The ranking of the criteria
named in the overview as well as in each review are all based on the number of times the criteria are
mentioned in scientific articles. The differences between the rankings are the scientific journals that
are used and the time the articles are published. Dickson based the rating of the criteria on a
questionnaire among 170 purchasing agents and managers, who are member of the National
Association of Purchasing Managers. The rating of the review from Weber et al., (1991) is based on
the review of 74 scientific papers published between 1966 and 1991 on supplier selection. The articles
are published in 21 different journals of which 33 articles were published in Journal of Purchasing
and Materials Management. The review of Cheraghi et al., (2011) is based on the 74 articles used in
the review from Weber et al., (1991) including additional articles, in total 113. The articles are
published between 1990 and 2001. In this review 23% of the articles used were published in Journal
of Purchasing and Materials Management, additionally 10% of the articles used were published in
International Journal of Physical Distribution and Logistics Management. The review of Deshmukh
and Chaudhari (2011) is based on 49 scientific articles, published between 1992 and 2007. The articles
used for the review are found by using the key words “vendor selection”, “supplier selection” and
“SCM” (Deshmukh and Chaudhari, 2011). The review of JE and Thiruchelvam (2011) is based on
relevant articles published between 2001 and 2010, including the review of Weber et al., (1991) and
the review of Cheraghi et al., (2011).
When there is taken a closer look to the reviews of Weber et al. (1991); Deshmukh and
Chaudhari (2011); Cheraghi et al., (2011) and JE and Thiruchelvam, (2011), there are a lot of
similarities, especially between the top ranked criteria.
Criteria
Dickson Weber et
al.,(1991)
Deshmukh
and
Chaudhari
(2011)
Cheraghi
et al.,
(2011)
JE and
Thiruchel
vam
(2011)
Quality 1 3 2 1 1
Delivery 2 2 3 2 3
Performance history 3 9 7 12 14
Warranties and claim history 4 23 13 - 21
Production facilities and capacity 5 4 4 6 6
Price 6 1 1 3 1
Technical capability 7 6 5 4 4
Financial position 8 9 6 7 9
Procedural compliance 9 15 13 14 -
Communication system 10 15 7 12 18
Management and organization 13 7 7 7 5
Repair Service 15 9 13 4 12
Geographical location 20 5 7 14 10
Table 2: Development of criteria in literature (based on Weber et al., (1991); Deshmukh and Chaudhari (2011);
Cheraghi et al., (2011) and JE and Thiruchelvam, (2011))
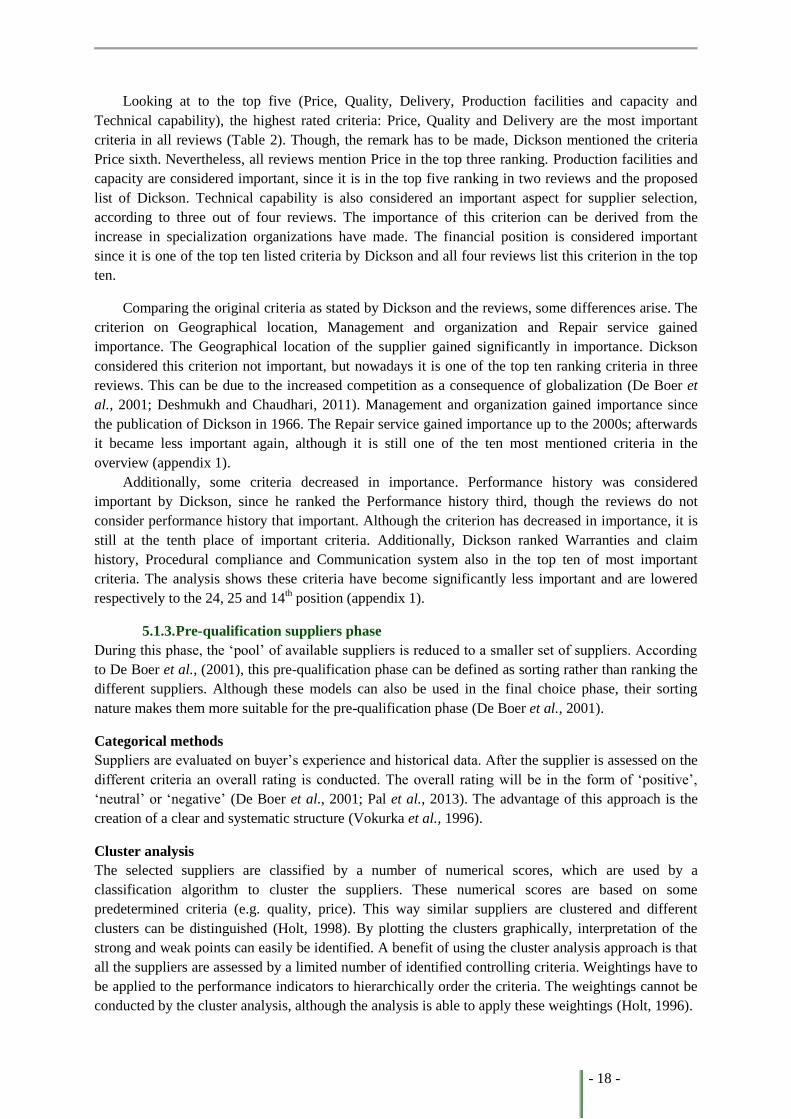
- 18 -
Looking at to the top five (Price, Quality, Delivery, Production facilities and capacity and
Technical capability), the highest rated criteria: Price, Quality and Delivery are the most important
criteria in all reviews (Table 2). Though, the remark has to be made, Dickson mentioned the criteria
Price sixth. Nevertheless, all reviews mention Price in the top three ranking. Production facilities and
capacity are considered important, since it is in the top five ranking in two reviews and the proposed
list of Dickson. Technical capability is also considered an important aspect for supplier selection,
according to three out of four reviews. The importance of this criterion can be derived from the
increase in specialization organizations have made. The financial position is considered important
since it is one of the top ten listed criteria by Dickson and all four reviews list this criterion in the top
ten.
Comparing the original criteria as stated by Dickson and the reviews, some differences arise. The
criterion on Geographical location, Management and organization and Repair service gained
importance. The Geographical location of the supplier gained significantly in importance. Dickson
considered this criterion not important, but nowadays it is one of the top ten ranking criteria in three
reviews. This can be due to the increased competition as a consequence of globalization (De Boer et
al., 2001; Deshmukh and Chaudhari, 2011). Management and organization gained importance since
the publication of Dickson in 1966. The Repair service gained importance up to the 2000s; afterwards
it became less important again, although it is still one of the ten most mentioned criteria in the
overview (appendix 1).
Additionally, some criteria decreased in importance. Performance history was considered
important by Dickson, since he ranked the Performance history third, though the reviews do not
consider performance history that important. Although the criterion has decreased in importance, it is
still at the tenth place of important criteria. Additionally, Dickson ranked Warranties and claim
history, Procedural compliance and Communication system also in the top ten of most important
criteria. The analysis shows these criteria have become significantly less important and are lowered
respectively to the 24, 25 and 14th position (appendix 1).
5.1.3. Pre-qualification suppliers phase
During this phase, the ‘pool’ of available suppliers is reduced to a smaller set of suppliers. According
to De Boer et al., (2001), this pre-qualification phase can be defined as sorting rather than ranking the
different suppliers. Although these models can also be used in the final choice phase, their sorting
nature makes them more suitable for the pre-qualification phase (De Boer et al., 2001).
Categorical methods
Suppliers are evaluated on buyer’s experience and historical data. After the supplier is assessed on the
different criteria an overall rating is conducted. The overall rating will be in the form of ‘positive’,
‘neutral’ or ‘negative’ (De Boer et al., 2001; Pal et al., 2013). The advantage of this approach is the
creation of a clear and systematic structure (Vokurka et al., 1996).
Cluster analysis
The selected suppliers are classified by a number of numerical scores, which are used by a
classification algorithm to cluster the suppliers. These numerical scores are based on some
predetermined criteria (e.g. quality, price). This way similar suppliers are clustered and different
clusters can be distinguished (Holt, 1998). By plotting the clusters graphically, interpretation of the
strong and weak points can easily be identified. A benefit of using the cluster analysis approach is that
all the suppliers are assessed by a limited number of identified controlling criteria. Weightings have to
be applied to the performance indicators to hierarchically order the criteria. The weightings cannot be
conducted by the cluster analysis, although the analysis is able to apply these weightings (Holt, 1996).
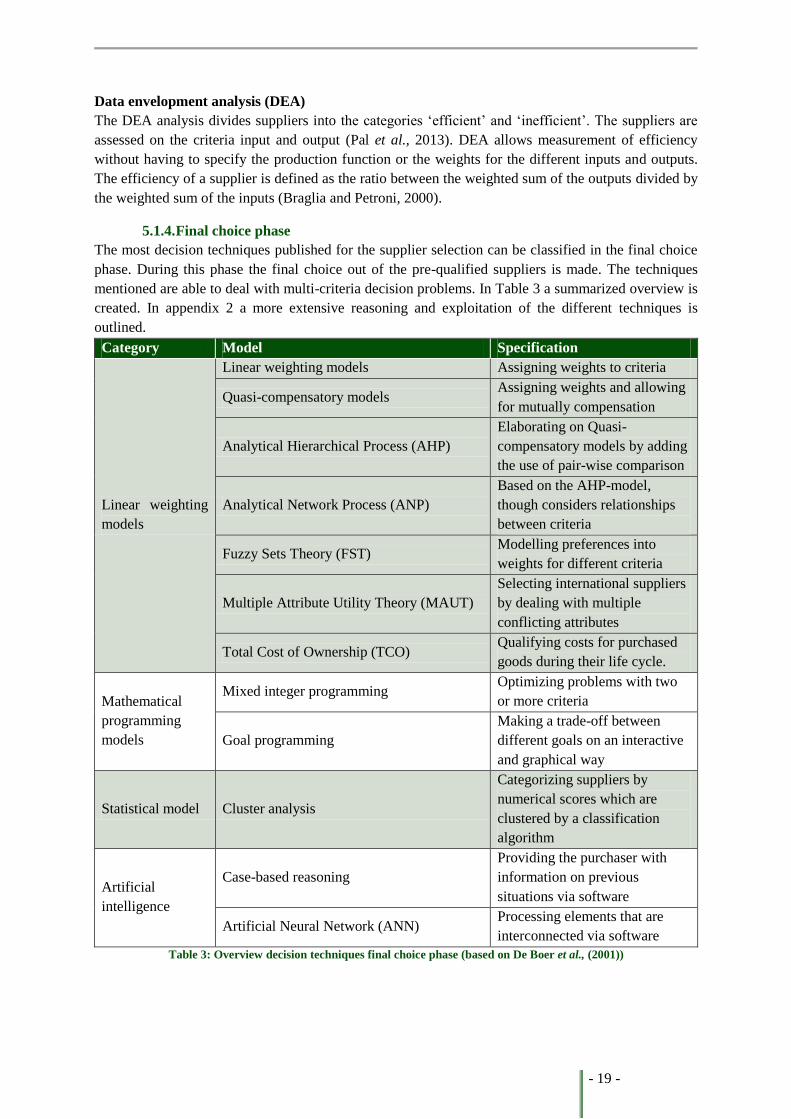
- 19 -
Data envelopment analysis (DEA)
The DEA analysis divides suppliers into the categories ‘efficient’ and ‘inefficient’. The suppliers are
assessed on the criteria input and output (Pal et al., 2013). DEA allows measurement of efficiency
without having to specify the production function or the weights for the different inputs and outputs.
The efficiency of a supplier is defined as the ratio between the weighted sum of the outputs divided by
the weighted sum of the inputs (Braglia and Petroni, 2000).
5.1.4. Final choice phase
The most decision techniques published for the supplier selection can be classified in the final choice
phase. During this phase the final choice out of the pre-qualified suppliers is made. The techniques
mentioned are able to deal with multi-criteria decision problems. In Table 3 a summarized overview is
created. In appendix 2 a more extensive reasoning and exploitation of the different techniques is
outlined.
Category Model Specification
Linear weighting
models
Linear weighting models Assigning weights to criteria
Quasi-compensatory models Assigning weights and allowing
for mutually compensation
Analytical Hierarchical Process (AHP)
Elaborating on Quasi-
compensatory models by adding
the use of pair-wise comparison
Analytical Network Process (ANP)
Based on the AHP-model,
though considers relationships
between criteria
Fuzzy Sets Theory (FST) Modelling preferences into
weights for different criteria
Multiple Attribute Utility Theory (MAUT)
Selecting international suppliers
by dealing with multiple
conflicting attributes
Total Cost of Ownership (TCO) Qualifying costs for purchased
goods during their life cycle.
Mathematical
programming
models
Mixed integer programming Optimizing problems with two
or more criteria
Goal programming
Making a trade-off between
different goals on an interactive
and graphical way
Statistical model Cluster analysis
Categorizing suppliers by
numerical scores which are
clustered by a classification
algorithm
Artificial
intelligence
Case-based reasoning
Providing the purchaser with
information on previous
situations via software
Artificial Neural Network (ANN) Processing elements that are
interconnected via software
Table 3: Overview decision techniques final choice phase (based on De Boer et al., (2001))
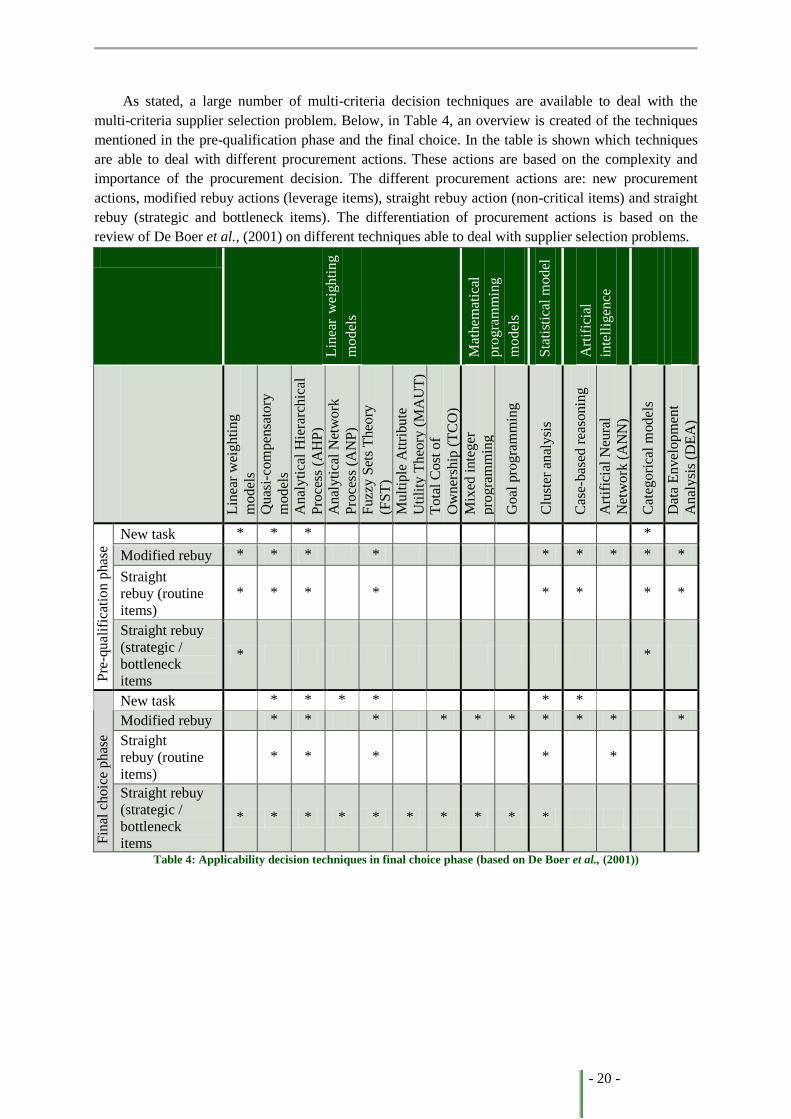
- 20 -
As stated, a large number of multi-criteria decision techniques are available to deal with the
multi-criteria supplier selection problem. Below, in Table 4, an overview is created of the techniques
mentioned in the pre-qualification phase and the final choice. In the table is shown which techniques
are able to deal with different procurement actions. These actions are based on the complexity and
importance of the procurement decision. The different procurement actions are: new procurement
actions, modified rebuy actions (leverage items), straight rebuy action (non-critical items) and straight
rebuy (strategic and bottleneck items). The differentiation of procurement actions is based on the
review of De Boer et al., (2001) on different techniques able to deal with supplier selection problems.
Lin
ear
wei
gh
tin
g
mo
del
s
Mat
hem
atic
al
pro
gra
mm
ing
mo
del
s
Sta
tist
ical
mod
el
Art
ific
ial
inte
llig
ence
Lin
ear
wei
ghti
ng
model
s Q
uas
i-co
mpen
sato
ry
model
s
Anal
yti
cal
Hie
rarc
hic
al
Pro
cess
(A
HP
) A
nal
yti
cal
Net
wo
rk
Pro
cess
(A
NP
)
Fuzz
y S
ets
Theo
ry
(FS
T)
Mult
iple
Att
ribu
te
Uti
lity
Theo
ry (
MA
UT
) T
ota
l C
ost
of
Ow
ner
ship
(T
CO
)
Mix
ed i
nte
ger
pro
gra
mm
ing
Goal
pro
gra
mm
ing
Clu
ster
anal
ysi
s
Cas
e-bas
ed r
easo
nin
g
Art
ific
ial
Neu
ral
Net
work
(A
NN
)
Cat
egori
cal
mod
els
Dat
a E
nvel
op
men
t
Anal
ysi
s (D
EA
)
Pre
-qual
ific
atio
n p
has
e
New task * * * *
Modified rebuy * * * * * * * * *
Straight
rebuy (routine
items)
* * * * * * * *
Straight rebuy
(strategic /
bottleneck
items
* *
Fin
al c
hoic
e phas
e
New task * * * * * *
Modified rebuy * * * * * * * * * *
Straight
rebuy (routine
items)
* * * * *
Straight rebuy
(strategic /
bottleneck
items
* * * * * * * * * *
Table 4: Applicability decision techniques in final choice phase (based on De Boer et al., (2001))
- 21 -
5.2. Supplier evaluation
When the right supplier is selected, it is essential to evaluate the supplier to ensure the performances of
the suppliers positively affect the results of the buying organization (Dickson as stated in Purdy et al.,
1994). The goal of supplier evaluation is to gain insight in the performances of the supplier by
measuring and analysing the performances, to ensure actions can be taken in case of unacceptable
performances. By accurately defining the performance metrics and the expected performances, the
evaluation of suppliers supports the creation of a supply base that best suits the organizational goals
(Harding and Harding, 2000). These metrics help the buying organization to align, focus and develop
strategies to efficiently address their resources (Minahan and Vigoroso, 2002). Additionally, a firm
needs to be able to identify the suppliers that create the biggest synergy (Narasimhan et al., 2001;
Simpson et al., 2002).
Purdy et al., (1994) have made a three-stage model, namely: preparation stage, the evaluation
stage and the feedback stage. Because of the clear definition of different stages in supplier evaluation,
this model will be considered in this study. This model gives specific insight in the perceived
effectiveness of supplier evaluation. By making use of this model firstly the perspective of the buying
organization will be presented, which will be followed by the perspective of the suppliers. The
determination of the suppliers’ perspective is composed by 49 organizations which were assessed by a
survey, and additionally 25 people were interviewed. The participants all worked at different
organizations with an average of 170 employees. All the suppliers were active in the automotive
branch.
5.2.1. Preparation stage
During the preparation stage, the buying organization has to define and align the goals within the
organization. The goals of the different strategic levels within the organization need to be embedded
into the performance metrics. Often the goals at the corporate level of the organization are financial
issues which should come forward in the expected performances of the suppliers. The non-financial
issues regarding the performances of the suppliers are evident for the business and operational-levels
within the organization and are referring to for example quality, research and development and
communication.
Additionally, supplier evaluation needs to get recognition from all the management layers within
the organization. By acknowledgement of the corporate level, the essence of supplier evaluation is
underpinned. By regular reporting of the results of supplier evaluation to the corporate level of the
organization, the progress which has been made and contributes to the corporate goals can be made
clear. Furthermore, by communicating the importance of supplier evaluation towards the suppliers, the
essence of the performances of the supplier can be underpinned.
Suppliers’ perspective
During the preparation phase the supplier is preparing for the evaluation itself. This preparation makes
the supplier look critically at the internal processes. By doing so, often the supplier already makes
changes to increase efficiency (Purdy et al., 1994). Therefore the suppliers themselves note this stage
as most useful stage of the evaluation process, because it helps them to focus and increase
effectiveness. Though, there has to be noticed the increase in effectiveness was especially shown in
the evaluation, rather than the overall effectiveness of the organization (Purdy et al., 1994).
Additionally, besides paying attention to its different internal processes, the suppliers also pay
significant attention to the documentation, by focusing on the type of and up-to-date documentation.
- 22 -
5.2.2. Evaluation stage
The actual evaluation of the suppliers can be a difficult task, since the information required for the
performance metrics often comes from different systems the organization is working with.
Furthermore there has to be made sure the right input will be used to determine the score of the
supplier, which requires training of the personnel (Gordon, 2005).
The metrics used for the evaluation of the suppliers are the same metrics as used for the selection
of suppliers, since the final selection of new suppliers essentially is a form of supplier evaluation
(Krause and Ellram, 1997). As stated by Cavinato and Kauffman (2000), supplier evaluation has two
different meanings. Firstly, the qualification of suppliers is referring to the pre-purchasing activities,
which involves the pre-qualification and final choice for an appropriate supplier. Secondly, supplier
performance evaluation evaluates the suppliers’ actual performance on a regular basis.
Although the supplier selection metrics can also be used for supplier evaluation, only a selection
of the supplier selection metrics will be used for the supplier evaluation on a regular basis. This is due
to the fact that some metrics are considered more important by the buying organization, though
changes rarely occur. An example can be the technical capability of a supplier.
By the evaluation of the performances of the supplier, areas that need extra attention can be
identified.
Suppliers’ perspective
According to Purdy et al., (1994), the criteria considered most important according to the suppliers
are: continuous improvement, documentation, communication, quality, cleanliness, delivery, plant
layout and focus on reality. Additionally, a number of suppliers stated that a significant number of
problems the supplier had to deal with remained undetected, since the evaluators used the official
forms which did not bring up all the issues that were considered important according to the supplier.
Some suppliers mentioned they only brought up a few problems since it was up to the evaluators to
discover them (Purdy et al., 1994).
5.2.3. Feedback stage
During the feedback stage it is critical the results of the evaluation will be communicated with the
supplier. Though, there has to be kept in mind this communication has to be in the form of a dialogue
in which the follow-up actions will be discussed. Information on both the goals and the capabilities
has to be shared to come to an agreement on the future performances of the supplier. There has to be
made sure the agreements have follow-up actions to effectively improve the performances of the
supplier in line with the goals of the buying organization. One of the follow-up actions could be the
participation of the supplier in the supplier development program to align the capabilities of the
supplier with the goals of the organization. This dialogue and the follow-up actions are crucial to
increase the performances of the suppliers (Gordon, 2005).
Suppliers’ perspective
The feedback stage was considered very important according to the suppliers, since the evaluators
provided the suppliers with insight in the strengths and weaknesses of the organization from an
outsider’s perspective. Though feedback was considered important, the type of feedback most of the
time was related to documentation. Therefore, the feedback was considered not that useful.
Most of the techniques used are based on weighting scoring methods, which are based on
opinions of purchasing managers. By making use of these methods, the knowledge of the purchasing
staff is fully utilized, though the final ranking of the suppliers heavily depends on the pre-determined
ranking, which causes the scoring to be subjective (Purdy et al., 1994).
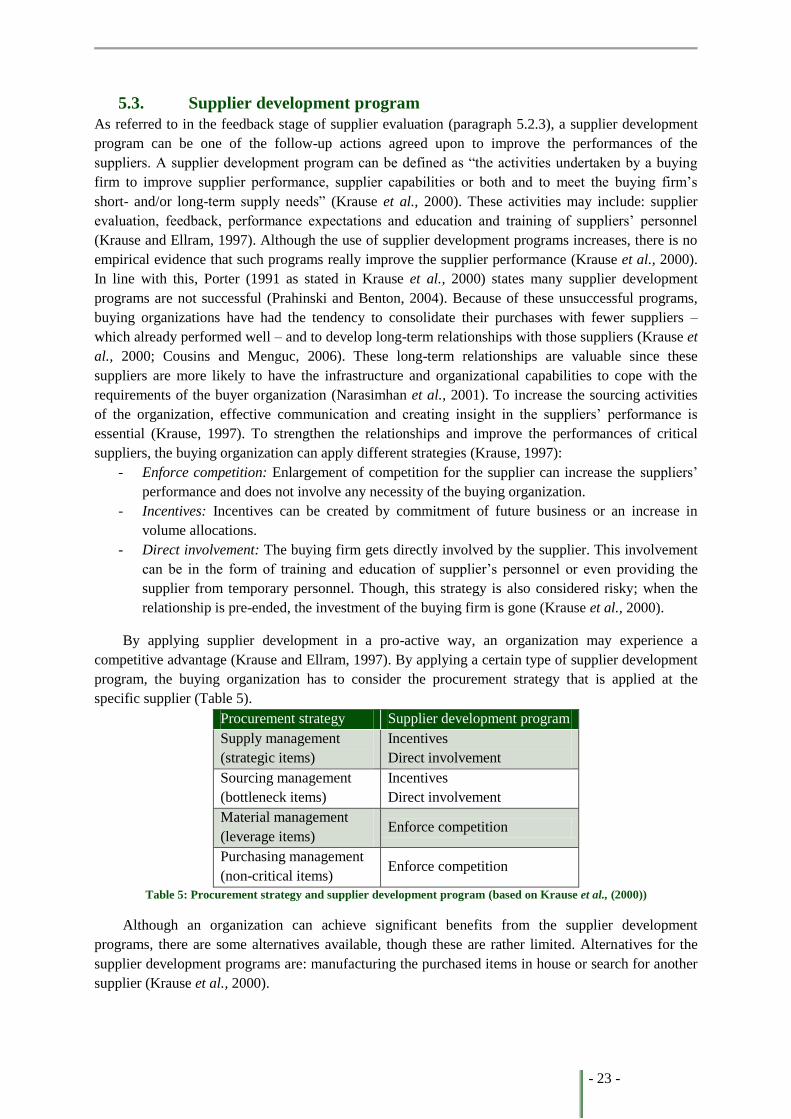
- 23 -
5.3. Supplier development program
As referred to in the feedback stage of supplier evaluation (paragraph 5.2.3), a supplier development
program can be one of the follow-up actions agreed upon to improve the performances of the
suppliers. A supplier development program can be defined as “the activities undertaken by a buying
firm to improve supplier performance, supplier capabilities or both and to meet the buying firm’s
short- and/or long-term supply needs” (Krause et al., 2000). These activities may include: supplier
evaluation, feedback, performance expectations and education and training of suppliers’ personnel
(Krause and Ellram, 1997). Although the use of supplier development programs increases, there is no
empirical evidence that such programs really improve the supplier performance (Krause et al., 2000).
In line with this, Porter (1991 as stated in Krause et al., 2000) states many supplier development
programs are not successful (Prahinski and Benton, 2004). Because of these unsuccessful programs,
buying organizations have had the tendency to consolidate their purchases with fewer suppliers –
which already performed well – and to develop long-term relationships with those suppliers (Krause et
al., 2000; Cousins and Menguc, 2006). These long-term relationships are valuable since these
suppliers are more likely to have the infrastructure and organizational capabilities to cope with the
requirements of the buyer organization (Narasimhan et al., 2001). To increase the sourcing activities
of the organization, effective communication and creating insight in the suppliers’ performance is
essential (Krause, 1997). To strengthen the relationships and improve the performances of critical
suppliers, the buying organization can apply different strategies (Krause, 1997):
- Enforce competition: Enlargement of competition for the supplier can increase the suppliers’
performance and does not involve any necessity of the buying organization.
- Incentives: Incentives can be created by commitment of future business or an increase in
volume allocations.
- Direct involvement: The buying firm gets directly involved by the supplier. This involvement
can be in the form of training and education of supplier’s personnel or even providing the
supplier from temporary personnel. Though, this strategy is also considered risky; when the
relationship is pre-ended, the investment of the buying firm is gone (Krause et al., 2000).
By applying supplier development in a pro-active way, an organization may experience a
competitive advantage (Krause and Ellram, 1997). By applying a certain type of supplier development
program, the buying organization has to consider the procurement strategy that is applied at the
specific supplier (Table 5).
Procurement strategy Supplier development program
Supply management
(strategic items)
Incentives
Direct involvement
Sourcing management
(bottleneck items)
Incentives
Direct involvement
Material management
(leverage items) Enforce competition
Purchasing management
(non-critical items) Enforce competition
Table 5: Procurement strategy and supplier development program (based on Krause et al., (2000))
Although an organization can achieve significant benefits from the supplier development
programs, there are some alternatives available, though these are rather limited. Alternatives for the
supplier development programs are: manufacturing the purchased items in house or search for another
supplier (Krause et al., 2000).
- 24 -
5.4. Conclusion
Since organizations are increasingly depending on the performances of its suppliers, it is crucial that
the performances of the suppliers are in line with the expected performances of the buying
organization. Therefore, it is essential the right supplier is selected.
Since there are a large number of techniques which can be used for the multi-criteria supplier
selection problem, there is searched for a technique which is able to deal with as much different
procurement situations as possible, with the emphasis on the final choice phase.
During this decision, the problem definition phase and the criteria definition phase are not taken
into account for the following reason: in the problem definition stage is stated this phase is not
particularly complex and therefore no explicit technique is needed. In the criteria definition phase a
few methods are shown. Additionally some publications focus on criteria to assess suppliers on, which
are a valid benchmark (Weber et al., 1991; Deshmukh and Chaudhari, 2011). In line with this
statement, these criteria are further considered in this study. The metrics that should be used for
assessing the suppliers according to the literature are based on the criteria formulated by Dickson in
1966. There have been a number of reviews, which ensure the validity of these criteria. Because of the
different reviews that have been published, the overall number of articles in which the criteria are
mentioned is used to determine which criteria are considered crucial. Looking at the reviews the
following criteria; Price, Quality, Delivery, Production facilities and capacity, Technical capability,
Financial position, Management and organization, Geographical location, Repair service and
Performance history are considered as the ten most important criteria.
As shown in Table 4 the Quasi-compensatory models and the AHP methodology are applicable in
most cases. After taking a closer look to both techniques, it can be derived the AHP methodology uses
the Quasi-compensatory models as a basis and adds pair-wise comparisons.
It is stated by Tahriri et al., (2008) the AHP methodology is a proved model for making supplier
selection decisions. The AHP methodology offers the possibility to rank the criteria based on the
judgment of the decision maker. This is an important aspect considering each organization is different
and therefore demands regarding the suppliers differ. Considering these comments, the AHP
methodology will be applied during this study.
During the supplier evaluation three different phases are differentiated. In the preparation stage it
is essential the metrics on which the suppliers are assessed, contain the goals of the buying
organization on corporate, business and operational level. By announcing the assessment, suppliers
start evaluating their internal processes critically to increase efficiency. Though, they mainly focus on
the performance metrics addressed by the buying organization.
During the actual evaluation it is critical that all the information needed is provided and generated
in the right way, since based on these outcomes conclusions will be drawn. The topics addressed by
the performance metrics, need to address all the important processes at the supplier.
In the feedback stage the results of the assessment are discussed and follow-up actions are
formulated. It is important this feedback stage will be in the form of a dialogue in which the results are
discussed and an agreement is made on the improvement of the performances.
One of the actions that can be considered to improve the performances of the supplier is by using
a supplier development program. This program is formulated by the buying organization and can be in
different forms: enforce competition, incentives and/or direct involvement. By deciding on the actions
taken in the supplier development program, the type of procurement strategy applied by this supplier
has to be taken in consideration.
- 25 -
6. Conclusion literature study In this part an overall conclusion will be drawn on the literature study. By doing so, the first and
second sub- question will be answered.
Different factors are of influence on the logistical performance of the organizations’ suppliers. In
paragraph 2.1 the different and most important characteristics of suppliers are mentioned as being
culture, technology and relationship. These three elements affect how a supplier and its’ employees are
behaving. It determines if the supplier is capable of dealing with the requirements set by the buying
organization and what type of relationship can be developed with the supplier.
The relationship arises from the trust the buyer organization has in the supplier, which has an
influence on the level of commitment the supplier has towards the buying organization (Chapter 4).
The interactions between these two elements form the basis of the relation and have a strong influence
on how close the relationship will be.
The characteristics of the supplier, type of product and the type of relationship the buyer and
supplier have, have a direct and indirect influence on the procurement activities of the buying
organization regarding the supplier. The procurement strategy handled (Chapter 3) by the buying
organization is to “minimize supply risk and make the most potential buying power” (Kraljic, 1983).
In the Kraljic matrix a clear overview of different procurement strategies is created. The basis of the
Kraljic matrix is the type of product that is procured. The importance of the procurement and the
complexity of the supply market determine the type of good.
The supplier the procurement strategy can be derived from the type of good, the supplier
characteristics and the relationship between the buying organization and the supplier. These different
factors answer the first research question: Which factors do have an influence on the performance of
the suppliers?
Since there has been quite some research on how to determine the performances of a supplier,
different metrics have been proposed. Dickson proposed different metrics which have been reviewed
by different authors. The proposed metrics and the analysis of the reviews on them is shown in
paragraph 5.1.2. From these publications there can be concluded that price, quality and delivery are
the most crucial metrics. Production facilities and capacity and technical capability are among the
most important criteria, though these are considerably less important than the most critical criteria.
Furthermore, financial position, management and organization, geographical location, repair service
and performance history are the additional criteria ranked in the top ten of the analysis, though the
importance of these criteria is considerably less.
The influences mentioned are the ten criteria that have most influence on the performance of the
suppliers and therefore answer the second research question: What performance metrics can be
applied to assess the logistical performances of the suppliers?
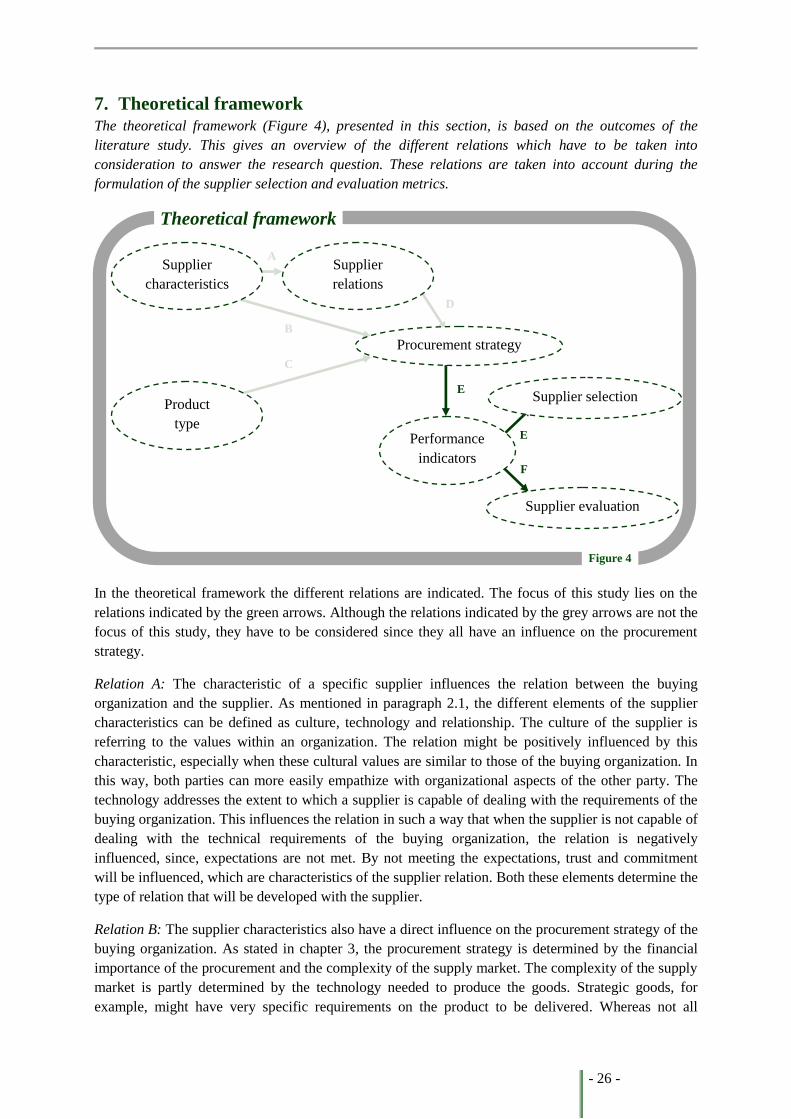
- 26 -
7. Theoretical framework The theoretical framework (Figure 4), presented in this section, is based on the outcomes of the
literature study. This gives an overview of the different relations which have to be taken into
consideration to answer the research question. These relations are taken into account during the
formulation of the supplier selection and evaluation metrics.
In the theoretical framework the different relations are indicated. The focus of this study lies on the
relations indicated by the green arrows. Although the relations indicated by the grey arrows are not the
focus of this study, they have to be considered since they all have an influence on the procurement
strategy.
Relation A: The characteristic of a specific supplier influences the relation between the buying
organization and the supplier. As mentioned in paragraph 2.1, the different elements of the supplier
characteristics can be defined as culture, technology and relationship. The culture of the supplier is
referring to the values within an organization. The relation might be positively influenced by this
characteristic, especially when these cultural values are similar to those of the buying organization. In
this way, both parties can more easily empathize with organizational aspects of the other party. The
technology addresses the extent to which a supplier is capable of dealing with the requirements of the
buying organization. This influences the relation in such a way that when the supplier is not capable of
dealing with the technical requirements of the buying organization, the relation is negatively
influenced, since, expectations are not met. By not meeting the expectations, trust and commitment
will be influenced, which are characteristics of the supplier relation. Both these elements determine the
type of relation that will be developed with the supplier.
Relation B: The supplier characteristics also have a direct influence on the procurement strategy of the
buying organization. As stated in chapter 3, the procurement strategy is determined by the financial
importance of the procurement and the complexity of the supply market. The complexity of the supply
market is partly determined by the technology needed to produce the goods. Strategic goods, for
example, might have very specific requirements on the product to be delivered. Whereas not all
A
C
F
E
E
D
D
A
C
B
B
Theoretical framework
Supplier
characteristics
Product
type
Procurement strategy
Supplier
relations
Performance
indicators
Supplier selection
Supplier evaluation
Figure 4
- 27 -
suppliers are capable of dealing with these requirements, the procurement strategy should consider the
availability of suppliers which are capable of dealing with the requirements. Therefore, the technology
characteristic has an influence on the procurement strategy.
Relation C: The product type is crucial to the type of procurement strategy that will be applied. Since
some products are more essential to the buying organization than others, naturally the importance of
the supplier will vary. The Kraljic matrix as outlined in paragraph 3.1., creates insight in the different
types of product and the related procurement strategies. In the Kraljic matrix different procurement
strategies are defined, which are based on the type of product procured. In line with this matrix, the
type of product has a direct influence on the procurement strategy applied by the buying organization.
Relation D: The relationship between the buying organization and its supplier has a direct influence on
the procurement strategy applied by the buying organization. As stated in chapter 4, trust and
commitment are the essential elements of the relation between the buying organization and the
supplier. By showing a high level of commitment to the buying organization, the relationship between
the organizations might change positively and therefore a different procurement strategy will possibly
be applied.
The different relations described above all have an influence on the procurement strategy of the
buying organization. In its turn, the procurement strategy itself has an influence on the performances
of the supplier. This is due to the fact that a close cooperation with a supplier might ensure the supplier
will perform differently compared to an open market negotiation. The development of this close
cooperation is determined by the different relations (A, B, C and D) mentioned above. The different
relations and elements outlined above contribute to the answer of the first sub-question: Which factors
do have an influence on the logistical performance of the suppliers?
Relation E: Part of the procurement strategy is setting the requirements for the supplier of the buying
organization. Once these requirements are set, it is important to gain insight in the performances of the
suppliers to ensure these performances cope with the standards of the buying organization. Insight is
created by making use of different performance metrics. The performance metrics are emphasized by
different procurement strategies: one performance metric is more important within one procurement
strategy than another metric is. Though, all the formulated performance metrics can be used in the
different procurement strategies, but to a different extent of importance.
Relation F: Performance indicators can be separated into supplier evaluation and selection metrics.
The supplier selection metrics are used for the selection of new suppliers. A number of potential
selection methodologies have been proposed of which an overview is created in paragraph 5.1. By
assessing the potential suppliers, an overview will be created on the level of performances these
suppliers are able to deliver. This insight provides the buying organization the opportunity to select the
supplier which fits best with the set standards. After this selection is carried out, a final choice can be
made. Which metrics are emphasized most, is determined by the procurement strategy that will be
applied.
Relation G: A number of formulated performance metrics are used for the evaluation of the
performances of the suppliers. If the selection of the supplier has taken place, the supplier will be
evaluated on a regular basis. By clearly defining the organizational goals, insight can be created in the
performances and whether these are satisfying or need to be improved. In paragraph 5.2 different
stages of the supplier evaluation are discussed.
- 28 -
The relations E, F and G are all related to the performance metrics applied by the buying
organization. The procurement strategy has a direct influence on the performance metrics applied to
gain insight in the performances of the suppliers. If the performance metrics are formulated, a
difference can be made between the performance metrics which will be applied for supplier selection
and the performance metrics which will be applied for supplier evaluation. The performance metrics
for supplier selection are used to decide on the best, new supplier. The evaluation metrics are used to
gain insight in the performances of existing suppliers. The performance metrics formulated answer the
second sub-question: What performance metrics can be applied to assess the logistical performances
of the suppliers?
The set of relations described above can be divided into two categories. The first category
consists of relations A, B, C and D, which refer to the choice of a specific procurement strategy. This
choice might be influenced by several factors, which should therefore be considered by the
determination of the procurement strategy. The second category of relations (E, F and G) refers to the
execution of the procurement strategy. These relations include the process of supplier selection and
evaluation. Whereas the choice of procurement strategy has a central role, the relations should all be
taken into consideration before the strategy can be applied. Although this study focuses on the second
category, the first category will be taken into account.
- 29 -
8. Methodology This chapter provides an overview of the methodology used during the empirical part of this study.
Clarification will be provided in this chapter on the position of the different elements of the study.
First an overview will be provided of the different stages which will be gone through. Additionally,
clarification will be provided on the different data sources used.
8.1. Research design
To be able to answer the research question of this study, a case study research is conducted. A case
study research is a qualitative method of investigating, which contributes to the aim of this study to
create in-depth insight in the performances of the suppliers. Since these performances need to be
determined for one organization specifically, generalization of findings does not apply. Therefore, a
qualitative research design is more applicable than a quantitative research design (Eriksson &
Kovalainen, 2008).
In terms of the practical approach of this study, a single case study is conducted. A single case
study provides the opportunity to specifically focus on the specific case at hand. In this way, all
aspects of the research can easily be applied to the organization of Vencomatic. Since there is no aim
to generalize or compare cases, conducting a single case is sufficient.
8.2. Data sources
Different types of data sources are used to compose this study. The different data sources are
described below, including the reasoning why these sources are used.
8.2.1. Literature
First, a literature study has been conducted. Different sources of literature are used. The literature
study is based on scientific (E-) journals, the internet and books. The (E-) journals that are used are:
International Journal of Physical Distribution and Logistics Management, International Journal of
Operations & Production Management, Harvard Business Review, International Journal of
Production Economics and The Journal of Supply Chain Management: A Global Review of
Purchasing and Supply. Complementary information from case studies is also gathered by making use
of scientific (E-) journals and the internet. The scientific (E-) journals used for the case studies were
the same journals as used for the literature study. The case studies are used to complement the
conclusions of the literature study and to test its validity.
8.2.2. Interviews
The conclusions of the literature study were the input for the empirical part of this study. The
empirical part consists of several interviews and discussions with different types of respondents.
Interviews were conducted in order to gather a broad variety of information. Interviews “allow us to
enter into the other person’s perspective” (Patton, 2002). Whereas the other person’s perspective is of
importance to the study, it is important to select the right respondents who are able to provide the
information needed. Furthermore, the respondents should be able to represent their organization. In
this way, not solely personal perspectives were obtained. All interviews were held in Dutch to prevent
misunderstandings. The interviews served different purposes: from creating a better understanding of
supplier selection processes, to determining performance metrics for Vencomatic specifically.
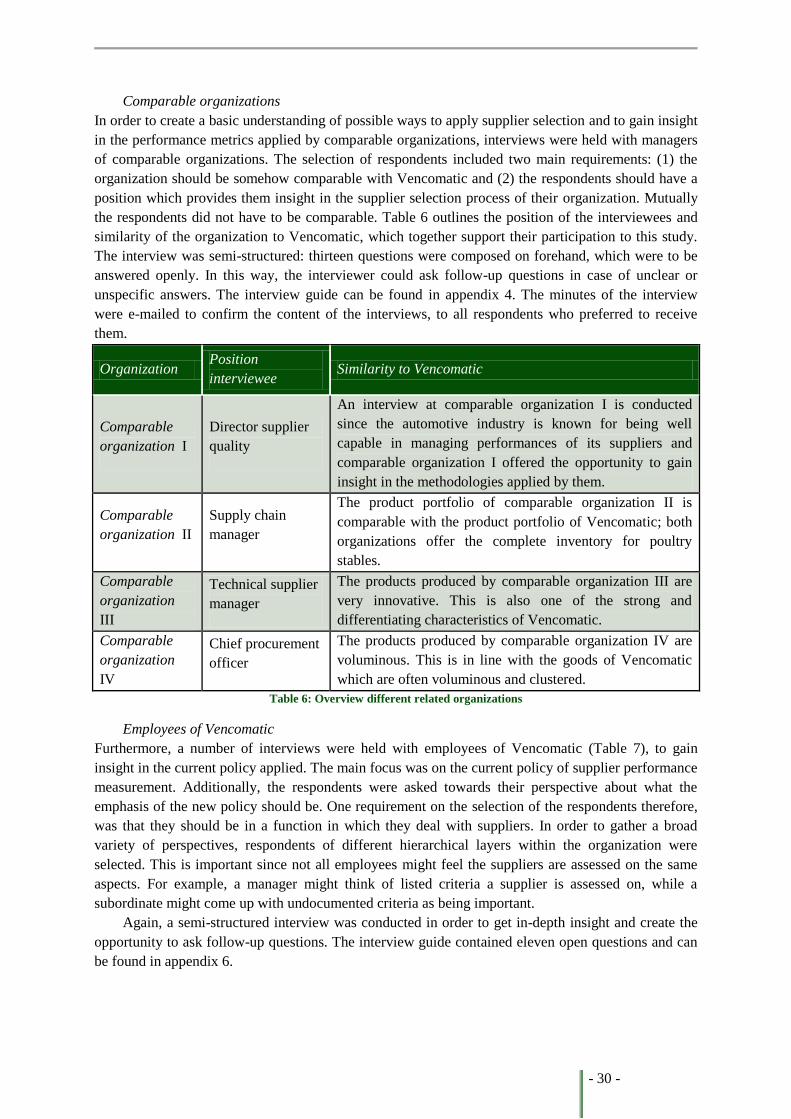
- 30 -
Comparable organizations
In order to create a basic understanding of possible ways to apply supplier selection and to gain insight
in the performance metrics applied by comparable organizations, interviews were held with managers
of comparable organizations. The selection of respondents included two main requirements: (1) the
organization should be somehow comparable with Vencomatic and (2) the respondents should have a
position which provides them insight in the supplier selection process of their organization. Mutually
the respondents did not have to be comparable. Table 6 outlines the position of the interviewees and
similarity of the organization to Vencomatic, which together support their participation to this study.
The interview was semi-structured: thirteen questions were composed on forehand, which were to be
answered openly. In this way, the interviewer could ask follow-up questions in case of unclear or
unspecific answers. The interview guide can be found in appendix 4. The minutes of the interview
were e-mailed to confirm the content of the interviews, to all respondents who preferred to receive
them.
Organization Position
interviewee Similarity to Vencomatic
Comparable
organization I
Director supplier
quality
An interview at comparable organization I is conducted
since the automotive industry is known for being well
capable in managing performances of its suppliers and
comparable organization I offered the opportunity to gain
insight in the methodologies applied by them.
Comparable
organization II
Supply chain
manager
The product portfolio of comparable organization II is
comparable with the product portfolio of Vencomatic; both
organizations offer the complete inventory for poultry
stables.
Comparable
organization
III
Technical supplier
manager
The products produced by comparable organization III are
very innovative. This is also one of the strong and
differentiating characteristics of Vencomatic.
Comparable
organization
IV
Chief procurement
officer
The products produced by comparable organization IV are
voluminous. This is in line with the goods of Vencomatic
which are often voluminous and clustered.
Table 6: Overview different related organizations
Employees of Vencomatic
Furthermore, a number of interviews were held with employees of Vencomatic (Table 7), to gain
insight in the current policy applied. The main focus was on the current policy of supplier performance
measurement. Additionally, the respondents were asked towards their perspective about what the
emphasis of the new policy should be. One requirement on the selection of the respondents therefore,
was that they should be in a function in which they deal with suppliers. In order to gather a broad
variety of perspectives, respondents of different hierarchical layers within the organization were
selected. This is important since not all employees might feel the suppliers are assessed on the same
aspects. For example, a manager might think of listed criteria a supplier is assessed on, while a
subordinate might come up with undocumented criteria as being important.
Again, a semi-structured interview was conducted in order to get in-depth insight and create the
opportunity to ask follow-up questions. The interview guide contained eleven open questions and can
be found in appendix 6.
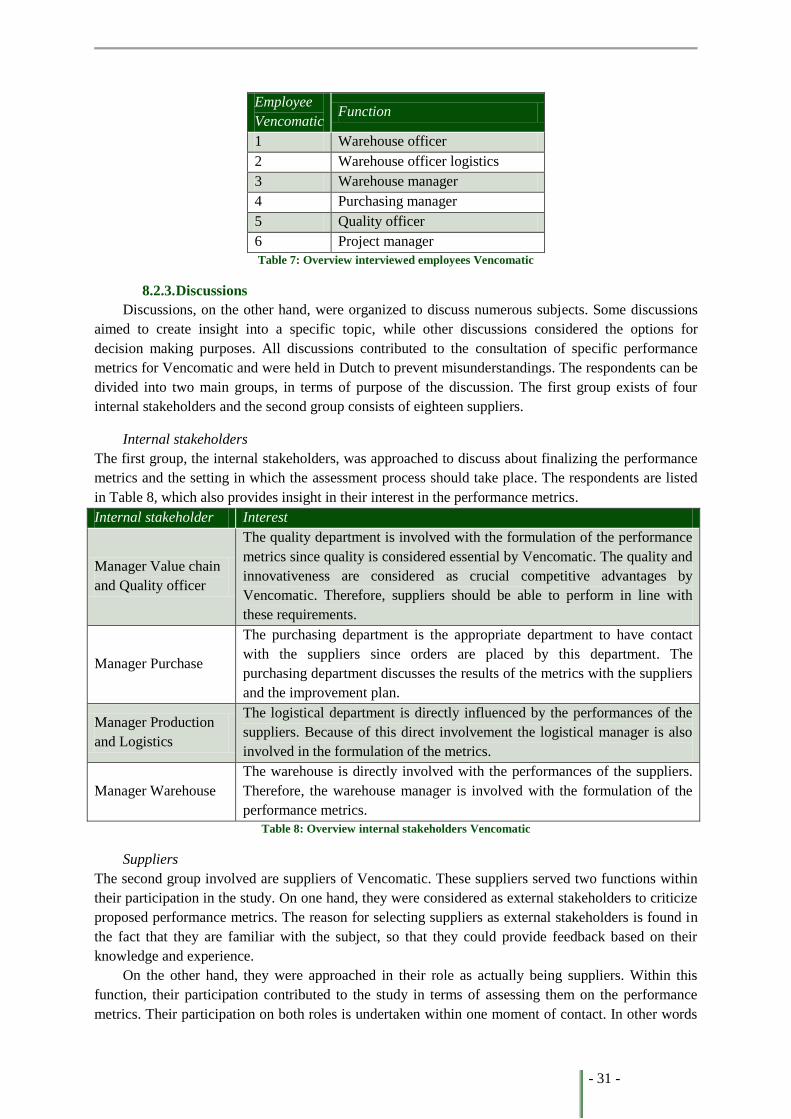
- 31 -
Employee
Vencomatic Function
1 Warehouse officer
2 Warehouse officer logistics
3 Warehouse manager
4 Purchasing manager
5 Quality officer
6 Project manager
Table 7: Overview interviewed employees Vencomatic
8.2.3. Discussions
Discussions, on the other hand, were organized to discuss numerous subjects. Some discussions
aimed to create insight into a specific topic, while other discussions considered the options for
decision making purposes. All discussions contributed to the consultation of specific performance
metrics for Vencomatic and were held in Dutch to prevent misunderstandings. The respondents can be
divided into two main groups, in terms of purpose of the discussion. The first group exists of four
internal stakeholders and the second group consists of eighteen suppliers.
Internal stakeholders
The first group, the internal stakeholders, was approached to discuss about finalizing the performance
metrics and the setting in which the assessment process should take place. The respondents are listed
in Table 8, which also provides insight in their interest in the performance metrics.
Internal stakeholder Interest
Manager Value chain
and Quality officer
The quality department is involved with the formulation of the performance
metrics since quality is considered essential by Vencomatic. The quality and
innovativeness are considered as crucial competitive advantages by
Vencomatic. Therefore, suppliers should be able to perform in line with
these requirements.
Manager Purchase
The purchasing department is the appropriate department to have contact
with the suppliers since orders are placed by this department. The
purchasing department discusses the results of the metrics with the suppliers
and the improvement plan.
Manager Production
and Logistics
The logistical department is directly influenced by the performances of the
suppliers. Because of this direct involvement the logistical manager is also
involved in the formulation of the metrics.
Manager Warehouse
The warehouse is directly involved with the performances of the suppliers.
Therefore, the warehouse manager is involved with the formulation of the
performance metrics.
Table 8: Overview internal stakeholders Vencomatic
Suppliers
The second group involved are suppliers of Vencomatic. These suppliers served two functions within
their participation in the study. On one hand, they were considered as external stakeholders to criticize
proposed performance metrics. The reason for selecting suppliers as external stakeholders is found in
the fact that they are familiar with the subject, so that they could provide feedback based on their
knowledge and experience.
On the other hand, they were approached in their role as actually being suppliers. Within this
function, their participation contributed to the study in terms of assessing them on the performance
metrics. Their participation on both roles is undertaken within one moment of contact. In other words
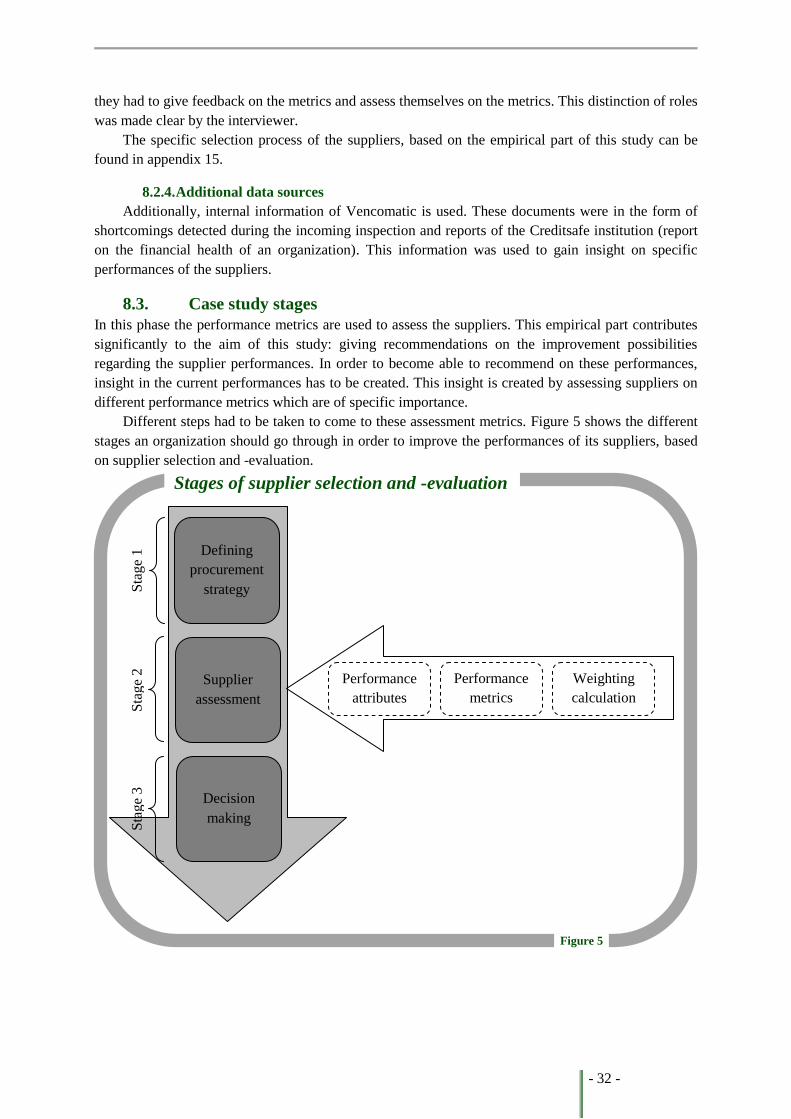
- 32 -
Defining
procurement
strategy
Decision
making
Supplier
assessment
Sta
ge
1
Sta
ge
2
Sta
ge
3
Performance
attributes
Performance
metrics
Weighting
calculation
they had to give feedback on the metrics and assess themselves on the metrics. This distinction of roles
was made clear by the interviewer.
The specific selection process of the suppliers, based on the empirical part of this study can be
found in appendix 15.
8.2.4. Additional data sources
Additionally, internal information of Vencomatic is used. These documents were in the form of
shortcomings detected during the incoming inspection and reports of the Creditsafe institution (report
on the financial health of an organization). This information was used to gain insight on specific
performances of the suppliers.
8.3. Case study stages
In this phase the performance metrics are used to assess the suppliers. This empirical part contributes
significantly to the aim of this study: giving recommendations on the improvement possibilities
regarding the supplier performances. In order to become able to recommend on these performances,
insight in the current performances has to be created. This insight is created by assessing suppliers on
different performance metrics which are of specific importance.
Different steps had to be taken to come to these assessment metrics. Figure 5 shows the different
stages an organization should go through in order to improve the performances of its suppliers, based
on supplier selection and -evaluation.
Stages of supplier selection and -evaluation Stages of supplier selection and -evaluation
Figure 5
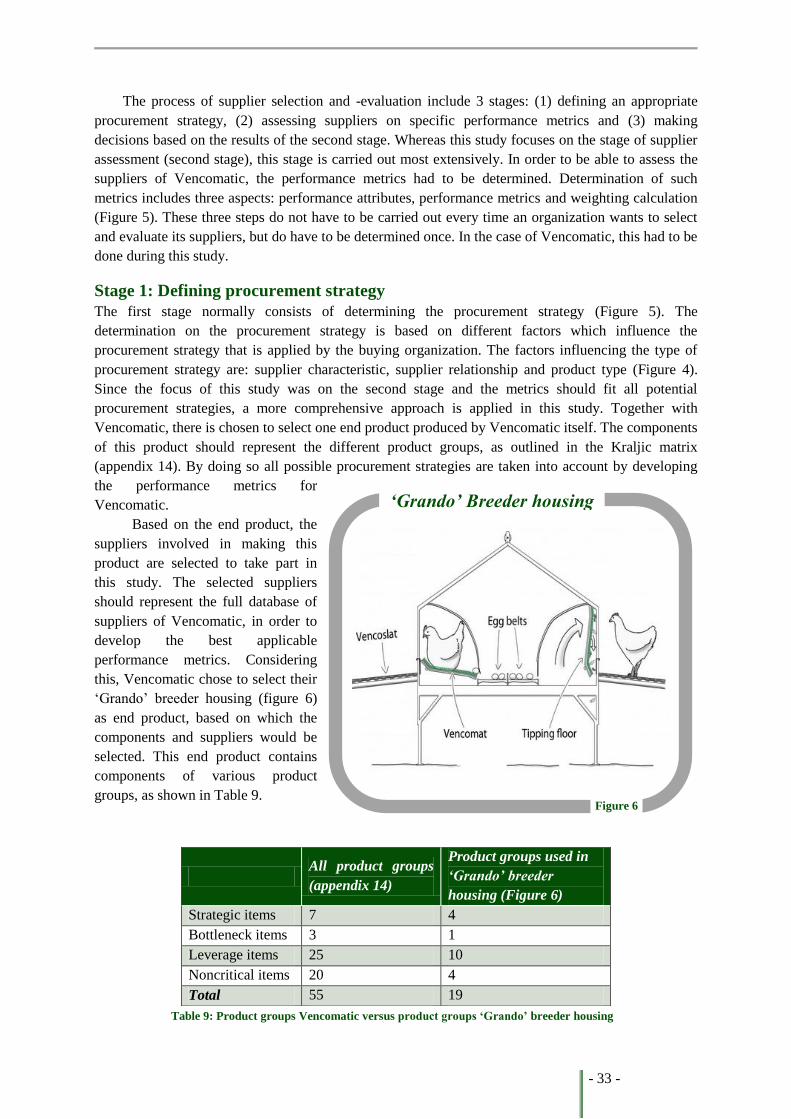
- 33 -
The process of supplier selection and -evaluation include 3 stages: (1) defining an appropriate
procurement strategy, (2) assessing suppliers on specific performance metrics and (3) making
decisions based on the results of the second stage. Whereas this study focuses on the stage of supplier
assessment (second stage), this stage is carried out most extensively. In order to be able to assess the
suppliers of Vencomatic, the performance metrics had to be determined. Determination of such
metrics includes three aspects: performance attributes, performance metrics and weighting calculation
(Figure 5). These three steps do not have to be carried out every time an organization wants to select
and evaluate its suppliers, but do have to be determined once. In the case of Vencomatic, this had to be
done during this study.
Stage 1: Defining procurement strategy
The first stage normally consists of determining the procurement strategy (Figure 5). The
determination on the procurement strategy is based on different factors which influence the
procurement strategy that is applied by the buying organization. The factors influencing the type of
procurement strategy are: supplier characteristic, supplier relationship and product type (Figure 4).
Since the focus of this study was on the second stage and the metrics should fit all potential
procurement strategies, a more comprehensive approach is applied in this study. Together with
Vencomatic, there is chosen to select one end product produced by Vencomatic itself. The components
of this product should represent the different product groups, as outlined in the Kraljic matrix
(appendix 14). By doing so all possible procurement strategies are taken into account by developing
the performance metrics for
Vencomatic.
Based on the end product, the
suppliers involved in making this
product are selected to take part in
this study. The selected suppliers
should represent the full database of
suppliers of Vencomatic, in order to
develop the best applicable
performance metrics. Considering
this, Vencomatic chose to select their
‘Grando’ breeder housing (figure 6)
as end product, based on which the
components and suppliers would be
selected. This end product contains
components of various product
groups, as shown in Table 9.
All product groups
(appendix 14)
Product groups used in
‘Grando’ breeder
housing (Figure 6)
Strategic items 7 4
Bottleneck items 3 1
Leverage items 25 10
Noncritical items 20 4
Total 55 19
Table 9: Product groups Vencomatic versus product groups ‘Grando’ breeder housing
Figure 6
‘Grando’ Breeder housing
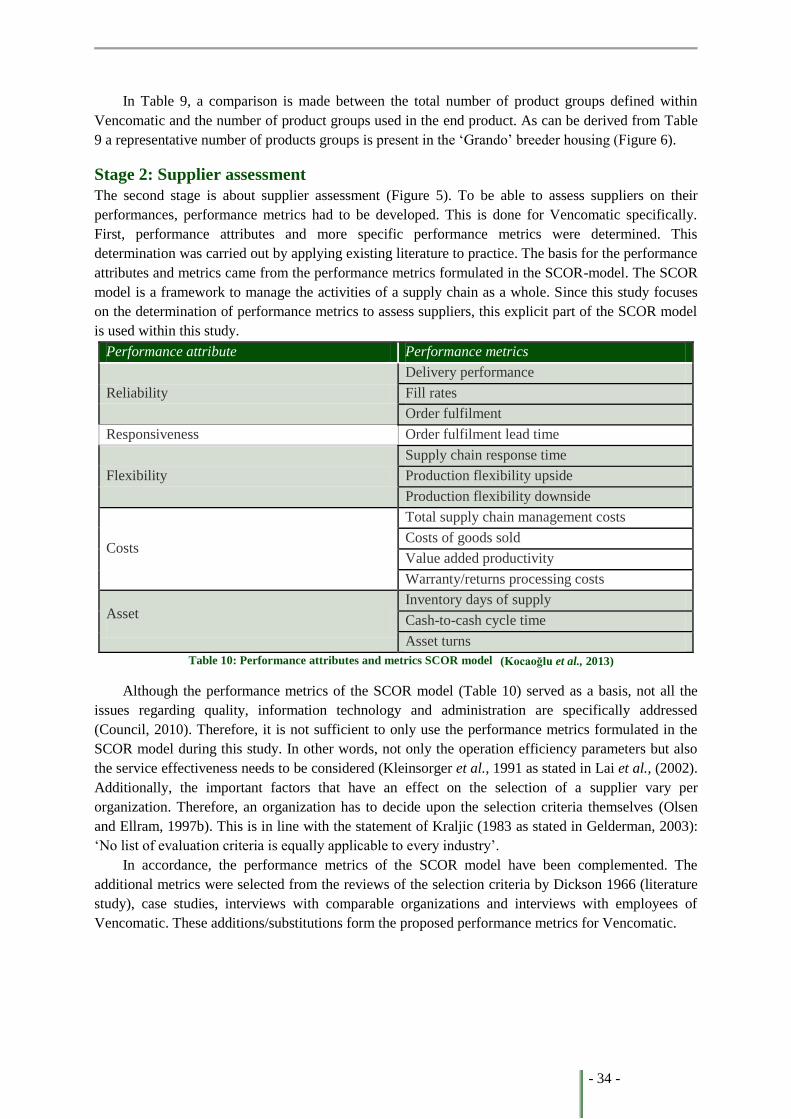
- 34 -
In Table 9, a comparison is made between the total number of product groups defined within
Vencomatic and the number of product groups used in the end product. As can be derived from Table
9 a representative number of products groups is present in the ‘Grando’ breeder housing (Figure 6).
Stage 2: Supplier assessment
The second stage is about supplier assessment (Figure 5). To be able to assess suppliers on their
performances, performance metrics had to be developed. This is done for Vencomatic specifically.
First, performance attributes and more specific performance metrics were determined. This
determination was carried out by applying existing literature to practice. The basis for the performance
attributes and metrics came from the performance metrics formulated in the SCOR-model. The SCOR
model is a framework to manage the activities of a supply chain as a whole. Since this study focuses
on the determination of performance metrics to assess suppliers, this explicit part of the SCOR model
is used within this study.
Performance attribute Performance metrics
Reliability
Delivery performance
Fill rates
Order fulfilment
Responsiveness Order fulfilment lead time
Flexibility
Supply chain response time
Production flexibility upside
Production flexibility downside
Costs
Total supply chain management costs
Costs of goods sold
Value added productivity
Warranty/returns processing costs
Asset Inventory days of supply
Cash-to-cash cycle time
Asset turns
Table 10: Performance attributes and metrics SCOR model
Although the performance metrics of the SCOR model (Table 10) served as a basis, not all the
issues regarding quality, information technology and administration are specifically addressed
(Council, 2010). Therefore, it is not sufficient to only use the performance metrics formulated in the
SCOR model during this study. In other words, not only the operation efficiency parameters but also
the service effectiveness needs to be considered (Kleinsorger et al., 1991 as stated in Lai et al., (2002).
Additionally, the important factors that have an effect on the selection of a supplier vary per
organization. Therefore, an organization has to decide upon the selection criteria themselves (Olsen
and Ellram, 1997b). This is in line with the statement of Kraljic (1983 as stated in Gelderman, 2003):
‘No list of evaluation criteria is equally applicable to every industry’.
In accordance, the performance metrics of the SCOR model have been complemented. The
additional metrics were selected from the reviews of the selection criteria by Dickson 1966 (literature
study), case studies, interviews with comparable organizations and interviews with employees of
Vencomatic. These additions/substitutions form the proposed performance metrics for Vencomatic.
(Kocaoğlu et al., 2013)
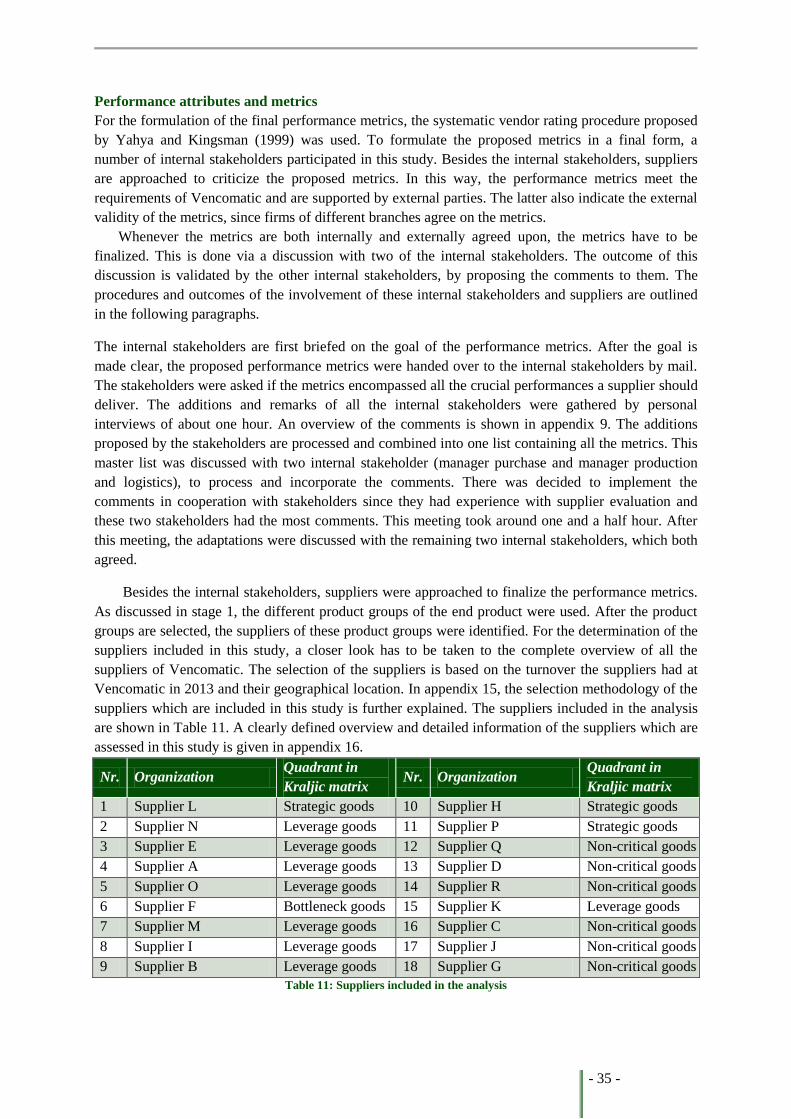
- 35 -
Performance attributes and metrics
For the formulation of the final performance metrics, the systematic vendor rating procedure proposed
by Yahya and Kingsman (1999) was used. To formulate the proposed metrics in a final form, a
number of internal stakeholders participated in this study. Besides the internal stakeholders, suppliers
are approached to criticize the proposed metrics. In this way, the performance metrics meet the
requirements of Vencomatic and are supported by external parties. The latter also indicate the external
validity of the metrics, since firms of different branches agree on the metrics.
Whenever the metrics are both internally and externally agreed upon, the metrics have to be
finalized. This is done via a discussion with two of the internal stakeholders. The outcome of this
discussion is validated by the other internal stakeholders, by proposing the comments to them. The
procedures and outcomes of the involvement of these internal stakeholders and suppliers are outlined
in the following paragraphs.
The internal stakeholders are first briefed on the goal of the performance metrics. After the goal is
made clear, the proposed performance metrics were handed over to the internal stakeholders by mail.
The stakeholders were asked if the metrics encompassed all the crucial performances a supplier should
deliver. The additions and remarks of all the internal stakeholders were gathered by personal
interviews of about one hour. An overview of the comments is shown in appendix 9. The additions
proposed by the stakeholders are processed and combined into one list containing all the metrics. This
master list was discussed with two internal stakeholder (manager purchase and manager production
and logistics), to process and incorporate the comments. There was decided to implement the
comments in cooperation with stakeholders since they had experience with supplier evaluation and
these two stakeholders had the most comments. This meeting took around one and a half hour. After
this meeting, the adaptations were discussed with the remaining two internal stakeholders, which both
agreed.
Besides the internal stakeholders, suppliers were approached to finalize the performance metrics.
As discussed in stage 1, the different product groups of the end product were used. After the product
groups are selected, the suppliers of these product groups were identified. For the determination of the
suppliers included in this study, a closer look has to be taken to the complete overview of all the
suppliers of Vencomatic. The selection of the suppliers is based on the turnover the suppliers had at
Vencomatic in 2013 and their geographical location. In appendix 15, the selection methodology of the
suppliers which are included in this study is further explained. The suppliers included in the analysis
are shown in Table 11. A clearly defined overview and detailed information of the suppliers which are
assessed in this study is given in appendix 16.
Nr. Organization Quadrant in
Kraljic matrix Nr. Organization
Quadrant in
Kraljic matrix
1 Supplier L Strategic goods 10 Supplier H Strategic goods
2 Supplier N Leverage goods 11 Supplier P Strategic goods
3 Supplier E Leverage goods 12 Supplier Q Non-critical goods
4 Supplier A Leverage goods 13 Supplier D Non-critical goods
5 Supplier O Leverage goods 14 Supplier R Non-critical goods
6 Supplier F Bottleneck goods 15 Supplier K Leverage goods
7 Supplier M Leverage goods 16 Supplier C Non-critical goods
8 Supplier I Leverage goods 17 Supplier J Non-critical goods
9 Supplier B Leverage goods 18 Supplier G Non-critical goods
Table 11: Suppliers included in the analysis
- 36 -
Next to finalizing the performance metrics, the suppliers are asked to score themselves on the
performance metrics, based on the performances they deliver to Vencomatic. Before the suppliers
started scoring, there was explained these scores would be compared to the performances measured by
Vencomatic. If these performances did not correspond, performances had to be improved due to the
fact the performances had to meet to the performances that were agreed upon.
All the suppliers were contacted by phone to inquire their willingness to cooperate. During the
phone call the general goal was explained. Additionally, an e-mail is sent containing all the
performance attributes and metrics. The phone calls showed all the suppliers were directly willing to
cooperate, except for one who wanted to discuss the collaboration internally. The internal
collaboration resulted in a decision to not take part in this study. To increase cooperation, the feedback
provided by the suppliers is anonymized, since several suppliers asked for this.
There is decided to interview half of the suppliers personally, and contact the other half by mail.
Reason to make this distinction is due to the type of feedback. In a personal interview the interviewer
is tending to provide additional information on the background of the metrics. By assessing several
suppliers by mail, so without additional background information on the metrics, the clearness of the
metrics could be tested.
When the suppliers were divided into two different groups, their position in the Kraljic matrix
was taken into account. There is strived for incorporating suppliers of each quadrant of the Kraljic
matrix in both ways of contact. This was possible, except for the bottleneck goods, since only one
supplier is located in this quadrant. There was chosen to contact this supplier by a personal interview
in order to gain background information.
The suppliers who were personally interviewed were asked to prepare the interview by gathering
the needed information to score the performances. During the interview, first the general goal of the
supplier selection metrics is explained again. Next, the different metrics were discussed one by one.
There was asked for feedback on the performance metrics, to increase the validity of these metrics.
Furthermore, the suppliers were asked to score themselves on the metrics regarding the performances
they deliver to Vencomatic. Additionally, it is crucial the suppliers share the level of importance on
supplier selection and the metrics used to do so. The suppliers assessed by a personal interview are: A,
B, C, D, F, H, I, L and N.
Besides, a number of suppliers were assessed by mail. After the contact by phone, an e-mail is
send in which the overall goal is explained again. In the attachment the performance metrics were
provided in an excel sheet, on which the supplier is asked to give feedback and to score themselves on
the performance metrics. After one week a reminder was send to the suppliers who did not respond.
Additionally, the suppliers who did not responded after two weeks were contacted by phone, which
resulted in a response of five out of nine (55,56%). The suppliers O, P, Q and R did not respond.
Suppliers assessed via e-mail are: E, G, J, K and M.
An overview of the comments of the suppliers is shown in appendix 10. The feedback was
discussed with the internal stakeholders (manager purchase and manager production and logistics), to
process and incorporate the comments. In this way, processing of the comments of both the external
and internal stakeholders is done consistently. This meeting took about one hour. After, the
adaptations were discussed with the two remaining internal stakeholders, which both agreed.
Weighting
After confirming the final performance metrics, the weights of the different metrics have to be
determined. The weights are determined by using the AHP methodology. According to the procedure
proposed by Yahya and Kingsman (1999), the determination of the weights is done in accordance and
- 37 -
cooperation with the internal stakeholders mentioned. Since the determination of the weights is a time
consuming process, the calculation was done with two internal stakeholders (manager purchase and
manager production and logistics).
Interviews are conducted with the remaining two internal stakeholders to discuss the proposed
weighting on the different performance attributes and metrics. The interviews took about one and a
half hours each. Both internal stakeholders confirmed and underpinned the proposed weights. The
calculation of these weights is shown in appendix 12.
Stage 3: Decision making
The third stage is about decision making. Normally, the scores of the suppliers will be analysed in this
stage and conclusions will be drawn. The final decision is made on the performances of the supplier
and the potential new supplier is selected.
However, the focus of this study is on the second stage of Figure 5. The executing of the third
stage is therefore somehow different in this study. After the data of the second stage is collected, this
data is analysed. Outstanding results are outlined and explained where possible. Next, these results are
related to the Kraljic matrix in order to get an overview of differences between the four quadrants.
Based on this division of the suppliers, strengths and weaknesses were identified. In case of
weaknesses, suggestions were made to improve the suppliers’ performances. In this way, the
performances of the suppliers individually, as well as the performances of the suppliers within one
quadrant are synthesized. In terms of the framework of this study, no conclusions or final decisions are
made towards the selection of suppliers.
8.4. Validity
The validity of a study is determined by the internal and external validity. Ideally, the internal and
external validity are high (Vaus, 2001).
Internal validity
The internal validity shows the confidence by which a research can support the conclusions which are
drawn (Vaus, 2001). An extensive literature study has been conducted to create insight in the
relationships between supplier performance and other factors. As stated in the literature study and the
theoretical framework, different factors influence the performances of suppliers. Testing of all the
mentioned relations would not be feasible within the set time frame. Since a number of relations are
confirmed theoretically, though not in this specific case, the internal validity of this study could be
improved by empirically testing these relations. However, to increase the internal validity of this
study, a larger number of stakeholders could be involved in the process of formulating the
performances metrics.
External validity
The external validity shows to which extend the results from study can be generalized beyond the
specific study (Vaus, 2001). The study conducted is a case study which implies the study is based on a
single or a series of cases (Vaus, 2001). Since the study is based on a single case, the external validity
of this study is low. Additionally, a few suppliers are assessed in this study which gives an indication
on the performances of the other suppliers. To increase the external validity of the study, interviews
are conducted at organizations that are comparable to Vencomatic in one way or another. During the
interviews, the literature is criticized and insight is created in how these organizations create insight in
the performances of their suppliers. Taking in consideration this input, the external validity of the
study is increased.
- 38 -
8.5. Reliability
The reliability shows to which extend a measurement generates the same output if the measurement is
repeated (Vaus, 2001). Since the study conducted is a qualitative study, chances are high that a
replication of the study would not generate the same outcome. This is due to the fact the interviews
conducted are qualitative and semi-structured, which offered the possibility to ask additional questions
to get more specific information. By repeating the interviews, it is dependent on the answers of the
interviewee and the additional questions of the interviewer if the interview produces the same output.
Though, during the interview there is tried to structure the interview, by asking the interviewee to
answer the proposed questions in order to get reliable interviews.
Additionally, a number of suppliers are assessed in the study. Depending on the performances of
the suppliers in a specific period, conclusions were drawn. If the study is repeated and the
performances of the suppliers have changed due to for example an investment in outgoing inspection,
the outcome of the assessment will be different. Therefore, there are a number of variables which have
a big influence on the reliability of the study.
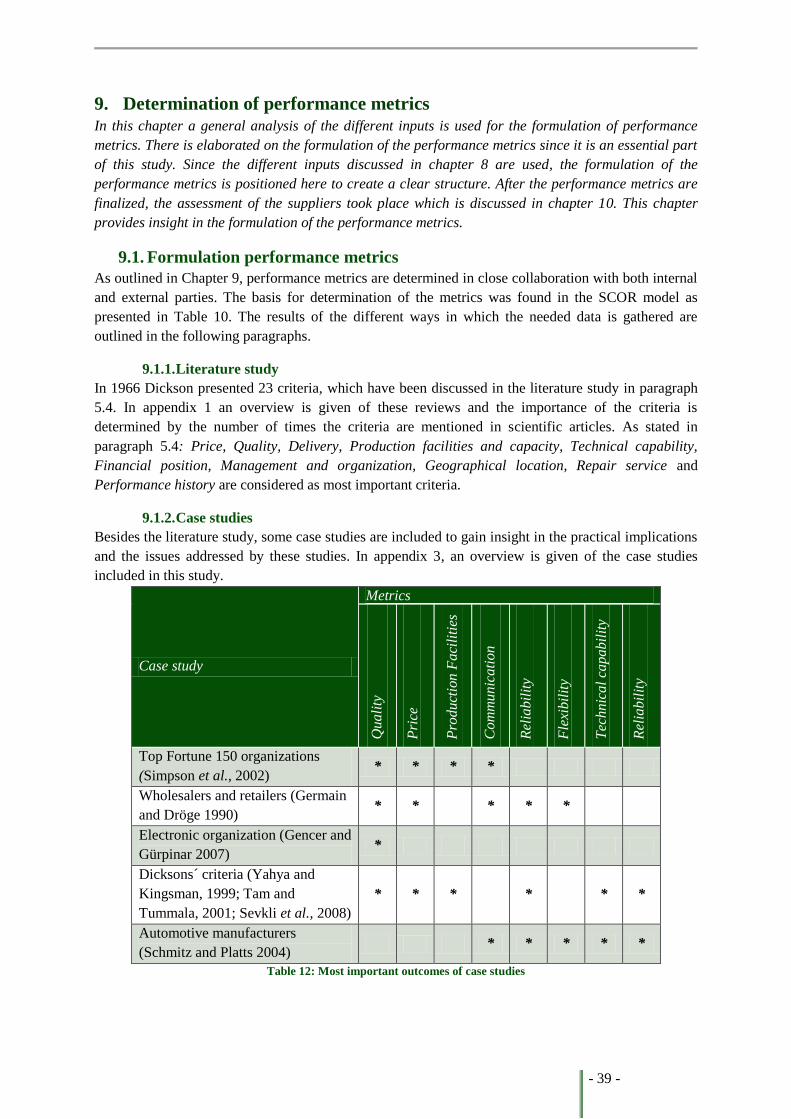
- 39 -
9. Determination of performance metrics In this chapter a general analysis of the different inputs is used for the formulation of performance
metrics. There is elaborated on the formulation of the performance metrics since it is an essential part
of this study. Since the different inputs discussed in chapter 8 are used, the formulation of the
performance metrics is positioned here to create a clear structure. After the performance metrics are
finalized, the assessment of the suppliers took place which is discussed in chapter 10. This chapter
provides insight in the formulation of the performance metrics.
9.1. Formulation performance metrics
As outlined in Chapter 9, performance metrics are determined in close collaboration with both internal
and external parties. The basis for determination of the metrics was found in the SCOR model as
presented in Table 10. The results of the different ways in which the needed data is gathered are
outlined in the following paragraphs.
9.1.1. Literature study
In 1966 Dickson presented 23 criteria, which have been discussed in the literature study in paragraph
5.4. In appendix 1 an overview is given of these reviews and the importance of the criteria is
determined by the number of times the criteria are mentioned in scientific articles. As stated in
paragraph 5.4: Price, Quality, Delivery, Production facilities and capacity, Technical capability,
Financial position, Management and organization, Geographical location, Repair service and
Performance history are considered as most important criteria.
9.1.2. Case studies
Besides the literature study, some case studies are included to gain insight in the practical implications
and the issues addressed by these studies. In appendix 3, an overview is given of the case studies
included in this study.
Case study
Metrics
Quali
ty
Pri
ce
Pro
duct
ion F
aci
liti
es
Com
munic
ati
on
Rel
iabil
ity
Fle
xibil
ity
Tec
hnic
al
capabil
ity
Rel
iabil
ity
Top Fortune 150 organizations
(Simpson et al., 2002) * * * *
Wholesalers and retailers (Germain
and Dröge 1990) * * * * *
Electronic organization (Gencer and
Gürpinar 2007) *
Dicksons´ criteria (Yahya and
Kingsman, 1999; Tam and
Tummala, 2001; Sevkli et al., 2008)
* * * * * *
Automotive manufacturers
(Schmitz and Platts 2004) * * * * *
Table 12: Most important outcomes of case studies
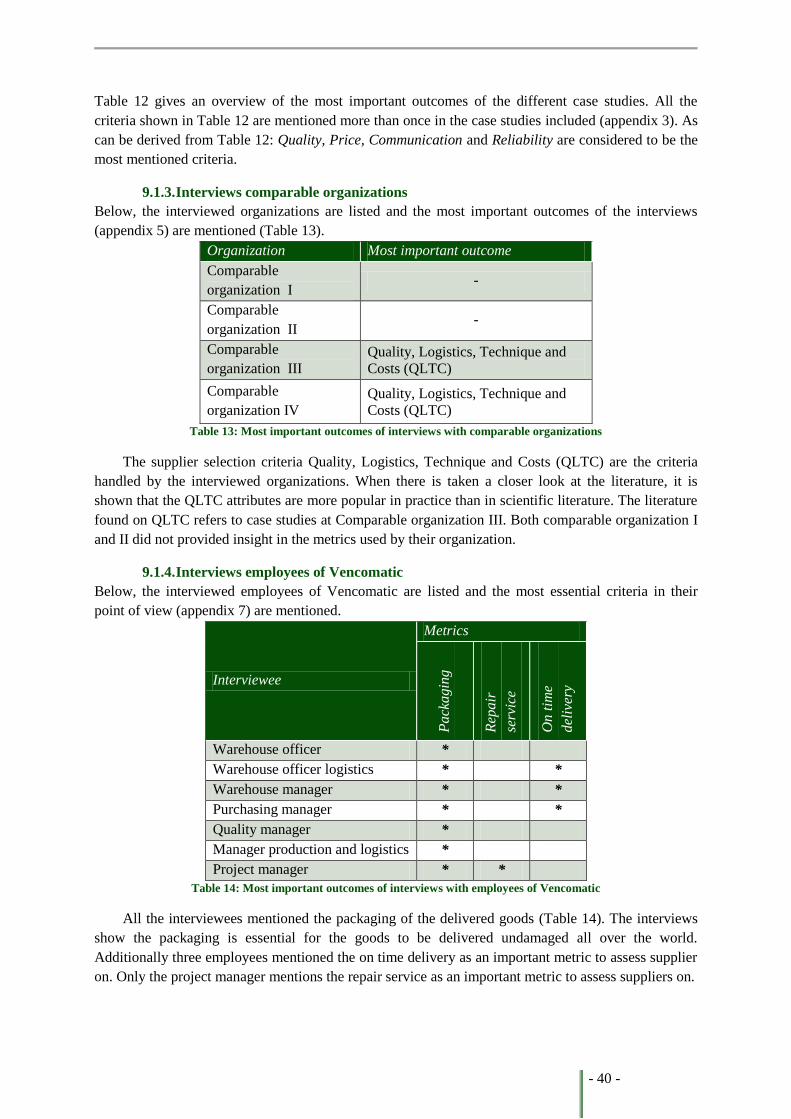
- 40 -
Table 12 gives an overview of the most important outcomes of the different case studies. All the
criteria shown in Table 12 are mentioned more than once in the case studies included (appendix 3). As
can be derived from Table 12: Quality, Price, Communication and Reliability are considered to be the
most mentioned criteria.
9.1.3. Interviews comparable organizations
Below, the interviewed organizations are listed and the most important outcomes of the interviews
(appendix 5) are mentioned (Table 13).
Organization Most important outcome
Comparable
organization I -
Comparable
organization II -
Comparable
organization III
Quality, Logistics, Technique and
Costs (QLTC)
Comparable
organization IV
Quality, Logistics, Technique and
Costs (QLTC)
Table 13: Most important outcomes of interviews with comparable organizations
The supplier selection criteria Quality, Logistics, Technique and Costs (QLTC) are the criteria
handled by the interviewed organizations. When there is taken a closer look at the literature, it is
shown that the QLTC attributes are more popular in practice than in scientific literature. The literature
found on QLTC refers to case studies at Comparable organization III. Both comparable organization I
and II did not provided insight in the metrics used by their organization.
9.1.4. Interviews employees of Vencomatic
Below, the interviewed employees of Vencomatic are listed and the most essential criteria in their
point of view (appendix 7) are mentioned.
Interviewee
Metrics
Pack
agin
g
Rep
air
serv
ice
On t
ime
del
iver
y
Warehouse officer *
Warehouse officer logistics * *
Warehouse manager * *
Purchasing manager * *
Quality manager *
Manager production and logistics *
Project manager * *
Table 14: Most important outcomes of interviews with employees of Vencomatic
All the interviewees mentioned the packaging of the delivered goods (Table 14). The interviews
show the packaging is essential for the goods to be delivered undamaged all over the world.
Additionally three employees mentioned the on time delivery as an important metric to assess supplier
on. Only the project manager mentions the repair service as an important metric to assess suppliers on.
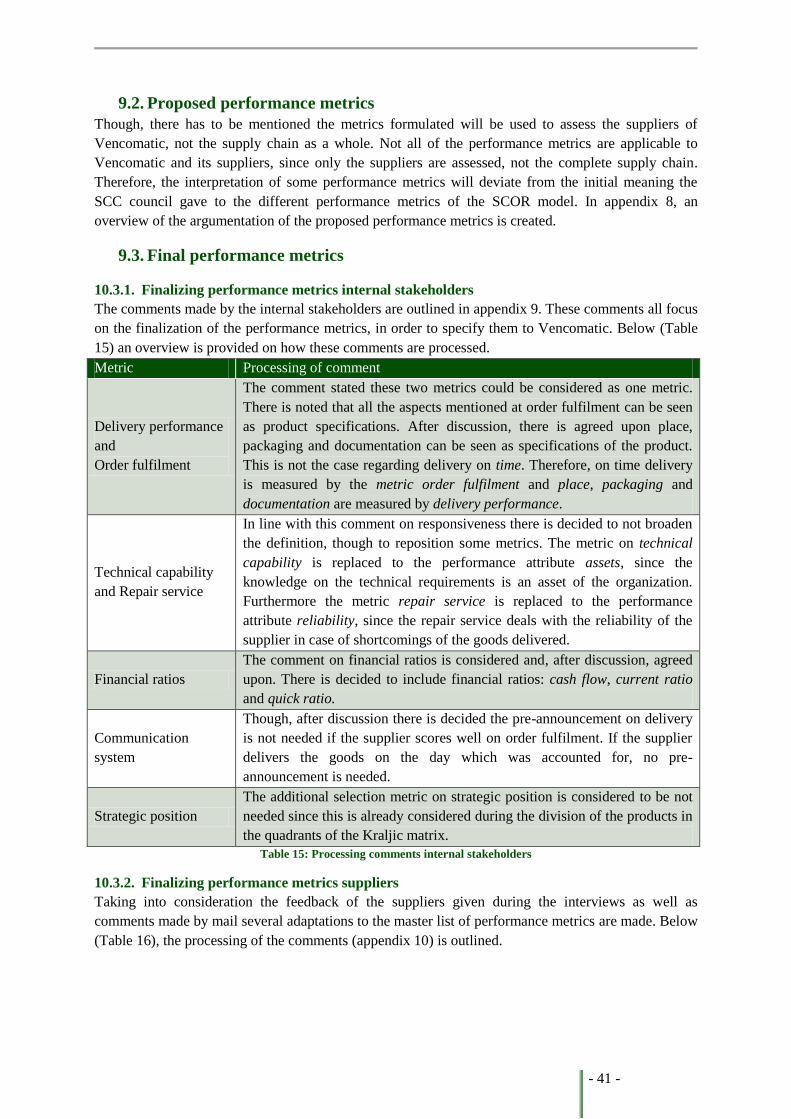
- 41 -
9.2. Proposed performance metrics
Though, there has to be mentioned the metrics formulated will be used to assess the suppliers of
Vencomatic, not the supply chain as a whole. Not all of the performance metrics are applicable to
Vencomatic and its suppliers, since only the suppliers are assessed, not the complete supply chain.
Therefore, the interpretation of some performance metrics will deviate from the initial meaning the
SCC council gave to the different performance metrics of the SCOR model. In appendix 8, an
overview of the argumentation of the proposed performance metrics is created.
9.3. Final performance metrics
10.3.1. Finalizing performance metrics internal stakeholders
The comments made by the internal stakeholders are outlined in appendix 9. These comments all focus
on the finalization of the performance metrics, in order to specify them to Vencomatic. Below (Table
15) an overview is provided on how these comments are processed.
Metric Processing of comment
Delivery performance
and
Order fulfilment
The comment stated these two metrics could be considered as one metric.
There is noted that all the aspects mentioned at order fulfilment can be seen
as product specifications. After discussion, there is agreed upon place,
packaging and documentation can be seen as specifications of the product.
This is not the case regarding delivery on time. Therefore, on time delivery
is measured by the metric order fulfilment and place, packaging and
documentation are measured by delivery performance.
Technical capability
and Repair service
In line with this comment on responsiveness there is decided to not broaden
the definition, though to reposition some metrics. The metric on technical
capability is replaced to the performance attribute assets, since the
knowledge on the technical requirements is an asset of the organization.
Furthermore the metric repair service is replaced to the performance
attribute reliability, since the repair service deals with the reliability of the
supplier in case of shortcomings of the goods delivered.
Financial ratios
The comment on financial ratios is considered and, after discussion, agreed
upon. There is decided to include financial ratios: cash flow, current ratio
and quick ratio.
Communication
system
Though, after discussion there is decided the pre-announcement on delivery
is not needed if the supplier scores well on order fulfilment. If the supplier
delivers the goods on the day which was accounted for, no pre-
announcement is needed.
Strategic position
The additional selection metric on strategic position is considered to be not
needed since this is already considered during the division of the products in
the quadrants of the Kraljic matrix.
Table 15: Processing comments internal stakeholders
10.3.2. Finalizing performance metrics suppliers
Taking into consideration the feedback of the suppliers given during the interviews as well as
comments made by mail several adaptations to the master list of performance metrics are made. Below
(Table 16), the processing of the comments (appendix 10) is outlined.
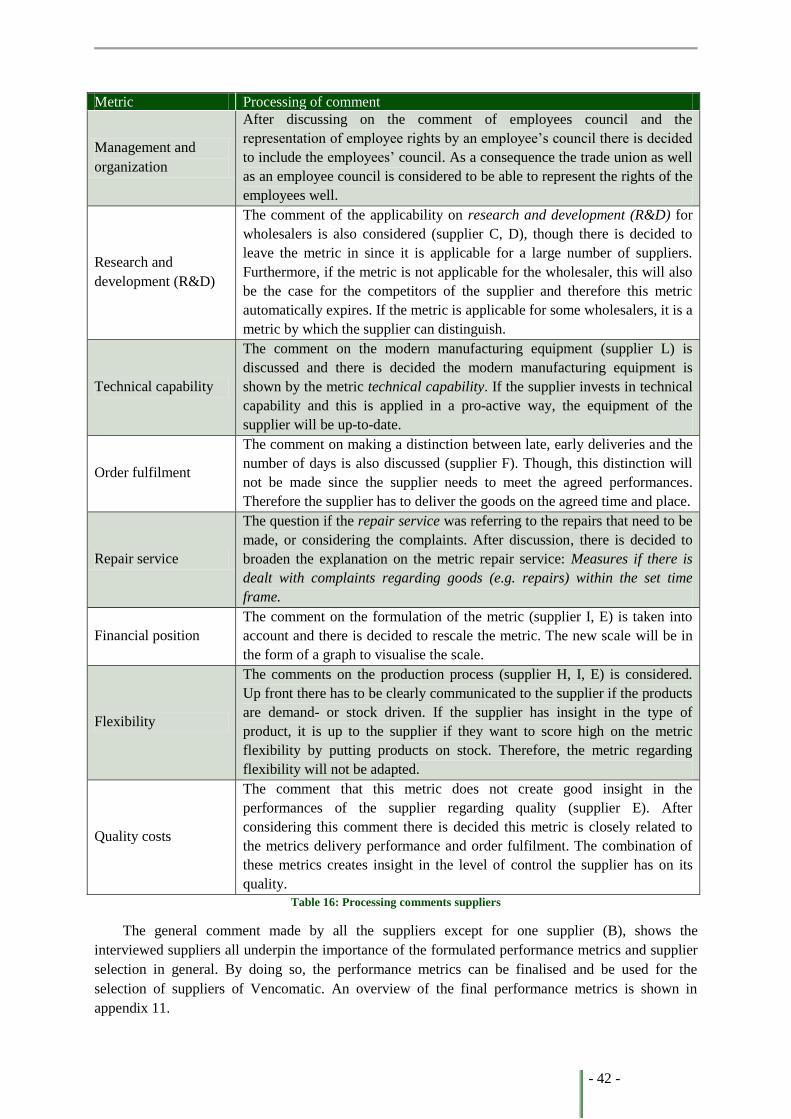
- 42 -
Metric Processing of comment
Management and
organization
After discussing on the comment of employees council and the
representation of employee rights by an employee’s council there is decided
to include the employees’ council. As a consequence the trade union as well
as an employee council is considered to be able to represent the rights of the
employees well.
Research and
development (R&D)
The comment of the applicability on research and development (R&D) for
wholesalers is also considered (supplier C, D), though there is decided to
leave the metric in since it is applicable for a large number of suppliers.
Furthermore, if the metric is not applicable for the wholesaler, this will also
be the case for the competitors of the supplier and therefore this metric
automatically expires. If the metric is applicable for some wholesalers, it is a
metric by which the supplier can distinguish.
Technical capability
The comment on the modern manufacturing equipment (supplier L) is
discussed and there is decided the modern manufacturing equipment is
shown by the metric technical capability. If the supplier invests in technical
capability and this is applied in a pro-active way, the equipment of the
supplier will be up-to-date.
Order fulfilment
The comment on making a distinction between late, early deliveries and the
number of days is also discussed (supplier F). Though, this distinction will
not be made since the supplier needs to meet the agreed performances.
Therefore the supplier has to deliver the goods on the agreed time and place.
Repair service
The question if the repair service was referring to the repairs that need to be
made, or considering the complaints. After discussion, there is decided to
broaden the explanation on the metric repair service: Measures if there is
dealt with complaints regarding goods (e.g. repairs) within the set time
frame.
Financial position
The comment on the formulation of the metric (supplier I, E) is taken into
account and there is decided to rescale the metric. The new scale will be in
the form of a graph to visualise the scale.
Flexibility
The comments on the production process (supplier H, I, E) is considered.
Up front there has to be clearly communicated to the supplier if the products
are demand- or stock driven. If the supplier has insight in the type of
product, it is up to the supplier if they want to score high on the metric
flexibility by putting products on stock. Therefore, the metric regarding
flexibility will not be adapted.
Quality costs
The comment that this metric does not create good insight in the
performances of the supplier regarding quality (supplier E). After
considering this comment there is decided this metric is closely related to
the metrics delivery performance and order fulfilment. The combination of
these metrics creates insight in the level of control the supplier has on its
quality.
Table 16: Processing comments suppliers
The general comment made by all the suppliers except for one supplier (B), shows the
interviewed suppliers all underpin the importance of the formulated performance metrics and supplier
selection in general. By doing so, the performance metrics can be finalised and be used for the
selection of suppliers of Vencomatic. An overview of the final performance metrics is shown in
appendix 11.
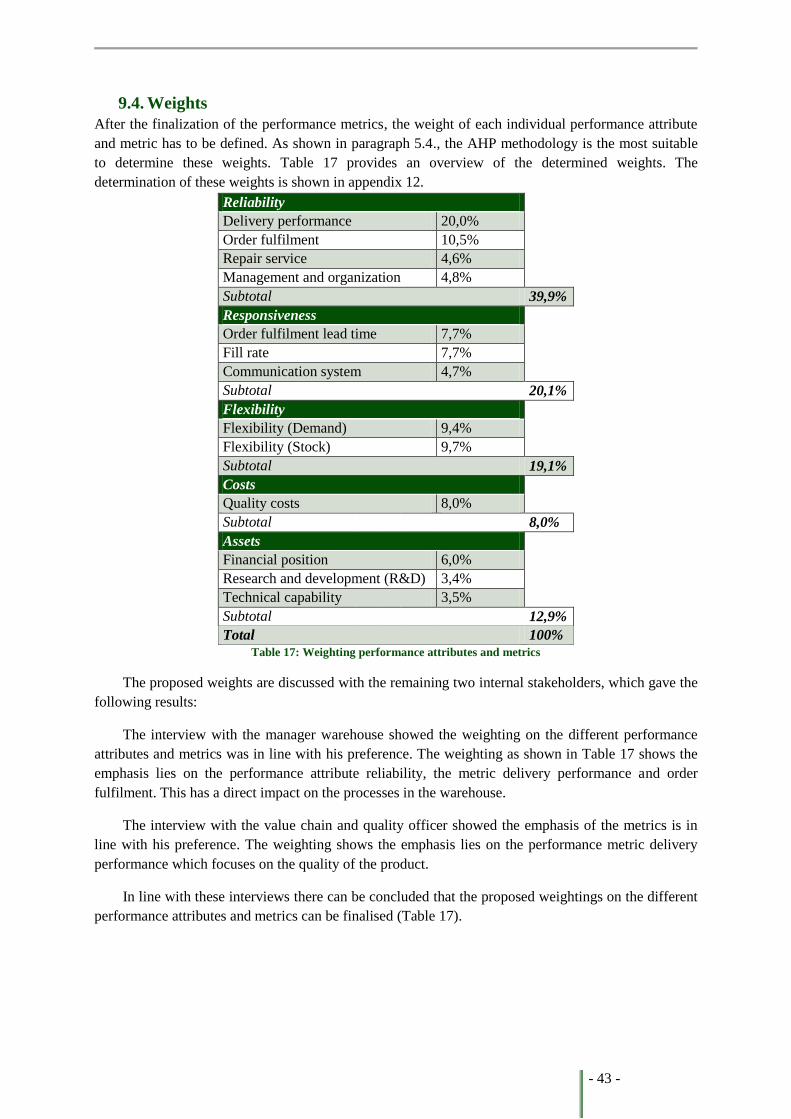
- 43 -
9.4. Weights
After the finalization of the performance metrics, the weight of each individual performance attribute
and metric has to be defined. As shown in paragraph 5.4., the AHP methodology is the most suitable
to determine these weights. Table 17 provides an overview of the determined weights. The
determination of these weights is shown in appendix 12.
Reliability
Delivery performance 20,0%
Order fulfilment 10,5%
Repair service 4,6%
Management and organization 4,8%
Subtotal 39,9%
Responsiveness
Order fulfilment lead time 7,7%
Fill rate 7,7%
Communication system 4,7%
Subtotal 20,1%
Flexibility
Flexibility (Demand) 9,4%
Flexibility (Stock) 9,7%
Subtotal 19,1%
Costs
Quality costs 8,0%
Subtotal 8,0%
Assets
Financial position 6,0%
Research and development (R&D) 3,4%
Technical capability 3,5%
Subtotal 12,9%
Total 100%
Table 17: Weighting performance attributes and metrics
The proposed weights are discussed with the remaining two internal stakeholders, which gave the
following results:
The interview with the manager warehouse showed the weighting on the different performance
attributes and metrics was in line with his preference. The weighting as shown in Table 17 shows the
emphasis lies on the performance attribute reliability, the metric delivery performance and order
fulfilment. This has a direct impact on the processes in the warehouse.
The interview with the value chain and quality officer showed the emphasis of the metrics is in
line with his preference. The weighting shows the emphasis lies on the performance metric delivery
performance which focuses on the quality of the product.
In line with these interviews there can be concluded that the proposed weightings on the different
performance attributes and metrics can be finalised (Table 17).
- 44 -
10. Supplier assessment In this chapter, the different phases of this case study are outlined (Figure 5). First the different
procurement strategies are discussed and the choice for the selected suppliers in this study is
motivated. The different suppliers included in this study, as discussed in chapter 8 are deviated in the
different quadrants of the Kraljic matrix. Besides, the assessment of the suppliers takes place and
scores of the suppliers regarding the different performance metrics are outlined and discussed. The
performance metrics to do so are discussed in chapter 9. Furthermore the decision making phase is
discussed. In this chapter the third sub-research question will be answered.
10.1. Kraljic matrix
Since different performances are required for different procured goods, the evaluation of suppliers
might differ. Therefore, first a division has to be made between the different goods and the suppliers
of those goods. This division will be made according to the Kraljic matrix. In line with the Kraljic
matrix, Vencomatic wants to develop a procurement strategy for each quadrant of the matrix.
These procurement strategies are in line with the different strategies defined in the Kraljic matrix
(Kraljic, 1983) and are complemented with the remarks of two internal stakeholders.
- Supply management (Strategic items): Accurate demand forecasting and long-term
relationships need to be developed. A risk analysis needs to be defined and collective research
and development (R&D) activities are conducted to increase performance for both parties. A
Cost Improvement Program (CIP) is applied and the performances of the supplier are
structurally assessed. A Service Level Agreement (SLA) is conducted to ensure the supplier
has good insight in the expectations of Vencomatic. The relationship developed with these
suppliers can be defined as ‘Partnership’.
- Sourcing management (Bottleneck items): Vencomatic needs to look for opportunities to move
these product groups to the left side of the Kraljic matrix. If this is not possible, back-up plans
need to be defined and the inventories need to be secured by making use of long-term
contracts. Furthermore, with the suppliers of these products is dealt in the same way as is with
the suppliers of strategic items, except for collective research and development (R&D). Since
the difference in procurement strategies is little, relationship with these suppliers is
comparable with suppliers of strategic items. Therefore, the relationships developed can also
be described as ‘Partnership’. This is in line with the classification used by De Boer et al.,
(2001), since the demands on which new suppliers are selected are considered the same for
strategic and bottleneck items.
- Materials management (Leverage items): Product substitution and price negotiations need to
take place. Order volumes need to be optimized. Competitive bidding and short term contracts
can be used by Vencomatic to fully exploit their buying power. Additionally, a Service Level
Agreement is conducted to ensure the supplier has good insight in the expectations of
Vencomatic. The suppliers allocated in this quadrant of the Kraljic matrix are called ‘Preferred
suppliers’.
- Purchasing management (Noncritical items): Product standardization and the volumes need to
be optimized by creating large quantities. Vencomatic needs to exploit its buying power by
open market negotiations. The organizations in this quadrant of the Kraljic matrix can be
defined as ‘Suppliers’.
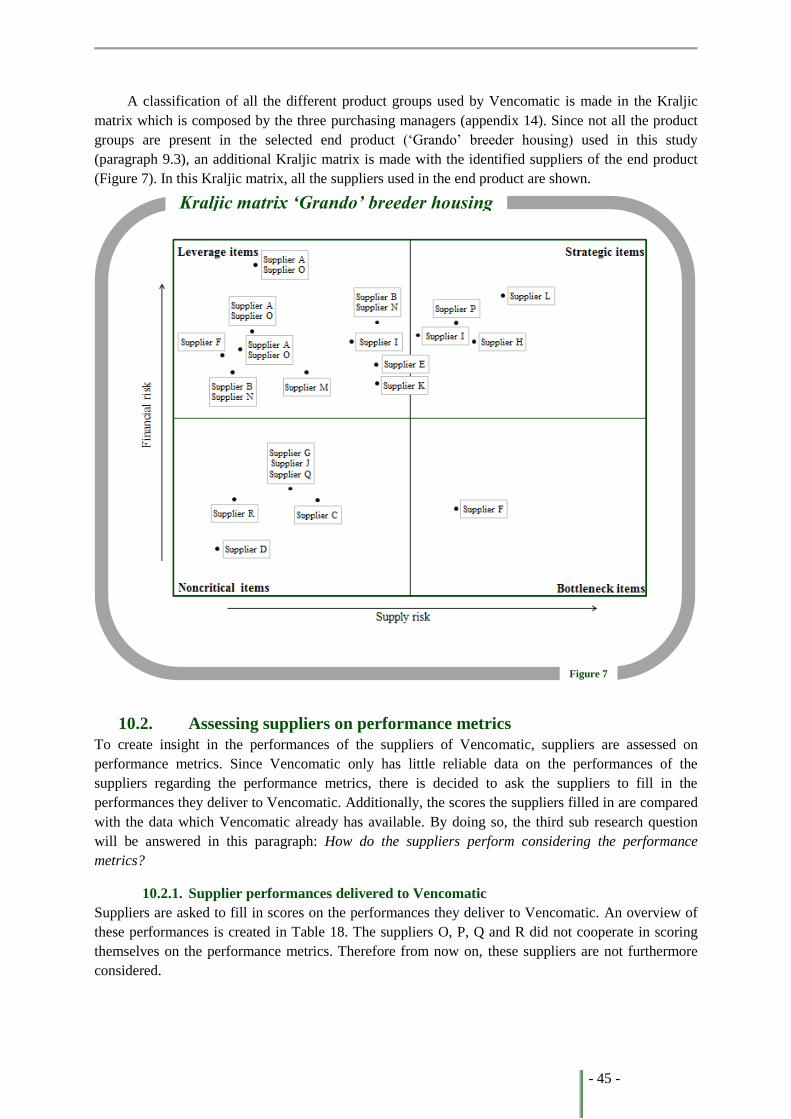
- 45 -
A classification of all the different product groups used by Vencomatic is made in the Kraljic
matrix which is composed by the three purchasing managers (appendix 14). Since not all the product
groups are present in the selected end product (‘Grando’ breeder housing) used in this study
(paragraph 9.3), an additional Kraljic matrix is made with the identified suppliers of the end product
(Figure 7). In this Kraljic matrix, all the suppliers used in the end product are shown.
10.2. Assessing suppliers on performance metrics
To create insight in the performances of the suppliers of Vencomatic, suppliers are assessed on
performance metrics. Since Vencomatic only has little reliable data on the performances of the
suppliers regarding the performance metrics, there is decided to ask the suppliers to fill in the
performances they deliver to Vencomatic. Additionally, the scores the suppliers filled in are compared
with the data which Vencomatic already has available. By doing so, the third sub research question
will be answered in this paragraph: How do the suppliers perform considering the performance
metrics?
10.2.1. Supplier performances delivered to Vencomatic
Suppliers are asked to fill in scores on the performances they deliver to Vencomatic. An overview of
these performances is created in Table 18. The suppliers O, P, Q and R did not cooperate in scoring
themselves on the performance metrics. Therefore from now on, these suppliers are not furthermore
considered.
Figure 7
Kraljic matrix ‘Grando’ breeder housing
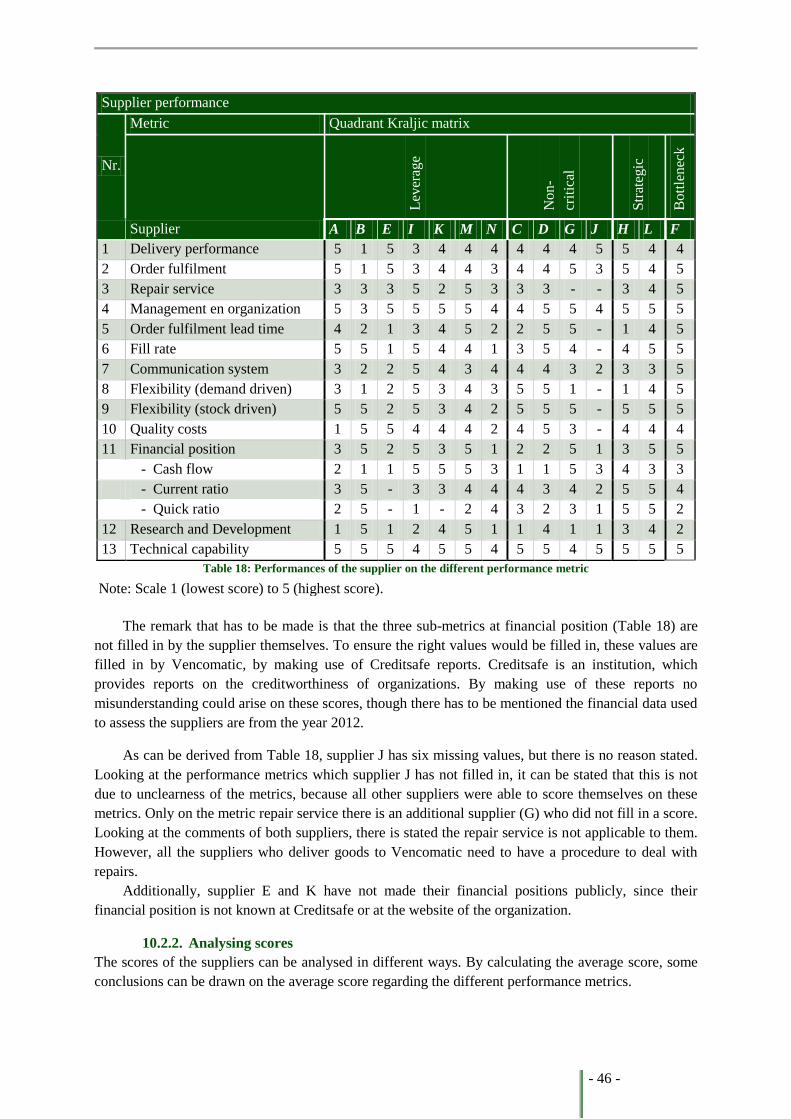
- 46 -
Supplier performance
Nr.
Metric Quadrant Kraljic matrix
Lev
erag
e
No
n-
crit
ical
Str
ateg
ic
Bo
ttle
nec
k
Supplier A B E I K M N C D G J H L F
1 Delivery performance 5 1 5 3 4 4 4 4 4 4 5 5 4 4
2 Order fulfilment 5 1 5 3 4 4 3 4 4 5 3 5 4 5
3 Repair service 3 3 3 5 2 5 3 3 3 - - 3 4 5
4 Management en organization 5 3 5 5 5 5 4 4 5 5 4 5 5 5
5 Order fulfilment lead time 4 2 1 3 4 5 2 2 5 5 - 1 4 5
6 Fill rate 5 5 1 5 4 4 1 3 5 4 - 4 5 5
7 Communication system 3 2 2 5 4 3 4 4 4 3 2 3 3 5
8 Flexibility (demand driven) 3 1 2 5 3 4 3 5 5 1 - 1 4 5
9 Flexibility (stock driven) 5 5 2 5 3 4 2 5 5 5 - 5 5 5
10 Quality costs 1 5 5 4 4 4 2 4 5 3 - 4 4 4
11 Financial position 3 5 2 5 3 5 1 2 2 5 1 3 5 5
- Cash flow 2 1 1 5 5 5 3 1 1 5 3 4 3 3
- Current ratio 3 5 - 3 3 4 4 4 3 4 2 5 5 4
- Quick ratio 2 5 - 1 - 2 4 3 2 3 1 5 5 2
12 Research and Development 1 5 1 2 4 5 1 1 4 1 1 3 4 2
13 Technical capability 5 5 5 4 5 5 4 5 5 4 5 5 5 5
Table 18: Performances of the supplier on the different performance metric
The remark that has to be made is that the three sub-metrics at financial position (Table 18) are
not filled in by the supplier themselves. To ensure the right values would be filled in, these values are
filled in by Vencomatic, by making use of Creditsafe reports. Creditsafe is an institution, which
provides reports on the creditworthiness of organizations. By making use of these reports no
misunderstanding could arise on these scores, though there has to be mentioned the financial data used
to assess the suppliers are from the year 2012.
As can be derived from Table 18, supplier J has six missing values, but there is no reason stated.
Looking at the performance metrics which supplier J has not filled in, it can be stated that this is not
due to unclearness of the metrics, because all other suppliers were able to score themselves on these
metrics. Only on the metric repair service there is an additional supplier (G) who did not fill in a score.
Looking at the comments of both suppliers, there is stated the repair service is not applicable to them.
However, all the suppliers who deliver goods to Vencomatic need to have a procedure to deal with
repairs.
Additionally, supplier E and K have not made their financial positions publicly, since their
financial position is not known at Creditsafe or at the website of the organization.
10.2.2. Analysing scores
The scores of the suppliers can be analysed in different ways. By calculating the average score, some
conclusions can be drawn on the average score regarding the different performance metrics.
Note: Scale 1 (lowest score) to 5 (highest score).
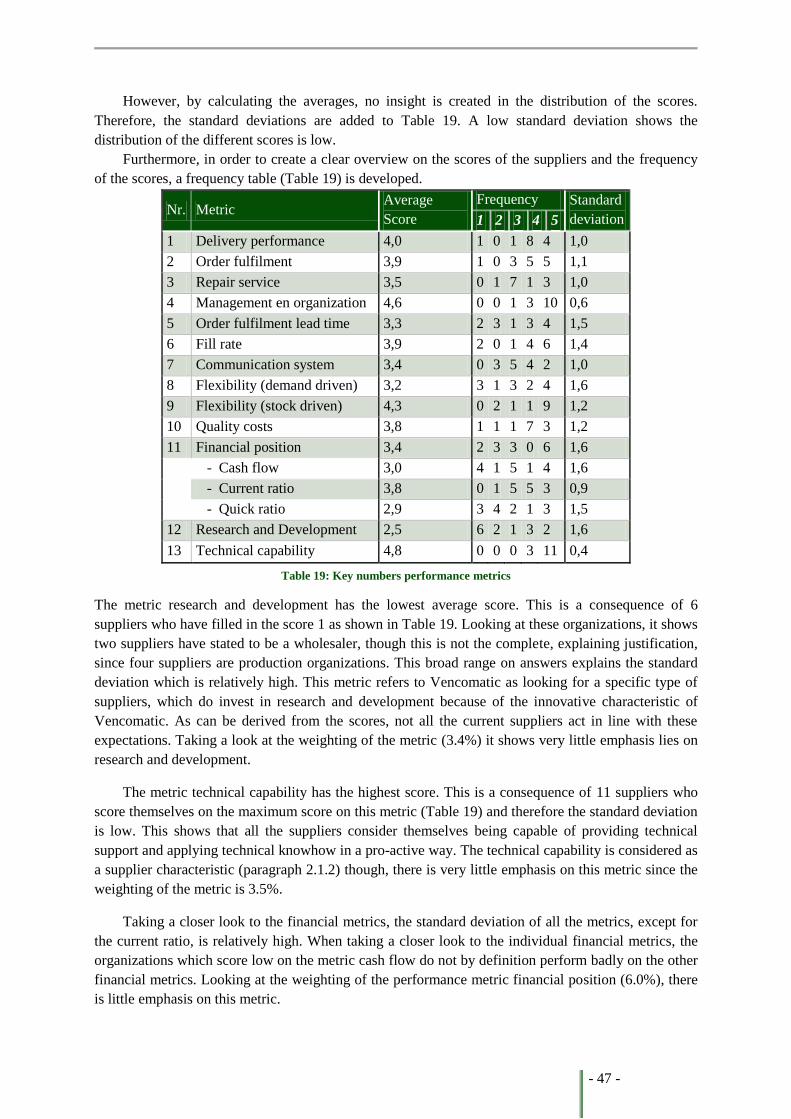
- 47 -
However, by calculating the averages, no insight is created in the distribution of the scores.
Therefore, the standard deviations are added to Table 19. A low standard deviation shows the
distribution of the different scores is low.
Furthermore, in order to create a clear overview on the scores of the suppliers and the frequency
of the scores, a frequency table (Table 19) is developed.
Nr. Metric Average
Score
Frequency Standard
deviation 1 2 3 4 5
1 Delivery performance 4,0 1 0 1 8 4 1,0
2 Order fulfilment 3,9 1 0 3 5 5 1,1
3 Repair service 3,5 0 1 7 1 3 1,0
4 Management en organization 4,6 0 0 1 3 10 0,6
5 Order fulfilment lead time 3,3 2 3 1 3 4 1,5
6 Fill rate 3,9 2 0 1 4 6 1,4
7 Communication system 3,4 0 3 5 4 2 1,0
8 Flexibility (demand driven) 3,2 3 1 3 2 4 1,6
9 Flexibility (stock driven) 4,3 0 2 1 1 9 1,2
10 Quality costs 3,8 1 1 1 7 3 1,2
11 Financial position 3,4 2 3 3 0 6 1,6
- Cash flow 3,0 4 1 5 1 4 1,6
- Current ratio 3,8 0 1 5 5 3 0,9
- Quick ratio 2,9 3 4 2 1 3 1,5
12 Research and Development 2,5 6 2 1 3 2 1,6
13 Technical capability 4,8 0 0 0 3 11 0,4
The metric research and development has the lowest average score. This is a consequence of 6
suppliers who have filled in the score 1 as shown in Table 19. Looking at these organizations, it shows
two suppliers have stated to be a wholesaler, though this is not the complete, explaining justification,
since four suppliers are production organizations. This broad range on answers explains the standard
deviation which is relatively high. This metric refers to Vencomatic as looking for a specific type of
suppliers, which do invest in research and development because of the innovative characteristic of
Vencomatic. As can be derived from the scores, not all the current suppliers act in line with these
expectations. Taking a look at the weighting of the metric (3.4%) it shows very little emphasis lies on
research and development.
The metric technical capability has the highest score. This is a consequence of 11 suppliers who
score themselves on the maximum score on this metric (Table 19) and therefore the standard deviation
is low. This shows that all the suppliers consider themselves being capable of providing technical
support and applying technical knowhow in a pro-active way. The technical capability is considered as
a supplier characteristic (paragraph 2.1.2) though, there is very little emphasis on this metric since the
weighting of the metric is 3.5%.
Taking a closer look to the financial metrics, the standard deviation of all the metrics, except for
the current ratio, is relatively high. When taking a closer look to the individual financial metrics, the
organizations which score low on the metric cash flow do not by definition perform badly on the other
financial metrics. Looking at the weighting of the performance metric financial position (6.0%), there
is little emphasis on this metric.
Table 19: Key numbers performance metrics
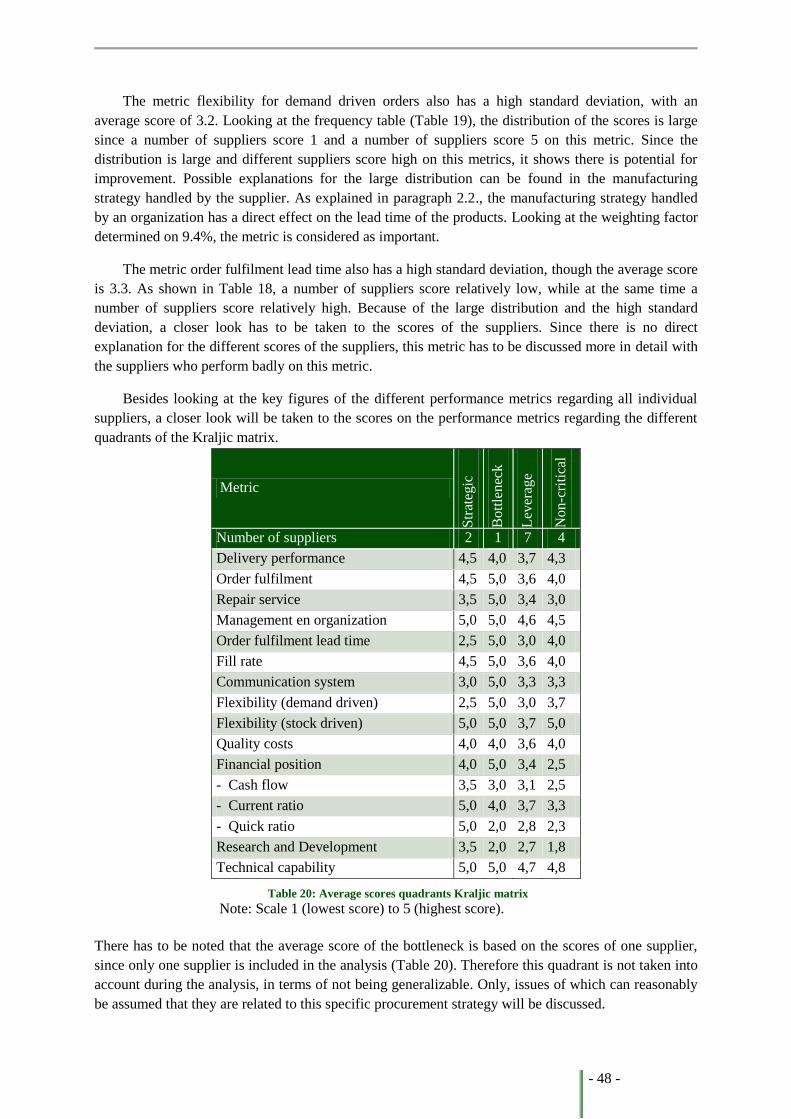
- 48 -
Table 20: Average scores quadrants Kraljic matrix
Note: Scale 1 (lowest score) to 5 (highest score).
The metric flexibility for demand driven orders also has a high standard deviation, with an
average score of 3.2. Looking at the frequency table (Table 19), the distribution of the scores is large
since a number of suppliers score 1 and a number of suppliers score 5 on this metric. Since the
distribution is large and different suppliers score high on this metrics, it shows there is potential for
improvement. Possible explanations for the large distribution can be found in the manufacturing
strategy handled by the supplier. As explained in paragraph 2.2., the manufacturing strategy handled
by an organization has a direct effect on the lead time of the products. Looking at the weighting factor
determined on 9.4%, the metric is considered as important.
The metric order fulfilment lead time also has a high standard deviation, though the average score
is 3.3. As shown in Table 18, a number of suppliers score relatively low, while at the same time a
number of suppliers score relatively high. Because of the large distribution and the high standard
deviation, a closer look has to be taken to the scores of the suppliers. Since there is no direct
explanation for the different scores of the suppliers, this metric has to be discussed more in detail with
the suppliers who perform badly on this metric.
Besides looking at the key figures of the different performance metrics regarding all individual
suppliers, a closer look will be taken to the scores on the performance metrics regarding the different
quadrants of the Kraljic matrix.
Metric
Str
ateg
ic
Bott
lenec
k
Lev
erag
e
Non
-cri
tica
l
Number of suppliers 2 1 7 4
Delivery performance 4,5 4,0 3,7 4,3
Order fulfilment 4,5 5,0 3,6 4,0
Repair service 3,5 5,0 3,4 3,0
Management en organization 5,0 5,0 4,6 4,5
Order fulfilment lead time 2,5 5,0 3,0 4,0
Fill rate 4,5 5,0 3,6 4,0
Communication system 3,0 5,0 3,3 3,3
Flexibility (demand driven) 2,5 5,0 3,0 3,7
Flexibility (stock driven) 5,0 5,0 3,7 5,0
Quality costs 4,0 4,0 3,6 4,0
Financial position 4,0 5,0 3,4 2,5
- Cash flow 3,5 3,0 3,1 2,5
- Current ratio 5,0 4,0 3,7 3,3
- Quick ratio 5,0 2,0 2,8 2,3
Research and Development 3,5 2,0 2,7 1,8
Technical capability 5,0 5,0 4,7 4,8
There has to be noted that the average score of the bottleneck is based on the scores of one supplier,
since only one supplier is included in the analysis (Table 20). Therefore this quadrant is not taken into
account during the analysis, in terms of not being generalizable. Only, issues of which can reasonably
be assumed that they are related to this specific procurement strategy will be discussed.
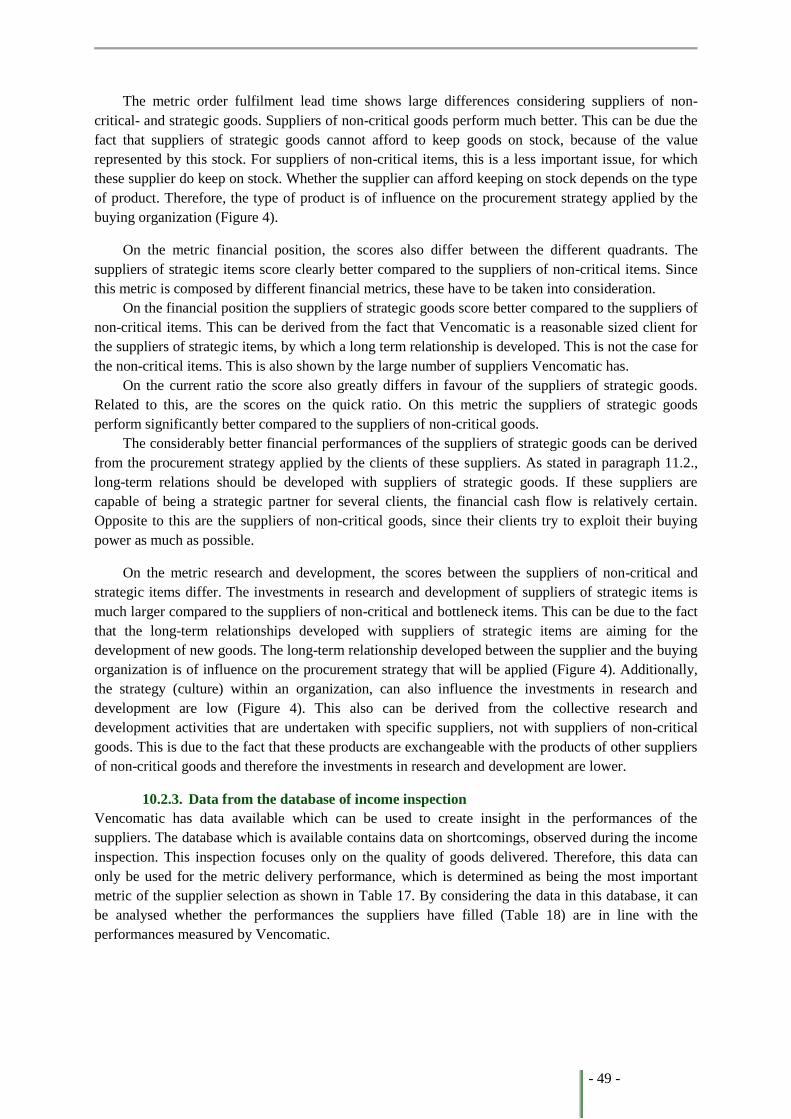
- 49 -
The metric order fulfilment lead time shows large differences considering suppliers of non-
critical- and strategic goods. Suppliers of non-critical goods perform much better. This can be due the
fact that suppliers of strategic goods cannot afford to keep goods on stock, because of the value
represented by this stock. For suppliers of non-critical items, this is a less important issue, for which
these supplier do keep on stock. Whether the supplier can afford keeping on stock depends on the type
of product. Therefore, the type of product is of influence on the procurement strategy applied by the
buying organization (Figure 4).
On the metric financial position, the scores also differ between the different quadrants. The
suppliers of strategic items score clearly better compared to the suppliers of non-critical items. Since
this metric is composed by different financial metrics, these have to be taken into consideration.
On the financial position the suppliers of strategic goods score better compared to the suppliers of
non-critical items. This can be derived from the fact that Vencomatic is a reasonable sized client for
the suppliers of strategic items, by which a long term relationship is developed. This is not the case for
the non-critical items. This is also shown by the large number of suppliers Vencomatic has.
On the current ratio the score also greatly differs in favour of the suppliers of strategic goods.
Related to this, are the scores on the quick ratio. On this metric the suppliers of strategic goods
perform significantly better compared to the suppliers of non-critical goods.
The considerably better financial performances of the suppliers of strategic goods can be derived
from the procurement strategy applied by the clients of these suppliers. As stated in paragraph 11.2.,
long-term relations should be developed with suppliers of strategic goods. If these suppliers are
capable of being a strategic partner for several clients, the financial cash flow is relatively certain.
Opposite to this are the suppliers of non-critical goods, since their clients try to exploit their buying
power as much as possible.
On the metric research and development, the scores between the suppliers of non-critical and
strategic items differ. The investments in research and development of suppliers of strategic items is
much larger compared to the suppliers of non-critical and bottleneck items. This can be due to the fact
that the long-term relationships developed with suppliers of strategic items are aiming for the
development of new goods. The long-term relationship developed between the supplier and the buying
organization is of influence on the procurement strategy that will be applied (Figure 4). Additionally,
the strategy (culture) within an organization, can also influence the investments in research and
development are low (Figure 4). This also can be derived from the collective research and
development activities that are undertaken with specific suppliers, not with suppliers of non-critical
goods. This is due to the fact that these products are exchangeable with the products of other suppliers
of non-critical goods and therefore the investments in research and development are lower.
10.2.3. Data from the database of income inspection
Vencomatic has data available which can be used to create insight in the performances of the
suppliers. The database which is available contains data on shortcomings, observed during the income
inspection. This inspection focuses only on the quality of goods delivered. Therefore, this data can
only be used for the metric delivery performance, which is determined as being the most important
metric of the supplier selection as shown in Table 17. By considering the data in this database, it can
be analysed whether the performances the suppliers have filled (Table 18) are in line with the
performances measured by Vencomatic.
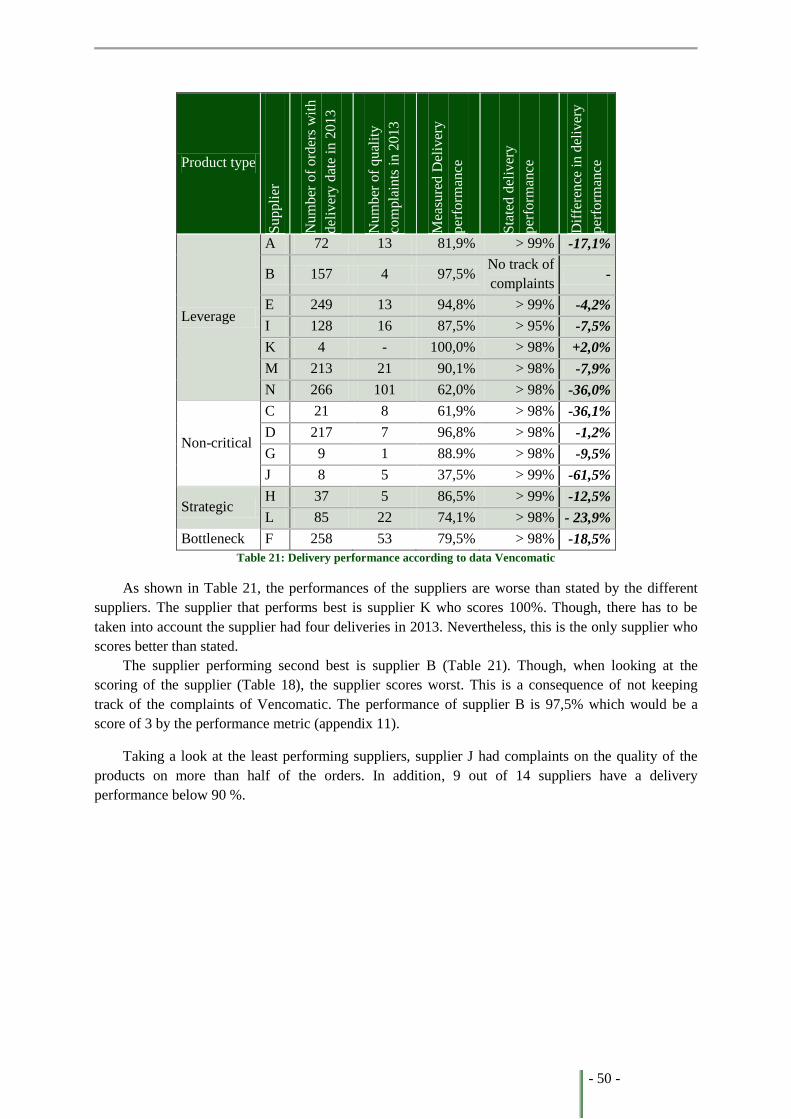
- 50 -
Product type
Sup
pli
er
Nu
mb
er o
f o
rder
s w
ith
del
iver
y d
ate
in 2
013
Nu
mb
er o
f q
ual
ity
com
pla
ints
in 2
01
3
Mea
sure
d D
eliv
ery
per
form
ance
Sta
ted
del
iver
y
per
form
ance
Dif
fere
nce
in
del
iver
y
per
form
ance
Leverage
A 72 13 81,9% > 99% -17,1%
B 157 4 97,5% No track of
complaints -
E 249 13 94,8% > 99% -4,2%
I 128 16 87,5% > 95% -7,5%
K 4 - 100,0% > 98% +2,0%
M 213 21 90,1% > 98% -7,9%
N 266 101 62,0% > 98% -36,0%
Non-critical
C 21 8 61,9% > 98% -36,1%
D 217 7 96,8% > 98% -1,2%
G 9 1 88.9% > 98% -9,5%
J 8 5 37,5% > 99% -61,5%
Strategic H 37 5 86,5% > 99% -12,5%
L 85 22 74,1% > 98% - 23,9%
Bottleneck F 258 53 79,5% > 98% -18,5%
Table 21: Delivery performance according to data Vencomatic
As shown in Table 21, the performances of the suppliers are worse than stated by the different
suppliers. The supplier that performs best is supplier K who scores 100%. Though, there has to be
taken into account the supplier had four deliveries in 2013. Nevertheless, this is the only supplier who
scores better than stated.
The supplier performing second best is supplier B (Table 21). Though, when looking at the
scoring of the supplier (Table 18), the supplier scores worst. This is a consequence of not keeping
track of the complaints of Vencomatic. The performance of supplier B is 97,5% which would be a
score of 3 by the performance metric (appendix 11).
Taking a look at the least performing suppliers, supplier J had complaints on the quality of the
products on more than half of the orders. In addition, 9 out of 14 suppliers have a delivery
performance below 90 %.
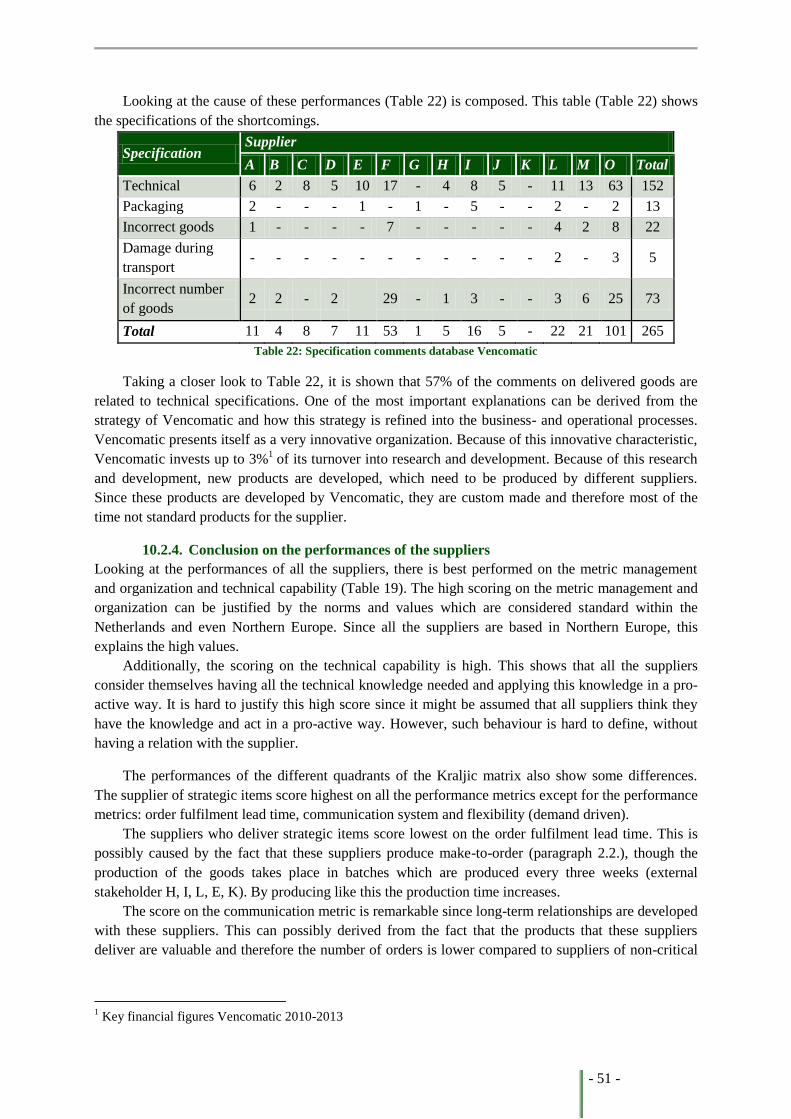
- 51 -
Looking at the cause of these performances (Table 22) is composed. This table (Table 22) shows
the specifications of the shortcomings.
Specification Supplier
A B C D E F G H I J K L M O Total
Technical 6 2 8 5 10 17 - 4 8 5 - 11 13 63 152
Packaging 2 - - - 1 - 1 - 5 - - 2 - 2 13
Incorrect goods 1 - - - - 7 - - - - - 4 2 8 22
Damage during
transport - - - - - - - - - - - 2 - 3 5
Incorrect number
of goods 2 2 - 2
29 - 1 3 - - 3 6 25 73
Total 11 4 8 7 11 53 1 5 16 5 - 22 21 101 265
Table 22: Specification comments database Vencomatic
Taking a closer look to Table 22, it is shown that 57% of the comments on delivered goods are
related to technical specifications. One of the most important explanations can be derived from the
strategy of Vencomatic and how this strategy is refined into the business- and operational processes.
Vencomatic presents itself as a very innovative organization. Because of this innovative characteristic,
Vencomatic invests up to 3%1 of its turnover into research and development. Because of this research
and development, new products are developed, which need to be produced by different suppliers.
Since these products are developed by Vencomatic, they are custom made and therefore most of the
time not standard products for the supplier.
10.2.4. Conclusion on the performances of the suppliers
Looking at the performances of all the suppliers, there is best performed on the metric management
and organization and technical capability (Table 19). The high scoring on the metric management and
organization can be justified by the norms and values which are considered standard within the
Netherlands and even Northern Europe. Since all the suppliers are based in Northern Europe, this
explains the high values.
Additionally, the scoring on the technical capability is high. This shows that all the suppliers
consider themselves having all the technical knowledge needed and applying this knowledge in a pro-
active way. It is hard to justify this high score since it might be assumed that all suppliers think they
have the knowledge and act in a pro-active way. However, such behaviour is hard to define, without
having a relation with the supplier.
The performances of the different quadrants of the Kraljic matrix also show some differences.
The supplier of strategic items score highest on all the performance metrics except for the performance
metrics: order fulfilment lead time, communication system and flexibility (demand driven).
The suppliers who deliver strategic items score lowest on the order fulfilment lead time. This is
possibly caused by the fact that these suppliers produce make-to-order (paragraph 2.2.), though the
production of the goods takes place in batches which are produced every three weeks (external
stakeholder H, I, L, E, K). By producing like this the production time increases.
The score on the communication metric is remarkable since long-term relationships are developed
with these suppliers. This can possibly derived from the fact that the products that these suppliers
deliver are valuable and therefore the number of orders is lower compared to suppliers of non-critical
1 Key financial figures Vencomatic 2010-2013
- 52 -
items. Possibly because of this lower number of orders, it is not profitable to do the investment for this
type of communication.
On the metric flexibility (demand driven), the scores of the suppliers of strategic items are the
lowest of the four quadrants. This can possibly be ascribed to the same reasoning as is done to the
order fulfilment lead time.
Taking a closer look to the performances of the individual suppliers, there are a few suppliers
who stand out regarding their scores. Supplier L scores relatively high (score 3, 4 or 5) on all the
metrics, supplier K and M only score on one metric relatively low (score 1 or 2). When taking an
additional look at the actual performances of the suppliers according to the data of Vencomatic (Table
21), it shows only supplier K has a score which was anticipated for (> 95%). Supplier M scores lower
and supplier L scores much lower than the performances they filled in themselves on the metric
delivery performance.
Since no more reliable data is available at Vencomatic, the conclusions have to be drawn based
on these findings. These findings show that in general the suppliers think they perform considerably
better on the performance metrics than they actually do according to the data of Vencomatic. This can
be a consequence of not having insight in the performances delivered.
Additionally, it can be questioned whether all the suppliers filled in the realistic performances or
instead filled in, unrealistic, high scores. The fact that the suppliers were informed of the fact the
performance metrics would be used for supplier selection and -evaluation, could explain the high
scores.
10.3. Decision making
In the decision making phase a decision is made on the selection of the supplier. Before a supplier can
be defined as potential supplier, they have to cope with the knock-out metrics. These knock-out
metrics are defined in line with the comments of the internal stakeholders on the practical
determination of the performance metrics. The knock-out metrics defined are shown in table 23.
Metric Minimum performance
Knock-out metrics
After discussion, there is decided to agree with the comment on
the knock-out metrics and corresponding scores. The potential
suppliers at least have to meet these knock-out metrics to be
eligible to become a supplier of Vencomatic. The scores the
suppliers have to score minimally are discussed and determined
in cooperation with the internal stakeholders.
- Management and organization The supplier has to score at least 2 points on this metric.
- Communication The supplier has to score at least 2 points on this metric.
- Financial position The supplier has to score at least 2 points on this metric. This
metric includes the financial position, cash flow, current ratio
and the quick ratio. These sub-metrics together account for the
metric financial position, which allows them to compensate for
one another.
Table 23: Knock-out metrics
This decision is based on the performances of the supplier on the different performance metrics
and additionally on the aspect of price. The combination of these two aspects is in line with the
comment on the practical determination of the performances of the suppliers (appendix 13) of one of
the internal stakeholders.
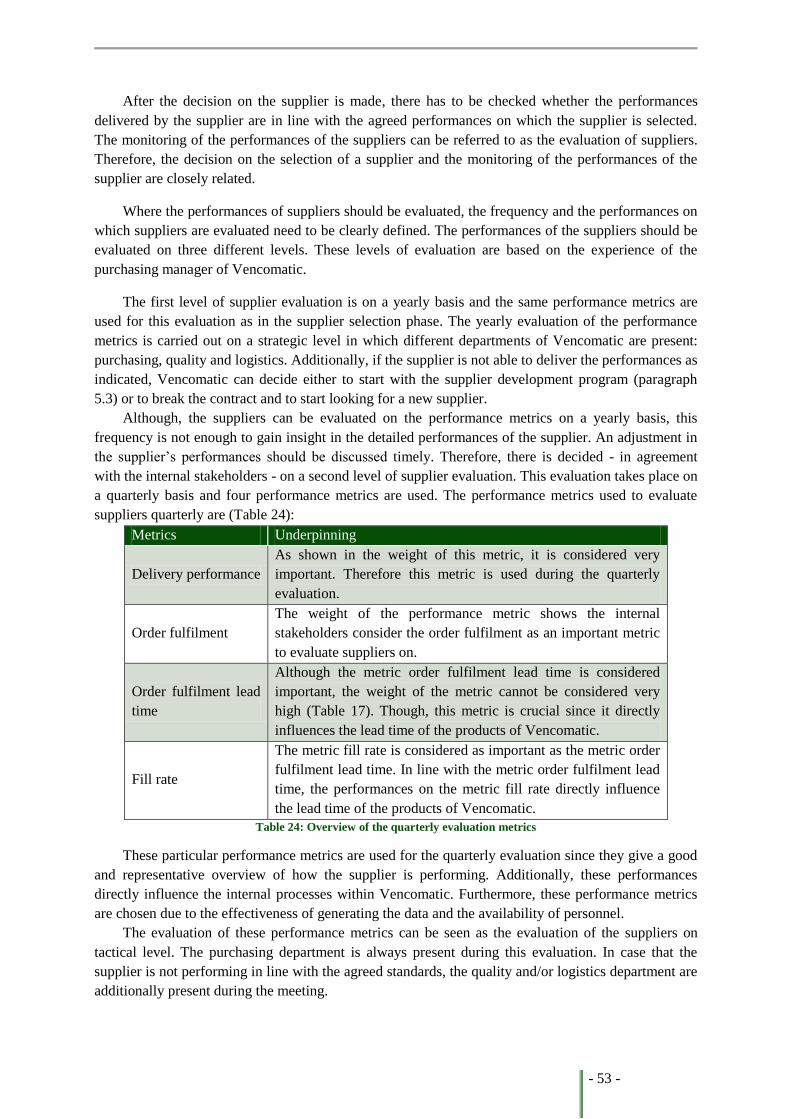
- 53 -
After the decision on the supplier is made, there has to be checked whether the performances
delivered by the supplier are in line with the agreed performances on which the supplier is selected.
The monitoring of the performances of the suppliers can be referred to as the evaluation of suppliers.
Therefore, the decision on the selection of a supplier and the monitoring of the performances of the
supplier are closely related.
Where the performances of suppliers should be evaluated, the frequency and the performances on
which suppliers are evaluated need to be clearly defined. The performances of the suppliers should be
evaluated on three different levels. These levels of evaluation are based on the experience of the
purchasing manager of Vencomatic.
The first level of supplier evaluation is on a yearly basis and the same performance metrics are
used for this evaluation as in the supplier selection phase. The yearly evaluation of the performance
metrics is carried out on a strategic level in which different departments of Vencomatic are present:
purchasing, quality and logistics. Additionally, if the supplier is not able to deliver the performances as
indicated, Vencomatic can decide either to start with the supplier development program (paragraph
5.3) or to break the contract and to start looking for a new supplier.
Although, the suppliers can be evaluated on the performance metrics on a yearly basis, this
frequency is not enough to gain insight in the detailed performances of the supplier. An adjustment in
the supplier’s performances should be discussed timely. Therefore, there is decided - in agreement
with the internal stakeholders - on a second level of supplier evaluation. This evaluation takes place on
a quarterly basis and four performance metrics are used. The performance metrics used to evaluate
suppliers quarterly are (Table 24):
Metrics Underpinning
Delivery performance
As shown in the weight of this metric, it is considered very
important. Therefore this metric is used during the quarterly
evaluation.
Order fulfilment
The weight of the performance metric shows the internal
stakeholders consider the order fulfilment as an important metric
to evaluate suppliers on.
Order fulfilment lead
time
Although the metric order fulfilment lead time is considered
important, the weight of the metric cannot be considered very
high (Table 17). Though, this metric is crucial since it directly
influences the lead time of the products of Vencomatic.
Fill rate
The metric fill rate is considered as important as the metric order
fulfilment lead time. In line with the metric order fulfilment lead
time, the performances on the metric fill rate directly influence
the lead time of the products of Vencomatic.
Table 24: Overview of the quarterly evaluation metrics
These particular performance metrics are used for the quarterly evaluation since they give a good
and representative overview of how the supplier is performing. Additionally, these performances
directly influence the internal processes within Vencomatic. Furthermore, these performance metrics
are chosen due to the effectiveness of generating the data and the availability of personnel.
The evaluation of these performance metrics can be seen as the evaluation of the suppliers on
tactical level. The purchasing department is always present during this evaluation. In case that the
supplier is not performing in line with the agreed standards, the quality and/or logistics department are
additionally present during the meeting.
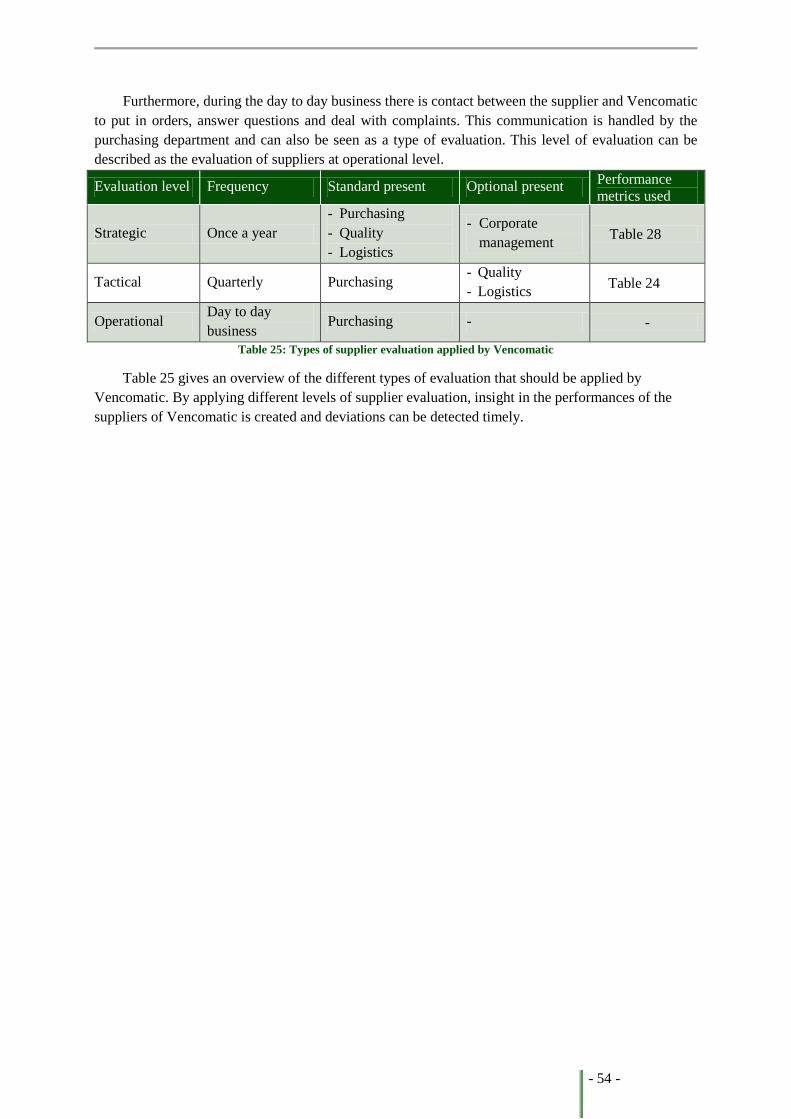
- 54 -
Furthermore, during the day to day business there is contact between the supplier and Vencomatic
to put in orders, answer questions and deal with complaints. This communication is handled by the
purchasing department and can also be seen as a type of evaluation. This level of evaluation can be
described as the evaluation of suppliers at operational level.
Evaluation level Frequency Standard present Optional present Performance
metrics used
Strategic Once a year
- Purchasing
- Quality
- Logistics
- Corporate
management Table 28
Tactical Quarterly Purchasing - Quality
- Logistics Table 24
Operational Day to day
business Purchasing - -
Table 25: Types of supplier evaluation applied by Vencomatic
Table 25 gives an overview of the different types of evaluation that should be applied by
Vencomatic. By applying different levels of supplier evaluation, insight in the performances of the
suppliers of Vencomatic is created and deviations can be detected timely.
- 55 -
11. Supplier performance improvement In this chapter a reflection is made on the results discussed in paragraph 11.2. Since in the
methodology part (paragraph 9.1) is stated a more comprehensive approach will be used in this study,
in the first part of this chapter the deviation of the Kraljic matrix is handled. By doing so, suggestions
can be formulated on how to improve the performances of the suppliers. Furthermore, a broader view
is taken into consideration to come up with recommendations for Vencomatic to improve the
performances of its suppliers. To do so, the different phases of this case study (Figure 5) are discussed
and recommendations are given to improve the processes and increase the performances of the
suppliers of Vencomatic. In this chapter the fourth and fifth sub-research question will be answered.
11.1. Supplier performance improvement
This paragraph reflects on the results which are discussed in paragraph 11.3. As shown in the different
stages of supplier selection and –evaluation (Figure 5), a deviation between the different suppliers is
based on the procurement strategy that is applied. By doing so the fourth sub-question can be
answered: How can the performances of the suppliers be improved?
11.1.1. Strategic items
Order fulfilment lead time
The performances regarding order fulfilment lead time of suppliers of strategic items should be
improved. It is important these performances are improved since these performances directly affect the
amount of stock at Vencomatic. To improve the performances regarding this metric, there should be
clarity among Vencomatic and its supplier about the production method and the effects on order
fulfilment lead time. Furthermore, insight in the stock levels at different stages of the supply chain is
important. By having insight in the different stock levels, these levels can be adapted to create the best
stock levels.
Flexibility (demand driven)
Performances regarding demand driven flexibility of suppliers of strategic items should be improved.
The improvement of flexibility decreases the lead time of the products sold by Vencomatic. To
increase these performances, the suppliers should bring down the setup times for the production of the
different batches. Additionally, the size of these batches should be decreased to be able to switch
between batches more quickly. Vencomatic cannot directly influence the performances on flexibility
of the suppliers. Though, Vencomatic can minimize the number of orders that require these
performances of the supplier, by ordering timely.
Looking at the weight of the discussed performance metrics, it is important the performances of
the suppliers of strategic items improve.
11.1.2. Bottleneck items
Quick ratio
The performances regarding the quick ratio of the suppliers of bottleneck items can be improved. The
quick ratio gives an indication of the financial health of an organization. It shows if the organization is
capable of fulfilling its obligations regarding current liabilities by the current assets. The quick ratio is
closely related to the current ratio except for taking into account the stock values. These stock values
are taken into account by the quick ratio though the current ratio does not account for them. Since part
of these stocks are often needed for the organization to function normally, these stocks cannot be sold
that easy. Therefore, these stocks cannot be taken into account to fulfil the obligations of current
liabilities. To improve the quick ratio, the supplier can pay off the current liabilities and increase its
cash position. Vencomatic cannot directly influence the quick ratio of the supplier.
- 56 -
Research and development
The research and development performances of suppliers that produce bottleneck items should be
improved. The research and development metric gives insight in what priorities the supplier has.
Vencomatic is looking for suppliers who are investing in research and development. To improve the
performances of the suppliers on this metric, Vencomatic has to show the emphasis of them towards
research and development. By doing so, the (pro-) active suppliers will act on that. Vencomatic can
show their preference to suppliers with high investments in research and development by increasing
the amount of business.
11.1.3. Leverage items
Quick ratio
The performances of the supplier of leverage items should be improved. These performances can be
improved in the same way as stated in the sub-paragraph quick ratio at the bottleneck items.
Research and development
The supplier of leverage items should improve the performances regarding the research and
development. At sub-paragraph research and development at bottleneck items is stated how to improve
these performances, though the procurement strategy should be kept in mind.
11.1.4. Non-critical items
Financial position
Performances of the suppliers of non-critical items regarding the financial position can be improved. It
shows the suppliers of non-critical items have generated a turnover below 15% in 2013 at Vencomatic.
To improve this performance, these suppliers have to ensure their product portfolio is comprehensive
enough for Vencomatic to order more goods at these suppliers. Additionally, the prices of these
products have to be competing with the suppliers’ competitors.
The actions taken by Vencomatic should be in the form of combining orders to increase buying
power. The amount of business being done with suppliers of non-critical items should be increased
and therefore the amount of different suppliers should be decreased.
Cash flow
The suppliers of non-critical items should improve the performances regarding the cash flow. The cash
flow of a potential supplier refers to the net result of the organization in the past years. By having a
positive net result for the past few years, the organization shows it is capable of generating revenues
and therefore creates the possibility to increase its financial health.
The remark that has to be made is, if the organization decides to invest, on one hand this brings
down the cash flow, while on the other hand this investment might improve other performances of the
organization. To improve the performances regarding cash flow, the supplier can decide to bring down
the costs within the organization or increase the margin on the sold goods and therewith the profit.
Vencomatic cannot directly influence the performance of the supplier regarding this metric.
Quick ratio
The performances of the suppliers of non-critical items regarding the quick ratio should be improved.
These performances can be improved in the same way as described at the sub-paragraph quick ratio at
the bottleneck items.
Research and development
The research and development performances of supplier which produce non-critical items can be
improved. Although these performances can be improved as described at the sub-paragraph research
- 57 -
and development at bottleneck items, the type of procurement strategy should be kept in mind to
ensure the importance of this metric.
11.1.5. Conclusion improvement performances suppliers
To improve the performances of the suppliers, a number of suggestions are made. These suggestions
are based on the different quadrants of the Kraljic matrix.
As can be derived from above, the quick ratio should be improved at all the different quadrants,
except for the suppliers of strategic items. It is difficult for Vencomatic to influence the performances
of the suppliers on this metric, since it cannot be influenced directly by Vencomatic. Since, it is hard
for Vencomatic to improve these performances of the suppliers, there should be paid attention to this
metric during the selection of suppliers.
The metric on research and development is also mentioned in all the quadrants of the Kraljic
matrix except for the suppliers of strategic items. This shows the suppliers who have a long-term
relationship with Vencomatic (suppliers of strategic items) know the importance of this metric
according to Vencomatic. The other suppliers might not have such a close relationship with
Vencomatic and therefore do not have enough insight in this preference. By the performance metrics
defined in this study, Vencomatic shows the metrics on which suppliers should perform. By including
the metric research and development, the importance Vencomatic assigned to this topic is shown.
11.2. Recommendations
To formulate recommendations for Vencomatic to improve the performances of its suppliers, a
broader view has to be taken to consideration. The procedure of selecting and evaluating new suppliers
is described below. Additionally, at the different stages recommendations, the fifth - and last- sub-
question can be answered: Which recommendations can be made to improve the logistical
performances of the suppliers of Vencomatic?
- Determine procurement strategy (Kraljic matrix)
Before Vencomatic decides to purchase certain goods, a closer look has to be taken to the type of
goods that have to be procured. By classifying the goods in the different quadrants of the Kraljic
matrix, there can be decided on the procurement strategy that has to be applied. This procurement
strategy is essential, since it is closely related to the type of relationship that will be developed with
the supplier. Additionally, the characteristics of the supplier have an influence on the procurement
strategy, so these characteristics also have to be taken into consideration. After there is decided upon
the procurement strategy, the potential suppliers can be selected.
- Apply supplier selection
Vencomatic sets requirements to its suppliers. To ensure the suppliers are capable of dealing with
these requirements, supplier selection needs to be applied. After determination of the procurement
strategy there can be looked after potential suppliers. These potential suppliers are assessed by the
performance metrics as shown in appendix 11. Additionally, the potential suppliers need to meet the
requirements of the knockout criteria, to be allowed to become a supplier. The potential suppliers that
meet these requirements need to fill in the performances they will deliver to Vencomatic. The potential
suppliers need to underpin the performances they fill in, by performances delivered at other clients.
The three suppliers who score themselves best on these performance metrics are asked to come up
with a price. The final choice of the supplier will be based on the technical-content performances
(appendix 11) and the price.
- 58 -
- Communication
If the supplier is selected, it is essential the supplier has insight in the performances Vencomatic
expects. Depending on the type of goods procured, a contract is settled between the supplier and
Vencomatic. In this contract, specifications are made on price and general purchase conditions.
Additionally, specifications and requirements need to be defined, to ensure the supplier has insight in
the performances that are expected (e.g. technical specifications, delivery times). These requirements
and specifications are defined in a Service Level Agreement.
- Measure supplier performances
If the supplier is selected and the specifications and requirements are clear, Vencomatic has to create
insight in the performances of the supplier. Insight in the performances is created by supplier
evaluation. Vencomatic has to look critically to how insight in the performances of the suppliers will
be created. The systems used by Vencomatic, have to be equipped in such a way it produces reliable
data on the performances of its suppliers.
The type of evaluation will take place as shown in Table 25. During the strategic level of supplier
evaluation, the performance metrics formulated in appendix 11 are used. At the tactical level of
supplier evaluation, four performance metrics are used for the evaluation (Table 24) of supplier
evaluation. Supplier evaluation at operational level takes place on a day-to-day basis, for which no
performance metrics are used. Though, the potential shortcomings identified during the day-to-day
basis are registered, to take into consideration during tactical and strategic supplier evaluation. By
regular interaction between the supplier and Vencomatic about the performances delivered,
performances can be adjusted timely.
- Responsibilities
When the insight in the performances of the suppliers is created, it is important to have a clear view on
who is allowed to take actions if the performances of the supplier are not in line with the agreements
made. The different levels of supplier evaluation can have different consequences:
o Operational level: essential is clarity on who is allowed to disapprove orders if they
are physically delivered to Vencomatic. If the goods are delivered and do not meet the
set requirements, the quality officer needs to be allowed to disapprove an order and
send it retour to sender. Disapprovement of an order needs to be done in consultation
with the purchasing department.
o Tactical level: evaluation of suppliers at tactical level is done on a quarterly basis. The
purchasing department will always be present during this meeting and, when needed,
the quality and/or logistics department join. If the supplier has any shortcomings,
these will be discussed during this meeting. If needed during this meeting, it can be
decided to start with the supplier development program (paragraph 5.3). During this
meeting the performance metrics discussed in Paragraph 11.1., should be taken into
consideration.
o Strategic level: The supplier evaluation at strategic level is on a yearly basis. During
this meeting, the performance metrics (appendix 11) are used. The purchasing, quality
and logistics department are all present during this meeting. If the supplier is not
performing in line with the requirements, this is discussed during this meeting.
Additionally, the Cost Improvement Program (CIP) is discussed. If the supplier does
not meet the standards as stated during the selection, in this meeting can be decided to
look for a new supplier.
- 59 -
- Cooperation with suppliers
During the interviews, different suppliers stated they wanted to increase the cooperation with
Vencomatic to further optimize the relationship. By taking into account the procurement strategy
Vencomatic wants to apply to this supplier, in case of strategic items there should be decided to
increase the cooperation. This cooperation can have different forms:
o Product development: by cooperation during the development of new products,
increased efficiency can be achieved through involvement of the supplier in an early
stage. By doing so, the technical specifications can be developed in such a way the
product is easy to produce and therefore less costly.
o Stock optimizing: a number of suppliers have stated to keep a number of specific
products for Vencomatic on stock, to be able to always fulfil the demand of
Vencomatic. Additionally, Vencomatic has a number of products if keeps on stock. By
creating insights in the different stock-levels in the supply chain, these stocks can be
optimized.
- 60 -
12. Discussion This study aims to come up with an advice to improve the performances of suppliers. The study is
conducted on behalf of Vencomatic and is performed in the form of a case study. The input of this
study consists of: literature, interviews with internal stakeholders, employees, comparable
organizations and suppliers and discussions which are held with internal stakeholders to process the
input.
Looking at existing literature, it is remarkable that the topic of supplier performance is discussed
without any direct link towards the subjects of procurement management and supply chain
management. In this way, literature seems to do not take into consideration the influences of these two
latter subjects on supplier performance. However, this study shows that these subjects are related to
each other. Whereas supply chain management is a broad area of knowledge, procurement
management is already more focused and even more specific is the topic of supplier performance.
Without discussing these broader and more comprehensive topics and taking into account the
influences those subjects can have, it is hard to increase the performances of suppliers. In order to
become able to measure any performances of suppliers, an organization should determine
requirements it wants the suppliers to meet. These specific requirements depend on the different
operational, business and corporate goals the buying organization has. Furthermore, as shown in the
theoretical framework of this study, the emphasis of supplier performance differs among the
procurement strategy a buying organization applies. Considering this, it can be derived that supplier
performance is not just a standalone subject.
Another remarkable topic discussed in literature is about supplier selection and supplier
evaluation. On one hand, existing literature distinguishes supplier selection and supplier evaluation as
two separate subjects. On the other hand, these subjects are discussed together, as being interrelated to
each other and seen as one total concept. Since the selection as well as evaluation of suppliers
comprehends similar activities at different moments, both ways of reasoning can be considered as
being competent. Nevertheless, in terms of a practical approach - like in this study - it is best
applicable to not distinguish supplier selection and supplier evaluation in all stages of supplier
assessment. As shown in this study, it is important to define performance metrics which cover criteria
on both supplier selection and supplier evaluation. Therefore, by determining performance metrics, the
subjects of supplier selection and supplier evaluation should be seen as one same subject. However,
this study demonstrates the use of different criteria for different purposes. Within the stage of supplier
selection all performance metrics are taken into account by assessing the suppliers, as well as in the
stage of yearly evaluation. But in the stage of intermediate evaluations, only several specific metrics
are considered. This is done in order to ensure the manageability and accessibility of supplier
evaluation. Evaluating all suppliers quarterly based on all performance metrics would be too intensive
in terms of organizational practicality. So, whereas literature explains both subjects in a combining
way as well as in a distinguishing way, this study argues to consider these subjects either combined or
separated depending on the stage of supplier assessment.
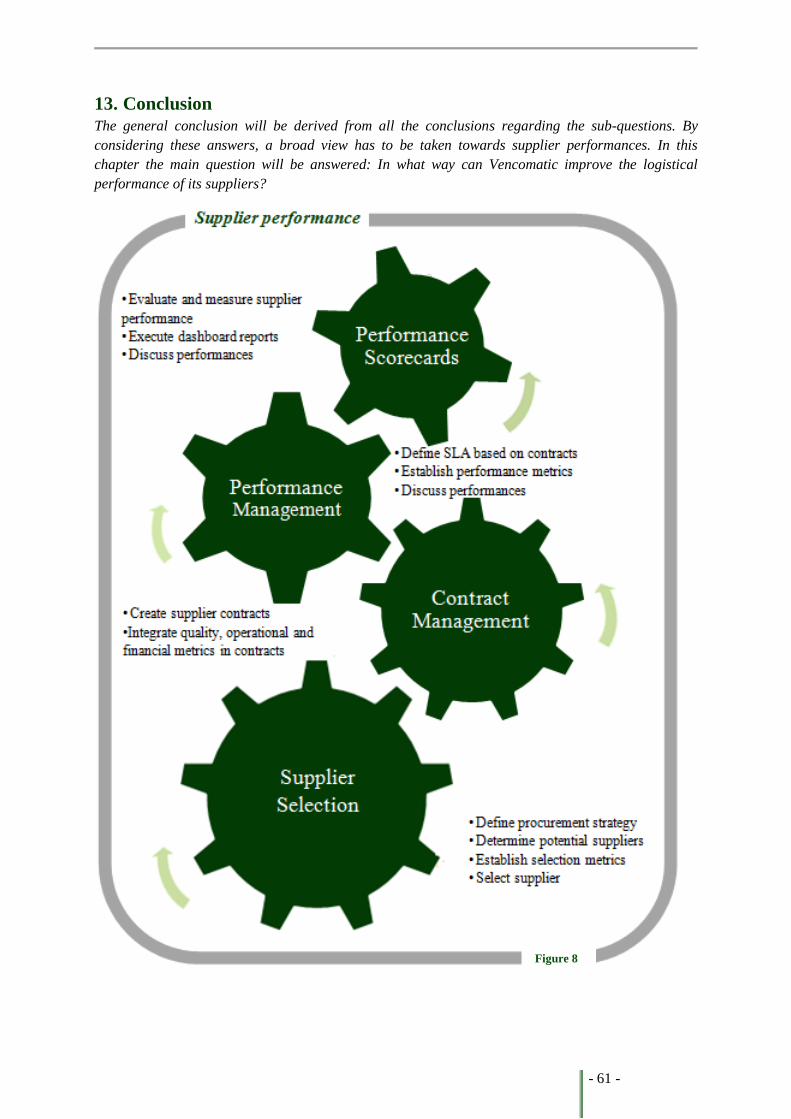
- 61 -
13. Conclusion The general conclusion will be derived from all the conclusions regarding the sub-questions. By
considering these answers, a broad view has to be taken towards supplier performances. In this
chapter the main question will be answered: In what way can Vencomatic improve the logistical
performance of its suppliers?
Figure 8
- 62 -
Answering the main question of this study will be done by making use of Figure 8. This figure
gives a schematic overview of the different steps Vencomatic needs to take to improve the
performances of its suppliers.
Supplier selection
To improve the performances of its suppliers, Vencomatic has to start questioning what kind of
suppliers it needs and wants. This should be derived from the strategy which is handled by
Vencomatic regarding its products. The innovative strategy applied by Vencomatic should be
recognized and appreciated by its suppliers. By translating this strategy into the different procurement
strategies applied by Vencomatic, a selection of suppliers can be made. The different procurement
strategies are defined in accordance with the Kraljic matrix. The procurement strategy that should be
applied by Vencomatic is determined by the characteristics of the potential supplier, the type of
product procured and the relationship with the potential supplier. After determination of the right
procurement strategy, the potential suppliers can be selected, by making use of the performance
metrics defined in appendix 11.
Contract management
After the supplier is selected, the agreed contract is the basis for the performances the supplier and
Vencomatic need to deliver. Within this contract, the purchasing conditions are defined. Additionally,
agreements regarding quality, delivery and price are set within a Service Level Agreement. It is crucial
this contract contains all the agreements made, the performances expected to create clarity and a clear
basis on which the relationship between Vencomatic and the supplier is based.
Performance management
Once clarity is created on the performances expected from both parties, physical deliveries can be
carried out. Measurements are made regarding these physical deliveries to create insight in the
performances. The performances delivered need to be in line with the agreements made in the
contract. To create insight in whether these performances are in line, the performance metrics defined
in appendix 11 are discussed on a yearly basis. During this discussion the performances are evaluated
and potential shortcomings are detected and discussed. If there are shortcomings, depending on the
deviation of the agreed performances, there can be decided to ask the supplier to come up with an
improvement plan, start with a supplier development program or look for a new supplier. Depending
on the procurement strategy and the size of the deviation, there can be decided how to improve the
performances.
Performance scorecards
Although the performances of the suppliers are discussed on a yearly basis, this frequency is not
enough if performances deviate significantly from the agreed performances. Therefore, Vencomatic
should assess the supplier on the performance metrics defined in paragraph 11.1 on a quarterly basis.
By assessing the suppliers quarterly, Vencomatic is faster able to address these performances to the
supplier and measures can be discussed to improve these performances.
As can be defined from the described steps above, it is a complete process Vencomatic has to
work with to improve the performances of its suppliers. By selecting the right suppliers which fit the
defined procurement strategies, improvements on the performances will be made. It is crucial for
Vencomatic to take into consideration all these steps and not just one, since the process as a whole
potentially improves the performances of suppliers.
- 63 -
Limitations
Despite the careful execution of this study, some limitations should be outlined. The results of this
study come from a single case. Therefore, the results are not directly generalizable. However, the aim
of this study was to give recommendations to Vencomatic, in order to improve the performances of its
suppliers. Considering this, the aim of this study serves only one case, in which generalizability was
not intended.
Besides, the supplier assessment was carried out by the suppliers themselves. They were asked to
score themselves on the different performance metrics, by reflecting on the performances they deliver
to Vencomatic. As results shown, several suppliers scored their performances on a higher level than
actually was the case. Although a more objective way of scoring (reliable measurements from
Vencomatic) might have created different insight in the supplier performances, the choice of assessing
this way was well considered on forehand. Assessing suppliers by an internal employee would result
in a standard – like always done – way of assessing suppliers, while the aim of this study is to improve
this process.
The different performance metrics emphasise different performance metrics. Due to the fact that
Vencomatic does not use any formal ways of assessing supplier performance, there is decided to first
define the performance metrics and start assessing suppliers on these metrics. Since the time period of
this study was limited, this differentiation is not carried out.
Additionally, the representation of bottleneck products is limited while only one supplier of
bottleneck products is assessed. Because of the approach used to identify suppliers based on an end
product, produced by Vencomatic, the representation of all product groups could not be manipulated.
Although a high representation could not be established, there was chosen to ensure a representation of
all product groups at least on a minimum level of one supplier per product group.
Directions for future research
Because of the single case approach of this study, the results are not generalizable. In order to become
able to generalize findings, it might be interesting to execute the research on a broader scale. More
cases should be used to define overall performance metrics applicable in different contexts.
Next, it would be interesting to investigate the long term effects of the determined performance
metrics and the use of those metrics. In this way, the practical application of supplier selection and
supplier evaluation by using this method can be examined. When this method of supplier selection and
supplier evaluation is considered to be applicable and worthy, the process can be standardized within
the organization.
Furthermore, as shown in the results, a buying organization does not have (much) direct influence
on the financial situation of its suppliers. A research towards potential influences a buying
organization can have on the financial situation of its suppliers would contribute to the practical and
theoretical area of supplier performance management.
- 64 -
References Abell, D. F. 1999. Competing today while preparing for tomorrow. Sloan management review 40.
Braglia, M. & Petroni, A. 2000. A quality assurance-oriented methodology for handling trade-offs in
supplier selection. International Journal of Physical Distribution & Logistics Management,
30, 96-112.
Burgess, K., Singh, P. J. & Koroglu, R. 2006. Supply chain management: a structured literature review
and implications for future research. International Journal of Operations & Production
Management, 26, 703-729.
Caniels, M. C. & Gelderman, C. J. 2005. Purchasing strategies in the Kraljic matrix—A power and
dependence perspective. Journal of Purchasing and Supply Management, 11, 141-155.
Carr, A. S. & Smeltzer, L. R. 1997. An empirically based operational definition of strategic
purchasing. European Journal of Purchasing & Supply Management, 3, 199-207.
Cavinato, J. L. & Kauffman, R. G. 2000. Identification and Evaluation of Sources. In: Giunipero, L. C.
(ed.) The purchasing handbook: A guide for the purchasing and supply professional. Sixth
edition ed. McGraw - Hill, United States of America.
Cheraghi, S. H., Dadashzadeh, M. & Subramanian, M. 2011. Critical success factors for supplier
selection: an update. Journal of Applied Business Research (JABR), 20.
Choi, T. Y. & Hartley, J. L. 1996. An exploration of supplier selection practices across the supply
chain. Journal of operations management, 14, 333-343.
Council, S. C. 2010. Supply Chain Operations Reference (SCOR) model - Overview Version 10.0.
Cousins, P. D., Lawson, B. & Squire, B. 2008. Performance measurement in strategic buyer-supplier
relationships: the mediating role of socialization mechanisms. International Journal of
Operations & Production Management, 28, 238-258.
Cousins, P. D. & Menguc, B. 2006. The implications of socialization and integration in supply chain
management. Journal of Operations Management, 24, 604-620.
Cousins, P. D. & Spekman, R. 2003. Strategic supply and the management of inter-and intra-
organisational relationships. Journal of Purchasing and Supply Management, 9, 19-29.
De Boer, L., Labro, E. & Morlacchi, P. 2001. A review of methods supporting supplier selection.
European Journal of Purchasing & Supply Management, 7, 75-89.
Deshmukh, A. J. & Chaudhari, A. A. 2011. A review for supplier selection criteria and methods.
Technology Systems and Management. Springer.
Dubois, A. & Pedersen, A.-C. 2002. Why relationships do not fit into purchasing portfolio models—a
comparison between the portfolio and industrial network approaches. European Journal of
Purchasing & Supply Management, 8, 35-42.
Ellram, L. M. & Carr, A. 1994. Strategic purchasing: a history and review of the literature.
International Journal of Purchasing and Materials Management, 30, 9-19.
Eriksson, P. & Kovalainen, A. 2008. Introduction. Qualitative Methods in Business Research Sage
publications, London.Flores, B. E. & Whybark, D. C. 1987. Implementing multiple criteria
ABC analysis. Journal of Operations Management, 7, 79-85.
Forrester, J. W. 1958. Industrial dynamics; a major breakthrough for decision makers. Harvard
Business Review, July-August, 37 - 66.
Gelderman, C. J. 2003. A portfolio approach to the development of differentiated purchasing
strategies.
Gelderman, C. J. & Van Weele, A. J. 2003. Handling measurement issues and strategic directions in
Kraljic's purchasing portfolio model. Journal of purchasing and supply management, 9, 207-
216.
- 65 -
Gelderman, C. J. & Van Weele, A. J. 2005. Purchasing portfolio models: a critique and update.
Journal of Supply Chain Management, 41, 19-28.
Gencer, C. & Gürpinar, D. 2007. Analytic network process in supplier selection: A case study in an
electronic firm. Applied Mathematical Modelling, 31, 2475-2486.
Germain, R. & Dröge, C. 1990. Wholesale operations and vendor evaluation. Journal of Business
Research, 21, 119-129.
Gordon, S. 2005. Seven steps to measure supplier performance. Quality progress, 38, 20-25.
Garvin, D.A., 1993. Building a learning organization. Harvard Business Review 71 (4), 78–81.
Gunasekaran, A., Patel, C. & McGaughey, R. E. 2004. A framework for supply chain performance
measurement. International journal of production economics, 87, 333-347.
Halldorsson, A., Kotzab, H., Mikkola, J. H. & Skjøtt-Larsen, T. 2007. Complementary theories to
supply chain management. Supply chain management: An international journal, 12, 284-296.
Harding, M. & Harding, M., L. 2000. Supplier Performance Evaluation. The purchasing handbook: A
guide for purchasing and supply professionals. Sixth edition ed. McGraw - Hill, United States
of America.
Hatch, M. J. 1993. The dynamics of organizational culture. Academy of management review, 18, 657-
693.
Ho, W., Xu, X. & Dey, P. K. 2010. Multi-criteria decision making approaches for supplier evaluation
and selection: A literature review. European Journal of Operational Research, 202, 16-24.
Holt, G. D. 1996. Applying cluster analysis to construction contractor classification. Building and
Environment, 31, 557-568.
Holt, G. D. 1998. Which contractor selection methodology? International Journal of project
management, 16, 153-164.
Islam, D. M. Z., Fabian Meier, J., Aditjandra, P. T., Zunder, T. H. & Pace, G. 2013. Logistics and
supply chain management. Research in Transportation Economics, 41, 3-16.
JE, T. & Thiruchelvam, S. 2011. Evolving Trends of Supplier Selection Criteria And Methods.
International Journal of Automotive and Mechanical Engineering (IJAME), 4, 437-454.
Johnson, G., Whittington, R. & Scholes, K. 2012. Fundamentals of strategy, Second edn. Pearson
Education Limited, Harlow.
Kannan, V. R. & Tan, K. C. 2006. Buyer-supplier relationships: the impact of supplier selection and
buyer-supplier engagement on relationship and firm performance. International Journal of
Physical Distribution & Logistics Management, 36, 755-775.
Karpak, B., Kumcu, E. & Kasuganti, R. R. 2001. Purchasing materials in the supply chain: managing a
multi-objective task. European Journal of Purchasing & Supply Management, 7, 209-216.
Kocaoğlu, B., Gülsün, B. & Tanyaş, M. 2013. A SCOR based approach for measuring a
benchmarkable supply chain performance. Journal of Intelligent Manufacturing, 24, 113-132.
Kraljic, P. 1983. Purchasing must become supply management. Harvard business review, 61, 109-117.
Krause, D. R. 1997. Supplier development: current practices and outcomes. Journal of Supply Chain
Management, 33, 12-19.
Krause, D. R. & Ellram, L. M. 1997. Critical elements of supplier development; The buying-firm
perspective. European Journal of Purchasing & Supply Management, 3, 21-31.
Krause, D. R., Scannell, T. V. & Calantone, R. J. 2000. A structural analysis of the effectiveness of
buying firms' strategies to improve supplier performance. Decision Sciences, 31, 33-55.
Kumar, N., Scheer, L. K. & Steenkamp, J.-B. E. 1995. The effects of perceived interdependence on
dealer attitudes. Journal of Marketing Research (JMR), 32.
Lai, K.-h., Ngai, E. & Cheng, T. 2002. Measures for evaluating supply chain performance in transport
logistics. Transportation Research Part E: Logistics and Transportation Review, 38, 439-456.
- 66 -
Lambert, D. M., García‐Dastugue, S. J. & Croxton, K. L. 2005. An evaluation of process‐oriented
supply chain management frameworks. Journal of business Logistics, 26, 25-51.
Mandal, A. & Deshmukh, S. 1994. Vendor selection using interpretive structural modelling (ISM).
International Journal of Operations & Production Management, 14, 52-59.
Mentzer, J. T., DeWitt, W., Keebler, J. S., Min, S., Nix, N. W., Smith, C. D. & Zacharia, Z. G. 2001.
Defining supply chain management. Journal of Business logistics, 22, 1-25.
Minahan, T. A. & Vigoroso, M. W. 2002. The supplier performance measurement benchmarking
report: Measuring supply chain success. Aberdeen Group.
Morgan, R. M. & Hunt, S. D. 1994. The commitment-trust theory of relationship marketing. Journal
of marketing, 58.
Morris, M. & Carter, C. R. 2005. Relationship marketing and supplier logistics performance: an
extension of the key mediating variables model. Journal of Supply Chain Management, 41,
32-43.
Muralidharan, C., Anantharaman, N. & Deshmukh, S. 2002. A Multi‐Criteria Group Decisionmaking
Model for Supplier Rating. Journal of Supply Chain Management, 38, 22-33.
Narasimhan, R., Talluri, S. & Mendez, D. 2001. Supplier evaluation and rationalization via data
envelopment analysis: an empirical examination. Journal of supply chain management, 37,
28-37.
Naslund, D. & Williamson, S. 2010. What is Management in Supply Chain Management?-A Critical
Review of Definitions, Frameworks and Terminology. Journal of Management Policy &
Practice, 11.
Nellore, R. & Söderquist, K. 2000. Portfolio approaches to procurement: Analysing the missing link to
specifications. Long Range Planning, 33, 245-267.
Olhager, J. 2012. The role of decoupling points in value chain management. Modelling Value.
Springer.
Olhager, J. & Selldin, E. 2007. Manufacturing planning and control approaches: market alignment and
performance. International Journal of Production Research, 45, 1469-1484.
Olsen, R. F. & Ellram, L. M. 1997a. Buyer-supplier relationships: alternative research approaches.
European Journal of Purchasing & Supply Management, 3, 221-231.
Olsen, R. F. & Ellram, L. M. 1997b. A portfolio approach to supplier relationships. Industrial
marketing management, 26, 101-113.
Pal, O., Gupta, A. K. & Garg, R. 2013. Supplier Selection Criteria and Methods in Supply Chains: A
Review. International Journal of Social, Human Science and Engineering, 7, 173 - 179.
Patton, M.Q. (2002). Qualitative interviewing. Qualitative research and evaluation methods. Third
edition ed. Sage Publications, California.
Park, A., Nayyar, G. & Low, P. 2013. Supply Chain Perspectives and Issues: A Literature Review.
World Trade Organization, Fung Global Institute, Geneva.
Paulraj, A. & Chen, I. J. 2007. Strategic buyer–supplier relationships, information technology and
external logistics integration. Journal of Supply Chain Management, 43, 2-14.
Porter, M. E. 2000. The five competitive forces that shape strategy. Harvard business review,
February, 1 - 18.
Porter, M. E. & Millar, V. E. 1985. How information gives you competitive advantage. Harvard
Business Review, Reprint Service.
Power, D. 2005. Supply chain management integration and implementation: a literature review. Supply
chain management: an International journal, 10, 252-263.
Pradhan, S. K. & Routroy, S. 2014. Analyzing the performance of supplier development: a case study.
International Journal of Productivity and Performance Management, 63, 209-233.
- 67 -
Prahalad, C. & Hamel, G. 2008. The core competence of the corporation. Classics Compendium, 15
must - read articles for managerial success, 74 - 89.
Prahinski, C. & Benton, W. 2004. Supplier evaluations: communication strategies to improve supplier
performance. Journal of operations management, 22, 39-62.
Purdy, L., Astad, U. & Safayeni, F. 1994. Perceived effectiveness of the automotive supplier
evaluation process. International Journal of Operations & Production Management, 14, 91-
103.
Sarkis, J. & Talluri, S. 2002. A model for strategic supplier selection. Journal of supply chain
management, 38, 18-28.
Schmitz, J. & Platts, K. 2004. Supplier logistics performance measurement: indications from a study
in the automotive industry. International Journal of Production Economics, 89, 231-243.
Sevkli, M., Koh, S. L., Zaim, S., Demirbag, M. & Tatoglu, E. 2008. Hybrid analytical hierarchy
process model for supplier selection. Industrial Management & Data Systems, 108, 122-142.
Simpson, P. M., Siguaw, J. A. & White, S. C. 2002. Measuring the performance of suppliers: an
analysis of evaluation processes. Journal of Supply Chain Management, 38, 29-41.
Spekman, R. E., Kamauff Jr, J. W. & Myhr, N. 1998. An empirical investigation into supply chain
management: a perspective on partnerships. Supply Chain Management: An International
Journal, 3, 53-67.
Svensson, G. 2002. A conceptual framework of vulnerability in firms’ inbound and outbound logistics
flows. International Journal of Physical Distribution & Logistics Management, 32, 110-134.
Svensson, G. 2003. The bullwhip effect in intra-organisational echelons. International Journal of
Physical Distribution & Logistics Management, 33, 103-131.
Tahriri, F., Osman, M. R., Ali, A. & Yusuff, R. M. 2008. A review of supplier selection methods in
manufacturing industries. Suranaree Journal of Science and Technology, 15, 201-208.
Tam, M. C. & Tummala, V. 2001. An application of the AHP in vendor selection of a
telecommunications system. Omega, 29, 171-182.
Turnbull, P. W. 1990. A review of portfolio planning models for industrial marketing and purchasing
management. European Journal of Marketing, 24, 7-22.
Van Weele, A. J. 2005. Purchasing & Supply Chain Management: Analysis, Strategy, Planning and
Practice, Fourth edn. Thomson Learning, London.
Vaus, d. D. 2001. Research Design In Social Research Sage Publications Ltd.
Vokurka, R. J., Choobineh, J. & Vadi, L. 1996. A prototype expert system for the evaluation and
selection of potential suppliers. International Journal of Operations & Production
Management, 16, 106-127.
Vonderembse, M. A. & Tracey, M. 1999. The impact of supplier selection criteria and supplier
involvement on manufacturing performance. Journal of Supply Chain Management, 35, 33-
39.
Weber, C. A., Current, J. R. & Benton, W. 1991. Vendor selection criteria and methods. European
journal of operational research, 50, 2-18.
Wu, D. D. 2010. A systematic stochastic efficiency analysis model and application to international
supplier performance evaluation. Expert Systems with Applications, 37, 6257-6264.
Yahya, S. & Kingsman, B. 1999. Vendor rating for an entrepreneur development programme: a case
study using the analytic hierarchy process method. Journal of the Operational Research
Society, 916-930.

- 68 -
Appendices
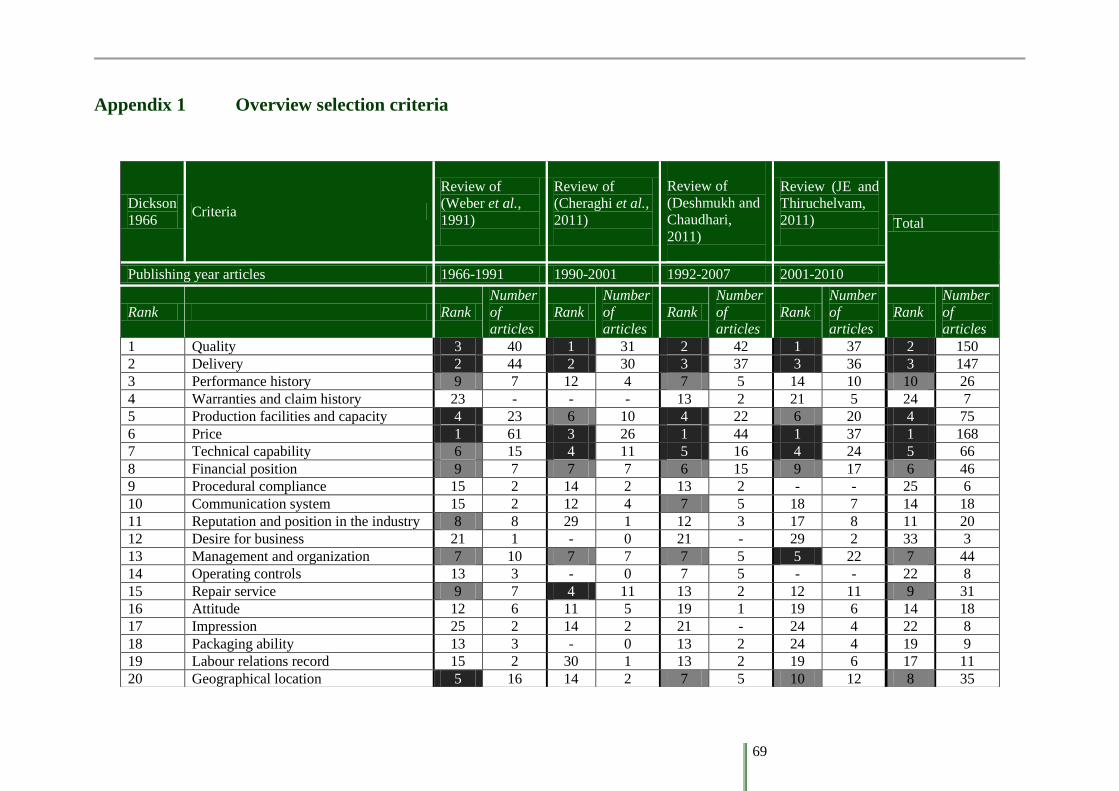
69
Appendix 1 Overview selection criteria
Dickson
1966 Criteria
Review of
(Weber et al.,
1991)
Review of
(Cheraghi et al.,
2011)
Review of
(Deshmukh and
Chaudhari,
2011)
Review (JE and
Thiruchelvam,
2011)
Total
Publishing year articles 1966-1991 1990-2001 1992-2007 2001-2010
Rank Rank
Number
of
articles
Rank
Number
of
articles
Rank
Number
of
articles
Rank
Number
of
articles
Rank
Number
of
articles
1 Quality 3 40 1 31 2 42 1 37 2 150
2 Delivery 2 44 2 30 3 37 3 36 3 147
3 Performance history 9 7 12 4 7 5 14 10 10 26
4 Warranties and claim history 23 - - - 13 2 21 5 24 7
5 Production facilities and capacity 4 23 6 10 4 22 6 20 4 75
6 Price 1 61 3 26 1 44 1 37 1 168
7 Technical capability 6 15 4 11 5 16 4 24 5 66
8 Financial position 9 7 7 7 6 15 9 17 6 46
9 Procedural compliance 15 2 14 2 13 2 - - 25 6
10 Communication system 15 2 12 4 7 5 18 7 14 18
11 Reputation and position in the industry 8 8 29 1 12 3 17 8 11 20
12 Desire for business 21 1 - 0 21 - 29 2 33 3
13 Management and organization 7 10 7 7 7 5 5 22 7 44
14 Operating controls 13 3 - 0 7 5 - - 22 8
15 Repair service 9 7 4 11 13 2 12 11 9 31
16 Attitude 12 6 11 5 19 1 19 6 14 18
17 Impression 25 2 14 2 21 - 24 4 22 8
18 Packaging ability 13 3 - 0 13 2 24 4 19 9
19 Labour relations record 15 2 30 1 13 2 19 6 17 11
20 Geographical location 5 16 14 2 7 5 10 12 8 35
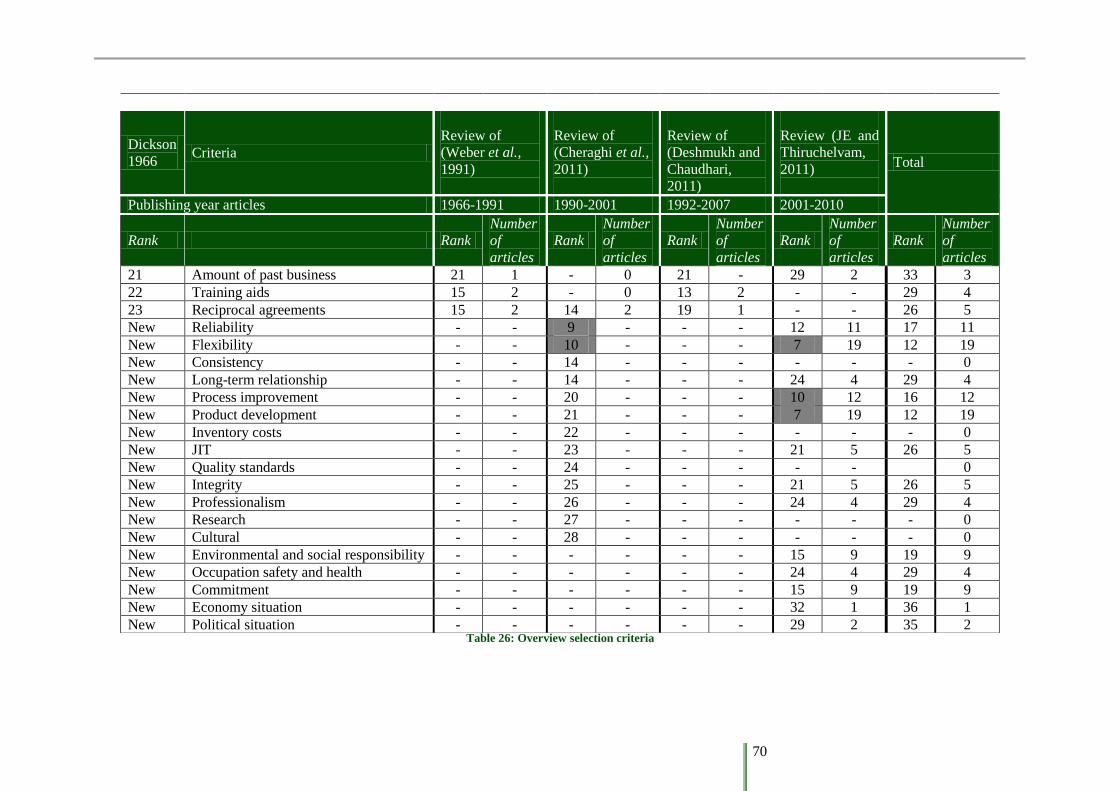
70
Dickson
1966 Criteria
Review of
(Weber et al.,
1991)
Review of
(Cheraghi et al.,
2011)
Review of
(Deshmukh and
Chaudhari,
2011)
Review (JE and
Thiruchelvam,
2011)
Total
Publishing year articles 1966-1991 1990-2001 1992-2007 2001-2010
Rank Rank
Number
of
articles
Rank
Number
of
articles
Rank
Number
of
articles
Rank
Number
of
articles
Rank
Number
of
articles
21 Amount of past business 21 1 - 0 21 - 29 2 33 3
22 Training aids 15 2 - 0 13 2 - - 29 4
23 Reciprocal agreements 15 2 14 2 19 1 - - 26 5
New Reliability - - 9 - - - 12 11 17 11
New Flexibility - - 10 - - - 7 19 12 19
New Consistency - - 14 - - - - - - 0
New Long-term relationship - - 14 - - - 24 4 29 4
New Process improvement - - 20 - - - 10 12 16 12
New Product development - - 21 - - - 7 19 12 19
New Inventory costs - - 22 - - - - - - 0
New JIT - - 23 - - - 21 5 26 5
New Quality standards - - 24 - - - - - 0
New Integrity - - 25 - - - 21 5 26 5
New Professionalism - - 26 - - - 24 4 29 4
New Research - - 27 - - - - - - 0
New Cultural - - 28 - - - - - - 0
New Environmental and social responsibility - - - - - - 15 9 19 9
New Occupation safety and health - - - - - - 24 4 29 4
New Commitment - - - - - - 15 9 19 9
New Economy situation - - - - - - 32 1 36 1
New Political situation - - - - - - 29 2 35 2 Table 26: Overview selection criteria
71
Appendix 2 Multi criteria decision making techniques
Linear weighting model
By far linear weighting models are the most applied approach to deal with supplier selection (Weber et
al., 1991; Vokurka et al., 1996). The linear weighting models place weights on the different criteria.
The biggest weight indicates the highest priority (De Boer et al., 2001). Deriving these weights is done
by an assessment procedure. Decision makers can evaluate the criteria in terms of importance. By
assigning weights to the different criteria a total score for each supplier can be calculated. Linear
weighting models are able to deal with incomplete, qualitative and unstructured purchasing situations.
Examples of linear weighting models are:
- Linear weighting models: Weightings are assigned to each criterion. The highest weighting
indicates the highest importance. The suppliers are assessed to these criteria; the highest
ranked supplier should be selected.
- Quasi-compensatory models: In a linear weighting model a high score on one criterion can
compensate a low score on another criterion. In a quasi-compensatory model this
compensation is not possible. These models can also be applied in the pre-qualification phase
(De Boer et al., 2001).
- Analytical Hierarchical Process (AHP): The AHP model continuous on the Quasi-
compensatory models. Additionally the AHP model makes use of pair-wise comparison to
determine the weights of the different criteria. By applying the AHP model, only a verbal,
qualitative statement regarding the importance of one criteria versus another is needed to rank
the alternatives (De Boer et al., 2001).
- Analytical Network Process (ANP): The ANP model is generalised of the AHP model. The
ANP model is capable of incorporating relationships of different factors into the model. The
AHP model is a starting point for the ANP model (Pal et al., 2013).
- Fuzzy Sets Theory (FST): The FST model offers a way to model preferences into setting
weights for the different criteria (De Boer et al., 2001).
- Multiple Attribute Utility Theory (MAUT): This technique is used for international supplier
selection and is capable of handling multiple conflicting attributes (Tahriri et al., 2008).
- Total Cost of Ownership (TCO): This technique summarizes and qualifies costs associated
with supplier selection accountable for the purchased items during its life cycle. This
technique is only applied to relatively simple cases, because it is a complex method (De Boer
et al., 2001; Tahriri et al., 2008).
Mathematical programming models
Mathematical programming offers a mathematical way of dealing with the supplier evaluation
problems. A mathematical objective function has to be formulated to maximize profit or minimize
costs, which will be solved by changing the variables in the objective function. An advantage of the
mathematical programming models is that the objective function has to be formulated which makes
the objective explicit. A disadvantage of the mathematical programming models is that only
quantitative criteria are considered. The mathematical models assume predetermined levels on quality
and service (De Boer et al., 2001). Examples of mathematical programming models are:
- Mixed integer programming: These models deal with optimization problems involving two or
more criteria (Pal et al., 2013).
- Goal programming: Goal programming allows to make a trade of between the different goals
on an interactive and graphical way (Karpak et al., 2001).
72
Statistical models
Statistical models deal with the stochastic uncertainty. This uncertainty is by not knowing how
demand for services will develop. In the previous mentioned models this uncertainty is also present,
although there is not explicitly death with (De Boer et al., 2001). Though the statistical model deals
with this uncertainty, there is dealt with uncertainty for one criterion at the time. Soukoup in De Boer
et al., (2001) introduced a simulation model for unstable demand, which can also be applied in the pre-
qualification phase. Although it is applicable in this phase these models are only capable of dealing
with a modified rebuy (leverage items). An example of statistical model is the cluster analysis, which
is already defined in the pre-qualification phase.
Artificial intelligence
The artificial intelligence models are based on computerized systems that can be trained by historic
data. When a situation occurs the non-expert purchaser can consult the system. The system is based on
artificial intelligence and is able to assist during the selection of a supplier. The systems are able to
deal with the complexity and uncertainty involved in supplier selection (Pal et al., 2013). As stated by
Vokurka et al., (1996) the artificial intelligence models can also be applied in the pre-qualification
phase of the supplier selection problem. Stated by Vokurka et al., (1996), the artificial intelligence
models can only be applied in with modified rebuy (leverage items). Examples of artificial intelligence
are:
- Case-based-reasoning: Case-based-reasoning is a software driven database, which provides
the purchaser with useful information about previous situations (Pal et al., 2013).
- Artificial Neural Network (ANN): The ANN model processes elements that are
interconnected. By doing so it saves time and money, though the model requires special
software and qualified personnel (De Boer et al., 2001; Tahriri et al., 2008).
73
Appendix 3 Case studies Since all organizations procure goods, every organization has to deal with the performances of
suppliers. Though, this is more essential for one organization than it is for another. Therefore, studies
have been conducted on the process of supplier performance measurement. Case studies create insight
in the potential issues previous studies have revealed. In line with this, some case studies are
mentioned to create insight in these performance metrics.
Top Fortune 150 organizations and Institute for Supply Management members
As stated by Simpson et al., (2002) less than 10% of the organizations who took part in the study, had
a formal weighted supplier evaluation system and even 45.5% of the organizations indicated that they
did not have a formal method for the evaluation of the suppliers at all. Considering the average sales
of the respondents was $3.861 million and 23% of the organizations had between 5.000 and 79.000
employees, this was noted remarkable. According toSimpson et al., (2002) quality is considerably
more important over the other criteria. Additionally the most important criteria are meeting the
customer requirements and continuous improvements. Furthermore facilities, open communication
and logistics and distribution are considered important.
Wholesalers and retailers
The case study by Germain and Dröge (1990), has 369 respondents of which 148 wholesalers and 221
retailers. The average sales were $483 million and the wholesalers and retailers are mostly active in
the food and building materials sector. The price, quality and communication were considered as the
most important aspects. Additionally aspects considered during the study in hierarchically order are:
On-time delivery, easy to work with, flexible, positive attitude, customer support, management
quality, complete orders, willing to customize service, consistency order cycle, early notification of
disruption, short order cycle and packing quality.
Electronic organization
In Gencer and Gürpinar (2007) a case study is conducted at a major electronic organization. The
organization employs 615 people to realize the design, manufacturing, purchasing and after sales of
electronic installations. The selection of suppliers takes place by making use of 45 supplier selection
criteria, which are divided under main attributes: business structure of the supplier, manufacturing
capability of the supplier and the quality system of the supplier. Weights on the different attributes and
criteria are determined by making use of the expert opinion, translated into weight by making use of
the AHP methodology. The suppliers are evaluated on these criteria and if they cope with the
requirement of the buying firm they are added to the list of approved suppliers. New order will only be
offered to these approved suppliers.
Dicksons’ criteria
Additionally there are several case studies which started with the criteria formulated by Dickson and
conducted internal expert interviews (Yahya and Kingsman, 1999; Tam and Tummala, 2001; Sevkli et
al., 2008). As stated by Yahya and Kingsman (1999), there are only slight differences between the
criteria stated by Dickson and the interviews with the experts, at least the six main topics are the same
only changed in order. In the other case studies, the criteria have been modified for the specific buying
organization, though the original criteria stated by Dickson can be derived. In these case studies the
order of main topics is: Quality, Delivery, Price, Production facilities, Geographical location,
Technical capability and Reliability.
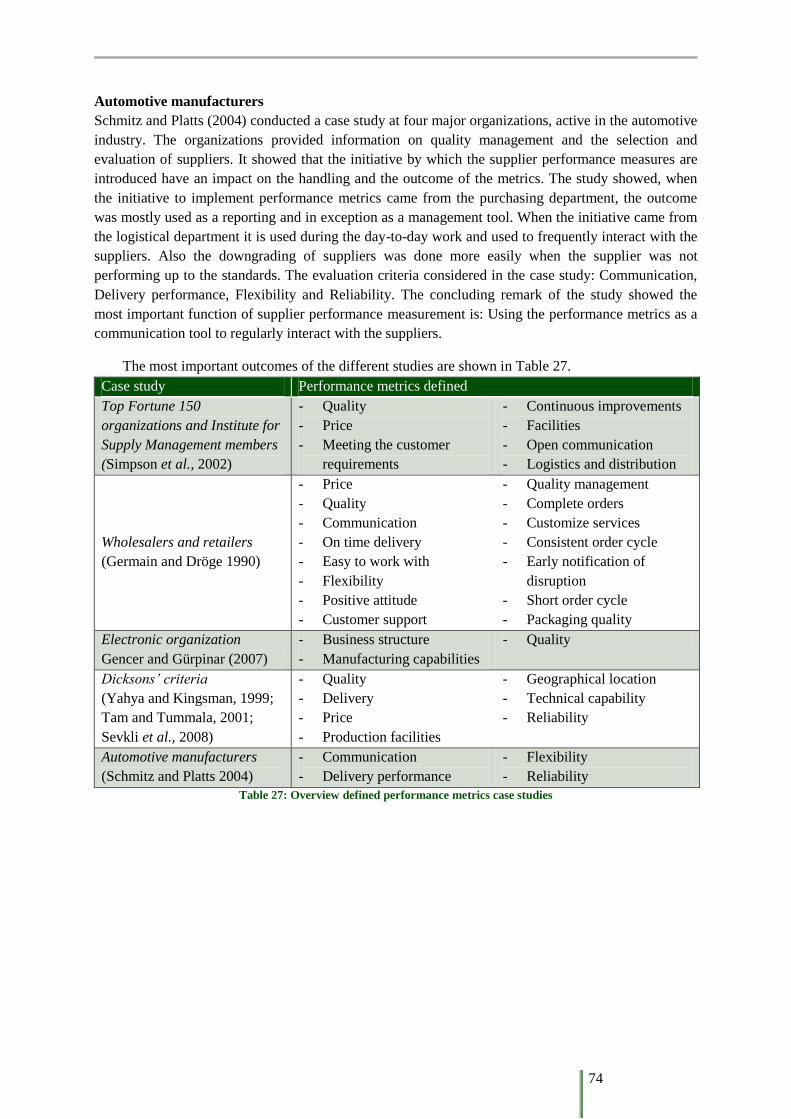
74
Automotive manufacturers
Schmitz and Platts (2004) conducted a case study at four major organizations, active in the automotive
industry. The organizations provided information on quality management and the selection and
evaluation of suppliers. It showed that the initiative by which the supplier performance measures are
introduced have an impact on the handling and the outcome of the metrics. The study showed, when
the initiative to implement performance metrics came from the purchasing department, the outcome
was mostly used as a reporting and in exception as a management tool. When the initiative came from
the logistical department it is used during the day-to-day work and used to frequently interact with the
suppliers. Also the downgrading of suppliers was done more easily when the supplier was not
performing up to the standards. The evaluation criteria considered in the case study: Communication,
Delivery performance, Flexibility and Reliability. The concluding remark of the study showed the
most important function of supplier performance measurement is: Using the performance metrics as a
communication tool to regularly interact with the suppliers.
The most important outcomes of the different studies are shown in Table 27.
Case study Performance metrics defined
Top Fortune 150
organizations and Institute for
Supply Management members
(Simpson et al., 2002)
- Quality
- Price
- Meeting the customer
requirements
- Continuous improvements
- Facilities
- Open communication
- Logistics and distribution
Wholesalers and retailers
(Germain and Dröge 1990)
- Price
- Quality
- Communication
- On time delivery
- Easy to work with
- Flexibility
- Positive attitude
- Customer support
- Quality management
- Complete orders
- Customize services
- Consistent order cycle
- Early notification of
disruption
- Short order cycle
- Packaging quality
Electronic organization
Gencer and Gürpinar (2007)
- Business structure
- Manufacturing capabilities
- Quality
Dicksons’ criteria
(Yahya and Kingsman, 1999;
Tam and Tummala, 2001;
Sevkli et al., 2008)
- Quality
- Delivery
- Price
- Production facilities
- Geographical location
- Technical capability
- Reliability
Automotive manufacturers
(Schmitz and Platts 2004)
- Communication
- Delivery performance
- Flexibility
- Reliability
Table 27: Overview defined performance metrics case studies
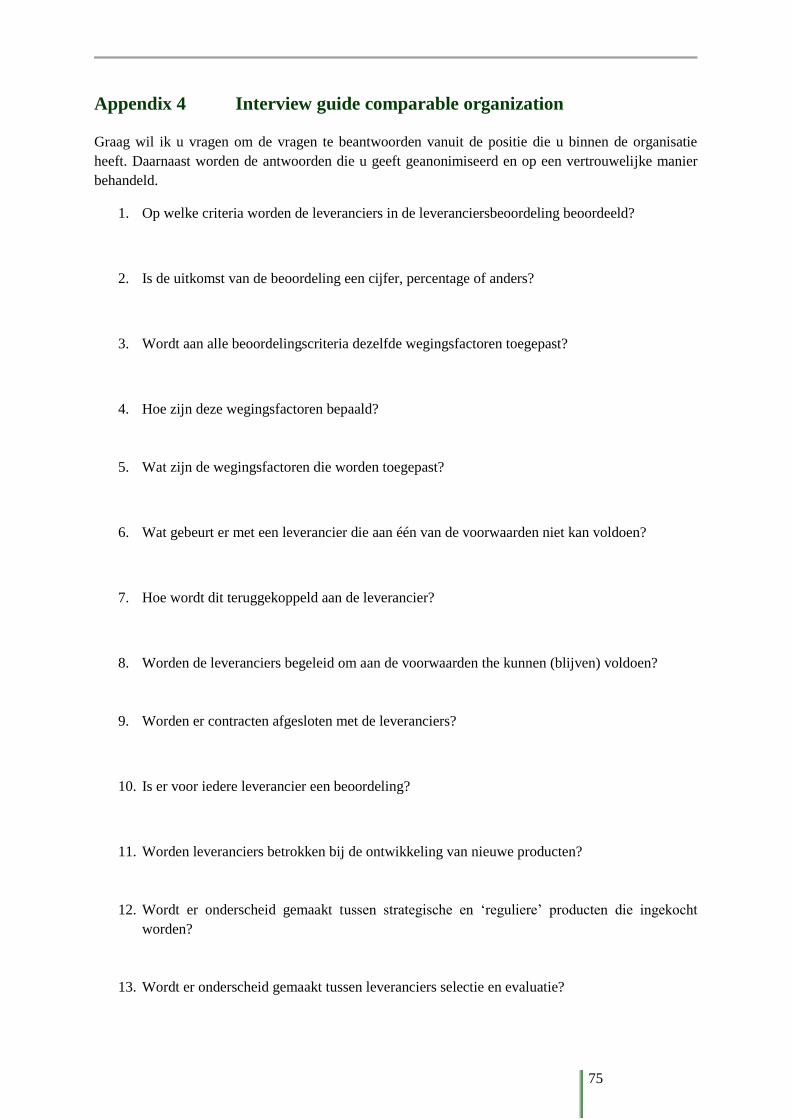
75
Appendix 4 Interview guide comparable organization
Graag wil ik u vragen om de vragen te beantwoorden vanuit de positie die u binnen de organisatie
heeft. Daarnaast worden de antwoorden die u geeft geanonimiseerd en op een vertrouwelijke manier
behandeld.
1. Op welke criteria worden de leveranciers in de leveranciersbeoordeling beoordeeld?
2. Is de uitkomst van de beoordeling een cijfer, percentage of anders?
3. Wordt aan alle beoordelingscriteria dezelfde wegingsfactoren toegepast?
4. Hoe zijn deze wegingsfactoren bepaald?
5. Wat zijn de wegingsfactoren die worden toegepast?
6. Wat gebeurt er met een leverancier die aan één van de voorwaarden niet kan voldoen?
7. Hoe wordt dit teruggekoppeld aan de leverancier?
8. Worden de leveranciers begeleid om aan de voorwaarden the kunnen (blijven) voldoen?
9. Worden er contracten afgesloten met de leveranciers?
10. Is er voor iedere leverancier een beoordeling?
11. Worden leveranciers betrokken bij de ontwikkeling van nieuwe producten?
12. Wordt er onderscheid gemaakt tussen strategische en ‘reguliere’ producten die ingekocht
worden?
13. Wordt er onderscheid gemaakt tussen leveranciers selectie en evaluatie?
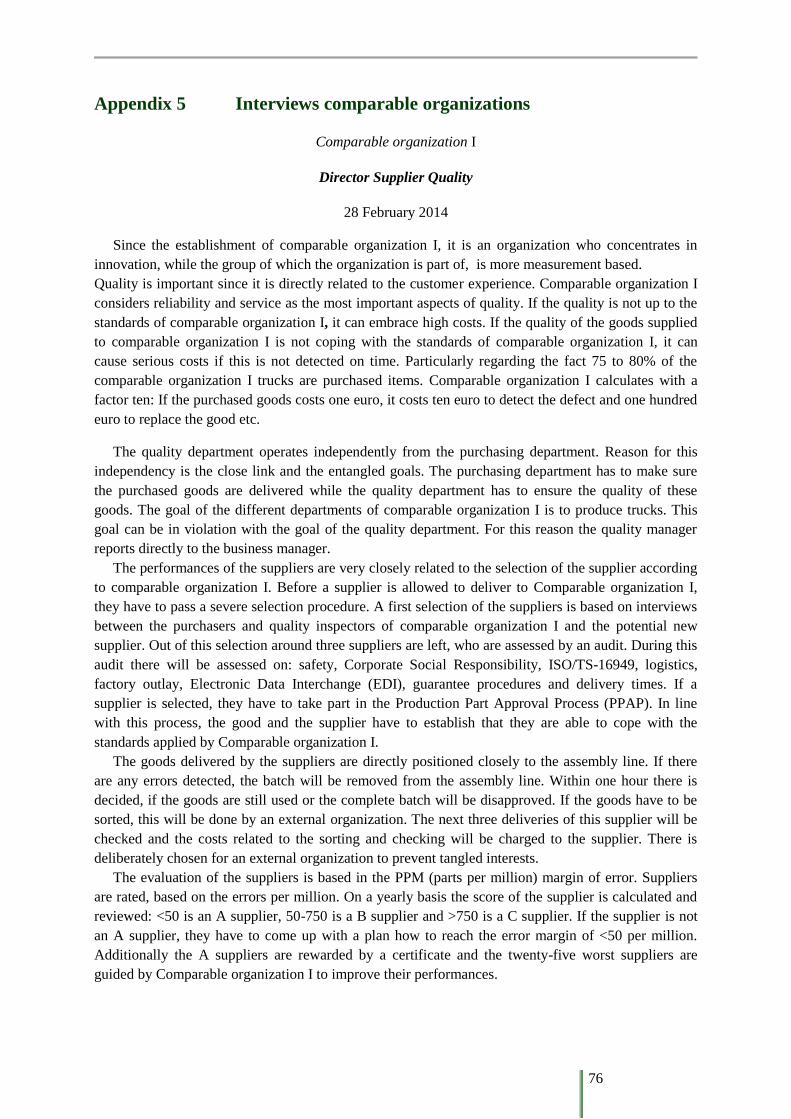
76
Appendix 5 Interviews comparable organizations
Comparable organization I
Director Supplier Quality
28 February 2014
Since the establishment of comparable organization I, it is an organization who concentrates in
innovation, while the group of which the organization is part of, is more measurement based.
Quality is important since it is directly related to the customer experience. Comparable organization I
considers reliability and service as the most important aspects of quality. If the quality is not up to the
standards of comparable organization I, it can embrace high costs. If the quality of the goods supplied
to comparable organization I is not coping with the standards of comparable organization I, it can
cause serious costs if this is not detected on time. Particularly regarding the fact 75 to 80% of the
comparable organization I trucks are purchased items. Comparable organization I calculates with a
factor ten: If the purchased goods costs one euro, it costs ten euro to detect the defect and one hundred
euro to replace the good etc.
The quality department operates independently from the purchasing department. Reason for this
independency is the close link and the entangled goals. The purchasing department has to make sure
the purchased goods are delivered while the quality department has to ensure the quality of these
goods. The goal of the different departments of comparable organization I is to produce trucks. This
goal can be in violation with the goal of the quality department. For this reason the quality manager
reports directly to the business manager.
The performances of the suppliers are very closely related to the selection of the supplier according
to comparable organization I. Before a supplier is allowed to deliver to Comparable organization I,
they have to pass a severe selection procedure. A first selection of the suppliers is based on interviews
between the purchasers and quality inspectors of comparable organization I and the potential new
supplier. Out of this selection around three suppliers are left, who are assessed by an audit. During this
audit there will be assessed on: safety, Corporate Social Responsibility, ISO/TS-16949, logistics,
factory outlay, Electronic Data Interchange (EDI), guarantee procedures and delivery times. If a
supplier is selected, they have to take part in the Production Part Approval Process (PPAP). In line
with this process, the good and the supplier have to establish that they are able to cope with the
standards applied by Comparable organization I.
The goods delivered by the suppliers are directly positioned closely to the assembly line. If there
are any errors detected, the batch will be removed from the assembly line. Within one hour there is
decided, if the goods are still used or the complete batch will be disapproved. If the goods have to be
sorted, this will be done by an external organization. The next three deliveries of this supplier will be
checked and the costs related to the sorting and checking will be charged to the supplier. There is
deliberately chosen for an external organization to prevent tangled interests.
The evaluation of the suppliers is based in the PPM (parts per million) margin of error. Suppliers
are rated, based on the errors per million. On a yearly basis the score of the supplier is calculated and
reviewed: <50 is an A supplier, 50-750 is a B supplier and >750 is a C supplier. If the supplier is not
an A supplier, they have to come up with a plan how to reach the error margin of <50 per million.
Additionally the A suppliers are rewarded by a certificate and the twenty-five worst suppliers are
guided by Comparable organization I to improve their performances.
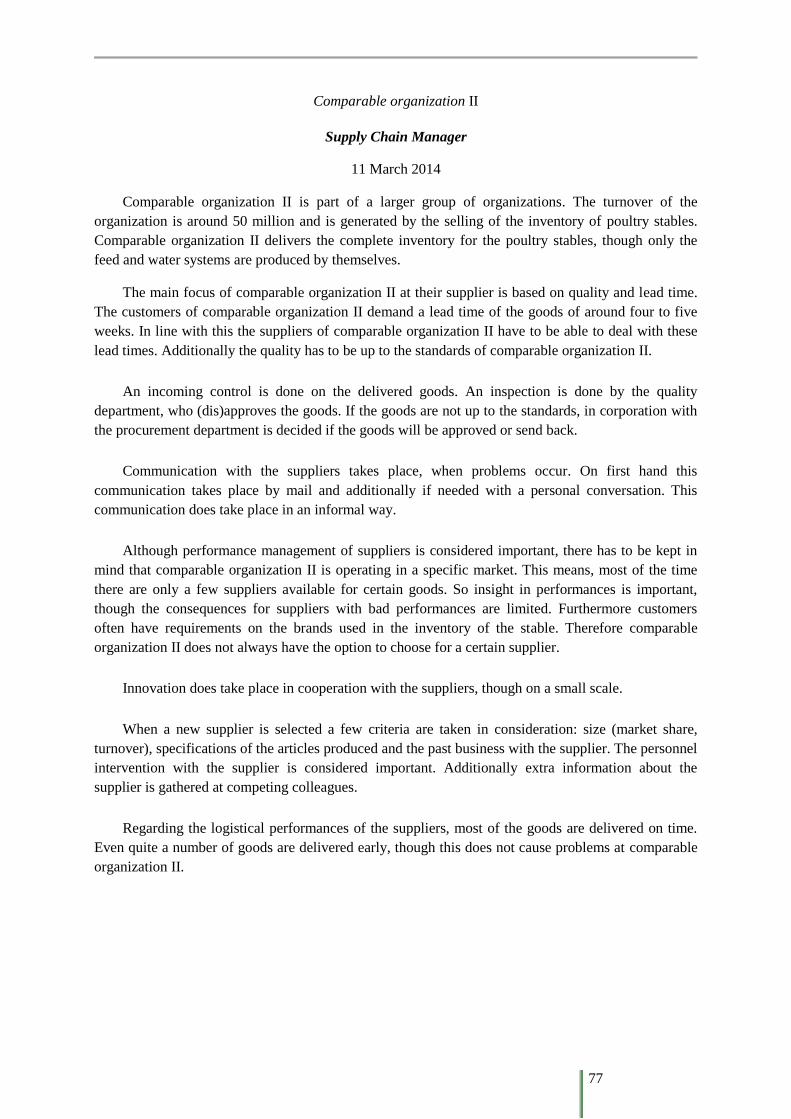
77
Comparable organization II
Supply Chain Manager
11 March 2014
Comparable organization II is part of a larger group of organizations. The turnover of the
organization is around 50 million and is generated by the selling of the inventory of poultry stables.
Comparable organization II delivers the complete inventory for the poultry stables, though only the
feed and water systems are produced by themselves.
The main focus of comparable organization II at their supplier is based on quality and lead time.
The customers of comparable organization II demand a lead time of the goods of around four to five
weeks. In line with this the suppliers of comparable organization II have to be able to deal with these
lead times. Additionally the quality has to be up to the standards of comparable organization II.
An incoming control is done on the delivered goods. An inspection is done by the quality
department, who (dis)approves the goods. If the goods are not up to the standards, in corporation with
the procurement department is decided if the goods will be approved or send back.
Communication with the suppliers takes place, when problems occur. On first hand this
communication takes place by mail and additionally if needed with a personal conversation. This
communication does take place in an informal way.
Although performance management of suppliers is considered important, there has to be kept in
mind that comparable organization II is operating in a specific market. This means, most of the time
there are only a few suppliers available for certain goods. So insight in performances is important,
though the consequences for suppliers with bad performances are limited. Furthermore customers
often have requirements on the brands used in the inventory of the stable. Therefore comparable
organization II does not always have the option to choose for a certain supplier.
Innovation does take place in cooperation with the suppliers, though on a small scale.
When a new supplier is selected a few criteria are taken in consideration: size (market share,
turnover), specifications of the articles produced and the past business with the supplier. The personnel
intervention with the supplier is considered important. Additionally extra information about the
supplier is gathered at competing colleagues.
Regarding the logistical performances of the suppliers, most of the goods are delivered on time.
Even quite a number of goods are delivered early, though this does not cause problems at comparable
organization II.
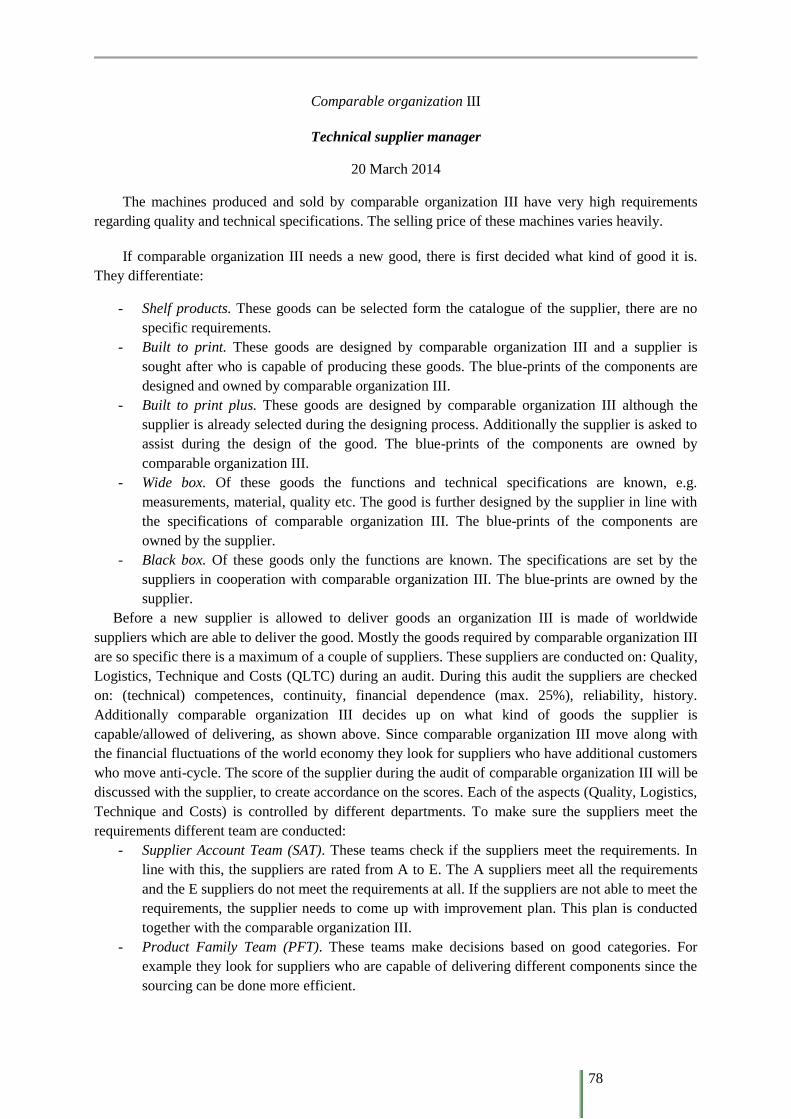
78
Comparable organization III
Technical supplier manager
20 March 2014
The machines produced and sold by comparable organization III have very high requirements
regarding quality and technical specifications. The selling price of these machines varies heavily.
If comparable organization III needs a new good, there is first decided what kind of good it is.
They differentiate:
- Shelf products. These goods can be selected form the catalogue of the supplier, there are no
specific requirements.
- Built to print. These goods are designed by comparable organization III and a supplier is
sought after who is capable of producing these goods. The blue-prints of the components are
designed and owned by comparable organization III.
- Built to print plus. These goods are designed by comparable organization III although the
supplier is already selected during the designing process. Additionally the supplier is asked to
assist during the design of the good. The blue-prints of the components are owned by
comparable organization III.
- Wide box. Of these goods the functions and technical specifications are known, e.g.
measurements, material, quality etc. The good is further designed by the supplier in line with
the specifications of comparable organization III. The blue-prints of the components are
owned by the supplier.
- Black box. Of these goods only the functions are known. The specifications are set by the
suppliers in cooperation with comparable organization III. The blue-prints are owned by the
supplier.
Before a new supplier is allowed to deliver goods an organization III is made of worldwide
suppliers which are able to deliver the good. Mostly the goods required by comparable organization III
are so specific there is a maximum of a couple of suppliers. These suppliers are conducted on: Quality,
Logistics, Technique and Costs (QLTC) during an audit. During this audit the suppliers are checked
on: (technical) competences, continuity, financial dependence (max. 25%), reliability, history.
Additionally comparable organization III decides up on what kind of goods the supplier is
capable/allowed of delivering, as shown above. Since comparable organization III move along with
the financial fluctuations of the world economy they look for suppliers who have additional customers
who move anti-cycle. The score of the supplier during the audit of comparable organization III will be
discussed with the supplier, to create accordance on the scores. Each of the aspects (Quality, Logistics,
Technique and Costs) is controlled by different departments. To make sure the suppliers meet the
requirements different team are conducted:
- Supplier Account Team (SAT). These teams check if the suppliers meet the requirements. In
line with this, the suppliers are rated from A to E. The A suppliers meet all the requirements
and the E suppliers do not meet the requirements at all. If the suppliers are not able to meet the
requirements, the supplier needs to come up with improvement plan. This plan is conducted
together with the comparable organization III.
- Product Family Team (PFT). These teams make decisions based on good categories. For
example they look for suppliers who are capable of delivering different components since the
sourcing can be done more efficient.
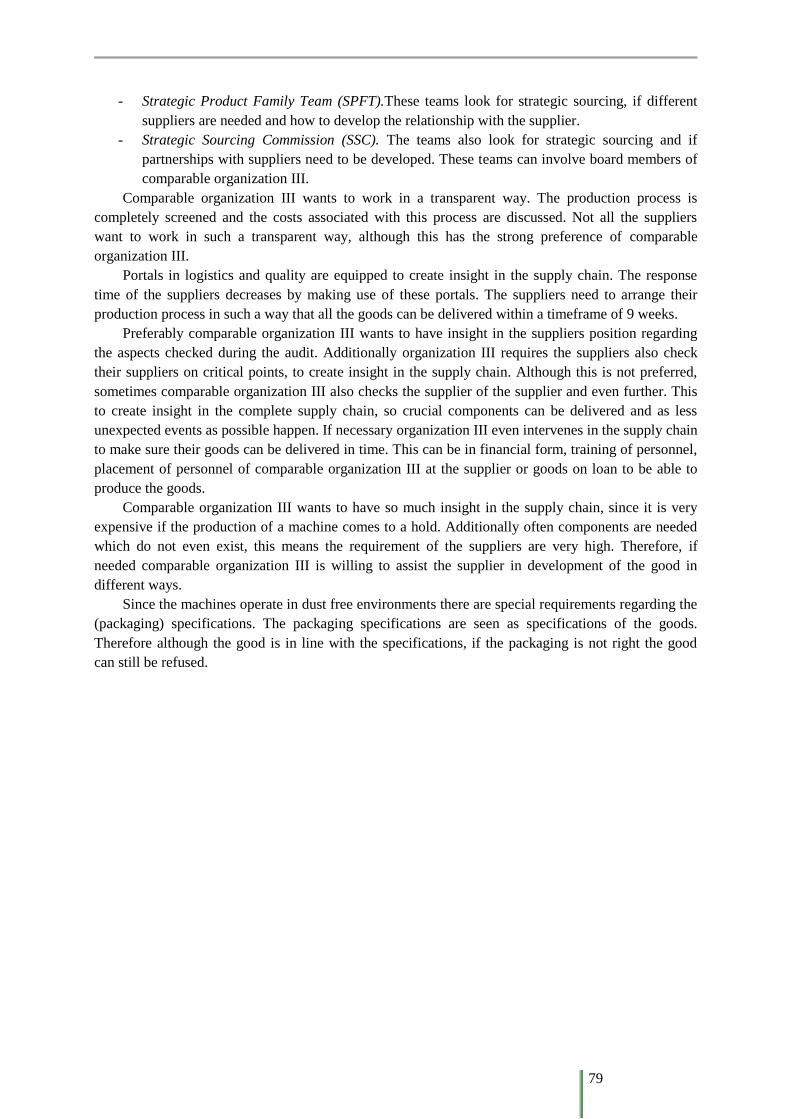
79
- Strategic Product Family Team (SPFT).These teams look for strategic sourcing, if different
suppliers are needed and how to develop the relationship with the supplier.
- Strategic Sourcing Commission (SSC). The teams also look for strategic sourcing and if
partnerships with suppliers need to be developed. These teams can involve board members of
comparable organization III.
Comparable organization III wants to work in a transparent way. The production process is
completely screened and the costs associated with this process are discussed. Not all the suppliers
want to work in such a transparent way, although this has the strong preference of comparable
organization III.
Portals in logistics and quality are equipped to create insight in the supply chain. The response
time of the suppliers decreases by making use of these portals. The suppliers need to arrange their
production process in such a way that all the goods can be delivered within a timeframe of 9 weeks.
Preferably comparable organization III wants to have insight in the suppliers position regarding
the aspects checked during the audit. Additionally organization III requires the suppliers also check
their suppliers on critical points, to create insight in the supply chain. Although this is not preferred,
sometimes comparable organization III also checks the supplier of the supplier and even further. This
to create insight in the complete supply chain, so crucial components can be delivered and as less
unexpected events as possible happen. If necessary organization III even intervenes in the supply chain
to make sure their goods can be delivered in time. This can be in financial form, training of personnel,
placement of personnel of comparable organization III at the supplier or goods on loan to be able to
produce the goods.
Comparable organization III wants to have so much insight in the supply chain, since it is very
expensive if the production of a machine comes to a hold. Additionally often components are needed
which do not even exist, this means the requirement of the suppliers are very high. Therefore, if
needed comparable organization III is willing to assist the supplier in development of the good in
different ways.
Since the machines operate in dust free environments there are special requirements regarding the
(packaging) specifications. The packaging specifications are seen as specifications of the goods.
Therefore although the good is in line with the specifications, if the packaging is not right the good
can still be refused.
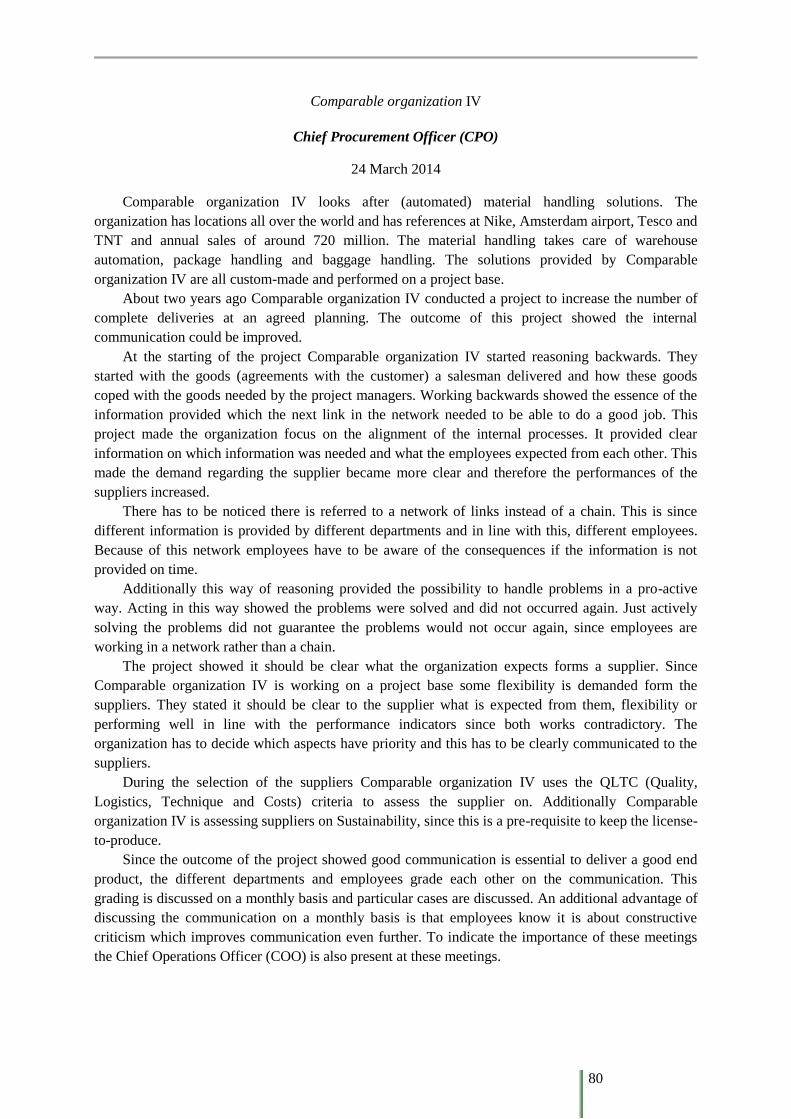
80
Comparable organization IV
Chief Procurement Officer (CPO)
24 March 2014
Comparable organization IV looks after (automated) material handling solutions. The
organization has locations all over the world and has references at Nike, Amsterdam airport, Tesco and
TNT and annual sales of around 720 million. The material handling takes care of warehouse
automation, package handling and baggage handling. The solutions provided by Comparable
organization IV are all custom-made and performed on a project base.
About two years ago Comparable organization IV conducted a project to increase the number of
complete deliveries at an agreed planning. The outcome of this project showed the internal
communication could be improved.
At the starting of the project Comparable organization IV started reasoning backwards. They
started with the goods (agreements with the customer) a salesman delivered and how these goods
coped with the goods needed by the project managers. Working backwards showed the essence of the
information provided which the next link in the network needed to be able to do a good job. This
project made the organization focus on the alignment of the internal processes. It provided clear
information on which information was needed and what the employees expected from each other. This
made the demand regarding the supplier became more clear and therefore the performances of the
suppliers increased.
There has to be noticed there is referred to a network of links instead of a chain. This is since
different information is provided by different departments and in line with this, different employees.
Because of this network employees have to be aware of the consequences if the information is not
provided on time.
Additionally this way of reasoning provided the possibility to handle problems in a pro-active
way. Acting in this way showed the problems were solved and did not occurred again. Just actively
solving the problems did not guarantee the problems would not occur again, since employees are
working in a network rather than a chain.
The project showed it should be clear what the organization expects forms a supplier. Since
Comparable organization IV is working on a project base some flexibility is demanded form the
suppliers. They stated it should be clear to the supplier what is expected from them, flexibility or
performing well in line with the performance indicators since both works contradictory. The
organization has to decide which aspects have priority and this has to be clearly communicated to the
suppliers.
During the selection of the suppliers Comparable organization IV uses the QLTC (Quality,
Logistics, Technique and Costs) criteria to assess the supplier on. Additionally Comparable
organization IV is assessing suppliers on Sustainability, since this is a pre-requisite to keep the license-
to-produce.
Since the outcome of the project showed good communication is essential to deliver a good end
product, the different departments and employees grade each other on the communication. This
grading is discussed on a monthly basis and particular cases are discussed. An additional advantage of
discussing the communication on a monthly basis is that employees know it is about constructive
criticism which improves communication even further. To indicate the importance of these meetings
the Chief Operations Officer (COO) is also present at these meetings.
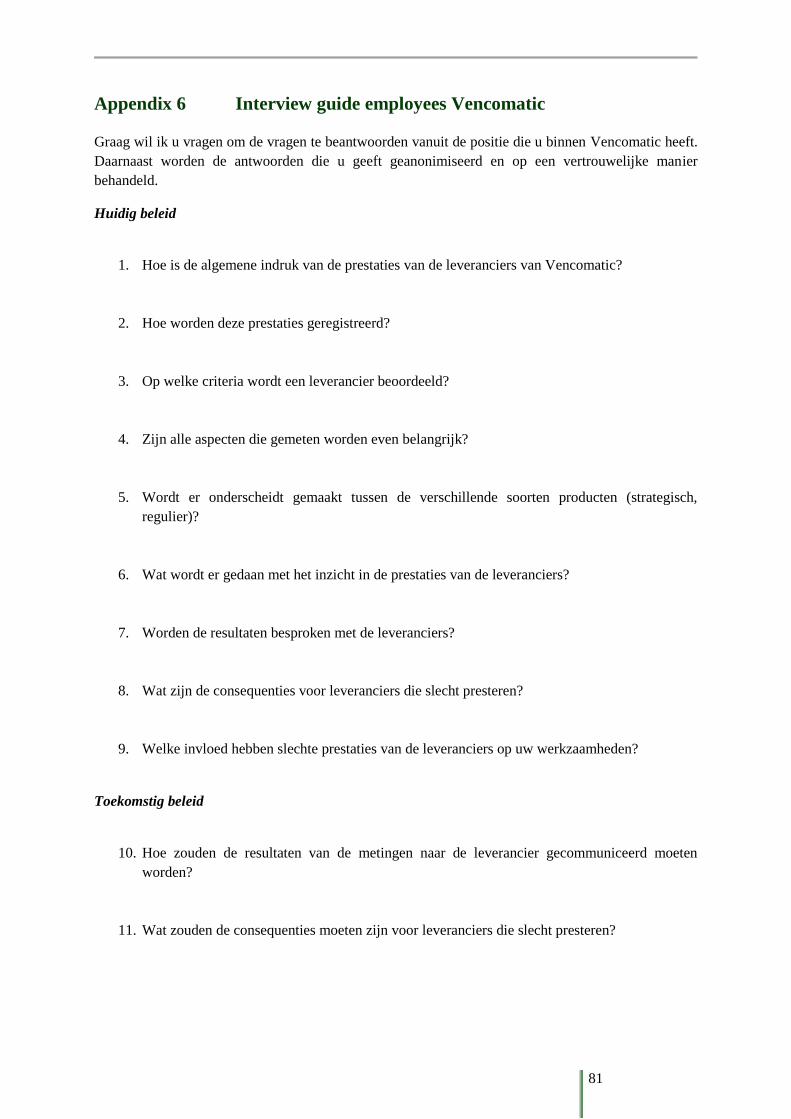
81
Appendix 6 Interview guide employees Vencomatic
Graag wil ik u vragen om de vragen te beantwoorden vanuit de positie die u binnen Vencomatic heeft.
Daarnaast worden de antwoorden die u geeft geanonimiseerd en op een vertrouwelijke manier
behandeld.
Huidig beleid
1. Hoe is de algemene indruk van de prestaties van de leveranciers van Vencomatic?
2. Hoe worden deze prestaties geregistreerd?
3. Op welke criteria wordt een leverancier beoordeeld?
4. Zijn alle aspecten die gemeten worden even belangrijk?
5. Wordt er onderscheidt gemaakt tussen de verschillende soorten producten (strategisch,
regulier)?
6. Wat wordt er gedaan met het inzicht in de prestaties van de leveranciers?
7. Worden de resultaten besproken met de leveranciers?
8. Wat zijn de consequenties voor leveranciers die slecht presteren?
9. Welke invloed hebben slechte prestaties van de leveranciers op uw werkzaamheden?
Toekomstig beleid
10. Hoe zouden de resultaten van de metingen naar de leverancier gecommuniceerd moeten
worden?
11. Wat zouden de consequenties moeten zijn voor leveranciers die slecht presteren?
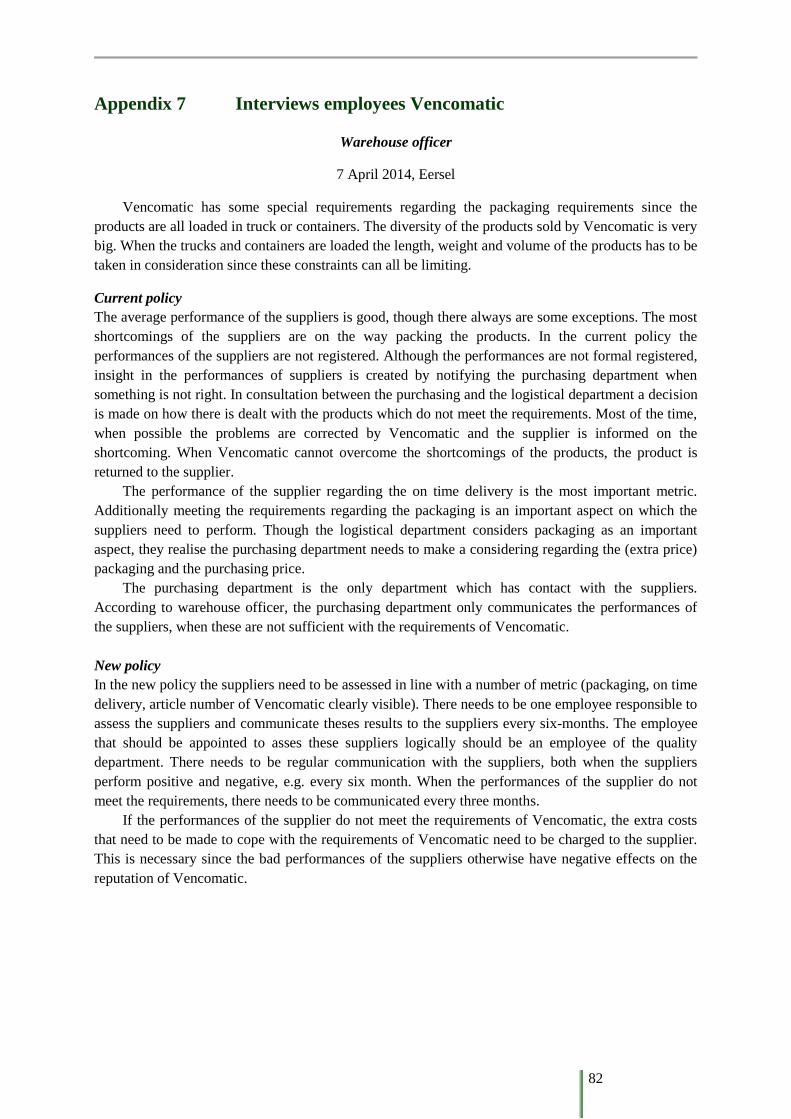
82
Appendix 7 Interviews employees Vencomatic
Warehouse officer
7 April 2014, Eersel
Vencomatic has some special requirements regarding the packaging requirements since the
products are all loaded in truck or containers. The diversity of the products sold by Vencomatic is very
big. When the trucks and containers are loaded the length, weight and volume of the products has to be
taken in consideration since these constraints can all be limiting.
Current policy
The average performance of the suppliers is good, though there always are some exceptions. The most
shortcomings of the suppliers are on the way packing the products. In the current policy the
performances of the suppliers are not registered. Although the performances are not formal registered,
insight in the performances of suppliers is created by notifying the purchasing department when
something is not right. In consultation between the purchasing and the logistical department a decision
is made on how there is dealt with the products which do not meet the requirements. Most of the time,
when possible the problems are corrected by Vencomatic and the supplier is informed on the
shortcoming. When Vencomatic cannot overcome the shortcomings of the products, the product is
returned to the supplier.
The performance of the supplier regarding the on time delivery is the most important metric.
Additionally meeting the requirements regarding the packaging is an important aspect on which the
suppliers need to perform. Though the logistical department considers packaging as an important
aspect, they realise the purchasing department needs to make a considering regarding the (extra price)
packaging and the purchasing price.
The purchasing department is the only department which has contact with the suppliers.
According to warehouse officer, the purchasing department only communicates the performances of
the suppliers, when these are not sufficient with the requirements of Vencomatic.
New policy
In the new policy the suppliers need to be assessed in line with a number of metric (packaging, on time
delivery, article number of Vencomatic clearly visible). There needs to be one employee responsible to
assess the suppliers and communicate theses results to the suppliers every six-months. The employee
that should be appointed to asses these suppliers logically should be an employee of the quality
department. There needs to be regular communication with the suppliers, both when the suppliers
perform positive and negative, e.g. every six month. When the performances of the supplier do not
meet the requirements, there needs to be communicated every three months.
If the performances of the supplier do not meet the requirements of Vencomatic, the extra costs
that need to be made to cope with the requirements of Vencomatic need to be charged to the supplier.
This is necessary since the bad performances of the suppliers otherwise have negative effects on the
reputation of Vencomatic.
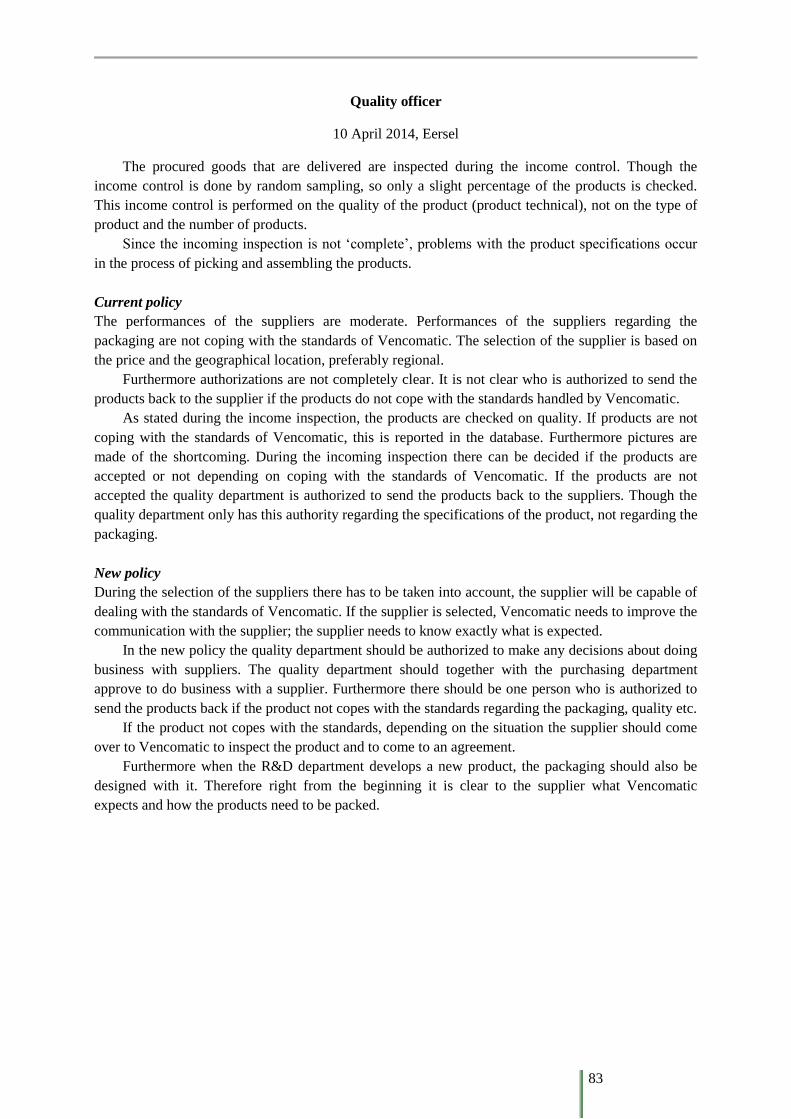
83
Quality officer
10 April 2014, Eersel
The procured goods that are delivered are inspected during the income control. Though the
income control is done by random sampling, so only a slight percentage of the products is checked.
This income control is performed on the quality of the product (product technical), not on the type of
product and the number of products.
Since the incoming inspection is not ‘complete’, problems with the product specifications occur
in the process of picking and assembling the products.
Current policy
The performances of the suppliers are moderate. Performances of the suppliers regarding the
packaging are not coping with the standards of Vencomatic. The selection of the supplier is based on
the price and the geographical location, preferably regional.
Furthermore authorizations are not completely clear. It is not clear who is authorized to send the
products back to the supplier if the products do not cope with the standards handled by Vencomatic.
As stated during the income inspection, the products are checked on quality. If products are not
coping with the standards of Vencomatic, this is reported in the database. Furthermore pictures are
made of the shortcoming. During the incoming inspection there can be decided if the products are
accepted or not depending on coping with the standards of Vencomatic. If the products are not
accepted the quality department is authorized to send the products back to the suppliers. Though the
quality department only has this authority regarding the specifications of the product, not regarding the
packaging.
New policy
During the selection of the suppliers there has to be taken into account, the supplier will be capable of
dealing with the standards of Vencomatic. If the supplier is selected, Vencomatic needs to improve the
communication with the supplier; the supplier needs to know exactly what is expected.
In the new policy the quality department should be authorized to make any decisions about doing
business with suppliers. The quality department should together with the purchasing department
approve to do business with a supplier. Furthermore there should be one person who is authorized to
send the products back if the product not copes with the standards regarding the packaging, quality etc.
If the product not copes with the standards, depending on the situation the supplier should come
over to Vencomatic to inspect the product and to come to an agreement.
Furthermore when the R&D department develops a new product, the packaging should also be
designed with it. Therefore right from the beginning it is clear to the supplier what Vencomatic
expects and how the products need to be packed.
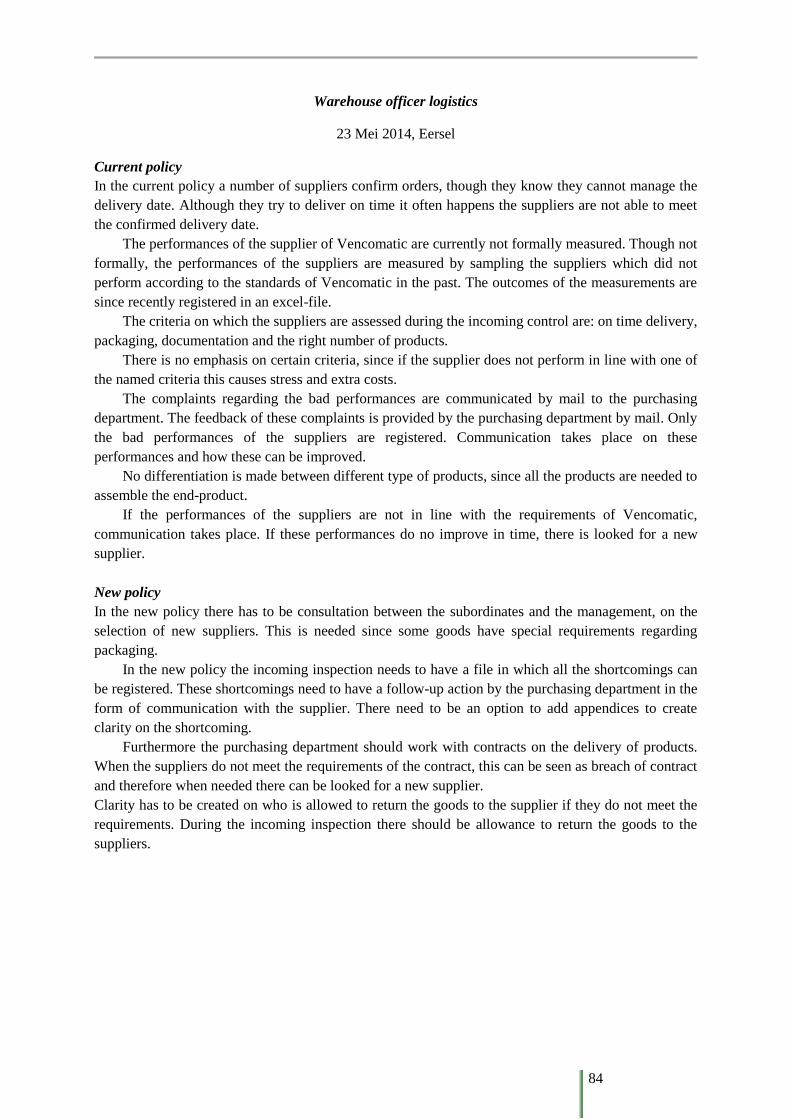
84
Warehouse officer logistics
23 Mei 2014, Eersel
Current policy
In the current policy a number of suppliers confirm orders, though they know they cannot manage the
delivery date. Although they try to deliver on time it often happens the suppliers are not able to meet
the confirmed delivery date.
The performances of the supplier of Vencomatic are currently not formally measured. Though not
formally, the performances of the suppliers are measured by sampling the suppliers which did not
perform according to the standards of Vencomatic in the past. The outcomes of the measurements are
since recently registered in an excel-file.
The criteria on which the suppliers are assessed during the incoming control are: on time delivery,
packaging, documentation and the right number of products.
There is no emphasis on certain criteria, since if the supplier does not perform in line with one of
the named criteria this causes stress and extra costs.
The complaints regarding the bad performances are communicated by mail to the purchasing
department. The feedback of these complaints is provided by the purchasing department by mail. Only
the bad performances of the suppliers are registered. Communication takes place on these
performances and how these can be improved.
No differentiation is made between different type of products, since all the products are needed to
assemble the end-product.
If the performances of the suppliers are not in line with the requirements of Vencomatic,
communication takes place. If these performances do no improve in time, there is looked for a new
supplier.
New policy
In the new policy there has to be consultation between the subordinates and the management, on the
selection of new suppliers. This is needed since some goods have special requirements regarding
packaging.
In the new policy the incoming inspection needs to have a file in which all the shortcomings can
be registered. These shortcomings need to have a follow-up action by the purchasing department in the
form of communication with the supplier. There need to be an option to add appendices to create
clarity on the shortcoming.
Furthermore the purchasing department should work with contracts on the delivery of products.
When the suppliers do not meet the requirements of the contract, this can be seen as breach of contract
and therefore when needed there can be looked for a new supplier.
Clarity has to be created on who is allowed to return the goods to the supplier if they do not meet the
requirements. During the incoming inspection there should be allowance to return the goods to the
suppliers.
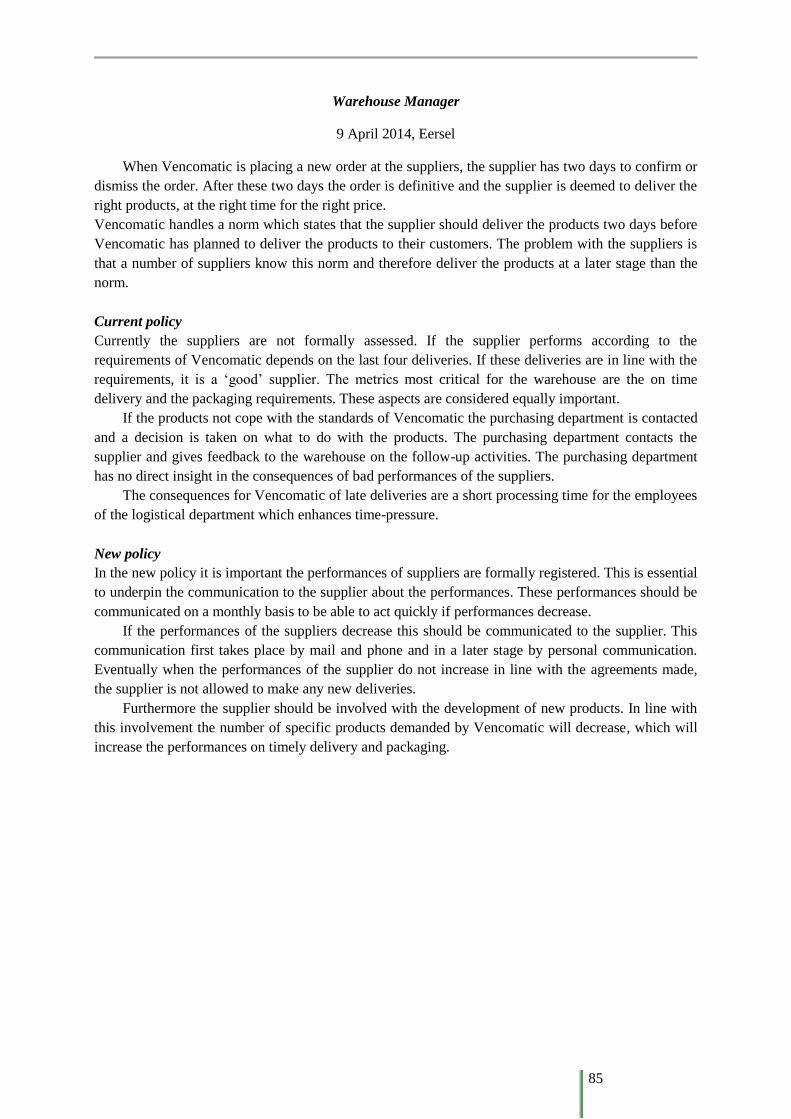
85
Warehouse Manager
9 April 2014, Eersel
When Vencomatic is placing a new order at the suppliers, the supplier has two days to confirm or
dismiss the order. After these two days the order is definitive and the supplier is deemed to deliver the
right products, at the right time for the right price.
Vencomatic handles a norm which states that the supplier should deliver the products two days before
Vencomatic has planned to deliver the products to their customers. The problem with the suppliers is
that a number of suppliers know this norm and therefore deliver the products at a later stage than the
norm.
Current policy
Currently the suppliers are not formally assessed. If the supplier performs according to the
requirements of Vencomatic depends on the last four deliveries. If these deliveries are in line with the
requirements, it is a ‘good’ supplier. The metrics most critical for the warehouse are the on time
delivery and the packaging requirements. These aspects are considered equally important.
If the products not cope with the standards of Vencomatic the purchasing department is contacted
and a decision is taken on what to do with the products. The purchasing department contacts the
supplier and gives feedback to the warehouse on the follow-up activities. The purchasing department
has no direct insight in the consequences of bad performances of the suppliers.
The consequences for Vencomatic of late deliveries are a short processing time for the employees
of the logistical department which enhances time-pressure.
New policy
In the new policy it is important the performances of suppliers are formally registered. This is essential
to underpin the communication to the supplier about the performances. These performances should be
communicated on a monthly basis to be able to act quickly if performances decrease.
If the performances of the suppliers decrease this should be communicated to the supplier. This
communication first takes place by mail and phone and in a later stage by personal communication.
Eventually when the performances of the supplier do not increase in line with the agreements made,
the supplier is not allowed to make any new deliveries.
Furthermore the supplier should be involved with the development of new products. In line with
this involvement the number of specific products demanded by Vencomatic will decrease, which will
increase the performances on timely delivery and packaging.
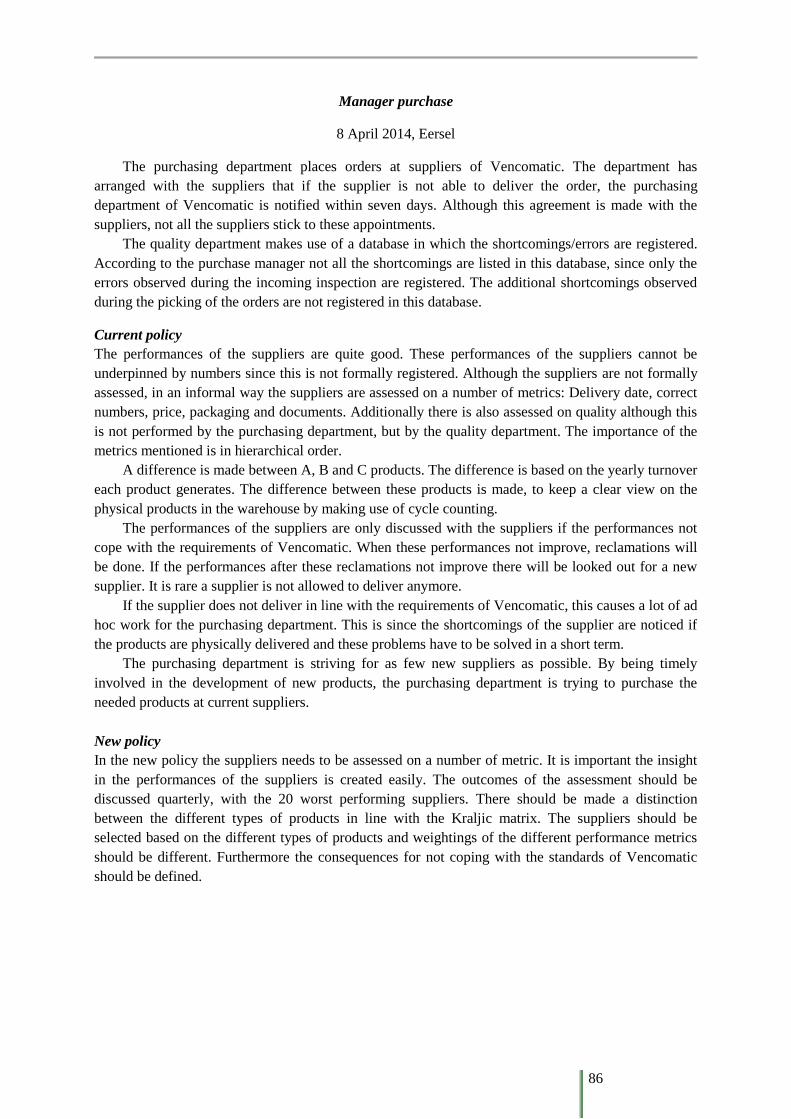
86
Manager purchase
8 April 2014, Eersel
The purchasing department places orders at suppliers of Vencomatic. The department has
arranged with the suppliers that if the supplier is not able to deliver the order, the purchasing
department of Vencomatic is notified within seven days. Although this agreement is made with the
suppliers, not all the suppliers stick to these appointments.
The quality department makes use of a database in which the shortcomings/errors are registered.
According to the purchase manager not all the shortcomings are listed in this database, since only the
errors observed during the incoming inspection are registered. The additional shortcomings observed
during the picking of the orders are not registered in this database.
Current policy
The performances of the suppliers are quite good. These performances of the suppliers cannot be
underpinned by numbers since this is not formally registered. Although the suppliers are not formally
assessed, in an informal way the suppliers are assessed on a number of metrics: Delivery date, correct
numbers, price, packaging and documents. Additionally there is also assessed on quality although this
is not performed by the purchasing department, but by the quality department. The importance of the
metrics mentioned is in hierarchical order.
A difference is made between A, B and C products. The difference is based on the yearly turnover
each product generates. The difference between these products is made, to keep a clear view on the
physical products in the warehouse by making use of cycle counting.
The performances of the suppliers are only discussed with the suppliers if the performances not
cope with the requirements of Vencomatic. When these performances not improve, reclamations will
be done. If the performances after these reclamations not improve there will be looked out for a new
supplier. It is rare a supplier is not allowed to deliver anymore.
If the supplier does not deliver in line with the requirements of Vencomatic, this causes a lot of ad
hoc work for the purchasing department. This is since the shortcomings of the supplier are noticed if
the products are physically delivered and these problems have to be solved in a short term.
The purchasing department is striving for as few new suppliers as possible. By being timely
involved in the development of new products, the purchasing department is trying to purchase the
needed products at current suppliers.
New policy
In the new policy the suppliers needs to be assessed on a number of metric. It is important the insight
in the performances of the suppliers is created easily. The outcomes of the assessment should be
discussed quarterly, with the 20 worst performing suppliers. There should be made a distinction
between the different types of products in line with the Kraljic matrix. The suppliers should be
selected based on the different types of products and weightings of the different performance metrics
should be different. Furthermore the consequences for not coping with the standards of Vencomatic
should be defined.
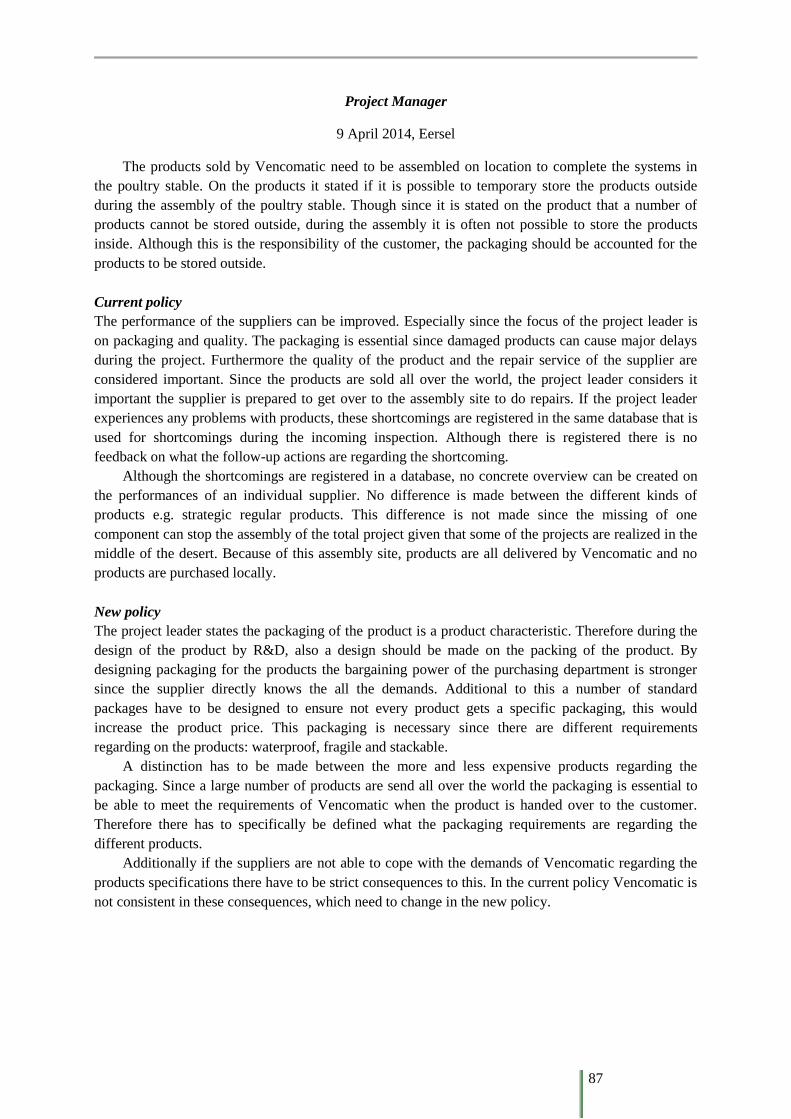
87
Project Manager
9 April 2014, Eersel
The products sold by Vencomatic need to be assembled on location to complete the systems in
the poultry stable. On the products it stated if it is possible to temporary store the products outside
during the assembly of the poultry stable. Though since it is stated on the product that a number of
products cannot be stored outside, during the assembly it is often not possible to store the products
inside. Although this is the responsibility of the customer, the packaging should be accounted for the
products to be stored outside.
Current policy
The performance of the suppliers can be improved. Especially since the focus of the project leader is
on packaging and quality. The packaging is essential since damaged products can cause major delays
during the project. Furthermore the quality of the product and the repair service of the supplier are
considered important. Since the products are sold all over the world, the project leader considers it
important the supplier is prepared to get over to the assembly site to do repairs. If the project leader
experiences any problems with products, these shortcomings are registered in the same database that is
used for shortcomings during the incoming inspection. Although there is registered there is no
feedback on what the follow-up actions are regarding the shortcoming.
Although the shortcomings are registered in a database, no concrete overview can be created on
the performances of an individual supplier. No difference is made between the different kinds of
products e.g. strategic regular products. This difference is not made since the missing of one
component can stop the assembly of the total project given that some of the projects are realized in the
middle of the desert. Because of this assembly site, products are all delivered by Vencomatic and no
products are purchased locally.
New policy
The project leader states the packaging of the product is a product characteristic. Therefore during the
design of the product by R&D, also a design should be made on the packing of the product. By
designing packaging for the products the bargaining power of the purchasing department is stronger
since the supplier directly knows the all the demands. Additional to this a number of standard
packages have to be designed to ensure not every product gets a specific packaging, this would
increase the product price. This packaging is necessary since there are different requirements
regarding on the products: waterproof, fragile and stackable.
A distinction has to be made between the more and less expensive products regarding the
packaging. Since a large number of products are send all over the world the packaging is essential to
be able to meet the requirements of Vencomatic when the product is handed over to the customer.
Therefore there has to specifically be defined what the packaging requirements are regarding the
different products.
Additionally if the suppliers are not able to cope with the demands of Vencomatic regarding the
products specifications there have to be strict consequences to this. In the current policy Vencomatic is
not consistent in these consequences, which need to change in the new policy.
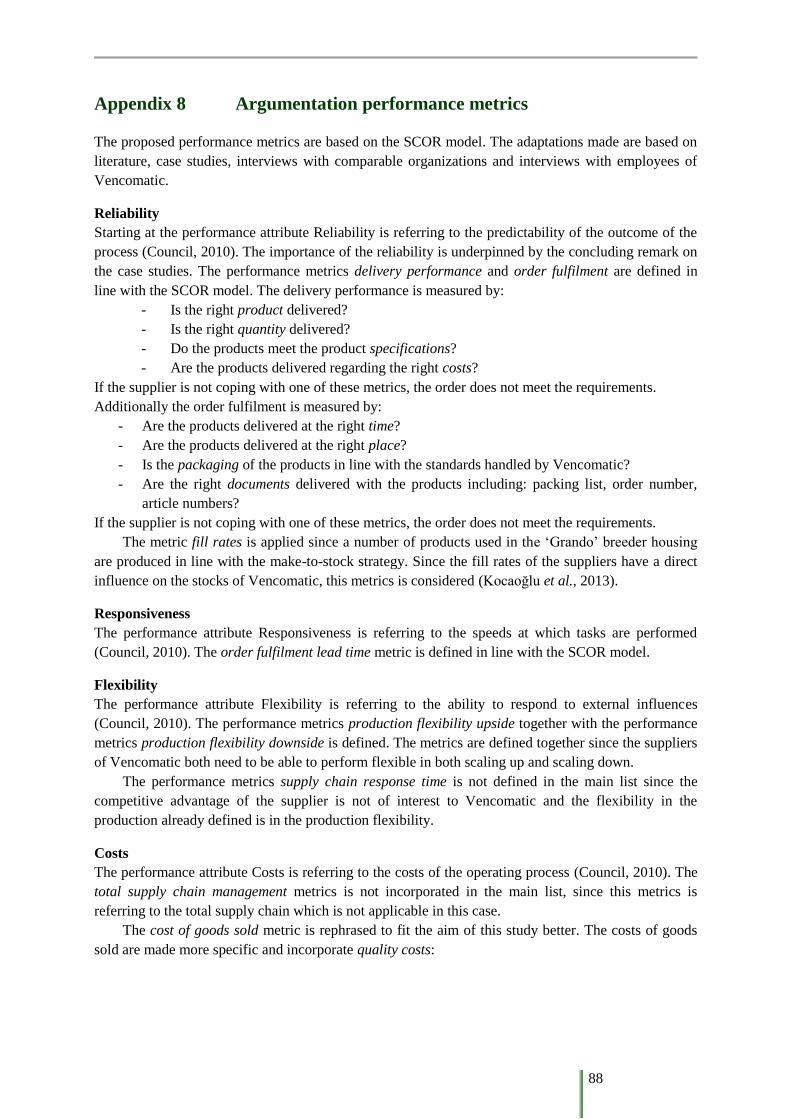
88
Appendix 8 Argumentation performance metrics
The proposed performance metrics are based on the SCOR model. The adaptations made are based on
literature, case studies, interviews with comparable organizations and interviews with employees of
Vencomatic.
Reliability
Starting at the performance attribute Reliability is referring to the predictability of the outcome of the
process (Council, 2010). The importance of the reliability is underpinned by the concluding remark on
the case studies. The performance metrics delivery performance and order fulfilment are defined in
line with the SCOR model. The delivery performance is measured by:
- Is the right product delivered?
- Is the right quantity delivered?
- Do the products meet the product specifications?
- Are the products delivered regarding the right costs?
If the supplier is not coping with one of these metrics, the order does not meet the requirements.
Additionally the order fulfilment is measured by:
- Are the products delivered at the right time?
- Are the products delivered at the right place?
- Is the packaging of the products in line with the standards handled by Vencomatic?
- Are the right documents delivered with the products including: packing list, order number,
article numbers?
If the supplier is not coping with one of these metrics, the order does not meet the requirements.
The metric fill rates is applied since a number of products used in the ‘Grando’ breeder housing
are produced in line with the make-to-stock strategy. Since the fill rates of the suppliers have a direct
influence on the stocks of Vencomatic, this metrics is considered (Kocaoğlu et al., 2013).
Responsiveness
The performance attribute Responsiveness is referring to the speeds at which tasks are performed
(Council, 2010). The order fulfilment lead time metric is defined in line with the SCOR model.
Flexibility
The performance attribute Flexibility is referring to the ability to respond to external influences
(Council, 2010). The performance metrics production flexibility upside together with the performance
metrics production flexibility downside is defined. The metrics are defined together since the suppliers
of Vencomatic both need to be able to perform flexible in both scaling up and scaling down.
The performance metrics supply chain response time is not defined in the main list since the
competitive advantage of the supplier is not of interest to Vencomatic and the flexibility in the
production already defined is in the production flexibility.
Costs
The performance attribute Costs is referring to the costs of the operating process (Council, 2010). The
total supply chain management metrics is not incorporated in the main list, since this metrics is
referring to the total supply chain which is not applicable in this case.
The cost of goods sold metric is rephrased to fit the aim of this study better. The costs of goods
sold are made more specific and incorporate quality costs:
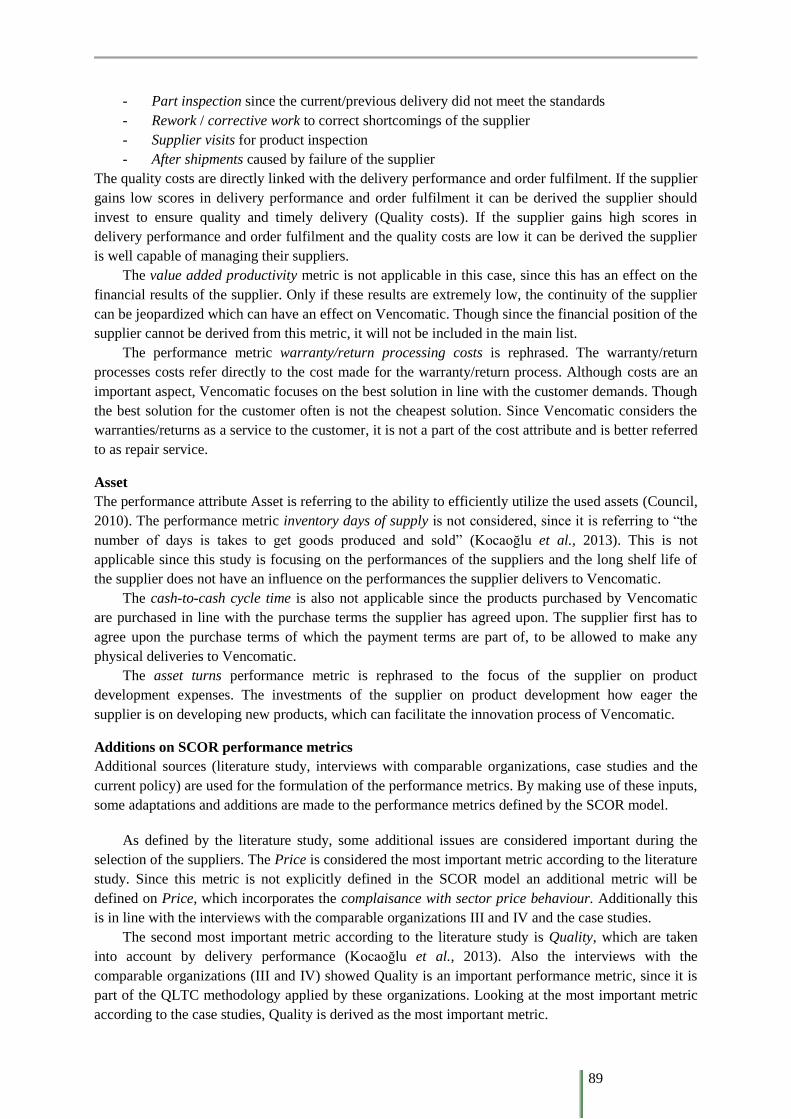
89
- Part inspection since the current/previous delivery did not meet the standards
- Rework / corrective work to correct shortcomings of the supplier
- Supplier visits for product inspection
- After shipments caused by failure of the supplier
The quality costs are directly linked with the delivery performance and order fulfilment. If the supplier
gains low scores in delivery performance and order fulfilment it can be derived the supplier should
invest to ensure quality and timely delivery (Quality costs). If the supplier gains high scores in
delivery performance and order fulfilment and the quality costs are low it can be derived the supplier
is well capable of managing their suppliers.
The value added productivity metric is not applicable in this case, since this has an effect on the
financial results of the supplier. Only if these results are extremely low, the continuity of the supplier
can be jeopardized which can have an effect on Vencomatic. Though since the financial position of the
supplier cannot be derived from this metric, it will not be included in the main list.
The performance metric warranty/return processing costs is rephrased. The warranty/return
processes costs refer directly to the cost made for the warranty/return process. Although costs are an
important aspect, Vencomatic focuses on the best solution in line with the customer demands. Though
the best solution for the customer often is not the cheapest solution. Since Vencomatic considers the
warranties/returns as a service to the customer, it is not a part of the cost attribute and is better referred
to as repair service.
Asset
The performance attribute Asset is referring to the ability to efficiently utilize the used assets (Council,
2010). The performance metric inventory days of supply is not considered, since it is referring to “the
number of days is takes to get goods produced and sold” (Kocaoğlu et al., 2013). This is not
applicable since this study is focusing on the performances of the suppliers and the long shelf life of
the supplier does not have an influence on the performances the supplier delivers to Vencomatic.
The cash-to-cash cycle time is also not applicable since the products purchased by Vencomatic
are purchased in line with the purchase terms the supplier has agreed upon. The supplier first has to
agree upon the purchase terms of which the payment terms are part of, to be allowed to make any
physical deliveries to Vencomatic.
The asset turns performance metric is rephrased to the focus of the supplier on product
development expenses. The investments of the supplier on product development how eager the
supplier is on developing new products, which can facilitate the innovation process of Vencomatic.
Additions on SCOR performance metrics
Additional sources (literature study, interviews with comparable organizations, case studies and the
current policy) are used for the formulation of the performance metrics. By making use of these inputs,
some adaptations and additions are made to the performance metrics defined by the SCOR model.
As defined by the literature study, some additional issues are considered important during the
selection of the suppliers. The Price is considered the most important metric according to the literature
study. Since this metric is not explicitly defined in the SCOR model an additional metric will be
defined on Price, which incorporates the complaisance with sector price behaviour. Additionally this
is in line with the interviews with the comparable organizations III and IV and the case studies.
The second most important metric according to the literature study is Quality, which are taken
into account by delivery performance (Kocaoğlu et al., 2013). Also the interviews with the
comparable organizations (III and IV) showed Quality is an important performance metric, since it is
part of the QLTC methodology applied by these organizations. Looking at the most important metric
according to the case studies, Quality is derived as the most important metric.
90
The third most important metric according to the literature is Delivery. The delivery is considered
by the metric order fulfilment (Kocaoğlu et al., 2013). This is underpinned by the ‘L’ of the QLTC
methodology and is referring to logistics. Logistics is directly linked to delivery, according to the
interviews with the comparable organizations (III and IV). The interviews with employees of
Vencomatic about the current policy show the packaging is named as a very important aspect. Though
packaging is considered as an part of the order fulfilment (Kocaoğlu et al., 2013). Additionally on
time delivery is considered as a critical metric according to the interview about the current policy. On
time delivery is also considered in the metric delivery.
The fourth most relevant metric are the Production facilities and capacity, the capacity is covered
by the Flexibility metric. Additionally the production facilities are considered by the metric
Management and organization, which is considered the seventh most metric according to the literature.
The fifth metric is the technical capability, which is defined as a separate metrics since
Vencomatic is partly relying on the technical capability of their suppliers. The importance of this
metric is underpinned by the ‘T’ in the QLTC methodology used by the interviewed comparable
organizations. Therefore the technical capability is an added metric.
The sixth metric is the financial position of the supplier. This is defined as an additional metric,
since the financial position can influence the ability of the supplier to deliver the ordered products,
which has a direct effect on the performances of Vencomatic.
The seventh most important metric according to the literature are the Management and
organization of a supplier. This is considered important because of the effect arguable management of
a supplier can have a significant effect on the reputation of Vencomatic. Since management and
organization is not explicitly considered in the SCOR an additional metric is used.
The eight most important metric is the geographical location of the supplier. The geographical
location considers transportation costs and trade barriers. These transportation costs and trade barriers
(financially) are already incorporated in the price metrics. Additionally lead time and trade barriers
(time) can be an issue, though this is considered in the order fulfilment lead time. Therefore the
geographical location is not explicitly considered by a metrics.
The ninth most important metric is the repair service. This metric is considered by a metric which
also is in line with the warranty/return processing costs of the SCOR model. Since these costs are not
explicitly calculated for, though the service is considered more important, the repair service is
explicitly mentioned by a performance metric.
The tenth most important metric according to the literature is the performance history of a
supplier. Since Vencomatic is focusing on the current and future situation, the performance history is
not explicitly mentioned. Additionally the performance history as a supplier of Vencomatic can be
derived from the evaluation of the supplier in the past.
Additionally the concluding remark on the case studies shows, communication is considered as an
important metric on which suppliers should be assessed. When there is taken a closer look to the
literature study the communication system is ranked 14th. The metric on the communication, covers all
the QLTC attributes formulated and therefore also at these organizations considered as important.
91
Appendix 9 Comments internal stakeholders
Comments made by the different internal stakeholders are:
- The delivery performance and order fulfilment can be considered as one metric, since the
different aspects mentioned by order fulfilment can all be considered as specifications of the
product. The packaging can be considered as quality of the good. Additionally place,
documentation and time are considered as specifications of the goods.
- The performance attribute Responsiveness now only considers the speed at which tasks are
performed. This definition is too specific and needs to be broadened.
- Some additional financial ratios should be considered, since the financial condition of the
supplier is important. These ratios’ can be derived from the Dun & Bradstreet rapports which
are requested occasionally.
- The communication system should be supplemented with a pre-announcement before the
physical delivery is made. This pre-announcement is used to make a detailed planning on the
logistical department for the next day/week.
- An additional selection metric can be the strategic position of the supplier, the competition
Vencomatic should be considered.
92
Appendix 10 Comments suppliers
The comments made by the suppliers who are personally interviewed are shown below.
- Supplier N: The rights of the employees are not represented by a trade union, though by an
employee’s council. This council also represents the rights of the employees and therefore
should also be mentioned in the statement on the employee rights at the management and
organization metric.
It should be considered if the final rating on ‘bad’, ‘moderate’ and ‘good’ will be applied. If
the final rating will be applied, additional rating segments have to be formulated since more
and clear differentiation between the performances of the suppliers has to be made.
- Supplier B: The final decision in the end is based on price. The price of the goods is not
incorporated in these metrics, while the emphasis should be on price.
- Supplier C: During the selection of the suppliers it should turn out if each supplier is willing to
provide insight in the cash flow. Additionally it is recommendable to make use of ´A´, ´B´ and
´C´ suppliers. Furthermore the investment in research and development (R&D) does not apply
since this supplier is a wholesaler.
- Supplier D: It is good to create insight in the performances of the different suppliers. By doing
so suppliers are able to differentiate themselves.
The metric on research and development (R&D) does not apply since this supplier is a
wholesaler.
- Supplier F: Differentiation has to be made in the metric on order fulfilment. This distinction
should be made on deliveries too early and too late and additionally the numbers of days, since
the problems caused by late deliveries are larger than early deliveries. The weighting should
also be different since deliveries which are very late cause bigger problems than deliveries
which are a bit late.
Additionally the added value offered by this supplier does not become clear by these metrics.
This supplier states to be able to deliver order demand driven, while their components only
deliver in batches.
- Supplier H: There has to be considered how to deal with partial delivery of orders. Some
orders are delivered in different deliveries, which date has to be considered by these metrics.
The flexibility metrics are important to create insight, though the supplier does not has
complete insight in what goods of Vencomatic are demand and stock driven. Furthermore the
products delivered to Vencomatic are partly kept on stock so in this case flexibility is no
problem. Though the production of new batches is once every three weeks, therefore if the
product is not a stock product for the supplier, the flexibility decreases dramatically.
- Supplier I: The metric on the financial position is not formulated well, since the supplier is not
able to fill in their position. Flexibility is not a problem, if the changes in the order are
communicated timely. If the changes are communicated before the production of the batch
starts the production can be adjusted.
- Supplier L: The financial position of the supplier is crucial to ensure the supplier cannot
endanger the continuity of the buying organization. Additionally the modern manufacturing
equipment is a competitive advantage this supplier has, though this is not directly shown in the
performance metrics. Supplier L produces the products for Vencomatic also in batches.
Regarding the flexibility, most of the products are kept on stock.
93
Additionally the comments of the suppliers who are contacted by mail
- Supplier E: Regarding the metrics repair service and flexibility it depends on if the supplier
keeps the product on stock, since some products are only produced in batches every three to
four weeks.
The metric on financial position is not formulated well.
The quality costs do not provide much information on how the supplier performs regarding
quality.
- Supplier G: This supplier stated repair service was not applicable to them without any specific
reason.
- Supplier J: No feedback is given.
- Supplier K: The products are produced in batches. If the orders of Vencomatic reach the
volume of a complete batch, the batch is planned to produce. Because of busyness at the
factory, delivery times and therefore flexibility strongly fluctuates.
- Supplier M: No feedback is given.
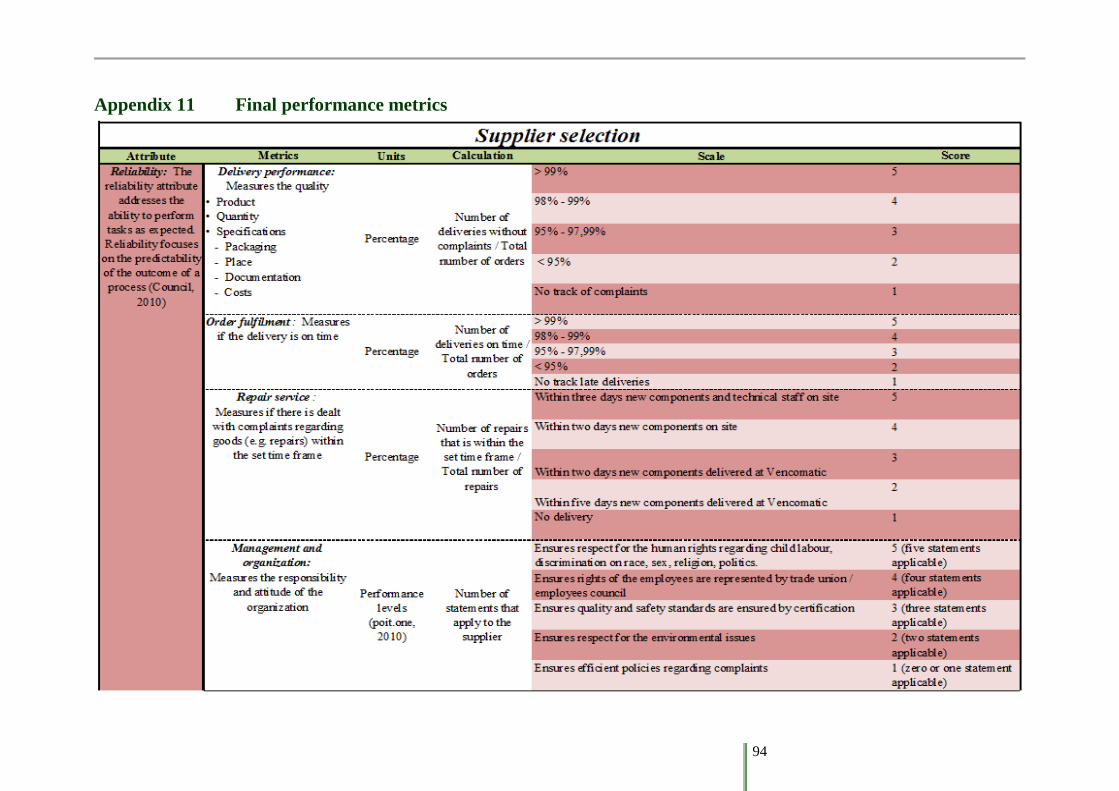
94
Appendix 11 Final performance metrics
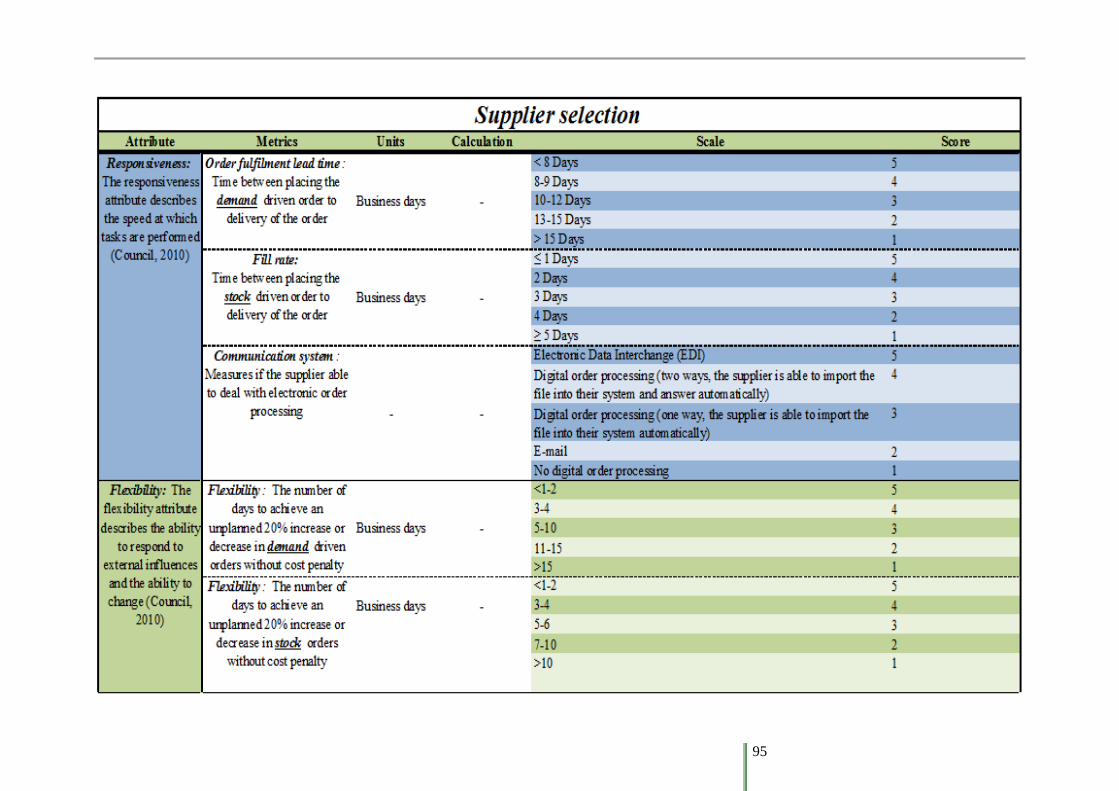
95

96
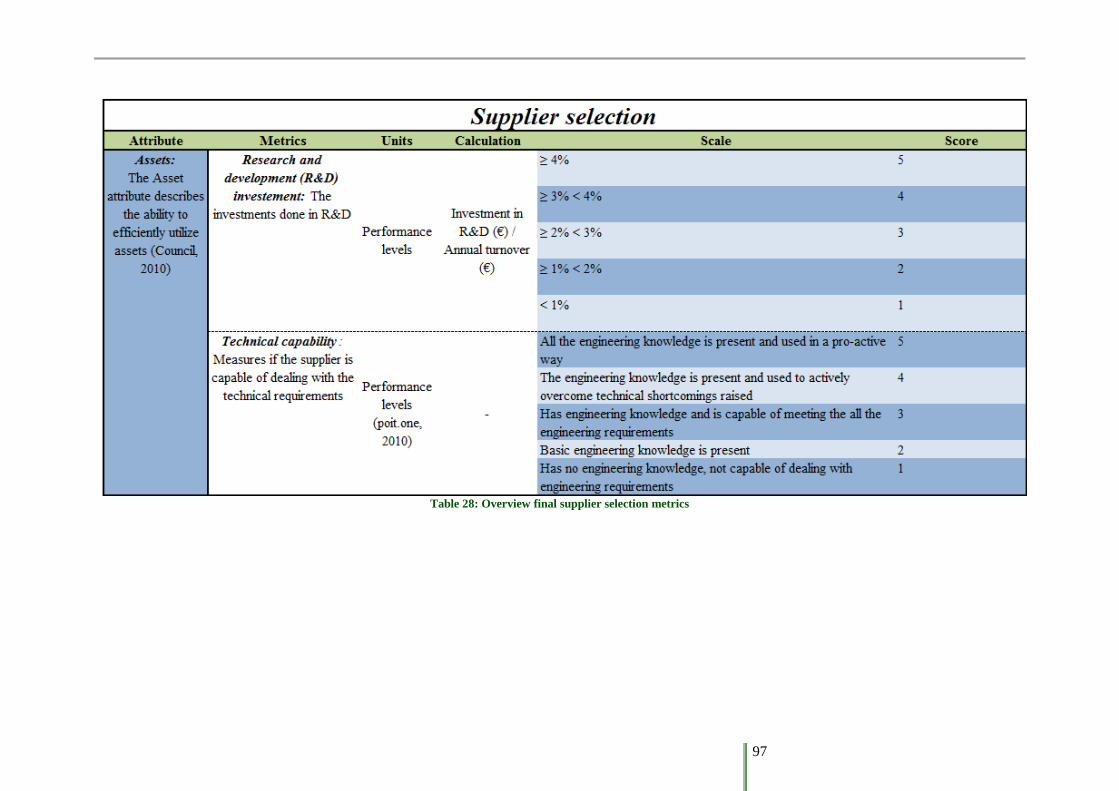
97
Table 28: Overview final supplier selection metrics
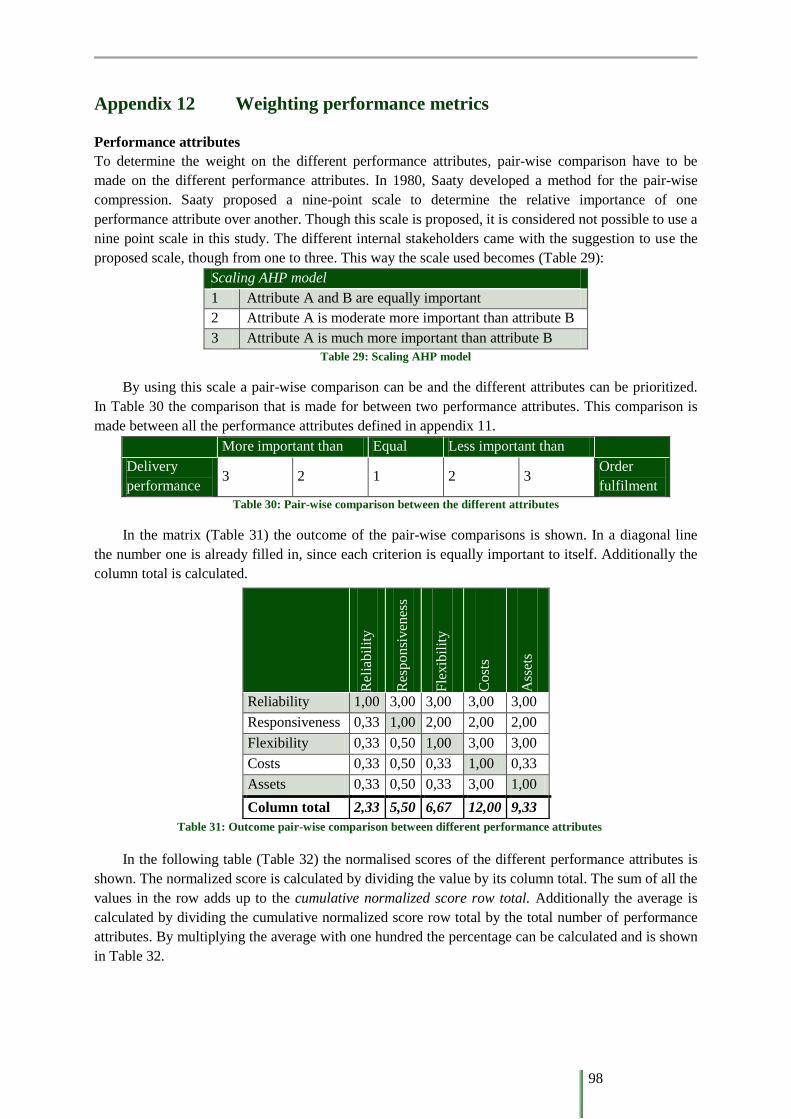
98
Appendix 12 Weighting performance metrics
Performance attributes
To determine the weight on the different performance attributes, pair-wise comparison have to be
made on the different performance attributes. In 1980, Saaty developed a method for the pair-wise
compression. Saaty proposed a nine-point scale to determine the relative importance of one
performance attribute over another. Though this scale is proposed, it is considered not possible to use a
nine point scale in this study. The different internal stakeholders came with the suggestion to use the
proposed scale, though from one to three. This way the scale used becomes (Table 29):
Scaling AHP model
1 Attribute A and B are equally important
2 Attribute A is moderate more important than attribute B
3 Attribute A is much more important than attribute B
Table 29: Scaling AHP model
By using this scale a pair-wise comparison can be and the different attributes can be prioritized.
In Table 30 the comparison that is made for between two performance attributes. This comparison is
made between all the performance attributes defined in appendix 11.
More important than Equal Less important than
Delivery
performance 3 2 1 2 3
Order
fulfilment
Table 30: Pair-wise comparison between the different attributes
In the matrix (Table 31) the outcome of the pair-wise comparisons is shown. In a diagonal line
the number one is already filled in, since each criterion is equally important to itself. Additionally the
column total is calculated.
In the following table (Table 32) the normalised scores of the different performance attributes is
shown. The normalized score is calculated by dividing the value by its column total. The sum of all the
values in the row adds up to the cumulative normalized score row total. Additionally the average is
calculated by dividing the cumulative normalized score row total by the total number of performance
attributes. By multiplying the average with one hundred the percentage can be calculated and is shown
in Table 32.
Rel
iabil
ity
Res
ponsi
ven
ess
Fle
xib
ilit
y
Cost
s
Ass
ets
Reliability 1,00 3,00 3,00 3,00 3,00
Responsiveness 0,33 1,00 2,00 2,00 2,00
Flexibility 0,33 0,50 1,00 3,00 3,00
Costs 0,33 0,50 0,33 1,00 0,33
Assets 0,33 0,50 0,33 3,00 1,00
Column total 2,33 5,50 6,67 12,00 9,33
Table 31: Outcome pair-wise comparison between different performance attributes
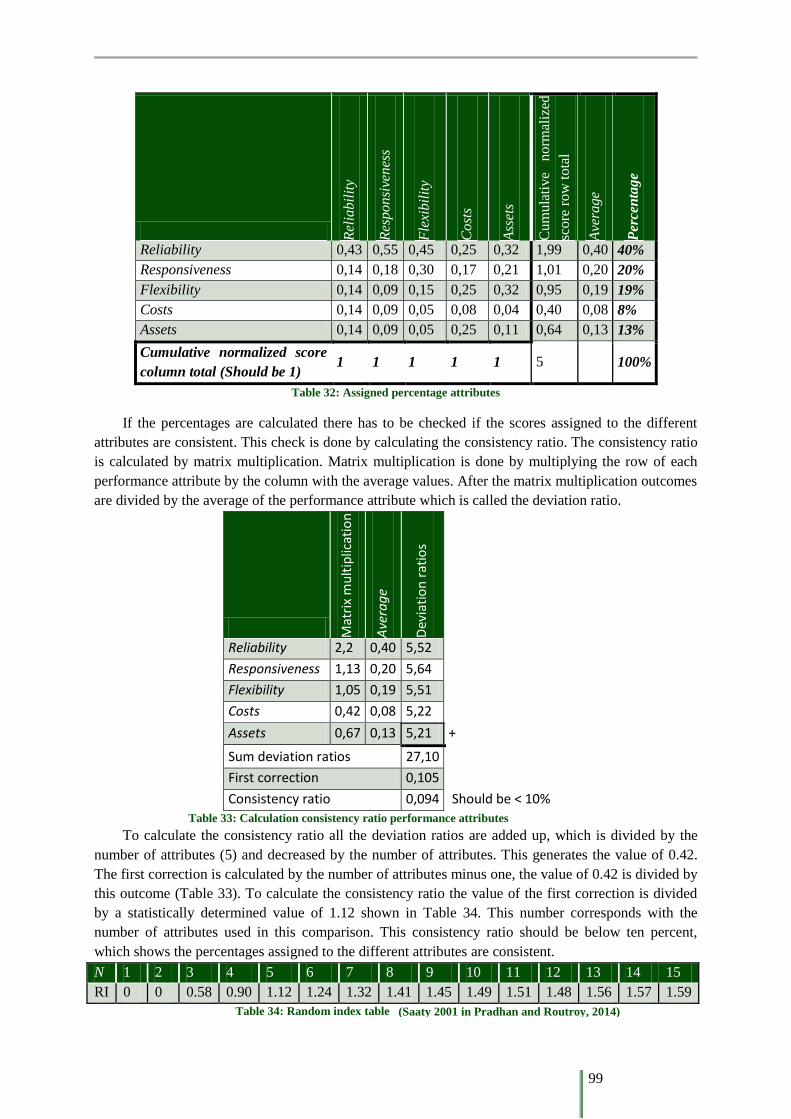
99
Rel
iab
ilit
y
Res
po
nsi
ven
ess
Fle
xib
ilit
y
Co
sts
Ass
ets
Cu
mu
lati
ve
no
rmal
ized
sco
re r
ow
to
tal
Ave
rage
Per
cen
tag
e
Reliability 0,43 0,55 0,45 0,25 0,32 1,99 0,40 40%
Responsiveness 0,14 0,18 0,30 0,17 0,21 1,01 0,20 20%
Flexibility 0,14 0,09 0,15 0,25 0,32 0,95 0,19 19%
Costs 0,14 0,09 0,05 0,08 0,04 0,40 0,08 8%
Assets 0,14 0,09 0,05 0,25 0,11 0,64 0,13 13%
Cumulative normalized score
column total (Should be 1) 1 1 1 1 1 5
100%
Table 32: Assigned percentage attributes
If the percentages are calculated there has to be checked if the scores assigned to the different
attributes are consistent. This check is done by calculating the consistency ratio. The consistency ratio
is calculated by matrix multiplication. Matrix multiplication is done by multiplying the row of each
performance attribute by the column with the average values. After the matrix multiplication outcomes
are divided by the average of the performance attribute which is called the deviation ratio.
Mat
rix
mu
ltip
licat
ion
Ave
rag
e
Dev
iati
on
rat
ios
Reliability 2,2 0,40 5,52
Responsiveness 1,13 0,20 5,64
Flexibility 1,05 0,19 5,51
Costs 0,42 0,08 5,22
Assets 0,67 0,13 5,21 +
Sum deviation ratios 27,10
First correction 0,105
Consistency ratio 0,094 Should be < 10%
Table 33: Calculation consistency ratio performance attributes
To calculate the consistency ratio all the deviation ratios are added up, which is divided by the
number of attributes (5) and decreased by the number of attributes. This generates the value of 0.42.
The first correction is calculated by the number of attributes minus one, the value of 0.42 is divided by
this outcome (Table 33). To calculate the consistency ratio the value of the first correction is divided
by a statistically determined value of 1.12 shown in Table 34. This number corresponds with the
number of attributes used in this comparison. This consistency ratio should be below ten percent,
which shows the percentages assigned to the different attributes are consistent.
N 1 2 3 4 5 6 7 8 9 10 11 12 13 14 15
RI 0 0 0.58 0.90 1.12 1.24 1.32 1.41 1.45 1.49 1.51 1.48 1.56 1.57 1.59
Table 34: Random index table (Saaty 2001 in Pradhan and Routroy, 2014)
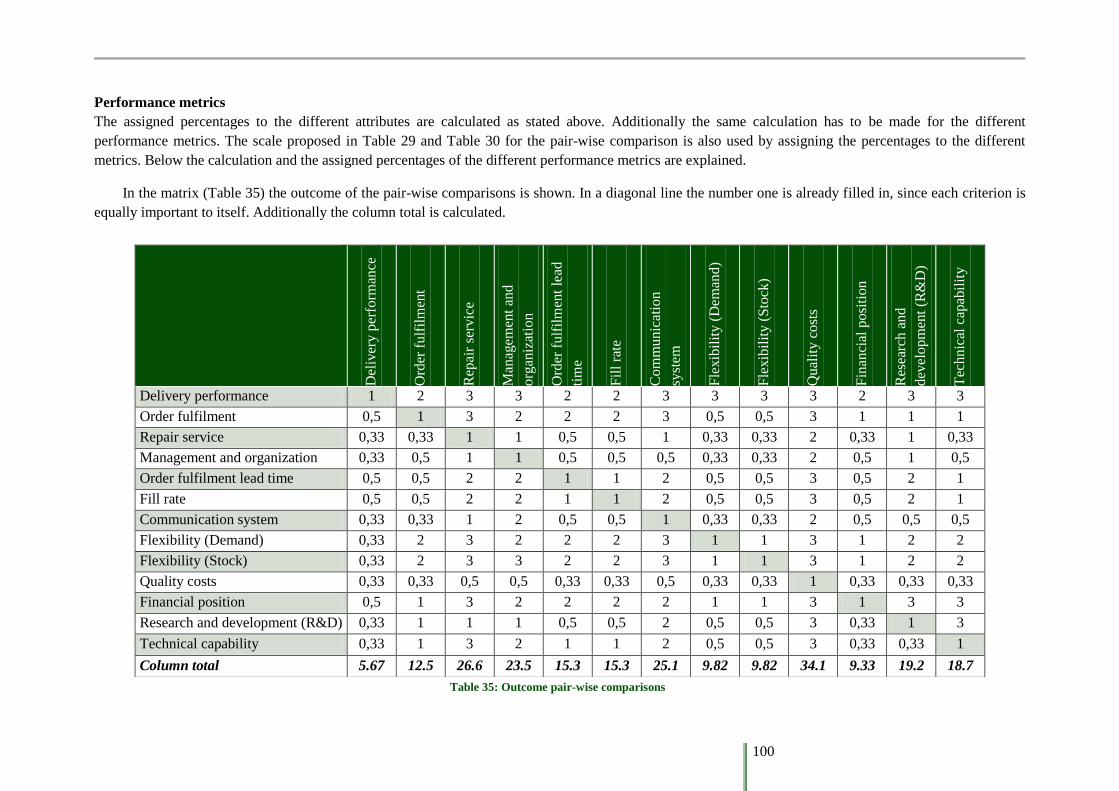
100
Performance metrics
The assigned percentages to the different attributes are calculated as stated above. Additionally the same calculation has to be made for the different
performance metrics. The scale proposed in Table 29 and Table 30 for the pair-wise comparison is also used by assigning the percentages to the different
metrics. Below the calculation and the assigned percentages of the different performance metrics are explained.
In the matrix (Table 35) the outcome of the pair-wise comparisons is shown. In a diagonal line the number one is already filled in, since each criterion is
equally important to itself. Additionally the column total is calculated.
Del
iver
y p
erfo
rman
ce
Ord
er f
ulf
ilm
ent
Rep
air
serv
ice
Man
agem
ent
and
org
aniz
atio
n
Ord
er f
ulf
ilm
ent
lead
tim
e
Fil
l ra
te
Com
munic
atio
n
syst
em
Fle
xib
ilit
y (
Dem
and)
Fle
xib
ilit
y (
Sto
ck)
Qual
ity c
ost
s
Fin
anci
al p
osi
tion
Res
earc
h a
nd
dev
elopm
ent
(R&
D)
Tec
hnic
al c
apab
ilit
y
Delivery performance 1 2 3 3 2 2 3 3 3 3 2 3 3
Order fulfilment 0,5 1 3 2 2 2 3 0,5 0,5 3 1 1 1
Repair service 0,33 0,33 1 1 0,5 0,5 1 0,33 0,33 2 0,33 1 0,33
Management and organization 0,33 0,5 1 1 0,5 0,5 0,5 0,33 0,33 2 0,5 1 0,5
Order fulfilment lead time 0,5 0,5 2 2 1 1 2 0,5 0,5 3 0,5 2 1
Fill rate 0,5 0,5 2 2 1 1 2 0,5 0,5 3 0,5 2 1
Communication system 0,33 0,33 1 2 0,5 0,5 1 0,33 0,33 2 0,5 0,5 0,5
Flexibility (Demand) 0,33 2 3 2 2 2 3 1 1 3 1 2 2
Flexibility (Stock) 0,33 2 3 3 2 2 3 1 1 3 1 2 2
Quality costs 0,33 0,33 0,5 0,5 0,33 0,33 0,5 0,33 0,33 1 0,33 0,33 0,33
Financial position 0,5 1 3 2 2 2 2 1 1 3 1 3 3
Research and development (R&D) 0,33 1 1 1 0,5 0,5 2 0,5 0,5 3 0,33 1 3
Technical capability 0,33 1 3 2 1 1 2 0,5 0,5 3 0,33 0,33 1
Column total 5.67 12.5 26.6 23.5 15.3 15.3 25.1 9.82 9.82 34.1 9.33 19.2 18.7
Table 35: Outcome pair-wise comparisons
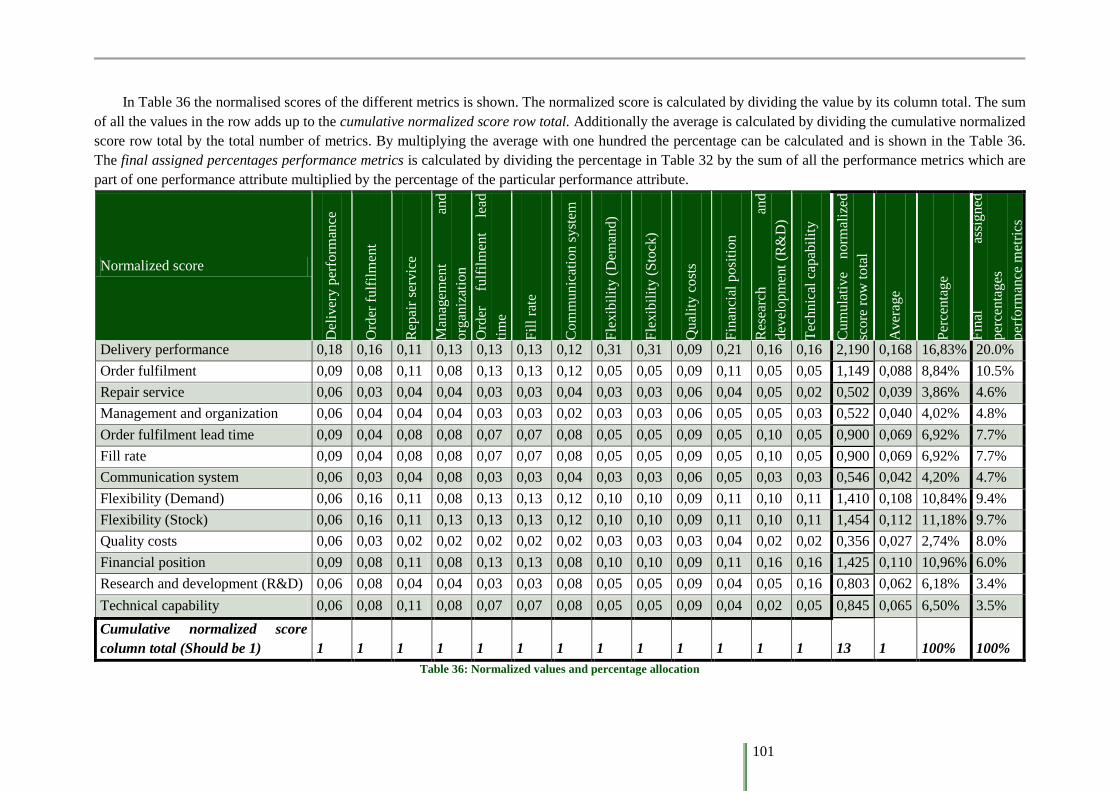
101
In Table 36 the normalised scores of the different metrics is shown. The normalized score is calculated by dividing the value by its column total. The sum
of all the values in the row adds up to the cumulative normalized score row total. Additionally the average is calculated by dividing the cumulative normalized
score row total by the total number of metrics. By multiplying the average with one hundred the percentage can be calculated and is shown in the Table 36.
The final assigned percentages performance metrics is calculated by dividing the percentage in Table 32 by the sum of all the performance metrics which are
part of one performance attribute multiplied by the percentage of the particular performance attribute.
Normalized score
Del
iver
y p
erfo
rman
ce
Ord
er f
ulf
ilm
ent
Rep
air
serv
ice
Man
agem
ent
and
org
aniz
atio
n
Ord
er
fulf
ilm
ent
lead
tim
e
Fil
l ra
te
Com
munic
atio
n s
yst
em
Fle
xib
ilit
y (
Dem
and)
Fle
xib
ilit
y (
Sto
ck)
Qual
ity c
ost
s
Fin
anci
al p
osi
tion
Res
earc
h
and
dev
elopm
ent
(R&
D)
Tec
hnic
al c
apab
ilit
y
Cum
ula
tive
norm
aliz
ed
score
row
tota
l
Aver
age
Per
centa
ge
Fin
al
assi
gned
per
centa
ges
per
form
ance
met
rics
Delivery performance 0,18 0,16 0,11 0,13 0,13 0,13 0,12 0,31 0,31 0,09 0,21 0,16 0,16 2,190 0,168 16,83% 20.0%
Order fulfilment 0,09 0,08 0,11 0,08 0,13 0,13 0,12 0,05 0,05 0,09 0,11 0,05 0,05 1,149 0,088 8,84% 10.5%
Repair service 0,06 0,03 0,04 0,04 0,03 0,03 0,04 0,03 0,03 0,06 0,04 0,05 0,02 0,502 0,039 3,86% 4.6%
Management and organization 0,06 0,04 0,04 0,04 0,03 0,03 0,02 0,03 0,03 0,06 0,05 0,05 0,03 0,522 0,040 4,02% 4.8%
Order fulfilment lead time 0,09 0,04 0,08 0,08 0,07 0,07 0,08 0,05 0,05 0,09 0,05 0,10 0,05 0,900 0,069 6,92% 7.7%
Fill rate 0,09 0,04 0,08 0,08 0,07 0,07 0,08 0,05 0,05 0,09 0,05 0,10 0,05 0,900 0,069 6,92% 7.7%
Communication system 0,06 0,03 0,04 0,08 0,03 0,03 0,04 0,03 0,03 0,06 0,05 0,03 0,03 0,546 0,042 4,20% 4.7%
Flexibility (Demand) 0,06 0,16 0,11 0,08 0,13 0,13 0,12 0,10 0,10 0,09 0,11 0,10 0,11 1,410 0,108 10,84% 9.4%
Flexibility (Stock) 0,06 0,16 0,11 0,13 0,13 0,13 0,12 0,10 0,10 0,09 0,11 0,10 0,11 1,454 0,112 11,18% 9.7%
Quality costs 0,06 0,03 0,02 0,02 0,02 0,02 0,02 0,03 0,03 0,03 0,04 0,02 0,02 0,356 0,027 2,74% 8.0%
Financial position 0,09 0,08 0,11 0,08 0,13 0,13 0,08 0,10 0,10 0,09 0,11 0,16 0,16 1,425 0,110 10,96% 6.0%
Research and development (R&D) 0,06 0,08 0,04 0,04 0,03 0,03 0,08 0,05 0,05 0,09 0,04 0,05 0,16 0,803 0,062 6,18% 3.4%
Technical capability 0,06 0,08 0,11 0,08 0,07 0,07 0,08 0,05 0,05 0,09 0,04 0,02 0,05 0,845 0,065 6,50% 3.5%
Cumulative normalized score
column total (Should be 1)
1
1
1
1
1
1
1
1
1
1
1
1
1
13
1
100%
100%
Table 36: Normalized values and percentage allocation
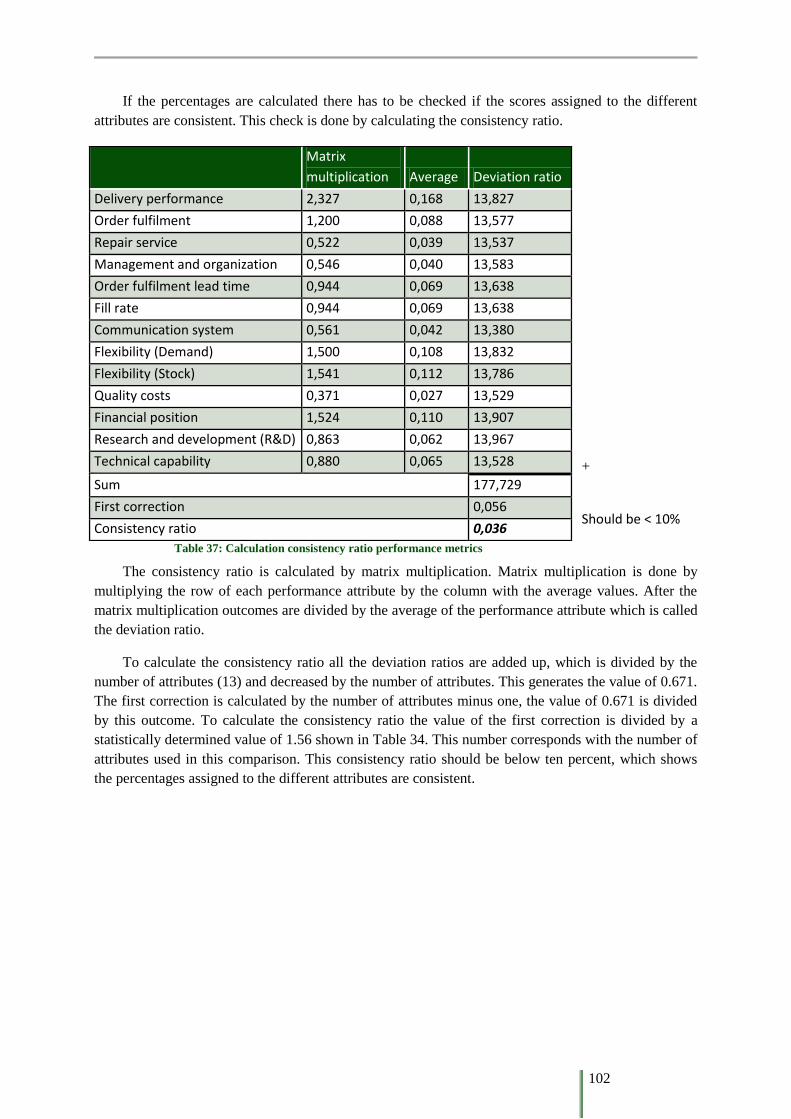
102
If the percentages are calculated there has to be checked if the scores assigned to the different
attributes are consistent. This check is done by calculating the consistency ratio.
+
Should be < 10%
The consistency ratio is calculated by matrix multiplication. Matrix multiplication is done by
multiplying the row of each performance attribute by the column with the average values. After the
matrix multiplication outcomes are divided by the average of the performance attribute which is called
the deviation ratio.
To calculate the consistency ratio all the deviation ratios are added up, which is divided by the
number of attributes (13) and decreased by the number of attributes. This generates the value of 0.671.
The first correction is calculated by the number of attributes minus one, the value of 0.671 is divided
by this outcome. To calculate the consistency ratio the value of the first correction is divided by a
statistically determined value of 1.56 shown in Table 34. This number corresponds with the number of
attributes used in this comparison. This consistency ratio should be below ten percent, which shows
the percentages assigned to the different attributes are consistent.
Matrix
multiplication Average Deviation ratio
Delivery performance 2,327 0,168 13,827
Order fulfilment 1,200 0,088 13,577
Repair service 0,522 0,039 13,537
Management and organization 0,546 0,040 13,583
Order fulfilment lead time 0,944 0,069 13,638
Fill rate 0,944 0,069 13,638
Communication system 0,561 0,042 13,380
Flexibility (Demand) 1,500 0,108 13,832
Flexibility (Stock) 1,541 0,112 13,786
Quality costs 0,371 0,027 13,529
Financial position 1,524 0,110 13,907
Research and development (R&D) 0,863 0,062 13,967
Technical capability 0,880 0,065 13,528
Sum 177,729
First correction 0,056
Consistency ratio 0,036
Table 37: Calculation consistency ratio performance metrics
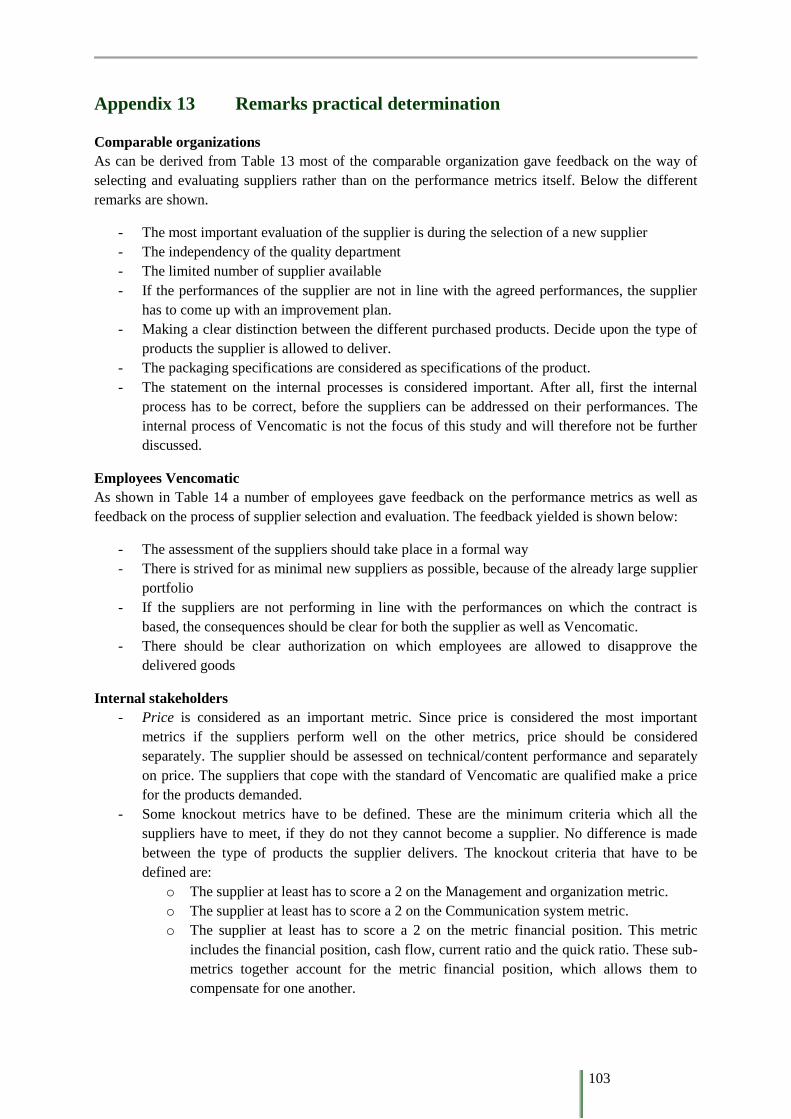
103
Appendix 13 Remarks practical determination
Comparable organizations
As can be derived from Table 13 most of the comparable organization gave feedback on the way of
selecting and evaluating suppliers rather than on the performance metrics itself. Below the different
remarks are shown.
- The most important evaluation of the supplier is during the selection of a new supplier
- The independency of the quality department
- The limited number of supplier available
- If the performances of the supplier are not in line with the agreed performances, the supplier
has to come up with an improvement plan.
- Making a clear distinction between the different purchased products. Decide upon the type of
products the supplier is allowed to deliver.
- The packaging specifications are considered as specifications of the product.
- The statement on the internal processes is considered important. After all, first the internal
process has to be correct, before the suppliers can be addressed on their performances. The
internal process of Vencomatic is not the focus of this study and will therefore not be further
discussed.
Employees Vencomatic
As shown in Table 14 a number of employees gave feedback on the performance metrics as well as
feedback on the process of supplier selection and evaluation. The feedback yielded is shown below:
- The assessment of the suppliers should take place in a formal way
- There is strived for as minimal new suppliers as possible, because of the already large supplier
portfolio
- If the suppliers are not performing in line with the performances on which the contract is
based, the consequences should be clear for both the supplier as well as Vencomatic.
- There should be clear authorization on which employees are allowed to disapprove the
delivered goods
Internal stakeholders
- Price is considered as an important metric. Since price is considered the most important
metrics if the suppliers perform well on the other metrics, price should be considered
separately. The supplier should be assessed on technical/content performance and separately
on price. The suppliers that cope with the standard of Vencomatic are qualified make a price
for the products demanded.
- Some knockout metrics have to be defined. These are the minimum criteria which all the
suppliers have to meet, if they do not they cannot become a supplier. No difference is made
between the type of products the supplier delivers. The knockout criteria that have to be
defined are:
o The supplier at least has to score a 2 on the Management and organization metric.
o The supplier at least has to score a 2 on the Communication system metric.
o The supplier at least has to score a 2 on the metric financial position. This metric
includes the financial position, cash flow, current ratio and the quick ratio. These sub-
metrics together account for the metric financial position, which allows them to
compensate for one another.
104
- A distinction has to be made between metrics that will be used for the selection of the
suppliers and for the evaluation of the suppliers. This distinction has to be made since a
number of metrics should only be assessed during selection, during the yearly evaluation and
during the quarterly evaluation.
These performance metrics and the reasoning why these performance metrics are used during
the quarterly evaluation of the suppliers is further discussed in paragraph 11.4.
- It has to be questioned if the scale and score should be determined up front. Since it is
difficult to determine up front how the suppliers will score on the different metrics, the scale
becomes wider. If the scale is determined after the suppliers are assessed, the scale becomes
more specific, by which a better insight of the performances of the suppliers can be created.
- The visualization of the table should be improved. Additionally the different terms should be
explained. By doing so, the model will be better usable.
Suppliers
- Supplier A: This supplier is also currently setting up supplier evaluation. Preparatory to the
selection of a supplier different type of purchasing strategies (Kraljic matrix) are defined. To
each purchasing strategy a different type of suppliers are required. This supplier differentiates
´A´, ´B´ and ´C´ suppliers, which puts different requirements on the performances of the
suppliers. During the procurement of a good, there first has to be decided on the purchasing
strategy which automatically selects the type of supplier needed. The next step is the selection
of a supplier which can be defined as a ´A´, ´B´ or ´C´ supplier. The differentiation between
the ´A´, ´B´ or ´C´ supplier should also be made in this supplier selection.
.
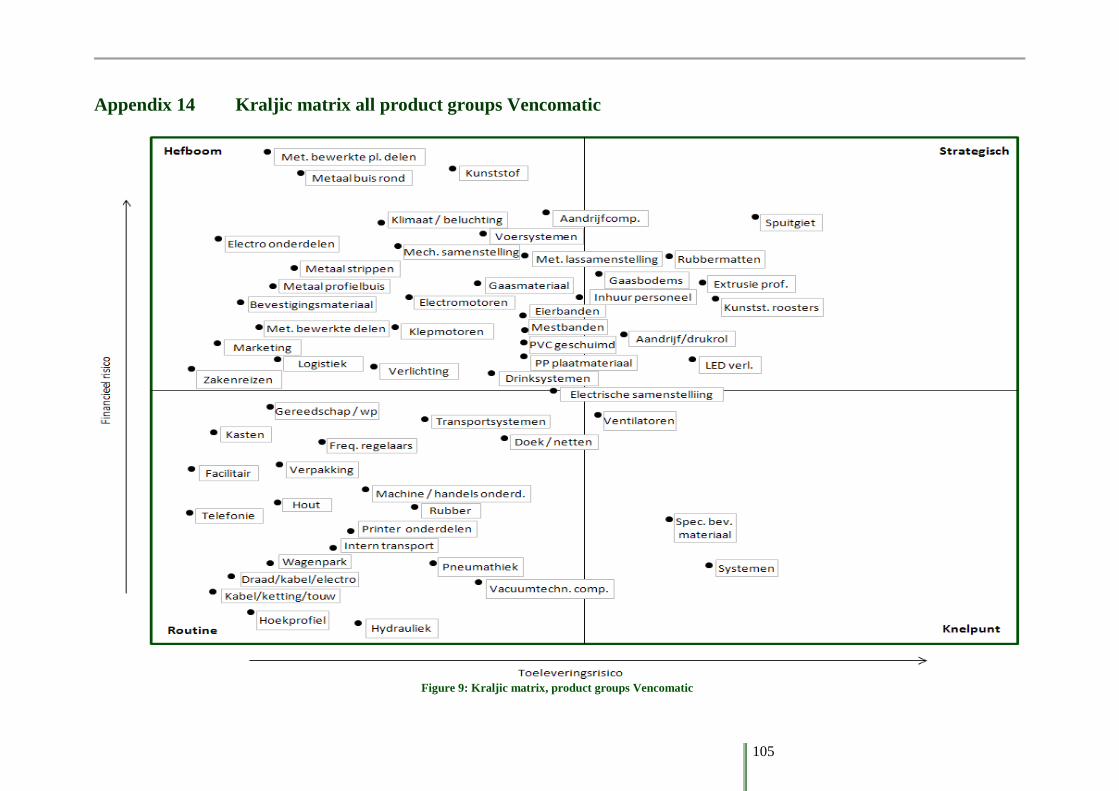
105
Appendix 14 Kraljic matrix all product groups Vencomatic
Figure 9: Kraljic matrix, product groups Vencomatic
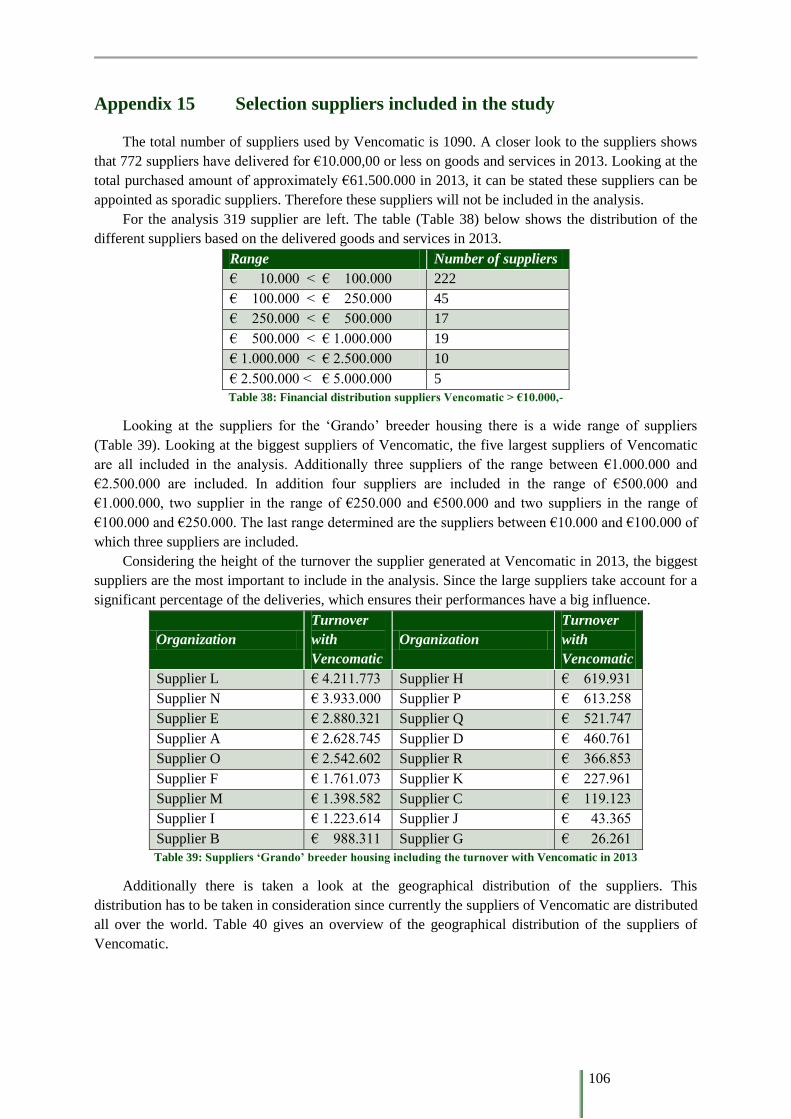
106
Appendix 15 Selection suppliers included in the study
The total number of suppliers used by Vencomatic is 1090. A closer look to the suppliers shows
that 772 suppliers have delivered for €10.000,00 or less on goods and services in 2013. Looking at the
total purchased amount of approximately €61.500.000 in 2013, it can be stated these suppliers can be
appointed as sporadic suppliers. Therefore these suppliers will not be included in the analysis.
For the analysis 319 supplier are left. The table (Table 38) below shows the distribution of the
different suppliers based on the delivered goods and services in 2013.
Range Number of suppliers
€ 10.000 < € 100.000 222
€ 100.000 < € 250.000 45
€ 250.000 < € 500.000 17
€ 500.000 < € 1.000.000 19
€ 1.000.000 < € 2.500.000 10
€ 2.500.000 < € 5.000.000 5
Table 38: Financial distribution suppliers Vencomatic > €10.000,-
Looking at the suppliers for the ‘Grando’ breeder housing there is a wide range of suppliers
(Table 39). Looking at the biggest suppliers of Vencomatic, the five largest suppliers of Vencomatic
are all included in the analysis. Additionally three suppliers of the range between €1.000.000 and
€2.500.000 are included. In addition four suppliers are included in the range of €500.000 and
€1.000.000, two supplier in the range of €250.000 and €500.000 and two suppliers in the range of
€100.000 and €250.000. The last range determined are the suppliers between €10.000 and €100.000 of
which three suppliers are included.
Considering the height of the turnover the supplier generated at Vencomatic in 2013, the biggest
suppliers are the most important to include in the analysis. Since the large suppliers take account for a
significant percentage of the deliveries, which ensures their performances have a big influence.
Organization
Turnover
with
Vencomatic
Organization
Turnover
with
Vencomatic
Supplier L € 4.211.773 Supplier H € 619.931
Supplier N € 3.933.000 Supplier P € 613.258
Supplier E € 2.880.321 Supplier Q € 521.747
Supplier A € 2.628.745 Supplier D € 460.761
Supplier O € 2.542.602 Supplier R € 366.853
Supplier F € 1.761.073 Supplier K € 227.961
Supplier M € 1.398.582 Supplier C € 119.123
Supplier I € 1.223.614 Supplier J € 43.365
Supplier B € 988.311 Supplier G € 26.261
Table 39: Suppliers ‘Grando’ breeder housing including the turnover with Vencomatic in 2013
Additionally there is taken a look at the geographical distribution of the suppliers. This
distribution has to be taken in consideration since currently the suppliers of Vencomatic are distributed
all over the world. Table 40 gives an overview of the geographical distribution of the suppliers of
Vencomatic.
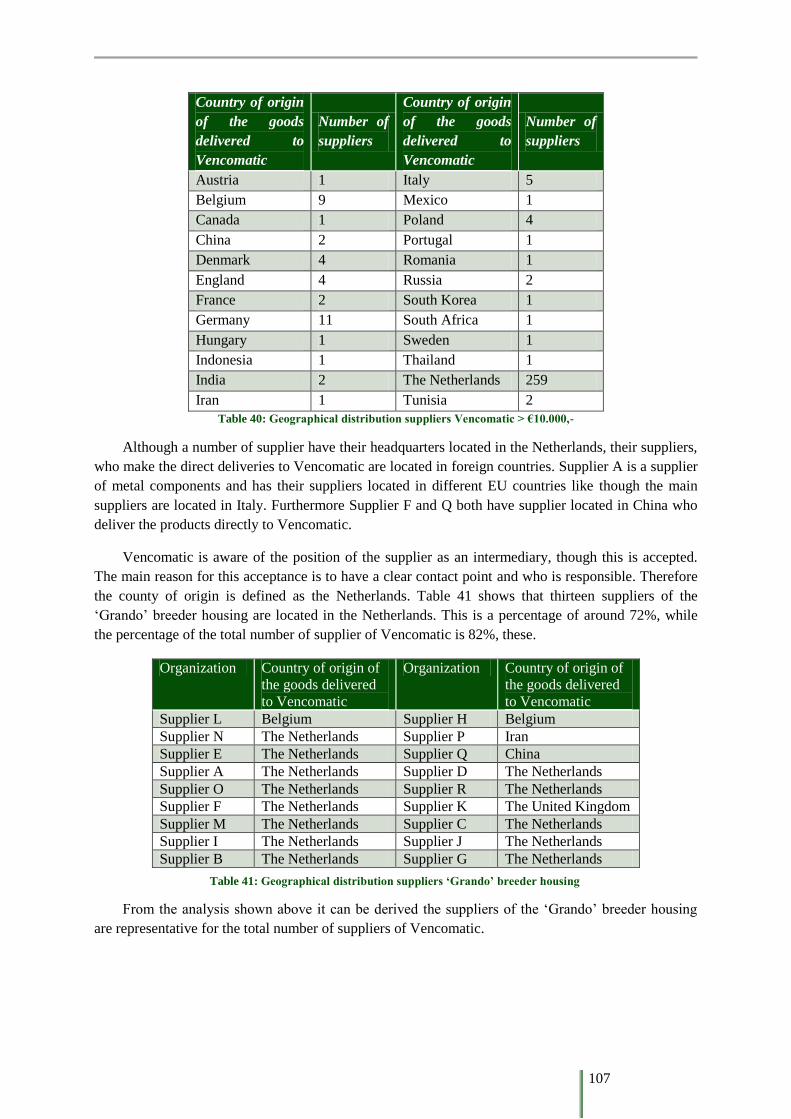
107
Country of origin
of the goods
delivered to
Vencomatic
Number of
suppliers
Country of origin
of the goods
delivered to
Vencomatic
Number of
suppliers
Austria 1 Italy 5
Belgium 9 Mexico 1
Canada 1 Poland 4
China 2 Portugal 1
Denmark 4 Romania 1
England 4 Russia 2
France 2 South Korea 1
Germany 11 South Africa 1
Hungary 1 Sweden 1
Indonesia 1 Thailand 1
India 2 The Netherlands 259
Iran 1 Tunisia 2
Table 40: Geographical distribution suppliers Vencomatic > €10.000,-
Although a number of supplier have their headquarters located in the Netherlands, their suppliers,
who make the direct deliveries to Vencomatic are located in foreign countries. Supplier A is a supplier
of metal components and has their suppliers located in different EU countries like though the main
suppliers are located in Italy. Furthermore Supplier F and Q both have supplier located in China who
deliver the products directly to Vencomatic.
Vencomatic is aware of the position of the supplier as an intermediary, though this is accepted.
The main reason for this acceptance is to have a clear contact point and who is responsible. Therefore
the county of origin is defined as the Netherlands. Table 41 shows that thirteen suppliers of the
‘Grando’ breeder housing are located in the Netherlands. This is a percentage of around 72%, while
the percentage of the total number of supplier of Vencomatic is 82%, these.
Organization Country of origin of
the goods delivered
to Vencomatic
Organization Country of origin of
the goods delivered
to Vencomatic
Supplier L Belgium Supplier H Belgium
Supplier N The Netherlands Supplier P Iran
Supplier E The Netherlands Supplier Q China
Supplier A The Netherlands Supplier D The Netherlands
Supplier O The Netherlands Supplier R The Netherlands
Supplier F The Netherlands Supplier K The United Kingdom
Supplier M The Netherlands Supplier C The Netherlands
Supplier I The Netherlands Supplier J The Netherlands
Supplier B The Netherlands Supplier G The Netherlands
From the analysis shown above it can be derived the suppliers of the ‘Grando’ breeder housing
are representative for the total number of suppliers of Vencomatic.
Table 41: Geographical distribution suppliers ‘Grando’ breeder housing
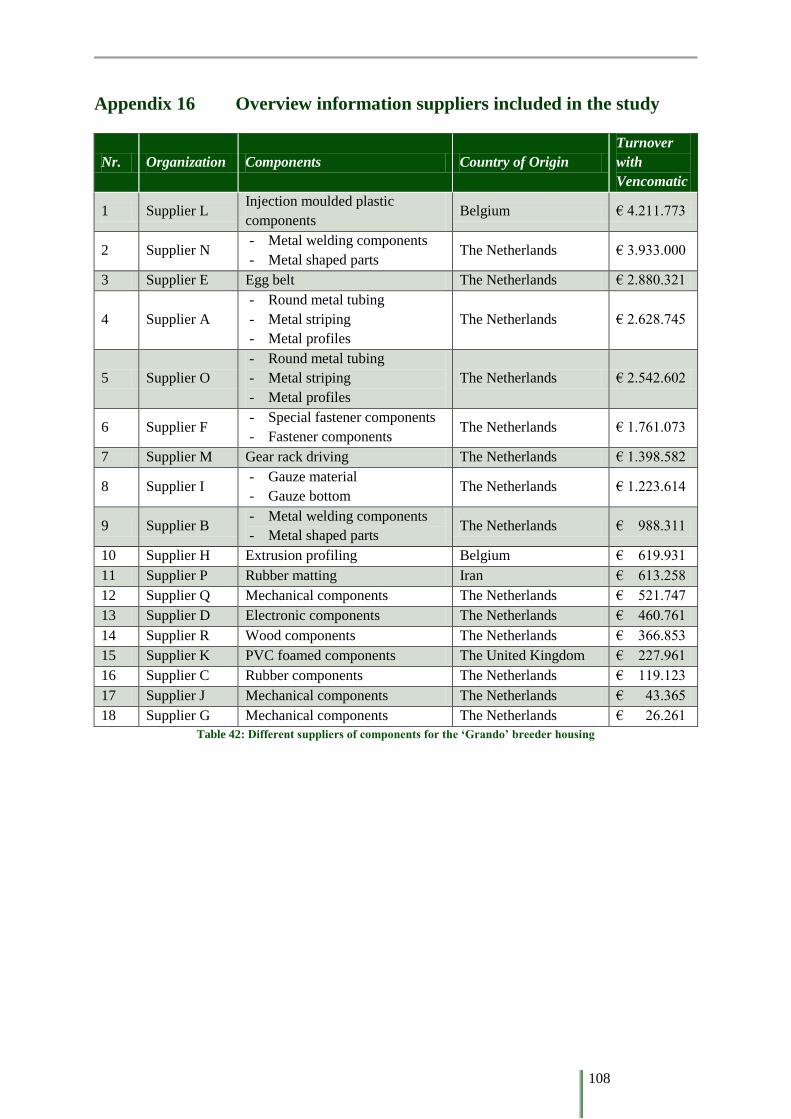
108
Appendix 16 Overview information suppliers included in the study
Nr. Organization Components Country of Origin
Turnover
with
Vencomatic
1 Supplier L Injection moulded plastic
components Belgium € 4.211.773
2 Supplier N - Metal welding components
- Metal shaped parts The Netherlands € 3.933.000
3 Supplier E Egg belt The Netherlands € 2.880.321
4 Supplier A
- Round metal tubing
- Metal striping
- Metal profiles
The Netherlands € 2.628.745
5 Supplier O
- Round metal tubing
- Metal striping
- Metal profiles
The Netherlands € 2.542.602
6 Supplier F - Special fastener components
- Fastener components The Netherlands € 1.761.073
7 Supplier M Gear rack driving The Netherlands € 1.398.582
8 Supplier I - Gauze material
- Gauze bottom The Netherlands € 1.223.614
9 Supplier B - Metal welding components
- Metal shaped parts The Netherlands € 988.311
10 Supplier H Extrusion profiling Belgium € 619.931
11 Supplier P Rubber matting Iran € 613.258
12 Supplier Q Mechanical components The Netherlands € 521.747
13 Supplier D Electronic components The Netherlands € 460.761
14 Supplier R Wood components The Netherlands € 366.853
15 Supplier K PVC foamed components The United Kingdom € 227.961
16 Supplier C Rubber components The Netherlands € 119.123
17 Supplier J Mechanical components The Netherlands € 43.365
18 Supplier G Mechanical components The Netherlands € 26.261
Table 42: Different suppliers of components for the ‘Grando’ breeder housing