Embed Size (px)
Citation preview
[Faizullin et. al., Vol.5 (Iss.5): May, 2017] ISSN- 2350-0530(O), ISSN- 2394-3629(P)
ICV (Index Copernicus Value) 2015: 71.21 IF: 4.321 (CosmosImpactFactor), 2.532 (I2OR)
InfoBase Index IBI Factor 3.86
Http://www.granthaalayah.com ©International Journal of Research - GRANTHAALAYAH [54]
Science
IMPROVEMENT OF SUN ANGLE ACCURACY FROM IN-ORBIT DATA
OF A QUADRANT PHOTODIODE SUN SENSOR
Dmytro Faizullin*1
, Koju Hiraki2, HORYU-IV team
3, Mengu Cho
4
*1, 2 Mechanical and Control Engineering, Kyushu Institute of Technology, Japan
3 Kyushu Institute of Technology, Japan
4 Applied Science for Integrated System Engineering, Kyushu Institute of Technology, Japan
DOI: https://doi.org/10.5281/zenodo.583886
Abstract
The sun vector is commonly used for defining a satellite attitude and many types of sensors exist
for its determination. A fine pinhole sun sensor type was chosen and designed for HORYU-IV
nanosatellite of Kyushu Institute of Technology. This sensor has a round-shaped hole and uses
commercial off-the-shelf silicon photodiode, which consists of four small sensitive elements
arranged close to each other. This type of sensors commonly uses look-up tables for providing
high accuracy, which requires a large amount of data to be saved. Polynomial methods for sun
vector determination were considered instead of look-up tables to avoid having a large amount of
data to be saved. The influence of dead spaces between photodiodes on sensor accuracy was also
investigated. The sensor was tested in space environment. It was found that its output signals
went to saturation point. A method for the compensation of signals truncated by saturation was
proposed. It was found that: 1) polynomial method provided 0.1deg accuracy for a sensor with
±5deg field of view; 2) accounting for gaps between photodiodes decreases the average error of
the angle determined by 15%; 3) a method for compensation of truncated signals saves full
sensor FOV with decreasing accuracy till 0.11deg.
Keywords: Angle Measurement; Photodiodes Gap; Polynomial Fitting; Quadrant Photodiode;
Saturation; Small Satellite.
Cite This Article: Dmytro Faizullin, Koju Hiraki, HORYU-IV team, and Mengu Cho. (2017).
“IMPROVEMENT OF SUN ANGLE ACCURACY FROM IN-ORBIT DATA OF A
QUADRANT PHOTODIODE SUN SENSOR.” International Journal of Research -
Granthaalayah, 5(5), 54-67. https://doi.org/10.5281/zenodo.583886.
1. Introduction
One of the efficient ways in training highly skilled specialists for rocket and space branch is to
attract young people to work in real space projects. University satellites play an important role in
such kind of training. However, this kind of satellites has some drawbacks such as: lack of
[Faizullin et. al., Vol.5 (Iss.5): May, 2017] ISSN- 2350-0530(O), ISSN- 2394-3629(P)
ICV (Index Copernicus Value) 2015: 71.21 IF: 4.321 (CosmosImpactFactor), 2.532 (I2OR)
InfoBase Index IBI Factor 3.86
Http://www.granthaalayah.com ©International Journal of Research - GRANTHAALAYAH [55]
experience for developers in a real project, substitution of team members by newcomers because
of students’ graduation, and lack or limited access to testing equipment, which can have
influence on satellite reliability. While mistakes in professional satellites can lead to huge
financial losses, mistakes in university satellites are also unwanted but educative effect from
errors identified and corrected through data processing or accounting for future projects will be
more significant.
A sun sensor of HORYU-IV nanosatellite is under consideration. The satellite was developed by
Kyushu Institute of Technology and successfully launched on February 17, 2016. Sun sensors
can be devided in two types: analog and digital sensors [1]-[2]. The selection of a sun sensor type
depends on the considered satellite’s mission requirements. For HORYU-IV nanosatellite, a fine
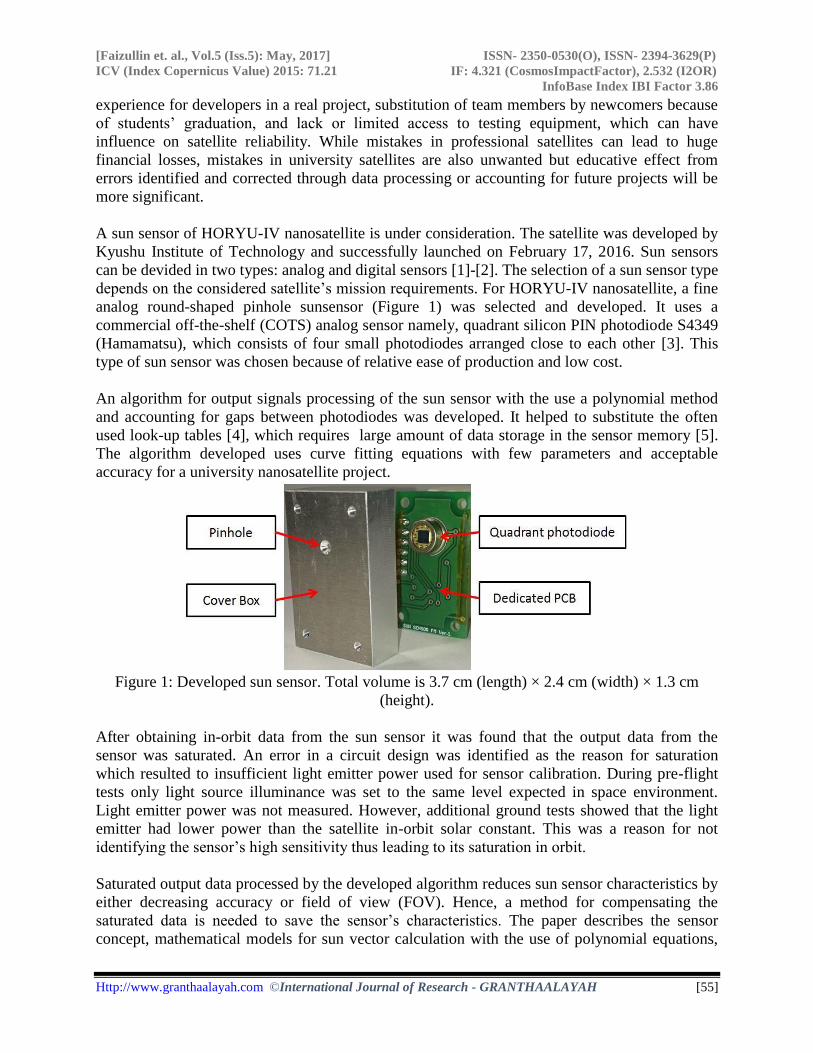
analog round-shaped pinhole sunsensor (Figure 1) was selected and developed. It uses a
commercial off-the-shelf (COTS) analog sensor namely, quadrant silicon PIN photodiode S4349
(Hamamatsu), which consists of four small photodiodes arranged close to each other [3]. This
type of sun sensor was chosen because of relative ease of production and low cost.
An algorithm for output signals processing of the sun sensor with the use a polynomial method
and accounting for gaps between photodiodes was developed. It helped to substitute the often
used look-up tables [4], which requires large amount of data storage in the sensor memory [5].
The algorithm developed uses curve fitting equations with few parameters and acceptable
accuracy for a university nanosatellite project.
Figure 1: Developed sun sensor. Total volume is 3.7 cm (length) × 2.4 cm (width) × 1.3 cm
(height).
After obtaining in-orbit data from the sun sensor it was found that the output data from the
sensor was saturated. An error in a circuit design was identified as the reason for saturation
which resulted to insufficient light emitter power used for sensor calibration. During pre-flight
tests only light source illuminance was set to the same level expected in space environment.
Light emitter power was not measured. However, additional ground tests showed that the light
emitter had lower power than the satellite in-orbit solar constant. This was a reason for not
identifying the sensor’s high sensitivity thus leading to its saturation in orbit.
Saturated output data processed by the developed algorithm reduces sun sensor characteristics by
either decreasing accuracy or field of view (FOV). Hence, a method for compensating the
saturated data is needed to save the sensor’s characteristics. The paper describes the sensor
concept, mathematical models for sun vector calculation with the use of polynomial equations,

[Faizullin et. al., Vol.5 (Iss.5): May, 2017] ISSN- 2350-0530(O), ISSN- 2394-3629(P)
ICV (Index Copernicus Value) 2015: 71.21 IF: 4.321 (CosmosImpactFactor), 2.532 (I2OR)
InfoBase Index IBI Factor 3.86
Http://www.granthaalayah.com ©International Journal of Research - GRANTHAALAYAH [56]
gaps accounting between photodiodes, and finaly how to process obtained saturated signals for
saving full sensor FOV without considerable decreasing of sensor accuracy.
2. Materials and Methods
2.1. Sun Vector Determination by Analog Pinhole Sun Sensor
When look-up tables are replaced by fitting equations, parameters such as pinhole shape and the
gaps size between photodiodes influence the sun vector accuracy or field of view (FOV). Many
commercial analog pinhole sun sensors for nanosatellites have square-shaped hole and simple
linear equations can be used for sun vector determination [6]. When square-shaped holes are
used taking into account gaps between photodiodes is relatively easy to do since the intersection
area has a square shape. The sun sensor developed for HORYU-IV has round shaped-hole.
Therefore in this case, two problems appeared: 1) taking gaps into account by calculating the
intersection area betwen a circle and rectangles; 2) decrease in FOV or accuracy when using
linear equations [7]. Information which could explain how to solve them was scarce [7]. Hence, a
polynomial equation and also a method to take into account gaps were used for improving sun
vector determination [9].
2.1.1. Sensor Concept
Operation of the sensor is based on a principle that when an incident light passes through a
pinhole it illuminates a spot on the four photodiodes (Figure 2). Each diode’s output is a current
proportional to the amount of light it is exposed to [7]. Ratios of obtained output data (x0, y0)
calculated by (1)-(2) provide an information to define the light spot centre (x, y) [10].
𝑥0 =(𝐵 + 𝐶) − (𝐴 + 𝐷)
𝐴 + 𝐵 + 𝐶 + 𝐷 (1)
𝑦0 =(𝐴 + 𝐵) − (𝐶 + 𝐷)
𝐴 + 𝐵 + 𝐶 + 𝐷 (2)
Where, A, B, C, and D are output signals from photodiodes.
Figure 2: Schematic of a pinhole sun sensor. Where, A, B, C, and D: sensor photodiodes; O1:
incident light center; L: quadrant photodiode size; d: pinhole diameter; h: distance from
photodiodes to a pinhole plane; α: incident angle of light.
[Faizullin et. al., Vol.5 (Iss.5): May, 2017] ISSN- 2350-0530(O), ISSN- 2394-3629(P)
ICV (Index Copernicus Value) 2015: 71.21 IF: 4.321 (CosmosImpactFactor), 2.532 (I2OR)
InfoBase Index IBI Factor 3.86
Http://www.granthaalayah.com ©International Journal of Research - GRANTHAALAYAH [57]
2.1.2. Investigated Area in the Sensor
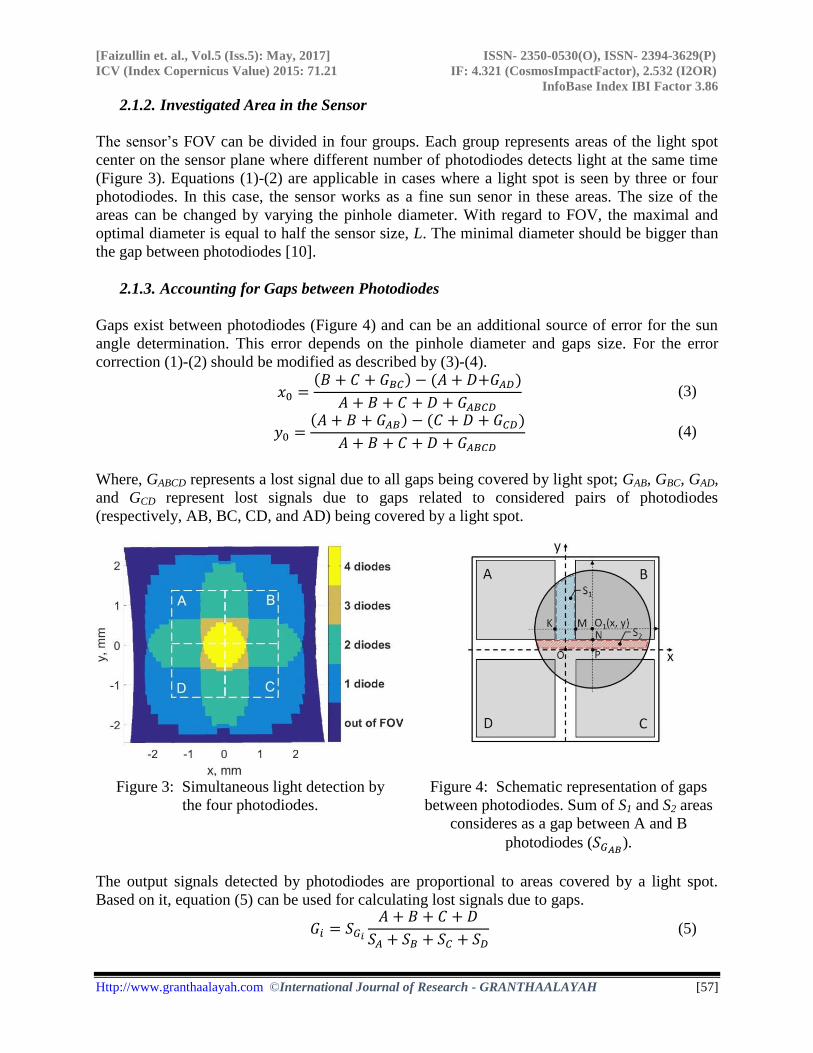
The sensor’s FOV can be divided in four groups. Each group represents areas of the light spot
center on the sensor plane where different number of photodiodes detects light at the same time
(Figure 3). Equations (1)-(2) are applicable in cases where a light spot is seen by three or four
photodiodes. In this case, the sensor works as a fine sun senor in these areas. The size of the
areas can be changed by varying the pinhole diameter. With regard to FOV, the maximal and
optimal diameter is equal to half the sensor size, L. The minimal diameter should be bigger than
the gap between photodiodes [10].
2.1.3. Accounting for Gaps between Photodiodes
Gaps exist between photodiodes (Figure 4) and can be an additional source of error for the sun
angle determination. This error depends on the pinhole diameter and gaps size. For the error
correction (1)-(2) should be modified as described by (3)-(4).
𝑥0 =(𝐵 + 𝐶 + 𝐺𝐵𝐶) − (𝐴 + 𝐷+𝐺𝐴𝐷)
𝐴 + 𝐵 + 𝐶 + 𝐷 + 𝐺𝐴𝐵𝐶𝐷 (3)
𝑦0 =(𝐴 + 𝐵 + 𝐺𝐴𝐵) − (𝐶 + 𝐷 + 𝐺𝐶𝐷)
𝐴 + 𝐵 + 𝐶 + 𝐷 + 𝐺𝐴𝐵𝐶𝐷 (4)
Where, GABCD represents a lost signal due to all gaps being covered by light spot; GAB, GBC, GAD,
and GCD represent lost signals due to gaps related to considered pairs of photodiodes
(respectively, AB, BC, CD, and AD) being covered by a light spot.
Figure 3: Simultaneous light detection by
the four photodiodes.
Figure 4: Schematic representation of gaps
between photodiodes. Sum of S1 and S2 areas
consideres as a gap between A and B
photodiodes (𝑆𝐺𝐴𝐵).
The output signals detected by photodiodes are proportional to areas covered by a light spot.
Based on it, equation (5) can be used for calculating lost signals due to gaps.
𝐺𝑖 = 𝑆𝐺𝑖
𝐴 + 𝐵 + 𝐶 + 𝐷
𝑆𝐴 + 𝑆𝐵 + 𝑆𝐶 + 𝑆𝐷 (5)
[Faizullin et. al., Vol.5 (Iss.5): May, 2017] ISSN- 2350-0530(O), ISSN- 2394-3629(P)
ICV (Index Copernicus Value) 2015: 71.21 IF: 4.321 (CosmosImpactFactor), 2.532 (I2OR)
InfoBase Index IBI Factor 3.86
Http://www.granthaalayah.com ©International Journal of Research - GRANTHAALAYAH [58]
Where, SA, SB, SC, and SD are areas of photodiodes covered by a light spot; SGi is the area of a gap
between the considered photodiodes covered by a light spot.
For example, an SG between A and B photodiodes can be found as described in (6).
𝑆𝐺𝐴𝐵= 𝑆1 + 𝑆2 (6)
Where, S1 and S2 are shown in Figure 4 and are calculated using (7)-(8):
𝑆1 = ∫ 𝑑𝑥 ∫ 𝑑𝑦
√𝑟2−𝑥2
𝑏1
𝑎11
𝑎12
(7)
𝑆2 = 2 ∫ 𝑑𝑦 ∫ 𝑑𝑥
√𝑟2−𝑦2
0
𝑎22
𝑎21
(8)
Where, a11=O1M; a12=O1K; a21=O1N; a22=O1P; b1=O1N; r is the radius of a light spot; x, y are
the measured position of a light spot center calculated without taking into account gaps.
Equations (7)-(8) can be converted to a simpler form for the calculations in the simulations. An
example for S1 is given in(9)-(11).
𝑆1 = 𝑑1 − 𝑑2 (9)
𝑑1 = 0.5(𝑎11√𝑟2 − 𝑎112 + 𝑟2 arcsin
𝑎11
𝑟) − 𝑏1 𝑎11 (10)
𝑑2 = 0.5(𝑎12√𝑟2 − 𝑎122 + 𝑟2 arcsin
𝑎12
𝑟) − 𝑏1 𝑎12 (11)
After a series of tests with real sun sensors, it was found that (5) does not correctly represent
gaps variation. Hence, a coefficient, which reduces signal loss due to gaps, was added as
described in (12).
𝐺𝑖 =𝑆𝐺𝑖
𝑘𝐺
𝐴 + 𝐵 + 𝐶 + 𝐷
𝑆𝐴 + 𝑆𝐵 + 𝑆𝐶 + 𝑆𝐷 (12)
Where, kG is the coefficient, which should be determined during a calibration process.
2.1.4. Determination of Sun Vector
Sun vector is determined as unit vector in a sun sensor frame. Distance from the pinhole to the
photodiodes plane, h, and coordinates of a light spot center are used for calculating the vector
components. Coordinates can be easily found based on output information from a rate table and
an inclinometer used in a testing facility of the sensor. Hence, dependencies between calculated
ratios of output signals (x0, y0) and obtained coordinates (x, y) can be also found. An example of
the dependencies for X axis is shown in Figure 5-a. The ratios were calculated with gaps
accounting for a sun sensor with pin hole diameter 1 mm. Figure 5-b shows the same curves in 2-

[Faizullin et. al., Vol.5 (Iss.5): May, 2017] ISSN- 2350-0530(O), ISSN- 2394-3629(P)
ICV (Index Copernicus Value) 2015: 71.21 IF: 4.321 (CosmosImpactFactor), 2.532 (I2OR)
InfoBase Index IBI Factor 3.86
Http://www.granthaalayah.com ©International Journal of Research - GRANTHAALAYAH [59]
D interpretation. It can be seen that the curves are similar and can be considered as one curve. It
has sinusoidal form due to combination of a round-shaped pinhole and squared photodiodes. The
main goal was to find equations which will fit curves for X and Y axis and give light spot center
coordinates with respect to output signals. Polynomial equation was considered.
(a) 3D view of curves with regards to
photodiodes coordinate system.
(b) 2D view of curves with regards to x
axis of photodiodes coordinate system.
Figure 5: Curves representation of output signal ratios for x coordinates of light spot center with
different constant values of y coordinate.
2.1.5. Polynomial Equation
Using Matlab software, sets of curves obtained by (3)-(4) were averaged and polynomial
parameters were found using a curve fitting tool. It was defined that increasing the polynom over
the 7th
order would not give considerable improvement in angle error correction. The curves in
Figure 5 are sinusoidal and for this reason, even parameters in the polynomial equation can be
omitted as described by Eq.(13)-(14). An example angle error determination is shown in Figure
6. It can be seen that polynomial method has uniform distribution of angle error in 100% of
sensor's FOV.
(a) Schematic representation of polinomial
curve fitting. (b) Error of angle determination.
Figure 6: Error of angle determination of a sun sensor for a polynomial equation.
𝑥𝑝 = 𝑝7𝑥07 + 𝑝5𝑥0
5 + 𝑝3𝑥03 + 𝑝1𝑥0 (13)
𝑦𝑝 = 𝑝7𝑦07 + 𝑝5𝑦0
5 + 𝑝3𝑦03 + 𝑝1𝑦0 (14)

[Faizullin et. al., Vol.5 (Iss.5): May, 2017] ISSN- 2350-0530(O), ISSN- 2394-3629(P)
ICV (Index Copernicus Value) 2015: 71.21 IF: 4.321 (CosmosImpactFactor), 2.532 (I2OR)
InfoBase Index IBI Factor 3.86
Http://www.granthaalayah.com ©International Journal of Research - GRANTHAALAYAH [60]
2.2. Compensation of Saturated Signals of the Sun Sensor
2.2.1. Comparison of Sun Sensor Outputs from In-Orbit and Ground Tests
In-orbit sun sensors data were downloaded from the satellite. An example is shown in Figure 7.
It contains signals from A, B, C, and D photodiodes and also their sum ABCD. It was found that
behavior of measured output signal did not match expected values, measured during ground tests
(Figure 8-b). The light spot motion path used in generating sun sensor output signal during
ground test is shown in Figure 8-a.
Figure 7: Example of in-orbit sun sensor output signals from photodiodes A, B, C, D, and their
sum ABCD. The data set is good for sun vector determination because the sensor works in fine
mode when 3 or 4 photodiodes simultaneously detect light. But characteristics of the sensors
(FOV and accuracy) are decreased because of truncated output signals.
(a) Schematic representation of light
spot path during ground tests. The
sun sensor was inclined to the X
axis at an angle and rotated about
Y axis.
(b) Correct output signal profile from sun
sensor obtained with low power light
emission. The data was obtained during
ground test with 5 deg inclination to X
axis and rotated about the Y axis from -
20 to +20 deg.
Figure 8: Sun senor output signals obtained from ground tests in a laboratory.
Umax
FOV
Reverse bias

[Faizullin et. al., Vol.5 (Iss.5): May, 2017] ISSN- 2350-0530(O), ISSN- 2394-3629(P)
ICV (Index Copernicus Value) 2015: 71.21 IF: 4.321 (CosmosImpactFactor), 2.532 (I2OR)
InfoBase Index IBI Factor 3.86
Http://www.granthaalayah.com ©International Journal of Research - GRANTHAALAYAH [61]
In normal mode (without saturation) output signals from the sun sensor should be proportional to
the area on surface of the sensor’s photodiodes exposed to light multiplied by cosine of light
vector ascending angle 0. In considered case, the sun sensor has low FOV (±5deg). Hence,
difference in the sum caused by ascending angle is small and the sum can be considered as a
constant value Umax (Figure 8-b). In-orbit sun sensor data investigation showed that the sum
ABCD had steep change in profile. It gave a reason to conclude that some output data was lost.
As a result, the sun sensor’s characteristics was degraded by decreasing FOV and accuracy.
2.2.2. Sun Sensor Outputs under Different Emitting Power of a Light Source
Additional ground tests to identify reasons for unusual sensor outputs were made with a spare
sensor. It was found that after increasing the emitted power from light source the sensor’s output
signals has the same characteristics as in-orbit sensors (Figure 9). The reason was saturation of
output signals caused by exceeding reverse bias level of the photodiodes. Spurious signals were
observed in 2 neighboring photodiodes to a saturated one. The third photodiode did not produce
any unwanted signal because of small contact area with saturated photodiode.
Figure 9: Shapes of output sun sensor signals truncated by saturation because of exceeding
reverse bias level.
Two additional tests with low and high emitting powers were made to map the output signal
levels. Fig. 10 shows separate results for each of photodiode. Fig. 10-a represents maps of output
signals obtained with a low intensity light source. They have correct square shapes with rounded
corners. But in Fig. 10-b it can be easily recognized that spurious signals appeared at areas where
neighboring photodiodes achieved maximum signal levels and went to saturation. From this
point it was concluded that the saturation was a reason for spurious signal recorded in
neighboring photodiodes. The phenomenon is known as electrical crosstalk. Usually pure
electrical crosstalk is negligible if the photodiode array operates under a reverse bias 0. The
maximum level of the parameter in a datasheet of the photodiode is 2 % [3]. In considered case
the crosstalk exceeds 10% and explanation for it is saturation.
Reverse
bias
[Faizullin et. al., Vol.5 (Iss.5): May, 2017] ISSN- 2350-0530(O), ISSN- 2394-3629(P)
ICV (Index Copernicus Value) 2015: 71.21 IF: 4.321 (CosmosImpactFactor), 2.532 (I2OR)
InfoBase Index IBI Factor 3.86
Http://www.granthaalayah.com ©International Journal of Research - GRANTHAALAYAH [62]
2.2.3. Method for Compensation of Saturated Signals
Saturation of a sun sensor reduces accuracy and FOV of the sensor. There is a need to
compensate for truncated signals and find signal levels for usage of method described in Section
2.1. To compensate truncated signals lost due to photodiodes reverse bias, it is important to
recover lost signals from saturated photodiode and spurious signals gained as a result of
crosstalk.
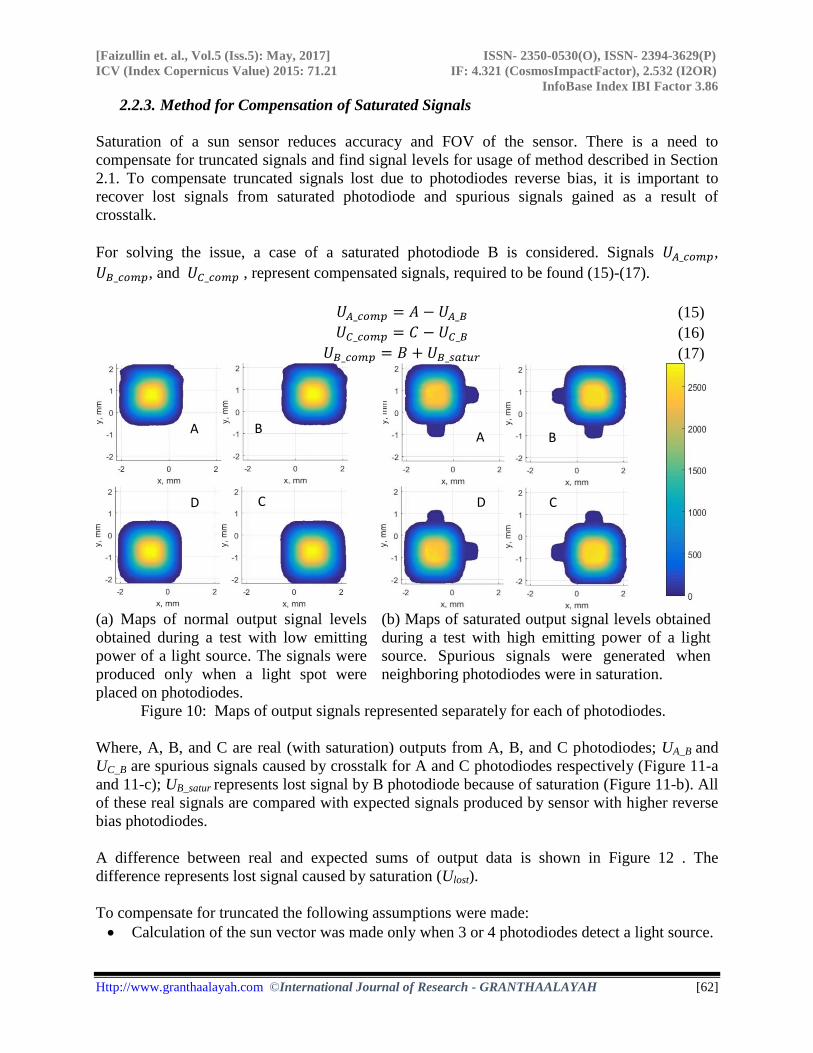
For solving the issue, a case of a saturated photodiode B is considered. Signals 𝑈𝐴_𝑐𝑜𝑚𝑝,
𝑈𝐵_𝑐𝑜𝑚𝑝, and 𝑈𝐶_𝑐𝑜𝑚𝑝 , represent compensated signals, required to be found (15)-(17).
𝑈𝐴_𝑐𝑜𝑚𝑝 = 𝐴 − 𝑈𝐴_𝐵 (15)
𝑈𝐶_𝑐𝑜𝑚𝑝 = 𝐶 − 𝑈𝐶_𝐵 (16)
𝑈𝐵_𝑐𝑜𝑚𝑝 = 𝐵 + 𝑈𝐵_𝑠𝑎𝑡𝑢𝑟 (17)
(a) Maps of normal output signal levels
obtained during a test with low emitting
power of a light source. The signals were
produced only when a light spot were
placed on photodiodes.
(b) Maps of saturated output signal levels obtained
during a test with high emitting power of a light
source. Spurious signals were generated when
neighboring photodiodes were in saturation.
Figure 10: Maps of output signals represented separately for each of photodiodes.
Where, A, B, and C are real (with saturation) outputs from A, B, and C photodiodes; UA_B and
UC_B are spurious signals caused by crosstalk for A and C photodiodes respectively (Figure 11-a
and 11-c); UB_satur represents lost signal by B photodiode because of saturation (Figure 11-b). All
of these real signals are compared with expected signals produced by sensor with higher reverse
bias photodiodes.
A difference between real and expected sums of output data is shown in Figure 12 . The
difference represents lost signal caused by saturation (Ulost).
To compensate for truncated the following assumptions were made:
Calculation of the sun vector was made only when 3 or 4 photodiodes detect a light source.
A B
C D
A B
C D
[Faizullin et. al., Vol.5 (Iss.5): May, 2017] ISSN- 2350-0530(O), ISSN- 2394-3629(P)
ICV (Index Copernicus Value) 2015: 71.21 IF: 4.321 (CosmosImpactFactor), 2.532 (I2OR)
InfoBase Index IBI Factor 3.86
Http://www.granthaalayah.com ©International Journal of Research - GRANTHAALAYAH [63]
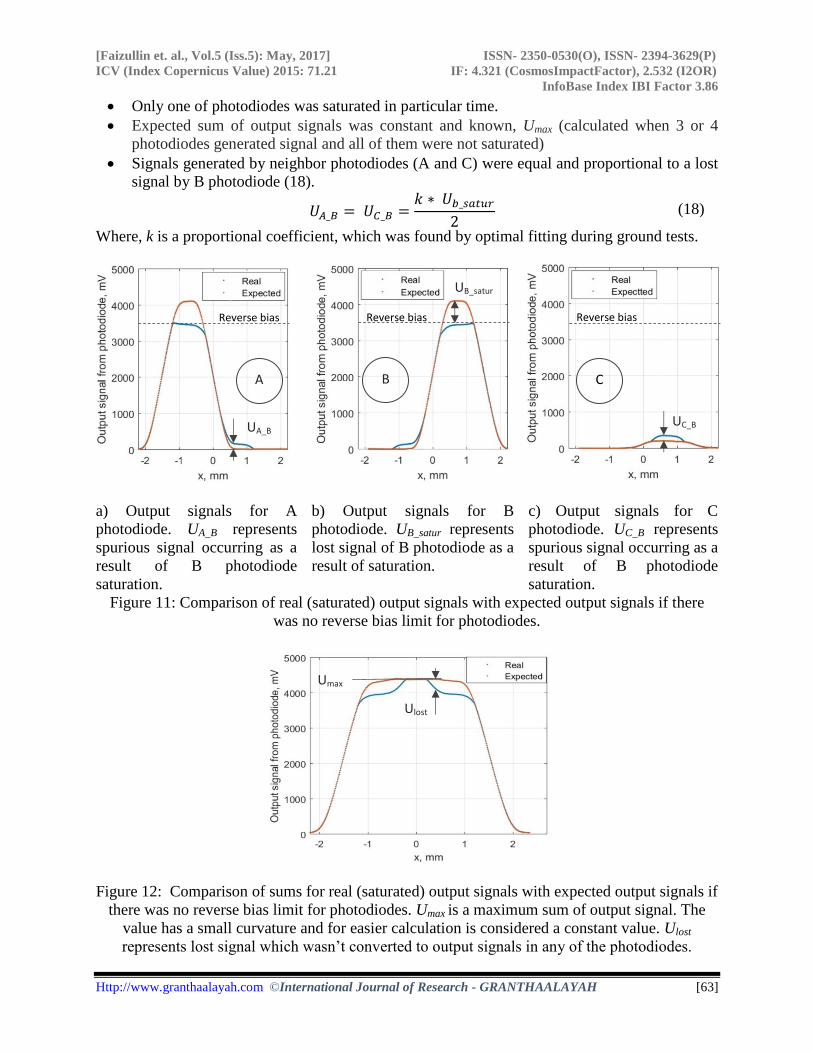
Only one of photodiodes was saturated in particular time.
Expected sum of output signals was constant and known, Umax (calculated when 3 or 4
photodiodes generated signal and all of them were not saturated)
Signals generated by neighbor photodiodes (A and C) were equal and proportional to a lost
signal by B photodiode (18).
𝑈𝐴_𝐵 = 𝑈𝐶_𝐵 =𝑘 ∗ 𝑈𝑏_𝑠𝑎𝑡𝑢𝑟
2 (18)
Where, k is a proportional coefficient, which was found by optimal fitting during ground tests.
a) Output signals for A
photodiode. UA_B represents
spurious signal occurring as a
result of B photodiode
saturation.
b) Output signals for B
photodiode. UB_satur represents
lost signal of B photodiode as a
result of saturation.
c) Output signals for C
photodiode. UC_B represents
spurious signal occurring as a
result of B photodiode
saturation.
Figure 11: Comparison of real (saturated) output signals with expected output signals if there
was no reverse bias limit for photodiodes.
Figure 12: Comparison of sums for real (saturated) output signals with expected output signals if
there was no reverse bias limit for photodiodes. Umax is a maximum sum of output signal. The
value has a small curvature and for easier calculation is considered a constant value. Ulost
represents lost signal which wasn’t converted to output signals in any of the photodiodes.
Umax
Ulost
B C A
UA_B
UB_satur
UC_B
Reverse bias Reverse bias Reverse bias

[Faizullin et. al., Vol.5 (Iss.5): May, 2017] ISSN- 2350-0530(O), ISSN- 2394-3629(P)
ICV (Index Copernicus Value) 2015: 71.21 IF: 4.321 (CosmosImpactFactor), 2.532 (I2OR)
InfoBase Index IBI Factor 3.86
Http://www.granthaalayah.com ©International Journal of Research - GRANTHAALAYAH [64]
For compensating truncated signals next assumptions were made:
Calculation of the sun vector was made only when 3 or 4 photodiodes detect a light
source.
Only one of photodiodes was saturated in particular time.
Expected sum of output signals was constant and known, Umax (calculated when 3 or 4
photodiodes generated signal and all of them were not saturated)
Signals generated by neighbor photodiodes (A and C) were equal and proportional to a
lost signal by B photodiode (18).
A lost signal by B photodiode (𝑈𝐵_𝑠𝑎𝑡𝑢𝑟) can be divided in two components: a signal produced
by neighbor photodiodes and a lost signal (19).
𝑈𝐵_𝑠𝑎𝑡𝑢𝑟 = 𝑈𝐴𝐶_𝐵 + 𝑈𝐵_𝑙𝑜𝑠𝑡 (19)
Where,
𝑈𝐴𝐶_𝐵 = 𝑈𝐴_𝐵 + 𝑈𝐶_𝐵 (20)
𝑈𝐵_𝑙𝑜𝑠𝑡 = 𝑈𝑚𝑎𝑥 − 𝑈𝐴𝐵𝐶𝐷 (21)
𝑈𝐴𝐵𝐶𝐷 = 𝐴 + 𝐵 + 𝐶 + 𝐷 (22)
Using (18), (20), and (21), Eq. (19) can be rewritten as (23)
𝑈𝐵_𝑠𝑎𝑡𝑢𝑟 = 𝑈𝑚𝑎𝑥 − 𝑈𝐴𝐵𝐶𝐷
1 − 𝑘 (23)
Finally, Eq. (15)-(17) can be rewritten as
𝑈𝐴_𝑐𝑜𝑚𝑝 = 𝐴 −𝑘(𝑈𝑚𝑎𝑥 − 𝑈𝐴𝐵𝐶𝐷)
2(1 − 𝑘) (24)
𝑈𝐶_𝑐𝑜𝑚𝑝 = 𝐶 −𝑘(𝑈𝑚𝑎𝑥 − 𝑈𝐴𝐵𝐶𝐷)
2(1 − 𝑘) (25)
𝑈𝐵_𝑐𝑜𝑚𝑝 = 𝐵 +𝑈𝑚𝑎𝑥 − 𝑈𝐴𝐵𝐶𝐷
1 − 𝑘 (26)
3. Results
3.1. Sensor Accuracy
Based on requirements from Photo-electrons Current (PEC) Measurement mission of Horyu-IV,
attitude and orbit determination system (AODS) should send a logical signal when a sun sensor
on the same panel as PEC elements detects the Sun in a field of view (FOV) ±15deg. It was
decided to choose total field of view of sun sensor to 15 deg. In this case the sun senor can work
as a fine sensor within FOV ±5deg.
On ground calibration of the sensor showed next accuracies: 1) for polynomial curve fitting:
0.1deg; 2) for polynomial curve fitting with gap accounting between photodiodes: 0.9deg. The
same algorithm was checked for other sensor configurations (pinhole diameter: 1deg and 1.5deg;
distance from pinhole to the photodiode plane: 1.73mm, 3.16mm, and 6.76mm) for real sun
sensor model and simulated ones with MATLAB. The average ratio of sun vector determination
[Faizullin et. al., Vol.5 (Iss.5): May, 2017] ISSN- 2350-0530(O), ISSN- 2394-3629(P)
ICV (Index Copernicus Value) 2015: 71.21 IF: 4.321 (CosmosImpactFactor), 2.532 (I2OR)
InfoBase Index IBI Factor 3.86
Http://www.granthaalayah.com ©International Journal of Research - GRANTHAALAYAH [65]
improvement with gap accounting was found to be 15%. All of the tests were made with normal
(unsaturated) data. The full information with test results for all considered sensor configurations
can be found at [9].
3.2. Results of Saturated Signals Compensation
For investigating efficiency of proposed method in Section 2.2, two tests with the same
conditions with difference only in emitting power of light source were made. First set of data
was obrained with low power and all of the signals were normal (without saturation) (Figure 8-
b). Second set of data were obrained with hight power and saturated signals appeared (Figure 9).
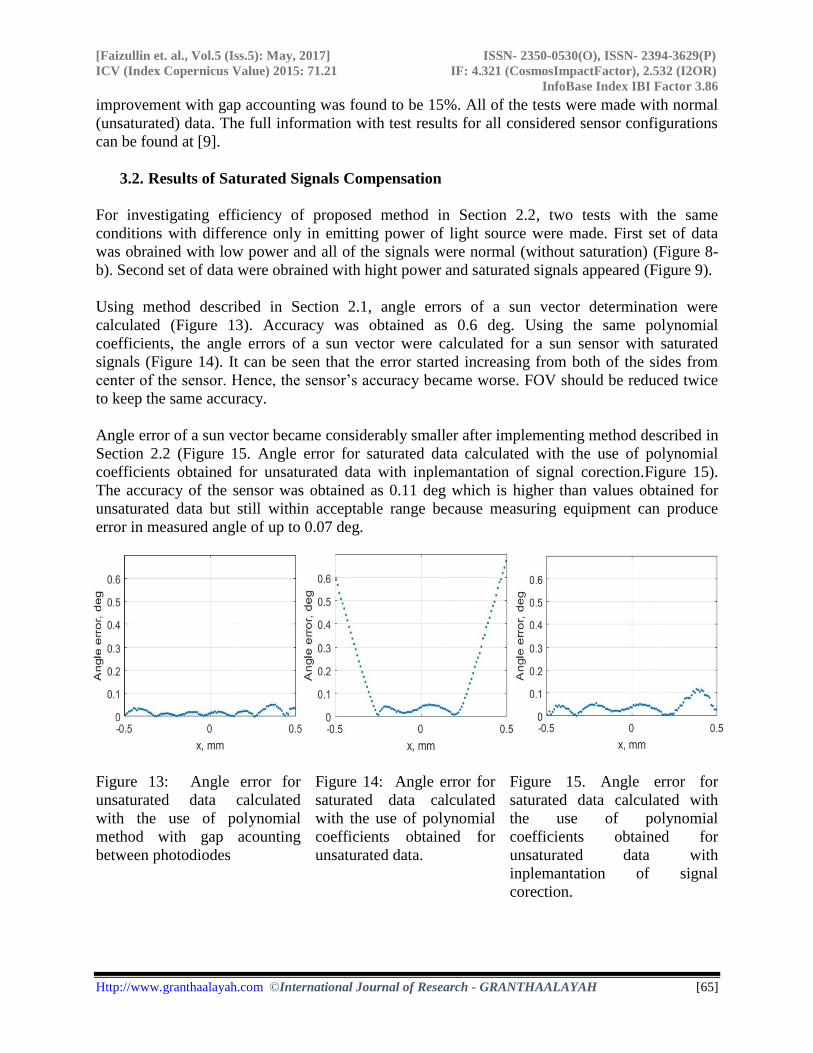
Using method described in Section 2.1, angle errors of a sun vector determination were
calculated (Figure 13). Accuracy was obtained as 0.6 deg. Using the same polynomial
coefficients, the angle errors of a sun vector were calculated for a sun sensor with saturated
signals (Figure 14). It can be seen that the error started increasing from both of the sides from
center of the sensor. Hence, the sensor’s accuracy became worse. FOV should be reduced twice
to keep the same accuracy.
Angle error of a sun vector became considerably smaller after implementing method described in
Section 2.2 (Figure 15. Angle error for saturated data calculated with the use of polynomial
coefficients obtained for unsaturated data with inplemantation of signal corection.Figure 15).
The accuracy of the sensor was obtained as 0.11 deg which is higher than values obtained for
unsaturated data but still within acceptable range because measuring equipment can produce
error in measured angle of up to 0.07 deg.
Figure 13: Angle error for
unsaturated data calculated
with the use of polynomial
method with gap acounting
between photodiodes
Figure 14: Angle error for
saturated data calculated
with the use of polynomial
coefficients obtained for
unsaturated data.
Figure 15. Angle error for
saturated data calculated with
the use of polynomial
coefficients obtained for
unsaturated data with
inplemantation of signal
corection.
[Faizullin et. al., Vol.5 (Iss.5): May, 2017] ISSN- 2350-0530(O), ISSN- 2394-3629(P)
ICV (Index Copernicus Value) 2015: 71.21 IF: 4.321 (CosmosImpactFactor), 2.532 (I2OR)
InfoBase Index IBI Factor 3.86
Http://www.granthaalayah.com ©International Journal of Research - GRANTHAALAYAH [66]
3.3. Lessons Learned
University satellites have high risk for mistakes occurring because of lack of experience,
different time schedule of developers’ education process, etc. In case of considered sun sensor
next mistake was identified:
During preflight tests the sun sensors were calibrated with illuminance equal to in-orbit
sun illuminance which was measured by a lux meter. At that time light emitter power was
not measured. After receiving saturated data from orbiting satellite additional ground
tests were made. They showed that the light power was lower than the solar constant.
This was a reason for sun sensor saturation.
For fixing the issue sensitivity of the sensor should be reduced by decreasing resistance related to
setting up a level of photodiodes revers bias. It was successfully checked by ground tests.
4. Conclusions
University satellites are very useful as a part of educational process, for scientific mission and
also for technology demonstration because of considerably lower price for development in
comparison to professional satellites. In the same time occurring errors in the satellite design is
more likely.
The paper presented a sun sensor developed for HORYU-IV nanosatellite. Polynomial method
was considered for replacing the use of look-up tables for sun vector determination. Moreover,
gaps between sensor’s photodiodes were also considered in the proposed methods. Obtained data
from space showed that sun sensors went to saturation. Hence, accuracy and FOV of the sensors
were reduced. The same behaivior of a spare sensor was found after ground tests with high
emitted power from light source. A method for compensating truncated signals due to saturation
was developed.
The investigation showed that:
saturation in one of the photodiodes lead to spurious signals in 2 neighboring
photodiodes;
direct processing of truncated signals due to saturation led to a decrease in the sensors
FOV by a factor of 2 while maintaining the initial accuracy;
direct processing of truncated signals due to saturation led to a decrease in the sensors
accuracy up to 0.6 deg while maintaining initial FOV;
using developed method for truncated signal compensation saves full sensor FOV,
however the sensors accuracy is degraded to 0.11 deg, which is totally acceptable for
HORYU-IV missions.
Acknowledgements
The authors wish to thank the Center for Nanosatellite Testing, Kyushu Institute of Technology,
for providing testing equipment. They would also like to express thanks to HORYU-IV team for
taking part in designing, testing, and integrating sun sensors. This work was supported in part by
the JSPS KAKENHI Grant Number 25220915.
[Faizullin et. al., Vol.5 (Iss.5): May, 2017] ISSN- 2350-0530(O), ISSN- 2394-3629(P)
ICV (Index Copernicus Value) 2015: 71.21 IF: 4.321 (CosmosImpactFactor), 2.532 (I2OR)
InfoBase Index IBI Factor 3.86
Http://www.granthaalayah.com ©International Journal of Research - GRANTHAALAYAH [67]
References
[1] Wertz, J. ed. Spacecraft Attitude Determination and Control. Dordrecht, Holland: Kluwer
Academic Publisher, 1978.
[2] J. Garcia Ortega, C.L. Tarrida, J.M. Quero, MEMS solar sensor testing for satellite applications,
2009 Spanish Conference on Electron Devices, Santiago de Compostela, 2009, pp. 345-348.
[3] S4349 photodiode Hamamatsu. [Online]. Available:
https://www.hamamatsu.com/eu/en/product/alpha/S/4106/S4349/index.html
[4] G. Falbel and M. A. Paluszek, An ultra low weight/low cost three axis attitude readout system for
nano-satellites, 2001 IEEE Aerospace Conference Proceedings (Cat. No.01TH8542), Big Sky,
MT, 2001, pp. 2469-2481 vol.5.
[5] D. P. Ramer and J. C. Rains Jr., Quadrant light detector, U.S. patent 5 705 804, Jan. 6, 1998.
[6] E. Boslooper, BepiColombo Fine Sun Sensor, in Proc. ICSO 2012, Ajaccio. [Online]. Available:
http://esaconferencebureau.com/custom/icso/2012/papers/fp_icso-029.pdf.
[7] P. Ortega, G. López-Rodríguez, J. Ricart, A Miniaturized Two Axis Sun Sensor for Attitude
Control of Nano-Satellites, IEEE Sensor Journal, VOL. 10, NO. 10, October 2010.
[8] I. Shafer, C. Powell, J. Stanton, CubeSat Solar Sensor Final Report, Olin-NASA Research Group,
2008. [Online]. Available: http://nasa.olin.edu/projects/2008/sos/files/SOSReport.pdf.
[9] D. Faizullin, K. Hiraki, M. Cho, Optimization of a sun vector determination for pinhole type sun
sensor. [Unpublished].
[10] Bi-Cell & Quadrant Photodiodes. [Online]. Available:
https://www.aptechnologies.co.uk/index.php/support/photodiodes/bi-cell-a-quadrant-photodiodes.
[11] I. Goushcha, B. Tabbert and A. O. Goushcha, Optical and electrical crosstalk in pin photodiode
array for medical imaging applications, 2007 IEEE Nuclear Science Symposium Conference
Record, Honolulu, HI, 2007, pp. 4348-4353.
*Corresponding author.
E-mail address: [email protected]


![]Rinsyobyouri_61(7)635-640...gression of chronic renal disease. J Lab Clin Med 2004; 143:23-30. 9) Hiraki K, Kamijo-lkemori A, Sugaya T, et al. Moder- ate-intensity single exercise](https://img.pdfslide.us/doc/110x75/60c117358c700c4b4b6fbc12/j21rinsyobyouri617635-640-gression-of-chronic-renal-disease-j-lab-clin-med.jpg)


![Simulation Based Optimization Strategy for Balancing ... · The layer thickness of the casting powder can be described by the equation according Hiraki [4] d 0.95 *v 0.95 [mm] cf](https://img.pdfslide.us/doc/110x75/5f37158eb28df25be42f9b43/simulation-based-optimization-strategy-for-balancing-the-layer-thickness-of.jpg)