Embed Size (px)
Citation preview

Improvement of Reverse Osmosis
Through.Pretr,eatment
by
J . R. Davis
M. K . Stenstrom
J . W . McCutchan
Water Resources Program
School of Engineering and Applied Science
UCLA
Draft issued October 1980
Final report issued July 1981

TABLE OF CONTENTS
Pa eList of Figures v
List of Tables vi
Acknowledgments viiAbstract viii
Chapter 1 Introduction
1
1.1 The Need for Wastewater Recyclein California 1
1.2 Current Reclamation Efforts 31.3 Project Objectives 4
Chapter 2 The Reverse Osmosis Configurations andOperating Characteristics
6
2 .1 The Status of Reverse Osmosis as aDesalination Alternative 6
2.2 The Three Common Membrane Configurations72.3 Membrane Flux 8
Chapter 3 Flux Decline Parameters
15
3 .1 Introduction 153 .2 Hydrolysis and Compaction 153 .3 Fouling of Membranes 16
3.3 .1 Dissolved Inorganic (Salts)173.3 .2 Dissolved Organics 183.3 .3 Colloidal Material 19
3.4 The Effect of Velocity on Fouling203.5 The Effectiveness of Chemical and
Mechanical Cleaning 21
Chapter 4 Pretreatment
24
4 .1 Economic Benefits of Pretreatment244 .2 Pretreatment Methods 264.3 Blending of Pretreated Water with
RO Product Water 284.4 Health Benefits of Pretreatment28
iii
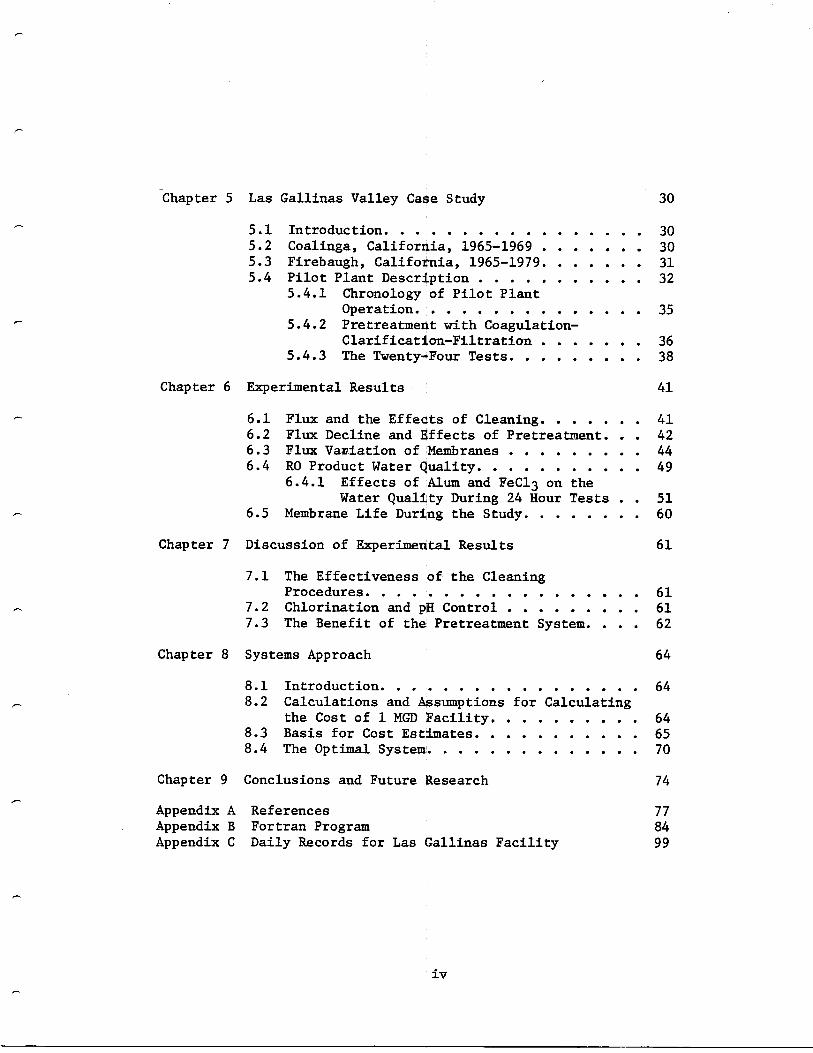
Chapter 5 Las Gallinas Valley Case Study
30
5.1 Introduction 305 .2 Coalinga, California, 1965-1969305 .3 Firebaugh, California, 1965-1979315.4 Pilot Plant Description 32
5.4 .1 Chronology of Pilot PlantOperation 35
5.4 .2 Pretreatment with Coagulation-Clarification-Filtration36
5 .4 .3 The Twenty-Four Tests38
Chapter 6 Experimental Results
41
6 .1 Flux and the Effects of Cleaning416.2 Flux Decline and Effects of Pretreatment . . . 426 .3 Flux Variation of Membranes446.4 RO Product Water Quality 49
6 .4 .1 Effects of Alum and FeC13 on theWater Quality During 24 Hour Tests
516.5 Membrane Life During the Study60
Chapter 7 Discussion of Experimental Results
61
7 .1 The Effectiveness of the CleaningProcedures 61
7.2 Chlorination and pH Control617.3 The Benefit of the Pretreatment System . . . . 62
Chapter 8 Systems Approach
64
8.1 Introduction 648.2 Calculations and Assumptions for Calculating
the Cost of 1 MGD Facility 648.3 Basis for Cost Estimates 658 .4 The Optimal System 70
Chapter 9 Conclusions and Future Research
74
Appendix A References 77Appendix B Fortran Program 84Appendix C Daily Records for Las Gallinas Facility
99
iv

LIST OF FIGURES
Figure Page
1 Cross-section of Tubular Membrane . 9
2 Product Flux versus Operating Pressure forDifferent Annealing Temperatures . 13
3 Membrane Permeability Coefficient versusElapsed Time for Differing Operating Pressures . .14
4 Pilot Plant Schematic . . 34
5 Membrane Fluxes Before and After Cleaningversus Time . 43
6 Flux From 24 Hour Tests . 45
7 Membrane Fluxes versus Number . 47
8 Membrane Fluxes versus Number . 48
9 Total Suspended Solids versus Time UsingFerric Chloride . 52
10 Turbidities versus Time Using Ferric Chloride . .53
11 TOC Versus Time Using Ferric Chloride . . . . . 54
12 TOD versus Time Using Ferric Chloride . . . . . 55
13 TSS versus Time Using Alum . . 56
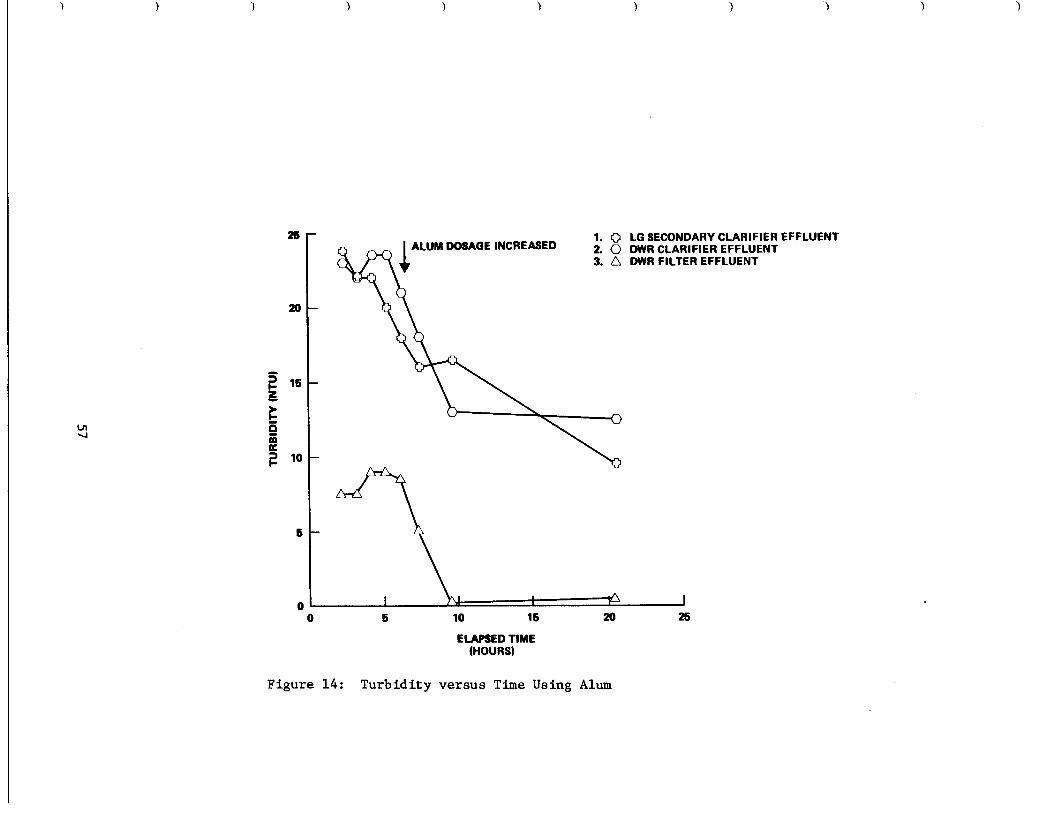
14 Turbidity versus Time Using Alum . 57
15 TOC versus Time Using Alum . 58
16 TOD versus Time Using Alum. 59

LIST OF TABLES
Table Page
1
RO Unit Specifications . 5
2
Comparison of Revere Osmosis Configurations . . . 10
3
Final Weekly Cleaning Procedure . 37
4
Chronological Summary of Pilot PlantOperation . . 39
5
Flux Decline Coefficients for VariousTypes Feed Waters . 46
6
RO Feed Water and Product Water Quality onMarch 19,1979 and September 17, 1979 . 50
7
Size Variables and Design Basis . 67
8
Cost Coefficients . 68
9
Sample Calculation . 69
10
Optimal Reclamation Plant Design . 72

ABSTRACT
This report describes the results of a four year pilot scale
investigation to desalt brackish wastewaters for reclamation and re-
cycle using reverse osmosis . The work described herein is only part
of large, continuing development program sponsored by the California
Department of Water Resources .
The work described herein was initiated in April of 1976 at the
Las Ga,llinas Valley Sanitary District, north of San Rafael, in'Marin
County, California . This site was selected due to the interest of two
local agencies, the Marin Municipal Water District, and the Las Gallinas
Valley Sanitary District . It was: also selected due to the anticipated
need for improved water resources in the county . Marin County was one
of the.most severely affected areas by the drought of 1976-77 .
A 10 GPM (0..63 1/sec).) reverse osmosis unit, using one-inch
diameter, tube-style, cellulose acetate membranes was assembled at the
site .._ The unit wa,s initially operated using trickling filter effluent .
The unit provided satisfactory effluent quality, but flux decline, due
to membrane scaling and fouling, was excessive .
To improve production rates., a Variety of types of treatment
techniques were used to pretreat the trickling filter effluent prior to
reyerse osmosis treatment . Rapid sand filtration, chemical precipitation,
flocculation, and clarification were, evaluated . Average recovery rates
were. increased from a low of 25% using trickling filter effluent directly,
tq over, 60%, using ferric chloride coagulation with
nd filtration.
viii

ACKNOWLEDGMENTS
The work reported herein was supported by the California
Department of Water Resources under contract number B53131 .
Throughout the study a number of'individuals helped or provided .I
valuable assistance . The authors are especially thankful to the
Marin Municipal Water District for providing assistance and to
Mr . Dave Johnson and Mr . Tom O'Haire who performed the daily
checking and data collection . The authors are thankful for the
assistance provided by the Las Galling Valley Sanitary DistrictJ
and Mr . Jim Fmanual and Mr . Gary'O'Reilly for their help and
cooperation . Mr . Roger Lindholmand Mr . Darrell Perkins of the
California Department of Water Resources were especially helpful
with administration and technical support of the project . Mr .
Jimmy Lopez, also of the California Department of Water Resources,
maintained the unit, helped withlconstruction, and provided needed
support, which is greatly appreciated . Mr . Steven Song, Mr . H .J .
Hwang, Mr . Adam Ng, and Mr . Matthew Sander of the UCLA Water
Resources Program helped with pilot plant construction and data
collection . Dr . John Dracup is acknowledged for his assistance
with the economics calculations .
vii

Three years of operating data gre presented in this .repgxt, long
with detailed descriptions of flux -maintenance, and cleaning techniques,
A mathematical analysis and model of',the process are presented which_
can be used to determine the economically optimal design for Municipal
waatewater-reclamation .

Chapter 1 : INTRODUCTION
1 .1 TheNeedfor Wastewater Recyple in California
Water is a scarce and valuable commodity in California due to the
arid nature of the region and the uneven distributions in water with
respect to both time and space . The northern one-third of the state
receives the bulk of the rainfall ; while most of the water demand is
from the heavily populated semi-arid south . Moreover, a great majority
of the state's rainfall comes during the winter months in contrast to
the heavy summer demands .
Thirdly, the yearly rainfall is highly unpredictable with drought
years of less than half the average rainfall interspersed with deluges
of double to triple average values . This heterogenous distribution of
water resources has resulted in the development of the world's largest
system of reservoirs and canals to store and transport water to meet
the state's temporal and spatial water demands . In spite of this highly
developed water resources management system, severe water shortages are
predicted before the year 2000, unless changes are made in the water-
use policy of the state's agricultural economy.
To understand the severity of the state's water problem it is
useful to review California water resources and water demand . Asano,
Ghirelli, and Wassermann (1979) hove compiled some useful statistics .
The total water demand in California in 1975, an average rainfall year,
was 35 .0 million acre-ft .(11 .4 trillion gallons), which was partially
supplied by a groundwater overdraft of 1 .8 million acre-ft . In the

drought year of 1977 the overdraft increased to 6 .2 million acre-ft .
and by the year 2000 it is anticipated to reach this level during
average rainfall years . A continued groundwater overdraft of this
magnitude would rapidly diminish the state's groundwater resources
and could not be maintained without drastic and unacceptable changes
in the environment .
This increasing pressure on limited water supplies has led to a
re-evaluation of excessive water use and wastewater disposal methods .
As the gap between supply and demand closes, communities foreseeing
water shortages are searching for ways of conserving and reusing
water instead of discarding it into a heavily regulated environment .
Municipal wastewater recycle can lead to improvements in the
environment and could significantly augment the state water supplies .
In 1975 approximately 3 .1 million acre-ft . (1 trillion gallons) of
municipal wastewater was produced, of which 68%, or 2 .1 million acre-
ft .(684 billion gallons) were discharged to saline water (Asano, et .
al ., 1979 ; Calif . Dept . of Water Res ., 1974) . Moreover, the quantity
of wastewater discharged to saline, water is anticipated to increase to
3 .7 million acre-ft . by the year 2000 . It has been estimated that
2 .5 million acre-ft . of this wastewater could be reclaimed and used
for beneficial purposes (Calif . Dept . of Water Res ., 1973 ; Calif . Dept .
of Health Serv ., 1979) . This could reduce the projected year 2000
shortfall by approximately 40% . Therefore, it is apparent that
wastewater recycling is an excellent source of additional water to
decrease the impact of the predicted water shortage .

1 .2 Current Reclamation Efforts
Though there are limitations, and uncertainties pertaining to the
direct reuse of treated wastewater for potable supplies, many
communities are already using recycled wastewater for landscape and
crop irrigation, industrial applications, and groundwater recharge
(OSW and Bureau of Rec ., 1972 ; Argo and Moutes, 1979, Flour, 1978) .
Presently there are several full scale wastewater recycling
projects in California. Prominent among these are the surface
spreading operations by the County Sanitation Districts of Los Angeles
(Asano, et . al ., 1979), and the direct injection program at Water
Factory 21 in Orange County (Argo .and Moutes, 1979) . During 1978 these
projects and several smaller ones recycled a total of 0 .184 million
acre-ft . of treated wastewater .
The majority of this reclaimed wastewater is produced by advanced,
technologically sophisticated, treatment plants, embodying the best
available treatment technology . For example, Water Factory 21 uses
high lime coagulation, ammonia stripping, recarbonation, carbon
adsorption, and reverse osmosis to treat activated sludge plant
effluent prior to injection . The need for such advanced treatment
arises from the potential public health hazards of partially treated
wastewaters .
There are other applications for recycled wastewaters where such
advanced treatment may not be required . For example, industrial reuse
for such applications as cooling tower make-up, irrigation of
agricultural and non-agricultural lands (freeway medians and borders,
parks, golf courses, etc .), and construction do not necessarily require
3

such advanced treatment . In many cases the total dissolved solids
(TDS) and bacterial quality (as measured by coliform counts) represent
the most challenging treatment objectives . Therefore, some type of
desalting and disinfection may be the only processes required to treat
municipal secondary effluent for recycle . Moreover, simpler, less
capital-intensive treatment plants will allow broader, more widespread
use of wastewater recycling, and will assist in meeting recycling
goals .
1 .3 Project Objectives
There have been numerous research projects investigating desalting
capabilities of reverse osmosis . The California Department of Water
Resources has recently sponsored investigations of desalting of
irrigation drainage water (Antoniuk and McCutchan, 1973 ; Speight and
McCutchan, 1979), for reuse and desalting ground water for potable
supplies (Johnson and Loeb, 1969 ; Johnson, McCutchan, and Bennion,
1969), and application of reverse osmosis for municipal wastewater
recycle (Wojcik, Lopez, and McCutchan, 1980) . Los Angeles County
investigated the application of the reverse osmosis process at their
Pomona Wastewater Plant (Chen and Miele, 1971, 1972) and a 5 mgd
spiral wound system was installed in Orange County, California
(Argo and Moutes, 1979) .
The investigation reported herein is an example of the use of
simplest technology to achieve recycling objectives . A three-year
study of a tubular reverse osmosis pilot plant is presented, with
associated plant experience and operating data . The pilot plant is a
4

portion of an ongoing study of reverse osmosis operation by the
California Department of Water Resources .
A description of the unit is given in Table 1 . A preliminary
report of the system performance has been given by Wojcik, Lopez, and
McCutchan (1979) . Cooper and Richard (1978) and Cooper, Richard,
Scarpace, and Straube (1977) have provided the results from studies
on the unit's effectiveness in removing bacteria and viruses .
This study sought to evaluate the pretreatment requirements and
the performance with trickling filter effluent on the feed . The RO
pilot system was initially operated with only cartridge filtration of
the feed water . From this system the pretreatment has evolved into
the current system which includes chemical clarification, filtration,
pH adjustment, and chlorination . During this development daily
records of the flow and salinities of the feed, product and brine
flows have provided documentation of improvements . These daily
records, special short term tests, and cost data from previous DWR
operation, (Wojeck et . al ., 1980), Oak Ridge National Laboratory
(1980) and the EPA (1979) have provided the basis for a system's
analysis to determine the economically optimal water reclamation
plant configuration .
5
Table 1 : RO Unit Specifications
Membrane Configuration TubularInternal Diameter .88 in .Material Cellulose AcetateAnnealing Temperature 88-900 CNumber of Tubes 160Operating Pressure 600 psiFeed Rate 6 .4 GPM

Chapter 2 : THE REVERSE OSMOSIS CONFIGURATIONS ANDOPERATING CHARACTERISTICS
2 .1 TheStatusofReverseOsmosisasaDesalination Alternative
The development of reverse osmosis as a process for desalinizing
water was begun in the early 1950Rs . The early membranes, many of them
organic substances (i .e ., animal bladders) and metallic compounds, were
not able to obtain economical fluxes while providing sufficient salt
rejection ability. It wasn't until the development of the asymetric
cellulose acetate membranes by Loeb and Sourirajian (1960), and the
subsequent improvements by Manjikian, Loeb, and McCutchan (1965), that
reverse osmosis became a viable desalination alternative . From these
beginnings the process has become', a ,major contributor to saline water
and wastewater reclamation .efforts .
Currently reverse osmosis is the most economical process for
reducing the dissolved solids in brackish waters and removing most
bacteria, heavy metals and viruses remaining after conventional waste-
water treatment (Glueckstern, 1979 ;Channabasappa, 1977 ; OSW and Bureau
of Rec .,1972, Goel and McCutchan, 1977) . The value of reverse osmosis
is evidenced by the increase in the number and capacity of reverse
osmosis (RO) systems . Between 1971 and 1976 the number of membrane
desalting plants (RO and electrodialysis) with capacity greater than
25,000 gallons per day (GPD) rose from 94 to 689 plants, and the total
installed capacity of membrane desalting plants increased from 23 MGD

in 1971 to 218 MGD in 1976 . Eighty-five percent of these new membrane
plants are reverse osmosis facilities (El-Ramby and Congdon, 1977) .
Fluor Corp . (1978) projected that the demand for output from membrane
plants desalting brackish water will be over 4 BGD in 1985, and by the
year 2000, almost 18 BGD .
2 .2 THE THREE COMMON MEMBRANE CONFIGURATIONS
From the original plate and frame design used by the early
researchers the membranes and their supports have evolved into three
commonly used configurations : spiral wound, hollow fibre, and tubular .
The choice of configuration is dependent upon the type of the water
being treated . The spiral wound and the hollow fibre require water
which is free from particulates (see Table 2) .
The spiral wound membrane configuration employs membranes which
form an envelope around a porous backing . The membranes are sealed
three edges with the open edge being glued to a plastic, perforated
collection tube . This envelope is then wrapped around the tube and
placed in a tubular pressure vessel . The feed water flows into the
vessel and between the wrappings of the membranes . The product (desalt-
ed) water passes through the membranes and into the plastic collection
tube which drains to collection tanks . The membranes normally come in
three foot modules containing about 230 square feet of membrane area .
The modules are connected in a combination serial and parallel arrange-
ment to increase the recovery rate (OSW and Bureau of Rec ., 1972) .
The hollow fine fibre configuration developed by DuPont and Dow
Chemical Corporations utilizes fibres with diameters of 25 to 250
7
on

microns (roughly comparable to the thickness of a human hair) . The
fibres have wall thicknessses of only 5 to 50 microns and are composed
of unsupported membrane material . These hollow fibres are placed in a
pressure vessel with the feed flowing external to the fibres . The
product passes into the fibres and flows countercurrent on the inside
to collection tubes . The small diameter of the fibres allows for a
high packing density and prevents the fibres from collapsing . De-
scriptions•of the spiral wound and hollow fibre configurations are
given in the Desalting Handbook for Planners (OSW and Burreau of Rec,
1972) .
Tubular membranes were utilized in this study . This configuration
(Fig . 1) has the cellulose acetate membrane annealed to the inside of
a porous membrane support which also functions as the pressure vessel .
The 0 .88 inch diameter, 10 foot long tubes are less prone to clogging
than the spiral wound or the hollow fibre configuration and provide a
configuration which is compatible with mechanical cleaning . Serial
arrangement of the membranes allows for adjusting the recovery ratio
(product flow/feed flow) . The disadvantages of the tubular membranes
are the large number of tubes required and the low packing density
(ft2/ft3) relative to the other two configurations . A comparison of
the three module configurations is given in Table 2, and a detailed
description of the tubular configuration is given by Loeb (1965) .
2 .3 Membrane Flux
The flux through the membrane is related to the initial permeabil-
ity and the rate of the flux decline . The initial permeability and
8

TUBE COUPLER
MALE COUPLING
2.64 an (1 in.) O.D. TITANIUMSUPPORT TUBE(0.089 an or 0 .035 In. wall)
CELLULOSE ACETATE MEMBRANE
PRODUCT WATER(PERMEATE)
3 WRAPS OF DACRON
PLASTIC COLLECTOR PIPE
0.159 an (0.0625 in.) DIA. HOLES
FIGURE 1 : REVERSE OSMOSIS TUBULAR SECTION

Table 2 : Comparison of Reverse Osmosis Module Configurations(After : OSW and Bureau of Rec ., 1972)
7
Spiral Wound Tubular Hollow Fine Fibre
Membrane Surface Area per Volume, ft 2/ft 3Product Water Flux, gfdTypical Module Factors
100 - 3008 - 25
40 - 1008 - 25
5,000 - 10,0000 .1 - 2
Brine Velocity, ft/sec . 0 .7 1 .5 0 .04Brine Channel Diameter, in . 0 .005 0 .5 0 .004
Method of Membrane Replacement As a membrane module As tubes, on site As entire pressure-assembly - on site moduleon site, moduli
Membrane Replacement Labor Medium Highreturned to factoryMedium, requires
High Pressure Limitation Membrane compaction Membrane compact .equipment
Fibre collapsePressure Drop, Product Water Side Medium Low HighPressure Drop, Feed to Brine Exit Medium High LowConcentration Polarization Problem Medium High LowMembrane Cleaning - Mechanical No Yes No
- Chemical Yes - pH and solvent Yes - pH and Yes - less restricted
Permissible Feed Ranges, ghlimited5 .5 - 7 .5
solvent limited5 .5 - 7 .5 2 - 10
Permissible Temperature, F 100 100 100

salt rejection capabilities of the cellulose acetate membranes are
determined by the manufacturing process and the operating pressure .
Utilizing the Manjikian(1965), formulation for the membranes, the
permeability can be changed by varying the annealing temperature . A
higher annealling temperature yields a membrane with smaller pores .
These smaller pores result in lower water permeability and higher salt
rejection ability . Johnson, et .al ., (1969) found empirically that a
one degree centigrade increase in the annealing temperature decreases
the permeation by about 1 .5% . There is also a corresponding decrease
in salt flow through the membrane . The optimal combination of membrane
flux and salt rejection ability results with annealing temperatures
between 86° and 93° Centigrade (Go le1 and McCutchan, 1977) . Within
normal temperature ranges an increase in operating temperature results
in an increase in the permeability, .
The initial flux across a membrane is also a function of the
permeability and the change in pressure across the membrane . The
simplest mathematical formulation to describe flux decline was pre-
sented by Rosenfeld and Loeb (1967) with flux as a function of the
membrane permeability coefficient ;(A) and the differences in the
osmotic and mechanical pressures across the membrane :
F1 = A UP -Air)
(1)
in which AP is the pressure difference across the membrane, and ATris
the osmotic pressure difference across the membrane .
The salt flux is given by :
F2 = BLC
(2)
in which B is the membrane permeability coefficient for salt, and AC

the concentration difference across the membrane .
These equations were utilized in the work by Goel and McCutchan
(1971, 1977) and Antoniuk and McCutchan (1973) . Though not as
theoretically comprehensive as those derived by Merten (1966),
Speigler and Kedem (1966), or Sourirajan and Ohya (1977), they are
adequate for low permeability membranes (Goel and McCutchan, 1977) . The
relationship of the intrinsic flux to annealing temperature and operat-
ing pressure are shown in Figures : 2 and 3 (pages 13 - 14) .
12

x
w
50
Tap Water Feed (250 ppm)
Feed Flow Rate H qpm
i200
13
i400
L-1600
800
,....Operating Pressure (psig)
Figure 2 ; Product Flux versus Operating Pressure for DifferentAnnealing Temperatures
(from Goel and McCutchan, 1977)

1 1 I
ELAPSED TIME (HOURS)Figure 3 : Membrane Permeability Coefficient vs . Elapsed Time for Five Operating Pressures .
(from Goel and McCutchan, 1977 ; based upon data of Merten, et . al .,1967)

,-
Chapter .3: FLUX DECLINE PARAMETERS
3 .1 Introduction
Reverse osmosis systems normally experience a severe drop in the
product water flux during operation, especially during the first 20
hours after installation or cleaning . This is followed by a more
gradual decline for the next 200 - 300 hours . Often at this point a
severe drop in the flux may again occur (Thomas, et . al .,1973) . These
flux declines result in systems operating well below the intrinsic rate .
The causes of these flux changes are related to three general processes ;
hydrolysis, compaction, and fouling . Establishing the causes, and
designing systems which minimize the rate and effects of flux decline
are major goals . of reverse osmosis researchers .
3 .2 Hydrolysis and Compaction
Hydrolysis of cellulose acetate membranes constitutes permanent
damage to the membranes and results in an increase in both the water
and salt flux through the membrane . The rate of hydrolysis is
sensitive to the water chemistry, especially the chlorine residual .
The chlorine reacts with the cellulose acetate causing hydrolysis, and
since chlorine is normally used for control of organics care must be
excercised in maintaining the residual of less than 1 .0 ppm
15

r- .
r
(Channabasappa, 1977 ; Winfield, 1979a).
The rate of hydrolysis is also dependent upon the pH of the
feedwater . The cellulose acetate membranes deteriorate rapidly
when the pH is extremely acidic or basic . For maximum membrane life the
pH needs to be maintained between 5 .0 and 8 .0 (Richard and Cooper, 1975 ;
Winfield, 1979b) .
Compaction occurs when membranes are subjected to high pressures .
The structure is compressed resulting in a loss of product water flux .
This compaction of the membranes results in a decrease in flux, but
little change in the salt rejecting ability of the membranes . Though
compaction is normally not as significant as fouling in reducing mem
brane flux, it is common to all membranes . The significance of
compaction will vary with membrane formulation, operating pressure, and
annealing temperature (Feuerstein and Bursztynsky, 1971 ; Kimura and
Nakao, 1975 ; Pusch and Mossa, 1978; Goel and McCutchan, 1977) . A
general rule is that compaction effects increase with increases in the
initial flux . The effects of compaction are usually significant only
during the first 24 hours after the unit has been pressurized
(Belfort, Babriella, and Marx, 1976) .
3 .3 Fouling of the membranes
Fouling occurs when substances or organisms in the feed wastewater
become attached to the membrane surface or clog the membrane pores .
The result is a decrease in the flux and usually an increase in salt
rejection . Fouling of reverse osmosis membranes is the most significant
cause of flux decline .
16

r
Reverse osmosis was orginally!designed for use in seawater desal-
ination where precipitation of salts onto the membranes was the
determinant of maximum recoveries, The dissolved salts in the seawater
quickly reach saturation as recovery increases and precipitate ants the
membranes . With municipal wastewater as feed, much higher recovery
ratios are possible without salt precipitation. As the recovery rates
increase,the levels of organic and colloidal contaminants increase and
become more significant .
Belfort, et . al .(1976) divided the foulants into three
categories :
1) dissolved inorganics - precipitates (CaSO4 , CaCO3 , Mg(OH) 2 ,
Fe (OH) 3 )
2) dissolved organics - humies, biological slimes and dissolved
macromolecules, and
3) colloidal material .
3 .3 .1 Dissolved inorganics (salt)
Precipitation problems are common with seawater desalination,and
for brackish waters where the solubility limits of various salts
(especially CaSO 4) are exceeded due to brine concentration and the
effects of concentration polarization .
To establish the maximum recovery and optimize the operating
parameters the ratio of the concentration at the membrane wall to that
of the bulk solution must by computed . This ratio is called the
concentration polarization ratio . The concentration polarization
ratio is an indicator of the tendency for salts to accumulate at the
17

membrane surfaces .
Rosenfeld-and Loeb (1967) used the equations of Brian (1965) to
develop the following relationship between the concentration of a
solution constituent at the membrane wall (Cw) and the bulk solution
(Cb ) . The concentration polarization ratio is defined as follows :
- = D + ( i - D1 )
exp( F,Nwc0 .67)
(3)b
r
r
V jd
in which Dr is the ratio of the blink brine concentration (C d) to the
product concentration (C p), F1 is the product flux, Nsc is the
dimensionless Schmidt number for :salt diffusion (kinematic viscosity/
diffusivity coefficient), Ub is the bulk brine velocity, jd is the
Chilton-Coburn mass transfer factor which is equivalent to .023NRe-0 .17
(Re = Ubd/u) .
3 .3.2 Dissolved Organics
Though removal of organics is one of the functions of RO, the
dissolved organics can cause severe damage to the cellulose acetate
membranes if they are not controlled . The organics in the wastewater
will not only attach to the membranes and decrease permeability, but
will attack the cellulose acetate resulting in physical deterioration
of the membrane . To mitigate the effects of these dissolved organics,
the water can be treated for their removal and/or, as is more
frequently done, the influent stream can be chlorinated .
Unfortunately, as mentioned earlier, chlorine will cause membrane
hydrolysis . Richard and Cooper (1975) studied the effects of
chlorination on the microfauna of the membranes and concluded that a
18.

chlorine residual of 0 .1 - 0 .2 mg/l was effective at preventing bact-
erial attack on the membranes while not causing detectable damage to
the membranes . A residual chlorine concentration of 1 ppm was set
the maximum by Goel and McCutchan!(1977) . Winfield (1979a) was able
to find a high correlation between the dissolved organics (as measured
by UV absorbance at 270 0 ) and the ,flux decline . Winfield's work
illustrates the importance of dissolved organics and the need for some
form of disinfection in the pretreatment of the RO feed .
3 .3 .3 Colloidal Material
Colloidal material is present in all wastewaters even after
conventional treatment and are readily removed by the reverse osmosis
process . As the product water flotwsthrough the tubes the colloidal
concentrations increase due to increased brine concentration and the
concentration polarization . As these colloidal particles and the salts
become concentrated the negative charges surrounding the colloidal
particles are compressed due to the increased salts concentration .
The colloidal material may then aggregate and become attached to the
membranes, resulting in a loss of flux (Brunelle, 1980) .
Bevege, et . al . (1973) did research in which they were able to
correlate the precipitation on the membranes with the streaming
potential of the brine . Jackson and Landolt (1972), however, found
that the fouling effects of Fe(OH)3 were minimized at the isoelectric
point, apparently because of the increased shear force upon the larger
floc produced . This apparent conflict may be due to differences in
feedwater characteristics and variation in operating parameters . It is
1 9

indicative of the complex relationships which exist in reverse osmosis
operations .
When turbidity is used as an indicator of the suspended solids
concentration, a correlation with the flux decline has been noted by
several authors . Feuerstein and Burstynski (1971) found the flux and
turbidity could be related by :
A = 0 .708AoTf -0 .379
(4)
where A is the expected product water flux coefficient . AO is the
flux coefficient for a pure saline solution of comparable osmotic
pressure and Tf is the turbidity (NTU) of the brine . Belfort (1976)
also experimentally observed the dependence of flux upon turbidity as
did Cruver and Nusbaum (1974) .
3 .4 The Effect of Velocity on Fouling
The concentration polarization relationship indicates the role of
velocity in preventing severe flux decline . As the velocity of the
brine increases, the ratio, Cw/cb, approaches unity . The velocity
appears to be one of the most critical of design parameters (Boari, et .
al ., 1978) .
The importance of velocity in controlling the flux decline in
RO modules was investigated by Thomas, e t .al . (1973) . In his study of
the flux declines encountered with tubular membranes treating primary
sewage, a "critical velocity" could be determined below which flux
declines were more severe . This critical velocity is dependent upon
the particle size and the axial velocity . When velocities greater
than the critical velocity were used, the flux decline parameter
2 0

(b = clog flux/ Olog time) was generally between 0 .045 and .14 while
at velocities below this critical velocity the value ranged from 0 .3
to .016 . For primary sewage a marked improvement in performance was
found with velocity greater than
Vc = (1 .3 + 0 .6)*(S1)
21
(5)
when SI is the initial flux of the membrane . The relationship of
velocity and flux decline was much weaker during the first 20 hours
after cleaning when rapid flux declines are common .
The relationship of velocity and flux decline were noted by
Belfort, e t .al . (1976) using artificially prepared wastewaters, and
further supported by Boari, et .al . (1978), Sach and Zisner (1977),
Jackson and Landolt (1972) .
Kimura, et .al . (1975) were able to show that the velocity of the
brine is more crucial than the annealing temperature of the membranes
for long run times . The flux decline curves of membranes annealed at
varying temperature will merge . When they tested membranes with
differing initial fluxes, they found that the fluxes nearly converged
after 150-200 hours operation . . The final flux varied with the
velocity . Nusbaum (1972), Sach and,Zisner (1977), Boari, et .al .
1978), and Jackson and Landolt (1972) have also verified the dependency
of flux upon velocity .
3 .5 The Effectiveness of Chemical and Mechanical Cleaning
Maintenance of adequate flux rates through the membranes requires
periodic cleaning . Various techniques have been developed for
removing the scaling and fouling which have been deposited upon the
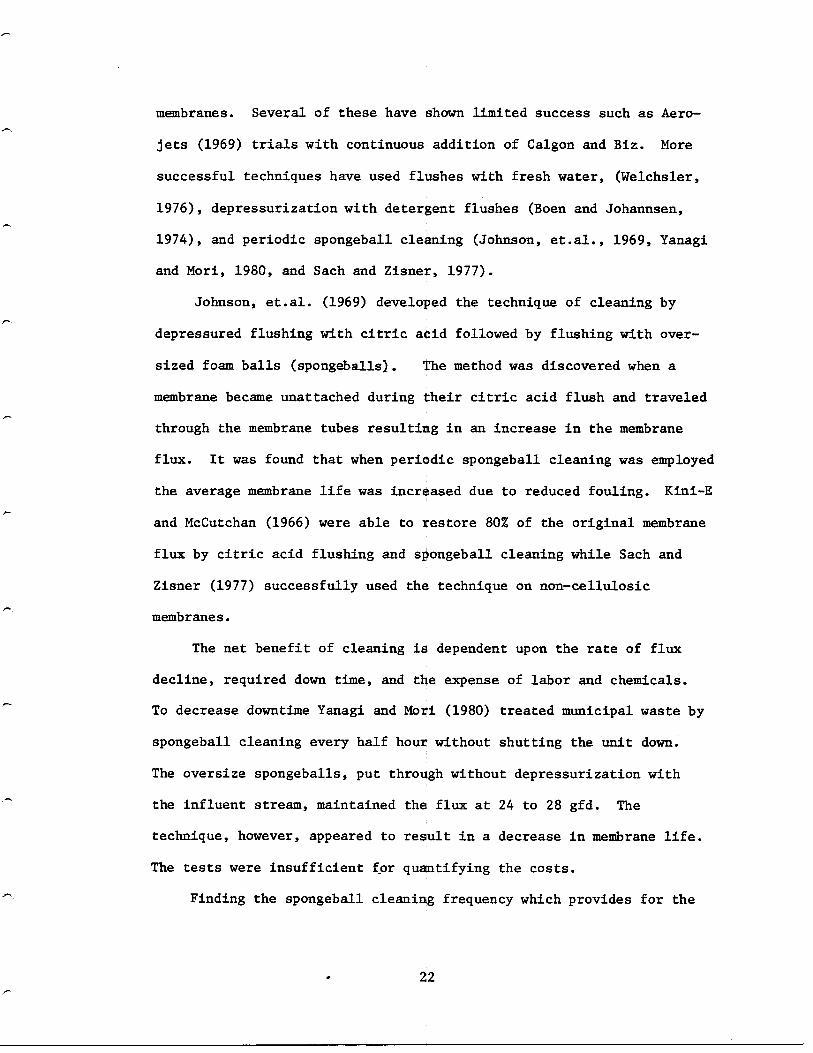
membranes . Several of these have shown limited success such as Aero-
jets (1969) trials with continuous addition of Calgon and Biz. . More
successful techniques have used flushes with fresh water, (Welchsler,
1976), depressurization with detergent flushes (Boen and Johannsen,
1974), and periodic spongeball cleaning (Johnson, et .al ., 1969, Yanagi
and Mori, 1980, and Sach and Zisner, 1977) .
Johnson, et .al . (1969) developed the technique of cleaning by
depressured flushing with citric acid followed by flushing with over-
sized foam balls (spongeballs) . The method was discovered when a
membrane became unattached during their citric acid flush and traveled
through the membrane tubes resulting in an increase in the membrane
flux . It was found that when periodic spongeball cleaning was employed
the average membrane life was increased due to reduced fouling . Kini-E
and McCutchan (1966) were able to restore 80% of the original membrane
flux by citric acid flushing and spongeball cleaning while Sach and
Zisner (1977) successfully used the technique on non-cellulosic
membranes .
The net benefit of cleaning is dependent upon the rate of flux
decline, required down time, and the expense of labor and chemicals .
To decrease downtime Yanagi and Mori (1980) treated municipal waste by
spongeball cleaning every half hour without shutting the unit down .
The oversize spongeballs, put through without depressurization with
the influent stream, maintained the flux at 24 to 28 gfd . The
technique, however, appeared to result in a decrease in membrane life .
The tests were insufficient for quantifying the costs .
Finding the spongeball cleaning frequency which provides for the
22

optimal trade-off between flux and membrane life will require long
term experimentation, and is a subject of future research .
2 3

Chapter 4 : PRETREATMENT
4 .1 Economic Benefits of Pretreatment
All reverse osmosis feedwater receives some form of preparatory
treatment before entering the unit . The level of preparation varies
from screening of particulates to elaborate tertiary treatment schemes .
Increased pretreatment results in benefits due to reduced RO
capital investment and savings in the operation and maintenance cost
of the reverse osmosis plant . Pretreatment of the reverse osmosis
feedwater results in the following benefits :
1 . The reduced organic concentrations result in a reduced
fouling rate and therefore, maintenance of higher flux
and lower energy usage ;
2 . The membranes will last longer due to the lessened bac-
terial attachment and lessened abrasion by particulates ;
3 . Removal or control of precipitating salts will decrease
the scaling and increase the potential recovery rate .
4 .1 .2 Increased Flux and Decrease4 Energy Usage
The increase in flux due to the decrease in fouling not only
reduces membrane area requirements, but also results in energy savings .
Due to the high pressure involved, the energy costs for pumping water
through a reverse osmosis system tends to be a major portion of the
operating expenses of the plant (up to 50%) . The amount of energy
24
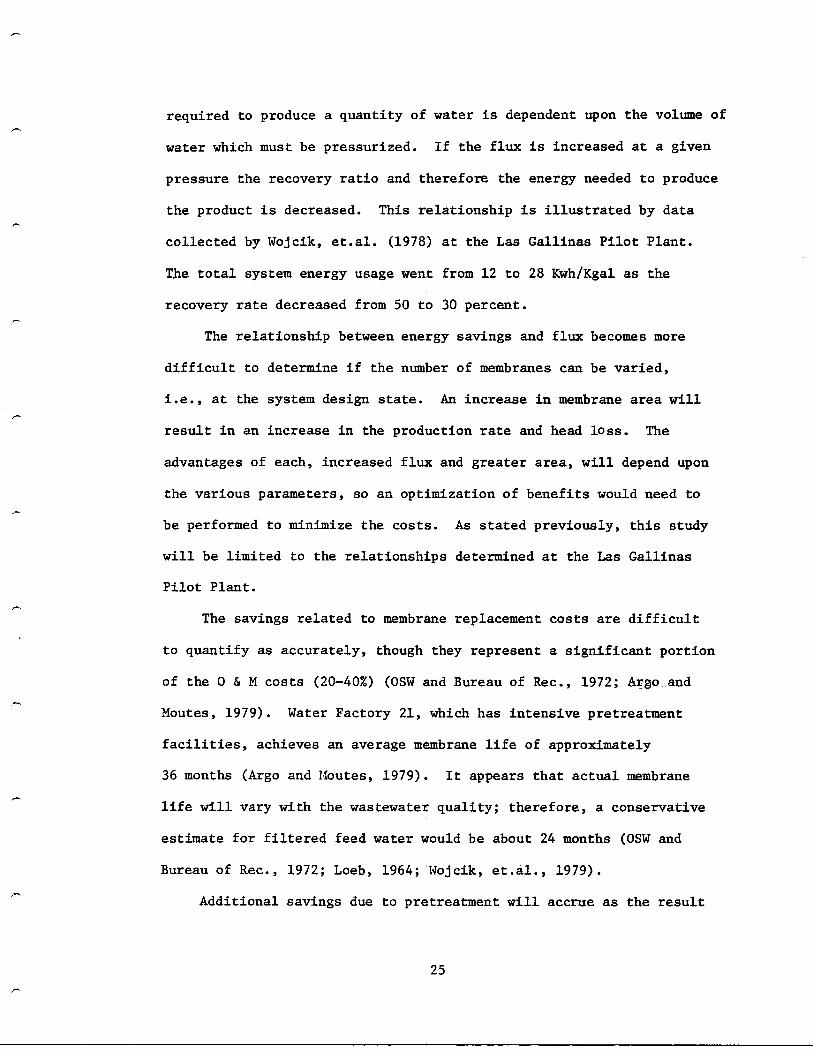
required to produce a quantity of water is dependent upon the volume of
water which must be pressurized . If the flux is increased at a given
pressure the recovery ratio and therefore the energy needed to produce
the product is decreased . This relationship is illustrated by data
collected by Wojcik, et .al . (1978) at the Las Gallinas Pilot Plant .
The total system energy usage went from 12 to 28 Kwh/Kgal as the
recovery rate decreased from 50 to 30 percent .
The relationship between energy savings and flux becomes more
difficult to determine if the number of membranes can be varied,
i .e ., at the system design state . An increase in membrane area will
result in an increase in the production rate and head loss . The
advantages of each, increased flux and greater area, will depend upon
the various parameters, so an optimization of benefits would need to
be performed to minimize the costs . As stated previously, this study
will be limited to the relationships determined at the Las Gallinas
Pilot Plant .
The savings related to membrane replacement costs are difficult
to quantify as accurately, though they represent a significant portion
of the 0 & M costs (20-40%) (OSW and Bureau of Rec ., 1972 ;Argo .and
Moutes, 1979) . Water Factory 21, which has intensive pretreatment
facilities, achieves an average membrane life of approximately
36 months (Argo and Moutes, 1979) . It appears that actual membrane
life will vary with the wastewater quality ; therefore, a conservative
estimate for filtered feed water would be about 24 months (OSW and
Bureau of Rec ., 1972 ; Loeb, 1964 ; Wojcik, et .al ., 1979) .
Additional savings due to pretreatment will accrue as the result
25

of reduction in the chemical requirements for adjusting the pH of the
feed water . Acidic coagulants reduce the sulfuric acid required by
reducing the pH and decreasing the buffering capacity .
4 .2 Pretreatment Methods
Several researchers have attempted to operate the tubular
reverse osmosis systems using primary treated wastewater for the feed .
The RO system has demonstrated that it is capable of treating solids
laden wastewater, butother problems result such as more severe flux
declines, shorter life of membranes-apd - pumping equipment, and higher
critical velocities (Feuerstein and Bursztynsky, 1971 ; Chen and Miele,
1972 ; Thomas, et .al . 1973 ; Sach and Zisner, 1977) . Thus, though the
tubular unit is capable of treating primary wastewater, it is normally
economically advantageous to include additional feedwater treatment
(due to the relatively high costs of RO operation) .
Secondary treatment reduces the organic and solids loading to the
unit . The result is a lowering of the critical velocity (Thomas,
et .al ., 1973) or an increase in the average flux (Feuerstein and
Bursztynsky, 1971) . Some research has been done on the effects of
different types of secondary treatment processes (Anderson and Mills,
1977 ; Boen and Johannsen, 1974 ; Feuerstein and Bursztynsky, 1970) .
Where salt precipitation is a problem lime-soda precipitation and/or
ion exchange will be advantageous, but for municipal wastes colloidal
and organic material often cause more severe problems, and their
reduction is more crucial .
The simplest form of pretreatment is the use of cartridge filters
26

preceding the RO module to remove particles which may damage the
membranes . However, sensitivity of flux to cartridge filtration with
pore sizes between 5 and 50 microns appears to be small . Johnson and
Loeb '(1966) and Winfield (1979) found little correlation between the
flux decline when the pore size was varied within this range . The
benefit of cartridge filtration appeared to be limited to the protec-n
tion of equipment from large particulates .
More effective removal of colloidal material can be achieved by
using conventional tertiary processes such as, coagulation-settling-
filtration, coagulation-filtration, activated carbon treatments or a
combination of these processes .
Granular activated carbon adsorption (GAC) preceded by filtration
has proven to be the more effective pretreatment for increasing flux
through the membranes, but is is also relatively expensive . The GAC
pretreatment is being utilized at Water Factory 21 in Orange County,
California, where the high quality GAC effluent can be blended with RO
product before being injected into the groundwater aquifer (Argo &
P1outes, 1979) .
Though sand filtration has been found only marginally useful
in reducing the flux decline, alum coagulation followed by sand
filtration has also been found to be effective at decreasing the flux
decline (Feuerstein and Bursztynsky, 1971 ; Boen and Johannsen ; Aero-
jet, 1969) . Nusbaum (1972) found that the mixed media filtration
could replace the GAC as a pretreatment for secondary effluent with
little loss of flux, and Channabasappa (1975) recommended coagulation/
settling followed by sand filtration in order to decrease the loss of
2 7

flux . The findings do favor some form of pretreatment and it is the
purpose of this research to compare pretreatment alternatives, and
determine their relative benefit .
4 .3 Blending of Pretreated Water With The RO Product Water
For many applications of recycled water the quality of the
reverse osmosis product is better than that demanded by users . The
blending of secondary effluent which has been coagulated and filtered
with the RO product can produce water of sufficient quality at a
significantly reduced price, due to the lower costs of operating the
coagulation-filtration process . The economics of this blending are
dependent upon the use of product water and the TDS of the feedwater .
For example, if the TDS of RO feedwater (filter effluent) is 3000 ppm,
there is little opportunity for savings ; a blend of 1 :1 will have a
TDS of about 1600-1700, but if the influent has a low TDS (i .e ., 1000-
1500) the higher blending ratios. can decrease water costs by 10% to
40% depending upon the product requirements . This use of blending not
only reduces costs, but allows some flexibility in meeting varying
water quality requirements .
4 .4 Health Benefits of Pretreatment
While this report concentrates upon the direct benefits of
pretreatment in terms of capital and operating reductions which are
related to the production of the reverse osmosis effluent, there are
other important benefits of pretreatment which will have varying value
depending upon product water use . Many of these benefits are difficult
28

to evaluate but will become increasingly important in the future .
Health effects will become increasingly important as reclaimed
wastewaters are used to augment the potable supplies . When wastewater
is chlorinated, the chlorine reacts with the organic constituents in
the water to form low molecular weight carcinogenic substances .
Reverse osmosis is relatively ineffective at removing these by-products
from the influent stream (Cooper and Richard, 1978) ; thus, any reduc-
tion in the concentration of organic compounds in the feed water should
result in a decrease in the level of carcinogens in the product . The
addition of coagulation/filtration or granular activated carbon
adsorption effectively lowers the organic content and thereby the
production of the organic by-products of chlorination .
Evaluation of this benefit would be dependent upon the use of
the water ; since the length of time before use, the amount of mixing
with other waters, and possible filtering in groundwater basins are
all factors in determining the health risks . A discussion of the
potential health effects of these by-products is given by Page, et .al .,
(1979) .
2 9

,Chapter 5 : LAS GALLINAS VALLEY CASE STUDY
5 :1 Introduction
The Las Gallinas Pilot Plant Study is the latest of a series of
UCLA research on the operations of tubular cellular acetate membranes .
In this chapter studies involving brackish water desalting will be
discussed briefly before a detailed analysis of the Las Gallinas
Operations .
5 .2 Coalinga, California 1965-1969
The development of high flux cellulose acetate membranes which
retained a high salt rejection capacity by Loeb and Sourirajan (1960),
and then improved by Manjikian, et . al . (1965), encouraged the UCLA
researchers to test the membranes in a pilot scale desalination effort
at Coalinga, California . The Coalinga groundwater supply contains
2500 ppm of salt . The reverse osmosis system was installed to provide
desalted water to augment the city's potable supply . During the three
and a half years of operation the most serious problem encountered was
the decline in flux resulting from fouling of the reverse osmosis
membranes . Subsequent analysis of membrane foulants showed Fe(OH)3
to be the major constituent in the fouling material. The attempts at
reducing this loss of flux met with some success .
The addition of cobalt catalized sodium sulfite, which prevented
the oxidation of the iron by removing the oxygen from the feed,
30

improved performance. Chlorine injection, which oxidizes iron but
inhibits the growth of bacteria upon the membranes resulted in
less flux decline, (Loeb and Johnson, 1966) .
5. .3 Firebaugh, California 1971-1979
The Interagency Wastewater Treatment Center at Firebaugh,
California, has been concerned with the salinity increases in ground-
water and soil due to irrigation water which permeates through the top
soil, accumulating dissolved solids and then depositing these salts at
a less permeable layer below . The resulting build-up of salts in the
subsoil, if unattenuated, endangers agricultural production .
The Firebaugh, California, study was initiated by the California
Department of Water Resources and UCLA in 1971 to ascertain the
effectiveness of reverse osmosis in reducing the TDS of irrigation
drainage for reuse .
The system contained 180 membranes and operated at 400 psi with
an influent flow rate of approximately 6 gpm. The unit experienced
severe fouling problems due to membrane scaling and the average
recovery was only 33% . Addition of sodium hexametaphosphate (SHMP)
improved performance, but scaling was still a problem .
Besides the low recovery the membranes also experienced physical
deterioration . Deterioration of the membranes noted after 25 days of
operation was attributed to bacterial growth in membrane areas which
were not subject to a significant . flux (i .e ., at the flange ends where
the couplings prevented flux), and chlorine addition to 1 ppm residual
was initiated (Antoniuk and McCutchan, 1973) . Still after 99 days of
31

operation the tests were temporarily discontinued because of the
excessive membrane deterioration; whether this was caused by the
initial bacteria growth in areas protected from chlorine disinfection
(Antoniuk and McCutchan, 1973) or by the attack upon the membranes by
the chlorine as conjectured by Loeb and Johnson (1966) is not evident .
The deterioration in evidence before chlorination favors a bacterial
hypothesis .
5 .4 Pilot Plant Description
In 1975 the UCLA Engineering Systems Department, with the
sponsorship and support of the California Department of Water
Resources, and in cooperation with the Las Gallinas Valley Sanitary
District and Marin Municipal Water District, started the operation
of a 160 tube reverse osmosis pilot plant at the Las Gallinas facility
in Marin County, California . The purpose of the project was to
investigate the application of reverse osmosis in reclamation of
municipal wastewater .
The pilot plant is located at the Las Gallinas Valley Sanitary
district north of San Rafael, in Marin County, California . The
sanitary district operates a secondary treatment facility using two
stage trickling filters and clarification . The total plant flow
consists almost entirely of municipal wastewater, augmented with
heavy rainfall runoff from November to March . The flow rate ranges
from 1 .5 MGD ( .065m3/sec) to as high as 10 MGD ( .44 M3/sec) depending
upon the season and weather, with the trickling filters loaded at
approximately 11 MGD/acre (1 .17 x 10-4 m3/m2-sec) and 84 lbBOD5 /1000
3 2

ft3 (1 .35 kg BOD5/m3) of media.
The RO pilot plant is composed of 160, ten foot (3 .05 m) long
tubes, with an internal membrane diameter of 0 .88 inches (2 .23 cm) .
Each membrane has an effective area approximately 2 .24 ft2 (2 .08 m2 ) .
Cellulose acetate membranes are used exclusively and are made by pilot
plant operators using Eastman cellulose acetate formulation E-400-25,
with membrane curing temperatures of 88-900C . The total membrane area
of the unit is 358 ft 2(33 .3 m2) . Figure 1 is a schematic diagram of
a typical membrane ; the membrane casting procedure and construction
techniques are no different than those used in earlier studies at
U.C .L .A . (Johnson, et .al ., 1969 ; McCutchan and Goel, 1974 ; Goel and
McCutchan, 1977, Speight and McCutchan, 1979) and are similar to
the original membranes reported by Manjikian, et .al ., (1965) . The
membranes are cast at the Department of Water Resources Firebaugh
Facility .
The membranes are all arranged in a series, single stage
configuration. A triplex positive displacement pump is used to pump
feed water and can be operated over a range of 200 to 800 PSIG with
flow rates ranging from 2 to 12 GPM (0 .13 to 0 .75 1/sec) . The work
reported herein was all performed at 600 PSIG (40 .8 atmospheres) and
the feedwater flow rate was normally 6 .4 GPM ( .404 1/sec) providing
an inlet Reynolds number of approximately 23,000 and an inlet velocity
of approximately 3 .4 ft/s(l .05 m/s) . The unit was also equipped with
automatic flow reversal valves and spongeball cleaning facilities . A
schematic is shown in Figure 4 .
33

1
)
)
1
)
)
)
)
Lo4-
Figure 4 : Plant Schematic
1. LGSVD SECONDARY EFFLUENT2. CLARIFIER INFLUENT3. DIRECT FILTRATION BYPASS VALVE4. CLARIFIER EFFLUENT6. SLUDGE TO DISPOSALS. MIXED-MEDIA FILTER INFLUENT7. FILTER EFFLUENTS. RO INFLUENT9. BRINE TO DISPOSAL10. RO PRODUCT WATER11. CHEMICAL ADDITION POINT12. FILTER SURFACE WASH AND BACKWASH13. BACKWASH TO DISPOSAL14. CHLORIDE INJECTION POINT15. ACID INJECTION
RO UNIT
11
MIXEDMEDIAFILTER10.81 m dis.)
2
FLOWREVERSEVALVE
13
HIGHPRESSUREPUMP
30 MICRON FILTER TO PROTECT PUMP
15
14
7D-
a
RO FEEDWATERSTORAGE
(7.8 m3 )
BACKWASH ANDRO FEEDWATERSTORAGE(3.21 m3)

5 .4 .1 ChronologyofROPlant Operation
The RO pilot plant was originally placed in operation in April
of 1976 treating trickling filter effluent which was filtered through
a 30" diameter multi-media filter . This filter, besides providing
feed for the RO unit, was operated by the Marin Municipal Water
District (MMWD) to provide water for recycle . Subsequently MMWD
installed a second filter to increase their recycling effort . The
RO unit operated on filtered trickling filter effluent from the MMWD
filters until May of 1979 when a smaller 24" diameter mixed-media
filter was installed and dedicated to pretreatment of RO feedwater .
No coagulating chemicals were used until May of 1979 . The reclaimed
water from the MMWD filters was used from 1976 through the drought
of 1977 and continues until the present ; the Marin Municipal Water
District should be consulted for further information regarding their
work .
This initial period from April 1976 to June 1979 was devoted
to the development of membrane cleaning techniques and endurance
testing of the RO membranes and equipment . The original cleaning
technique was restricted to spongeball cleaning without chemical
cleaning agents . During cleaning the unit was always depressurized
and flushed with tap water or RO product water (later containing
cleaning chemicals) . Beginning in April of 1977 a two hour enzyme
detergent flush was initiated . In June of 1977 the detergent flush
was stopped and a citric acid flush was begun . Combinations of
cleaning techniques were evaluated until March 1978, when a final
cleaning procedure, consisting of one hour flushes with citric acid
35

and detergent followed by spongeball cleaning, was developed . Table 3
is a summary of the final cleaning procedure .
In March, 1978, chlorination of RO feedwater was begun and in
May of 1978 pH control of feed water was started . Operation continued
in this fashion until June, 1979, when improved pretreatment
facilities were placed in operation .
5 .4 .2 Pretreatment with Coagulation-Clarification-Filtration
The current phase of UCLA participation at Las Gallinas began
in December of 1978 with Zeta Potential determinations and jar tests
to determine the efficiency of various coagulants . Tests were
conducted using alum, ferric chloride, and various organic polymers .
From these initial tests the alum, FeCl 3 and Nalco 7134 cationic
polymer were selected for system testing .
From June 1979 until July 1979 feedwater was pretreated using
direct filtration with cationic organic polymer (Nalco 7134) . In July,
1979 a 5 .5 ft . (1 .7 m) diameter clarifier was installed and inorganic
coagulants were used . The mixed-media filter was operated at 3 .2
GPM/ft2 (2 .17 1/m2 sec) filtration rate and backwashed at 18-20
GPM/ft2 (10 .2-13 .6 1/m2 sec) after a two minute surface wash .
Backwashing was performed automatically on a timed cycle . Usually
backwashes were performed every 12 hours . The filter was operated at
the 3 .2 GPM/ft2 (2 .17 1/m2 sec) rate independently of the RO feed
rate and excess water was discharged with the Las Gallinas Valley
Sanitary Districts Effluent . The filter media used was a commercially
available media (Neptune Microfloc) consisting of 1 .0 to 1 .2 mm size
36

Table 3 :Final Weekly Cleaning Procedure
Operation
Procedure
Citric Acid Flush 0 .55 lbs (250 grams) of citric acid is added to
50 gallons (190 liters) of tap water or RO product
water at ambient temperature . This solution is
circulated through the RO unit at approximately
5 GPM (0 .315 1/sec) for one hour .
1 .10 lbs (500 grams) of a commercially available
detergent (Biz) is added to 50 gallons (190 liters)
of tap water at ambient temperature and circulated
through the RO unit as before for one hour .
After completion of chemical cleaning, ten 1 1/2"
(3 .8 cm) spongeballs are introduced into the RO
feed at approximately one minute intervals, and are
allowed to pass through the unit at approximately
2 .7 ft/sec . ( .52 m/sec) .
Spongeball
After approximately 70 hours of operation theCleaning
unit is depressurized and the spongeball cleaning
is repeated .
Enzyme DetergentFlush
SpongeballCleaning
3 7

distributions of coal, a 0 .42 to 0 .55 mm size distribution of silica
sand, and 0 .2-0 .3 mm size distribution of garnet sand .
The clarif ier was operated at 10 GPM ( .63 1/sec) also, giving
an overflow rate of 610 gal/ft 2 day (24 .8 m3 /m2 day) . Sludge was
manually withdrawn on a regular basis .
The entire pilot plant, with the exception of cleaning chemical
makeup and data collection, operated on an unattended, automatic
basis . Operational attention was restricted to a daily check and
daily data collection . Cleanings were normally performed on the
remaining two days (usually Monday and Thursday) . The total amount
of operator time averaged about two hours per day .
Table 4 summarizes the various changes in operation of the unit .
Figure 4 (page 34) is a schematic flow diagram for the entire reverse
osmosis plant with pretreatment facilities .
5 .4 .3 The Twenty-Four Hour Tests
In order to evaluate the effectiveness of various coagulants in
preventing flux decline twenty-four hour tests with close monitoring
of the flux and TDS were conducted . The tests were conducted during
three periods during which 3-4 tests were run on consecutive days .
This served to lessen the variability due to changing influent
composition and temperature variations . The general procedure follows :
1) To prepare for the test, injection of the coagulant to be
tested was begun at the. influent pump discharge . The chemical
clarification - filtration system was operated independently
3 8

Pilot plant started up ontrickling filter effluentafter multi-media filtration .
Cleaning prodedure changedby the addition of two hourBiz detergent flush .
Citric acid substituted forBiz detergent .
Returned to Biz detergent .
Final cleaning proceduredeveloped, using one hourcitric acid flush, followedby one hour Biz detergentflush, followed by spongeball cleaning .
Began chlorination of multi-media filter effluent .
Influent pH control initiatedby addition of sulfuric acid .
Table 4 :Chronological Summary of Pilot Plant Operation
Automatic sponge ball clean-ing started using reverse flowto initiate sponge ballcleaning .
Mixed media filter with cation Cationic polymer dosageoptimized by Zeta Potential measurements .Optimal concentrationsof alum, FeC13 andcationic polymers testedduring this period .
id polymer operation begun .
Clarifier installed . Pilotplant operated with coagula-tion, clarification andfiltration until shut down .
Unit shut down.
39
Weekly spongeball cleaning without cleaningchemicals .
Various concentrationsof Biz (up to 2 .1 g/1)were used for flushing .
Various concentrations( .04- .53g/1) were used .
Concentrations between .1 .05 and 1 .32 g/1 wereused .0 .66 g/1 citric acidconcentration and 1 .32g/1 Biz used for flush .
Chlorine residual rangedfrom .5 to 6 .0 mg .l averaging about 2 .5 mg/l .
Set acid injection forph = 5 .5 .
Cleaning frequency setto 6 hours .
DATE HOUR4/27/76 0
4/18/77 8,500
6/20/77 10,000
9/26/77 12,400
1/1/78 14,700
3/23/78 16,700
5/15/78 18,000
8/1/78 19,800
6/1/79 27,100
7/6/79 28,000
1/7/80 32,400

of the reverse osmosis unit to allow the pretreatment system
to reach steady-state for the coagulant . During this process
the water remaining in the 2000 gallon storage tank provided
feed for the RO unit .
2) The multi-media filter was backwashed .
3) The RO unit was shut down and chemically cleaned with a one
hour citric acid flush, followed by a one-hour Biz flush,
followed by ten oversize spongeballs introduced at one minuteintervals .
4) During the cleaning the feedwater storage tank was drained,
flushed with water from the pretreatment system and filled .
Normally enough water to begin the test was available when
the cleaning was completed .
5) The unit was started and adjusted to a feed rate of 6 .4 GPM
and to 600 psi operating pressure . Initial data collection
was begun thirty minutes after start-up .
6) The brine and product flows were determined by timing 30 - 60,
seconds of flow into .264 gallon (1000 ml) graduated
cylinders and recording the results in milliters per minute and
gallons per minute . The feed flow was calculated by summing
these two flows . The total dissolved solids (TDS) was
measured with a TDS meter and recorded . Also recorded were
the filter effluent turbidity, power usage, operating pressure,
and pH. A sample data collection sheet is enclosed in
Appendix C .
7) The measurements were repeated at hourly intervals for the
first several hours and then repeated the next morning .
40

Chapter 6 : EXPERIMENTAL RESULTS
6 .1 .1 FluxandtheEffectsofCleaning
The early results with the unit were disappointing in that
very low recovery rates were obtained . The recovery averaged about
25% with fluxes in the range of 4 .5 to 5 .0 gal/ft2 day (GSFD) (7 .6-8 .5
1/m2 hr) . The spongeball cleaning was effective at first in that
fluxes were increased from approximately 5 .0 GSFD (8 .5 1/m2 hr)
before cleaning to approximately 9 to 10 GSFD (15 to 17 1/m2 hr)
after cleaning. After approximately 8000 hours operation the flux
before cleaning decreased to approximately 3 .5 GSFD (6 1/m2 hr)
while the flux after cleaning could only be restored to about 4 .2 to
4 .5 GSFD (7 .1-7 .6 1/m2 hr) . This rapid deterioration was due to the
accumulation of insoluble salts on the membrane surface, which could
not be scrubbed from the surface by the spongeballs .
The use of the enzyme detergent partially restored the
membrane fluxes, but results were still disappointing . Starting in
April of 1977 the fluxes after detergent and spongeball cleaning
gradually increased from 4-4 .5 GSFD (6 .8-7 .6 1/m2 hr) to a maximum of
about 5 GSFD (8 .5 1/m2 hr) . On June 20, 1977 the first citric acid
cleaning was performed, which restored membrane flux to 12 .5 GSFD
(21 .2 1/m2 hr) . This flux after cleaning was maintained until the
end of September when flushing only with the enzyme detergent was
resumed . The flux after cleaning gradually declined and by December
41

1977 had declined to the previous levels of 4 to 4 .5 GSFD (6 .8-7 .6
1/m2 hr) . Beginning in March of 1978 the final cleaning procedures
shown in Table 3 were consistently used and flux after cleaning again
stabilized at about 12 .5 GSFD (21 .2 l .m2 hr) . The results of the
improvements in cleaning technique can be seen in Figure 5 which
shows the before and after cleaning fluxes for the entire period of
the investigation . The increases in flux due to improvement in
cleaning are obvious . The increases in fluxes after January, 1978
are attributed to improved pretreatment, rather than improved membrane
cleaning .
6 .2 .2 Flux Decline and Effects of Pretreatment
Improvements made in recovery and flux maintenance after
January 1978 are largely due to improvements in RO feed water quality .
Chlorination of RO feed water was begun in March 1978 and feedwater
pH control (pH controlled to approximately 5 .5) was begun in May,
1978, and resulted in small increases in the before cleaning fluxes .
Before cleaning fluxes increased from approximately 4 GSFD (6 .8 1/m2
hr) to approximately 6 GSFD (10 .2 1/m2 hr) . The installation of
the auto-spongeball cleaning devices in August of 1978 coincides with
increases in before cleaning fluxes to as high as 8 GSFD (13 .6 1/m2
hr) . Unfortunately the high before cleaning fluxes fell back to the
5-7 GSFD (8 .5-11 .8 1/m2 hr) range during the period from October, 1978
to May, 1979 . At present there is no explanation of this decreasing
trend .
The use of chemical coagulation and clarification had very
42

40
cmE
xZ)JWWZIQ31W2 10
20
0
24
20
1s
` 12
8
4
0
1. DETERGENT CLEANING BEGUN2. CITRIC ACID CLEANING BEGUN3. RETURN TO DETERGENT CLEANING4. FINAL CLEANING PROCEDURE BEGUN
05. CHLORINATION BEGUN8t pH CONTROL BEGUN7. AUTO SPONGEBALL ING BEGUN
1-8. DIRECT FILTRATION WITH COAGULATION
~''10BEGUN
9. CLARIFICATION BEGUN
8 0 (5) 1?RAFTER CLEANING FLUX
BEFORE CLEANING FLUX
( 06
6 00
Z 03
10
O
00
110
170
230
290
360 x 102
ELAPSED OPERATING TIME (hours)
Figure 5 : Membrane Fluxes BeforeandAfter . . Cleaning vs . Time
50I
43

large effects on both before and after cleaning fluxes . Direct
filtration with a cationic polymer which was begun on May 31, 1979
coincides with increasing trends in both before and after cleaning
fluxes . The before and after cleaning fluxes increased to maximum
values of about 14 and 25 GSFD_(23 .7 to 42 .4 1/m2 hr) respectively,
during the final phases of the study when the inorganic coagulants
were used .
During the last months of the study a series of 24 hour flux
decline tests were made using various concentrations of ferricchloride,
alum, and organic coagulants . Flux decline curves for represent-
ative 24 hour tests for each coagulant, and uncoagulated, filtered
trickling filter effluent are shown in Figure 6 . The flux decline
coefficients (slope of a log-log plot of flux and time) are shown in
Table 5 and are compared with decline coefficients calculated by
Thomas, et . al . (1973) . The flux decline coefficients show that the
ferric chloride coagulant produced feed water with the least tendency
to foul the membranes . The effectiveness of the organic coagulant
using direct filtration and alum with clarification were about equal .
The uncoagulated water, as expected, produced the largest fouling
rate .
6 .1 .3 Flux Variation of Membranes
Figures 7 and 8 show the results of flux measurements for
individual membranes . In Figure 7 the upper set of data points
represents flow measurements taken one-half hour after the unit was
started after cleaning . It reflects the variability in the initial
44

40
20
10
0
1. TAP WATER2. TRICKLING FILTER EFFLUENT COAGULATEDWITH FERRIC CHLORIDE
3. TRICKLING FILTER EFFLUENT COAGULATEDWITH ALUM
4. TRICKLING FILTER EFFLUENT COAGULATEDWITH AN ORGANIC POLYMER, USING DIRECT FILTRATION
5. TRICKLING FILTER EFFLUENT USING DIRECTFILTRATION WITHOUT COAGULATION
5 10
15
ELAPSED TIME (hours)
Figure 6 : Flux Decline From 24 Hour Tests
45
20 25

Table 5 : Flux Dec]4ne Coefficients forVarious Types of Feed Waters
Flux Decline
Feed Water TypeCoefficient
0 .243
Trickling Effluent withDual Media Filtration
0 .202
Trickling Filter Effluentwith alum coagulation,clarification and mixed-media filtration
0 .204
Trickling Filter Effluentwith Organic Polymercoagulation and directmixed-media :filtration
0 .146
Trickling Filter Effluentwith Ferric Chloridecoagulation, clarification,and mixed-media filtration
0.0136
Tap Water (TDS 100)
0 .9
Raw Wastewater
0 .56
Primary Effluent
0 .35
Secondary Effluent
0 .14
Carbon-TreatedSecondary Effluent
46
Reference
This Study
This Study
This Study
This Study
This Study
Calculated by Thomaset . al . (1973)from the data ofFeuerstein andBursztynsky (1970) .
Calculated by Thomaset . al ., aspreviously .
Calculated by Thomaset . al ., aspreviously .
Calculated by Thomaset . al ., aspreviously .

00
Membrane Number
Figure 7 : Membrane Flux versus the Membrane Number
4 7

Membrane Number
Figure 8 : MembraneFlux versus Membrane Number
48

fluxes of the individual membranes . The lower set of data represent
the fluxes an hour later . The individual membranes fluxes appear to
be strongly influenced by the hydraulic characteristics of the system .
This is also shown by the similar measurements shown in Figure 8 .
The two sets of data for Figure 8 were collected after the unit had
operated for several hours and then approximately nine hours later .
Though the data is insufficient to support quantitative conclusions,
it appears to support the work of Kimura and Nakao ('1975),
who found the velocity to be more of a flux determinant than the
initial membrane flux .
Also, because the data shows no sharp changes in flux, it
appears that the salts are not becoming saturated and precipitating
upon the membranes . This was supported by a test which showed sodium
hexametaphosphate to be ineffective at reducing the flux decline .
6 .2 RO Product Water Quality
RO product water quality was routinely measured for TDS and
turbidity and measured quarterly for a broad spectrum of contaminants,
including trace metals, boron, total organic carbon (TOC) and
nutrients . Table 6 shows two such analysis of RO feedwater and
product water quality . The levels of contaminants shown in the feed-
water on September 17 are typical of the feedwater produced by direct
filtration with an organic coagulant . The best quality feedwater was
not analyzed for all the contaminants shown in Table 6, but for only
a small subset of contaminants, including TOC, total suspended solids,
and turbidity, which averaged approximately 15 mg/1, 4 mg/l and 3 .0
49

Table 6 : ROFeed Water and Product Water Qualityon March 19, 1979 and September 17,1979*
*A11 units are in mg/1 . Values represent averages of measured waterquality before and after chemical cleaning . Analysis performed by DWR .
+ as CaC03
In addition the following constituents were measured and less than0 .01 mg/l were found in both product and feedwater : Arsenic, Cadmium,Chromium, Lead, Mercury, and Nickel .
50
Contaminant Feed Water Product Water3/19/79 9/17/79 3/19/79 9/17/79
Hardness+ 216 241 13 19
Calcium 36 38 2 3
Magnesium 30 35 2 3
Sodium 136 218 28 57
Sulfate 77 251 1 .5 8 .5
Chlorides 207 351 44 99
Boron 0 .55 0 .55 0 .4 0 .45
TDS 671' 1090 98 203
TOC 26 .5 22 .5 1 .5 1 .2
Total Nitrogen 26 39 4 .1 7 .6
Total Phosphorous 9 .3 12 0 .21 0 .83
Iron 0 .085 0 .36 0 .0 0 .08
Copper 0 .01 0 .15 0 .0 0 .01

NTU, respectively .
The product water quality shown in Table 6 is excellent for
most reclaimed water applications and in fact is much higher than
needed for many applications . The only contaminants which might be
of concern for non-potable recycle uses are boron and sodium . The
boron might be of concern when irrigating boron sensitive plants . The
sodium concentration is not prohibitively high except that the
balance between it and the divalent cations such as calcium and
magnesium is poor . If the RO product water were used as the only
source of irrigation water for sensitive crops, it might be
advantageous to adjust the sodium to calcium ratio by adding calcium
to the product water .
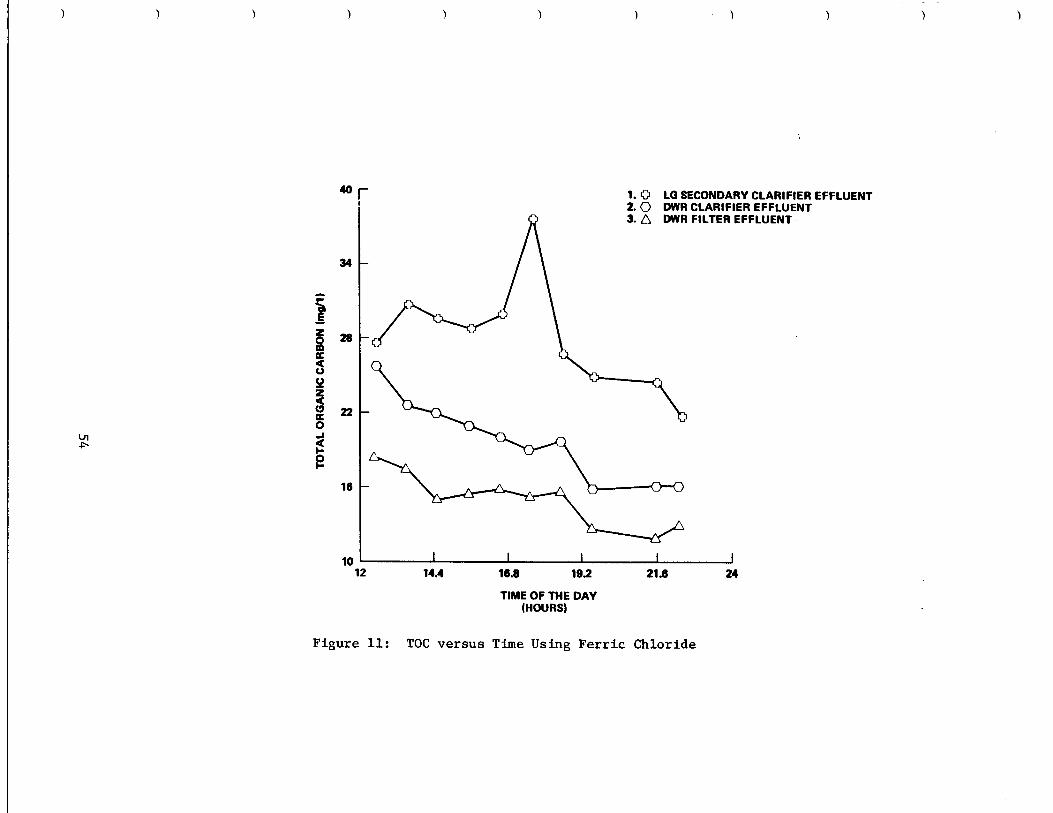
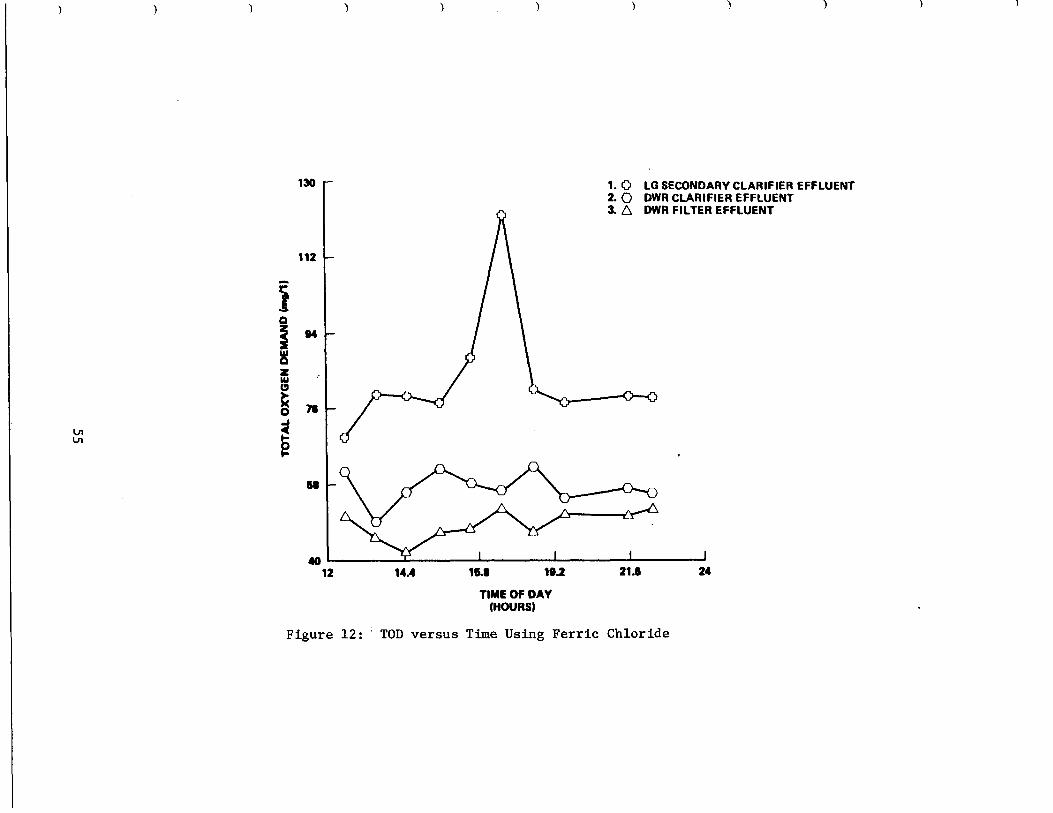
6 .2 .2 Effects of Alum and FeC13 on the Water Quality During 24 HourTests
The effluent from the pretreatment system was analyzed
during the initial twenty four hour tests with FeC1 3 and Alum for
TSS, turbidity, COD, and TOC . The results are shown in Figures 9
through 16 (pages 52-59) . Both coagulants were effective at improving
the quality of the filter effluent . The plots reflect the improved
water quality which would allow the filtered water to be used directly
in some recycling applications, and to be blended with RO product
water where there are more stringent requirements .
51

36
7
012
1 . 0 LG SECONDARY CLARIFIER EFFLUENT2 0 DWR CLARIFIER EFFLUENT3 L DWR FILTER EFFLUENT
'LrIII
14A
18.8
192
21.6
24
TIME OF THE DAY(HOURS)
Figure 9 : Total Suspended Solids versus Time UsingFerric Chloride
52

1
)
)
)
)
)
)
)
)
Uiw
TIME OF THE DAY(HOURS)
Figure 10 : Turbidities versus Time Using Ferric Chloride
1 . 0 LG SECONDARY CLARIFIER EFFLUENT2 . 0 DWR CLARIFIER EFFLUENT3. L DWR FILTER EFFLUENT
112
14A
1 .0 LG SECONDARY CLARIFIER EFFLUENT2. 0 DWR CLARIFIER EFFLUENT3. ,nj DWR FILTER EFFLUENT
IIIi16.8
19.2
21.6
24
TIME OF THE DAY(HOURS)
Figure 11 : TOC versus Time Using Ferric Chloride
34
cca
CPcc0
22
Ln aFpF
16
10
130
112
4012
14.4I
I15.S
19.2
TIME OF DAY(HOURS)
1.0 LG SECONDARY CLARIFIER EFFLUENT2. 0 DWR CLARIFIER EFFLUENT3. p DWR FILTER EFFLUENT
I21.6
24
Figure 12 : TOD versus Time Using Ferric Chloride

Ig
36
0WOrn
2W
24
JH0H
00
40
12
00 5
AA
10
15
ELAPSED TIME(HOURS)
Figure 13 : TSS versus Time Using Alum
1 . 0 LG SECONDARY CLARIFIER EFFLUENT2. 0 DWR CLARIFIER EFFLUENT3. t~ DWR FILTER EFFLUENT
20 25
0 5 10
ELAPSED TIME(HOURS)
Figure 14 : Turbidity versus Time Using Alum
1. Q LG SECONDARY CLARIFIER EFFLUENT2. 0 DWR CLARIFIER EFFLUENT3 .
DWR FILTER EFFLUENT
15
20
25
25
20
15
UI 0v m
a 10
5
0

0
A1
I5
ALUM DOSAGE INCREASED
Il10
15
ELAPSED TIME(HOURS)
Figure 15 : TOC versus Time Using Alum
1. 0 LO SECONDARY CLARIFIER EFFLUENT2. 0 DWR CLARIFIER EFFLUENT3. A DWR FILTER EFFLUENT
i I20
25
40
34
28
t7c c 22Ui00
OJa0g
16
10

500
41,
9
I
5
II
10
15
ELAPSED TIME(HOURS)
Figure 16 : TOD versus Time Using Alum
1. 0 LG SECONDARY CLARIFIER EFFLUENT2. 0 DWR CLARIFIER EFFLUENT3. L DWR FILTER EFFLUENT
I I20
25
1 )
) )
200
170
0140
W0
In
zWC7
I'D
G 110JHH
so

6 .3 Membrane Life During the Study
It has been reported by Kimura and Nakao (1975) that frequent
spongeball cleaning of membranes may tend to reduce membrane life . In
the present study there is no way to determine the decrease in life
expectancy due to cleaning ; however, it is interesting to note the
membrane replacement statistics . From the. start-up of the pilot plant
until November, 1979, 363 membranes were replaced, not including mem-
branes which failed within 30 days after insertion . Membranes which
failed in less than 30 days were judged to be defective due to the
casting or insertion technique . The average membrane life was 420 days
with a standard deviation of 262 days . Membranes were replaced when
product TDS was above 500 mg/l or when after cleaning flux declined to
less than 5 .0 GSFD (8 .5 1/m3 hr) . The majority of membranes were
replaced due to high product TDS concentration resulting from membrane
rupture .
It appears that the. major source of membrane failure is due to
corrosion of end fittings and not due to hydrolysis or other types of
membrane failure . The end fittings of the membranes were brass and it
appears that an electrochemical corrosion reaction gradually reduced
the-bevel of the couplings, which eventually allowed the high pressure.
flow to reach the dacron backing material, producing very rapid failure .
An alternate type of coupling using a PVC liner was manufactured to
alleviate the corrosion problems, and where these were installed there
was essentially no corrosion, and reduced membrane failure .
60

Chapter 7 : DISCUSSION OF EXPERIMENTAL RESULTS
..7 .1 The Effectiveness of the Cleaning Procedures
The cleaning technique obviously is very important to
maintaining membrane flux . It appears that spongeball cleaning
alone is effective for only a limited period of time, after which
the build-up of insoluble material on the membrane surfaces
prohibitively reduces membrane flux . Enzyme detergent cleanings in
conjunction with spongeball cleaning are only slightly more effective
than spongeball cleaning alone . The most significant cleaning agent
is the citric acid which appears to be several times more effective
than either spongeball cleaning or enzyme detergent cleaning .
Membrane fluxes, using the final cleaning procedures, have been
essentially restored to original flux levels . It appears that the
cleaning procedure does not improve the flux decline characteristics
of the membranes . The membrane flux observed in this study declines
to approximately the same value independent of the cleaning technique .
The value of the spongeball cleaning, especially automatic
spongeball cleaning, appears to be in retarding the initial rapid
rate of flux decline . The value of spongeball cleaning in reducing
the gradual flux decline appears to be very limited .
. .7 .2 Chlorination and pH Control
The use of chlorination and pH control appears to have a
6 1

modest beneficial effect on membrane flux decline . This result is
similar to the results of Winfield (1979a, 1979b) with hollow fiber
membranes, Hanagi and Mori (1980) with tube membranes, and Cruver and
Nusbaum (1974) and Nusbaum, Cruver, and Sleigh (1972) with spiral
wound membranes . The improved flux appears to be related to in-
hibition of bacterial growth on the membranes, and to reduced pH
where many of the scaling salts are more soluble . The fate of the
chlorination byproducts in the pilot plant, and the effect of
chlorine on the membranes have been investigated by Cooper, et . al .,
(1977, 1980) .
7.3 The Benefit of the Pretreatment System
Pretreatment with coagulation, clarification, and filtration
had the most dramatic effect on flux maintenance . Fluxes before
cleaning increased from 8 GSFD (13 .6 1/m2 hr) to values ranging as
high as 12 to 14 GSFD (20 to 24 1/m2 hr) . This flux increase is
attributed to removal of the submicron colloidal particles, as
evidenced by relatively ineffective results of filtration without
coagulation . The amount of carry over of potentially fouling
colloidal and suspended material to the RO unit, as measured during
cleaning, declined dramatically with enhanced pretreatment .
The ferric chloride coagulant provided the highest quality
effluent as indicated by flux decline rates . Alum and organic
polymers were less effective . Both alum and ferric chloride
efficiently removed suspended and colloidal material, as indicated
by decreases in the TSS and turbidity of untreated and treated water
62

from 20-30 mg/l and 10-20 NTU to 3-5 mg/l and 1-4 NTU respectively .
The superiority of ferric chloride over alum can in part
be attributed to the pH used in clarification/filtration and in the
RO unit . The pH during clarification/filtration is approximately
7 .2 which is reduced after filtration to approximately 5 .5 by the
addition of sulfuric acid . The pH for minimum solubility of the
ferric hydroxide is approximately 8 .3, and solubility increases with
decreasing pH . Therefore, one would expect any ferric ions remaining
in the filter effluent to be more soluble, tending to precipitate
less on the RO membranes . Aluminum hydroxide has just the opposite
solubility chemistry . Coagulation occurs at pH's where alum is more
soluble and, ironically, the RO unit is operated near the pH for
minimum aluminum hydroxide solubility . Undoubtedly, the chemistry
is more complex than the overview presented here, especially since
the ionic strength and aluminum concentration are increased in the
RO unit ; nevertheless the large accumulation of aluminum hydroxide
flocs found in the cleaning flush when using alum coagulation,
supports this theory .
6 3

Chapter 8 : SYSTEMS APPROACH
8 .1 Introduction
Several researchers have developed parameter optimization
routines for tubular membranes . Hatfield (1967) developed a nonlinear
programming model for desalination of brackish waters to maximize
flux . Later Hatfield and Graves (1970) presented an improved version
of the model . Fan, et . al . (1969) and McCutchan and Goel (1974)
presented an optimization which included multi-staging of the units .
Goel and McCutchan (1977) then presented a model for
optimizing a single pass tubular system . Antoniuk and McCutchan
(1973) attempted to predict system performance for a unit operating
on irrigation field water at Firebaugh, California . This same
facility was also utilized by Speight and McCutchan (1979) to develop
a mathematical model for economic optimization of a system.
8 .1 Calculations and Assumptions for Calculating the Cost of 1 MGDFacility
Using the data collected in this study, and current cost data
compiled by Oak Ridge National Laboratory (1980) and the EPA (1979),
an economic simulation model has been developed . The model is based
upon using the RO product water in conjunction with a specific
quantity of RO feedwater, to provide water for recycle with a
specified water quality . The calculation procedure is to determine
the minimum quantity of RO product water for blending with feedwater
64

to meet specified water quality standards, such as TDS, TOC, turbidity .
Pretreatment level and cleaning frequency are considered as variables
while RO operating pressure, membrane characteristics, and velocity
are considered constant .
8 .3 Basis for Cost Estimates
The least cost system of pretreatment was found by simulating
the RO unit with various pretreatment systems . The basis of
comparison for the simulation were the flux decline indices for the
various pretreatment operations .
The flux decline indices ($) were calculated for each of
the pretreatment alternatives from the tests described in section 5 .4 .3 .
From this value the optimal cleaning frequency for the Las Gallinas
system was determined with the least cost pretreatment system for
producing 1 MGD of a given quality product water .
The costs for the system were obtained from EPA documents
(1979), Oak Ridge National Laboratory (1980) and local estimates of
power and labor costs . The costs of the pretreatment systems were
functions assumed to be log-linear with parameters calculated from
the appropriate reference . The assumption of log-linearity
corresponds well with the functions in the range of 1-10 MGD . The
equations for the cost functions are given in the following form :
Log10 (Cost Variable) = a * Log10 (Size Variable) + b .
(6)
The functions were calculated for each of 5 categories
specified in the EPA report (1979) which allows variation of the
costs for labor and energy . The size variables used to represent
65

each process are given in Table 7, the values of a and b are given in
Table 8, and Table 9 shows a - sample calculation .
Detailed cost estimates for reverse osmosis plants are
given in Desalting Seawater and Brackish Water : Cost Update, 1979
(ORNL, 1979) as well as the EPA document, which contained the pretreat-
ment figures . The Oak Ridge cost figures were slightly less for total
costs than the costs estimated in the EPA document . Assumption of an
8% discount rate for a 20-year amoritization were used in calculations .
Labor costs were placed at $12 .00/hr . instead of the ten dollar figure
of the EPA (1979) . The EPA energy consumption estimates were used in
lieu of those measured in the pilot plant, due to the relative ineffic-
iencies. of pilot plant operation, and the cost of energy was assumed tobe5C/Kwh .
It was assumed that the flux decline relationships and
the relationship of the cleaning techniques are transferable to a
1 MGD facility . It is also assumed that though the EPA costs (1979),
which are based upon spiral wound and hollow fibre installations, will
not necessarily equal the tubular costs, they will vary in a similar
fashion with recovery rate and total capacity, thus insuring the
same relationship for comparative costs .
Brine disposal costs have not been included and no function
was included for variation of membrane life with changes in cleaning
frequency, because there is insufficient data from which to derive a
relationship . Determination of such a membrane life function would
probably require years of operation with the specific system . It
would appear that more frequent spongeballing would reduce membrane
life, (Bdlfar.t,1976) but there is some evidence which indicates that
66

Table 7 : Size Variables and Design Basis
FILTER SIZE VARIABLE DESIGN BASIS RATE
Vessels, Tanks, Filter Area Loading Rate 5 GPM/Ft2Etc.
Surface Wash " `~
Filter Media ",s
~~
Backwash GPM Upflow Velocity 2 ft/min
CLARIFIER
Vessel Clarifier Area Loading Rate 1000 GPD/Ft2
Polymer lbs/Day Dose 5 ppm
FeCl3 lbs/Hr " 50 ppm
Alum lbs/Hr " 60 ppm
REVERSE OSMOSIS
Vessels Feed Flow Flux Decline Index (B) .13 -.23
Chlorine lbs/Day Dose 2 ppm-9 ppm
H2SO4 GPD Dose 15 ppm

1 - Value is approximately constant for considered values
2 - Based on costs for FeSO4
1
TABLE 8 : COST COEFFICIENTS
TOTAL ENERGY OPERATION AND MAINTENANCE
COST SECTION
FILTER
CAPITAL ($) Lights, HeatingProcess
a
ba b& Coolinga
bMaterials ($/yr)a
bLabor (Person Hrs/yr)a
b
Tanks & Vessels .32 4 .72 210,00 .968
2 .47 .785 2 .47 .301 2 .51
Surface Wash .24 3 .96 NA
NA .888
1.45 .139 2 .00 .486 .69
Filter Media .65 2 .55 NA
NA NA
NA NA NA NA NA
Backwash .37 3 .49 NA
NA 1.00
1.38 .281 2 .24 .062 2 .146
CLARIFIER
Vessel .322 4 .01 NA
NA .172
3 .024 .640 1 .57 .154 1 .736
Polymer 20,2001 82101 173001 2701 1981
(ONw FeCl32 .278 4 .00 .574
3.20 49001 .067 2 .186 .062 .067
Alum .232 4 .08 .574
3.216 49001 2001 0 .62 3 .97
REVERSE OSMOSIS
System .848 5 .89 .901
5.023 .962
6.382 .188 3 .265 .886 4.988
H2SO4 .1186 3 .82 36801 16301 .330 1 .53 .222 1 .56
Chlorine .3625 3 .752 .517
3.448 .173
2 .58 .1066 2 .53 .177 2 .570
Cleaning .276 3 .31 NA
NA 1.0
1.077 .062 2 .127 .281 2 .157

Table 9 : Sample CalculationDetermination of Filter Vessel Capital Costs
Equation 5 shows the relationship between the cost variableand the size variable ;
Log10 (Cost Variable) = a * Log10 (Size Variable) + b
Table 7 shows that the size variable for filter vessels isthe filter area, and the loading rate is 5 GPM. If the feedflow is 1 .7 mgd ;
1 .7x 106 gals/day = 1 .7x 106 /1440 gals/min= 1180 GPM .
Therefore, the filter area at 5 GPM/ft 2 is given by
Area = 1180 GPM/(5-GPM/ft 2 ) = 236 ft2 .
Table 8 shows the values of the coefficients ;
a = 0 .32 and b = 4 .72,
where the cost variable is in units of dollars l .
Substitution into equation 5 yields the following ;
Log10(Cost Variable) = .32 * Log10 (236) + 4 .72 .
Log10 (Cost Variable) = 5 .478
Cost Variable = 301531, which is equivalent to
$ 301,531 .
1Had the cost variable been in units of hrs/yr or Kwh/yr,the final step would be to multiply the cost variable bythe $/hr for the labor or the $/Kwh for energy .
69

cleaner membranes have longer effective lives (Kuiper, Van Hezel, and
Bom, 1974) . Membrane life could have a significant effect upon the
total water cost, but since the cleaning frequencies for the various
systems differ only slightly, the relationship between costs would
be similar .
8 .4 The Optimal System
Table 10 shows a hypothetical analysis for a plant producing
1 MGD of reclaimed water . The water quality required for recycle
is a TDS of less than 750 mg/l, turbidity of less than 2 .0 NTU, TSS
less than 5 mg/l and TOC less than 5 .0 mg/1 . Using the values obtained
in the experimental study (RO product water : TDS - 250 mg/1, turbidity
- 0 .1, TOC - 1 .0, and TSS = 0, with feedwater quality ; TDS - 1200 mg/l,
turbidity = 3 .0, TOC = 18, and TSS = 4 .0), a blending ratio of
0.76 MGD RO product flow to 0 .24 MGD of feed blending flow is required .
The size and cost of each pretreatment system, with associated flux
decline coefficients, are calculated along with the optimal cleaning
frequency . The optimal cleaning frequency affects RO plant size
since the cleaning requires the RO unit to be down for 2 .0 hours .
The optimal reclamation plant size and cost breakdown are
also shown in Table 10 . For this hypothetical case ferric chloride
with clarification/filtration was found to be optimal and the optimal
cleaning frequency was found to be once per 16 hours . The total
system cost was found to be $1 .55/1000 gal of reclaimed water
produced . This cost is relatively insensitive to cleaning frequency
over the range of once per 12 hours to once per 26 hours .
70

In all hypothetical cases considered thus far, the most
advanced pretreatment system of these evaluated experimentally has
been optimal . For this case the cost varies from a low of $1 .55/1000
gal to a high of $2 .23/1000 gal . The results of this program are
considered to be tentative .
71

Table 10 : Optimal Reclamation Plant Design
The limiting parameter for the desired water quality is theTOC and the blending ratio is .76 MGD ( .033 m3/sec) of ROproduct water per 1 MGD ( .044 m3/sec) of production .
The following water quality results ;
72
Filter RO
Required BlendedTDS
1200 .0NTU
3.0TOC
18.0TSS
4.0
250 .0
750 .00 .1
2 .01 .0
5 .00 .0
5 .0
473 .50 .85 .00 .9
Optimal System's Specifications
Filter :Influent Flow 1 .37 MGD ( 0 .071 m3/sec )Loading Rate 5 .00 GPM/ft2 ( 3 .4
1~m2sec)Filter Area 222
ft2 ( 20 .6
m
)Diameter 17 .
ft ( 5 .2
m
)Backwash Velocity 2 .0 ft/min ( 0 .010 m/sec )
Clarifier :Influent Flow 1 .63 MGD ( 0 .071 m3/sec )Loading Rate 1000
gpJ/ft2 ( 40 .7 m3/m2day)Clarifier Area 1602
ft (148 .
M2
)Diameter 45 .
ft ( 13 .8
m
)Coagulant
Reverse Osmosis :Influent Flow
Ferric Chloride
( 0 .059 m3 /sec )1 .37 MGDProduct Flow 0 .76 MGD ( 0 .033 m3/sec )Percent Recovery 56Flux Decline Index (B) 0 .15Average Flux 13 .58 GPD/ft 2 ( 23 .0
1/m2/sec)Number of Membranes :24484Total Membrane Area :56314 ft2 (5231
m2
)Time Req'd for Cleaning 2 .0 hrsOptimal Cleaning Interval 16 .0 hrsSulfuric Acid Injected 8 .19 ppmChlorine Injected 2 .00 ppm
Assumptions
Labor
= $12.00 /hrElectrical Rate= $ 0 .05 /KwhInterest Rate = 8Life of Project= 20
years

Table 10 Optimal Reclamation Plant Design (Continued)
Unit Costs
73
TotalCapital($).
TotalCapital (,$/yr)
0 & M($/yr)
Water Costs($/kgal) ($/m3)
Vessels
295873 .
30135 .Surface Wash
32986 .
3360 .Media
12144 .
1237 .Backwash
62114 .
6326 .Clarifier
110138 .
11218 .Coagulants
25312 .
2578 .RO Unit
1011413 .
103015 .H2SO4
8841 .
900 .Chlorination
5904 .
601 .Cleaning
32496 .
3310 .
26436 .1199 .
0 .3408 .2645 .4219 .
315734 .1181 .4668 .6038 .
0 .17
0.0450 .01
0.0030 .004
0.0010 .03
0.0080 .04
0.0180 .02
0.0051 .23
0.3250 .01
0 .0030 .02
0 .0050 .03
0 .008
Coagulation/Clarification/Filtration
0.27Reverse Osmosis System
1.28$/Kgal$/Kgal
(0 .07 $/m3 )(0 .34 $/m3 )
Total System
1.55 $/Kgal (0 .41 $/m-J)
Hrs/yr $/yr
Energy and Labor Analysis
Building Energy Process EnergyKwh/yr Cost($/yr) Kwh/yr Cost($/yr)
Filter Unit 41176 . 2059 . 55220 . 2761 . 1646 19756 .Surface Wash
0 . 0 . 3484 . 174 . 68
813 .Media
0 . 0 . 0 . 0 . 0
0 .Backwash
0 . 0 . 5336 . 267 . 196 2384 .Clarifier Unit
0 . 0 . 3760 . 188 . 170 2036 .Coagulant
2114 . 106 . 4900 . 245 . 306 3674 .RO Unit
27387 . 1369 . 3253701 . 162685 . 1952 23424 .Sulfuric Acid 722 . 36 . 1630 . 82 . 76
914 .Chlorine
2988 . 149 . 388 . 19 . 343 4119 .Cleaning
0 . 0 . 2267 . 113 . 185 2226 .

Chapter 9 : CONCLUSIONS AND FUTURE RESEARCH
An experimental and economic analysis of a 10 GPM pilot RO
plant has been presented . From the experimental study the following
conclusions are made :
1 . Cleaning using flushes of citric acid, followed by enzyme
detergent and spongeball cleaning are effective at maintaining
membrane flux to essentially the initial flux levels . The
citric acid is the major cleaning agent . Enzyme detergent and/or
spongeball cleaning without citric acid are relatively
ineffective .
2 .
Automatic spongeball cleaning technique appears to have
promise for maintaining membrane flux between chemical
cleanings . Further testing is required .
3 . The major factor contributing to membrane degradation for the
type of membrane construction shown in Figure 1 is corrosion,
resulting in an average membrane life of 420 days (10,000 hours) .
This will be tested in future studys which will use the PVC
liners at the couplings .
4 . For all the conditions tested and analyzed, the greatest level
of pretreatment provided the most economical operation .
74

For the feed water investigated in this study, ferric chloride
coagulation with clarification and filtration provided the
highest quality feed water and the feed water with the least
fouling tendency .
5 . For the optimal conditions investigated, reclaimed water
containing approximately 500 mg/l TDS can be produced for
approximately $0 .42/m3 ($1 .60/1000 gal) . The costs estimated
are considered tentative .
6 . The pretreatment system had a significant effect on energy
consumption . The optimal energy requirements were approximately
2 .6 KWhr/m3 (10 KWhr/1000 gal) .
An important aspect of this investigation is the relatively
uncomplicated levels of pretreatment which were used . High lime
coagulation and carbon adsorption were not investigated due to the
complexity of operating a lime recovery/disposal system and carbon
regeneration system . It is hoped that continued development will
permit less expensive operation without using the higher technology
pretreatment processes .
It is anticipated that the existing pilot plant will be
operated for at least two more years . During this time several major
modifications are planned to further observe the units performance .
To test the RO system on activated sludge effluent, installation
of a pilot activated sludge plant is planned for the fall of 1980 .
75

The system will be operated with increasingly consistent pretreatment
and cleaning procedures, and thus a more accurate appraisal of
membrane life will be possible . Investigation into velocity
relationships, (which have largely been ignored in this study) are
planned and possibly a test of a parallel leg configuration.
Additionally, several novel flux control techniques, such as those
proposed by Belfort and Marx (1979) are being considered .
76

APPENDIX A - REFERENCES
77

REFERENCES
Anderson, Donald R . and William R. Mills . "An IntegratedPretreatment System for High Recovery Reverse Osmosis Systems",Desalination, 22, pp . 349-357, 1977 .
Antoniuk, D . and J . W . McCutchan . "Desalting Irrigation FieldDrainage Water by Reverse Osmosis, Firebaugh, California," Schoolof Engineering and Applied Science, University of California,Los Angeles, UCLA-ENG-7368, August 1973 .
Argo, D . and J .G . Moutes . "Wastewater Reclamation by ReverseOsmosis", Journal of Water Pollution Control Federation, 51,pp . 590-600, 1979 .
Asano, T ., Ghirelli, and K.L . Wassermann . discussion of"Wastewater Reuse by Biological-Chemical Treatment andGroundwater Recharge," by Idelovitch, E ., Jour . Water Poll .Control Fed ., 51, pp . 2327-2329, 1979 .
Belfort, Georges . "Pretreatment and Cleaning of HyperfiltrationMembranes in Municipal Wastewater Renovation," Desalination, 21(3), pp . 285-300,1977 .
Belfort, Georges, Gabriella Alexandrowicz and Benny Marx ."Artificial Particulate Fouling of Hyperfiltration Membranes,"Desalination, 19, pp . 127-138, 1976 .
Belfort, Georges and B . Marx . "Artificial Fouling ofHyperfiltration Membranes - II Analysis and Protection FromFouling," Desalination, 28, pp . 13-30, 1979 .
Bevege, E .E ., J .E . Cruver, J .G . Killbride, S .S . Kremen, andA.B . Riedinger . "Interaction of Feedwater Colloids with theSurface of Reverse Osmosis Membranes," Office of Saline Water,U .S . Dept . of Interior, Report No . 883 (PB223193), July 1973 .
Boari, G ., C . Carrieri, P . Mappelli, and M. Santori . "ReverseOsmosis Pilot Plants Performance in Brackish Water Desalination,"Desalination, 24, pp . 341-364, 1978 .
Boen, Doyle and Gerald Johannsen, "Reverse Osmosis of Treated andUntreated Secondary Sewage Effluent," EPA Tech . Series,EPA-670/2-74-077, 1974 .
Brian, P .L .T . "Concentration Polarization in Reverse OsmosisDesalination with Variable Flux and Incomplete Salt Rejection,"Office of Saline Water, U .S . Department of Interior, ReportNo . 145 (PB 179436), 1965 .
78

Brunelle, Michael . "Colloidal Fouling of Reverse OsmosisMembranes," Desalination, 32, pp . 127-135, 1980 .
Buros, O .K. "Economic Aspects of Membrane Processes,"Desalination, 30, pp . 595-603, 1979 .
California Department of Health Services . "Wastewater ReclamationPlant Survey : 1978," State of California Department of HealthServices, January 1979 .
California Department of Water Resources . "The California WaterPlan Outlook in 1974," State of California Resources Agency,Bulletin No . 160-74, November 1974 .
California Department of Water Resources . "WastewaterReclamation-State of the Art," State of California ResourcesAgency, Bulletin No . 189, March 1973 .
Channabasappa, K.C . "Status of Reverse Osmosis DesalinationTechnology," Desalination, 17, pp . 31-67, 1975 .
Channabasappa, K.C . "Membrane Technology for Water ReuseApplication," Desalination, 23, pp . 495-514, 1977 .
Chen, Ching-lin and Robert Miele . "Wastewater Demineralization byTubular Reverse Osmosis Process," EPA Contract 14-12-150, 1971 .
Chen, Ching-lin and Robert Miele . "Demineralization of Carbon-treated Secondary Effluent by Spiral-wound Reverse OsmosisProcess," EPA Contract 14-12-150, 1972 .
Cooper, Robert and Michael Richard . "The Fate of ChlorinationByproducts in the Reverse Osmosis Process," Progress Report to theDepartment of Water Resources, State of California, May 1978 .
Cooper, R.C ., Michael Richard, Lewis Scarpace, and David Straube ."The Fate of Viruses, Bacteria, Humic Substances, and ChlorinationByproducts in the Reverse Osmosis Process," Report to theCalifornia Department of Water Resources, for contract B52356,University of California, Berkeley, . California, 1977 .
Cruver, J . and I . Nusbaum. "Application of Reverse Osmosis toWastewater Treatment," JWPCF, 46, pp . 301-311, 1974 .
El-Ramby, Nabil and Charles Congdon . "Desalting Plants InventoryReport No . 6," Office of Water Research and Technology, 1977 .
EPA . "Estimating Water Treatment Costs," U .S . EPA publicationEPA-600/2-79/162a through 162b, Vol . 1-4, 1979 .
79

Feuerstein, D .L . and T .A . Bursztynsky . "Design Consideration forTreatment of Solids-Laden Wastewaters by Reverse Osmosis,"AICHE Water, 67, pp . 568-574, 1970 .
Fluor, Inc . "Desalting Plans and Progress - An Evaluation of theState of the Art", OWRT contract 14-34-0001-7707, 1978 .
Glueckstern, P . "Comparative Economics of Current and AdvancedDesalting Systems," Desalination, 30, pp . 223-234, 1979 .
Goel, V . and J . McCutchan . "Systems Design of a Tubular ReverseOsmosis Plant," UCLA Engineering Report 7704, 1977 .
Goel, V . and J .W . McCutchan . "Systems Analysis and Optimaizationof a Tubular Module Reverse Osmosis Pilot Plant for Sea WaterDesalination," School of Engineering and Applied Science,University of California, Los Angeles, UCLA-ENG-7163, October1971 .
Halary, J .L ., C . Noel, and L . Monnerie . "Analysis of TransportPhenomena in Cellulose Diacetate Membranes . II - Pressure Effectson Permeability Characteristics in Reverse Osmosis," Desalination,Vol . 27, No . 3, pp . 197-214, 1978 .
Hatfield, Gordon B . Digital Computer Simulation and Optimization ofa Reverse Osmosis System, M .S . in Engineering, Engineering SystemsDepartment, University of California, Los Angeles, 1967 .
Hatfield, G .B . and G .W . Graves . "Optimization of a Reverse OsmosisSystem Using Non-Linear Programming," Desalination, 7, pp . 147-177, 1970 .
Jackson, J .M . and D . Landolt . "About the Mechanism of Formationof Iron Hydroxide Fouling Layers on Reverse Osmosis Membranes,"Water Resources Center Desalination Report No . 50 (UCLA-ENG-7266),1972 .
Johnson, J .S . "Performance of Cellulose Acetate SemipermeableMembranes Under Brackish Water Conditions," School of Engineeringand Applied Science, University of California, Los Angeles,Report No . 67-41, August 1967 .
Johnson,J .S . and S . Loeb . "Reverse Osmosis Desalination at theCoalinga Plant : Progress Report January 1, 1966 to June 30, 1966,"Water Resources Center Desalination Report No . 7, 1966 .
Johnson, J .S ., J .W . McCutchan, and D .N . Bennion, "Three and One-Half Years Experience with Reverse Osmosis at Coalinga,California," School of Engineering and Applied Science, Universityof California, Los Angeles, Report No . 69-45, July 1969 .
80
Kimura, Shoji and Shin-Ichi Nakao . "Fouling of Cellulose AcetateTubular Reverse Osmosis Modules Treating the Industrial Water inTokyo," Desalination, 17, pp . 267-288, 1975 .
Kini-E, Mulka and Joseph McCutchan . "Reclamation of HyperionSecondary Effluent by Reverse Osmosis," Water Resources CenterDesalination Report No . 60, 1975 .
Kuiper, D ., J .L . Van Hezel, and C .A. Bom. "The Use of ReverseOsmosis for the Treatment of River Rhine Water, Part II,"Desalination, 15, p . 193, 1974 .
Larson and Associates, Limited . Desalting Seawater and BrackishWater : Cost Update, 1979, Oak Ridge National Laboratory, ORNL/TM-6912, 1979 .
Loeb, S . "A Composite Tubular Assembly for Reverse OsmosisDesalination," Desalination, Vol . 1, pp . 35-49, 1965 .
Loeb, S . and J .S . Johnson . "Fouling Problems Encountered in aR .O . Desalination Pilot Plant," Water Resources Center DesalinationReport 9, 1966 .
Loeb, S . and J . Rosenfeld . "Turbulent Region Performance ofReverse Osmosis Desalination Tubes ; Experience at Coalinga PilotPlant," Water Resources Center Desalination Report No . 10,66-62, 1966 .
Loeb, S . and S . Sourirajan . "Sea Water Demineralization by Meansof a Semi-permeable Membrane," UCLA Engineering Report No . 60-60,1960 .
Loeb, S . and S . Sourirajan . "Sea Water Demineralization by Meansof an Osmotic Membrane," ACS, Saline Water Conversion - II, pp .117-132, 1962 .
Manjikian, S ., S . Loeb, and J .W . McCutchan . "Improvement inFabrication Techniques for Reverse Osmosis DesalinationMembranes," Proceedings of the First International Symposium onWater Desalination, Washington, D.C ., pp . 159-173, October 1965 .
Mattson, Melvin . "Significant Development in MembraneDesalination-1979," Desalination,, 28, pp . 207-223, 1979 .
Matz, R . and Y . Meitlis . "Design and Operating Parameters forTubular Ultrafiltration Membrane Modules," Desalination, 24, pp .281-294, 1978 .
McCutchan, J .W . from Reverse Osmosis, ed . by S . Sourirajan,Academic Press, pp . 541-563, 1977 .
81

McCutchan, J .W . and V . Goel . "Systems Analysis of a Multi-StageTubular Module Reverse Osmosis Plant for Sea Water Desalination,"Desalination, 14, pp . 57-76, 1974 .
Merten, U . "Transport Properties of Osmotic Membranes,"Desalination by Reverse Osmosis, edited by U. Merten, M .I .T .Press, Cambridge, Massachusetts, pp . 15-54, 1966 .
Merten, U ., et al . "Reverse Osmosis Membrane Research," Office ofSaline Water, U .S . Department of Interior, Report No . 265(PB 180322), August 1967 .
Nusbaum, I ., J .E . Cruver, and J .H . Sleigh. "Reverse Osmosis - NewSolutions and New Problems," AICHE Water, 68, pp . 270-282, 1972 .
O .S .W. and Bureau of Rec . Desalting Handbook for Planners, U .S .Department of Interior, May 1972 .
Page, Talbot, Robert Harris, and Judith Bruser . "Removal ofCarcinogens from Wastewater : a Cost-Benefit Analysis," CaliforniaInstitute of Technology Social Science Working Paper 230, 1979 .
Pusch, W . and G. Mossa . "Influence of Pressure and/or PressureDifferential on Membrane Permeability," Desalination, 24,pp . 39-53, 1978 .
Richardson, J .L ., G . Segovia, W . Baerg, and M.L . Anderson ."Reverse Osmosis Tubular Module Optimization," O .S .W . Researchand Development Report No . 455, 1969 .
Richard, M .G . and R .C . Cooper . "Bacteriological Aspects of SlimeFormation and Membrane Failure in Reverse Osmosis Systems," FinalReport for the California Department of Water Resources, Groupin Environmental Health Sciences, School of Public Health,University of California, Berkeley, California, August 1974 .
Richard, M .G . and R .C . Cooper . "Prevention of Biodeteriorationand Slime Formation in Tubular Reverse Osmosis Units,"Proceedings of the Third Annual Conference of the National WaterSupply Improvement Association, Key Largo, Florida, July 13-17,1975 .
Rosenfeld, J . and S . Loeb . "Turbulent Region Performance ofReverse Osmosis Desalination Tubes," I & EC Process Design andDevelopment, Vol . 6, pp . 122-127, January 1967 .
Sach, S .B . and E . Zisner . "Wastewater Renovation by SewageUltrafiltration," Desalination, 20, pp . 203-215, 1977 .
82

Schippers, J .C ., J. Verdouw, and J .M. Hofman . "Pretreatment ofReverse Osmosis Feedwater by Means of In Line Coagulation,"Desalination, 32, pp . 103-112, 1980 .
Schmidt, C .J . and D .E . Ross . "Cost-Effectiveness Analysis ofMunicipal Water Reuse," EPA Water Planning Division, WPD -4-76-01, 1975 .
Smith, J .M ., A. Masse, and R. Miele . "Renovation of MunicipalWastewater by Reverse Osmosis," Water Pollution Control Research,Series 17040, 1970 .
Speight, L .W . and J .W . McCutchan . "Reverse Osmosis DesalinationPlant Design and System Optimization Based on the Facility atFirebaugh, California," School of Engineering and Applied Science,University of California, Los Angeles, UCLA-ENG-7982, 1979 .
Spiegler, K .S . and 0 . Kedem. "Thermodynamics of Hyperfiltration(Reverse Osmosis) : Criteria for Efficient Membranes,"Desalination, 1, pp . 311-326, 1966 .
Stevens, D . and S . Loeb . "Reverse Osmosis Desalination CostsDerived from the Coalinga Pilot Plant Operation," School ofEngineering and Applied Science, University of California,Los Angeles, Report No . 67-2, February 1967 .
Thomas, D .G ., R.B . Gallaher, and J .S . Johnson Jr . "Hydro-dynamicFlux Control for Wastewater Application of HyperfiltrationSystems," U .S . EPA-R2-73-228, 1973 .
Wechsler, Robert . "Reverse Osmosis on Secondary Sewage Effluent :The Effect of Recovery," Water Research, 11, pp . 379-385, 1976 .
Winfield, B .A . "The Treatment of Sewage Effluents by ReverseOsmosis : pH Based Studies of the Fouling Layer and Its' Removal,"Water Research, 13, pp . 561-564, 1979a .
Winfield, B .A. "A Study of the Factor Affecting the Rate ofFouling Reverse Osmosis Membranes Treating Secondary SewageEffluents," Water Research, 13, pp . 565-569, 1979b .
Yanagi, Chota and Kenji Mori . "Advanced Reverse Osmosis Processwith Automatic Spongeball Cleaning for the Reclamation ofMunicipal Sewage," Desalination, 32(3), pp . 391-398, 1980 .
83
APPENDIX B - FORTRAN PROGRAM
84

C
THIS PROGRAM IS DESIGNED TO GIVE THE OPTIMAL CONFIGURATIONC FOR A REVERSE OSMOSIS SYSTEM GIVEN THE ALTERNATIVES OF DIRECTC FILTRATION OR COAGULATION/FILTRATION WITH VARIOUS COAGULANT AIDS .C VARIOUS VALUES OF THE FLUX DECLINE INDEX (B) WHICH CORRESPOND WITHC DIFFERING LEVELS OF TREATMENT-(DIRECT FILTRATION AND COAGULATION!C FILTRATION WITH DIFFERENT COAGULANTS) HAVE BEEN DETERMINED FROMC THREE YEARS OF OPERATING AT LAS GALINAS, CALIFORNIA . THESE AREC TESTED ALONG WITH DIFFERING CLEANING FREQUENCIES TO DETERMINE THEC LEAST COST ALTERNATIVE .CCC
SUBROUTINESC BLEND
CALCULATES THE 'RATIO' OF THE RO PRODUCT TO THE THE 1MGDC
PRODUCT FLOW REQUIRED TO PRODUCE THE INPUT WATER QUALITYC
DEFINED BY FOUR(CAN BE USED UP TO 10) QUALITY PARAMETERS .C FLUX
DETERMINES THE AVERAGE FLUX PER SQUARE FOOT/DAY (AFD) FROMC
THE CLEANING FREQUENCY AND RECOVERY AFTER CLEANING .C CLEAN
CALCULATES THE COST OF CLEANING FROM THE FEED RATE AND THEC
DOSES OF THE H2SO4 AND CHLORINECC SIZE
PRODUCES THE SIZES OF THE UNITS REQUIRED TO PRODUCE 1MGDC
FROM THE GIVEN AVERAGE FLUX AND BLENDING RATIO .C COST
THE CENTRAL ROUTINE FOR CALCULATING THE COSTS OF THE VARIOUSC
UNIT PROCESSES USING THE DATA FROM THE EPA COST ESTIMATINGC
TECHNIQUES, 1979 . THE ANNUAL COSTS ARE CALCULATED USINGC
7% FOR 20 YEARS .CC
VARIABLESC
THE CAPITAL COSTS ARE NONDIMENSIONED VARIABLES STARTING WITH CC-C
EXCEPT IN THE OUTPUT SUBROUTINE WHERE THE UNIT CAPITAL COSTS AREC
REPRESENTED BY ARRAY BN(I)r AND ANNUAL CAPITAL COSTS BY BNN(I)C
ENERGY CONSUMPTION IS REPRESENTED BY ARRAY E(I) AND THE ENERGYC
COSTS ARE GIVEN IN ARRAY EC(I)r WHERE PKWH IS THE PRICE/KWHC
LABOR - GIVEN IN ARRAY AL(I) IN HRS/YR AND LABOR COSTS BY ALC(I)C
MAINTENANCE MATERIAL COST - ARE CONTAINED IN ARRAY AM(I) IN 3/YR .CC
1SUMCLrSUMMrPKWH,HOURLY,AOPT(10),BOPT(10),AICOMMON /OPTIM/ KBOPT,CFOPT,TMAXEQUIVALENCE (CCF,PP(1))REAL MADATA JOKER/1! A/1000000 .!,INDEX/OI,P/1 ./
C NHRS = NUMBER OF CLEANING FREQUENCIES(CF) TO TO BE USEDC MK = NUMBER OF VALUES OF FLUX DECLINE INDEX TO BE USEDC CT = TIME REQUIRED FOR CLEANINGC Fl I REC = THE FLOW AND THE RECOVERY AFTER CLEANINGC FRATE AND CRATE ARE THE LOADING RATES FOR THE FILTER AND CLARIFIER
85
DIMENSION PP(20),BQ(100),BX(100)COMMON /RO/ CTrF1vRECrAFDrAFrMArRECOV,RFEEDrCF,RF,MKCOMMON /FILTER/ FRATE,FOUT,FIN,FSIZErRATIO,FF,VCOMMON /C/ CRATE,CIN,CSIZECOMMON /UNIT1! BrBB(20),TABLE(10,500)rKrKM,TCOST,DOSE,ADOSE,CDOSECOMMON /UNIT2/ CCFUrCCFSrCCFMrCCFBrCCCvCCArCCRrCCBrCCDvCCLrBNN(10)COMMON /UNIT3/ E(20)rAM(20)rAL(20)rEC(20),ALC(10),SUML,ESUM,ECSUMr

C
INITIALIZATIONDO 10 I = 1x20PP(I) = 0 .0E(I) = 0 .AM(I) = 0 .AL(I) = 0 .
10 CONTINUEC
B = BB(KM)CALL FLUX(B)IF(P .GT .10 .) GO TO 30
20 CALL BLENDP = 20 .
30 CALL SIZECALL CLEANKGB = KMCALL COST(KGB)TABLE(KMYJ) = TCOSTCF = CF + 4 .
40 CONTINUECF = 4 .
50 CONTINUEC INITIALIZATION
DO 55 I = 1x20PP(I) = 0 .0E(I) = 0 .AM(I) = 0 .AL(I) = 0 .
55 CONTINUEC COMPUTE OPTIMAL VALUES
KGB = KBOPTKM = KGBB = BB(KM)CF = CFOPT
CC
1 DO 50 KM = 1,4DO 40 J = 1,NHRS
86
TMAX = 99999999 .NHRS = 10MK =4FEED = 6 .2CT = 2 .Fl = 5 .2REC = Fl/FEEDFRATE = 5 .CRATE = 1000 .V = 2 .0CF = 4 .0BB(1) = .1456BB(2) = .2060BB(3) = .2020BB(4) = .2425

CALL FLUX(B)CALL SIZECALL CLEANCALL COST(KGB)
60 CALL OUTPUT(NHRS)100 STOP
ENDSUBROUTINE CLEAN
CC
SUBROUTINE CLEANC
COMMON /RO/ CT,F1,REC,AFD,AF,MA,RECOV,RFEED,CF,RF,MKCOMMON /FILTER/ FRATE,FOUTvFIN,FSIZE,RATIO,FF,VCOMMON /C/ CRATE,CIN,CSIZECOMMON /UNIT1/ BrBB(20),TABLE(10,500),K,KM,TCOST,DOSE,ADOSErCDOSECOMMON /UNIT2/ CCFU,CCFS,CCFM,CCFB,CCC,CCA,CCR,CCB,CCD,CCLrBNN(10)COMMON /UNIT3/ E(20),AM(20),AL(20)rEC(20),ALC(10),SUML,ESUM,ECSUM,
1SUMCL,SUMM,PKWH,HOURLY,AOPT(10)rBOPT(10),AICOMMON /OPTIM/ KBOPT,CFOPT,TMAX
CC
CFACT = THE SIZE OF REQUIRED TANKS FOR WASH WATERC
ACETIC = ACETIC ACID DOSE/MEMBRANE PER CLEANINGC
BIZ = BIZ DOSE/MEMBRANE PER CLEANINGC
QM = COST OF CLEANING CHEMICALS/YEARC
CT/CF = CLEANING TIME/CLEANING FREQUENCYC
UPTIME = PROPORTION OF TIME SYSTEM IS OPERATINGC
DATA UPTIME/0 .8/,PA/0 .05/,PB/0 .02/,ACETIC/ .00344/ ,BIZ/0 .00689/TM = RFEED/(AFD*2 .3)QM = (ACETIC*PA + BIZ*PB) *TM *CF/24 .*340 .Q = 0 .03125 * TM * CT/((CF +CT)*UPTIME)CFACT = Q * CT * 60 .
CC
SUBROUTINE FLUXCC FSUM IS THE TOTAL FLOW BETWEEN CLEANINGSC CF = THE CLEANING FREQUENCYC CT = CLEANING TIMEC Fl = FLUX AFTER CLEANINGC REC = THE RECOVERY AFTER CLEANINGC FSUM/TOTAL TIME = AVERAGE FLUX
DIMENSION F(500),T(500),Z(102),AAF(500)COMMON /RO/ CT,FI,REC,AFD,AF,MA,RECOV,RFEED,CF,RF,MKCOMMON /FILTER/ FRATE,FOUT,FIN,FSIZE,RATIO,FF,V
87
CCL = 10 . **(0 .2758 *ALOG10(CFACT) + 3 .31)E(19) = 0 .0E(20) = 10 . **(1 .00 * ALOG10(Q) + 1 .077)AL(10)= 10 . **(0 .062 *ALOG10(Q) + 2 .127)AM(10)= 10 . **(0 .281 *ALOG10(Q) + 2 .157) + QMFIN = FIN +RETURNENDSUBROUTINE
CFACT
FLUX(B)

COMMON /C/ CRATE,CINrCSIZECOMMON /UNIT2/ CCFUrCCFSrCCFMrCCFB,000,CCArCCR,CCB,CCD , CCLREAL MAFMAX = 0 .0FSUM = 0KK = CFF(i) = FlN=KK+1DO 10 I = 2,NT(I) = FLOAT(I)F(I) = Fl * (1/T(I)**B)FSUM = FSUM +(F(I) + F(I-1))/2 .
10 CONTINUEAF = FSUM/(KK + CT)RECOV = AF * REC/F1AFD = AF * 1440 . /368 .CF = FLOAT (KK)RETURNENDSUBROUTINE BLEND
CC
SUBROUTINE BLENDC
DIMENSION FAR(2r20),FPAR(20),ROPAR(20),CRIT(20)COMMON /RO/ CTrF1rREC,AFD,AF,MA,RECOV,RFEED,CF,RF,MKCOMMON /FILTER/ FRATE,FOUT,FIN,FSIZE,RATIO,FF,VCOMMON /C/ CRATE,CINrCSIZECOMMON /UNIT2/ CCFUrCCFSrCCFMrCCFBrCCC,CCA,CCR,CCB,CCDvCCL,BNN(10)REAL MAN = 4XX = 0 .0
C LOOP FOR CALCULATING THE BLENDING RATIODO 1 K= 1,NIF(K .GT .N) GO TO 1READ(5r10) CRIT(K),PAR(1,K),FPAR(K),ROPAR(K)
10 FORMAT(A3r3F8 .1)IF(FPAR(K) .LE .PAR(1,K)) GO TO 20IF(ROPAR(K) .GT .PAR(1rK)) GO TO 30RATIO = (PAR(1,K) - FPAR(K))/(ROPAR(K) - FPAR(K))IF( RATIO .L T .XX) GO TO 1XX = RATIOKK = KGO TO 1
20 RATIO = 0KK = 1GO TO 1
30 WRITE(6r40) CRIT(KK),CRIT(KK),PAR(1rK)40 FORMAT(//////rT20r'THE RO PRODUCT WATER HAS A 'rA3r' GREATER THANCTHAT REOUIRED'r/r'THEREFORE WATER WITH 'rA3r' LESS THAN',F8 .1r'CCANNOT BE PRODUCED WITH THIS SYSTEM')STOP
1 CONTINUE
88

RATIO = XXDO 2I=1,NPAR(2,I) _ (RATIO*ROPAR(I)) + ((1-RATIO) * FPAR(I))
2 CONTINUEWRITE(6,50) CRIT(KK),(CRIT(K),FPAR(K),ROPAR(K),1(PAR(I,K),I=1,2),K=1,4)
50 FORMAT(///,T20,'THE LIMITING PARAMETER IS ',A3,/,1//,T20,'THE FOLLOWING WATER QUALITY RESULTS',/,T20,2'FILTER',T30,'RO ',T40,'REQUIRED',T50,'BLENDED',34(/,T10,A3,T19,F8 .1,T26,F8 .1,T39,F8 .1,T50 , F8 .1))RETURNENDSUBROUTINE SIZE
CC
SUBROUTINE SIZECC
CALCULATES THE SIZES OF THE VARIOUS COMPONENTS OF THE SYSTEM
SUBROUTINE COST(KGB)
89
1SUMCL,SUMM,PKWH,HOURLY,AOPT(10),BOPT(10),AICOMMON /OPTIM/ KBOPT,CFOPT,TMAX
COMMON /RD/ CT,FI,REC,AFD,AF,MA,RECOV,RFEED,CF,RF,MKCOMMON /FILTER/ FRATE,FOUT,FIN,FSIZE,RATIO,FF,VCOMMON /C/ CRATE,CIN,CSIZECOMMON /UNIT2/ CCFU,CCFS,CCFM,CCFB,CCC,CCA,CCR,CCB,CCD,tCL,BNN(10)REAL MAA = 10 .0**6
C BN = NUMBER OF BACKWASHES PER DAYBN = 2
C MEMBRANE AREA
AFD = AVERAGE FLUX/FT2-DAY MAMA = RATIO * A/AFD
C FEED FLOW RATE TO RD RFEEDRFEED = RATIO * A/RECOV
FOUTC FILTER OUTPUT
CFOUT = RFEED + (1-RATIO) *A
FINFILTER INPUT = FOUT + BACKWASH WATER (2%)
CFIN = FOUT
FSIZEFILTER SURFACE AREA AT 5 GPM/FT2FSIZE = FIN /(FRATE * 1440 .)
CFIN = FIN + BN*V*FSIZE
CLARIFIER AT 1000 GPD/FT2 CSIZECSIZE = FIN/1000 .RETURNEND
CCC
SUBROUTINE COST
COMMON /RD/ CT,FI,REC,AFD,AF,MA,RECOV,RFEED,CF,RF,MKCOMMON /FILTER/ FRATE,FOUT,FIN,FSIZE,RATIO,FF,VCOMMON /C/ CRATE,CIN,CSIZECOMMON /UNIT1/ B,BB(20),TABLE(10,500),K,KM,TCOST,DOSE,ADOSE,CDOSECOMMON /UNIT2/ CCFU,CCFS,CCFM,CCFB,CCC,CCA,CCR,CCB,CCD,CCL,BNN(10)COMMON /UNITS/ E(20),AM(20),AL(20),EC(20),ALC(10),SUML,ESUM,ECSUM,

DIMENSION ANN(10)EQUIVALENCE (CCFU,ANN(1))REAL MADATA N/20/,CFT/20 ./AI = 0 .08PKWH = .05HOURLY = 12 .RFT = CFT/102 .A = 10 .**6
C FF = MOD TO FILTER, WF = MILLIONS OF GALLONS TO FILTER, RF=MGD TO ROFF = FIN/AWF = FF * 8 .34RF = RFEED/A
C*
FILTER
*C**********************************************************
CC
MEDIAC
CCFM = 10 . **(0 .652 * ALOG10(FSIZE) + 2 .554)E(5) = 0,E(6) = 0 .
AM(3) = 0 .AL(3) = 0 .
CC
BACKWASHC
Q = FSIZE * V * 7 .48CCFB = 10 . **(0 .37 * ALOG10(Q) + 3 .49)
E(7)
= 0.0E(8)
= 10 . **(1 .00 * ALOG10(FSIZE) + 1 .38)AL(4)
= 10 . **(0 .062 * ALOG10(FSIZE) + 2 .146)
90
C CALCULATE THE COST OF FILTRATIONC CCF = CAPITAL COST FOR FILTER (EPA,1979)rC
FILTER UNITC
ECOST = 0 .32 * ALOG10(FSIZE) + 4 .72CCFU = 10 .**ECOST
E(1)
= RFT * 210000 .E(2)
= 10 . **(0 .968 * ALOG1O(FSIZE) + 2 .47)AM(1)
= 10 . **(0 .785 * ALOG10(FSIZE) + 1 .427)AL(1)
= 10 . **(0 .301 * ALOG10(FSIZE) + 2 .51)CC SURFACE WASHC
ECOST = 0 .24 * ALOG10(FSIZE) + 3 .955CCFS = 10 . ** ECOST
E(3)
= 0 .0E(4)
= 10 . **(0 .8877* ALOG10(FSIZE) + 1 .4585)AM(2)
= 10 . **(0 .139 * ALOG10(FSIZE) + 2 .0)AL(2)
= 10 . **(0 .486 * ALOG10(FSIZE) + 0 .69)

AM(4)
= 10, **(0,281 * ALOG1O(FSIZE) + 2 .24)CC
TOTAL CAPITAL COST FOR FILTER (CCF)C
CCF = CCFU + CCFS + CCFM + CCFBC IF PRETREATMENT INCLUDES MORE THAN FILTRATION 60 TO 10
IF( K GB .NE .4) GO TO 10K = 1GO TO 40
C*************************************************************C* CLARIFIER *C********~*********************************************~~*****C OVERFLOW = 1000 . GPD/FT2C CCC = CLARIFIER CAPITAL COSTSC CCA = CAPITAL COSTS FOR CHEMICAL FEED SYSTEMSCC
CLARIFIER UNITC
10 ECOST = 0 .322 * ALOG10(CSIZE) + 4 .01
CC
COAGULANTSC
BRANCH TO THE PROPER CHEMICAL FEEDC
GO TO (20v25930)PKGBCC
NALCO 7134 @ 1OPPMC
25 CCA = 20200DOSE = 5PRICE = 1 .50AMT = WF * DOSE * PRICE*340 .
E(11)= RFT * 8210 .E(12)= 17300 .
AL(6) = 198+AM(6) = 270 . + AMT
K = 2GO TO 40
CC
FECL3 @ 50 PPMC
20 DOSE = 50AMT = WF * DOSE/24+PRICE _ +10CCA = 10 . **(0 .278 * ALOG1O(AMT) + 4 .00)E(11) = RFT * (10+ **( .574 * ALOG10(AMT) + 3 .20))E(12) = 4900 .AL(6) = 10, **(0 .062 * ALOG10(AMT) + 2,396)
91
CCC = 10 . ** ECOSTE(9) = 0 .0E(10)= 10, **(0 .172 * ALOG10(CSIZE) + 3 .024)
AL(5) = 10 . **(0 .154 * ALOG10(CSIZE) + 1 .736)AM(5) = 10, **(0 .640 * ALOG10(CSIZE) + 0 .574)

AM(6) = 10 . **(0 .067 * ALOG1O(AMT) + 2,186) + PRICE*AMTK = 3GO TO 40
CC
ALUM @ 60 PPMC
30 DOSE = 60CONC1 = .5PRICE = .05AMT = WF * DOSE/24 .AMTC = AMT/CONC1CCA = 10 . **(0,232 * ALOG10(AMTC) + 4 .08)E(11) = RFT * (10, **(0 .574 * ALOG1O(AMT) + 3 .216))E(12) = 4900 .AL(6) = 10 . **(0 .062 * ALOG10(AMT) + 3 .97)AM(6) = 200 . + PRICE * AMT
K 4C***************************************************************C* REVERSE OSMOSIS *C***************************************************************C CCR = CAPITAL COSTSC
CC
PRETREATMENT CHEMICALSCC
SULFURIC ACIDC
CONC = 0 .96PRIC1 = 7 .40ADOSE = 15 .0/1 .8318AMT = ADOSE * RF/CONCCCB = 10 . **(0 .1186 * ALOG10(AMT) + 3 .82)
E(15) = RFT * 3680 .E(16) = 1630 .AL(8) = 10 . **(0 .330 * ALOG1O(AMT) + 1 .53)AM(8) = 10 . **(0 .222 * ALOG10(AMT) + 1 .56) + PRIC1 * AMT
9 2
40 CCR = 10 . **(0 .848 * ALOG10(RF) + 5 .89)E(13) = RFT * (10 . **(0 .901 * ALOG10(RF) + 5 .023))E(14) = 10 . **(0 .962 * ALOG1O(RF) + 6 .382)AL(7) = 10 . **(0 .188 * ALOG10(RF) + 3 .265)AM(7) = 10 . **(0 .886 * ALOG10(RF) + 4 .988)
CC CHLORINEC
IF(K .GT .1) CDOSE = 2 .IF(K .LE .1) CDOSE = 9 .PRIC2 = 0 .25AMT2 = WF * CDOSE/24 .CCD = 10 . **(0 .3625 * ALOG10(AMT2) + 3 .752)E(17) = 10 . **(0 .517 * ALOG10(AMT2) + 3 .448)E(18) = 10 . **(0 .173 * ALOG1O(AMT2) + 2 .58)
AL(9) = 10 . **(0 .1066 * ALOG10(AMT2) + 2 .53)

AM(9) = 10 . **(0 .177 * ALOG10(AMT2) + -2 .570) + PRIC2 * AMT2CC*************************************************************C*************
TOTAL COSTS
*******************************C*************************************************************C
SUML = 0 .ESUM = 0 .SUMM = 0 .ECSUM = 0 .SUMCL = 0 .DO 50 I = 1,20EC(I) = E(I) * PKWHESUM = ESUM + E(I)ECSUM = ECSUM + EC(I)
50 CONTINUEDO 60 J = 1,10ALC(J) = AL(J) * HOURLYSUML = SUML + AL(J)SUMCL = SUMCL + ALC(J)SUMM = SUMM + AM(J)
60 CONTINUEC
TOTAL CAPITAL(TCAP) AND O&M (TOM) COSTSC
TCAP = CCF + CCC + CCA + CCR + CCB + CCD +CCLTOM =
SUMM + SUMCL + ECSUMCC
ANNUAL CAPITAL COSTSC
AT = (1 + AI)**NF
= (AI * AT)/(AT - 1)DO 70 I = 1,10BNN(I) = ANN(I) * F
70 CONTINUEACAP = TCAP * FTCOST = TOM + ACAP
C
SELECT LEAST TOTAL ANNUAL COSTC
IF( TCOST .L T .TMAX) GO TO 80RETURN
80 KBOPT = KGBCFOPT = CFTMAX = TCOSTDO 90 I = 1,10BOPT(I) = EC(2*I-1) +EC(2*I) + ALC(I) + AM(I)AOPT(I) =(BNN(I)+BOPT(I))/340000
90 CONTINUERETURNENDSUBROUTINE OUTPUT(NHRS)
C
93

1SUMCL,SUMM,PKWH,HOURLY,AOPT(10),BOPT(10),AIDIMENSION T(4,4),AA(4,3),G(10,3)DATA AA/W
I'l NA','LCO ','7134',' FER','RIC ','CHLO','RIDE'r1 '
',/
/'t
ty'ALUM'/REAL MA
C READ IN THE NAMES OF THE UNIT PROCESSES ; COLS 2-17= PRESSURE FILTERC COLS 19-34= CLARIFIERY COLS 36-51= CHEMICAL FEED, COLS 53-68 =C REVERSE OSMOSIS
READ(5,5) ((T(I,J),I=1,4),J=1x4)5 FORMAT(4(1X,4A4))
C ASSUMPTIONSWRITE(6,220) HOURLY,PKWH,AI
220 FORMAT(///,T40,'ASSUMPTIONS',/,T30,'LABOR RATE = $',F6 .2,' PER HOU1R',//,T25,'ELECTRICAL RATE = $',F6,2,' PER KWH',//,T26,'INTEREST2RATE =',F7,2,'X',//,T25v'LIFE OF PROJECT =
20 YEARS',//)
C
TABLE OF ANNUAL COSTS AND FLUX DECLINE INDEXCC TABLE HEADINGSC
WRITE(6,10) (I,I=1,4074)C 10 FORMAT(/////,T20,'TOTAL ANNUAL COSTS FOR VARYING VALUES OF THE FLUC
1X DECLINE INDEX (B) AND THE CLEANING INTERVAL',//,T50rC
2'CLEANING INTERVAL(HOURS)',/,T3r'B',T5,1OI1O)CC B VALUES AND TOTAL ANNUAL COSTSC
-
WRITE(6,20) (BB(I),(TABLE(I,J),J=1,10),I=1,MK)C 20 FORMAT(/,(F5 .2,T10,10(F9,0,1X)))CC B VALUES AND COSTS PER THOUSAND GALLONS
DO 30 I = 1,MKDO 30 J = 1,NHRSTABLE(I,J) = TABLE(I,J)/340000 .
30 CONTINUEWRITE(6F40) (I,I=4,40v4)
40 FORMAT(////,T10,'COSTS PER KGALS FOR VARYING VALUES OF B AND THE C ,1LEANING INTERVAL',//,T30,'CLEANING INTERVAL(HOURS)'r/T8,'B',T10'21016)WRITE(6,50) (BB(I),(TABLE(I,J),J=1,10),I=1,MK)
50 FORMAT(/,T5,F5 .2,T10,10F6 .2)
94
CC
SUBROUTINE OUTPUT
COMMON /RO/ CT,F1,REC,AFD,AF,MA,RECOV,RFEED,CF , RF , MKCOMMON /FILTER/ FRATE,FOUT,FIN,FSIZE,RATIOPFF,VCOMMON /C/ CRATEYCINYCSIZECOMMON /UNIT1/ B,BB(20),TABLE(1Ox500),K,KM,TCOST,DOSE,ADOSE,CDOSECOMMON /UNIT2/ BN(10),BNN(10)COMMON /UNIT3/ E(20),AM(20),AL(20),EC(20),ALC(10),SUML,ESUM,ECSUM ,

C*******
OPTIMAL SYSTEM
* *
*C*********
*
*C***********************************************************************C---BRANCH TO OPTIMAL DESIGNC
GO TO (60,80,100,120),KC
60 WRITE(6Y70)70 FORMAT('1',/,T10,'THE OPTIMAL DESIGN REQUIRES FILTRATION ONLY')
GO TO 140C
80 WRITE(6,90) DOSE90 FORMAT('1',//,T10,'THE OPTIMAL DESIGN CONSISTS OF A CLARIFICATION/
CFILTRATION PRETREATMENT',/T20,'WITH NALCO 7134 POLMER ADDED AT ',FC4 .0,' PPM')GO TO 140
C100 WRITE(6,110) DOSE110 FORMAT('1',//,T10,'THE OPTIMAL DESIGN CONSISTS OF A CLARIFICATION/
1FILTRATION PRETREATMENT',/T20,'WITH FERRIC CHLORIDE ADDED AT ',F4 .20,' PPM')GO TO 140
C120 WRITE(6,130) DOSE130 FORMAT('1',///,T10,'THE OPTIMAL DESIGN CONSISTS OF A CLARIFICATION
C/FILTRATION PRETREATMENT',/T20,'WITH ALUM ADDED AT ',F4 .0,' PPM')C*******~***************************************************************C
FILTERC
140 D = (4 .*FSIZE/3 .1418)**0 .5C FILTER SPECIFICATIONS
WRITE(61150) FF, FRATE, FSIZE,D,V150 FORMAT(///,T40,'OPTIMAL SYSTEM SPECIFICATIONS',//,T10,'FILTER',/,
1T26,'INFLUENT FLOW :',F12 .2,T54,'MGD',/2T27,'LOADING RATE :',F12 .2,T54,'MGD'v/3T28,'FILTER AREA :',F10 .0,T541'SQUARE FEET',/4T31,'DIAMETER :',F10 .0,T541'FEET',/5T22,'BACKWASH VELOCITY :',F10 .0,T54,'FEET/MIN')IF(K .EQ .1) GO TO 170
CC
CLARIFIERC
D2 = (4 .*CSIZE/3 .1418)**0 .5JJ = K-1
CCLARIFIER SPECIFICATIONSWRITE(6,160) FF,CRATE,CSIZE,D2,(AA(I,JJ),I = 1,4)
160 FORMAT(//,T10,'CLARIFIER'1/,1T26,'INFLUENT FLOW :',F12 .2,T54,'MGD',/2T27,'LOADING RATE :',F12 .2,T54,'MGD',/3T25,'CLARIFIER AREA :',F10 .0,T54,'SQUARE FEET',/4T31,'DIAMETER :',F12 .2,T54,'FEET',/,T30,'COAGULANT :',4A4)
96

CC
REVERSE OSMOSISC
170 RECOV = RECOV * 100 .NM = IFIX(RFEED/(AFD*2 .3))RFEED = RFEED/(10 .**6)
CREVERSE OSMOSIS SPECIFICATIONSWRITE(6,180) RFEED,RATIO,RECOV,B,AFD,NM,MA,CT
180 FORMAT(//,T10r'REVERSE OSMOSIS ',//,1T26r'INFLUENT FLOW ;',F12 .2,T54r'MGD'r/,T27r'PRODUCT FLOW2',F12 .2rT254,'MGD'r/,T23r'PERCENT RECOVERY :',F12 .2,T54,'X'r/r3T17,'FLUX DECLINE INCEX (B) :',F12 .2r/,T27,'AVERAGE FLUX :',F12 .2r4T54r'GPD/FT2'r/,T20r'NUMBER OF MEMBRANES :',I9,/,5T29r'TOTAL AREA :',F12 .2,T54,'SQUARE FEET',/,6T13,'TIME REQUIRED FOR CLEANING :',F12 .1,T54,'HOURS')
CRO-CONTINUEDWRITE(6Y190) CF,ADOSE,CDOSE
190 FORMAT(' ',T22,'CLEANING INTERVALt',F12 .1,T54,'HOURS',/,1T17,'SULFURIC ACID INJECTED :',F12 .2,T54,'PPM'r/r2T22,'CHLORINE INJECTED ;',F12 .2,T54,'PPM')
C~>X~~%K :K**~K~>k>k>k~~~K>x~K~~~K~~*>X~>K~*>X>K~~~~~~~~~*>K>X~~C~~~~k~C>K** .K**>K~~>k>K~~*~~*~*~>x
C
TOTAL COSTS
CHEADINGS FOR THE UNITS PROCESS COSTSWRITE(6,200)
200 FORMAT('1',///,T25,'ENERGY AND LABOR ANALYSIS',//r1T13,'BUILDING ENERGY',2T35,'PROCESS ENERGY',T55r'LABOR'r/r3T12,'KWH/YR COST($/YR)',T32,'KWH/YR COST($/YR)',4T53,'HRS/YR $/YR')
CTOTAL AND ANNUAL COSTS OF UNIT PROCESSESC
WRITE(6Y210) (E(2*J-1),EC(2*J-1),E(2*J),EC(2*J),AL(J)1,ALC(J),J=1,10)
210 FORMAT(/,T7,'FILTER UNIT',6F9 .0,//,T6,'SURFACE WASH',6F9 .0,1//,T12,'MEDIA',6F9 .0r//,T9r' BACKWASH',6F9 .0r//,2T4,'CLARIFIER UNIT',6F9 .0,//,T8r' COAGULANT',6F9 .0r//,3T3,'REVERSE OSMOSIS',6F9 .0,//,4T5,'SULFURIC ACID',6F9 .0,//,T9,' CHLORINE',6F9 .0,//r5T10,'CLEANING',6F9 .0)READ(59213) ((G(J,I),I=1,3), J=1,10)
213 FORMAT(10(3A4,/))WRITE(6Y214)WRITE(6Y215) ((G(J,I),I=1,3),BN(J),BNN(J),BOPT(J),AOPT(J), J=1,10)
214 FORMAT(//,T35,'UNIT COSTS',//,T15,'TOTAL CAPITAL($/YR)',T37,'ANNUA1L CAPITAL',T54r'O & M ($/YR)',T67,'WATER COSTS($/KGAL)')
215 FORMAT(/,10(T5,3A4,T25,F8 .0,T45,F7 .0,T60,F7 .0,T75,F5 .2,/))CAP = 0 .RCAP = 0 .DO 217 I = 1,10IF(I,GE .7) GO TO 216CAP = CAP + AOPT(I)
97

GO TO 217216 RCAP = RCAF + AOPT(I)217 CONTINUE
ADD = CAP + RCAPWRITE(6r218) CAP,RCAP,ADD
218 FORMAT(/rT20r'COAGULATION/CLARIFICATION/FILTRATION $/KGAL=',F5 .2r1/,T10r'
REVERSE OSMOSIS SYSTEM $/KGAL=',F5 .2r2/,T10r'
TOTAL SYSTEM BIKGAL=',F5 .2)CCTOTAL COST AND PRICE/KGAL
CKG = TCOSTI340000 .WRITE(6r230) TCOST,CKG
230 FORMAT(///,T15r' THE PLANT PRODUCES 1 MGD PER DAY OF THE SPECIFIED1 QUALITY WATER'r/vT10r'THE TOTAL ANNUAL COSTS = $',F9 .0r14Xr2'COST/KGAL = $',F4 .2)RETURNEND
C
SUBROUTINE JDPLOT(JD,XVALSrYVALSrX1,Y1,KM)C
COMMON /SCLR/FX,DX,FY,DY,ITESTXrITESTYC
DIMENSION XVALS(100),YVALS(100),Z(105)C
DX = X1C
FX=0C
FY=0C
DY = Y1C
ITESTX = 1C
ITESTY = 1C
IF(KM .EQ .1) CALL CPLOT(3,JDr-1rXVALS,YVALSr1r1rZ)C
CALL CPLOT(3,JDr1,XVALSrYVALSr1r1rZ)C
IF(KM .EQ .4)
CALL CPLOT(3,JDr5,XVALS,YVALSr1r1'Z)C
RETURNC
END*RUN
98

APPENDIX C - DAILY RECORDS FOR LAS GALLINAS FACILITY
99

+ - EEPO ' GEBALL CLEANING- CHEMICAL AND SPONGELALL CLEANING
100
DAILY FLUX DATA - LAS GALINAS, CALIFCBNIA (1976-1980)TDS
IDS
TDS
FEEDLATE FEED BRINE PECDUCT FLOW GEM)
PECDUCTFLUX (GSF) RECOVERY
04/27/76
.0 16 .51 0 .4204/28/76
0.00 0 .0004/29/76
0 .00 12 .204/30/76
0.00 13 .9605/C 1/76
0 .00 10 .7605/02/76
0.00 10 .3305/C3/76
0 .00 10 .2905/04/76
0.00 10 .0205/C5/76
0 .00 9 .6335/06/76
0.00 8.180r,/C7/76
0 .00 8 .0605/C8/76
0 .00 7.5505/1C/76
0.00 5.9905/11/76
0 .00 5.5605/1 ;./76
0 .00 12.7205/1 .3/76
0.00 11.1905/ 14/76
0 .00 0 .0006/33/76
3.00 15 .3007/C 1/76
0 .00 11 . 1107/02/76
0.30 10 .21U7/C3/76
0 .00 11 .1907/06/76
3 .00 8.1807/C7/76
0 .00 7.6337/38/76
0 .00 6.8907/CS/76
0 .00 11.50:)7/10/76
0 .00 8.5707/ 12/76
0 .00 8.3007/ 13/76
0 .00 0.0007/ 14/76
0 .00 9 .6307/15/76
0 .00 8 .2207/ 16/76
0 .00 0.0007/21/76
0 .30 0.0007/23/76 .
0.00 0 .0007/24/76
0 .-00 7 .43C -1/26/76
0 .00 7 .1207/30/76
0 .30 0 .0007/ =1/76
0 .00 5.5638/02/76
0 .00 4.8508/C3/76
0 .00 4.5008/C4/76
0 .30 9.78

DAILY FLUX DATA - LAS GALINAS, CALIFCRNIA(1976-1980)TOS
IDS
TDS
FEED
PEODUCT08 LATE FEED BRINE PRCDUCT FLOO W(GGPS) FLUX (GSF) RECOVERY08/25
5/76 0.00 12.• 40
CE/26/76 0.00 0 .0008/27/76 0.00 10.8508/28/76 0.00 10 .4408/29/76 0.00 0.0009/28/76
0.00
19 .4409,LC/76
0 .00
17 .411 C/01/76 0.00 11.781C /C2/76 0.00 10.2510/03/76 0.00 5.821C /C4/7b 0.00 15.501 ./C5/76 0 .00 16 .631C/C6/76 0 .00 11 .3910/07/76 0.00 13 .701C/CE/76
0.00
9.51i 0/ 11/76 0 .00 11.941C/11/76 0.00 14.21lo/12/76 0.00 10.021C/ 13/76
0.00
10 .641 C/ 4/76 0 .00 9.201C/ 5/76
0 .00
8.331 C/ 5/76 0 .00 9 .231C/16/76
0 .00
7.54l 0/ 17/76 0.00 5 .971C/ lE/76 0 .00 4 .70
18/7 6
0 .00
11.191 C/19/76
0 .00
6 .791 0/23/76 0.00 6 .411C/21/76 0 .00 6 .1810/22/76 3.00 5 .831C/2 .3/76
0 .00
6.511 C/24/76
0.00
5.351 C/25/76
0 .00
4.931 C/25/761C/26/76 0 .00 7 .1210/27/76 0.00 6.81lc/26/76 0.00 6.2210/29/76
0 .00
5.68•
- EL'CNGEBALL CLEANING•
- CHEMICAL AND SPONGEEALL CLEANING
101

DAILY FLUX DATA - LAS GALINAS, CALIFORNIA(1976-1980)TDS
IDS
IDS
FEED
PRCDUCTLATE FEED BRINE PRODUCT PLOW IGPN) FLUX4GSF) RECOVERY
1C/ 3 C/76
0 . 0
6 . 2
1 1/C 1/76
0 .00
5.36•
11/C1/76 1150 1350 25 .0 6 .09 9 .16 0.3811/C2/76 1050 1450
87 .5
6 .07
7 .16
0.3011/03/76 1125 1553
92.5
6.04
6 .89
0.291 1/C4/76 1100 1200
9c . c
5 .97
6 .14
0.2611/05/76 1300 1403
85.0
5 .87
6.42
0 .2811/C6/76 1325 2300
27 .5
5 .62
6 .10
0 .2811/07/76 1250 1650
05.0
5 .97
5 .99
0 .2611/C6/76 1175
1550
95 .C
5 .77
5 .32
0.24+11/08/76 1275 1853
20.0
6 .11
7.36
0.311 1/CS/76 1 150
1600
E5 . C
6 .20
6 .93
0.2911/10/76 1350
1900
05 .0
5 .95
6.73
0.29l l/ 1 1/76 1 100
1550
90 .c
6 .09
6 .18
0.26l l/ 15/76 1200 1600
12.5
6.33
8.45
0.34l l/ 1 E/76 1075
1550
26.c
0 .00
0.0011/16/76 1075 1553
26.0
6.24
6.50
0 .27+11/16/76 1100 1600 90 .c 6 .53 7 .51 0.2911/17/76 950 1353 75 .0 6 .50 6 .89 0 .2711/18/76 1050 1450 90 . C 6 .14 6 .57 0 .27l1/IS/76 900 1130 82 .5 5 .91 6 .18 0 .2711/20/76 1300 1800 5r- . c 6 .03 6 .14 0.2611/21/76 1500 1900 62 .5 5 .95 5 .71 0.2511/22/76 1375 1750 32 .5 5 .84 5 .48 0 .2411/23/76 1200 2303 92 .5 5 .30 4 .85 0 .2311/24/76 1600 2250
8C . C
5 .44
4.58
0.22•
11/30/76 953 1.300 00 .0 5 .64 6 .57 0 .3012/C 1/76 900 1250
7C . C
5 .35
5 .56
0 .2712/C2/76 1050 1400
S5. c
6 .24
5 .40
0.2212/03/76 1110 1603
97.5
5 .63
4.89
0.2212/04/76 1 150 1960
lo . c
5 .83
5.52
0 .2412/05r,/76 1000
1300
82.5
5 .76
5.17
0 .23+12/06/76 1250 1800 32 .5 5 .96 6 .89 0 .3012/06/76 1150 1525 95 .0 6 .76 5 .83 0 .2212/C7/76 1000 1300 12 .5 6 .14 5.32 0.2212/C8/76 1330 170) 07 .5 .5 .86 5 .36 0 .2312/CS/76 1300 1350
12.5
5 .84
5 .32
0.2312/ 10/76 1250 15 .30 12 .5 7 .03 4 .70 0.1712/11/76 1150
1450
17 .5
5 .93
4 .81
0.21•
- SFONGEBALi CLEANING•
- CEEL1ICAL AND SPONGEBALL CLEANING
10 2
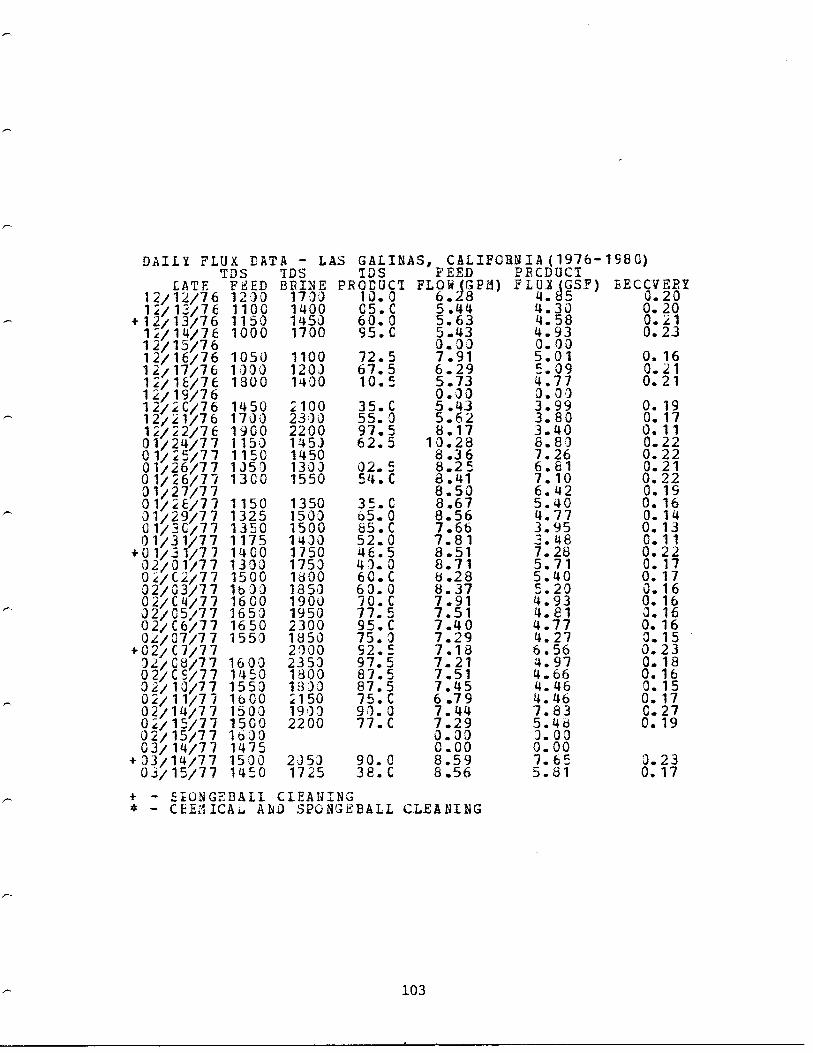
DAILY FLUX DATA - LAS GA.LINAS, CALIPCRNIA (1976-1980)TDS
IDS
IDS
FEED
PECDUCTLATE FEED BI?INE PRODUCI FLOW GP3) r LUx tGSF) LECCVERY
12/12/76 1210 1700
10.0
6 .28
4.55
0.201 2/ 13/76 1100 1400
05 .C
5 .44
4 .30
0.20•
12/ 13/76 1150 145J 60 .0 5 .63 4.58 0.2112/ i 4/76 1000 1700
95.C
5 .43
4 .93
0.2312/15/76
0 .30
0.0012/16/76 1050
1100
72.5
7 .91
5 .01
0.162/17/76 1300
120 :)
67 .5
6 .29
5.09
0.2112/1E/76 1800
1400
10.5
5 .73
4 .77
0.2112/19/76
0 .30
3 .0012/2C/76 1450 2100
35. C
5 .43
3.99
0.1912/1/76 1700 23)0
55.0
5.62
3.80
0.1712/22/76 1900 2200
97 .5
8 .17
3.40
0.1101/24/77 1150 1453
62.5
10.28
8.83
0.2201/25/77 1150 1450
8 .36
7.26
0.2201/26/77 1350
1300
02.5
8.25
6 .81
0.2101/26/77 1300 1550
54 .C
8 .41
7 .10
0.2201/27/77
8 .50
6.42
0.1901/2E/77 1150 1350
35 .C
8 .67
5.40
0.1601/29/77 1325 1500
65.0
8 .56
4.77
0.1401/3C/77 1350 1500
85 .C
7 .66
3.95
0.1301/31/77 1175 1400
52.0
7 .81
=.48
0.11+01/31/77 1400 1750 46 .5 8 .51 7 .28 0.2202/01/77 1330 1750 43.0 8 .71 5 .71 0 .1702/C2/77 1500 1800 60 .C 8 .28 5 .40 0 .1702/33/77 16'30 1850 60 .0 8 .37 5 .20 0 .1602/C4/77 1600 1900 70 .C 7 .91 4 .93 0.1632/05/77 165) 1950 77 .5 7 .51 4 .81 0.1602/Cb/77 1650 2300 95 .C 7 .40 4 .77 0 .1602/07/77 1550 1850
75 .0
7 .29
4 .27
0.15+02/07/77
2 ,100
52.5
7 .18
6 .56
0.2302/C8/77 1600 2350
97.5
7.21
4 .97
0.1814-0
1800
87 .5
7 .51
4.66
0.1602/10/77 1550 18)0
87 .5
7 .45
4 .46
0 .1502/ 11/77 1600
2150
75.C
6 .79
4.46
0.1702/ 4/77 1500 1900
90 .0
7 .44
7.83
0.2702/ 15/77 1500 2200
77 .C
7 .29
5 .46
0.1902/ 15/77 1600
0 .00
0.0003/ 14/7 7 1475
0 .00
0.00•
03/14/77 1500 2)50 90 .0 8 .59 7 .65 0 .2303/ 15/77 1450
1725
38 .C
8 .56
5 .81
0.17•
- SFONGE BALI CLEANING•
- CIEM1CAL AND SPGNGEBALL CLEANING
103

DAILY FLUX DATA - LAS GALINAS, CALIFORNIA (1976-1980)IDS
IDS
'IDS
FEED
PFCDUCTLATE FEED SHINE PRCEDCT FLOW GPM) FLUX {GSF) EECCVERY
03/16/77 1J50
1403
17.5
8.52
.ii0 3/ 17/77 1525
19 .25
62 .5
8 .64
6 .07
0 .• 1803/17/77 600 1953
65.0
8.66
4.35
0.1903/1/77 1625 1900
67 .5
8 .88
5 .63
0.1633/ 19/77 1700 1975
95.0
8.61
5.71
0.170=/2C/77 1700 1950
E5 . C
8 .70
4 .81
0.1403/21/77 1750 2303
65 .0
8 .82
5 .48
0.1603/22/77 1625 1850
60 . C
8 .65
4 .29
0.13+03/22/77 1650 2350
45 .0
7.89
6.89
0 .2203 3 77 16`0 1950 7c . c 8 .06 5.24 0 .1703/24/77 1600 1903 50 .0 8 .03 4 .70 0 .1503/25/77 1500 1750 50 .C 7 .92 4 .89 0.1633/i9/77 1550 2233 22 .5 5 .66 6 .07 0 .2703/30/77 1475 1825 67 .5 5 .61 4 .13 0 .1903/30/77 1550 2375 75 .0 4 .22 4 .44 0 .2703/31/77 15C0 2000 C5 . c 4 .19 3.56 0.2234/01/77 1500 2150 20 .0 4 .25 3 .29 0 .2004/C2/77 16CC 1900 17 .5 4 .77 3 .37 0.1804/03/77 1630 715J 4 .94 3 .33 C.1704/04/77 1450 1800
97 .5
4 .67
2.89
0.16+04,/04/77 600 2200 91 .5 4 .77 5 .32 0 .2904/C5/77 1600 2000 70 .C °4 .65 3 .87 0 .2104/06/77 16 50 2300 80 .0 5 .33 3 .51 0 .1704/07/77 1750 2250 97 .5 5 .47 3 .26 0 .1504/08/77 1850 2150 97 .5 5 .31 3 .02 0 .1504/C9/77 1700 2250 50 .c 4 .77 3 .15 0 .1704/ 10/77 1600 2230 87 .5 5 .25 2.99 0 .1504/ 1 1/77 1550
1900
65.5
4 .48
2 .79
0.16+34/ 11/77 160J 2050 87 .5 4 .20 4 .23 0 .2604/ 12/77 1500 1900 62 .5 4 .15 3 .68 0 .2304/13/77 1500 1600 65 .3 4 .11 -.23 0 .2004/14/77 1550 1900 07 .5 4 .21 3 .37 0 .2034/15/77 1500 1500 37 .5 3 .26 2 .95 0 .2304/16/77 1525 1700 65 .C 4 .16 2 .93 0 .1804/17/77 1300 1830 40.0 4 .34 3 .13 0 .1804/ 16/77 1475 1750
17 .5
4 .41
3 .09
0.18*34/18/77 1450 2209 01 .0 4 .19 5 .29 0 .3204/19/77 1500 1750 15 .C 4 .20 4 .59 0 .2834/20/77 1500 1650 13 .0 4 ;16 3 .35 0 .21/21/77 1480
1875
92.5•
- 5LCNGEEAII CLEANING•
- CEEVIICAL AND SPONGEBALL CLEANING
104

DAILY FlGX DATA - LAS GALINAS, CALIFORNIA(1976-1980)TDS
IDS
IDS
FEED
PBCDUCTLATE FEED EBINE PROIDCT FLOW tGPB) FLUXIGSF) EECCVERY
+04/21/77 1450 2100 20.0 4.53 0.2604/22/77 1200 1500 50 .C 4 .63 3.85 0.2104/23/77 1250 1700 65.0 4.47 3.E5 0.2204/24/77 13CO 1550 57 .5 4 .30 3.31 0.2004/25/77 1200 1480
48.5
4.21
3.15
0.19*04/25/77 1180 1975 43 .5 4 .59 4 .60 0.2604/26/77 1500 153J 62.5 4 .70 3.41 0.1904/27/7 -1 1475 1900 97 .5 3 .93 2.79 0.1804/28/77 1425 1625
79.0
3.92
2.65
C.17+04/28/77 1425 1775 54 .C 4 .41 3.54 0.2004/29/77 1503 1703 93 .0 4 .34 2 .97 0 .18C4/2C/77 1425 1650 67 .5 4 .13 2.61 0.16X05/ 01/77 1450 1453 55 .0 2 .55 2.32 0.2305/C2/77
0 .00
0 .00*35/02/77 1530 1975
02.5
3 .91
3.87
0.25C5/C3/77 15CO 1800
92 .5
3 .89
2.61
0.1705/04/77 1300 1900
92.5
4.21
2.32
0 .1405/C5/77
0 .00
0 .0005/05/77 1675
1903
27.5
5 .33
2.32
C. 1205/0/77
0.00
0 .0035/06/77 190J 2200
40.0
4 .16
2.58
0.1605/CS/77 17CO 1950
18.5
4 .20
2.34
0.14*05/C9/77 1680 2125 52.5 4 .67 3.37 0.1805/ 1 C/77 1650 1900 9C . C 4 .59 2.78 0 .1505/ 10/77 1625 1950 51 .5 4 .46 2.99 C .1705/ 1 1/77 1300
1200
57.5
4.54
2 .40
0.1405/ 2/77 330 1490
76.0
4.43
2 .40
0.14+05/12/77 1380
1550
64.C
4 .43
3 .23
0 .1905/ 13/77 16 50
1920
83 .0
4.59
2.65
0.1505/ 1 3/77 16C0 1750 15 . C 4 .61 3.00 0.1735/ 14/77 170) 1850 77.5 4 .69 2.43 0.1305/ 15/77 17CC 2000 10 . C 4 .12 2.48 0.150516/77 1350
1750
81 .5
4 .42
1 .94
0.11*05/ 16/77 1550 1800 26 .5 4 .66 3.26 0.1805/17/77 1500 1750 48.0 4 .59 2.58 0.1405/ 17/77 15b0 1730 91 .C 4 .71 3.73 0.2005/ 18/77 1500 1800 30 .0 4 .77 2 .74 0 . 1505/1S/77 1550
1850
27 .5
4 .81
2 .79
0 .15•
05/19/77 1550 2325 31 .0 4 .80 4.31 0.2305/2C/77 1580 1900
1C .C
4.83
3.40
0.18
•
- 5PONGEBAII CLEANING•
- CEE3ICAL AND SPONGEBALL CLEANING
105

DAI I Y FLUX DATA - LASTDS
IDSLATE FEED LEINE
05/20/7705/2C/7105/ 2 1/7 705/22/7705/23/77
#05/23/7705/24/7705/24/7705/25/7705/26/77
•
05/26/7705/27/7705/28/77C5/2S/77
*05,3C/770/ 31/7 705/ :1/7705/31/7705/31/7706/Cl/7706/C2/77
•
06/ C2/7 7*C6/C6/7706/ C7/7716/ C8/7 706/CS/77
+ 06/ C9/7706/ 1C/77C6/
10/77
06,'1 0/7 706/ 1 1/7736/12/7706/ 13/77
*06/13/7706/ 14/77J6/ 15/770 E/ 16/77
+06/16/77
GALINAS, CALIFORNIA (1576-1580)IDS
FEED
PFCDUCTPRCDUC2 FLCW(GFLI) FLIJX(GSF) FECCVERY
4.52 1 .51 0.201650 2100 22 .5 4 .56 4 .10 0 .231400 2050 20 .0 4 .61 15 0.171500
1400
65 .C
4 .54
2 .68
0.1515 JO 1830 20 .0 3 .55 2 .43 C . 181450
1980
C6 . C
4 .44
4 .51
0.260 .00
0.001450 1920
56 .5
4 .86
4 .25
0.22i 550
1700
10.0
4 .92
3.12
0.161380 1600
07 .5
4 .85
2 .90
0.151400
1720
44 .0
4 .99
3 .85
0.201450
1710
95.C
4 .90
3.33
0.171450
1650
02 .5
5.05
2 .82
C .141450
1950
10 .C
5 .03
3.13
0.161550
1830
17.5
5.30
2 .74
0.131750 2420
66.5
3 .97
4 .78
0.311730 2350
61 .5
3 .68
2 .90
0.203 .84
3 .05
0.203 .99 3 .13 C .201330 1600 25 .C 4 .74 3 .24 0.17
2J)0 2300 07 .5 5 .7 .3 2 .79 0 .122325 2650 68 .C 4 .74 2 .44 0.132730 3.300 81 .5 4 .39 31 .04 0 .182350 3280 CC .C 3 .53 4 .05 0.292350 2770 62 .5 4 .71 3 .14 0.17230J 23340 20 .0 4 .87 2 .53 0 .131950 2200 20 . C 3 .61 2 .14 0 .152)JO 2250 92 .5 4 .02 2 .92 C .1919CO
2250
F1 . ..
4 .11
2.77
0.174 .13
2 .71
0.171950 2320 85 .0 4 .48 2 .81 0 .161800 2350 6C .C 4 .54 2.58 0 .151750 2)00 55 .0 4 .58 2 .50 0 .141790 2050 46 .C 4 .53 2.43 0.141770 2450 65 .0 4 .55 4 .91 0 .2617C0 2000 32 .5 4 .46 3 .51 0 .201700 21J) 45 . 0 3 .48 J .31 0 .24165C 2050 47 .5 3 .74 2 .95 0 .201800 2 .330
20.5
4 .56
4 .40
0 .25•
- SSPONGEI3ALL CLEANING•
- CF EiIICAL AND SPO NGEBALL CLEAL+ING
106
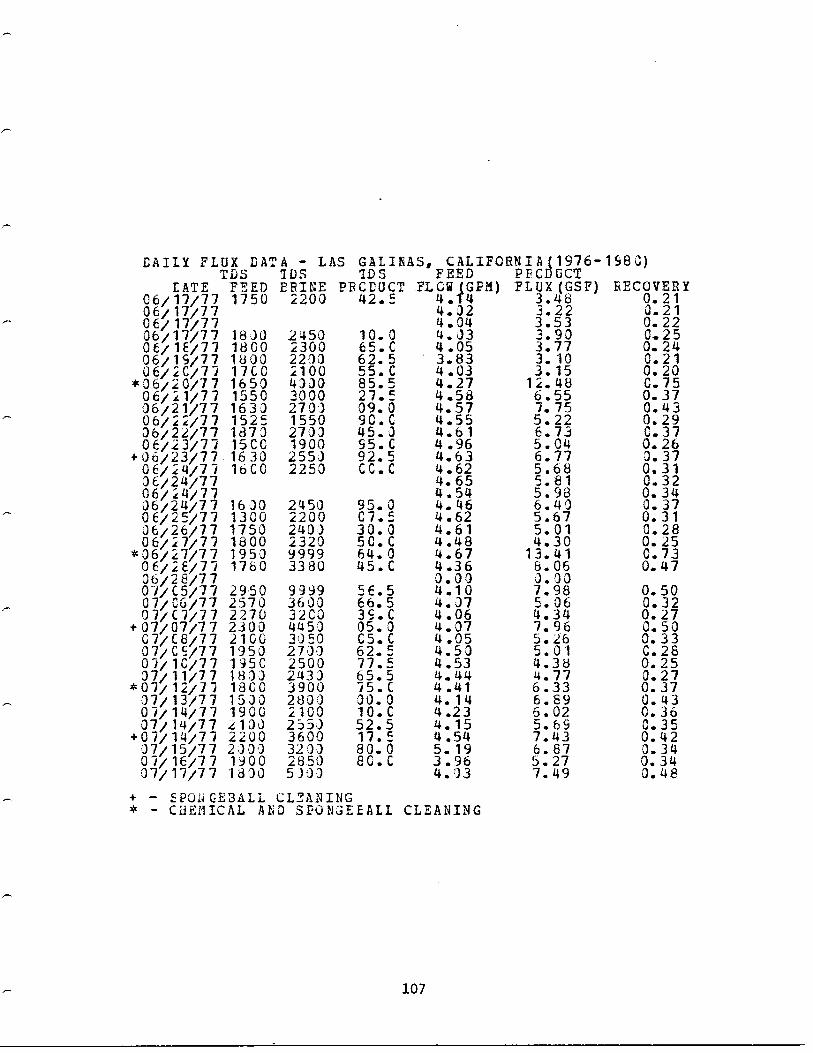
DAILY FLUX DATA - LAS GALINAS, CALIFORNIA(1976-1S80)TDS
IDS
IDS
FEED
PFCD UCTLATE FEED BRINE PRCLUCT FLCW (GPci) FLUX (GSF) TECOVERY
06/17/77 1750 2200 42 .5 4 .T4 3 .48 0 .2106/ 17/77 4 .02 3 .22 0 .2106/ 17/77 4 .04 3 .53 0.2206/17/77 1830 2450 10 .0 4 .03 3.90 0.2506/ 16/77 1800 2300 65 . C 4 .05 3 .77 0.2406/ 19/77 1800 2230 62 .5 3 .83 3.10 0.2106/2C/77 17CC 2100
55.C
4 .03
3 .15
0.20*36/20/77 1650 4300
85.5
4 .27
12.48
C.7506/ 2 1/7 7 1550 3000 27 .5 4 .58 6 .55 0.3706/21/77 1630 270) 09.0 4 .57 7.75 0 .4306/22/77 1525 1550 so . c 4,55 5 .22 0 .2906/22/77 1873 2703 45 .0 4 .61 6 .73 C .3706/23/77 15CC 1900
55 .C
4 .96
5.04
0.26+06/23/77 1630 255J 92 .5 4 .63 6 .77 0 .3706/24/77 16CC 2250 CC .C 4 .62 5 .68 0 .3106/24/77 4 .65 5 .81 0 .3206/24/77 4 .54 5 .98 0.3406/24/77 16 .00 2450 95 .0 4 .46 6 .40 0 .3706/25/77 1300 2200 C7 .5 4 .62 5 .67 0.3106/26/77 1750 240) 30 .0 4 .61 5 .01 0 .2806/27/77 1800 2320
50 . C
4 .48
4 .30
0.25*06/27/77 1950 9999
64.0
4 .67
13 .41
0.7306/26/77 1760 3380
45.C
4 .36
8 .06
0.4706/28/77
0 .00
0 .0007/05/77 2950 9999
56 .5
4 .10
7.98
0.5007/C6/77 2570 3600
66. 5
4 .37
5.06
0.3207/C7/77 2270 3200
39.C
4 .06
4.34
0.27•
07/07/77 2300 4450 05 .0 4 .07 7 .96 0 .50C7/C8/77 2100 3050
C5. C
4 .05
5.26
0.3307/C9/77 1950 2700
62.5
4 .53
5.01
C .280 -1/ 1C/77 135C 2500
77.5
4 .53
4.38
0.2507/ 11/77 18,00 243J
65 .5
4.44
4.77
0.270i/ 2/71 1800 3900
75 . C
4 .41
6 .33
0.3707/ 13/77 15J0 2800
30.0
4.14
6 .89
0.4307/ 14/77 1900 2100
lo. c
4 .23
6 .02
0.3607/14/77 2100 2550
52.5
4 .15
5.69
0.35+07/14/7 -1 2200 3600 17 .5 4 .54 7 .43 0 .4207/15/77 2300 3203 80 .0 5 .19 6 .87 0 .3407/ 16/77 1900 2850 8c . c 3 .96 5 .27 0 .3407/ 17/77 1800 5)00
4 . J3
7 .49
0.48•
- 5PJi GE3ALL CLEANING•
- CHEMICAL ALD SPONGEEALL CLEANING
10 7

.GAILY FLUX DAIA - LAS GALINAS, CALIFCRNIA(1976-1980)
+ - EPG j GEBALL CLEANING- CRE5ICAL AND SPONGEEALL CLEANING
FEED
PRO UC'"
108
LATE0 -1/1E/77
FEED BRINE PRCDUCT FLOW GPM)1850 2950
24.C
4 . 2FLUX GSF)
5 . 0RECOVERY
0 .38*07/16/77 1800 4900
77.5
4.34 12 .91 0 .7607/19/77 1750 2350
70.C
4 .45 6.66 0.3807/20/77 1700 29011)
45.0
3 .08 4.81 0 .4001/21/77 16CO 2300
30.C
3 .97 6 .13 0 .39+07/21/77 1600 1600
24. 5
3 .95 9 .09 0 .5907/22/77 1500 2300
35 .C
4 .28 6 .51 0 .3907/23/77 1800 2100
95.0
4 .16 5.32 0 .3307/24/77 14CC
1600
95 . C
4 .24 4 .42 0.2707/25/77 1430 2500
40.5
4 .42 4.49 0 .26*07/25/7 7 1430 3300
26.5
4 .20 15 .29 0.9307/26/77 1550 2530
45.3
4.35 6 .E9 0 .410 i/27/71 1500 2500
95 .C
3 .66 0.3507/28/77 2000 200)
25.0
3 .73 5.27 C .3607/2SS/77 2100 3200
75 . C
3 .64 4 .91 0 .34+07/29/77 1950 2900
20.0
4 .94 13 .48 0 .7007/ 31/77
24CO 2500
4 .08 6 .46 0.402100 2500
75 . 0
4 .42 5 . 22 0 .3008/ C 1/77 3300 4003
1 C . C
3 .40 4 .35 0 .33*J 8/01/77 3620
50.0
4.47 14.68 0 .840E/C2/77 3180 3780
15 .C
4 .47 6 .32 0.36J8/C2/77 3 .79 7 . 40 0.500E/C3 1 77 1300 3100
EC .C
3 .50 5 .37 0 .3908/C4/77 82 .5
3 .46 4.25 C. 3 1+0E/C4/77 2350 3470
25 .C
4 .45 0.340 6/ C 5/7 7 4 .66 5 .73 C .31CE/Cb/77 4 .86 5 .06 0 .27O C E/7E/
74 .55 5 .11 0 .29
165C 2046
43 .5
3 .96 4.26 0 .27#08/08/77 1650 2475
C6. 0
4 .30 14.36 0 .850c/C9/77 4 .46 6 .82 0.39CE/ 71/77
4 .32 5 .S4 0 .351530 2000
C7 .C
4 .19 5 .35 0.33+08/ 11/77 1584 2640
33 . 0
4 .13 7 .06 0 .4406/ 12/77 4 .29 5 .83 0 .3506/13/77 3 .83 4 . E6 0.32CE/ 14/77 3 .71 5 .01 0 .3508/15/77 1848 244
96 .0
3.651980 3300
01 .5
4 .354.71 0 .33
*CE/ 15/77 12 .71 0 .7508/15/77 1983 9999
15. 0
4 .53 12 .71 0 .72

+ - !FONGEBAIL CLEANING- CEEdICA1. AND SPGNGEBALI CLEANING
109
DAILY FLUX DATA - LAS GALINAS, CALIFCRNIA 1976-1980)TES
FEED
P&0 UCTTD :)
TL.FEED BRINE PRODUCT rLOW4GP?1) FLUX(GSF) RECOVERY
1 T
4 . 1A77C,0 88
76 . 0 0 .36
0 .3017/70E/ 18/77
+08/18/77 4 .33 7 .03 C .41OE/ 19/77 4 .13 6 .33 0 .3908/20/77 3 .85 5 .40 0 .3606/21/77 3 .95 5 .53 0.300 /•/~ 7165EX350
00 .35
4 .224 .17 12 .81 0 .78
38/23/7 7 1°3 00 2750 55 .0 4 .306 .07 3 6OE/24/77 2050 2650 E5 .C 4 .27 0.
08/25/77 2150 285J 10.0 4 .29 5 .95 0 .35+08/25/77 2150 2900 -)5 .C 4 .33 6 .6508/26/77 2150 3110 07 .5 4 .28 6 .22 0 .37CE/27/77 2050 3650 95 .C 4 .59 7 .28 0 .41OE/28/77 2300 2750 65 .0 4 .30
0 .00 0 .00OE/25/77*08/29/77 2150 3953 10 .0 3 .62 6 .64 0 .47Cc/ 3 C/77 21CO 2500 CC .C 2 .96 5 .78 0 .5008/31/77 1900 1753 52 .5 3 .47 0 .3609/C 1/77 24CO 3600 5t . C 3 .94 4 .99
+15/01/77 2300 28)1 50 .0 4 .32 6 .35 0 .40C5/C2/77 1900 2200 CS .C 4 .36 5 .06 0.3009/03/77 1750 2403 65 .0 4 .12 5 . 42 0 .34OS/C4/77 1950 2650 01 .5 4 .21 5 .22 0.3205/C4/77 1750 2270 62 .5 4 .32 4 .46 0 .26
*09/C5/77 1700 2680 E2 .5 4 .53 9 .67 0 .55C9/C6/77 1430 1500 05 .0 4 .63 5 .53 C .30OS/C7/77 15CO 2000 02 .5 3 .79 5 .47 0.3709/08/77 120 0 1633 45 .0 4 .03 5 .22 0 .33
+05/C8/77 1400 1000 CC . C 3 .77 6 .41 0 .4339/09/77 120J 123) 53 .0 3 .75 4 .96 0 .34C5/ C/7 -1 14CO09/ 11/77 1200
14001500
15 .C80 .0
3 .073 .35
3 .960 .34
C9/ 12/77 11 CO 2200 95 .C 3 .96 4 .65 0 .30*09/12/77 1810 25)1 65 .0 3 .56 9 .09 0 .6509/1---/7'7 16CC 1400 60 . C 3 .51 5 .06 0 .3709/1/77 11303 233) 20.0 4 .00 0 .31OS/15/77 175C 2400 95 .C 3 .91 4 .55
+J9/15/77 1753 2570 72 .5 3 .96 5 .99 0 .39

DAILY FLUX DATA - LAS GALINAS, CALIFORNIA j1976-1580)TiS
IDS
IDS
FEED
PECDUCTLATE FEED ERINE PRCEUCT PLOW GP"I) FLUX GSF) RECOVERY
OS/ 16/77 16CC 2100 C5 .5 4 .43 4.49 0.3009/17/77 1700 230) 45 . 0 4 .05 4.46 0.28CS/1E/77 1750 3350 40 .C 4 .05 4.46 0.2809/ 19/77 1820 2323
10.0
3 .86
4 .05
0.27*09/22/77 19CC 4000 25.C 3 .14 7.08 0.5809/23/77 1900 2100 85 .0 3.11 4.65 0.3809/24/77 17CC 3100 2C . C 3 .51 4.65 0.3409/25/77 17)0 1600 15 .0 3.13 5.94 0.4909/26/77 2030 2750
CC .C
3 .07
3.74
0.31*O9/26/77
4.35
6 .46
0.41* C S/2 x/77 2000 3400
92 .5
3 .97
6.66
0.4309/28/77 2100 26)0
75.0
3 .86
5.19
0.3405/25/77 21CO 5999
2.94
8 .11
0.7009/30/77
3.00
0.001 C/C 1/77 1900 2400
5r- . c
3 .38
5 .58
0.4210/02/77 1900 2730
75.0
3 .39
4. EO
0.361C/C3/77
0 .00
0 .0010/C4/77 1650 2553
95 .0
4 .05
8.42
0.531C/C4/77 1750 2925
47 .5
4 .37
7 .70
0.45i C/C5/77 1650 2233
05.0
4 .30
4.65
0.28i C/Cb/77 1600 2100
c5 . c
4 .34
4 .60
0.27‚
10/06/77 1730 210) 63.0 4 .04 7.13 0.451 C/C7/77 15CO 1800
15 .c
3 .99
5 .27
0.341 C/ 08/77
0.00
0 .001 C/C9/77 1600 2000
EC . C
4 .01
3 .93
0.2510,1 10/77
0.30
0 .001C/ 11/77 1480
1950
65. C
3 .96
4.43
0.291 C/ 11/77
4.47
5 .04
0.29‚
1 C/ i 1/77 1500 2080 3S . C 4 .54 8.97 0.511 0/ 12/77 1550 2000
20. 3
4.67
6 .51
0.361C/13/77 17CO 2400
CC .C
4 .66
5 .83
0.32‚
1011 13/77 1600 31)) 20 . 0 4.33 9.71 0.571 C/ 14/ 1 7 1900 3400
9C . C
4 .00
6.25
0.4010/15/77 2 100 2700
75.0
4.12
4.96
C.311C/1E/7-1
0.00 0.0010/17/77 1800 2230
25.C
4.20
5.E9
0.361C/ 1E/77 23C0 2800
85 . C
3 .78
5 .02
0.341 C/ 18/77 2)5J 4150
35.0
3 .06
8 .21
0.691C/19/77 2300 3400
75 .C
3 .06
4 .85
0.4010/20/77 1630 2650
30.0
3.39
4 .50
0.37
‚
- 5POi GEBALL CLEANING‚
- CHEMICAL AND SEONGEEALI CLEANING
110

+ - EPONGEBALL CLEANING- CHEMICAL AND SPONGEEAIL CLEANING
111
CAILY FLUX DATA - LAS GALINAS, CALIFCRNIA 1976-1980)FEED
P E0 aUCTTDS
TDS
TESLATE FEED BRINE PRCCUCT FLOW GPM)
+1C/2C/7 -1 1400 1900
15 .c
2 .8 FLUX (GSF)6 .71
RECOVERY0.65
10/21/77 1700 1800
10 .0
2 .57 4 .23 21C/22/77 1650 2500
5 7 .5
3 .31 4 .31 0.3310/23/77 1550 2203
27 .5
3.3110/24/77 1500
1100
45 .0
3 .35 4 .03 0.311 C/25/77 1500 21810
22.5
2 .99 3.72 0.32*1C/25/77 1550 2300
79 .C
4.28 6 .66 0 .4010/26/77 1600 22-00
20.0
4.30 5.22 C.311C/27/77 16CO 1700
15.C
3 .91 0.30+10/27/77 16 00 - 130
75.0
3 .83 5 .471C/28/77 17CO 3300
5 5.C
3 .70 4 .99 0.3310/29/77 1900 2630
05 .0
3.861C/30/77 15CC 2500
E7 .5
3 .85 4 .96 0 .331C/31/77 1509 233)
45.0
3 .72 4.23 0 .29*1C/31/776CO 2300 50 .c 3 .80 6 .51 0 .4411/01/77 1575 1675
30.0
3 .89 5.04 0 .3311/C1/77 1600
1850
60 .C
4 .27 4.87 0 .2911/02/77 1700 2200
95.0
4 .25 5.47 0 .3311/03/77 1550
1800
40 .C
3 .81 5 .22 0 .35+11/03/77 1200 1833
95.0
3 .82 4 .75 0 .3 211/C4/77 14CO 2100
95 .C
3 .8011/05/77 1403 2700
00.0
3 .12 4.55 0 .3711/C6/77 14CO
1900
95 .C
3 .14 4 .13 0.3485 .0 4 .37 0 .34* 11/07/77 1400 2130
4 .35 6 .20 0.3611/08/77 16JO 260)
45.0
4 .30 5 .17 0 .3111/ 0/77 15CO 2300
55.C
4 .08 5 .01 0.311 1/ 10/77 1550 1603
35.0
3.80 4 .86 0 .3311/11/77 1600 2300
1C .C
3 .91 4 .34 0.281 1/ 12/7 7 23 00 27')3
50.0
3 .911 1/ 13/77 29CO 3700
cc . c
3 .89 4 .28 0 .28.3 .79 0 .25
* 1 1/ 14/77 2950 4300
65 . C
3 .80 5 .37 0 .361 1/ 15/77 2600 38JJ
25.0
2 .34 4.49 0 .491 1/ 6/7 -1 2200 2900
cc . c
3 .87 4 .50 0 .3011/17/77 1833 2500
85 .0
4.04 4 .45 0 .2811/1E/77 17CO
1800
CC. C
3 .84 4 .18 0 .28+ 1 1/ 18/77 1730 2503
75 .0
3 .34 4 .78 0.3211/19/77 1650 2150
37.5
3 .76 4.10 0 .2811/20/77 1550
1850
52.5
3 .75 3.87 0 .26

LAILY FLUX DATA - LAS GALINAS, CALIFCRNIA(1976-1980)TDS
S
FEED
PRODUCTLATE FEED BRINE Pt CDUCT FL04ƒ jGPM) FLUX (GSF) FE000ERY
11/21/77 1575 2000
12 .
/
b5‚
11/21/77 1575 2350 80 .0 3 .97 5 .33 0 .3411/2E/77 2050 3 300
C5 . c
4 .32
7 .59
0.4511/29/77 1900 2503
90.0
4.37
4 .70
0.2711/_C/77 18CO 2200
C7 .5
4 .40
5 .42
0.3212/01/77 1800 2400
75.0
3 .49
3 .93
0.2912/C2/77 1700 3000
6C.C
3 .52
4 .80
0.3512/02/77
0 .00
3 .00+12/C3/77 16CO 3300
75.C
4 .15
8 .47
0.5212/04/77 1500 2)03
25.0
3 .73
5 .32
0.3612/C5/77 1575 2350
34.C
4 .29
6 .16
0.3712/06/77 1500 220J
05 .0
4 .37
4.E1
0..2812/C7/77
0 .00
0.0012/08/77 1400 2003
85 .0
4.30
5.27
0.31+12/CE/77 16CO 3200
65.C
4 .28
7.33
0.4412/09/77 2100 2500
70.0
0.33
0 .0012/10/77 2750 3600
52 .5
3 .68
4 .16
0.2912/ 11/77 3200 4200
15 .3
3 .72
82
0.2612/ 12/77 3450 4450
62 .5
3 .67
3 .67
0.26‚
12/ 12/77 3550 9999 75 .0 4 .20 7 .11 0 .4312/13/77 38 CC 4850
55 .C
4 .38
5 .27
0.3112/14/77 3000 37J0
85 .0
4 .29
5.01
0.3012/ 15/77 18CO 2300
6C . c
3 .81
5 .01
0.3412/ 16/77 1950 2100
25.0
3 .88
4.75
0.31‚
12/ 16/77 1400 25 . C 3 .66 5 .83 0 .4112/ 17/77 1330 1500
80.0
3 .56
5 .17
0.3712/1E/77 15CO 1700
60 .c
3.49
4 .93
0.3612/19/77 1700 2500
60.0
4 .05
4 .50
0.28‚
12,/19/77 1800 2400 20 .C 3 .66 6 .35 0 .4412/23/77 18JO 293)
07.5
3.83
4 .E6
0.3212/21/77 1500 2800
97 .5
3 .64
4,75
0 .3312/22/77 1700 2500
65 .0
3 .83
4,75
0.32‚
12/22/77 175C 2620 32 .5 3 .81 6 .25 0 .4212/23/77 1200 2 :300
92 .5
3.70
5 .78
0 .4012/24/77 16CC 2000
45 .C
3 .07
5 .22
0.4312/25/77 1900 2600
55.0
3 .47
4 .70
0 .351.2/26/77 19CO 2200
30 ..C
3 .47
4 .36
0.3212/27/77 1900 260)
71.5
3 .46
4.02
0 .30‚
12/27/77 18CC 2850 46 .5 3 .59 8 .28 0 .5912/2E/77 1600 2603,
22.5
3 .72
b.30
0.43‚
- EFOl' GEBAL1 CLEANING‚
CUE1ICAL AtD SPONGEEALL CLEANING
112

+ - SPON GEBALL CLEANING'~ - CHEMICAL AbB SPONGEEALL CLEANING
113
DAILY FLUX DATA - LAS GALINIAS,. CAL.IFCRNIA 1976-1980)TDS
TLS
IDS
FEED
PRO UCTLATE FEED BRINE PRCDUCT FLOG GPM)
12/2 :/77 1400 2000
90 .C
3 .81FLUX(GSF)
5 . 3RECOVERY
0 .38+12/29/77 1350 1800
35.0
3.77 8 . 26 0 .5612/3C/77 14CO 2300
97 .5
3.80 6 .41 0.4312/31/77 1400 1530
25.0
3 .81 5 .42 0.360 1/C1/7b 1000
1900
7C .C
3 .95 4 .70 0.3001/C2/78 1350 150J
92.5
3 .89 4.28 0 .2801/C3/7E 12CC 1620
56.5
3 .78 4 .26 0 .29*01/03/78 12,30 2700
31 .5
4 .12 10 .85C 1/C4/78 1300 2100
85.'C
4 .10 6 .66 0 .4101/05/78 1400 16))
95 .0
3 .30 5.27 C. 4101/C6/78 950 1500
C7 .5
3 .30 4 .80 0 .37+31/06/78 1300 1550
70 .0
3.85 9 .09 C.60G1/Q/78 1350 2800 2C . C 3 .80 6 .61 0 .4401/ C8/78 16')0 2450
82 .5
3 .74 5 .350 1/ 09/78 1380
1420
C2 .5
3 .74 4 .64 0 . 32*31/C9/78 1100 2875
11 .0
2.16 5 .4b 0 .6401/1C/78 1200 2100
CS .C
4 .36 7 .65 0.4501/ 11/78 1400 2350
60.0
4.36 6 .20 0 .360 1/ 12/78 1500
1600
35.C
4 .20 5 .27 0.32+0 1/ 2/78
2230
60.0
3.88 10 .53 G .6901/13/7E 1300
1500
3C .C
3 .87 5 .63 0 .3731/14/78 700
830
10 .0
3.81 5 .22 0.3501/ 1`_/78 7C0
1000
40 . C
3 .68 4 .80 0 .3301/ 16/78 750 10J0
45 .0
3 .66 4 .73 0 .33*Cl/16/7E 750 2200
92 .5
3 .70 13 .31 0 .710 1/ 17/78 7)0 1500
50.0
3 .69 8 .37 0 .5801/16/76 8CC
900
6C.C
3 .72 6 .87 0.4701/19/78 700 1)53
10 .0
3.86 5 .91 0 .39+01/19/7E 700
950
3C . C
3 .34 10 .17 0 .781 1 /23/78 875 1400
65.0
3 .27 7 .28 0 .5701/21/78 9CU
1400
47 .5
3 .23 6 .05 0.4801/22/78 950 1200
00.0
3.24 4 .99 0 .3901/6/76 950 2100
6C . C
3 .19 4 .31 0 .35*31/23/78 1000 1600
72 .5
4 .34 10 .95 0 .6401/24/78 975 1500
50 . C
4 .40 7 .20 0 .429 1/25/78 1 000 11)0
90 .0
3.22 4.96 0 .3901/26/7E 12CC
1500
15 .c
3 .25 4.65 0 .37+01/27/78
2203
85 .3
3 .52 10 .64 0 .7701/26/78 1100
1850
22 .5
3 .52 5 .94 0 .4301/29/78 1750
1350
10.0
3 .54 5 .04 0 .36

CAIIY FLUX DATA - LAS GALINAS, CAIIFCRNIA(1976-1980)TDS
ADS
TES
FEED
PRODUCT
+ - EFOiGEBALL CLEANINGCHE1ICAL AN SFONGEEALL CLEANING
1 14
LATE FEED BRINE PRCDUCT FLGW(GRI)950 1350
75 .C
3 . 0FLUX (GSF)
4 . 1RECOVERY
0 .31*01/38/78 1300 2700
35.0
3 .56 10.17 C .731100
95 .C
3 .602400 6 .15 0.4402/C1/78 975 1)00
15.0
3 .23 4.99 0 .3902/C2/78 1100
1600
40 .C
3 .12 4 .68 0 .38+02/02/78 1100
1225
70.0
3 .19 7.75 0 .6202/C3/78 1100
1600
77 .5
3 .27 5 .58 0.4402/C4/78 1300 1953
85.0
2 .85 4.44 0 .4002/C5/78 1000
1200
80 .0
2 .93 4 .k3 0.3702/C6/78 950 1753
32.5
2 .87 3.97 0 .35C2/C6/78 1025 2800
E5 .C
3 .99 11 .67 0 .7502/C7/78 92 .5
3 .84 7 .49 0 .5302/CE/7E
9001 850 20 .C
3.97 6 .77 0 .4402/09/78 35 .0
3 .56 5 .78 0 .41+02/C9/78 600 1175
30 .C
3 .60 9 .61 0 .7002/10/78 800 1950
72.5
3.59 7 .65 0 .5402/ 11/76 d50
1400
50 .C
3.93 6 .59 0 .4302/12/78 800 1200
37.5
3.80 5 .65 0 .38C2/ 13/76 6CC
950
C C . C
3 .72 5 .76 0 .4002/14/78 700
90')
20.0
3.63 5.01 0 .35*02/ 14/78 7CC
60.C
3 .25 11 .57 0 .9132/15/78 800 210 .)
60.0
4.21 7.49 0 .4502/ 16/78 32 .5
3 .93 6 .10 0 .4002/17/78 i 90)800
39 .0
3 .91 5.58 0 .36+02/ 17/76 700
1100
90 . C
3 .62 8.57 0 .61J 2/ 18/7 8 1300
1550
25.0
3 .51 6.61 0 .4802/ 1S/78 700
900
7C . C
3 .51 5.42 0 .3902,/20/78 75
350
05.0
3 .54 4 .65 0 .34 -0 .2/21/78 8CC
1115
47 .5
3 .49 4 .23 0 .31J2/ 22/7 8 700
850
65.C
3.80 l- .43 0 .9002/23/76 2100
CC. C
3 .79 6 .35 0 .4302/24/78 11,311
85.0
3 .71 5 .42 0.37+02/24/78 900
1300
3C . C
3 .62 1 0 .95 0 .7702/25/78 950 2200
90.0
3 .63 5 .94 0.4202/26/76 900
1700
E5 . c
3 .72 5 .06 0 .3502/27/78 980 138 .)
75.0
3 .64 4 .34 0 .30C2/27/78 1000
1175
J5 . C
3 .63 4 .39 0 .31*02/ .27/78 98) 2930
42 .5
4 .01 11 .43 C .73C2/26/78 1050
1800
C6 .C
3.18 5 .67 0 .4603/01/78 1300
133) 60 .0
3.19 4 .75 0 .38

DAILY FLUX DATA - LAS GALINAS, CALIFCFNIA(1976-1980)TDS
IDS
TDS
FEED
PRODUCT
+ - SPUN CEbALL CI2AUING- CHEMICAL AND SFONGEEALL CLEANING
115
LATE FEED BRINE FRCDUCT FLOW (GPM) RECOVERY03/C2/78 1200 1600
40 . C
3 . 1FLUk3GSF)
4 . 9 0 .35+33/02/78
3 .221900 7 .23 0 .5703/C3/75 900
3C.C
3 .21 0 .4903/04/78 800 1800
75.0 5 .27 0 .4203/C5/78 700
900
6E.C
3.23 5.01 0 .4003/C6/78 800 1203
75.0 0.35*03/C6/78 850
35.C
3 .1503/07/78 1000 240)
10.0
3.0612 .356 .40
1 .00 . 53
03/07/78
3 .49 7 .05 0 .521)00 1200
00.0
3.37/ CE/78 8 .01 0.6103
03/1200 2200
E5 .C
2 .82 5 .94 0 .54C 9/7 8 800 1000
20.0
2 .82 5 .58 0.50800 1000
85. C
3 .25+33/10/78 900 2575
82 .0
3.268 .898 .99
0 .700 .70
03/ 13/78 1000 2900
65 .C
4 .41 12.19 0 .71*03/13/78 1000 3453
70.0
4 .22 12.69 0 .770 3/ 13/7L, 1000 2150
32 .0
4 .19 10.73 0 .6503/ 14/78 925 1500
68.0
4.30 7.13 C . 420 3/ 15/78 950 1250
8C .C
4 .28 5 .99 0 .3603/ 16/7 8 975 1400
82 .0
4 .34 5 .84 C .34+ 0 3/ 16/7 8 925 1200
25 .C
4 .03 11 .67 0.7403/17/78 900 150-)
20.0
3 .75 9 .4) 0 .641000
1500
SC.C
3 .80 6 .40 0 .431 ,9/73/ 19/7 8 900 1210
90.0
3.750 / 5 .58 0.38., /78 7CC 1000
2E . C
4 .09 4 .96 0 .3103/20/78 900 1350
22.0
3 .76 5 .01 0 .34* 0 -/ 2 C/7 E 975 1950
1 8 . C
3 .63 13 .33 0.9403/20/78 110 0 2150
58.0
3.26 10.76 0 .840 3/ 2 1/7 E 980
1700
90 .0
3 .64 6 .61 0.4603/21/78
3.83 6 .82 C .4603/21/78 1000 2000
72 . C
3 .82 7 .57 0.5103/22/78 1000
1425
15.0
3.81 6 .04 0 .40990
1100
CO. C
3 .76 5.11 0 .35+03/23/78 975 2103
62.0
3 .90 11 .14 0.731000 2200
02.C
3 .7803/ 25/ 78 6 .74 0 .46
950 1500
90 .0
3.74 5 .50 0.3803/26/78 950 1350
85 .C
3 .75 5.06 0 .35950 1453
95 .0
3 .76#03/2 7/ 78 1000 1"100
7E . C
3 .604.52 C .31
13 .2 .2 0 .9403/ 8/78 1350 1730
92.C
3.69 5 .91 0 .41

GAILY FLUX DATA - LAS GALINAS, CALIFCIENIA(1976-1980)TDS
IDS
PRODUCTLATE FEED BRINE PRCDUCT FLOW (GPM) FLUX (GSP) RECOVERY
03/29/78 1250 2800 89 .C 3 .69 5 . L4 0 .3503/30/78 1300 2303
60.0
3 .77
4.75
0.32+03/30/78 1300 1700 CO . C 4 .13 11 .21 0 .6903/31/78 1230 1901 35.0 4 .06 6 .16 0 .3903/31/78 1150 1700 26 .C 4 .08 5 .64 0 .3504/01/78 1)00 1950 92 .0 4 .15 5 .54 0.3404/C2/78 1050 1450 CC .C 4 .10 5 .40 0 .3404/03/78 1030 1400
82 .0
4 .14
4.93
C.30*04/03/78 LOGO 2500 92 .C 4 .04 11 .96 0 .7604/C4/78 1050 1120 18.0 4 .07 6 .38 0.4004/05/78 900 1400 S5 . C 4 .08 5 .53 0.3504/06/78 1JJO
13)0
,00.0
4 .10
4 .91
0.31+04/C6/78 1000 1200 52 .C 3 .91 10 .33 0 .6804/07/78 900 1800 40 .0 3 .97 6 .64 0 .43C4/C8/78 1200 1150 15 .c 4 .55 5 .83 0.3304/C9/78 1100 1951 25 .0 4 .14 5 .27 0 .3204/10/78 1000 1500
C5 .C
3 .85
4 .55
0.30*34/10/78 1050 3600 80 .0 4 .12 14 .62 0 .9104/ 11/78 1050 1850 38 .C 4 .05 6 .04 0 .3804/12/78 1 .000 1400 10 .0 4 .15 5 .40 0.3304/ 13/78 1000 1350
00 . C
3 .96
4.85
0.31+04/13/78 55 .0 4 .09 11 .57 0 .7204/ 14/78 1000 1700 20 . C 4 .09 6.20 0 .3904/15/78 1 .)00
1403
95.0
3 .89
5.11
0.3404/ 16/78 900 1250 6E . C 3 .96 5 .11 0.3304/17/78
0 .00
3 .03*04/17/78 950 4200 9C .C 3 .62 12 .91 0.9104/16/78 950 1600 74 .0 3 .65 6 .46 0.4504/ 19/78 1000 1300 05 .c 3 .64 5 .17 0.3604/23/78 1030 1425
98 .0
3.76
4 .80
0.33+C4/2C/78 1000 2000 5c . c 3 .99 11 .05 ' 0 .7104/21/78 1000 1503 95 .0 3 .84 6 .56 0.4404/22/76 10CC 1400 25 .C 3 .83 5 .53 0 .3704/23/78 800 1400 00 .0 4 .24 5 .53 C .3304/24/78 925
1250
20 .c
3 .91
4 .68
0.31*04/24/78 980 2730 35 .0 4 .20 11 .83 C .7204/25/78 975 1550 65 . C 4 .22 6 .80 0.4104/26/78 600 1100 35.0 4 .37 6 .56 0 .3804/27/78 750
1100
28.C
4 .22
6 .14
0.37+04/27/78 830 1175
65 .0
0 .00
5 .58+ - 8PONGEBALL CLEANING
- ChEMICAL AED SPOlNGEBALL CLEANING
116

LATE FEED
04/29/789C0
04/2C/785 / C1/78 850*005/02/78 95005/03/78 11CO05/C4/78 1J0J
+05/C4/78 100005/05/78 1000CE/ C6/78
1 9J0J5 /C07/78 900*05/08/78 90005/CS/78 95005/10/78 1000C5/ 11/78 1000
‚ ,35/ 1 1/78 100005/ 12/78 375J5/ 13/78 80005/ 14/78 100C05/ 15/78 93 .3
*05/ 15/78 950
05/ 17/78 95035/18/78 950
+05/1E/78 95005/19/78 875C5/2C/78 95005/21/78 95)05/22/7E 975
*35/22/78 - 97505/23/78 110005/24/78 133305/25/78 110C
‚ 05--/25/78 15 0005/26/78 115005/27/78 75005,2E/78 90005/29/78
DALLY FLUX DATA - LAS GALINAS, CALI .FCRNIA 1976-1980)'"DS
IDS
'IDS
FEED ‚ PFC UCTERINE FRCDUCT PLOW (GP) FLUX(GSF) RECOVERY1195
22 .C
3 . 8
7 .49
0.541300
80 .0
4 .11
6 .89
0.4395 .c 4 .28 6 .23 0.37
1200 55 .0 4 .48 5 .73 C.331650 20 .C 4 .22 1-5 .86 0.781550 64 .0 4.26 7.15 0 .431450 90 .0 3 .95 5 .53 0 .3614JO 95 .0 4 .09 5 .06 0.321300 65 .C 4 .07 11 .88 0 .7510333 90 .0 4.15 6 .92 0 .431650 Cr-.c 4 .34 5 .86 0 .351250 68 .0 4.36 5.27 0 .311225 72 .C 4 .26 4 .91 0 .292153 62 .0 4 .24 13 .79 0 .831450 7C .C 4 .52 6 .64 0.381400 95 .0 4 .46 5 .68 0 .331100 80 .0 4 .53 5 .22 0 .291403 28 .0 4 .09 8 .78 0 .551100 05 .0 4 .37 7 .80 0 .461300 15 .0 4 .83 6 .10 0 .321700 95 .C 4 .28 5 .58 0 .331250 89 .0 4 .40 4 .60 0 .282600 32 . C 4 .36 12 .71 0 .7517) 0 82 .0 4 .32 7 .28 0.431450 20 .0 4 .30 6 .51 0 .39130) 72 .0 4.32 5 .17 0 .311825 92 .0 4 .31 9 .23 0 .551350 80 .0 4 .22 6 .71 0 .411350 9C . C 4 .30 5 .48 0 .331350 00 .0 4 .32 5 .53 0 .331175 CO . C 4 .74 5.17 0 .282300 50 .0 3 .91 13 .12 0 .861825 94 .( 4 .42 6 .88 0.401150 90 .0 5 .06 5 .54 0 .301300 6C .C 5 .06 5 .37 0.272300 55 .0 5 .25 12 .19 0 .591800 40 .C 5 .22 8 .11 0 .401630 15 .0 5 .37 5 .73 0 .271200
E5 . C
5 .31
6 .61
0.3210 .0
5 .19
6 .15
C .30
‚
- EPON GESALL CLE AN IL4G‚
- CHEMICAL AND SPONGEEALI CLEANING
11 7

LAILY FLUX BATA - LAS GALINAS, CALIFCANIA(1976-1980)TDS
TDS
TES
FEELATE FEED BRINE PRODUCT FLOW (GPM) FLUX (GSF) RECOVERY05/25/78 1025 1400 45 .C 5 . 7 6 . 5 0 .31
*05/29/78 1050 9999 35 .0 3 .94 14.77 0 .9605/3C/7E 1150 1900 38 .C 5 .61 8 .52 0 .3905/31/78 2300 2800 10 .0 5 .53 6 .56 0 .3006/C1/78 1750 1800 35 .C 5 .56 5 .63 0 .26+06/01/78 1600 3500 00 .0 5 .84 12.29 0.540°/C2/78 .1200 1800
60 .C
5 .97
9 .40
0.4006/03/78 1130 17)0
35.0
5 .79
7.05
03106/C4/7b 11C0
1600
35 .C
5 .84
7 .36
0:32 -06/ .45/78 1050 1525
26.0
5 .78
6 .67
G.29*0°/C5/78 1050 4053 39 .C 4 .27 13.25 0.7936/06/78 1000 1600 50.0 4.31 5.60 0.33C6/C6/78 1000
1600
50 . C
4 .29
7 .08
0 .42Ob/C7/78 1050 1150 50 .0 4 .42 6 .25 3.36C6/C8/78 22CC 3000 GC . C 4 .06 3 .92 0 .25+06/C8/78 21J0 29,30 55 .0 4 .08 12 .81 0 .8006/C9/78 2000 3000
5C .C
4 .22
6 .92
0.4236/ 10/78 2350 3300 75 .0 3 .93 5 .06 0 .3306/11/78 1600 2400 45 .0 3 .96 4 .65 0 .3006/12/78 15J0 2330 74.0 4.39 4.47 0.28*06/ 12/76 1250 2300 C5 . C 4 .81 10 .02 0.5.306/13/78 950 1950 34 .0 4 .86 9 .30 0 .4906/ 14/78 1700 2900
1 C . C
4.69
b .35
0.35‚ 06/15/78 950 2350 25 .0 4 .90 11.47 0.63C6/ 16/78 1700 2600
50 .C
4 .94
8 .93
0.46,36/17/78 1600 24 ,30
65 .0
5.32
7.67
0.3906/18/78 1650 3300
68 .C
5.04
6 .71
0.3406/19/78 1425 1925 73 .0 4 .89 5.90 0.31*06/ 15/78 1150 2250 5c . c 5 .97 13 .12 0 .5606/19/76 1153 225J 50 .0 4 .75 12 .81 C .69C6/2C/78 1750 3800 S5 . c 4 .70 8.47 0.4606/21/78 2500 440J 75 .0 4 .77 7.J7 0.3806/22/78 28CC 3500
25 .C
4 .74
5 .73
0.31‚
36/22/78 35JJ 9999 50.0 4 .79 11.67 0.6206/24/78 39CC 6000 CO . C 4 .94 9 .23 0.4806/26/78 1350 1450 62 .0 4.31 4 .71 0 .28
*06/26/76 1020 1600 E2 . C 4 .98 7 .59 0 .3906/27/78 1300 1230 40 . 5 .00 5 .27 0 .27C6/28/76 1000 1300 42 . C 4 .87 5.32 0.2806/29/78 3430 2103
28.0
3 .89
4.44
0.29‚
- SiONGEBALL CLEANING‚
- CHEAICAL AEL SPGNGEEALL CLEANING
118

DALLY FLUX DATA - LAS GALINAS, CALIFORNIA(1976-1980),"Ds
TDS
TLS
FEED
PRODUCTLATE FEED BRINE PRCDUCT FLOW (GPM) FLUX (GSF) RECOVERY
+06/29/78 2000 4750 38 .C 4 .17 12 .F1l 0 .7806/30/78 1 100 2003 45 .0 4.61 9 .56 0 .53C7/C1/78 850 1400 C0 .C 3 .99 6 .51 0.42,17/02/78 15 JO 2103 10 .0 3 .97 4 .39 C .2807/0/78 1725 2050
3C .C
3 .92
3 .23
0.21*j7/03/78 1550 2750 50 .0 4 .30 12 .60 0.7507/C4/7E 35C0 5999 00 .0 4 .09 8 .57 0.5407/C5/78 9999 9999 75 .0 3 .38 10 . 12 0.77C7/C6/78 1000 1700
55 .C
3 .38
6 .71
0.51+07/C6/78 170 ;) 353)
65.0
3 .76
12 .29
0.8407/C7/78 2000 2700
50 .c
3 .80
6.61
0.4407/C8/78
0.30
0 .0007/C9/78
0 .00
0 .0007/ 0/78 350 1203
76 .0
4.30
4 .99
0.30*07/ 1C/78 920 1780 95 .C 4 .27 9 .49 0 .5737/11/78 1100 1903 10.0 3 .82 6 .79 0 .4507/12/7,b 725 1100 30 . C 3 .83 5 .01 0.3307/13/78 1400 2103
70 .0
4 .14
4 .55
0 .28+07/13/78 15CC 3000 CB .C 3 .85 6 .71 0 .4507/14/78 725 1)00 02 .0 4 .02 7 .03 0 .4507/ 15/78 1200 1700 lo . c 3 .96 5.17 0.3307/16/78 800
1100
85.0
3 .79
.3 .87
0..26o -i/17/78 15C0 2000
88 .C
3 .83
4 .34
0.2907/17/78 1450 2800 35 .0 4 .20 9 .74 0.59O7/18/78 1000 1700 CC . C 4 .13 5 .94 0 .3707/19/78 1100 1900 38 .0 4 .24 6 .66 0 .40C7/2C/78 1200 1700 65 .c 4 .21 5 .11 0 .31
+07/20/78 1400 185 .0 75 .3 4 .02 7 .26 0 .46C7/21/78 1750 2500 72 .C 4 .0.5 6 .46 0 .4107/22/78 1903 27)0 35.0 4 .19 5 .45 0 .3 .307/23/78 15)0 2103 02 .0 4 .15 4.86 0.3007/24/76 1450 1950
E2 . C
4 .09
4.57
0 .29*07/24/78 1430 2733 98 .0 4 .12 8 .80 0 .55C7/25/78 120C 1800 5C . C 4 .22 6 .14 0 .3707/26/78 1230 175) 80.0 4.40 5 .63 C .3307/27/78 1000
1100
55 .c
4 .29
5 .20
0.31+07/27/78 1353 2150 50 .0 4 .28 9 .82. 0 .59C7/2E/78 950 1600 35 .C 4 .15 6 .34 0 .39J7/29/78 850 1253 38 .0 4 .18 5 .40 0 .33C7/---C/78 950 1300 65 . C 4 .22 5 .05 0 .31
+ - E OdGEBALL CLEANING- CBEMICAL AND SPONGEEALI CLEANING
119

+ - SEGNGEBALL CLEANING- CHEMICAL AND SPONGEBALL CLEANING
120
DAIIY FLUX DATA - LAS GALINAS, CALIFCRNIA (1976-1580)TDS
LATE FEED07/31/78 1050
IDS
'IDS
FEEDBRINE PRCLUCT FLOW tGPM)
P1CDUCTRECCVERY
0 .97FLUB
. 3GSF)
3303 00 . 0
1 .32*07/31/76 1250 3450 4 .49 12 . 17 0.6908/01/78 1025 02 . 3
4 .60 7.47 0 .42CE/C2/78 1100 1500 50 .C
4 .61 7 .28 0 .4008/03/78 1050 1450 19 .0
5 .13 5 .53 C . 280E/C3/78 6 .31 8 .58 0 .3508/C3/7 8 2180 45 .0
4 .22 4 .83 C .29OE/C4/7b 1100 5G . C
5 .58 10 .69 0 .4908/C5/78 1103 140) 63 .0
5 .62 9.40 0 .43CE/C6/78 1100 1600 38 .C
5 .54 8 .76 0 .41OE/C7/78 1300 1325 88 .0
5 .54 8.14 0 .38*0E/C7/78 1000 1600 38 .C
5 .40 12 .44 0 .5908/OS/78 1300 2150 38 .0
5 .55 12 .56 0 .58OE/(S/78 975 1600 C2 . C
5 .42 10 .72 0 .510 8/ 1 0/78 1 350 1630 12 .0
5 .47 8.3) 0 .390„/11/78 1000 1300 98 . C
5 .57 7 .12 0.3308/ -2/78 12=00 2353 50 .0
5.52 6.77 0 .3106/13/78 1100 2000 CO .C
5 .56 6 .69 0 .321050 115) 92 .0
5.51 5.87 0 .27*08/ 111,/78 1100 2300 3C . C
5 .57 11 .39 0.52J 8/ 15/7 8 1100 1350 10 .0
5 .76 9.09 0 .40CE/ 16/78 5 .49 11 .07 0.52
1603 2603 82 .0
5 .33 8 .68 0 .42CE/16,7E 1900 2100 3-r- . C
5 .61 9 .30 0.4208/19/78 1700 2653 88 .0
5 .24 7 .29 0 .3608/20/78 16 00 2300 S2 . C
5 .53 7 .49 0 .3508/21/78 1500 1930 33 .0
5 .44 9 .28 C .4406/22/78 1350 2300 75 .C
5 .54 7 .44 0 .3408/23/78 00 .0
5.04 6 .57 C .4306/24/78 1450 2100 3 C . C
4 .66 6 .66 0 .370„/25/78 50 .0
4 .42 E.63 0 .5006/26/76 11 C0 1950 15 .C
4 .62 8 .99 0 .5008/27/78 11)o 2330 25 .0
4 .34 7.90 0 .4608/2„/76 825 1550 15 .C
4 .34 4 .15 0 .2406/28/78 800 135) 70 .0
5 .54 13 .22 0 .610E/2S/78 1000 1950 42 .C
5 .48 10 .53 0 .4908/30/78 1300 1300 15 .0
5 .12 10 .12 C .510„/31/7„ 1100 1500 70 .C
5 .76 9 .50 0 .4209/C 1/78 950 135) 95 .0
5.65 9.53 0 .4309/C2/78 1100 2150 C7 . C
5 .45 10 .89 0 .51

+ - EEONGEBAIL CLEANING'a - CHH ICAL AND SPONGEBALI CLEANING
121
DAILY FLUX DATA - LAS GALINAS, CALIFCRNIA ('1976-1980)TDS
LATE FEEDIDjBEI1E PRODWCI FLCW
FEED PECDUCT(GPM) FLUX GSF) EEC CVERY
09/03/78 1 )JO 1207 90 .0 5 .45 10 .19 0 .4809/C4/78 11C0 1900 5 5 .0 5 .39 10 .53 0.5009/05/78 300 1353 00 .0 5 .44 9 .30 0 .44
0.5409j07/78 1170 170) 13 .0 1 8 .264 .97 0 .4209/C8/78 1100 1700 98 .C 5 .49 7 .65 0 .3639/09/78 1200 1630 50 .0 5 .54 7 .23 C.33C9/ 1C/78 1000 1300 65 .C 5 .60 7 .85 0 .3609/11/78 80) 1300 95 .0 5 .49 7 .75 0 .36
*Cc/ 1/78 2000 58 .0 5 .33 13 .74 0 .6639/ 12/78 2200 .3403 95 ..0 5 .83 10 .02 0.4405/13/78 1700 2800 95 .0 5 .37 7 .40 0 .3509/ 14/78 2500 4000 33 .3 5 .38 12 .17 0 .5809/ 15/78 2000 3000 CC . C 5 .34 8 .30 0 .4009/ 16/78 1500 2300 85 .0 5 .39 8 .06 0 .3809/17/78 1800 2150 50 .C 5 .37 7 .08 0 .34,39/18/78 1250 1700 10 .0 5 .30 6 .50 0 .31
*05/ 16/78 125C 2850 32 .C 4 .51 12 .05 0 .6809/ 19/78 3603 49 ,13 00 .0 4 .55 6 .46 0 .36C9/2C/78 1000 1700 CC .C 4 .04 6 .50 0 .4109/21/78 1100 1503 15 .0 4 .67 6 .07 0 .33
+09/21/78 11CO 1400 90 .0 4 .53 11 .54 0 .6509/21/78 1150 2430 70 .0 5 .24 12 .29 0 .6009/2`/78 900 1900 SC .C 3 .65 11 .78 0 .8209/23/78 1300 1737 20 .0 4 .49 7 .43 C .4209/24/78 1000 1400 3C .C 4 .46 6 .73 0.3909/25/78 1 :)03 120) 80 .0 4 .27 5 .56 0.33
*05/25/78 925 1780 "14 . C 4 .48 1 .5 . 18 0 .8709/26/78 1400 2553 12 .0 4 .33 7 .83 C . 4o09/26/78 1150 2350 SC .C 4 .11 9 .00 0 .5609/26/78 1050 223) 00 .0 4 .39 8 .92 0 .5209/27/78 950 1550 7C .C 4 .34 6 .97 0 .4109/27/78 950 1800 40 .0 4 .17 8 .84 0 .5409/2E/78 1000 1700 90 .C 4 .46 6 .42 0.37+09/2E/78 950 1750 62 .0 4 .34 14 .24 0 .8409/25/78 9CC 3900 35 .C 4 .39 9 .31 0.5409/30/78 90 .) 1530 88 .0 5 .56 8 .73 C .400 1/ 12/79 2000 3700 2C . C 3 .68 7 .36 0.5131/13/79 1500 235-.) 18 .0 3 .71 5 .52 C . 38Cl/14/7 11; 1200 1700 5E . C 3 .66 4 .77 0 .33

DAILY FLUX DATA - LAS GALINAS, CALIFCRNIA (1976-TDS
'IDS
IDS
FEED
PECDUCTLATE FEEL BRINE PECLUCT FLGK GPM) FLU (GSF)
01/15/79 850 1))J
95.0
7*01/15/79 1050 2850
20.C
4 .77
12 .090 1/16/79 110)
1300
45 .0
4.72
8 .450 /17/7S 120C
1600
75 . C
5 .01
6 .18+01/ 18/79 1200 5100
78.0
4.95
14.440 1/1S/79 700 1600 30 .0 4 .96 7 .8301/20/79 1250 1800
35.0
5 .14
6 .810 1/ 2 1/7 9 1250 1750 so . c 5 .02 5 .4801/22/79 1100 1600
85.0
4 .91
5.17*01/22/79 1250 9999 62 .C 5 .03 13 .4201/23/79 1500 2250 02 .0 5 .10 6 .7301/24/7S 15CC 2000 1c . c 4 .91 5 .1701/25/79 1400 1703
40.0
4.83
5.28+01/25/75 1400 2400 3c . c 4 .64 13 .4201/26/79 1400 2930 25.0 4 .15 5 .2801/27/79 1450 2000 35 .0 4 .06 4 .7301/28/79 1500 1850 50.0 4 .19 4 .4201/29/79 1400
1600
5c . c
4 .28
4 .15*01/29/79 2200 2830 65 .0 4 .20 13 .0301/29/79 16CC 3400 65 .C 5 .66 13 .0301/30/79 1500 2500 25 .0 5 .50 7 .0401/31/79 15CC 2500 55 .C 5 .01 9 .7002/01/79 1600 2000 80.0 4 .94 6 .9302/C2/79 1300 2300
22 .C
4 .76
5 .60+02/02/79 1300 2103 00 .0 4 .88 11 .6602/C3/79 1350 2700 30 .0 4 .70 6 .6102/04/79 1250 1833 23.0 4 .77 5 .5602/C5/79 1250 1500
C5 .C
4 .65
5 .17*32/05/79 1430 4750 50 .0 4 .49 12 .72C2/(b/7S 1300 2400 95 .0 4 .11 6 .1802/06/79 1 :100 260) 3J.0 4 .51 1 .5502/C7/79 1400 2000 30 .C 4 .16 4 .9302/0-8/79 1200 2_)33
25.0
4 .12
4.54+02/CE/7S 1200 1800 90 .0 4 .51 13 .7302/09/79 1200 2)00 45 .0 4 .51 6 .930~/ 1C/75 1400 1950 55 .0 4 .77 6 .0702/11/79 1350 130J 85.3 4.97 5 .4002/12/7S 1300 1350 45 .C 4 .29 4 .8102/13/7S 1400 1903
65 .0
4 .89
4 .15*02/13/7S 1400 2500
E0 . C
3 .99
14 .52+ - EFONGEBAIL CLEANING# - CHriICAL AND SPONGEBALL CLEANING
1 22
1980)
FECCVERY0 .370 .650 .460 .320 .750 .400 .340 .280 .270.680 .340 .270 .280 .740 .330 .300 .270 .25C .790 .59C.330 .50C.360 .300 .610.360 .300 .280.720 .380 .430 .300 .280.780 .390.320.280.290 .220 .93

DAILY FLUX DATA
LAS GALINAS, CALIFCRNIA(1976-1980)TDS
IDS
IDSLATE FEED BELNE PRC.DUC'i02/ 14/79 650 1200 70 .0
02/14/79 750 1050 60 .C02/ 15/79 950 130J 70 .002/15/79+32/15/79 1303 3200 55 .002/16/7S 1000 1600 C2 . C02/17/79 1 :)00 1500 82 .002,1E/79 1000 1500 95 .C02/ 19/79 1 300 1600 85 .o02/20/79 10CC 1300 72 .C*32/20/79 950 29)0 10 .002/21/79 750 1300 62 .C
+0 2/22/79 11450 4100 02 .002/23/79 900 1100 55 .C02/24/79 875 1150 68 .002/25/79 900
1100
E2 .C/1/
50 91200
1 C2 .950*02/26/7S32/27/79 1000 1730
95.002/27/7902/27/7902/27/75 1000 4200 05 .C02/28/79 1030 1600 95 .003/(1/7S 900 1250 52 .C+03/01/79 90) 1400 08 .003/C2/79 900 1400 90 .C03/03/79 950 1500 82 .003/C4/75 650 2000 C5 .C03/05/79 850 110) 80 .0
*03/C5/79 1750 3000 35 .C03/06/79 1575 2450 25 .0C3,C6,7903/C6/79 1450 9999 45 .0C3/C7/7c 1700 2700 7C .C03/08/79 1600 22J0 20 .003/C9/79 1600 2100 30 .C03/ 10/7 9 1500 2053 22 .003/11/7S 1500 2000 55 .C03/ 12/79 165) 2)50 28 .0*03,12/75 800 1400
7C .C+ - SLGNGEBALL CLEANING* - CLEc11CAL AND SPGNGEEALL CLEANING
1 23
FEED
PFCDUCTFLOW GPM) FLUX IGSF) FECCVERY
5 .' 5 9 .27 C .470.350 .260 .460 .810 .410 .600 .300 .340 .300 .610.410 .570 .400 .360.360 .270 .600 .361 .000 .920 .88C. 4 00 .310 .660.43C .360.240.270 .510 .370 .930 .800 .450.360 .36C . 3 50 .281 .00
10 .019 .745 .835 .475 .523 .436 .006 .016 .026 .146 .206 .847 .026 .985 .846 .776 .356 .434 .033 .924 .594 .674 .705 .525 .185 .205 .145 .567 .647 .403 .784 .054 .024 .073 .613 .644 .163 .994 .44
13 .819 .74
10 .6017 .378 .808 . 106 .978 .027 .04
14 .569 .94
15 . 1810 .969 .948 .187 . 08
1 9 .0415 .7714 .1715 .317 . 325 .7914 .288 .697 .324 .815 .87
15 .2610 .6413 .7312 .767 .045 .795 .054 .934 .934 .33
17 .37
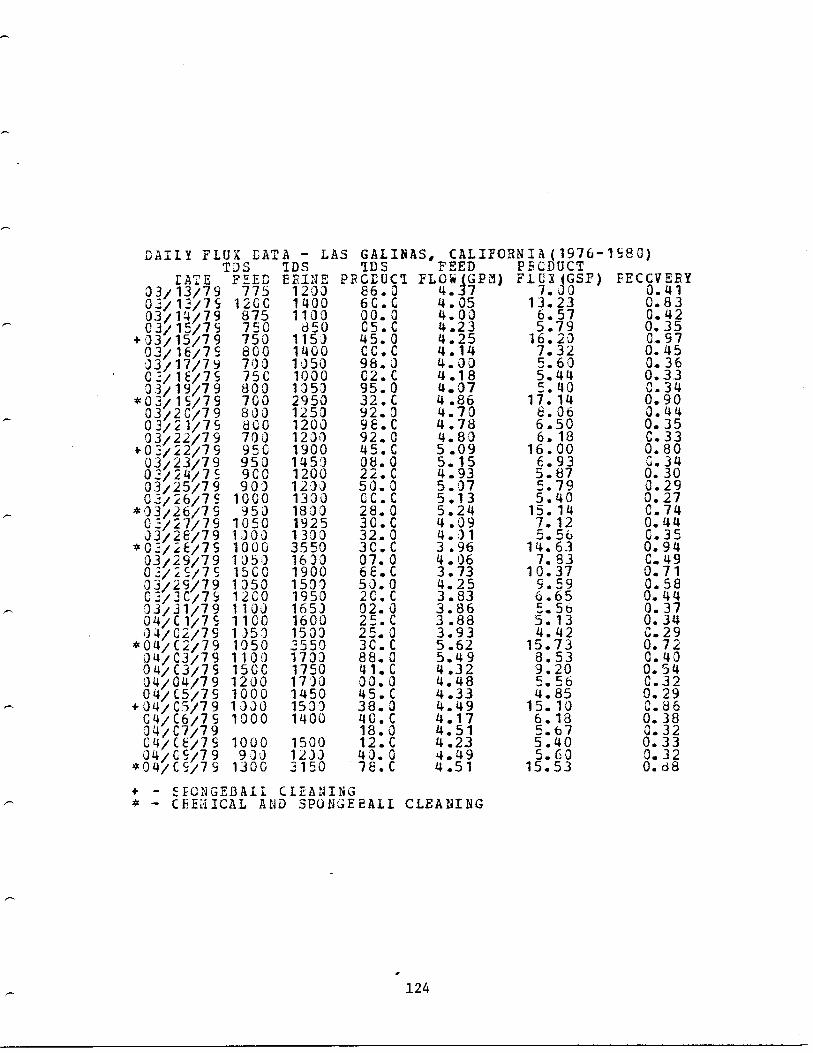
DAILY FLUX DATA - LAS GALINAS, CALIFORNIA(1976-1580)TDS
'IDS
FEED
PECDUCTLATE FEED EFINE PRCEUCT
03/ 13/79 775 1200 86 .00 1/12/75 12GC 1400 6C .C03/ 14/79 875 1100 00 . 003/15/7S 750
850
05 .C+03/15/79 750 115) 45 .003/16/75 800 1400 CC .C03/ 17/7 9 700 1)50 98 .002/1E/75 75C 1000 C2 .C03/19/79 800 1353
95.0*0--/l9/79 700 2 32 .C03/2C/79 800 1253 92 .00 1/21/7S 800 1200 98 .003/22/79 700 12J0 92 .0+03/22/79 95G 1900
45.C0 .3/23/79 950 1453 08 .003/24/7_ 900 1200 22 .C03/25/79 90) 123) 50 .00 ; /26/7S 1000 1300 0 C . C933/26/79 950
1800
28.00_/27/79 1050 1925
30 .C03/28/79 1)00 1 300 32 .0*03/2E/7S 1000 3550 3C .C03/29/79 1050 1630 07 .003/25/79 15GC 1900 6E .C03/29/79 1350 1590 50 .0C --/ 3C/7S 1200 1950 2C . C03/31/79 110J
165)
02.004/01/75 1100 1600 25 .C04/C2/79 1350 1503 25 .0*04/02/79 1050 '550 3C .C04/C3/79 1100 1703 88 .004/03/79 1500 1750 41 .004/04/79 1200 171)0 00 .004/05/79 1000 1450 45 .0+04/C5/79 1330 1533 38 .004/C6/79 1000 1400 40 .C04/C7/79 18 .0C4/CE/79 1000 1500 12 .C04/09/79 930 1203 43 .0
*04/05/7 9 1300 3150
7E . C+ - ZECNGEBALL CLEANING
- CEEiICAL AND SPONGEEALL CLEANING
FLOijGPiy) FLGR (GSF) FECCVERY4 . 7
7. 0 0
0.414 .05 13 .23 0 .83
0 .420.350 .970.450 .360 .330 .340.900 .440.35C . 330.800.300 .290 .270 .740 .44C . 350 .94C . 490 .710 .580.440 .370.29
0.720 .400 .540 .320 .29C.860 .380 .320 .330 .320 .68
4 .034 .234 .254 .144 .004 .184 .374 .864 .704 .784 .805 .095 .154 .935 .075 .135 .244 .094 .)l3 .964 .063 .734 .253 .833 .863 .883 .935 .625 .494 .324 .484 .334 .494 .174 .514 .234 .494 .51
6 .575 .79
16 .207 .325 .605 .44
17 .148 .066 .506 . 18
16 .006 .935 .875 .795 .4015 . 147 .125 . 5b
14 .637 .83
10 .379 .596 .655 .565 .134 .42
15 .738 .539 .20
564 .85
15 . 105 .16 75 .405 . 60
15 .53

+ - E):ONGEBALL CLEANING' - CL1aICAL AND SP0N EEALI CLEANING
1 25
DAILY FLUX EATA - LAS GALINAS, CALITCENIA(1976-1980)TDS
'DS
'IDS
FEED
PrCDUCTLATE FEEL EBINE PRCEUCT FLCW (GPE) FLUX {GS F) FECCYERY
04/10/79 1230 1939 90 .0 4 .78 7 . r04 0 .3804/ 1C/7504/11/79
15001450
34502230
52 .C00 .0
5 .385 .05
16 .40 0 .784504/ 11/79 1450 3850 46 .C 3 .61 10 .21 0 .7204/12/79 1330 1500 00 .0 3 .54 5 .40 0 .39
04/13/75 120C 1800 5 5 .C 2 .99 4 .15 0 .3534/14/79 1130 1503 22 .0 3 .38 3 .99 0 .3004/15/79 1150 1550 6C .C 3 .12 4 .4b 0 .3704/16/79 1250 1110 75 .0 3 .24 2 .54 0 .20*04/ 16/79 13CC 9999 2E . C 4 .38 0 .8304/ 7/79 2300 3 703 65 .0 2 .98 1 5 .67C4/ E/79 950 1250 CE .C 3 .71 5 .05 0 .35
*04/ E/79 950 3500 70 . 0 5 .08 18 .00 0 .9104/1=/79 95C 1553 SC .C 4 .14 6 .81 0 .4204/15/79 150) 1550 90 .0 3 .78 7 . 16 0 .4804/15/79 1350 2550 60 .C 3 .03 7 .47 0.6304/19/79 22J0 2753 88 .0 3 .89 7 .79 0 .5104/2C/79 1 .300 1550 50 .C 3 .b5 4 .81 0.3404/20/79 105J 1653 00 .0 4 .53 7 .43 C. 4204/21/75 100C 1700 22 .C 3 .9904/22/79 1333 13JJ 35 .0 3 .48 5 .56 0.4104/23/75 95C 1500 CE .C 3 .00 4 .34 0 .3704/24/7S 9)0 1730 10 .0 5 .15 6 .42 0 .3204/25/75 1000 1100 2C .C 4 .61
*04/25/79 1200 2)33 58 .0 5 .48 13 .51 0 .8604/26/75 1100 1600 25 .C 3 .73 7 .67 0.5334/27/79 1100 1530 45 .0 5 .39 7 .04 0 .3304/2E/79 1200 170J 12 .C 5 .45 7 . 16 0.3434/29/79 1100 1630 98 .0 5 .43 6 .89 0 .3204/3C/75 1000 1500 85 .C 5 .39 6 .42 0 . 30
*34/30/79 11JO 3150 50.0 5 .71 16 .36 C .7305/Cl/79 10 5C 1400 95 . C 5 .06 0 .38)5/Cl/79 1350 40)3 36 .0 5 .37 13 .7705/C1/75 180C 9999 62 .C 5 .59 16 .71 0 .7605/C1/79 2600 5330 02 .0 5 .14 14 .44 C . 7205/C2/79 1300 1600 1E .C 6 C2 12 .60 0 .53')5/03/79 1200 1950 35 .0 3 .6205/C4/75 1200 3000 45 .C 3 .62 10 .02 0.7135/05/79 1130 1550 92 .0 3 .85 5 .56 0 .37C5/C6/79 1000 1300 75 .C 3 .46 4 .85 0 .36

- SEGNGE;UALL CLEANING'~ - CHEMICAL AND SFONGEEAII CLEANING
126
DAILY FLUX DATA - LAS GALINAS, CALIFCRNIA (1976-1580)TDS
IDS
IDS
FLEDLATE FEED BEINE PRCLUCI FLOW
PPCCTJCT(GPM) FILX iGSF) PECCVERY
J5/C7/79 1 :)00 130)
95 .0
3 .46 . 66 0 .34C5/(7/79
0 .00 0 . 00*05/CE/79 1050 4800
12 .0
4 .41 14 . 13 C .8205/CS/75 1300 2200
25 .C
3 .40 12 . 83 0 .9605/21/79 1000 2150
02 .0
5 .00 11 . 48 0 .64C5/22/75 110C 3900
lc . c
5 .23 7 .67 0 .3705/23/79 1)03 1900
50.3
3.43 6 .38 0 .4805/24/79 1025
1650
S8 .C
3.40 5 .87 0 .44+05/27/79 1500 9999
00.0
4 .22 13 .81 0.8405/2E/7S 800
1500
88 .C
4 .10 7 .28 0 .4505/29/79 1350 1830
88.0
6 .01 6 .85 0 .29*05/29/79 1550 2400
cc . c
5 .01 19 .33 0.9905/30/79 375 2100
90.0
4.15 6 .71 C .41C5/31/7 S 1950 2200
CO . C
4 .17 6 . 18 0 .38*05/31/75 1200 9999
80.0
5.91 23 .09 1 .0006/C1/79 1,250
1900
E8 .C
5 .05 9 .74 0 .49)6/C1/79 2350 9999
00.0
4.29 15 .89 0 .9506/C2/7S 250C 1900
75 .c
4 .72 12 .17 0.6676/C3/79 2300 1600
30.0
3 .54 8 .30 0 .6006/04/75 1100
1700
9E .C
3 .35 9 .63 0 .73Jb/ C5/7 9 1200 1850
05 .0
3.35 0.50CE/(6/79 1000
1350
1 C . C
3 .54 5 .17 0.37*06/06/79 1350 9999
00.0
4 .2 5
16 .47 0 .99O6/C7/79 1250 1950
45.C
4 .59 8 .88 0.4906/C8/79 1417 3230
58 .0
3 .57 8 . 18 0 .5906/CS/7S 950
1500
CC .C
5 .51 8 .53 0.4076/ 10/79 1300
19')3
52.. 0
5.54 8 .06 0 . 37C6/11/79 1250
1700
35.C
5 .38 6 .73 0.32*)6/ 1 1/79 1400 9999
25.0
5 .30 19 .92 C .9606/ 12/7 : 2000 2500
55.c
4 .85 7 .94 0 .4276/12/79 1 55J 3400
62.0
4.84 18 .00 C. 950E/ 13/7S 1500 2700
35.C
4 .98 0 .5806/14/79 1450 161)
95.0
1 .761 ' 09
0 .74C6/1S/79 1100 9999
75 .C
3 .86 13 .54 0 .9006/19/79 1800 4400
63 .0
3 .40 11 .35 0 .8506/15/79 1150 2500
58.0
4 .19 16 .00 0 .98Ou/27/79 1101 1750
12 .0
3.62 6.73 0 .4806/21/79 1200
1700
CE . c
3 .74 5 .56 0 . 3806/22/79 6')t)
877
11 .0
2 .54 4 .97 0 . 50*06/24/7S 1450 9999
50 . C
4 .80 17 .30 0.92
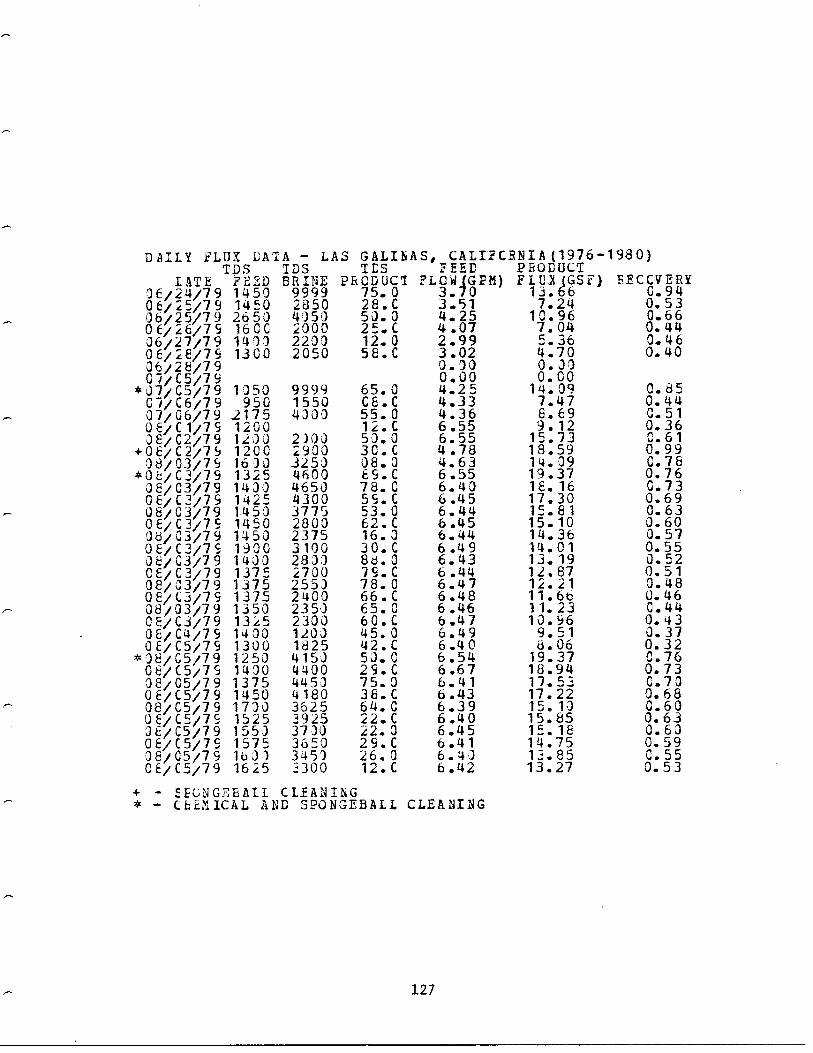
DAILY FLUX DATA - LAS GALIhAS, CALIECRNIA(1976-1980)TDS
IDS
TDS
FEED
PRODUCT
+ - EE6NGEEAIL CLEANING- CEct1ICAL AND SPONGEBALL CLEANING
1 2 7
LATEJE/24/79
?E D BRINE PRCDUCI FLCW(GPM)1450 9999
75.0
3. 0FLEX GSF)13 . 6
FECCVERY0.94
06/25/79 1450 2850
28 . C
3 .51 7 .24 0 .5306/25/79 2650 4050
50.0
4.25 10 .96 0.660f/26/7S 160C 2000
25. C
4 .07 7 .04 0 .4406/27/79 1400 220 .0
12.0
2.99 5 .36 0.46OE/25/75 1300 2050
58.0
3 .02 4 .70 0 .4006/28/79
10 .00 0 .00C7,C5/79* J7/ C5/7 9 1 )50 9999
65 .0
4.25 14 .09 0 .85C 7/C6/79 950 1550
CE .C
4 .33 7 .47 0 .440 7/ 06/7 9 2175 4)00
55 .0
4 .36 8 .69 0.510E/C 1/75 1200
12. C
6 .55 9 .12 0 .360 E/ C2/7 9 120'0 2 )0J
50 .0
6 .55 15 .73 0.61+05/C .2/79 1200 2900
3C .C
4 .78 18 .59 0 .990 8/ 03/7 5 16 )3 3250
08 .0
4.63 14 .09 0.78*08/03/75 1325 4600
E5 .C
6 .55 19 .37 0 .760 E/ 03/7 9 1400 4650
78 . C
6.40 1E . 16 0 .730E/C3/79 1425 4300
55 .C
6 .45 17 .30 0 .6908/03/79 1450 3775
53 .0
6 .44 15 .81 0.63OE/C3/7s 1450 2800
62 . C
6 .45 15 .10 0 .600d/C3/75 1450 2375
16 .0
6.44 14 .36 0 .57OE/C3/7S 1900 3100
30 . C
6 .49 14 .01 0 .5514J3 2800
88 .0
6 .43 13 .19 0 .52CE/ C3/ 79 1375 2700
79 . C
6 .44 12 .87 0 .5108;03,79 1375 255)
78.0
6 .47 12 .21 0 .4805/C3/79 1375 2400
66 .C
6 .48 11 .66 0 .4608/03/79 1350 235)
65 .0
6 .46 11 .23 C .4405/C3/79 1325 2300
60 . C
6 .47 10 .96 0 .43OE/C4/75 1400
120)
45 .0
6 .49 9 .51 0 .3705/05/79 1300
1825
42 .C
6 .40 8 .06 0 .32*08/05/79 1250 4150
50.0
6 .54 19 .37 0 .76OS/C5/7S 1400 4400
2S.C
6 .67 18 .94 0 .733 5/ C5/7 9 1375 4453
75.0
6 .41 17 .53 C .70OE/C5/79 7450 4 180
36 . C
6 .43 17 .22 0.6808/ C5/7 9 1730 3625
64.0
6 .39 15 .10 0 .600 E/ C5/7 1525 3925
22 . C
6 .40 15 .85 0 .63J E/ C5/7 9 155 :)
3700
22.0
6 .45 15 .18 0 .630E/C5/75 1575 3650
29 . C
6 .41 14 .75 0 .5938/05/75 163 ;)
3450
26 .0
6.4) 13 .85 0 .55C E/ C5/79 1625 3300
12 .C
6 .42 13 .27 0 .53

DAIIY FLUA DATA - LAS GALI1AS, CALIFORNIA (197b-1980)TDS
'IDS
TDS
FEED
PECDUC''LATE FEED E&I1IE PRCLUCI FLOWIGPM) F LUfGSF) EECCYEPY
38/C5/79 1625 3100 06 .0 6 . 8 ~ . 0 .500E/C5/79 1575 2925 C2 .C 6 .44 12 .05 0 .48OE/05/79 1575 2850 99.0 6 .40 11 .47 0 .46Ct/C6/79 1575 3350 13 .C 6 .31 12 .91 0 .52
*08/C7/79 1750 4633 62 .0 6 .54 20 .43 0 .8006/C7/79 1975 9999 58 .C 6 .65 20 .19 0 .7808/07/79 2)00 9999 56 .0 6 .61 19 .56 0 .76CE/Ci/79 '1975 6300 25 .C 6 .61 19 .17 0.7438/07/79 1975 5750
03.0
6 .57
18 .39
0.72t/ / 1950 5500 6E . C 6 .62 18 .00 0.69
08/07/79 1950 523 .) 50 .0 6 .64 17 .06 0 .6608/07/79 1925 4900
24 .C
6 .66
16.40
0.6303/07/79 1950 4453
10.0
6 .65
15 .81
0.61OE/C8/79 1800 3475 46 .C 6 .63 13 .23 0 .5108/08/79 1900 46)0 78 .0 4 .53 13 .30 0.76OE/C8/79 1825 3450 59 .0 6 .62 12 .87 0 .5008/C8/79 6 .57 13 .93 0 .54OE/CE/7S 6 .53 14 .87 0 .58
*38/C9/79 1975 8900 12 .0 6 .57 21 .99 0 .8606/CS/79 2450 6650 C0 .C 6 .53 19 .88 0 .78OE/C9/79 2300 6403 62 .0 6 .63 19 .96 0 .77OE/C9/79 2075 E900 60 .0 6 .57 19 .56 0 .763E/C9/79 2100 6403 40 .0 6 .59 19 .21 0 .7506/C9/79 2100 5900 C8 .C 6 .55 18 .35 0 .7206/09/79 2100 5703 85 .0 6 .b3 17 .80 0 .690E/CS/79 2050 5000 3C .C 6 .62 15 .81 0 .6138/'10/79 1925 3750 46 .0 6 .55 12 .76 0 .5006/ 10/79 1950 3770 4E . C 6 .53 12 .83 0.5038/11/79 1925 3250 55 .0 6 .45 11 .50 0 .46OE/ 12/79 1600 2950 50 . C 4 .39 8.33 0.4908/13/79 1500 200) 10 .0 6 .27 6 .34 0.2608/14/79 5 .13 19 .88 0 .9908/14/79 125)
1130
82 .0
5 .40
20.90
0.9906/ 14/79 162
425
44 .C
5 .78
21 .60
0.96J8/ 5/79 1500 2900 00 .0 5 .50 11 . 23 C .5208/16/79 1450 2600
E2 .C
5 .99
10 .63
0.46‚ 38/16/79 1400 37)0 22 .0 6 .90 17.30 0.6408/ 17/79 1400 2300 7C . c 6 .50 10 .96 0 .4308/ 18/79 135J 2330 55 .0 6 .44 8 .57 0 .34OE/ 15/75 1700 2800
6C . C
4 .31
8 .61
0.51‚
- 51:UNGEEAIL CLEANING‚
ChEUCAL AND SPONGEBALL CLEANING
128

+ - :EGNGEBAI1 CIEAN71iG- CEE ICAL AND SPONGE BALI CLEANING
1 29
DAILY FLUX DATA - LAS GALINAS, CALIFORNIA (1976-1S8C)TDS
IDS
IDS
FEED
PFCDUCTLATE FEED EBINE PRCEUCI FLCWI GPM) FLUX tGSF) E .ECCVERY
08/20/79 1250 1600
40.0
6, 1 6 .50 0 .26*C8/2C/79 130C 4650 Cr-.C 5 .95 17 .26 0 .74OE/21/79 20JO 3900
62 .0
4 .20 12 .21 0.74CE/22/79 1400 2400
22 .C
4 .15 8 .80 0.5408/23/79 1400 1500
85 .0
4 .17 6 .81 0 .42+08/23/79 1400 2000
1C .C
6 .21 19 .45 0 .8008/24/79 1350 3630
90.0
4 .25 11 .35 0 .6808/25/79 1250 2300
95 .0
4 .26 8 .61 0 .5208/26/79 1100 2900
90.0
6 .38 16 .51 0 .66*08/ ‚ 7/79 1000 1600
7C . C
4 .25410J
40.0
6 .168 .77
19 .560.530 .81CEDE/79 125C 2100
4E .C
4 .12 9 .00 0 .5 608/29/79 120) 2000
65 .0
5.54 17 .45 0 .81CE/3C/79 1250
1800
5-r . c
5 .51 9 .59 0.44+08/30/79 1100
1530
12 .0
5.15 19 .13 0 .950/31/79 1150 2050
70 . C
4 .93 10 .21 0 .5309/01/79 853 130)
00.0
3 .46 7.75 0.5709/C2/7S 1050
1400
12 .C
4 .96 8 .06 0 .4209/03/79 1000 1300
20.0
5 .35 7 .79 0 .39CS/C4/79 975
975
96 .C
4 .86 5 .99 0 .31*09/C4/79 900 190)
62.0
6 .08 21 .52 0 .9009/C5/7S
1900
2C .C
5 .83 12 .09 0 .5309/06/79 1400 2500
55 .0
5 .36 9 .82 0 .47CS/C6/7S 1400 4400
25.C
5 .86 17 .14 0 .7509/07/79 1375 265)
60.0
6 .70 14 .01 C .53C9/CE/79 200C 4000
70 .0
6 .75 14 .20 0 .5409/09/79 1450 28)0
02.0
6 .71 13 .15 0 .50CS/ 1C/79 1650 2950
C4 . C
6 .57 12 .09 0 .47*05/13/79 175) 891)
15.0
6 .47 22 .30 0 .88C9/ 11/79 1650 3950
42 .C
b .40 15 .34 0.6109/ 12/79 1700 8400
05 .0
6 .29 20.37 0 .8205/ 14/75 1600 :350
16 .C
6 .50 13 .77 0 .5409/ 14/79 1625 6403
55.0
6 .45 19 .84 0 .791900
E2 . C
6 .C209 / 8 .88 0 .3865/7/79 1500 2100
40.0
6 .25 7.94 C .3205%17/79 1100
1200
3 .98 7 .12 0 .46*09/17/79 1350 500'3
90.0
6 .74 20.66 0 .78C9/ 1E/79 140C
1500
40 .0
6 .17 9 .90 0.4109/19/79 14JO
150')
30 .0
6 .92 8 .88 0.33C9/zC/15 1200
1600
40 .C
6 .23 7 .87 0.32

I
DATE+09/20/79C 9/ 2 1/7 S09/22/7909/23/7509/24/79
#09/24/7909/25/7905/26/7509/27/79+09/27/7509/2E/7909/25/7509/30/791C/C1/7S1C/C1/791C/C2/7S1 6/03/79
/ C 4/7 9‚
1
1C/C
C5/7c1 C/CE/7S1‚ C/ C5/ 791 0/9/79012/C4/791 2/05/7912/06/791 2/ C 7/7 912/CE/7S12/09/7912/CS/7912/ 1 I0/7 912/10/751/10/7912/ 1 C/7912/10/79
‚
12/ 11/7912/ 11/75
DAILY FLUX DATA - LAS GALINAS, tALIFCRNIA(1976-1983)IDS
IDS
IDSFEED SEINE PECCUCT1230 3400 05 .0650 2400 CS .C
1250 1850
45.01 100 1603 42 .C1150 1650 16 .01175 4300 5C .C1300 2500 32 .01250 2200 ES .C1200 55 .01200 2000 95 .C1200 1950 20 .01200 1600 15 .C1230 16)3 00 .0120C 1725 20 .C1150 6300 48 .014CC 1500 40 .C1450 2450 80 .01600 1450 58 .C16 00 1953 32 .060C 2800 75 .C1650 31 .03 42 .01750 3100 30 .C1900 16)) 15 .03000 9999 75 .C1630 6440 39 .01200 1900 55 .C16 00 2200 65 .01500 2000
6C.C1400 1800
5 5.01 150 1600 08 .01250 6250 CC .C1200 2203 52 .02700 4400 CC .C1630 58)3 80 .01400 4650 65 .01250 465) 38 .012C0 2100 72 .C1230 380)
85.0
‚
- EFONGE8ALI CLEANING‚
- CEEI'1ICAL AND SPONGEEALL CLEANING
FEED
PFCDUCTFLOW {GP3) F1U 1GSF) FECCVEDY
6 . 3 1 .; . 3 C .650 .380 .340 .330 .330.740 .520.45C .460.510 .530.40C .310 .320 .910 .480 .450 .400 .740 .560 .520.43C . 400.760 .830 .340 .300 .310 .300 .310 .300 .920 .490 .970 .920 .930 .830 .50C . 780.77
130
6 .176 .416 .395.956 .256 .256 .396 .138 .606 .206 .165 .946 .216 .116 .176 .276 .346 .126 .286 .376 .306 .306 .126 .116 .696 .536 .596 .526 .426 .334 .985 .364 .084 .454 .405 .405 .016 .236 .44
9 .08E . 578 .267 .67
18 .0012 .6811 .151 1 .5817 . 1412 .919 .637 . 127 .83
X1 .7611 .5411 . 119 .94
17 .7713 .8512 .9510 .729 . 43
18 .16619 .928 .807 .797 .907 .757 .757 .51
17 .969 .78
15 .4616 .0016 .0017 .459 .7019 . 1319 .37