Embed Size (px)
Citation preview
From the Department of Medical Epidemiology and BiostatisticsKarolinska Institutet, Stockholm, Sweden
Improved statistical methodology forhigh-throughput omics data analysis
Wenjiang Deng
Stockholm 2021

All previously published papers and images were reproduced with permission from thepublishers.
Published by Karolinska Institutet.
Printed by Universitetsservice US-AB 2021.
© Wenjiang Deng, 2021
ISBN 978-91-8016-279-1
Improved statistical methodology forhigh-throughput omics data analysis
THESIS FOR DOCTORAL DEGREE (Ph.D.)
By
Wenjiang Deng
Time and location: September 17th, 2021, kl 09.00 in the lecture hall Atrium,
Nobels väg 12 B, Karolinska Institutet, Solna
Principle supervisor: Opponent:Professor Yudi Pawitan Associate Professor Raffaele Adolfo CalogeroKarolinska Institutet University of TurinDept. of Medical Epidemiology and Biostatistics Dept. of Molecular Biotechnology and Health
Sciences
Co-supervisors: Examination board:Assistant Professor Trung Nghia Vu Professor Rebecka JörnstenKarolinska Institutet University of Gothenburg and ChalmersDept. of Medical Epidemiology and Biostatistics University of Technology
Division of Applied Mathematics and Statistics
Assistant Professor Xia Shen Docent Carsten DaubKarolinska Institutet Karolinska InstitutetDept. of Medical Epidemiology and Biostatistics Department of Biosciences and Nutrition
Docent Fredrik WiklundKarolinska InstitutetDept. of Medical Epidemiology and Biostatistics


To all who I love
To be proud of whom I’ve tried to beAnd this life I choose to live

Abstract
Over the last two decades, the advent of high-throughput omics technology hassubstantially revolutionized biological and biomedical research. A large volumeof omics data has been produced with the rapid development of sequencingtechniques. Meanwhile, researchers have developed a wide range ofcomputational tools to manage and analyze the omics data. Although theimplementation of these tools generates significant discoveries, processing andinterpreting the omics data efficiently and accurately is still a big challenge.
In this thesis, we aim to develop novel statistical methodologies and algorithmsfor omics data analysis. We implement the methods for both simulated and realdata from different types of cancers. Based on the evaluation and comparisonwith existing tools, we find that our methods achieve higher accuracy and betterperformance in analyzing different types of omics data.
In Study I, we build an analysis pipeline to integrate multiple levels of omicsdata and identify potential driver genes in neuroblastoma. The pipeline employsgene expression profile, microarray-based comparative genomic hybridizationdata, and functional gene interaction network to detect cancer-related drivergenes. We identify a total of 66 patient-specific and four common driver genes.The genes are summarized into a driver-gene score (DGscore) for each patient.We find that the patients with a low DGscore have better survival than those witha high DGscore (p-value=0.006).
In Study II, we develop a novel method named XAEM to quantify isoform-level expression using RNA sequencing data. There are two major components inthis method. First, we construct a design matrix X as the starting parameter in thequantification model. Second, we utilize an alternating Expectation Maximizationalgorithm to estimate the design matrix X and isoform expression β iteratively.We compare XAEM with several quantification methods using both simulatedand real data. The result shows that XAEM achieves higher accuracy in multiple-isoform genes and obtains substantially better rediscovery rates in the differential-expression analysis.
In Study III, we extend the algorithm from Study II and develop an approachnamed MAX to quantify mutant-allele expression at the isoform level. For agiven gene and a list of mutations, we first generate the mutant reference byincorporating all possible mutant isoforms from the wild-type isoform. The
alternating Expectation Maximization algorithm is then applied to estimate theisoform abundance. We implement MAX to a real dataset of acute myeloidleukemia. Using the mutant-allele expression, we discover a subgroup ofNPM1-mutated patients that has better drug response to a kinase inhibitor.
In Study IV, we build a pipeline to detect fusion genes at DNA level usingwhole-exome sequencing data. The pipeline is utilized to three comprehensivedatasets of acute myeloid leukemia and prostate cancer patients. Compared withthe detection results from RNA sequencing data, we find that several major fusionevents in these two cancer types are validated in some of the patients. However,the overall results indicate that it is challenging to identify chimeric genes usingexome sequencing data due to its inherent limitations.
Altogether, we have developed several statistical and bioinformatics tools toanalyze different types of omics data, which demonstrate higher accuracy andbetter performance than other competing approaches. The results in this thesiswill provide novel insights into omics data analysis and facilitate significantdiscoveries in cancer research.
List of scientific papers
I. Chen Suo*, Wenjiang Deng*, Trung Nghia Vu, Mingrui Li, Leming Shi,Yudi Pawitan. Accumulation of potential driver genes with genomicalterations predicts survival of high-risk neuroblastoma patients. BiologyDirect, 2018; 16;13(1):14. doi:10.1186/s13062-018-0218-5.(*Contributed equally)
II. Wenjiang Deng, Tian Mou, Krishna R Kalari, Nifang Niu, Liewei Wang,Yudi Pawitan and Trung Nghia Vu. Alternating EM algorithm for a bilinearmodel in isoform quantification from RNA-seq data. Bioinformatics, 2020;1;36(3):805-812. doi:10.1093/bioinformatics/btz640.
III. Wenjiang Deng, Tian Mou, Yudi Pawitan and Trung Nghia Vu.Quantification of mutant-allele expression at isoform level in cancer fromRNA-seq data. (Submitted)
IV. Wenjiang Deng, Sarath Murugan, Johan Lindberg, Venkatesh Chellappa,Xia Shen, Yudi Pawitan and Trung Nghia Vu. Fusion gene detection usingwhole-exome sequencing data in cancer patients. (Manuscript)
Publications not included in the thesis
I. Tian Mou, Wenjiang Deng, Fengyun Gu, Yudi Pawitan and Trung NghiaVu. Reproducibility of methods to detect differentially expressed genes fromsingle-cell RNA sequencing.Frontiers in Genetics, 2020; doi:10.3389/fgene.2019.01331.
II. Trung Nghia Vu, Wenjiang Deng, Quang Thinh Trac, Stefano Calza,Woochang Hwang and Yudi Pawitan. A fast detection of fusion genes frompaired-end RNA-seq data.BMC Genomics, 2018; doi: 10.1186/s12864-018-5156-1.
III. Tian Mou, Yudi Pawitan, Matthias Stahl, Mattias Vesterlund, WenjiangDeng, Rozbeh Jafari, Anna Bohlin, Albin Österroos, loannis Siavelis,Helena Bäckvall, Tom Erkers, Santeri Kiviluoto, Brinton Seashore-Ludlow,Päivi Östling, Lukas M Orre, Olli Kallioniemi, Sören Lehmann, JanneLehtiö and Vu Trung Nghia.The transcriptome-wide landscape of molecular subtype-specific mRNAexpression profiles in acute myeloid leukemia. American Journal ofHematology, 2021; doi: 10.1002/ajh.26141.
Contents
1 Background 11.1 Sequencing technologies . . . . . . . . . . . . . . . . . . . . . . 1
1.1.1 First-generation sequencing . . . . . . . . . . . . . . . . 1
1.1.2 Next-generation sequencing . . . . . . . . . . . . . . . . 3
1.1.3 Third-generation sequencing . . . . . . . . . . . . . . . . 7
1.2 Omics data and applications . . . . . . . . . . . . . . . . . . . . 9
1.2.1 Genomics . . . . . . . . . . . . . . . . . . . . . . . . . . 9
1.2.2 Epigenomics . . . . . . . . . . . . . . . . . . . . . . . . 11
1.2.3 Transcriptomics . . . . . . . . . . . . . . . . . . . . . . . 12
1.2.4 Proteomics . . . . . . . . . . . . . . . . . . . . . . . . . 13
1.2.5 Microbiomics . . . . . . . . . . . . . . . . . . . . . . . . 14
1.3 Cancer research and overview . . . . . . . . . . . . . . . . . . . 14
1.3.1 Neuroblastoma . . . . . . . . . . . . . . . . . . . . . . . 15
1.3.2 Acute myeloid leukemia . . . . . . . . . . . . . . . . . . 17
1.3.3 Breast cancer . . . . . . . . . . . . . . . . . . . . . . . . 17
1.3.4 Prostate cancer . . . . . . . . . . . . . . . . . . . . . . . 18
2 Aims of this thesis 21
3 Materials and methods 233.1 Integrative analysis of neuroblastoma omics data . . . . . . . . . 23
3.2 Isoform quantification using RNA-seq data . . . . . . . . . . . . 25
3.2.1 Isoform quantification model . . . . . . . . . . . . . . . . 25
3.2.2 Construction of X matrix . . . . . . . . . . . . . . . . . . 26
3.2.3 Alternating expectation-maximization algorithm . . . . . 27
3.2.4 Simulated and real RNA-seq data . . . . . . . . . . . . . 27
3.3 Estimation of mutation-allele expression . . . . . . . . . . . . . . 29
3.4 Fusion gene detection at DNA level . . . . . . . . . . . . . . . . 30
4 Main results 314.1 Study I . . . . . . . . . . . . . . . . . . . . . . . . . . . . . . . . 31
4.2 Study II . . . . . . . . . . . . . . . . . . . . . . . . . . . . . . . 31
4.3 Study III . . . . . . . . . . . . . . . . . . . . . . . . . . . . . . . 35
4.4 Study IV . . . . . . . . . . . . . . . . . . . . . . . . . . . . . . . 37
5 Discussion and conclusion 39
6 Future perspectives 43
7 Acknowledgements 45
References 49
List of abbreviations
AEM Alternating expectation-maximizationAGS Altered gene setAML Acute myeloid leukemiaAPE Absolute proportional errorAUC Area under the curveBAM Binary Alignment/MapChIP Chromatin immunoprecipitationCNA Copy number alterationCNV Copy number variationddNTPs di-deoxynucleotide triphosphatesDE Differentially expressedDGscore Driver-gene scoreDNA Deoxyribonucleic aciddNTPs deoxynucleotides triphosphatesEFS Event-free survivalELN European Leukemia NetEqclass Equivalence classFEQ Fusion equivalence classFGS Functional gene setGB Giga-basesGWAS Genome-wide association studyHGP Human Genome ProjectHMP Human Microbiome ProjectHTS High-throughput sequencingIC50 Inhibitory concentrationICGC International Cancer Genome ConsortiumIGV Integrative Genomics VieweriHMP integrative Human Microbiome Projectindel Small insertion/deletionITD Internal tandem duplicationMNA MYCN amplificationmRNA Messenger RNA
NEA Network enrichment analysisNGS Next-generation sequencingONT Oxford Nanopore TechnologyPacBio Pacific BiosciencesPE Paired-endRDR Rediscovery rateRNA Ribonucleic acidRNA-seq RNA sequencingrRNA ribosomal RNASAM Sequence Alignment/MapSEQC Sequencing Quality Control ConsortiumSMRT Single-molecule real-timeSNP Single-nucleotide polymorphismSOLiD Sequencing by oligonucleotide ligation and detectionSRA Sequence Read ArchiveSV Structural variationTC Transcription clusterTCGA The Cancer Genome AtlasTE TMPRSS2-ERGTNs Transcript neighborstRNA Transfer RNATRP Transcript response profileWES Whole-exome sequencingWGS Whole-genome sequencingWT Wild-typeZMW Zero-mode waveguide
1 Background
Cancer is a leading cause of death across the world. In 2019, 18 million newcases were diagnosed and about 9 million deaths occurred due to cancer [1]. Theincreasing morbidity and mortality highlight the urgent need to characterize thepathophysiologic mechanism of different cancers. Over the last two decades, theadvancement of sequencing technology, especially the next-generationsequencing approach, has allowed researchers to interrogate cancers usingmultiple omics data [2]. It is well accepted that cancer is closely associated withgenetic abnormalities, such as structure variation, copy number alteration, singlenucleotide variation, and fusion gene [3]. The sequencing technologies provide afast, comprehensive and cost-effective way to capture these genetic aberrationssimultaneously. In recent years, a wide range of studies employing sequencingapproaches have been conducted. Specifically, two of the largest studies, TheCancer Genome Atlas (TCGA) and the International Cancer GenomeConsortium (ICGC), have led the way to produce a huge amount of sequencingdata in diverse cancer types [4, 5]. It can be expected that cancer-related researchwill continue to benefit from the sequencing approaches and yield more valuablefindings for the prevention, diagnosis, treatment, and prognosis of cancerpatients.
1.1 Sequencing technologies
Sequencing is the biochemical process to measure the order of nucleotides indeoxyribonucleic acid (DNA) or ribonucleic acid (RNA). A DNA molecule hasfour constituent bases: adenine (A), guanine (G), cytosine (C) and thymine (T).Different orders and combinations of bases are implicated in unique functionalimpacts on disease occurrence; thus, it is of great importance to determine thesequence of nucleotides in research samples.
1.1.1 First-generation sequencing
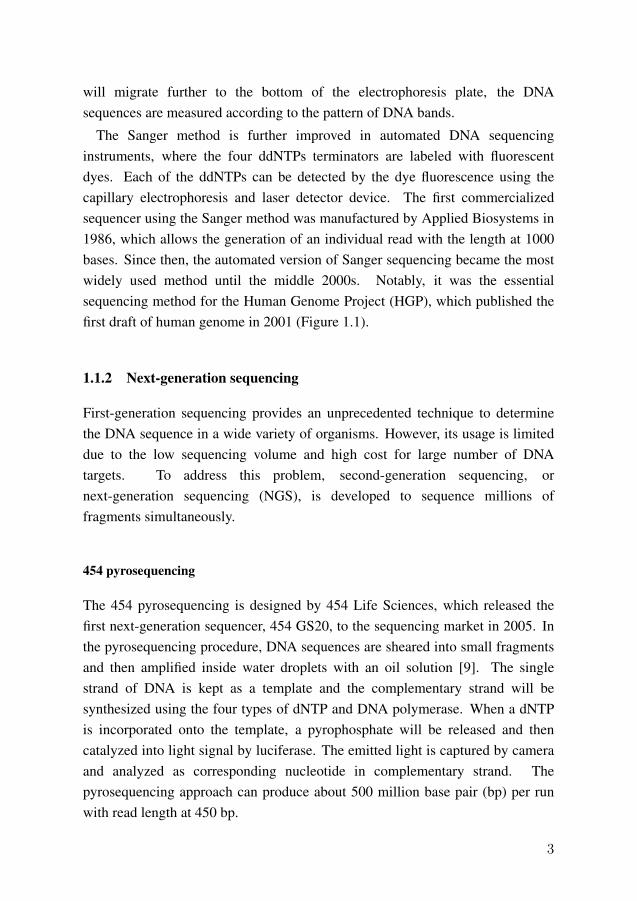
Great efforts have been made to characterize the sequences of DNA, RNA, andprotein in living organisms [7]. As Figure 1.1 shows, sequencing technologieshave been developed and improved continuously since the 1970s. The Sanger
1
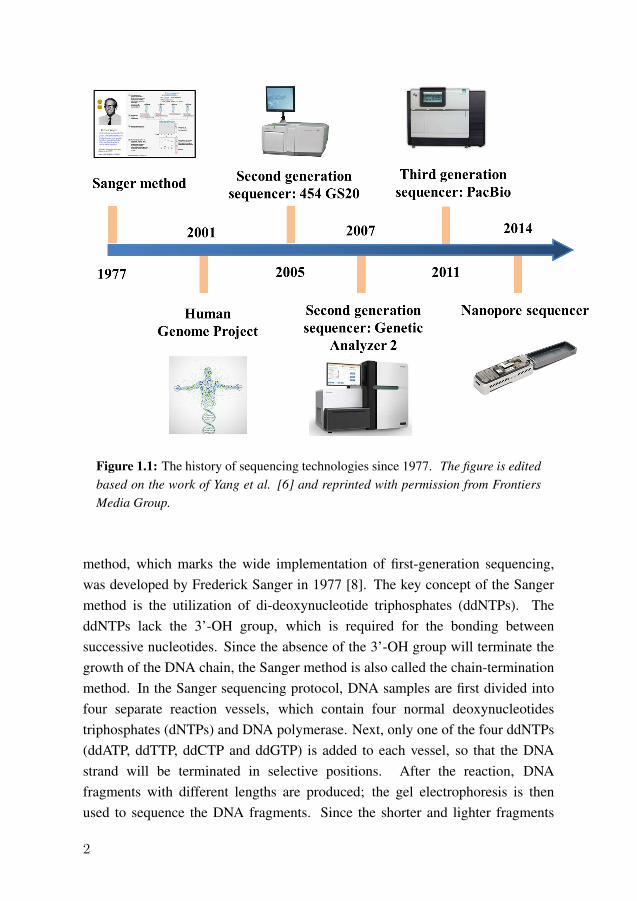
Figure 1.1: The history of sequencing technologies since 1977. The figure is editedbased on the work of Yang et al. [6] and reprinted with permission from FrontiersMedia Group.
method, which marks the wide implementation of first-generation sequencing,was developed by Frederick Sanger in 1977 [8]. The key concept of the Sangermethod is the utilization of di-deoxynucleotide triphosphates (ddNTPs). TheddNTPs lack the 3’-OH group, which is required for the bonding betweensuccessive nucleotides. Since the absence of the 3’-OH group will terminate thegrowth of the DNA chain, the Sanger method is also called the chain-terminationmethod. In the Sanger sequencing protocol, DNA samples are first divided intofour separate reaction vessels, which contain four normal deoxynucleotidestriphosphates (dNTPs) and DNA polymerase. Next, only one of the four ddNTPs(ddATP, ddTTP, ddCTP and ddGTP) is added to each vessel, so that the DNAstrand will be terminated in selective positions. After the reaction, DNAfragments with different lengths are produced; the gel electrophoresis is thenused to sequence the DNA fragments. Since the shorter and lighter fragments
2
will migrate further to the bottom of the electrophoresis plate, the DNAsequences are measured according to the pattern of DNA bands.
The Sanger method is further improved in automated DNA sequencinginstruments, where the four ddNTPs terminators are labeled with fluorescentdyes. Each of the ddNTPs can be detected by the dye fluorescence using thecapillary electrophoresis and laser detector device. The first commercializedsequencer using the Sanger method was manufactured by Applied Biosystems in1986, which allows the generation of an individual read with the length at 1000bases. Since then, the automated version of Sanger sequencing became the mostwidely used method until the middle 2000s. Notably, it was the essentialsequencing method for the Human Genome Project (HGP), which published thefirst draft of human genome in 2001 (Figure 1.1).
1.1.2 Next-generation sequencing
First-generation sequencing provides an unprecedented technique to determinethe DNA sequence in a wide variety of organisms. However, its usage is limiteddue to the low sequencing volume and high cost for large number of DNAtargets. To address this problem, second-generation sequencing, ornext-generation sequencing (NGS), is developed to sequence millions offragments simultaneously.
454 pyrosequencing
The 454 pyrosequencing is designed by 454 Life Sciences, which released thefirst next-generation sequencer, 454 GS20, to the sequencing market in 2005. Inthe pyrosequencing procedure, DNA sequences are sheared into small fragmentsand then amplified inside water droplets with an oil solution [9]. The singlestrand of DNA is kept as a template and the complementary strand will besynthesized using the four types of dNTP and DNA polymerase. When a dNTPis incorporated onto the template, a pyrophosphate will be released and thencatalyzed into light signal by luciferase. The emitted light is captured by cameraand analyzed as corresponding nucleotide in complementary strand. Thepyrosequencing approach can produce about 500 million base pair (bp) per runwith read length at 450 bp.
3
Sequencing by synthesis (Illumina)
Sequencing by synthesis is a major strategy employed in many sequencingmachines manufactured by Illumina. Literally, it means a nucleotide is measuredwhen incorporated to the template fragment in the synthesis of thecomplementary strand. There are three main steps in this method [10, 11]. Thefirst step is sample preparation, where the DNA is cut into smaller fragmentswith the size of 100–500 bp. The fragment is then ligated with adapters on bothends. Each adapter contains three different parts: (1) sample index, (2) bindingsite for sequencing primer and (3) the sequence complementary foroligonucleotides (oligo) on flow cell. The bottom of the flow cell is coated withmillions of oligos; each DNA fragment is then attached to the flow cell lane.
The second step is DNA cluster generation, also known as bridgeamplification. In this step, a DNA strand will bend over and attach to an oligo toform a bridge-like shape. The DNA polymerase binds to the strand and generatesa complementary strand. The original strand (forward strand) is then washedaway and only the reverse strand is retained. The reverse strand will attach to theoligo again and generate a new forward strand. Both strands are then denaturedand the bridge amplification is repeated to produce hundreds of thousands ofDNA copies.
In the third step, the sequencing starts by adding the fluorescently labeleddNTPs to the flow cell. When a dNTP incorporates to the template DNA strand,a unique fluorescent light is emitted and captured by camera. The sequencingmachine records the light signal and interprets it as a corresponding nucleotide.In this process, only one dNTP can be incorporated to the DNA strand becausethe fluorophore blocks the binding of next nucleotide. However, this blocking isreversible; when a dNTP is recorded, the fluorophore will be washed away sothat the next nucleotide can attach to the DNA strand. In this step, millions ofclusters on the flow cell are sequenced simultaneously, which generate hugeamount of sequencing reads and outputs.
As shown in Figure 1.1, in 2007, Illumina released the Genetic Analyzer 2sequencer, which produces one giga-bases (GB) per run with read length at 100bp. After that, several sequencing machines with improved performance arereleased, e.g. the HiSeq, MiSeq and HiScanSQ sequencing platform series. TheHiseq 2000 can generate 600 GB reads per run in ∼eight days, which becomes
4
one of the most powerful sequencers in the market.
Sequencing by oligonucleotide ligation and detection
Unlike the pyrosequencing and sequencing by synthesis, the sequencing byoligonucleotide ligation and detection (SOLiD) leverages oligonucleotide probesinstead of DNA polymerse [12]. The SOLiD sequencing employs 16 eigth-meroligonucleotide probes, where the first two bases in the probe use a two-baseencoding scheme. Each pair of bases has corresponding fluorescent dye in 5prime. In the process of sequencing, each probe is ligated to the target strand andthe color is recorded by the sequencer. The last three bases in the probe are thencleaved together with the dye to allow next probe to ligate. For each targetfragment, seven different probes will be ligated in separate round and five roundsare performed using different primers. Due to the implementation of thetwo-base encoding strategy, the SOLiD approach achieves a high sequencingaccuracy at 99.94%. However, the major disadvantage is the relatively short readlength at 50 bp. The first commercialized SOLiD sequencer was produced byApplied Biosystems in 2008, which can generate up to 60 GB reads per run.
Ion Torrent sequencing
When a dNTP is incorporated to the target strand, a hydrogen ion will be releasedand change the pH of the solution. The pH change is detected and analyzed by anion-sensitive ion sensor, which is a micro semiconductor chip underneath thereaction wells. In the process of sequencing, the four types of dNTP are added tothe reaction wells together with the DNA polymerase. If the introduced dNTP iscomplementary to the template strand, the hydrogen ion is released and detectedby the sensor, and the unattached dNTPs will be washed away. In this way, thesequencer can measure the template DNA when the process repeats. Ion Torrentsequencing is also called Ion semiconductor sequencing and pH mediatedsequencing. The first commercial Ion Torrent sequencer was released by LifeTechnologies in 2010. It provides a rapid sequencing in two hours and generatessequencing reads at 200–400 bp with an accuracy at 99%.
5

Figure 1.2: The cost of sequencing per genome from 2001 to 2019. Source data areobtained from National Human Genome Research Institute.
Sequencing price overview
The massively parallel capability and high throughput of next-generationsequencing have led to a substantial decrease in sequencing price. Figure 1.2shows the trend of costs per genome over the last two decades. In 2001, the priceto sequence a human genome was about 100 million dollars, while in 2019, thecost decreased strikingly to about 1000. In particular, the first draft of humangenome was released in 2001 by the Human Genome Project. The HGP was thefirst and biggest project at the time to measure the complete base pairs in humangenome [13]. It was started in 1990 and officially completed in April 2003,involving a huge amount of collaborations and efforts between researchersworldwide. The cost for the draft genome was about 300 million dollars and thelater refinement cost another 150 million. In Figure 1.2, there is a noteworthydecrease near 2008 due to the transition from the usage of first-generationsequencing (Sanger method) to next-generation sequencing. With the continuousimprovement of sequencing technologies, we anticipate that the sequencing willbe conducted with an even lower price and higher throughput in the near future.
6
1.1.3 Third-generation sequencing
The next-generation sequencing is high-throughput, efficient, and cost-effective.However, a major drawback of NGS is the relatively short read length, whichranges from 50 bp to 700 bp maximum. The short read length often complicatesthe downstream bioinformatics analysis, such as isoform quantification, de novoassembly and structural variation detection. To tackle this problem,third-generation sequencing, or long-read sequencing was developed, which canproduce reads with tens or hundreds of kilo bases [14, 15].
Single-molecule real-time (SMRT) sequencing
The SMRT method employs a zero-mode waveguide (ZMW), a structure of 70nm in diameter. A single molecule of DNA fragment and a DNA polymerase areattached in the bottom of the ZMW hole. Four types of DNA bases labeled withfluorescent dyes are added to the reaction. When a nucleotide is incorporated ontothe template strand, the fluorescence is observed by the detector and interpretedas a corresponding base. The SMRT is commercialized by Pacific Biosciences(PacBio), which released the first SMRT sequencer in 2011. The average readlength using the SMRT method is 10–15 kilo bases, and 500 million bases can begenerated per SMRT run [16, 17].
Nanopore sequencing
Nanopore is a nano-scale pore embedded in electrically resistant polymermembrane [18]. When a DNA strand passes through the Nanopore, voltagechanges will be triggered and recorded; thus, the DNA bases can be measuredfrom the current signal. The Nanopore method utilizes helicase to unwind thetarget DNA into two strands; one strand is translocated and passing through theNanopore for sequencing. Unlike all methods mentioned above, the Nanoporeapproach does not need PCR amplification or chemical labeling of nucleotide.This feature makes Nanopore sequencing independent of expensive equipmentand reagents, which allows it to be used in remote places with limited laboratoryresources. Nanopore sequencing was developed and released by OxfordNanopore Technology (ONT), with the first Nanopore sequencer manufacturedin 2014. The average read length of Nanopore sequencer is 20 kilo bases, and themaximum read length can reach to 2.3 million bases [19].
7
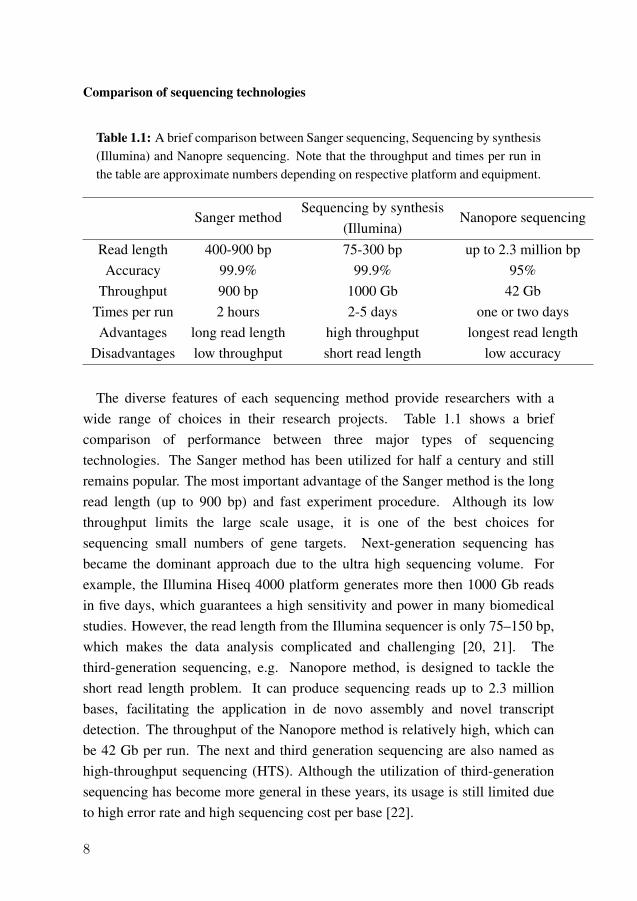
Comparison of sequencing technologies
Table 1.1: A brief comparison between Sanger sequencing, Sequencing by synthesis(Illumina) and Nanopre sequencing. Note that the throughput and times per run inthe table are approximate numbers depending on respective platform and equipment.
Sanger methodSequencing by synthesis
(Illumina)Nanopore sequencing
Read length 400-900 bp 75-300 bp up to 2.3 million bpAccuracy 99.9% 99.9% 95%
Throughput 900 bp 1000 Gb 42 GbTimes per run 2 hours 2-5 days one or two daysAdvantages long read length high throughput longest read length
Disadvantages low throughput short read length low accuracy
The diverse features of each sequencing method provide researchers with awide range of choices in their research projects. Table 1.1 shows a briefcomparison of performance between three major types of sequencingtechnologies. The Sanger method has been utilized for half a century and stillremains popular. The most important advantage of the Sanger method is the longread length (up to 900 bp) and fast experiment procedure. Although its lowthroughput limits the large scale usage, it is one of the best choices forsequencing small numbers of gene targets. Next-generation sequencing hasbecame the dominant approach due to the ultra high sequencing volume. Forexample, the Illumina Hiseq 4000 platform generates more then 1000 Gb readsin five days, which guarantees a high sensitivity and power in many biomedicalstudies. However, the read length from the Illumina sequencer is only 75–150 bp,which makes the data analysis complicated and challenging [20, 21]. Thethird-generation sequencing, e.g. Nanopore method, is designed to tackle theshort read length problem. It can produce sequencing reads up to 2.3 millionbases, facilitating the application in de novo assembly and novel transcriptdetection. The throughput of the Nanopore method is relatively high, which canbe 42 Gb per run. The next and third generation sequencing are also named ashigh-throughput sequencing (HTS). Although the utilization of third-generationsequencing has become more general in these years, its usage is still limited dueto high error rate and high sequencing cost per base [22].
8
1.2 Omics data and applications
Omics data are defined as the comprehensive dataset of the same type ofmolecule generated using the high-throughput sequencing methods [23]. Forexample, genomics measures entire DNA sequence, transcriptomics quantifies alltranscripts, and proteomics profiles the complete set of proteins. Each type ofomics data provides significant and unique insights into biological mechanismsunderlying human disease. In the last ten years, omics studies have been thrivingtremendously due to the advancement in sequencing technologies [24, 25].
1.2.1 Genomics
Genomics aims to elaborate the structure, component, function, and modificationof the whole genome [26]. In human research, a primary task is to identifygenomic mutations associated with different phenotypes and diseases. The mostcommon types of mutations include single-nucleotide polymorphism (SNP),structural variation (SV), copy number variation (CNV), and smallinsertion/deletion (indel). Different sequencing strategies such as whole-genomesequencing (WGS) and whole-exome sequencing (WES) are widely used todelineate specific mutations [27, 28].
SNP and genome-wide association study (GWAS)
SNP is a genetic variant when a single nucleotide differs between a group ofsamples. In human genome, there are about 4–5 million SNPs, in that SNPoccurs in every 1000 bases. Most SNPs have no functional effects, but some areclosely associated with human traits and the increased risk of diseases [29]. Inthe last two decades, GWAS has identified a wide range of candidate loci relatedto complex diseases [30]. For example, Fachal et al. have summarized a total of83 susceptibility loci in breast cancer from GWAS. These loci explain ∼14% ofbreast cancer heredity and provide significant insights into cancer riskstratification [31].
Structural variation (SV)
Structural variation occurs in the structure of chromosome that affects >100bases (referred to as indel if <100 bp). Compared with SNP, which only involves
9

the substitution of single nucleotide, SV alters much longer sequences in DNA.SVs can be categorized into two groups: (1) balanced SVs, i.e. inversion andtranslocation, which do not change the total number of genomic bases; (2)unbalanced SVs such as deletion, insertion and copy number variation (deletionand duplication), which will add or remove nucleotides from the genome [32].
Figure 1.3: Strategies to detect SVs using sequencing reads. The solid black arrowsare reads with orientations. The figure is re-edited from the work of Docampo et al.[33] and reprinted with permission from Oxford University Press.
Whole-genome sequencing and whole-exome sequencing data are frequentlyused to identify SVs [34]. Detection of SVs often involves three steps: (1) DNAsequencing using high-throughput sequencing approaches; (2) reads mappingusing a known reference genome; (3) variation calling and functional annotationof disease-related mutations. Figure 1.3 shows different strategies to detect SVsfrom sequencing reads [33]. Copy number variation is a type of SV with thelength ranging from 1000 to three million bases. As shown in Figure 1.3(A), a
10

CNV deletion is identified when the read depth is substantially lower than theaverage depth of the genome segment, while a CNV duplication is detected if theread depth is higher than reference regions.
Paired-end (PE) sequencing generates read pairs with a fixed length of insertsize in between. This feature is often used to detect SVs. Figure 1.3(B) showsthat if a pair of reads map to reference genome with correct position, concordantorientation and exact length of insert size, it means there is no SV eventoccurring. However, any violation of these criteria can indicate the presence ofvariations. For example, deletion is identified if a read pair has a bigger distancethan insert size when mapped to reference genome, and an insertion is detected ifthe alignment distance is smaller than the insert size. Inversion can be foundwhen two reads are mapping to the reference genome with the same orientation.Translocation is determined if the read pair is mapped to two differentchromosomes or having a large distance. Besides, a deletion can be identifiedwhen a single read is split at the position of breakpoints (Figure 1.3(C)).
1.2.2 Epigenomics
Epigenomics aims to study the reversible modifications on DNA that affect thegene expression level without changing the DNA nucleotides. Histonemodification and DNA methylation are two of the most common epigenomicvariants [35]. Studies have shown that these modifications are closely related tobiological mechanisms underlying cancer and other human diseases [35, 36]. Forexample, histone mutations significantly contribute to the formation of paediatricgliomas [37]; methylations of DNA-repair genes are frequently observed instomach cancer [38]. Several consortia have been launched to characterizehuman epigenome, such as the Roadmap Epigenomics Mapping Consortium andInternational Human Epigenome Consortium [39, 40]. To measure thegenome-wide epigenomic mutations, sequencing based approaches such aschromatin immunoprecipitation (ChIP) sequencing and bisulfite sequencing arewidely used. Recently, due to the great advances in third-generation sequencingtechnologies, the epigenetic modifications have been detected directly when theDNA bases are sequenced. The application of the Nanopore and SMRTsequencing provides a more accurate and rapid identification of epigenomicaberrations [41].
11

1.2.3 Transcriptomics
Transcriptomics is the study to characterize entire RNA transcripts. RNAparticipates in a wide variety of biological processes, including protein synthesis,regulation of gene expression and communicating cellular signals [42]. RNAscan be categorized into coding and non-coding groups. Coding RNA, i.e.messenger RNA (mRNA), is served as template to synthesize proteins in theprocess of translation. In human transcriptome, mRNA only accounts for 3% ofall RNAs and the rest 97% are non-coding RNAs. Transfer RNA (tRNA) andribosomal RNA (rRNA) represent two of the most common non-coding RNAs,both involved in the synthesis of proteins. Non-coding RNAs are mostly constantregardless of cellular or disease status, while the expression and type of mRNAare dynamically affected by healthy/cancerous conditions in living organism[43]. Hence, it is of great interest to quantify mRNA between differentexperimental conditions. Previously, the hybridization-based microarrays werewidely used to measure the expression of mRNA. However, the microarraymethod has several limitations; for example, prior knowledge of DNA/RNAsequences are needed to design probes.
RNA sequencing (RNA-seq)
With the tremendous advancement in sequencing technologies, the RNAquantification has embraced substantial improvement in the last ten years.RNA-seq can apply various sequencing approaches, e.g. next-generationsequencing to investigate the presence and abundance of RNA molecules [21].The overall procedure of RNA-seq is similar with DNA sequencing as introducedabove; a major difference is the step for complementary DNA (cDNA) synthesis.In the library preparation step, RNA is isolated from genomic DNA usingenzymes such as deoxyribonuclease (DNase). Next, the mRNA is selected orkept by removing non-coding RNAs. The mRNA is then reverse transcribed tocDNA for amplification and sequencing. Several sequencing platforms can beused to perform RNA-seq, such as Illumina and SOLiD. Also, mRNAs can besequenced directly using Nanopore sequencing without cDNA synthesis noramplification steps [44].
12
Quantification of isoform expression using RNA-seq data
Isoforms are different transcripts produced by the same gene with the alternativesplicing mechanism. Isoforms have highly similar sequences; however, theirfunctional effects can be distinct or even opposite. For example, full-length p53β
isoform from TP53 induces the apoptosis of cancer cell while the ∆133p53isoform inhibits the cell death process [45, 46]. In this case, it is essential toquantify expression at the isoform level instead of the traditional gene level. Inthe last decade, a large number of tools have been developed to estimate isoformabundance. These tools can be classified into alignment-based andalignment-free groups. The alignment-based methods include Cufflinks [47],RSEM [48] and eXpress [49]. The first step before running these methods is toalign RNA-seq reads to a genome/transcriptome reference. Several aligners canbe used for this purpose, such as BWA [50] and Bowtie2 [51]. Most recently, agroup of alignment-free methods have been introduced to leverage the idea thatprecise alignment is not necessary to distribute reads to their original isoforms.The alignment-free methods include Sailfish [52], Salmon [53] and Kallisto [54].Sailfish and Salmon employ a quasi-mapping concept that maps the k-mers of aread rapidly to a predefined reference index [53]. Kallisto utilizes a de bruijngraph to check the compatibility between reads and transcript segments [54]. Allthree methods provide an ultra-fast speed in the processing of RNA-seq data andan accurate estimation of isoform expression compared with alignment-basedapproaches [55].
1.2.4 Proteomics
Proteomics aims to explore the complete set of proteins in terms of structure,function, abundance and interaction. According to the central dogma ofmolecular biology, protein is the last layer of genetic information flow, thusindicating ultimate consequences from mutations at DNA and RNA level. One ofthe major applications of proteomics is to develop potential drugs for thetreatment of cancers. Many efforts have been made to predict thethree-dimensional (3D) structure of disease related proteins using experimentalor computational methods. Based on the 3D profile, a new drug could bedesigned to interfere with protein/enzyme and potentially inactivate the functionof protein [56]. Apart from the mutational effects from DNA and RNA level,
13
proteins can undergo a wide range of post-translational modifications such asphosphorylation and ubiquitination. These chemical modifications are oftenimplicated in enzyme activity and cell structure maintenance, which can be usedto monitor cancer formation and progression [57]. Several databases areconstructed to store protein sequences and annotated functional information. TheUniProt [58] and PROSITE [59] represent two of the largest proteomicrepositories, which provide rich resources for protein research.
1.2.5 Microbiomics
Microbiomics is the study to investigate the entire micro-organisms ormicrobiota such as bacteria, viruses, and fungi. These organisms reside on allparts of the human body, including skin, gastrointestinal tract, uterus, and lung[60]. Microbiomic and epidemiological studies have demonstrated that humanmicrobiome have crucial impacts on inflammatory bowel disease, type IIdiabetes, obesity, and neurodevelopmental disorders [61, 62]. A recent studyshows that the gut microbiome play an important role in body metabolism andcontribute to the increasing prevalence of diabetes and obesity [63]. In anotherstudy of autism, researchers found that the composition of gut microbiome issignificantly different between individuals with autism and those without [64].The high-throughput sequencing technologies have been commonly used toelucidate the genetic landscape of microbiome. In 2007, the first phase of theHuman Microbiome Project (HMP) was launched to characterize the microbialtypes and components from 300 healthy participants [65]. The second phase,known as integrative Human Microbiome Project (iHMP), was conducted in2014 to investigate the functional impacts of microbiome on human physiologyand disease development [66].
1.3 Cancer research and overview
Cancer is a disease where cells grow uncontrollably with the potential to spreadto other parts of the body. A malignant cancer is defined when tumor cells invadeother tissues or organisms, while a benign tumor is localized and does not spread.It is well recognized that cancer is closely related to heritable or somaticmutations, which result in abnormal cellular growth, exceptional angiogenesisand suppression of normal cell signaling [67]. In the last two decades, the
14
sequencing technologies and omics data have been widely used to elucidate thegenetic and pathological mechanisms in various cancers. The characterization ofgenetic mutation provides significant insights into diagnosis, stratification,treatment, and prognosis for cancer patients. In this thesis, we utilize thesequencing methods and omics data from several cancer types for isoformquantification and mutation detection.
1.3.1 Neuroblastoma
Neuroblastoma is the most common extracranial solid tumor in children underthe age of five. It ranks third among the most prevalent pediatric cancers afterleukemia and brain cancer [68]. The tumor emerges from the sympatheticnervous system, and develops mostly in the adrenal glands, abdomen, chest, orneck. A neuroblastoma is highly heterogeneous with clinical behaviors such asspontaneous regression or aggressive progression despite intensive therapy [24].The patients can be classified into low, intermediate, and high risk groups. Thelow- and intermediate-risk patients have a favorable outcome with 90%event-free survival (EFS) rate in three years. However, the high-risk group showsa <50% EFS rate [69]. A wide variety of genetic mutations have been observedin neuroblastoma patients, which are implicated in the tumorigenesis and cancerprogression. One of the major objectives of this thesis is to identify potentialdriver genes in neuroblastoma and provide useful guidance for individualprognosis and treatment.
MYCN amplification
Figure 1.4 shows a comprehensive collection of genetic variations detected todate, which include gene amplification, chromosomal alteration, andpolymorphism. MYCN is a protein coding gene and a member of the MYC genefamily of transcription factors. The MYCN proteins regulate several cellularprocesses such as cell proliferation, differentiation, and apoptosis. MYCNamplification (MNA), which contains >10 copies of the gene, is observed in 25%of neuroblastoma patients [24]. MNA is a significant predictor of poor survivalin neuroblastoma patients; the amplification and over-expression of MYCN genecan be found in 40% of high-risk cases [69]. MYCN status (amplification versusnon-amplification) is frequently used in neuroblastoma risk classification [24].
15
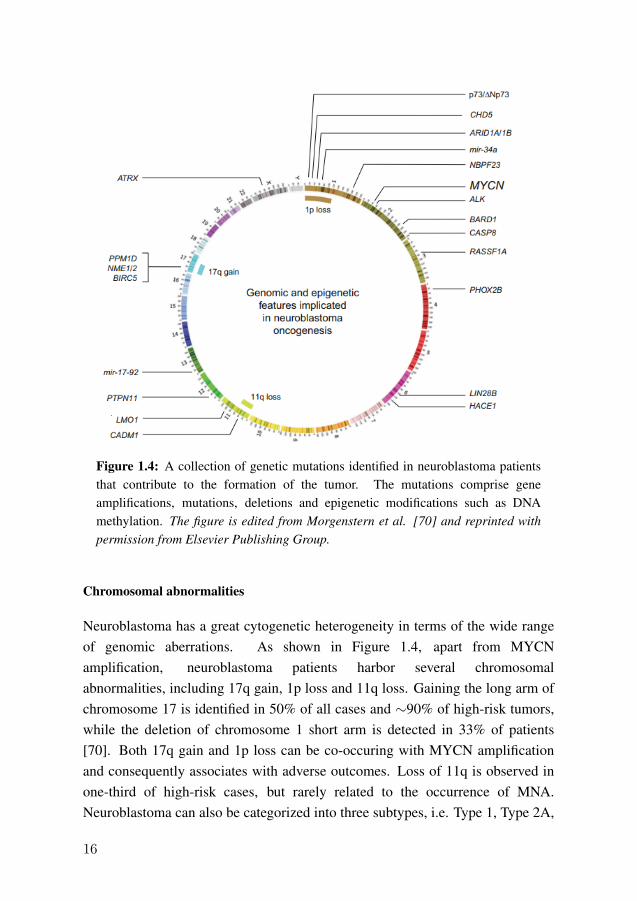
Figure 1.4: A collection of genetic mutations identified in neuroblastoma patientsthat contribute to the formation of the tumor. The mutations comprise geneamplifications, mutations, deletions and epigenetic modifications such as DNAmethylation. The figure is edited from Morgenstern et al. [70] and reprinted withpermission from Elsevier Publishing Group.
Chromosomal abnormalities
Neuroblastoma has a great cytogenetic heterogeneity in terms of the wide rangeof genomic aberrations. As shown in Figure 1.4, apart from MYCNamplification, neuroblastoma patients harbor several chromosomalabnormalities, including 17q gain, 1p loss and 11q loss. Gaining the long arm ofchromosome 17 is identified in 50% of all cases and ∼90% of high-risk tumors,while the deletion of chromosome 1 short arm is detected in 33% of patients[70]. Both 17q gain and 1p loss can be co-occuring with MYCN amplificationand consequently associates with adverse outcomes. Loss of 11q is observed inone-third of high-risk cases, but rarely related to the occurrence of MNA.Neuroblastoma can also be categorized into three subtypes, i.e. Type 1, Type 2A,
16
and Type 2B, based on the three genomic abnormalities. Type 1 are patientswithout MYCN amplification or any of the three chromosomal aberrations,usually having a favorable outcome. Type 2A tumor contains 17q gain or 11qloss but without MNA. This category has an intermediate risk and survivalcompared with Type 1. Type 2B is defined as MNA together with 1p loss or 17qgain, which has the highest risk and worst outcomes [71].
1.3.2 Acute myeloid leukemia
Acute myeloid leukemia (AML) is a hematological malignancy with excessivenumber of abnormal myeloid stem cells. Several risk factors are related to theformation of AML, such as old age, smoking, chemotherapy treatment, radiation,and genetic abnormalities. In the last 15 years, the advances of high-throughputsequencing technologies have greatly facilitated the detection of geneticmutations in AML [72]. In 2013, the cancer genome atlas (TCGA) researchgroup conducted a comprehensive study of 200 adult AML patients using WGS,WES, and RNA-seq approaches [73]. A total of 23 genes with recurrentmutations were detected, including NPM1 (27% frequency), FLT3 (28%), TP53(8%), et al. In 2017, the European Leukemia Net (ELN) published the latestrecommendation for diagnosis and classification based on AML mutations [74].As shown in Table 1.2, the patients can be classified into three risk groups, whichare favorable, intermediate, and adverse. The favorable risk group ischaracterized by a patient carrying RUNX1-RUNX1T1 fusion gene,CBFB-MYH11 fusion, or mutated NPM1 without FLT3 internal tandemduplication (ITD) (NPM1+/FLT3-ITD-). The intermediate category can bedefined with NPM1+/FLT3-ITD+, NPM1-/FLT3-ITD-, or the chimeric gene ofMLLT3-KMT2A. The BCR-ABL1 fusion or NPM1-/FLT3-ITD+ represent theadverse category, which mark the subgroup with inferior outcome and poorsurvival. Continuous efforts have been made to identify novel mutations toprovide further guidance for AML diagnosis and therapy [75].
1.3.3 Breast cancer
Breast cancer is one of the most diagnosed cancers in women worldwide. InAmerica, over 280,000 new cases are detected and 44,000 related deaths arefound every year [76]. Many risk factors are involved in the formation of breast
17
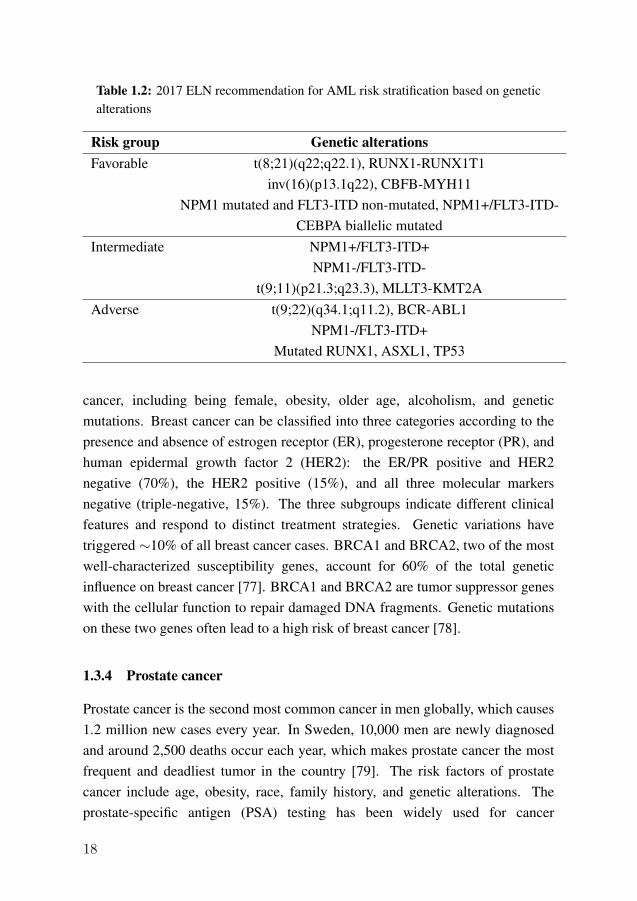
Table 1.2: 2017 ELN recommendation for AML risk stratification based on geneticalterations
Risk group Genetic alterationsFavorable t(8;21)(q22;q22.1), RUNX1-RUNX1T1
inv(16)(p13.1q22), CBFB-MYH11NPM1 mutated and FLT3-ITD non-mutated, NPM1+/FLT3-ITD-
CEBPA biallelic mutatedIntermediate NPM1+/FLT3-ITD+
NPM1-/FLT3-ITD-t(9;11)(p21.3;q23.3), MLLT3-KMT2A
Adverse t(9;22)(q34.1;q11.2), BCR-ABL1NPM1-/FLT3-ITD+
Mutated RUNX1, ASXL1, TP53
cancer, including being female, obesity, older age, alcoholism, and geneticmutations. Breast cancer can be classified into three categories according to thepresence and absence of estrogen receptor (ER), progesterone receptor (PR), andhuman epidermal growth factor 2 (HER2): the ER/PR positive and HER2negative (70%), the HER2 positive (15%), and all three molecular markersnegative (triple-negative, 15%). The three subgroups indicate different clinicalfeatures and respond to distinct treatment strategies. Genetic variations havetriggered ∼10% of all breast cancer cases. BRCA1 and BRCA2, two of the mostwell-characterized susceptibility genes, account for 60% of the total geneticinfluence on breast cancer [77]. BRCA1 and BRCA2 are tumor suppressor geneswith the cellular function to repair damaged DNA fragments. Genetic mutationson these two genes often lead to a high risk of breast cancer [78].
1.3.4 Prostate cancer
Prostate cancer is the second most common cancer in men globally, which causes1.2 million new cases every year. In Sweden, 10,000 men are newly diagnosedand around 2,500 deaths occur each year, which makes prostate cancer the mostfrequent and deadliest tumor in the country [79]. The risk factors of prostatecancer include age, obesity, race, family history, and genetic alterations. Theprostate-specific antigen (PSA) testing has been widely used for cancer
18
screening. However, its accuracy and efficacy are still controversial. In recentyears, artificial intelligence (AI) approaches have been applied to diagnose andstratify prostate cancer using biopsy images. Results show that AI methodsachieve a high accuracy and provide clinically useful aids to urological cliniciansfor the analysis of prostate biopsy samples [80]. Genetic mutations have beenimplicated in the formation and progression of prostate cancer. For example,using whole-exome sequencing data, researchers have identified deletions inPTEN (10q23) and NKX (8p21) as recurrent genomic alterations associated withprostate tumorigenesis [81]. The fusion gene represents another major type ofmutation identified in prostate cancer. The chimeric gene between TMPRSS2and ETS gene family, especially TMPRSS2-ERG and TMPRSS2-ETV1/4, arefrequently detected in cancer patients. The TMPRSS2-ERG fusion originatesfrom an interstitial deletion in chromosome 21, which is the most frequent fusionevent observed in more than 55% of cases [82].
19

20

2 Aims of this thesis
Although the sequencing platforms have yielded tremendous amount of omicsdata, it remains a major challenge to analyze these data with high accuracy andefficiency. The overall aim of this thesis is to develop novel statistical methods toanalyze the high-throughput omics data and make biologically meaningfulinterpretations in cancer studies. The specific aims of the four studies are asfollows:
� To integrate multiple omics data from neuroblastoma patients and identifypotential driver genes contributing to the formation and progression of thedisease. The datasets utilized in this study include microarray comparativegenomic hybridization data, gene expression profile, gene interactionnetwork, and clinical records.
� To develop a novel statistical method for the quantification of geneexpression at the isoform level using RNA-seq data. The method also aimsto correct all potential biases in the sequencing data.
� To build a new approach to quantify mutant-allele expression at the isoformlevel using RNA-seq data and investigate the association between isoform-level expression and drug response in cancer patients.
� To develop an analysis pipeline for the detection of fusion genes usingwhole-exome sequencing data and re-targeted sequencing data from acutemyeloid leukemia and prostate cancer samples.
21

22
3 Materials and methods
In this thesis, we have utilized a wide range of omics data from several cancertypes. Both real and simulated sequencing data have been employed to test theperformance of the methods developed in this doctoral project.
3.1 Integrative analysis of neuroblastoma omics data
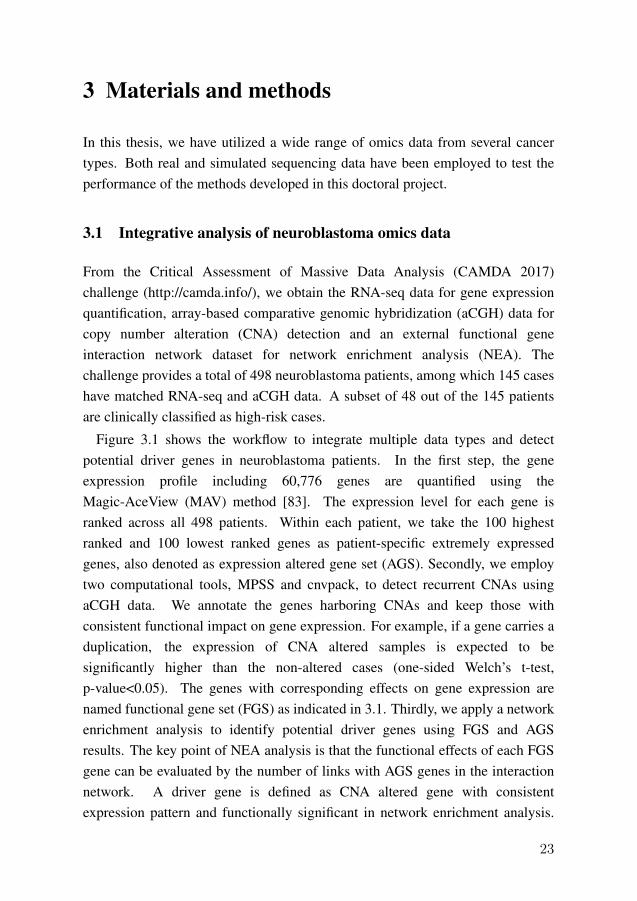
From the Critical Assessment of Massive Data Analysis (CAMDA 2017)challenge (http://camda.info/), we obtain the RNA-seq data for gene expressionquantification, array-based comparative genomic hybridization (aCGH) data forcopy number alteration (CNA) detection and an external functional geneinteraction network dataset for network enrichment analysis (NEA). Thechallenge provides a total of 498 neuroblastoma patients, among which 145 caseshave matched RNA-seq and aCGH data. A subset of 48 out of the 145 patientsare clinically classified as high-risk cases.
Figure 3.1 shows the workflow to integrate multiple data types and detectpotential driver genes in neuroblastoma patients. In the first step, the geneexpression profile including 60,776 genes are quantified using theMagic-AceView (MAV) method [83]. The expression level for each gene isranked across all 498 patients. Within each patient, we take the 100 highestranked and 100 lowest ranked genes as patient-specific extremely expressedgenes, also denoted as expression altered gene set (AGS). Secondly, we employtwo computational tools, MPSS and cnvpack, to detect recurrent CNAs usingaCGH data. We annotate the genes harboring CNAs and keep those withconsistent functional impact on gene expression. For example, if a gene carries aduplication, the expression of CNA altered samples is expected to besignificantly higher than the non-altered cases (one-sided Welch’s t-test,p-value<0.05). The genes with corresponding effects on gene expression arenamed functional gene set (FGS) as indicated in 3.1. Thirdly, we apply a networkenrichment analysis to identify potential driver genes using FGS and AGSresults. The key point of NEA analysis is that the functional effects of each FGSgene can be evaluated by the number of links with AGS genes in the interactionnetwork. A driver gene is defined as CNA altered gene with consistentexpression pattern and functionally significant in network enrichment analysis.
23

Figure 3.1: Integrative analysis pipeline to identify driver genes in neuroblastomapatients and subsequent clinical validation. The figure is from Study I and reprintedwith permission from BioMed Central Ltd [24].
Next, we summarize the total number of driver genes in each patient as the drivergene score (DGscore). We then assess the prognostic significance of DGscore by
24
comparing the patients’ survival in high and low DGscore groups.
3.2 Isoform quantification using RNA-seq data
3.2.1 Isoform quantification model
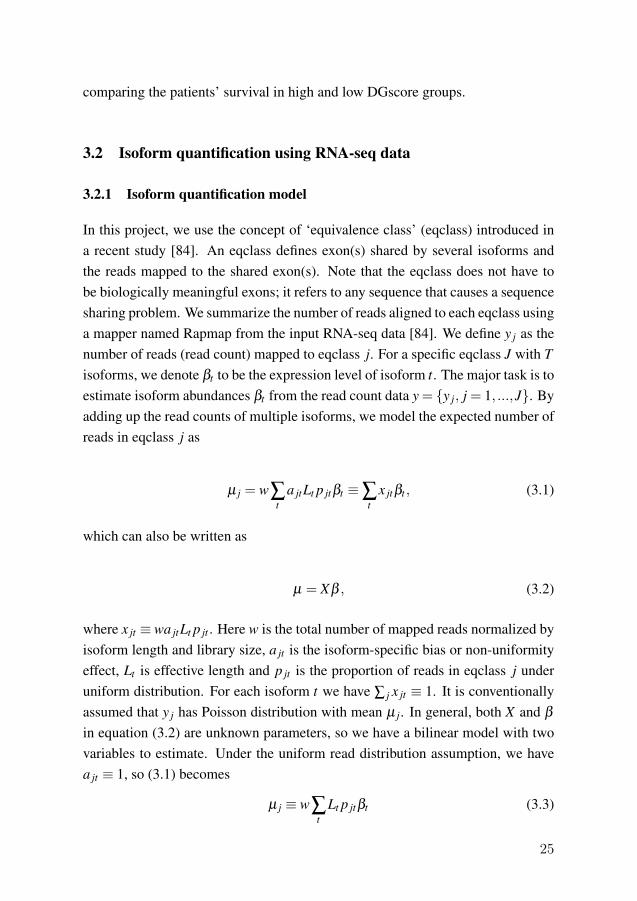
In this project, we use the concept of ‘equivalence class’ (eqclass) introduced ina recent study [84]. An eqclass defines exon(s) shared by several isoforms andthe reads mapped to the shared exon(s). Note that the eqclass does not have tobe biologically meaningful exons; it refers to any sequence that causes a sequencesharing problem. We summarize the number of reads aligned to each eqclass usinga mapper named Rapmap from the input RNA-seq data [84]. We define y j as thenumber of reads (read count) mapped to eqclass j. For a specific eqclass J with Tisoforms, we denote βt to be the expression level of isoform t. The major task is toestimate isoform abundances βt from the read count data y = {y j, j = 1, ...,J}. Byadding up the read counts of multiple isoforms, we model the expected number ofreads in eqclass j as
µ j = w∑t
a jtLt p jtβt ≡∑t
x jtβt , (3.1)
which can also be written as
µ = Xβ , (3.2)
where x jt ≡ wa jtLt p jt . Here w is the total number of mapped reads normalized byisoform length and library size, a jt is the isoform-specific bias or non-uniformityeffect, Lt is effective length and p jt is the proportion of reads in eqclass j underuniform distribution. For each isoform t we have ∑ j x jt ≡ 1. It is conventionallyassumed that y j has Poisson distribution with mean µ j. In general, both X and β
in equation (3.2) are unknown parameters, so we have a bilinear model with twovariables to estimate. Under the uniform read distribution assumption, we havea jt ≡ 1, so (3.1) becomes
µ j ≡ w∑t
Lt p jtβt (3.3)
25

Figure 3.2: Construction of the initial matrix X using simulated RNA-seq data. Thefigure is from Study II and reprinted with permission from Oxford University Press[21].
3.2.2 Construction of X matrix
According to model (3.3) and the definition, X matrix should contain threecomponents: (1) a group of isoforms sharing multiple exons; (2) a list ofeqclasses that define exons shared between isoforms; (3) the proportion of readcounts from each eqclass that contributes to the total expression of each isoform.Figure 3.2 shows the steps to construct the initial X matrix using a simulation
26

scheme. For each transcript, we simulate the corresponding RNA-seq sampleusing the R package Polyester [85]. For example, sample1 is simulated for tx1,where we assign read counts to tx1 only and other transcripts should not beexpressed. We then utilize Rapmap for read alignment and read quantification ineach eqclass. The result is summarized in the transcript response profile (TRP)matrix as illustrated in Figure 3.2(a). In TRP1, each row represents an eqclassand the number of reads mapped into this eqclass. The binary pattern indicates ifa transcript has reads originating from the specific eqclass. Each TRP alsodefines transcript neighbors (TNs), which are isoforms associated with eachother due to exon sharing. As shown in Figure 3.2(b) and (c), we continue togenerate TRPs for other transcripts and summarize the associations into atranscription cluster (TC). The unique set of binary patterns and original readcounts from each TRP are recorded in Figure 3.2(d). In Figure 3.2(e), the readcounts in each transcript are standardized with the sum of one to generate theinitial X matrix.
3.2.3 Alternating expectation-maximization algorithm
The starting X matrix is served as an input in equation 3.2. Figure 3.3 shows theworkflow of our quantification method XAEM to estimate the isoformabundance. In step (a) we generate the Y matrix using RNA-seq data. The matrixrecords the number of reads mapped to each eqclass in multiple samples. Step(b) involves the X matrix constructed as mentioned above. In step (c), weestimate both X and β using an alternating expectation-maximization (AEM)algorithm. The estimation is conducted iteratively until X and β have less than1% difference between successive iterations. In this estimation process, apotential issue could be caused by paralogs, which are transcripts with extremelysimilar sequences. Paralogs in X matrix will make the X matrix singular and theβ non-identifiable. To deal with this issue, we use the k-means clustering tocombine paralogs into one transcript.
3.2.4 Simulated and real RNA-seq data
Simulated data are commonly used for benchmarking the quantificationapproaches. We implement Polyester to simulate RNA-seq reads based on theexpression values from a human colon cancer cell line HCT116 [86]. Polyester
27

Figure 3.3: The workflow of XAEM to quantify isoform level expression. The figureis from Study II and reprinted with permission from Oxford University Press [21].
can generate sequencing reads under uniform and non-uniform distribution, sothat we simulate 100 RNA-seq samples under uniform condition and another 100samples with non-uniform read distribution. Paired-end reads are generated withread length of 100 bp and fragment length at 250 bp. We obtain two realRNA-seq datasets in this project. The first comprises 384 cells from a triplenegative breast cancer cell line (MDA-MB-231). The dataset includes twobatches and 50% of cells in each batch are treated with metformin. The secondreal dataset is downloaded from the Sequencing Quality Control Consortium(SEQC) project [87]. The dataset contains two unique RNA samples andhundreds of replicates sequenced in several laboratory sites. We select fourreplicates for each sample and obtain the RNA-seq data from the Sequence Read
28
Archive (SRA) repository. A qPCR validated expression profile is also acquiredfor the eight replicates.
We compare the quantification performance of XAEM with other existingapproaches such as Cufflinks [47], Sailfish [84], Kallisto [54], and Salmon [53].An absolute proportional error (APE) is calculated using the equation 3.4, whereE is the estimated expression value and T is the ground truth.
APE = |E−T |/(T +1). (3.4)
3.3 Estimation of mutation-allele expression
It is well recognized that DNA mutations play crucial roles in cancer initiationand progression [88]. However, traditional quantification methods often ignoremutant status and alleles. To address this issue, we extend the idea of X matrixand AEM algorithm to estimate mutation-allele expression at the isoform level.We use a more flexible strategy by estimating the sum of all mutant isoformsoriginating from the same wild-type isoform. For instance, two mutant isoforms,isoform_mut1 and isoform_mut2, are associated with the wild-type versionisoform_wt. In the process of X matrix construction, we rename bothisoform_mut1 and isoform_mut2 as isoform_mut. We then recode the binarypattern in respective eqclass and merge those with the same pattern. Thisprocessing will generate only one mutant version for each wild-type isoform, andthe number of total isoforms in the X matrix will be up to M ∗ 2, where M is thenumber of wild-type isoforms. The X matrix including both wild-type andmutant isoforms is then served as input in equation 3.2.
We simulate two RNA-seq datasets to evaluate the accuracy of our methodMAX and another quantification method Salmon [53]. The first dataset comprise100 non-mutated samples where we only assign read counts to wild-typeisoforms. The second dataset contain 100 mutated samples with equal readcounts to both wild-type and mutant isoforms. For the real RNA-seq data, weobtain a total of 461 RNA-seq samples from the BeatAML study [89]. Thedataset also includes whole-exome sequencing data, clinical records, and drugresponse data. The BeatAML project provides a detailed list of genetic variationsdetected using variation callers such as Mutect [90] and Varscan2 [91].
29
3.4 Fusion gene detection at DNA level
In this study, we build a pipeline to detect fusion genes using paired-endwhole-exome sequencing and targeted sequencing data. We first align reads togenome reference using aligners such as BWA [50] or Bowtie2 [51]. The outputis in the Sequence Alignment/Map (SAM) or Binary Alignment/Map (BAM)format, which records the mapping position, flag, mapping quality, CIGARstring and other alignment results. Based on these information, we extract (1) thediscordant reads, where the two reads are mapping to different genes and (2) splitreads, where a single read is partially mapping to more than one gene. The fusiongene identification from split reads can be straightforward since split readsspanning the fusion break point directly. For discordant reads, the idea ofequivalence class mentioned in section 3.2.1 is utilized to construct a fusionequivalence class (FEQ). Each FEQ comprises the constituent genes and thenumber of reads supporting the fusion event. We then apply multiple filters toexclude the fusion candidates that are false positives. We test the performance ofour method on three large cancer datasets including BeatAML data,TCGA-AML data, and the Prostate Biomarkers cohort. The BeatAML cohortprovides a total of 531 samples with WES data and 411 patients with RNA-seqdata. The TCGA-AML project performs whole-exome sequencing on 150samples and RNA-seq on 179 samples. From the Prostate Biomarkers cohort, weobtain a total of 65 patients with targeted deep-sequencing data.
30
4 Main results
4.1 Study I
We apply the analysis pipeline as shown in Figure 3.1 to a subset of 48 high-risk neuroblastoma patients. A total of 274 genes with recurrent copy numberalteration and parallel impact on gene expression are identified. We apply thenetwork enrichment analysis (NEA) to detect patient-specific driver genes, wherethe input AGS are the top 200 extremely expressed genes from each patient and theinput FGS are those CNA-altered genes in each patient (subset of the 274 recurrentgenes). The enrichment analysis identifies 66 patient-specific driver genes; thefull list is given in Additional File 4 attached with Study I. Next, we detect thecommon driver genes where the input FGS and AGS are genes present in at leastfive patients (10% of 48 samples). We detect four common drivers: ERCC6,HECTD2, KIAA1279, and EMX2.
We summarize the total number of common and patient-specific drivers ineach sample as DGscore and evaluate its clinical relevance in patients’ survival.The 48 patients are divided into high and low DGscore groups based on themedian value of the score. Figure 4.1(a) shows that the low DGscore group has asignificantly better outcome than the high DGscore group (p-value=0.006). InFigure 4.1(b), we only use the 274 CNA altered genes without the NEA step; theresult indicates that it cannot distinguish the survival between high and lowDGscore groups (p-value=0.492). In Figure 4.1(c) and (d), the DGscore iscalculated only using patient-specific or common driver genes. The resultsindicate that either type of driver genes is insufficient to predict the patients’survival (p-value>0.2).
4.2 Study II
In study II, we develop a novel method named XAEM for the quantification ofisoform abundance. We first apply XAEM to quantify the isoform expressionusing simulated data and compare the accuracy with existing methods such asSalmon [53], Sailfish [84], Kallisto [54], and Cufflinks [47]. Table 4.1summarizes the median APE for each method using 100 uniform andnon-uniform samples. The isoforms are divided into three categories: (1)
31
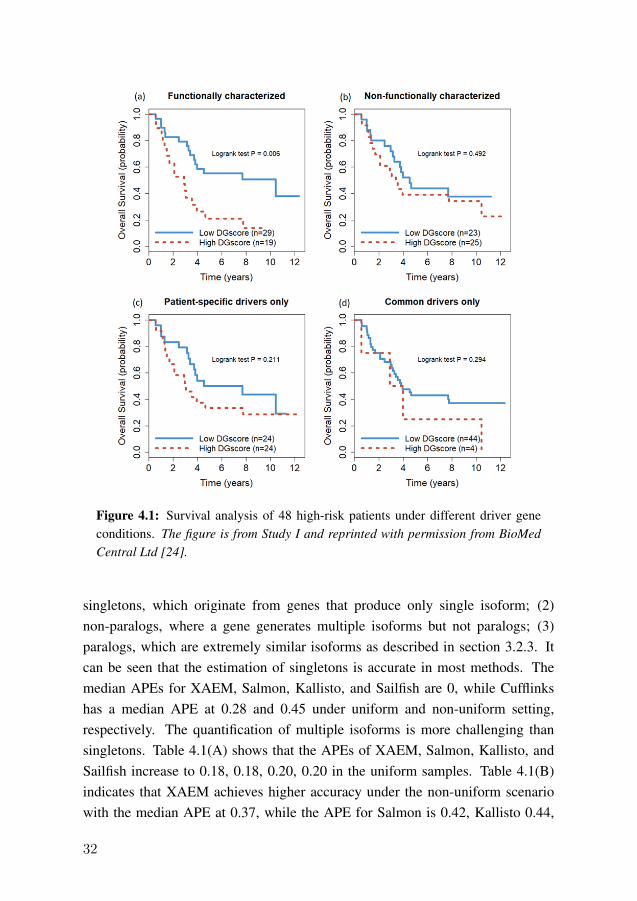
Figure 4.1: Survival analysis of 48 high-risk patients under different driver geneconditions. The figure is from Study I and reprinted with permission from BioMedCentral Ltd [24].
singletons, which originate from genes that produce only single isoform; (2)non-paralogs, where a gene generates multiple isoforms but not paralogs; (3)paralogs, which are extremely similar isoforms as described in section 3.2.3. Itcan be seen that the estimation of singletons is accurate in most methods. Themedian APEs for XAEM, Salmon, Kallisto, and Sailfish are 0, while Cufflinkshas a median APE at 0.28 and 0.45 under uniform and non-uniform setting,respectively. The quantification of multiple isoforms is more challenging thansingletons. Table 4.1(A) shows that the APEs of XAEM, Salmon, Kallisto, andSailfish increase to 0.18, 0.18, 0.20, 0.20 in the uniform samples. Table 4.1(B)indicates that XAEM achieves higher accuracy under the non-uniform scenariowith the median APE at 0.37, while the APE for Salmon is 0.42, Kallisto 0.44,
32
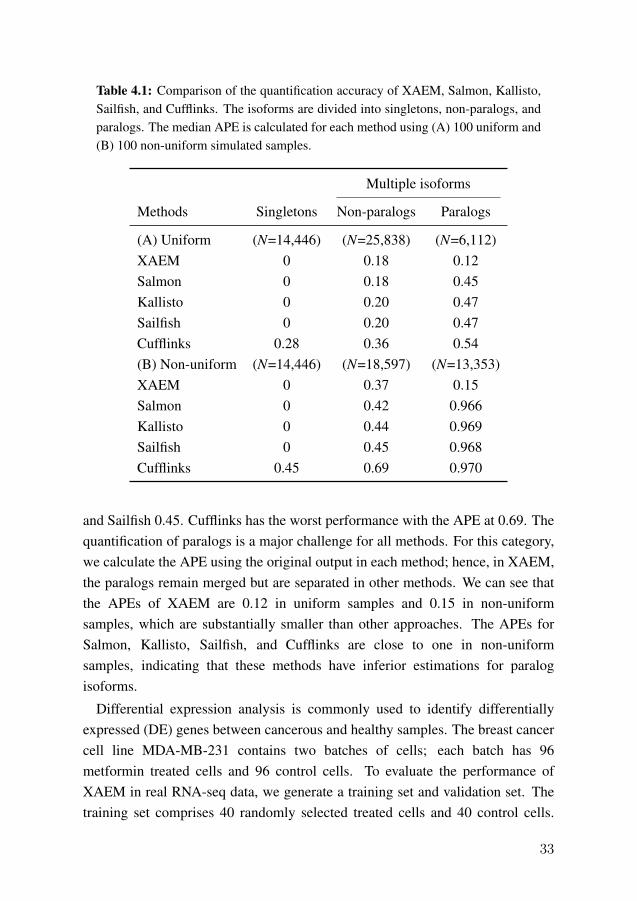
Table 4.1: Comparison of the quantification accuracy of XAEM, Salmon, Kallisto,Sailfish, and Cufflinks. The isoforms are divided into singletons, non-paralogs, andparalogs. The median APE is calculated for each method using (A) 100 uniform and(B) 100 non-uniform simulated samples.
Multiple isoforms
Methods Singletons Non-paralogs Paralogs
(A) Uniform (N=14,446) (N=25,838) (N=6,112)XAEM 0 0.18 0.12Salmon 0 0.18 0.45Kallisto 0 0.20 0.47Sailfish 0 0.20 0.47Cufflinks 0.28 0.36 0.54(B) Non-uniform (N=14,446) (N=18,597) (N=13,353)XAEM 0 0.37 0.15Salmon 0 0.42 0.966Kallisto 0 0.44 0.969Sailfish 0 0.45 0.968Cufflinks 0.45 0.69 0.970
and Sailfish 0.45. Cufflinks has the worst performance with the APE at 0.69. Thequantification of paralogs is a major challenge for all methods. For this category,we calculate the APE using the original output in each method; hence, in XAEM,the paralogs remain merged but are separated in other methods. We can see thatthe APEs of XAEM are 0.12 in uniform samples and 0.15 in non-uniformsamples, which are substantially smaller than other approaches. The APEs forSalmon, Kallisto, Sailfish, and Cufflinks are close to one in non-uniformsamples, indicating that these methods have inferior estimations for paralogisoforms.
Differential expression analysis is commonly used to identify differentiallyexpressed (DE) genes between cancerous and healthy samples. The breast cancercell line MDA-MB-231 contains two batches of cells; each batch has 96metformin treated cells and 96 control cells. To evaluate the performance ofXAEM in real RNA-seq data, we generate a training set and validation set. Thetraining set comprises 40 randomly selected treated cells and 40 control cells.
33

Figure 4.2: Detection and validation of differentially expressed isoforms usingbreast cancer cell line RNA-seq data. The comparison is between XAEM, Salmon,and Cufflinks. The figure is from Study II and reprinted with permission from OxfordUniversity Press [21].
The validation set contains another set of 40 treated and 40 control cells. Wecalculate a rediscovery rate (RDR) that indicates the number of significant DEisoforms from the training set that are validated in the validation set. Figure 4.2shows the comparison between XAEM, Salmon and Cufflinks. In Figure 4.2(a),all three methods are implemented on batch 1 without bias correction. Therefore,in XAEM, we do not run the AEM step to correct biases from RNA-seq data. Itcan be seen that the RDR is similar between the three methods. In Figure 4.2(b),the bias correction step is added back to each method, in that the AEM step is
34
used in XAEM’s estimation. We can see a notable improvement of XAEM,where the RDRs of top 100, 500, 1000 DE isoforms are 1.0, 0.56, and 0.50,respectively, which is substantially higher than those in Salmon and Cufflinks.Figure 4.2(c) shows the comparison across batches for singleton, indicating thatthere is no significant difference in RDR among the three methods. The findingis in agreement with Table 4.1 since the quantification of singletons is trivial.Figure 4.2(d) shows that XAEM achieves higher RDR for multiple isoforms(non-paralogs) across batches. The overall RDRs for XAEM, Salmon, andCufflinks are 0.77, 0.26, and 0.22, respectively.
4.3 Study III
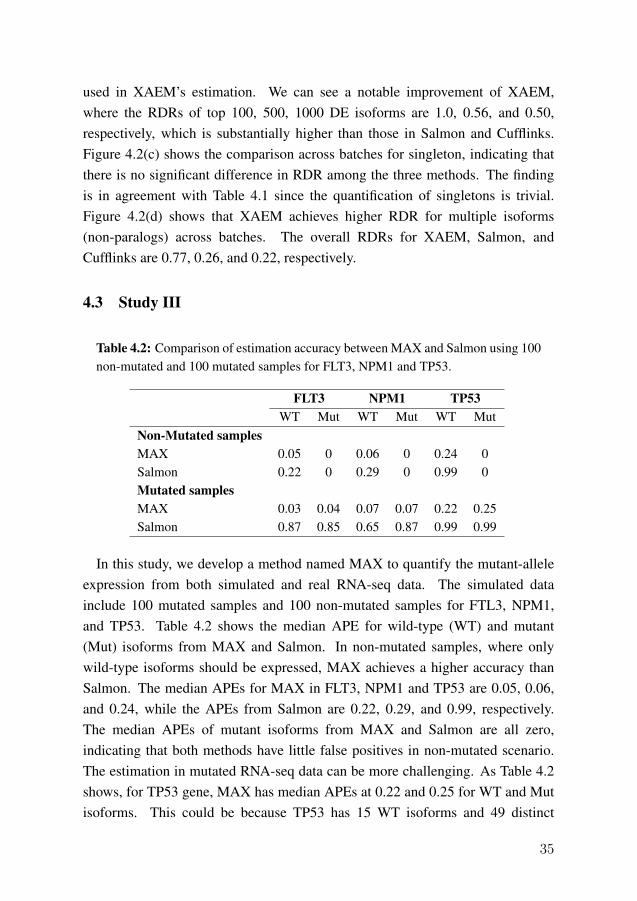
Table 4.2: Comparison of estimation accuracy between MAX and Salmon using 100non-mutated and 100 mutated samples for FLT3, NPM1 and TP53.
FLT3 NPM1 TP53WT Mut WT Mut WT Mut
Non-Mutated samplesMAX 0.05 0 0.06 0 0.24 0Salmon 0.22 0 0.29 0 0.99 0Mutated samplesMAX 0.03 0.04 0.07 0.07 0.22 0.25Salmon 0.87 0.85 0.65 0.87 0.99 0.99
In this study, we develop a method named MAX to quantify the mutant-alleleexpression from both simulated and real RNA-seq data. The simulated datainclude 100 mutated samples and 100 non-mutated samples for FTL3, NPM1,and TP53. Table 4.2 shows the median APE for wild-type (WT) and mutant(Mut) isoforms from MAX and Salmon. In non-mutated samples, where onlywild-type isoforms should be expressed, MAX achieves a higher accuracy thanSalmon. The median APEs for MAX in FLT3, NPM1 and TP53 are 0.05, 0.06,and 0.24, while the APEs from Salmon are 0.22, 0.29, and 0.99, respectively.The median APEs of mutant isoforms from MAX and Salmon are all zero,indicating that both methods have little false positives in non-mutated scenario.The estimation in mutated RNA-seq data can be more challenging. As Table 4.2shows, for TP53 gene, MAX has median APEs at 0.22 and 0.25 for WT and Mutisoforms. This could be because TP53 has 15 WT isoforms and 49 distinct
35
mutations, which results in a total of 522 MT isoforms. The accuracy of Salmonbecomes extremely low, where the median errors across three genes are >0.65.For example, the median APEs from Salmon for WT and Mut isoforms in TP53are close to one. Overall, compared with Salmon, MAX achieves a much higheraccuracy for the quantification of wild-type and mutant isoforms undernon-mutated and mutated conditions.
●
●
●●
●
●
●
●
●
● ●
●
●
●
●● ●
●
●
●
●
●
● ●●
●
●
●
● ●
●
●
●●
●
●
●●
●
●●●●
●
● ●
● ●●
●●
●
●●
●●●
●● ●●
●●
●
●
●●●
●●
●
●
●
●●
●
●
●
●●●●
●
● ●
●
●
● ●
●
●
●
●
●●
●
●
●
●
●
●
● ●
●
●
●
●
●
●
●
●
●
●
●
●
●●
●
●
●
●●
−3 −2 −1 0 1 2 3
0.0
1.0
2.0
3.0
High vs Low effect
−lo
g10(
P−
valu
e)
(a) IC50 vs mutant expression
20
83113
●
●
●
●
●●●
●
●
●●
●●
●●
●
●●
●
●●
●
●
● ●
●
●
●
●●
●
●
●
●
●
● ●● ●●
●●
●●
●
●●
●
●
●
●
●
●
● ●●
●
●
●
●
●●●● ●
●●
●●
●
●●
●
●
●
●
●
●
●
●
●
●
●
●
●
●●●
●
●● ●
●
●
●
●
●●
● ●
●
●
●
●
●●
●
●
●●
●
●
●
●
●●●
●
●●
●●
−20 0 20 40 60
0.0
1.0
2.0
3.0
High vs Low effect
−lo
g10(
P−
valu
e)
(b) AUC vs mutant expression
7383
113
02
46
810
IC50
ITD−N
−
ITD−L
o
ITD−H
i
ITD+N
−
ITD+L
o
ITD+H
i
(c) VX−745: IC50 vs mut expr
●
●
●
100
150
200
250
AU
C
ITD−N
−
ITD−L
o
ITD−H
i
ITD+N
−
ITD+L
o
ITD+H
i
(d) VX−745: AUC vs mut expr
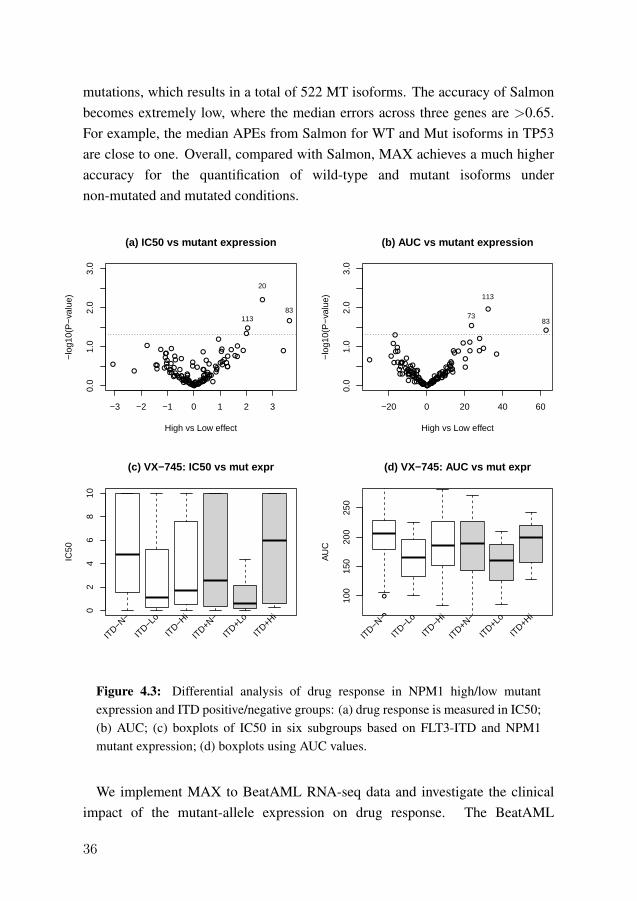
Figure 4.3: Differential analysis of drug response in NPM1 high/low mutantexpression and ITD positive/negative groups: (a) drug response is measured in IC50;(b) AUC; (c) boxplots of IC50 in six subgroups based on FLT3-ITD and NPM1mutant expression; (d) boxplots using AUC values.
We implement MAX to BeatAML RNA-seq data and investigate the clinicalimpact of the mutant-allele expression on drug response. The BeatAML
36
conducted drug screening experiments on 122 small-molecule inhibitors and thedrug sensitivities are measured in inhibitory concentration (IC50) and area underthe curve (AUC). We focus on 82 samples carrying the NPM1 mutation andcalculate a Mut/WT allele expression ratio for each isoform. Based on theexpression ratio of the dominant NM_002520 isoform, we split the 82 patientsinto high and low mutant expression groups. Figures 4.3(a) and (b) show thevolcano plots using IC50 and AUC metrics. It can be seen that drug 83(panobinostat) and drug 113 (VX-745) have significantly differential responsesbetween high and low ratio groups. We check the expression of VX-745 furtherby dividing the patients into six subgroups based on the presence of FLT3-ITDalteration and the high/low expression ratio of NPM1. Figures 4.3(c) and (d)illustrate the drug response in IC50 and AUC, respectively. In each panel, thethree left-most boxplots represent FLT3-ITD negative patients and the threeright-most boxplots are FLT3-ITD positive patients. Among the FLT3-ITDnegative samples, both low and high NPM1 mutated groups have better drugresponse than NPM1 non-mutated samples (p-value=0.04 for IC50 and 0.004 forAUC). However, in the FLT3-positive patients, samples with low NPM1expression are the only group to have good drug response (p-value=0.001 forIC50 and 0.03 for AUC). The results indicate that, based on the mutant-alleleexpression profile, we identify a subgroup of patients having better drug responseto a kinase inhibitor.
4.4 Study IV
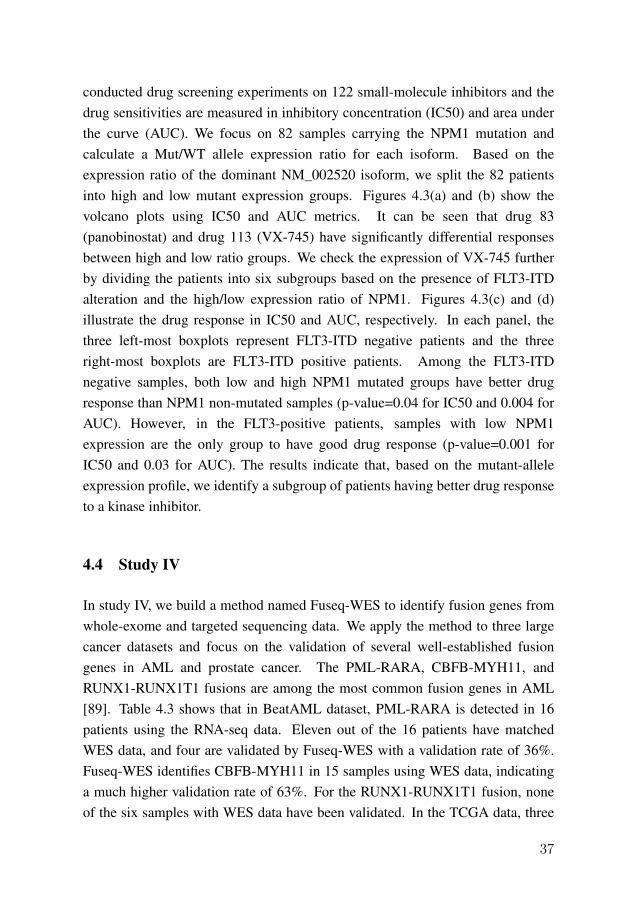
In study IV, we build a method named Fuseq-WES to identify fusion genes fromwhole-exome and targeted sequencing data. We apply the method to three largecancer datasets and focus on the validation of several well-established fusiongenes in AML and prostate cancer. The PML-RARA, CBFB-MYH11, andRUNX1-RUNX1T1 fusions are among the most common fusion genes in AML[89]. Table 4.3 shows that in BeatAML dataset, PML-RARA is detected in 16patients using the RNA-seq data. Eleven out of the 16 patients have matchedWES data, and four are validated by Fuseq-WES with a validation rate of 36%.Fuseq-WES identifies CBFB-MYH11 in 15 samples using WES data, indicatinga much higher validation rate of 63%. For the RUNX1-RUNX1T1 fusion, noneof the six samples with WES data have been validated. In the TCGA data, three
37
cases are detected to carry PML-RARA and two are harboring theRUNX1-RUNX1T1 fusion. In contrast, no cases are identified withCBFB-MYH11, which indicates a validation rate at 0.
Table 4.3: The number of patients detected with fusion genes using RNA-seq data;number of patients with matched WES data and number of patients carrying thefusion events validated using WES data.
BeatAML RNA-seq data WES data Fuseq-WESPML-RARA 16 11 4
CBFB-MYH11 25 24 15RUNX1-RUNX1T1 9 6 0
TCGA RNA-seq data WES data Fuseq-WESPML-RARA 16 6 3
CBFB-MYH11 11 6 0RUNX1-RUNX1T1 7 4 2
Table 4.4: Fusion detection results for TMPRSS2-ERG in Prostate Biomarkerdataset
Positive IGV Negative IGV TotalPostive Fuseq-WES 36 5 41
Negative Fuseq-WES 1 23 24Total 37 28 65
TMPRSS2-ERG (TE) is a predominant fusion in prostate cancer, which can beobserved in >55% of patients. From the Prostate Biomarker project we obtain65 samples with targeted sequencing data. We first implement four individualtools for fusion detection, including SvABA [92], GRIDSS [93], LUMPY [94],and a python-based tool named SVcaller. We then verify the fusion genes usingthe Integrative Genomics Viewer (IGV) and keep those successfully verified byIGV. Table 4.4 shows the comparison between IGV and Fuseq-WES detection.TMPRSS2-ERG is identified in 41 and absent in 24 patients using Fuseq-WES,while the IGV method detects the fusion in 37 samples. The comparison showsthat the results are concordant in 36 TE positive and 23 TE negative samples,indicating an overall concordance at 91%.
38

5 Discussion and conclusion
Integrative analysis of multi-omics data has been widely used in the era of high-throughput sequencing. In Study I, we present an integrative analysis pipelinecombining RNA-seq, copy number alteration and network enrichment profile todetect driver genes in neuroblastoma patients. A total of 66 patient-specific andfour common driver genes are detected from 48 high-risk cases. We calculatea DGscore based on the driver genes and evaluate its clinical impact in survivalanalysis. Results show that patients with a low DGscore have significantly betteroutcomes than those with a high DGscore.
A key feature of the integrative pipeline is that it combines signals frommultiple omic sources. A driver gene is defined when it fulfills three criteria:altered copy number, having a consistent impact on gene expression and enrichedin gene functional network. The result in Figure 4.1(b) shows that withoutfunctional characterization in the gene interaction network, the DGscore cannotdistinguish the survival of high and low DGscore groups. Besides, the DGscoretakes both patient-specific and common drivers into account. As shown inFigures 4.1(c) and (d), using patient-specific or common driver genes only is notsufficient to predict the patients’ survival. In a Cox regression analysis ofhigh-risk neuroblastoma patients, DGscore emerged as the strongest prognosticfactor with the adjustment of age, tumor stage and MYCN amplification.
Notably, MYCN is a well-established oncogene and a significant predictor forsurvival in neuroblastoma patients [69]; however, it is not necessarily effectivefor high-risk groups. Unlike DGscore, which integrates several levels of signals,MYCN amplification alone is insufficient to predict the outcome of high-riskpatients. The result shows the importance to consider multiple attributes rangingfrom mutation status to functional impacts in identifying candidate driver genes.
The quantification of isoform level expression is a fundamental task in RNA-seq data analysis. Compared with gene level quantification, which simply adds upall reads mapped to a single gene, the estimation of isoform abundance is trickierdue to the alternative splicing mechanism and exon sharing. A major problem ishow to distribute reads mapping to exons shared by different isoforms.
In Study II, we develop a method named XAEM to quantify the isoformexpression from RNA-seq data. Many existing methods utilize a linear model
39
Y = Xβ with a possibly known X and estimate only the β . In contrast, XAEMleverages a more flexible bi-linear model where both X and β are unknown. Weconstruct the initial X matrix using a simulation scheme and divide the wholetranscriptome into small and feasible units as isoform clusters. The X matrix isthen served as an input variable in the model where β and X are estimated usingan AEM algorithm. In the process of updating the X matrix, the AEM algorithmautomatically corrects all potential biases observed from multiple input RNA-seqsamples.
We utilize simulated and real RNA-seq data to evaluate the performance ofXAEM and compare it with other approaches. The comparison shows thatXAEM achieves higher accuracy in multiple isoforms and better rediscovery ratein differential expression analysis. Paralogs are isoforms with extremely similarsequences. The quantification of paralogs using short read-length sequencingdata remains a big challenge in existing approaches. In the XAEM model, weemploy a special strategy to merge paralogs into a combined isoform group,which leads to a more accurate estimation of paralog abundance.
In Study III, we extend the concept of AEM algorithm and develop a methodnamed MAX to quantify mutant-allele expression at isoform level. The majorobstacle in this analysis is the highly similar sequences between wild-type isoformand potentially large number of mutant isoforms. For example, if there are Mwild-type isoforms and N distinct mutations detected in a gene, the total number ofwild-type and mutant isoforms can be M×2N . The large number of isoforms willmake the X matrix sparse and result in an indeterminate solution in the equation3.2.
To address this issue, we merge the mutant isoforms from the same wild-typeisoform into a single mutant set. In this case, each wild-type isoform only hasone mutant version, thus reducing the dimension of the X and making thequantification feasible. We assess the accuracy of MAX using mutated andnon-mutated RNA-seq data and compare it with a standard quantification methodSalmon. The results indicate that MAX achieves substantially betterperformance than Salmon under both scenarios.
One advantage of MAX over other methods is the utilization of explicit Xmatrix, which integrates both wild-type and mutant isoforms, providing aneffective way to deal with the huge amount of sequence similarities. We applyMAX to a real RNA-seq dataset from BeatAML project; the analysis shows little
40
false positive estimates in non-mutated samples, which can be considered as avalidation of MAX’s accuracy in real-world data. To evaluate the clinicalsignificance of mutant-allele expression, we investigate the expression pattern inthe drug response data comprising 122 drugs. We find that a subgroup of NPM1mutated patients has a better drug response than other groups. The resultsdemonstrate that mutant-allele expression can provide significant information forpatient stratification and individualized treatment.
Whole-exome sequencing data have been frequently used to investigate thegenetic landscape in numerous diseases. The large number of WES data providerich resources for further exploitation. In Study IV, we build an analysis pipelinenamed Fuseq-WES to detect fusion genes from WES and targeted sequencingdata. We apply the method to AML and prostate cancer cohorts, validatingseveral well-known fusion genes in these two cancers. In the BeatAML data, wedetect 15 patients carrying the CBFB-MYH11 fusion, which indicates avalidation rate of 63%. The PML-RARA fusion is validated in 36% patients. Wecheck the gene structure of MYH11 and notice that it contains 43 exons with thegene length at 154,000 nucleotides. Both the PML and RARA gene have nineexons with a gene length of ∼50,000 bases. Accordingly, we speculate that thedensity of exons could be a key factor for validation rate, where a high densitycan facilitate the detection of fusion events. However, in the TCGA dataset, theCBFB-MYH11 is not validated in any samples. From the WES data, we find thatthe read depth of TCGA data is 15x while in BeatAML data it is 40x. The resultsuggests that read depth could also affect the fusion gene detection using WESdata.
This is confirmed when we use targeted sequencing data to detectTMPRSS2-ERG fusion in prostate cancer patients. The average read depth oftargeted sequencing data is 1500x, which provides an ultra deep coverage forfusion detection. The result shows that Fuseq-WES achieves a 97% concordancein TMPRSS2-ERG positive cases and 88% concordance in negative cases.Although we validate several fusion genes using exome sequencing data, theoverall detection result indicates that it is difficult to replicate the fusion genesdetected in the RNA-seq dataset. An inherent disadvantage of WES data is thatonly exonic regions are sequenced. Thus, if a fusion gene occurs in the intron orintergenic region, the WES is unable to capture the breakpoint.
41

42
6 Future perspectives
In this thesis, we develop several methods to analyze a wide variety of omics datafrom cancer patients. Each method aims to tackle specific questions in omicsdata analysis and subsequently facilitates the investigation of pathophysiologicmechanisms underlying different cancer types. Our studies have severallimitations. For example, in Study I, we detect driver genes on a small number(48) of high-risk neuroblastoma patients. The same problem exists in Study IIIand IV, where the number of NPM1 mutated samples or patients with WES datais limited. Ideally, if sufficient omics data had been available, we would be ableto identify candidate driver genes with higher confidence. Besides, we couldvalidate the efficacy and performance of our methods in a separate validation set.
The second limitation comes from the completeness of genome/transcriptomereference used for read alignment. The reference is served as the basis to detectgenetic mutations and quantify isoform abundance. However, since the releaseof the first draft of human genome, many complex regions remain unfinished orerroneous. These incomplete and incorrect segments can have negative effectson gene annotation and other downstream analyses. According to a latest pre-print study [95], a research consortium has almost filled in the unfinished gapsand added ∼115 protein-coding genes. We anticipate that a complete and refinedhuman genome would generally improve the performance of related analyses.
Another limitation regarding the XAEM approach is the applicability tosingle-cell (sc) RNA-seq data. The current version of XAEM achieves the bestperformance using bulk RNA-seq data, while the scRNA-seq data usually havelowly expressed isoforms and produce a sparse read-count matrix. Therefore,improving the accuracy of XAEM using scRNA-seq data is worth furtherinvestigation.
43

44
7 Acknowledgements
Finally I am reaching this point here, with all the memories reappearing in myhead. During my last several years of PhD study, there are so many of you whohelped and supported me warmly. Here I would like to take the chance to expressmy sincere gratitude to all of you.
First of all, to my main supervisor, Yudi Pawitan. Thank you for giving me thechance to conduct the PhD study in your group. I learned so much from you andI believe I have improved myself a lot with your help. Also, thank you for takingus to so many different restaurants for the delicious food, I surely miss thosehappy times.
My co-supervisor, Trung Nghia Vu. Thank you for being so patient with me allthe time. I feel that you are my “elder brother”, who is always there and ready tohelp when I have problems in my project. I am so grateful that you help medebug and improve my codes and analysis. For so many times I was impressedby your intelligence and efficiency to solve the problems that I got stuck.
My co-supervisor, Xia Shen. It is really pleasant and inspiring every time when Isee you and hear your talk. You are very interesting person with a lot of brilliantideas in your head. I feel like you are my “younger brother” because you told mewhich video game is the most popular, which restaurant serves the most authenticfood, which country has the best view, which mountain is the best for skiing andso on. I am happy that you are here because it is joyful to talk with you.
Thanks to my mentor, Di Wu, who is also my landlord, roommate, “part-timeboss”, collaborator and a true friend. We spend a lot of times together and talk awide range of topics every day. I have learned so much from you when wediscuss about academy, industry, technology and sometimes philosophy. Specialthanks to Yanling Cai, for providing me the accommodation in the last fouryeas, I wish you a big success in your career and life journey.
Thanks to everyone in the group: Zheng Ning, for helping me since the first daywhen I arrived in Sweden and giving me advises to prepare each important
45

seminar; to Tian Mou, Stefano Calza, Sophie Debonneville, Lu Pan, QuangThinh Trac, Sarath Kumar Murugan, Dat T Nguyen and Tingyou Zhou,thanks for the inspring discussions during our weekly meeting.
Thanks to my office mates: Linda Abrahamsson, Xingrong Liu, for helpingme at the very beginning of my PhD study, and our everyday fika within theoffice. Anastasia Lam, Nurgul Batyrbekova and Henrik Olsson, thanks foryour accompany, I have learned so many interesting things from your study andproject.
I would like to express my gratitude to everyone in MEB, past and present.Thanks to Chen Suo, it is pleasant and enjoyable to have every talk anddiscussion with you, and I wish you a big success in your academic career.Chuen Seng Tan, thanks for hosting me warmly in Singapore. To Jingru Yu,Shihua Sun, Weiwei Bian, Yun Du, Shuan Hao, Can Cui, Xinhe Mao, YangXu, Erwei Zeng, Shengxin Liu, Qian Yang, Jiangwei Sun, Lin Li, YunzhangWang, Yinxi Wang, Xia Li, Shuyang Yao, Venkatesh Chellappa, Tong Gong,Jie Song, Yiqiang Zhan, Yi Lu, Zheng Chang, Donghao Lv, Xu Chen,Jiangrong Wang, Haomin Yang, Tingting Huang, Xiaoying Kang, JiayaoLei, Qing Shen, Le Zhang, Ruyue Zhang, Chen Wang, Wei He and YufengChen. Each of you are so fabulous and talented. I feel lucky to be your friendand colleague.
To the Biostatistics Group colleagues: Marie Reilly, Marie Jansson, GabrielIsheden, Andreas Karlsson, Peter Ström, Keith Humphreys, Maya AlshehAli, Rickard Strandberg, Lili Meng, Julien Bryois, Hannah Bower,Elisabeth Dahlqwist, Alexander Ploner and so on. Thank you for creating sucha nice and brilliant group.
Thanks to the IT, HR and Administration group in MEB, for helping me dealwith the document and contract, especially thanks to Alessandra Nanni, GunillaNilsson Roos, Jenny Lindgren, Lina Werner and Gunilla Sonnebring.
To my friends in Sweden: Xiaoyan Qian, Xingwu Zhou, Xiang Jiao, Dan Bai,it is a lot of fun to hang out with you guys. To my previous colleagues in China,
46
Lusheng Huang, Bin Yang, Zhiyan Zhang, Huashui Ai, Shijun Xiao, JunRen, Aleksei Traspov and Wanbo Li. Thank you for your help during mymaster’s study.
To Tat Wah, thank you for all the joyful times together. I hope we can travel tomore destinations in the near future.
To my parents and my family, thank you for supporting me as always. And to myfour adorable nephews and niece, which are Zhong En Jun, Zhong Xin Yue,Lan Ying Hao and Lan Xi Jie, I am lucky to be your uncle, and watching allyou little guys growing up. Let us hope that someday in the future, when you areable to read these words, you would be proud of your uncle and consider him asyour role model.
The PhD study is a unique experience in my life. It is filled with happiness,sorrow, challenges and achievements. I will cherish this special journey andcontinue to improve myself as a better person.
47

48
References
[1] Sciacovelli, M., Schmidt, C., Maher, E.R., Frezza, C.: Metabolic drivers inhereditary cancer syndromes. Annual Review of Cancer Biology 4, 77–97(2020) 1
[2] Nones, K., Patch, A.-M.: The Impact of Next Generation Sequencing inCancer Research. Multidisciplinary Digital Publishing Institute (2020) 1
[3] Rusch, M., Nakitandwe, J., Shurtleff, S., Newman, S., Zhang, Z., Edmonson,M.N., Parker, M., Jiao, Y., Ma, X., Liu, Y., et al.: Clinical cancer genomicprofiling by three-platform sequencing of whole genome, whole exome andtranscriptome. Nature communications 9(1), 1–13 (2018) 1
[4] Tomczak, K., Czerwinska, P., Wiznerowicz, M.: The cancer genome atlas(tcga): an immeasurable source of knowledge. Contemporary oncology19(1A), 68 (2015) 1
[5] Zhang, J., Baran, J., Cros, A., Guberman, J.M., Haider, S., Hsu, J., Liang,Y., Rivkin, E., Wang, J., Whitty, B., et al.: International cancer genomeconsortium data portal—a one-stop shop for cancer genomics data. Database2011 (2011) 1
[6] Yang, A., Zhang, W., Wang, J., Yang, K., Han, Y., Zhang, L.: Review on theapplication of machine learning algorithms in the sequence data mining ofdna. Frontiers in Bioengineering and Biotechnology 8, 1032 (2020) 2
[7] Zhou, X., Ren, L., Li, Y., Zhang, M., Yu, Y., Yu, J.: The next-generationsequencing technology: a technology review and future perspective. ScienceChina Life Sciences 53(1), 44–57 (2010) 1
[8] Sanger, F., Nicklen, S., Coulson, A.R.: Dna sequencing with chain-terminating inhibitors. Proceedings of the national academy of sciences74(12), 5463–5467 (1977) 2
[9] Quince, C., Lanzén, A., Curtis, T.P., Davenport, R.J., Hall, N., Head, I.M.,Read, L.F., Sloan, W.T.: Accurate determination of microbial diversity from454 pyrosequencing data. Nature methods 6(9), 639–641 (2009) 3
49
[10] Bronner, I.F., Quail, M.A., Turner, D.J., Swerdlow, H.: Improved protocolsfor illumina sequencing. Current protocols in human genetics 79(1), 18–2(2013) 4
[11] McElhoe, J.A., Holland, M.M., Makova, K.D., Su, M.S.-W., Paul, I.M.,Baker, C.H., Faith, S.A., Young, B.: Development and assessment of anoptimized next-generation dna sequencing approach for the mtgenome usingthe illumina miseq. Forensic Science International: Genetics 13, 20–29(2014) 4
[12] Su, Z., Ning, B., Fang, H., Hong, H., Perkins, R., Tong, W., Shi, L.: Next-generation sequencing and its applications in molecular diagnostics. Expertreview of molecular diagnostics 11(3), 333–343 (2011) 5
[13] Olson, M.V.: The human genome project. Proceedings of the NationalAcademy of Sciences 90(10), 4338–4344 (1993) 6
[14] Bleidorn, C.: Third generation sequencing: technology and its potentialimpact on evolutionary biodiversity research. Systematics and biodiversity14(1), 1–8 (2016) 7
[15] Schadt, E.E., Turner, S., Kasarskis, A.: A window into third-generationsequencing. Human molecular genetics 19(R2), 227–240 (2010) 7
[16] Roberts, R.J., Carneiro, M.O., Schatz, M.C.: The advantages of smrtsequencing. Genome biology 14(7), 1–4 (2013) 7
[17] Ardui, S., Ameur, A., Vermeesch, J.R., Hestand, M.S.: Single molecule real-time (smrt) sequencing comes of age: applications and utilities for medicaldiagnostics. Nucleic acids research 46(5), 2159–2168 (2018) 7
[18] Branton, D., Deamer, D.W., Marziali, A., Bayley, H., Benner, S.A., Butler,T., Di Ventra, M., Garaj, S., Hibbs, A., Huang, X., et al.: The potentialand challenges of nanopore sequencing. Nanoscience and technology: Acollection of reviews from Nature Journals, 261–268 (2010) 7
[19] Jain, M., Olsen, H.E., Paten, B., Akeson, M.: The oxford nanopore minion:delivery of nanopore sequencing to the genomics community. Genomebiology 17(1), 1–11 (2016) 7
50
[20] Ari, S., Arikan, M.: Next-generation sequencing: advantages,disadvantages, and future. In: Plant Omics: Trends and Applications, pp.109–135. Springer, ??? (2016) 8
[21] Deng, W., Mou, T., Kalari, K.R., Niu, N., Wang, L., Pawitan, Y., Vu, T.N.:Alternating em algorithm for a bilinear model in isoform quantification fromrna-seq data. Bioinformatics 36(3), 805–812 (2020) 8, 12, 26, 28, 34
[22] Petersen, L.M., Martin, I.W., Moschetti, W.E., Kershaw, C.M., Tsongalis,G.J.: Third-generation sequencing in the clinical laboratory: exploringthe advantages and challenges of nanopore sequencing. Journal of ClinicalMicrobiology 58(1), 01315–19 (2019) 8
[23] Wu, C., Zhou, F., Ren, J., Li, X., Jiang, Y., Ma, S.: A selective review ofmulti-level omics data integration using variable selection. High-throughput8(1), 4 (2019) 9
[24] Suo, C., Deng, W., Vu, T.N., Li, M., Shi, L., Pawitan, Y.: Accumulation ofpotential driver genes with genomic alterations predicts survival of high-riskneuroblastoma patients. Biology direct 13(1), 1–11 (2018) 9, 15, 24, 32
[25] Huang, S., Chaudhary, K., Garmire, L.X.: More is better: recent progress inmulti-omics data integration methods. Frontiers in genetics 8, 84 (2017) 9
[26] Bhardwaj, R., Sethi, A., Nambiar, R.: Big data in genomics: An overview.In: 2014 IEEE International Conference on Big Data (Big Data), pp. 45–49(2014). IEEE 9
[27] Zuryn, S., Le Gras, S., Jamet, K., Jarriault, S.: A strategy for direct mappingand identification of mutations by whole-genome sequencing. Genetics186(1), 427–430 (2010) 9
[28] Larson, D.E., Harris, C.C., Chen, K., Koboldt, D.C., Abbott, T.E., Dooling,D.J., Ley, T.J., Mardis, E.R., Wilson, R.K., Ding, L.: Somaticsniper:identification of somatic point mutations in whole genome sequencing data.Bioinformatics 28(3), 311–317 (2012) 9
[29] Li, P., Guo, M., Wang, C., Liu, X., Zou, Q.: An overview of snp interactionsin genome-wide association studies. Briefings in functional genomics 14(2),143–155 (2015) 9
51
[30] Rosenthal, S.L., Barmada, M.M., Wang, X., Demirci, F.Y., Kamboh, M.I.:Connecting the dots: potential of data integration to identify regulatory snpsin late-onset alzheimer’s disease gwas findings. PloS one 9(4), 95152 (2014)9
[31] Fachal, L., Dunning, A.M.: From candidate gene studies to gwas and post-gwas analyses in breast cancer. Current opinion in genetics & development30, 32–41 (2015) 9
[32] Guan, P., Sung, W.-K.: Structural variation detection using next-generationsequencing data: a comparative technical review. Methods 102, 36–49(2016) 10
[33] Escaramís, G., Docampo, E., Rabionet, R.: A decade of structural variants:description, history and methods to detect structural variation. Briefings infunctional genomics 14(5), 305–314 (2015) 10
[34] Kosugi, S., Momozawa, Y., Liu, X., Terao, C., Kubo, M., Kamatani, Y.:Comprehensive evaluation of structural variation detection algorithms forwhole genome sequencing. Genome biology 20(1), 1–18 (2019) 10
[35] Jones, P.A., Baylin, S.B.: The epigenomics of cancer. Cell 128(4), 683–692(2007) 11
[36] Baylin, S.B., Esteller, M., Rountree, M.R., Bachman, K.E., Schuebel, K.,Herman, J.G.: Aberrant patterns of dna methylation, chromatin formationand gene expression in cancer. Human molecular genetics 10(7), 687–692(2001) 11
[37] Diaz, A.K., Baker, S.J.: The genetic signatures of pediatric high-gradeglioma: no longer a one-act play. In: Seminars in Radiation Oncology, vol.24, pp. 240–247 (2014). Elsevier 11
[38] Jin, B., Robertson, K.D.: Dna methyltransferases, dna damage repair, andcancer. Epigenetic alterations in oncogenesis, 3–29 (2013) 11
[39] Bernstein, B.E., Stamatoyannopoulos, J.A., Costello, J.F., Ren, B.,Milosavljevic, A., Meissner, A., Kellis, M., Marra, M.A., Beaudet, A.L.,Ecker, J.R., et al.: The nih roadmap epigenomics mapping consortium.Nature biotechnology 28(10), 1045–1048 (2010) 11
52
[40] Stunnenberg, H.G., Abrignani, S., Adams, D., de Almeida, M., Altucci,L., Amin, V., Amit, I., Antonarakis, S.E., Aparicio, S., Arima, T., et al.:The international human epigenome consortium: a blueprint for scientificcollaboration and discovery. Cell 167(5), 1145–1149 (2016) 11
[41] Simpson, J.T., Workman, R.E., Zuzarte, P., David, M., Dursi, L., Timp,W.: Detecting dna cytosine methylation using nanopore sequencing. Naturemethods 14(4), 407–410 (2017) 11
[42] Wang, Z., Gerstein, M., Snyder, M.: Rna-seq: a revolutionary tool fortranscriptomics. Nature reviews genetics 10(1), 57–63 (2009) 12
[43] Heegaard, N.H., Schetter, A.J., Welsh, J.A., Yoneda, M., Bowman, E.D.,Harris, C.C.: Circulating micro-rna expression profiles in early stagenonsmall cell lung cancer. International journal of cancer 130(6), 1378–1386(2012) 12
[44] Sessegolo, C., Cruaud, C., Da Silva, C., Cologne, A., Dubarry, M., Derrien,T., Lacroix, V., Aury, J.-M.: Transcriptome profiling of mouse samples usingnanopore sequencing of cdna and rna molecules. Scientific reports 9(1), 1–12 (2019) 12
[45] Aoubala, M., Murray-Zmijewski, F., Khoury, M.P., Fernandes, K., Perrier,S., Bernard, H., Prats, A.-C., Lane, D.P., Bourdon, J.-C.: p53 directlytransactivates δ133p53 α , regulating cell fate outcome in response to dnadamage. Cell Death & Differentiation 18(2), 248–258 (2011) 13
[46] Mondal, A.M., Horikawa, I., Pine, S.R., Fujita, K., Morgan, K.M., Vera,E., Mazur, S.J., Appella, E., Vojtesek, B., Blasco, M.A., et al.: p53isoforms regulate aging-and tumor-associated replicative senescence in tlymphocytes. The Journal of clinical investigation 123(12), 5247–5257(2013) 13
[47] Trapnell, C., Roberts, A., Goff, L., Pertea, G., Kim, D., Kelley, D.R.,Pimentel, H., Salzberg, S.L., Rinn, J.L., Pachter, L.: Differential geneand transcript expression analysis of rna-seq experiments with tophat andcufflinks. Nature protocols 7(3), 562 (2012) 13, 29, 31
53
[48] Li, B., Dewey, C.N.: Rsem: accurate transcript quantification from rna-seqdata with or without a reference genome. BMC bioinformatics 12(1), 1–16(2011) 13
[49] Roberts, A., Pachter, L.: Streaming fragment assignment for real-timeanalysis of sequencing experiments. Nature methods 10(1), 71–73 (2013)13
[50] Li, H.: Aligning sequence reads, clone sequences and assembly contigs withbwa-mem. arXiv preprint arXiv:1303.3997 (2013) 13, 30
[51] Langmead, B., Salzberg, S.L.: Fast gapped-read alignment with bowtie 2.Nature methods 9(4), 357 (2012) 13, 30
[52] Patro, R., Mount, S.M., Kingsford, C.: Sailfish enables alignment-freeisoform quantification from rna-seq reads using lightweight algorithms.Nature biotechnology 32(5), 462–464 (2014) 13
[53] Patro, R., Duggal, G., Love, M.I., Irizarry, R.A., Kingsford, C.: Salmonprovides fast and bias-aware quantification of transcript expression. Naturemethods 14(4), 417–419 (2017) 13, 29, 31
[54] Bray, N.L., Pimentel, H., Melsted, P., Pachter, L.: Near-optimal probabilisticrna-seq quantification. Nature biotechnology 34(5), 525–527 (2016) 13, 29,31
[55] Zhang, C., Zhang, B., Lin, L.-L., Zhao, S.: Evaluation and comparisonof computational tools for rna-seq isoform quantification. BMC genomics18(1), 1–11 (2017) 13
[56] Klebe, G.: Protein modeling and structure-based drug design. Springer(2013) 13
[57] Woolfrey, K.M., Dell’Acqua, M.L.: Coordination of proteinphosphorylation and dephosphorylation in synaptic plasticity. Journalof Biological Chemistry 290(48), 28604–28612 (2015) 14
[58] Consortium, U.: Uniprot: a hub for protein information. Nucleic acidsresearch 43(D1), 204–212 (2015) 14
54

[59] Hulo, N., Bairoch, A., Bulliard, V., Cerutti, L., De Castro, E., Langendijk-Genevaux, P.S., Pagni, M., Sigrist, C.J.: The prosite database. Nucleic acidsresearch 34(suppl_1), 227–230 (2006) 14
[60] Rajendhran, J., Gunasekaran, P.: Human microbiomics. Indian journal ofmicrobiology 50(1), 109–112 (2010) 14
[61] Gurung, M., Li, Z., You, H., Rodrigues, R., Jump, D.B., Morgun, A.,Shulzhenko, N.: Role of gut microbiota in type 2 diabetes pathophysiology.EBioMedicine 51, 102590 (2020) 14
[62] Li, Q., Han, Y., Dy, A.B.C., Hagerman, R.J.: The gut microbiota and autismspectrum disorders. Frontiers in cellular neuroscience 11, 120 (2017) 14
[63] Singer-Englar, T., Barlow, G., Mathur, R.: Obesity, diabetes, and thegut microbiome: an updated review. Expert review of gastroenterology &hepatology 13(1), 3–15 (2019) 14
[64] Devaraj, S., Hemarajata, P., Versalovic, J.: The human gut microbiome andbody metabolism: implications for obesity and diabetes. Clinical chemistry59(4), 617–628 (2013) 14
[65] Turnbaugh, P.J., Ley, R.E., Hamady, M., Fraser-Liggett, C.M., Knight, R.,Gordon, J.I.: The human microbiome project. Nature 449(7164), 804–810(2007) 14
[66] lita. proctor@ nih. gov Lita Proctor Jonathan LoTempio Aron MarquitzPhil Daschner Dan Xi Roberto Flores Liliana Brown Ryan Ranallo PadmaMaruvada Karen Regan R. Dwayne Lunsford Michael Reddy Lis Caler,N.H.M.P.A.T.: A review of 10 years of human microbiome researchactivities at the us national institutes of health, fiscal years 2007-2016.Microbiome 7, 1–19 (2019) 14
[67] Chin, L., Andersen, J.N., Futreal, P.A.: Cancer genomics: from discoveryscience to personalized medicine. Nature medicine 17(3), 297 (2011) 14
[68] Simon, T., Hero, B., Schulte, J.H., Deubzer, H., Hundsdoerfer, P., vonSchweinitz, D., Fuchs, J., Schmidt, M., Prasad, V., Krug, B., et al.: 2017gpoh guidelines for diagnosis and treatment of patients with neuroblastictumors. Klinische Pädiatrie 229(03), 147–167 (2017) 15
55
[69] Huang, M., Weiss, W.A.: Neuroblastoma and mycn. Cold Spring Harborperspectives in medicine 3(10), 014415 (2013) 15, 39
[70] Dellaire, G., Berman, J.N., Arceci, R.J.: Cancer Genomics: from Bench toPersonalized Medicine. Academic Press, ??? (2013) 16
[71] Costa, R.A., Seuánez, H.N.: Investigation of major genetic alterations inneuroblastoma. Molecular biology reports 45(3), 287–295 (2018) 17
[72] Daver, N., Schlenk, R.F., Russell, N.H., Levis, M.J.: Targeting flt3 mutationsin aml: review of current knowledge and evidence. Leukemia 33(2), 299–312 (2019) 17
[73] Network, C.G.A.R.: Genomic and epigenomic landscapes of adult de novoacute myeloid leukemia. New England Journal of Medicine 368(22), 2059–2074 (2013) 17
[74] Döhner, H., Estey, E., Grimwade, D., Amadori, S., Appelbaum, F.R.,Büchner, T., Dombret, H., Ebert, B.L., Fenaux, P., Larson, R.A., et al.:Diagnosis and management of aml in adults: 2017 eln recommendationsfrom an international expert panel. Blood 129(4), 424–447 (2017) 17
[75] Saultz, J.N., Garzon, R.: Acute myeloid leukemia: a concise review. Journalof clinical medicine 5(3), 33 (2016) 17
[76] Waks, A.G., Winer, E.P.: Breast cancer treatment: a review. Jama 321(3),288–300 (2019) 17
[77] Sun, J., Meng, H., Yao, L., Lv, M., Bai, J., Zhang, J., Wang, L., Ouyang, T.,Li, J., Wang, T., et al.: Germline mutations in cancer susceptibility genes ina large series of unselected breast cancer patients. Clinical Cancer Research23(20), 6113–6119 (2017) 18
[78] Abdel-Razeq, H., Al-Omari, A., Zahran, F., Arun, B.: Germline brca1/brca2mutations among high risk breast cancer patients in jordan. BMC cancer18(1), 1–11 (2018) 18
[79] Loeb, S., Folkvaljon, Y., Curnyn, C., Robinson, D., Bratt, O., Stattin, P.:Uptake of active surveillance for very-low-risk prostate cancer in sweden.JAMA oncology 3(10), 1393–1398 (2017) 18
56
[80] Goldenberg, S.L., Nir, G., Salcudean, S.E.: A new era: artificial intelligenceand machine learning in prostate cancer. Nature Reviews Urology 16(7),391–403 (2019) 19
[81] Barbieri, C.E., Baca, S.C., Lawrence, M.S., Demichelis, F., Blattner, M.,Theurillat, J.-P., White, T.A., Stojanov, P., Van Allen, E., Stransky, N., et al.:Exome sequencing identifies recurrent spop, foxa1 and med12 mutations inprostate cancer. Nature genetics 44(6), 685–689 (2012) 19
[82] Zhou, F., Gao, S., Han, D., Han, W., Chen, S., Patalano, S., Macoska, J.A.,He, H.H., Cai, C.: Tmprss2-erg activates no-cgmp signaling in prostatecancer cells. Oncogene 38(22), 4397–4411 (2019) 19
[83] Thierry-Mieg, D., Thierry-Mieg, J.: Aceview: a comprehensive cdna-supported gene and transcripts annotation. Genome biology 7(1), 1–14(2006) 23
[84] Srivastava, A., Sarkar, H., Gupta, N., Patro, R.: Rapmap: a rapid,sensitive and accurate tool for mapping rna-seq reads to transcriptomes.Bioinformatics 32(12), 192–200 (2016) 25, 29, 31
[85] Frazee, A.C., Jaffe, A.E., Langmead, B., Leek, J.T.: Polyester: simulatingrna-seq datasets with differential transcript expression. Bioinformatics31(17), 2778–2784 (2015) 27
[86] Wu, A.R., Neff, N.F., Kalisky, T., Dalerba, P., Treutlein, B., Rothenberg,M.E., Mburu, F.M., Mantalas, G.L., Sim, S., Clarke, M.F., et al.:Quantitative assessment of single-cell rna-sequencing methods. Naturemethods 11(1), 41 (2014) 27
[87] Su, Z., Mason, C.: Seqc/maqc-iii consortium a comprehensive assessment ofrna-seq accuracy, reproducibility and information content by the sequencingquality control consortium. Nat. Biotechnol 32(9), 903–914 (2014) 28
[88] Halazonetis, T.D., Gorgoulis, V.G., Bartek, J.: An oncogene-induced dnadamage model for cancer development. science 319(5868), 1352–1355(2008) 29
[89] Tyner, J.W., Tognon, C.E., Bottomly, D., Wilmot, B., Kurtz, S.E., Savage,S.L., Long, N., Schultz, A.R., Traer, E., Abel, M., et al.: Functional genomic
57
landscape of acute myeloid leukaemia. Nature 562(7728), 526–531 (2018)29, 37
[90] Cibulskis, K., Lawrence, M.S., Carter, S.L., Sivachenko, A., Jaffe, D.,Sougnez, C., Gabriel, S., Meyerson, M., Lander, E.S., Getz, G.: Sensitivedetection of somatic point mutations in impure and heterogeneous cancersamples. Nature biotechnology 31(3), 213–219 (2013) 29
[91] Koboldt, D.C., Zhang, Q., Larson, D.E., Shen, D., McLellan, M.D.,Lin, L., Miller, C.A., Mardis, E.R., Ding, L., Wilson, R.K.: Varscan 2:somatic mutation and copy number alteration discovery in cancer by exomesequencing. Genome research 22(3), 568–576 (2012) 29
[92] Wala, J.A., Bandopadhayay, P., Greenwald, N.F., O’Rourke, R., Sharpe, T.,Stewart, C., Schumacher, S., Li, Y., Weischenfeldt, J., Yao, X., et al.: Svaba:genome-wide detection of structural variants and indels by local assembly.Genome research 28(4), 581–591 (2018) 38
[93] Cameron, D.L., Schröder, J., Penington, J.S., Do, H., Molania, R., Dobrovic,A., Speed, T.P., Papenfuss, A.T.: Gridss: sensitive and specific genomicrearrangement detection using positional de bruijn graph assembly. Genomeresearch 27(12), 2050–2060 (2017) 38
[94] Layer, R.M., Chiang, C., Quinlan, A.R., Hall, I.M.: Lumpy: a probabilisticframework for structural variant discovery. Genome biology 15(6), 1–19(2014) 38
[95] Nurk, S., Koren, S., Rhie, A., Rautiainen, M., Bzikadze, A.V., Mikheenko,A., Vollger, M.R., Altemose, N., Uralsky, L., Gershman, A., et al.: Thecomplete sequence of a human genome. bioRxiv (2021) 43
58