Embed Size (px)
Citation preview

4th Quarter and Full-Year 2017 Financial ResultsImproved revenue and EBITDAs
Financial restructuring process completed
All results are presented before Non-Recurring Charges & write-offs, unless stated otherwise

Forward-looking statementsThis presentation contains forward-looking statements, including, without limitation, statements aboutCGG (“the Company”) plans, strategies and prospects. These forward-looking statements are subjectto risks and uncertainties that may change at any time, and, therefore, the Company’s actual resultsmay differ materially from those that were expected. The Company based these forward-lookingstatements on its current assumptions, expectations and projections about future events. Although theCompany believes that the expectations reflected in these forward-looking statements are reasonable,it is very difficult to predict the impact of known factors and it is impossible for us to anticipate allfactors that could affect our proposed results. All forward-looking statements are based uponinformation available to the Company as of the date of this presentation. Important factors that couldcause actual results to differ materially from management's expectations are disclosed in theCompany’s periodic reports and registration statements filed with the SEC and the AMF. Investors arecautioned not to place undue reliance on such forward-looking statements.
2

Agenda
3
Operational review
Financial review
Group restructuring completed
Conclusion

4
Operational review

Q4 2017 key highlights
5
Revenue at $401m, up 22% y-o-y
GGR: strong multi-client sales in Brazil and North Sea Equipment: very strong volumes increase Contractual Data Acquisition: low Marine revenue as
75% of fleet dedicated to multi-client surveys
EBITDAs at $134m up 34% y-o-y, a 33% margin
Operating Income positive at $18m
Positive impact from multi-client after-sales and Equipment sales
Contractual Data Acquisition segment impacted by bad weather and delays
Free Cash Flow positive at $13m
PowerLog
Sercel FDU-508
Full-year 2017 key highlights
6
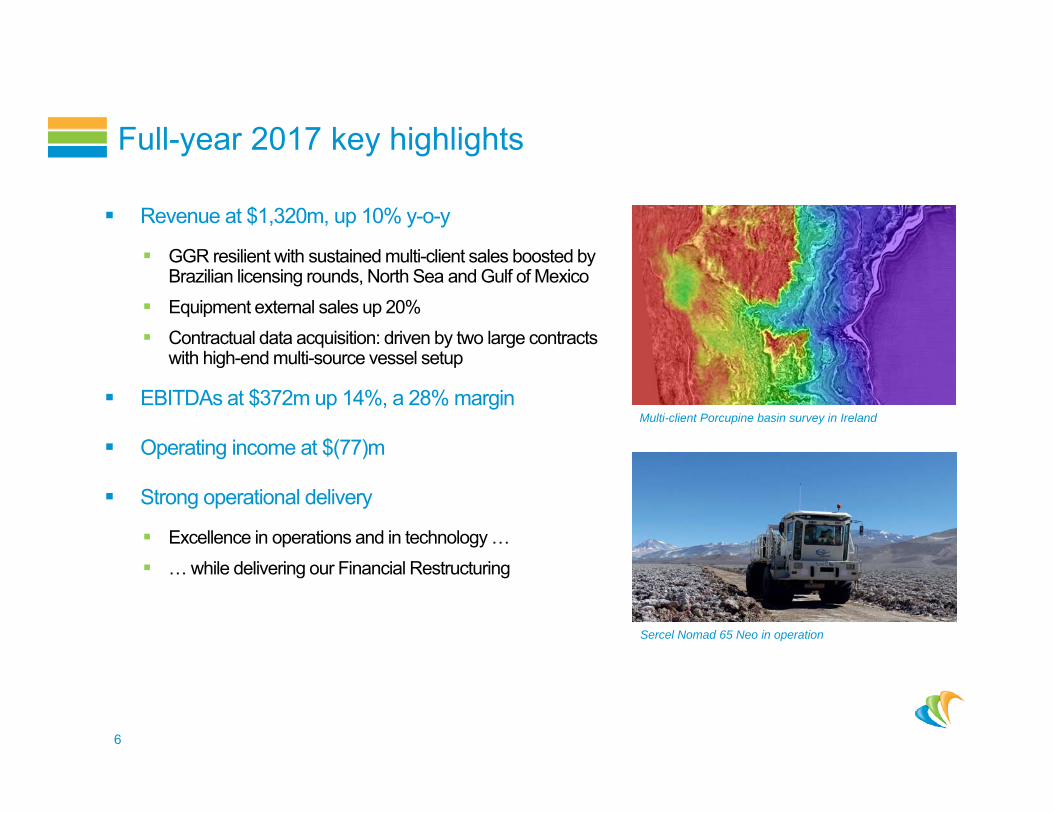
Revenue at $1,320m, up 10% y-o-y
GGR resilient with sustained multi-client sales boosted by Brazilian licensing rounds, North Sea and Gulf of Mexico
Equipment external sales up 20% Contractual data acquisition: driven by two large contracts
with high-end multi-source vessel setup
EBITDAs at $372m up 14%, a 28% margin
Operating income at $(77)m
Strong operational delivery
Excellence in operations and in technology … … while delivering our Financial Restructuring
Multi-client Porcupine basin survey in Ireland
Sercel Nomad 65 Neo in operation

7
Total revenue at $820m, up 5% y-o-y
Multi-Client at $469m, up 22% y-o-y Multi-client sales particularly active in Brazil, the North Sea
and Gulf of Mexico
Prefunding revenue at $269m and after-sales at $200m
High cash prefunding rate at 107%
48% fleet allocation to multi-client programs in 2017 and expected to be c. 45% in Q1 2018 and c. 50% in Q2 2018
Subsurface Imaging (SI) & Reservoir at $351m, down (13)% y-o-y Resilient activity
Market share preserved
EBITDAs at $486m
Operating income at $131m, a 16% margin Margin increase due to favorable revenue mix with multi-
client depreciation rate of 63%, versus 84% in 2016
MC RevenueSI & Reservoir
GGR: solid multi-client sales
84
100.8143
Revenue(In million $)
OPINC(In million $)
94
95.6 99546
383 469
562
401 351
2015 2016 2017
1,108
784
288
81131
2015 2016 2017
26.0% 10.4%
*Multi-client data library impairment restated to NRC in 2015
*
820
15.9%

8
Total sales at $241m, down (5)% y-o-y
External sales up 20% at $216m ($179m in 2016)
Internal sales down 66% at $26m ($76m in 2016)
Sales split: 59% Land and 41% Marine
EBITDAs at $(6)m
Operating income at $(36)m
Q4 sales at $116m, generating an 8% OPINC margin
Full-year hampered by very low volumes:
o OPINC margin negative at (15)% despite reducedcost base
Equipment: volume increase, the key driver
437
Land EquipmentMarine Equipment
Revenue(In million $)
OPINC(In million $)
2015
20165.9% 2017
26
(36)
255
(14.9)%
(42)
301144 143
136
111 98
2015 2016 2017
241
(16.4)%

Total revenue at $289m, up 21% y-o-y
Marine revenue at $186m, up 40% y-o-y Increase driven by two large contracts with high-end multi-
source vessel setup
52% allocation to marine contractual activities (50% in 2016)
93% availability rate and 97% production rate
Land & Multi-Physics total revenue at $102m, down (3)% y-o-y Impacted by delayed contract in Algeria and early
termination in Angola
EBITDAs at $(47)m
Operating Income at $(91)m Continuing competitive market environment, stabilized at a
low level
Impacted by delays and weather conditions in Q4
Positive impact of lower marine cost base in 2017
Partly offset by non-recurrent 2016 R&D tax credit
9
Contractual Data Acquisition: persistently weak market conditions
439
133 186
177
105102
2015 2016 2017
616
Land & MPMarine
OPINC(In million $)
Revenue(In million $)
238
2015 2016 2017
(98)(41.2)%
(156)
(25.3)%
289
(91)(31.7)%
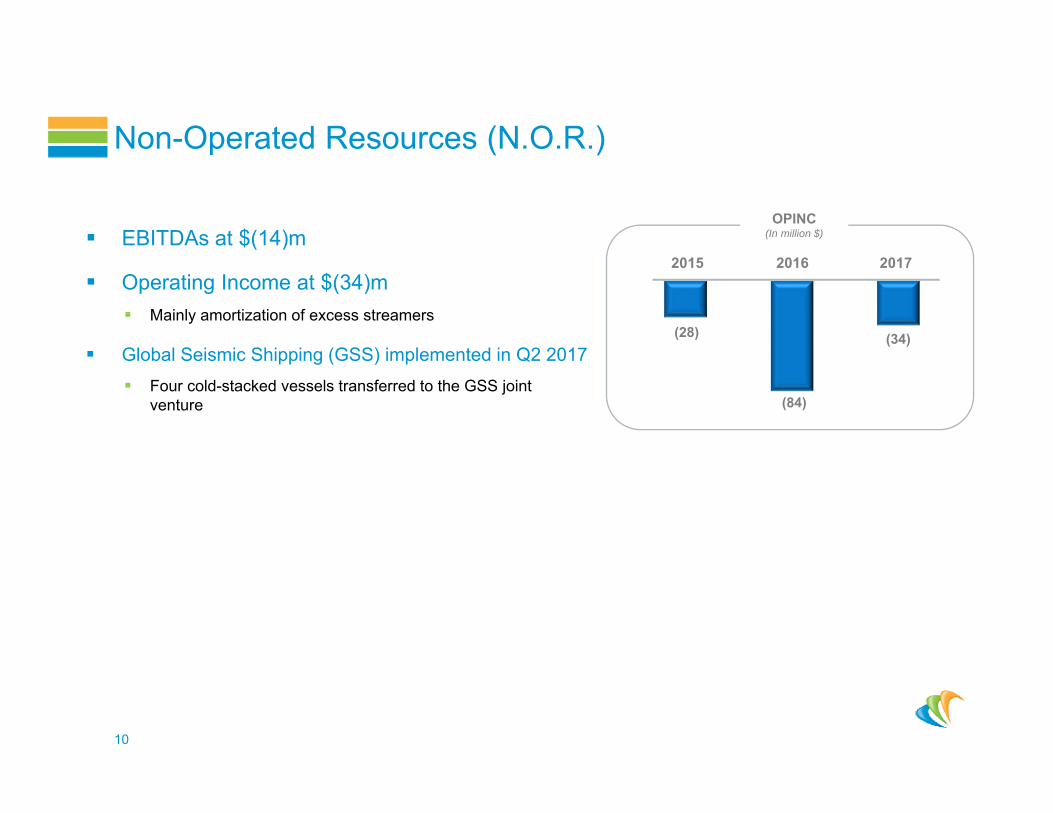
EBITDAs at $(14)m
Operating Income at $(34)m Mainly amortization of excess streamers
Global Seismic Shipping (GSS) implemented in Q2 2017 Four cold-stacked vessels transferred to the GSS joint
venture
10
Non-Operated Resources (N.O.R.)
(84)
2015 2016 2017
(28)
OPINC(In million $)
(34)

Financial review
11

2017 full-year P&L
12
Group Revenue at $1,320m, up 10% y-o-y Group OPINC at $(77)m, versus $(213)m in 2016 Net financial costs at $(207)m, including $(85)m cash cost of debt Non-recurring charges at $(186)m Including non-cash $(63)m related to marine liabilities, mainly GSS
$(21)m related to the Industrial Transformation Plan versus $(56)m in 2016
Net Income at $(514)m
In Million $ FY 2016 FY 2017 Var.Total Revenue 1,196 1,320 10%Group EBITDAs excluding NOR 350 387 10%
NOR (22) (14) 36%
Group EBITDAs 328 372 14%Group OPINC excluding NOR (128) (43) 66%
NOR (84) (34) 60%
Group OPINC (213) (77) 64%Equity from Investments (8) (20) (145)%
Net financial costs (186) (207) 11%
Income Taxes 14 (24) (273)%
Non-recurring charges (184) (186) 1%
Net Income (577) (514) 11%

285 295 251
89 6650
2015 2016 2017
EBITDAs at $372m, up 14% y-o-y
$(40)m change in working capital
compared to strong positive $198m in 2016
Operating Cash Flow at $299m
Capex at $335m, down (15)% y-o-y
Multi-client cash capex at $251m, 107% prefunded
Industrial and R&D capex at $84m
Paid cost of debt at $(85)m
Free Cash Flow at $(96)m, versus $(7)m last year
$(101)m restructuring cash costs: $(75)m related to our Industrial Transformation Plan
$(26)m net related to our Financial Restructuring
Liquidity as of December-end at $315m
CAPEX(In million $)
Industrial and lease pool capex*Multi-client cash capex
Development Cost
415 395
13
335
2017 Financial indicators
* Excluding change in fixed assets payables
EBITDAs(In million $)
661
328 372
2015 2016 2017
28.2%27.4%31.4%
Group restructuring completed
14

Massive industrial transformation
15
CGG revenue mix evolution
Headcount(2)
Total Capex(1)
($m)
CGG’s revenue mix has improved towards less capex-intensive activities and its cost base has decreased by c. 50 to c. 80% over 2013-2017, leading to a more resilient business model
$mNumber of employees
c. (50)%
Source: CompanyNote: (1) Excluding impact of variation in fixed asset suppliers – 2017 estimate
(2) Including Manufacturing temporaries(3) Full cost base including Depreciation and Amortization
Marine monthly cost structure(3)G&A expenses
Base
c. (60)%
c. (60)%
c. (80)%
862
415 395 335
YE 2014 YE 2015 YE 2016 YE 2017
216
14799 84 82
YE 2013YE 2014YE 2015YE 2016YE 2017
100
72
3625 22
YE 2013 YE 2014 YE 2015 YE 2016YE 2017
11,060
8,6327,353
5,812 5,325
YE 2013 YE 2014 YE 2015 YE 2016 YE 2017
34%62%
22%16%44% 22%
2013 2017GGR Equipment Data Acquisition
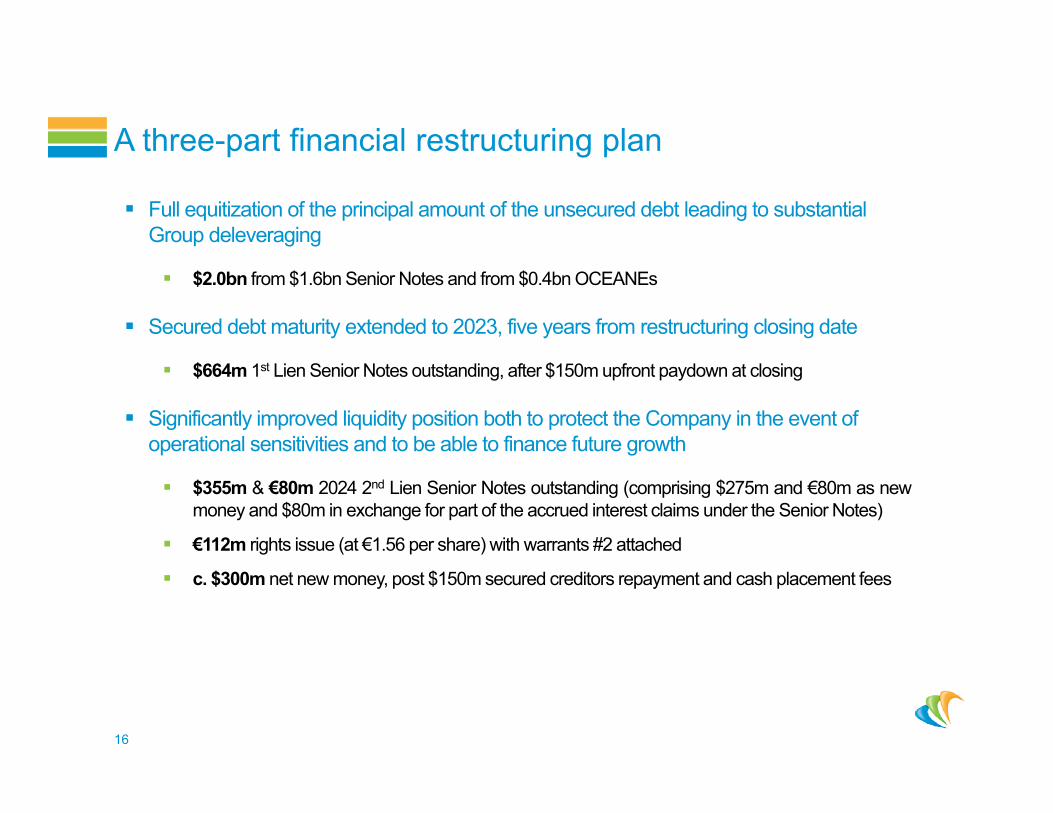
Full equitization of the principal amount of the unsecured debt leading to substantial Group deleveraging
$2.0bn from $1.6bn Senior Notes and from $0.4bn OCEANEs
Secured debt maturity extended to 2023, five years from restructuring closing date
$664m 1st Lien Senior Notes outstanding, after $150m upfront paydown at closing
Significantly improved liquidity position both to protect the Company in the event of operational sensitivities and to be able to finance future growth
$355m & €80m 2024 2nd Lien Senior Notes outstanding (comprising $275m and €80m as newmoney and $80m in exchange for part of the accrued interest claims under the Senior Notes)
€112m rights issue (at €1.56 per share) with warrants #2 attached
c. $300m net new money, post $150m secured creditors repayment and cash placement fees
A three-part financial restructuring plan
16

CGG pro forma post financial restructuring
17
Pre restructuring by YE 2017
• Gross Financial Debt of c. $3.0bn
• Liquidity at $315m
• Net Debt of c. $2.65bn
• First maturity in July 2018
• Financial leverage at 7.2x
Post restructuring/ Pro Forma basis
• Gross Financial Debt of c. $1.2bn
• Liquidity at $575m
• Pro Forma Net Debt of c. $0.63bn
• First maturity in Feb. 2023
• Financial leverage at 1.7x

c. $3.0bn senior debt by year-end 2017 (including accrued interests)
$1.15bn senior debt pro forma post-Restructuring
Maturities extended to February 2023 and February 2024
Average cost of debt at 7.0% cash + 5.0% PIK
Sustainable cash cost of debt of ~$85m per year
1st lien refinancing: free up to May 21st; 3% roll-over fee up to August 21st; NC3 after
2nd lien: callable at 120% in year 1 and 2
Senior debt profile as of December 31, 2017
Restored capital structure post-restructuring
18
Senior debt profile post-restructuring
* 3% roll-over fee included
*

Enough liquidity to manage potential recovery delay
19
Savings related to the Nordic & Fin. Restructuring:
Nordic Restructuring: ~$275m
Net reduction of finance costs: ~$225m
New liquidity:
Immediate cash injection: ~$300m
Authorized floor of new secured debt: ~$200m
$1bn Improvem
ent

Significant leverage reduction
20
Net debt reduction of ~$2.2bn post restructuring
Leverage ratio below 2x

Conclusion
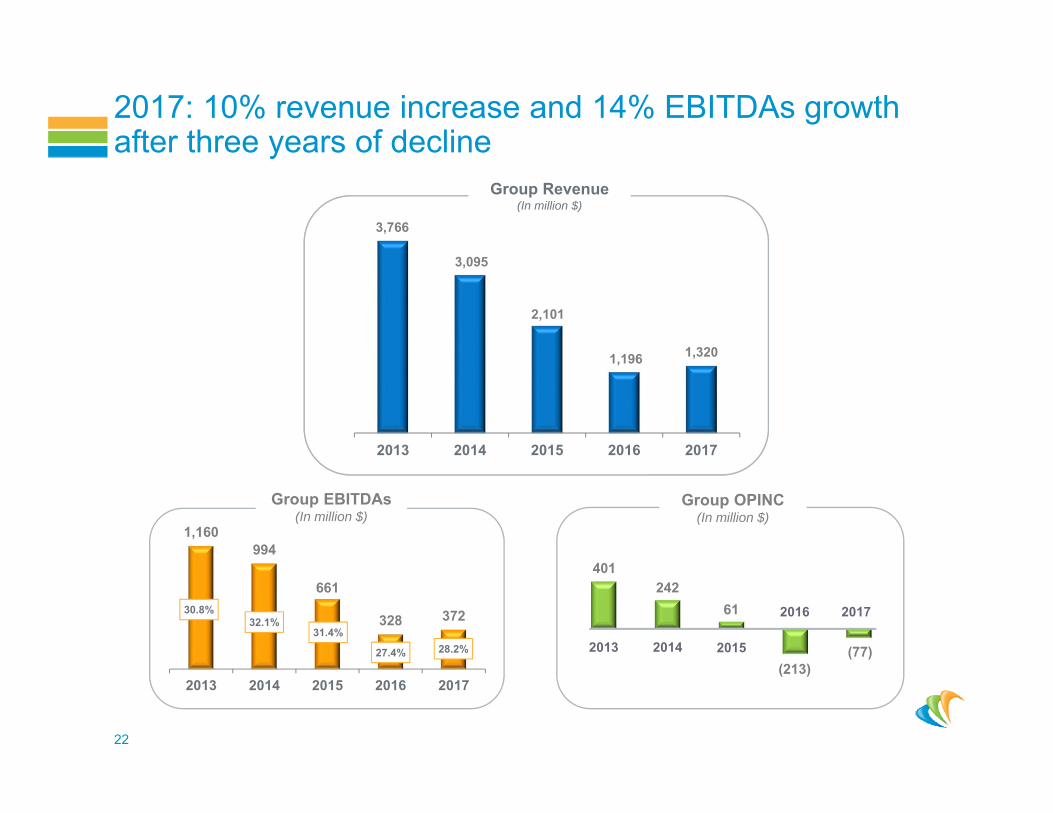
2017: 10% revenue increase and 14% EBITDAs growth after three years of decline
Group EBITDAs(In million $)
2013 2014 2015 2016 2017
2,101
1,196 1,320
Group Revenue(In million $)
1,160994
661
328 372
2013 2014 2015 2016 2017
28.2%27.4%
31.4%
(213)2015
2016 201761
Group OPINC(In million $)
(77)
3,095
3,766
32.1%30.8%
2013 2014
242401
22

2018 outlook
23
Revenue1 expected up at c. $1.5bn +/- 5% in a stabilized and still uncertain market
EBITDAs1 margin within 35% - 40% range
Multi-client cash capex at $275/325m with cash prefunding rate above 70%
Industrial and R&D capex at $100/135m
Cash cost of debt at c. $85m
Industrial Transformation Plan cash cost at c. $25m
Liquidity: starting the year pro forma at $575m
Restored balance sheet and improved liquidity
Ready for the market rebound
1 Subject to final IFRS 15 application

Thank you

Appendix

Share count post financial restructuring on February 21, 2018
26
Shares (actual and potential)
Number of Warrants
Parity MaturitySubscription price (€)
Subscription price ($) *
Initial share count 22 133 149Rights Issue with PSR 71 932 731
Debtor shares 1 (OCEANES) 35 311 528Debtor shares 2 (Senior Notes) 449 197 594Subtotal on February 21, 2018 578 575 002
Penny Warrants** 131 332 974 131 332 974 1 : 1 6 months 0.01 0.01Subtotal post‐Penny Warrants 709 907 976
Warrants #1 29 477 536*** 22 133 149 3 : 4 4 years 3.12 3.50Subtotal post‐Warrants #1 739 385 512
Warrants #2 47 955 154 71 932 731 3 : 2 5 years 4.02 4.50Maximum share count post‐Warrants #2 787 340 666
* €/$ FX rate set on June 14th, 2017 midday CET at 1.1206 (date of the agreement with key financial creditors)** Penny warrants comprises: 113,585,276 Warrants #3; 7,099,079 Coordination Warrants and 10,648,619 Backstop Warrants.*** The 24,996 Warrants #1 allocated to the Company in connection with the treasury shares were cancelled
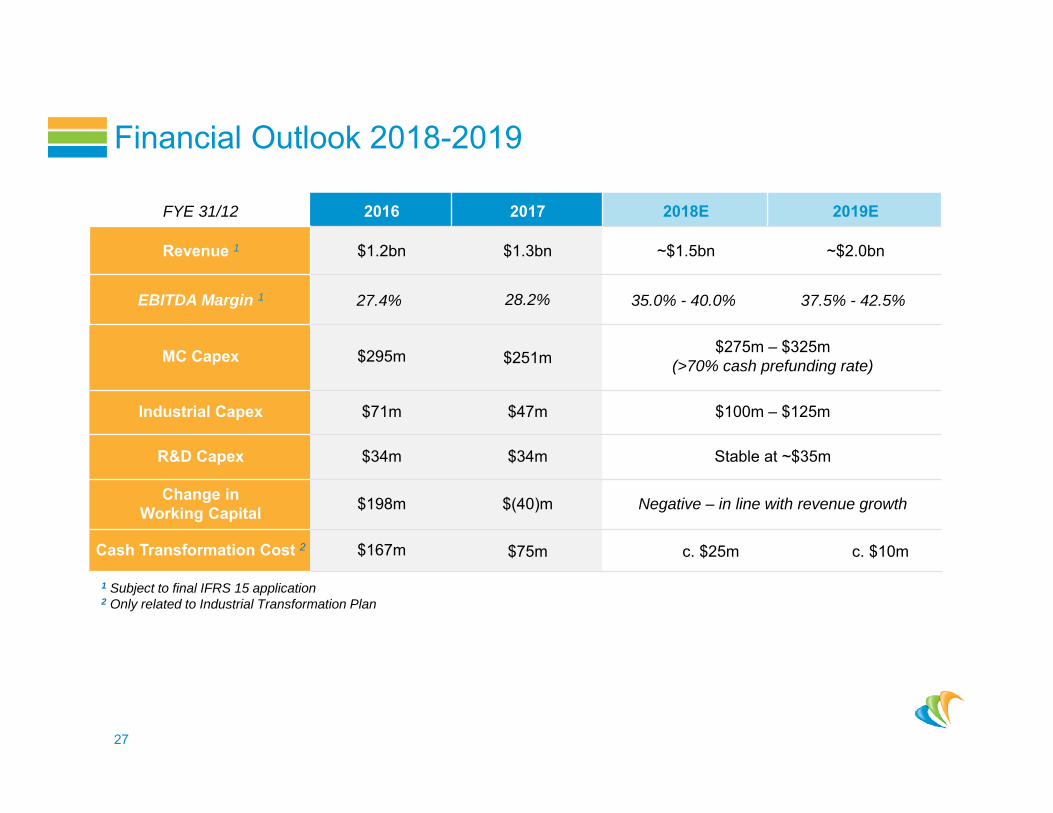
Financial Outlook 2018-2019
27
FYE 31/12 2016 2017 2018E 2019E
Revenue 1 $1.2bn $1.3bn ~$1.5bn ~$2.0bn
EBITDA Margin 1 27.4% 28.2% 35.0% - 40.0% 37.5% - 42.5%
MC Capex $295m $251m$275m – $325m
(>70% cash prefunding rate)
Industrial Capex $71m $47m $100m – $125m
R&D Capex $34m $34m Stable at ~$35m
Change inWorking Capital $198m $(40)m Negative – in line with revenue growth
Cash Transformation Cost 2 $167m $75m c. $25m c. $10m
1 Subject to final IFRS 15 application2 Only related to Industrial Transformation Plan