Embed Size (px)
Citation preview
Improved Network Operations Through Computer Modeling and Support System
1
Lindell Ormsbee, P.E., Ph.D., Sebastian Bryson, P.E. Ph.D.
Scott Yost, P.E., Ph.D
University of Kentucky
Abdoul A. Oubeidillah, Ph.D., Andrew N.S. Ernest, Ph.D., P.E.,
Joseph L. Gutenson
University of Alabama
Jim Uber, P.E., Ph.D, Dominic Boccelli, Ph.D
University of Cincinnati
Srini Lingireddy, Ph.D, KYPIPE, LLC.
www.uky.edu/WaterSecurity
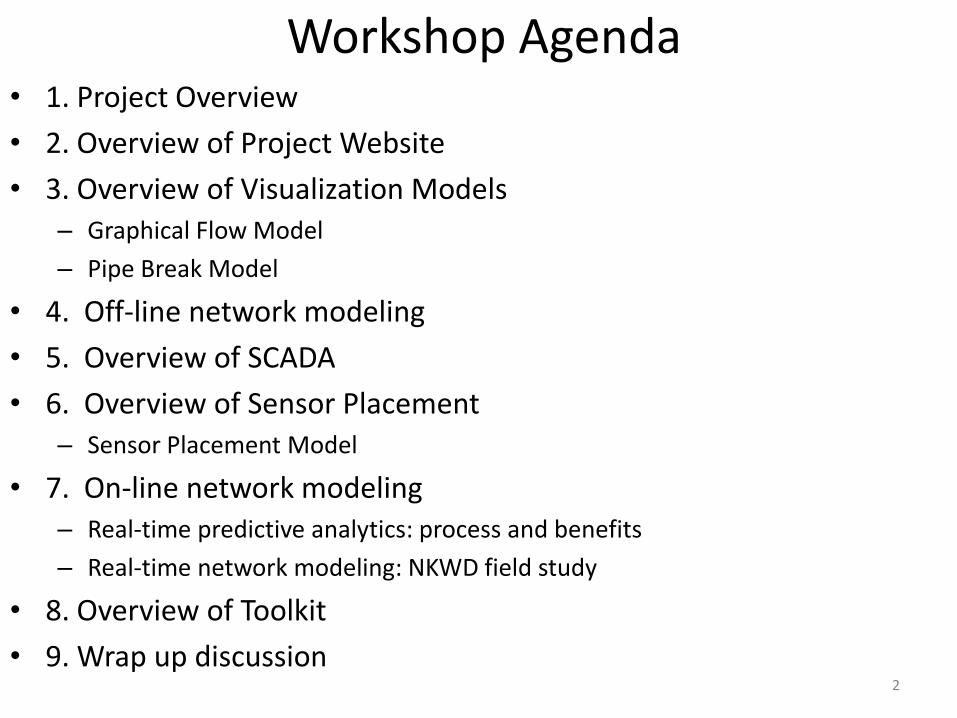
Workshop Agenda • 1. Project Overview
• 2. Overview of Project Website
• 3. Overview of Visualization Models – Graphical Flow Model
– Pipe Break Model
• 4. Off-line network modeling
• 5. Overview of SCADA
• 6. Overview of Sensor Placement – Sensor Placement Model
• 7. On-line network modeling – Real-time predictive analytics: process and benefits
– Real-time network modeling: NKWD field study
• 8. Overview of Toolkit
• 9. Wrap up discussion 2

Workshop Agenda
• 1. Project Overview/Objectives • 2. Overview of Project Website
• 3. Overview of Visualization Models – Graphical Flow Model
– Pipe Break Model
• 4. Off-line network modeling
• 5. Overview of SCADA
• 6. Overview of Sensor Placement – Sensor Placement Model
• 7. On-line network modeling – Real-time predictive analytics: process and benefits
– Real-time network modeling: NKWD field study
• 8. Overview of Toolkit
• 9. Wrap up discussion 3
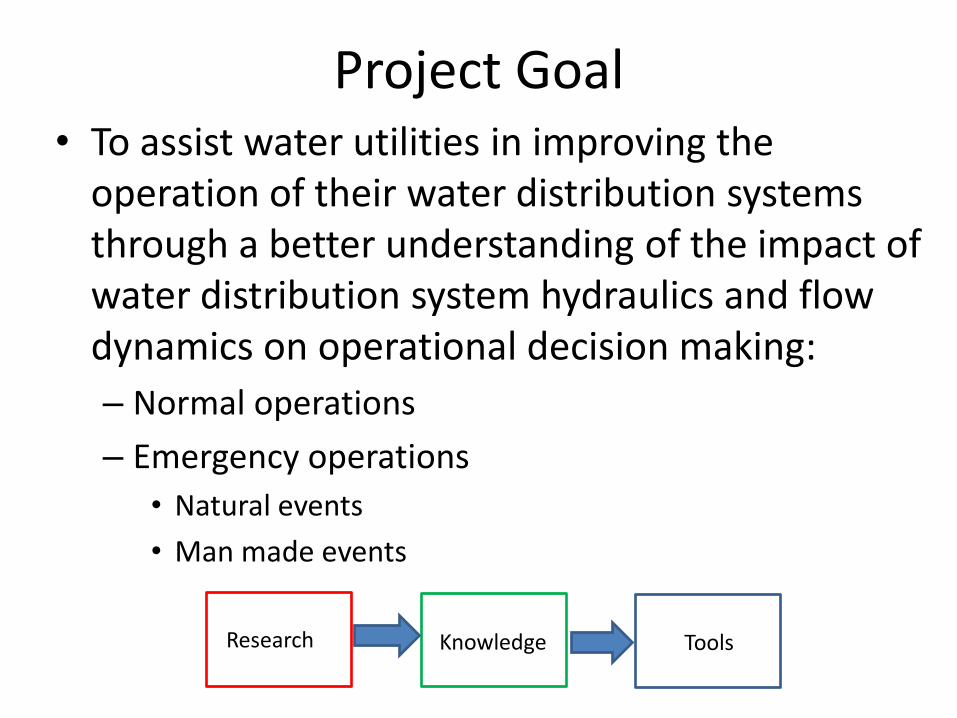
Project Goal • To assist water utilities in improving the
operation of their water distribution systems through a better understanding of the impact of water distribution system hydraulics and flow dynamics on operational decision making:
– Normal operations
– Emergency operations
• Natural events
• Man made events
Knowledge Tools Research
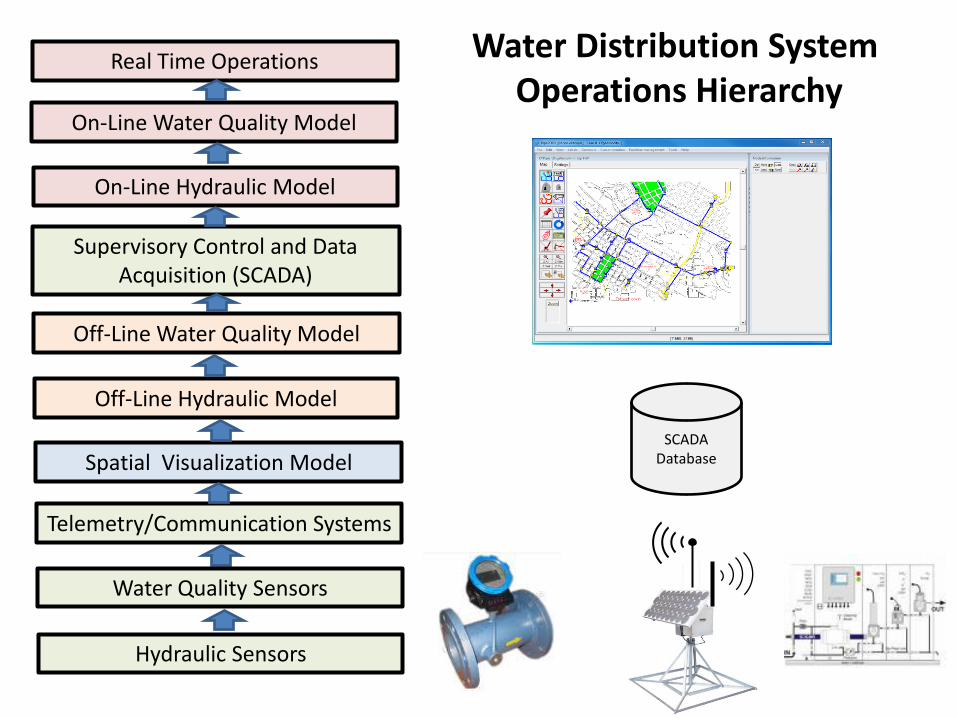
Hydraulic Sensors
Telemetry/Communication Systems
Spatial Visualization Model
Off-Line Hydraulic Model
Off-Line Water Quality Model
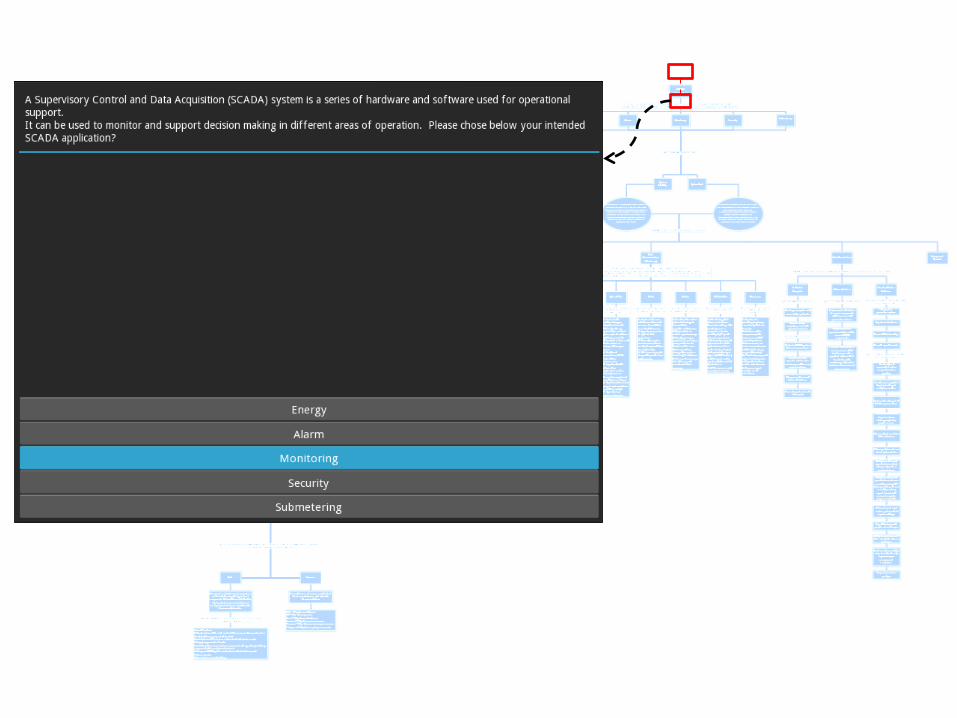
Supervisory Control and Data Acquisition (SCADA)
On-Line Hydraulic Model
On-Line Water Quality Model
Real Time Operations
Water Quality Sensors
Water Distribution System Operations Hierarchy
SCADA Database
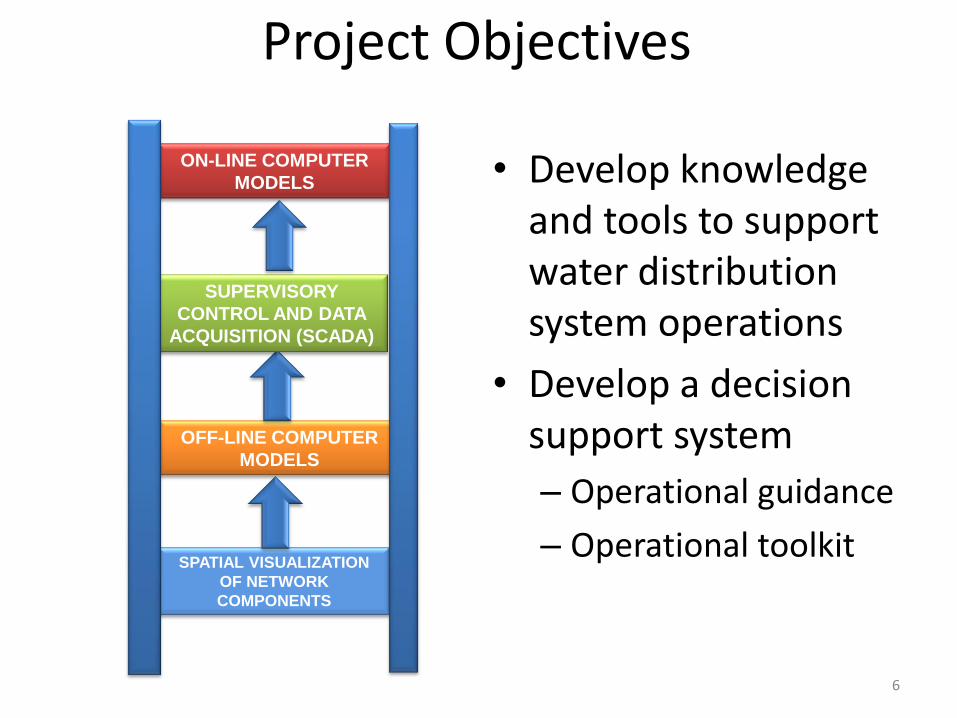
Project Objectives
6
SPATIAL VISUALIZATION
OF NETWORK
COMPONENTS
OFF-LINE COMPUTER
MODELS
ON-LINE COMPUTER
MODELS
SUPERVISORY
CONTROL AND DATA
ACQUISITION (SCADA)
• Develop knowledge and tools to support water distribution system operations
• Develop a decision support system
– Operational guidance
– Operational toolkit
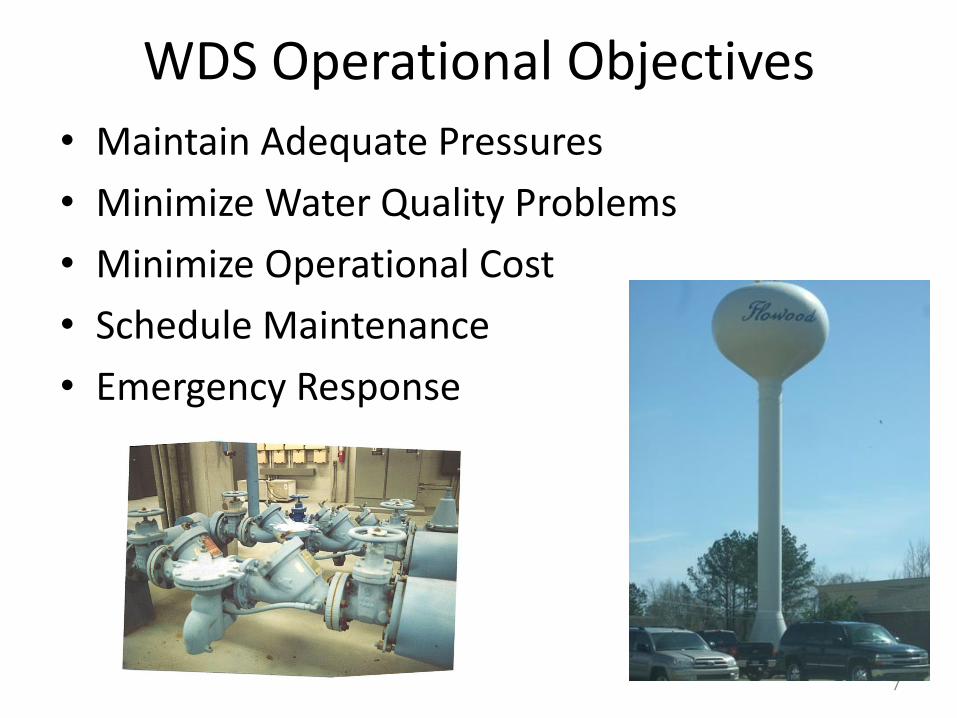
WDS Operational Objectives
• Maintain Adequate Pressures
• Minimize Water Quality Problems
• Minimize Operational Cost
• Schedule Maintenance
• Emergency Response
7
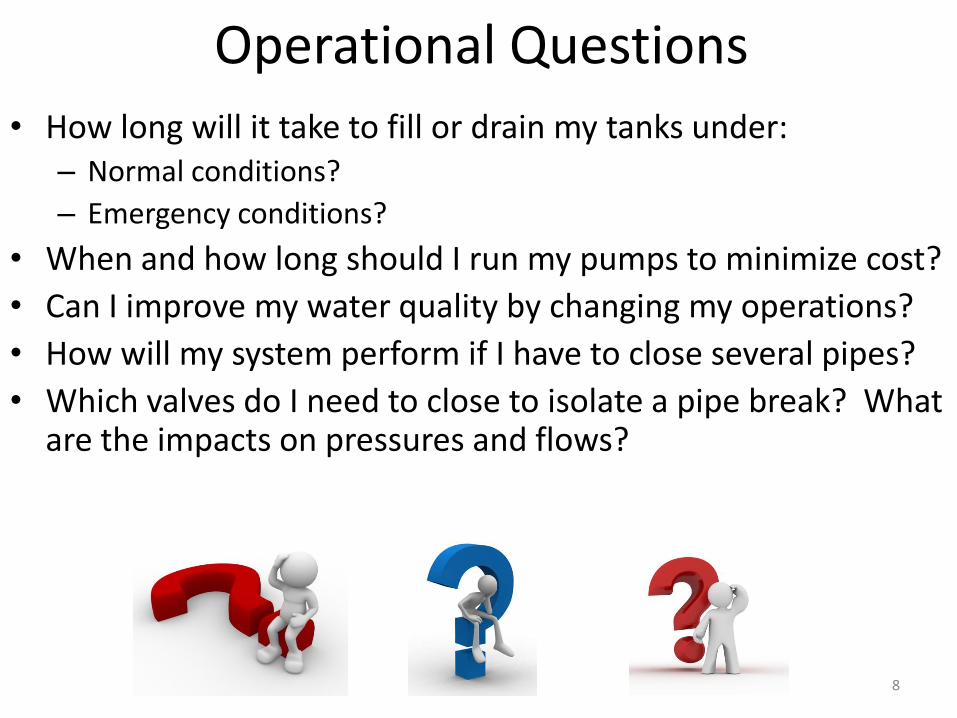
Operational Questions
• How long will it take to fill or drain my tanks under: – Normal conditions?
– Emergency conditions?
• When and how long should I run my pumps to minimize cost?
• Can I improve my water quality by changing my operations?
• How will my system perform if I have to close several pipes?
• Which valves do I need to close to isolate a pipe break? What are the impacts on pressures and flows?
8
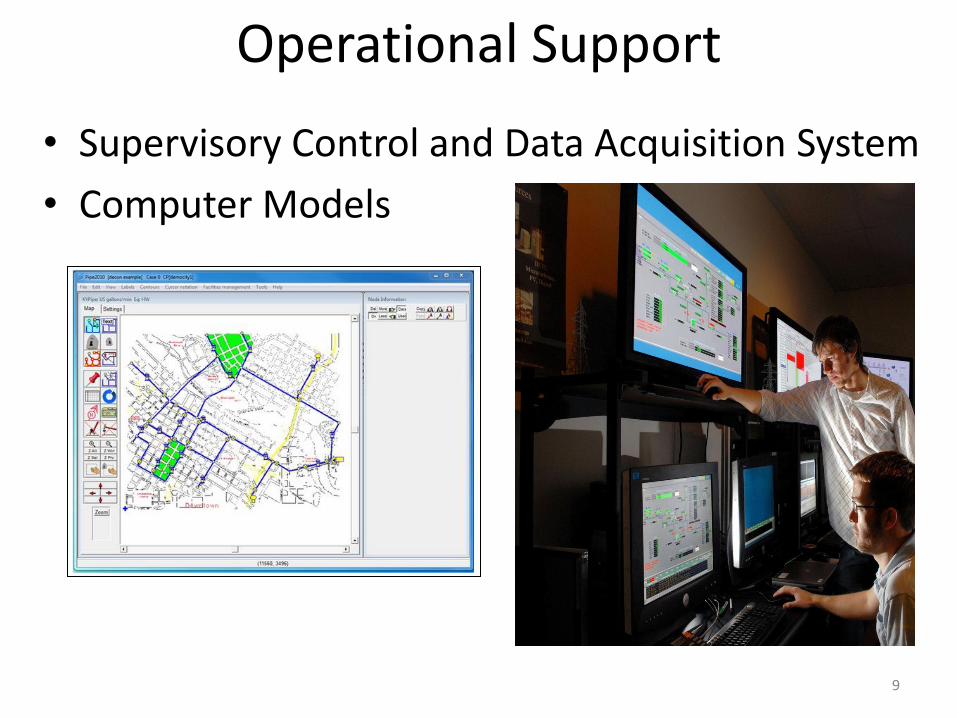
Operational Support
• Supervisory Control and Data Acquisition System
• Computer Models
9

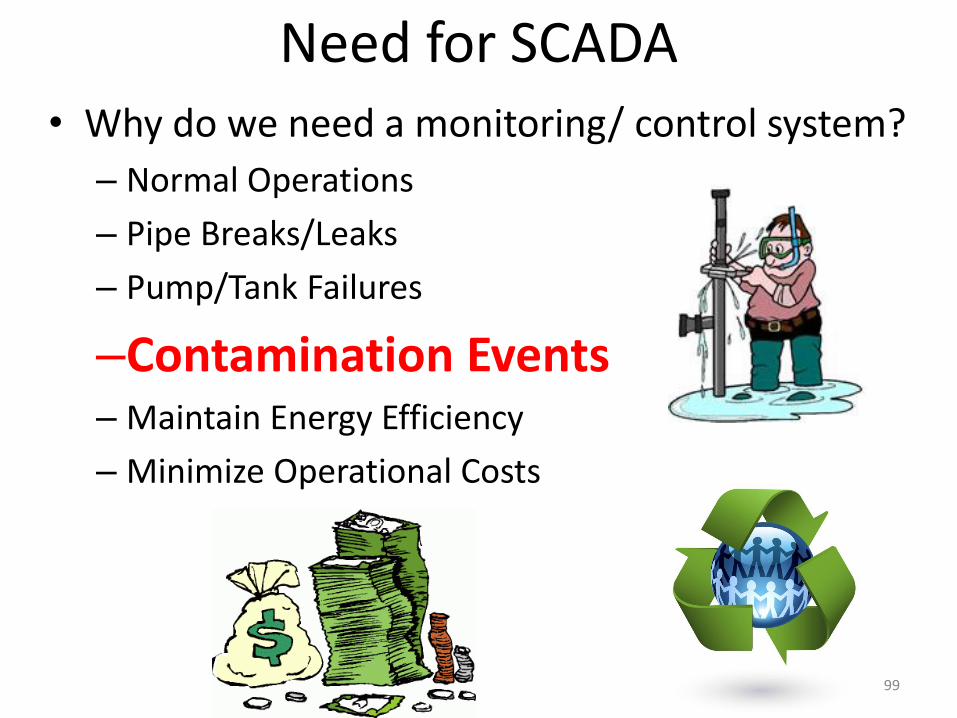
• Why do we need a monitoring/ control system?
– Normal Operations
– Pipe Breaks/Leaks
– Pump/Tank Failures
– Contamination Events
– Maintain Energy Efficiency
– Minimize Operational Costs
10
Need for SCADA
Need for Models
• Graphical representation of system
– Network schematic
– Background map
• Infrastructure database
• Customer database
• Computer analyses
11

Notes:
12
Workshop Agenda • 1. Project Overview
• 2. Overview of Project Website • 3. Overview of Visualization Models
– Graphical Flow Model
– Pipe Break Model
• 4. Off-line network modeling
• 5. Overview of SCADA
• 6. Overview of Sensor Placement – Sensor Placement Model
• 7. On-line network modeling – Real-time predictive analytics: process and benefits
– Real-time network modeling: NKWD field study
• 8. Overview of Toolkit
• 9. Wrap up discussion 13

Water Distribution System Operations Website
14
• PURPOSE: To assist water utilities with designing a monitoring/control system.
• Operational Applications
– Normal Operations
– Emergency Response Management
– Water Quality Management
– Energy Management
– Event Detection
www.uky.edu/WaterSecurity
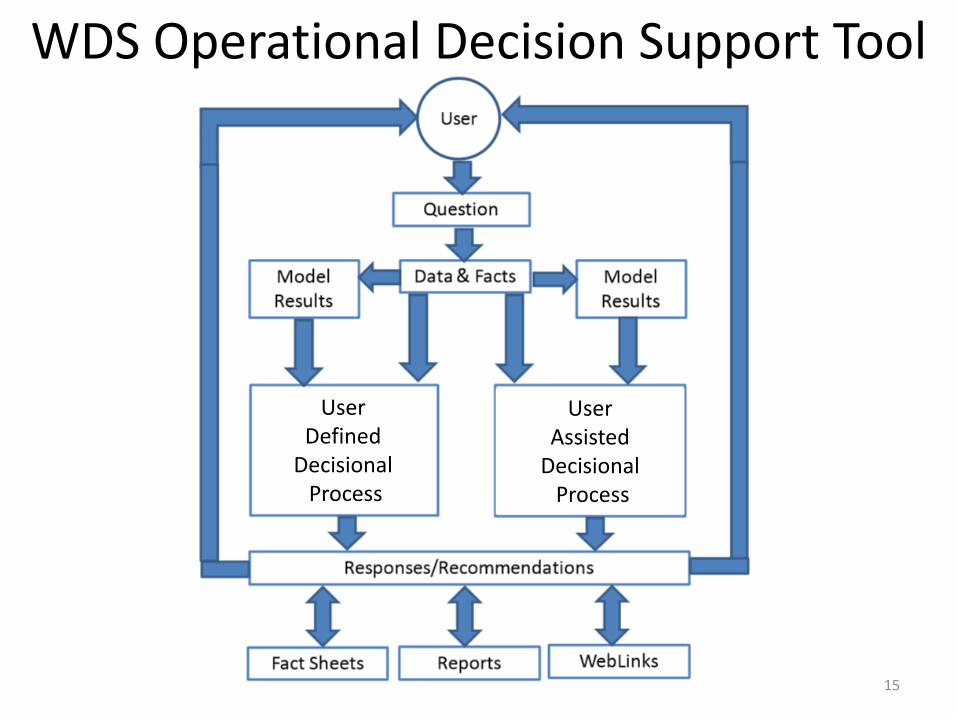
WDS Operational Decision Support Tool
15
User Defined
Decisional Process
User Assisted
Decisional Process

16
User Defined
Decisional Process
User Assisted
Decisional Process
User Defined Decisional Process (Guidance)

17

18
User Defined
Decisional Process
User Assisted
Decisional Process
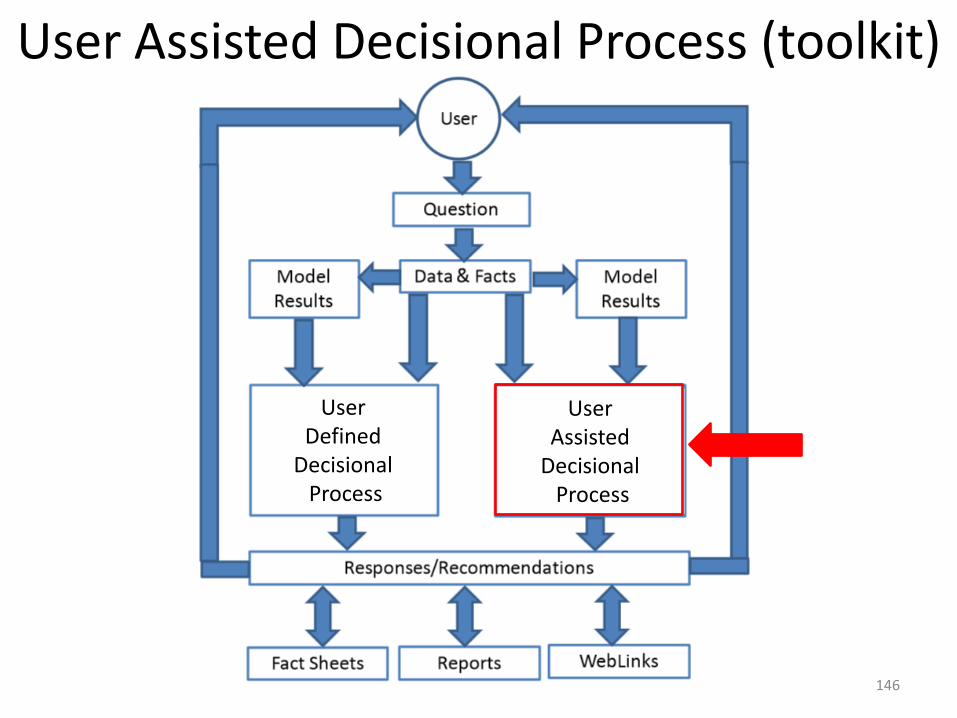
User Assisted Decisional Process (toolkit)

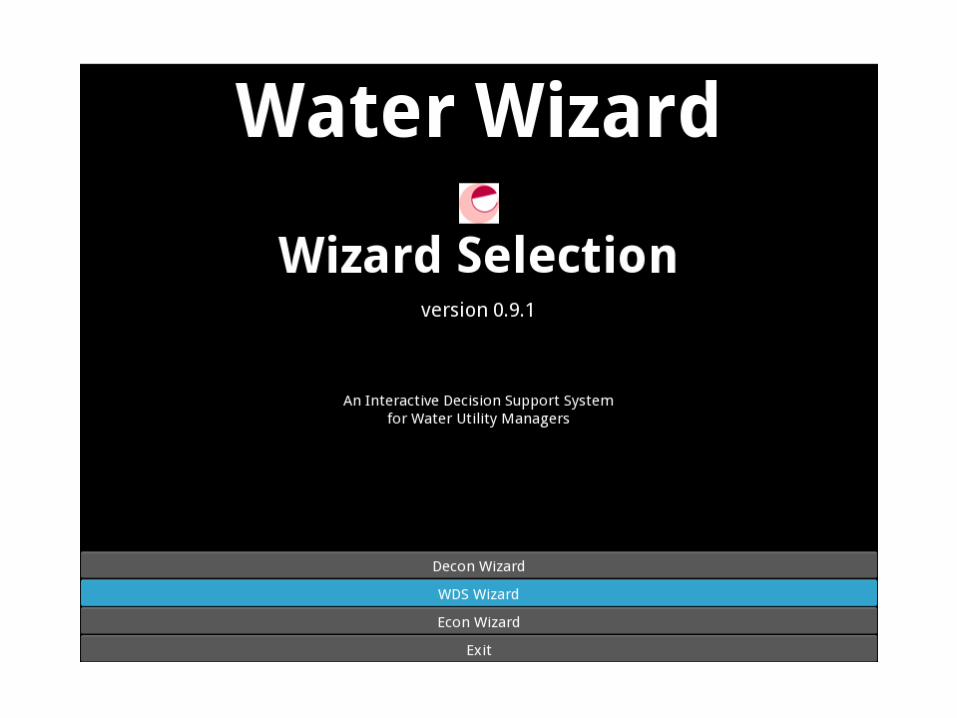
WDS Toolkit

Notes
20
Workshop Agenda • 1. Project Overview
• 2. Overview of Project Website
• 3. Overview of Visualization Models – Graphical Flow Model
– Pipe Break Model
• 4. Off line network modeling
• 5. Overview of SCADA
• 6. Overview of Sensor Placement – Sensor Placement Model
• 7. On-line network modeling
– Real-time predictive analytics: process and benefits – Real-time network modeling: NKWD field study
• 8. Overview of Toolkit
• 9. Wrap up discussion 21
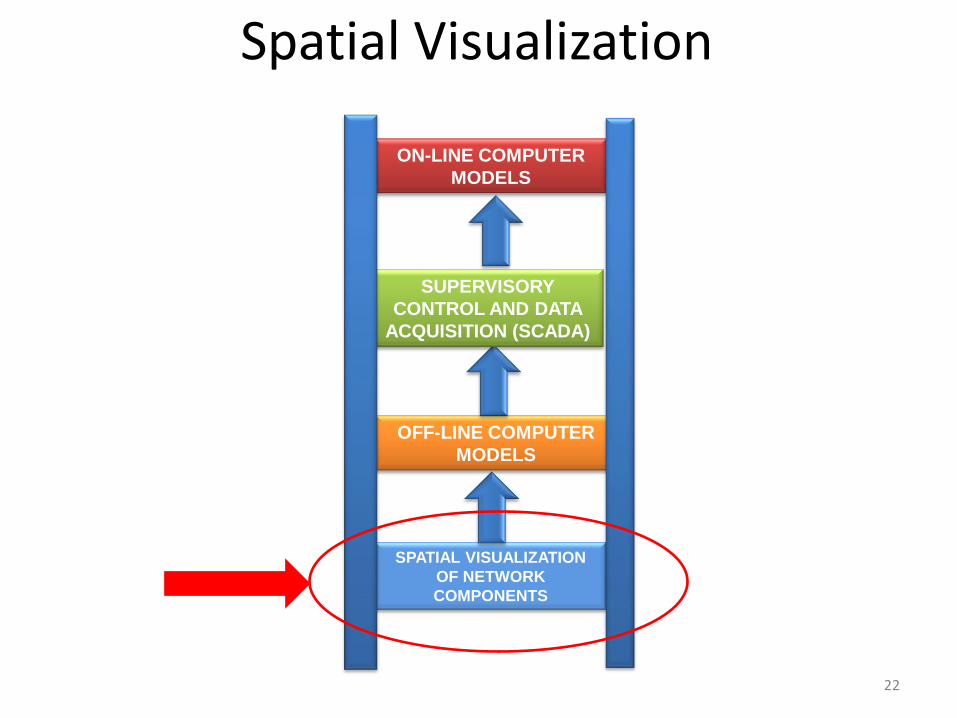
Spatial Visualization
22
SPATIAL VISUALIZATION
OF NETWORK
COMPONENTS
OFF-LINE COMPUTER
MODELS
ON-LINE COMPUTER
MODELS
SUPERVISORY
CONTROL AND DATA
ACQUISITION (SCADA)
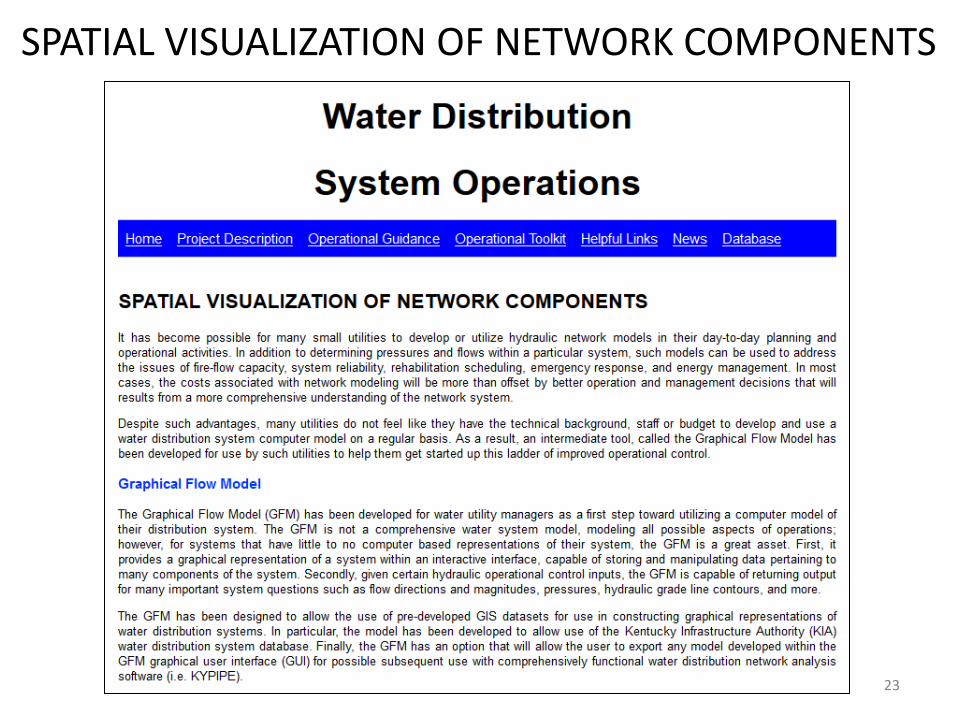
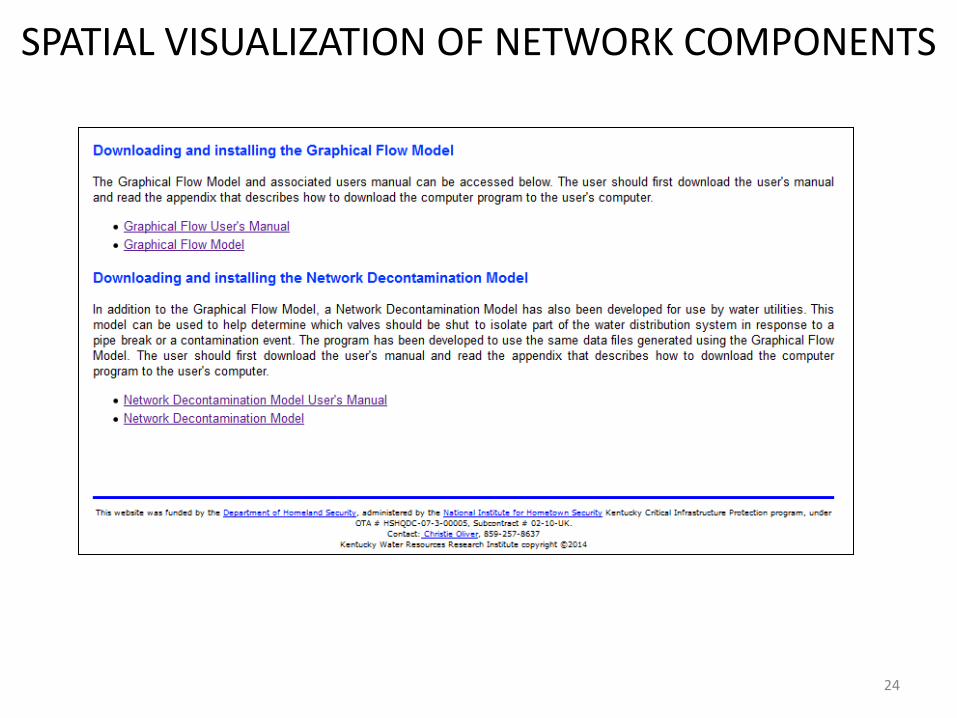
SPATIAL VISUALIZATION OF NETWORK COMPONENTS
23
SPATIAL VISUALIZATION OF NETWORK COMPONENTS
24
Graphical Flow Model User Interface
25
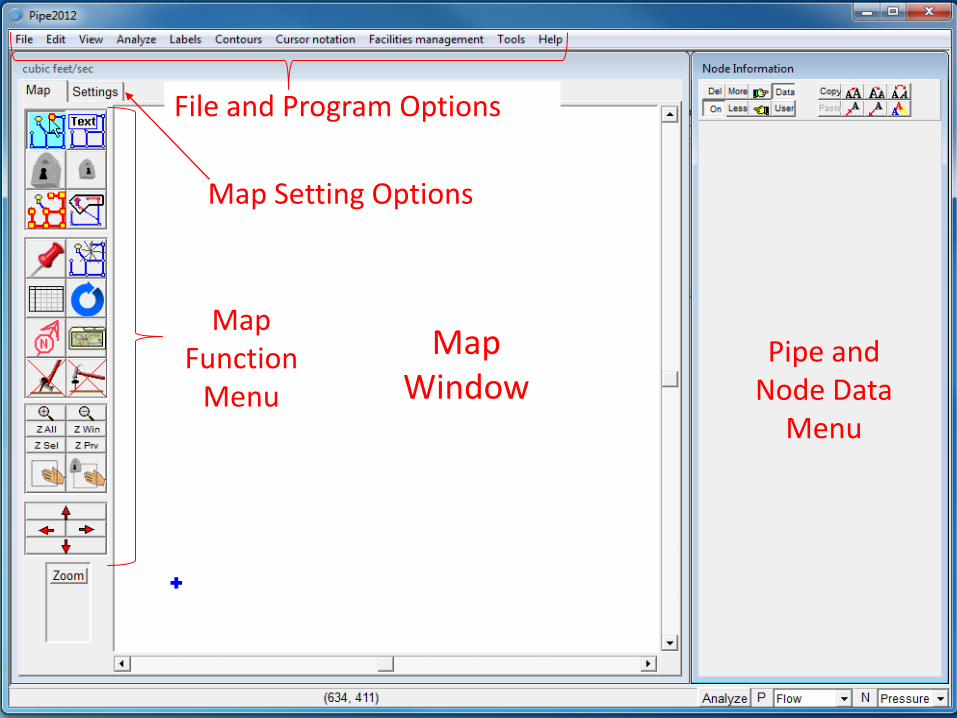
Pipe and Node Data
Menu
Map Window
Map Function
Menu
Map Setting Options
File and Program Options

Program Command Bar

Map Text Mode Map Layout Mode
Fixed Mode 1 – Cannot move or add nodes Fixed Mode 2 – Cannot move/Can add nodes
Select Multiple Nodes and Pipes Select Nodes/Pipes using a polygon
Attach a note to the map Clear selections
View data tables Refresh map
Views
Redo last map change
Zoom and pan functions
Shift map window functions
Add north arrow to map
Undo last map change
Zoom and pan functions
Shift map window functions
Map Function Menu
28

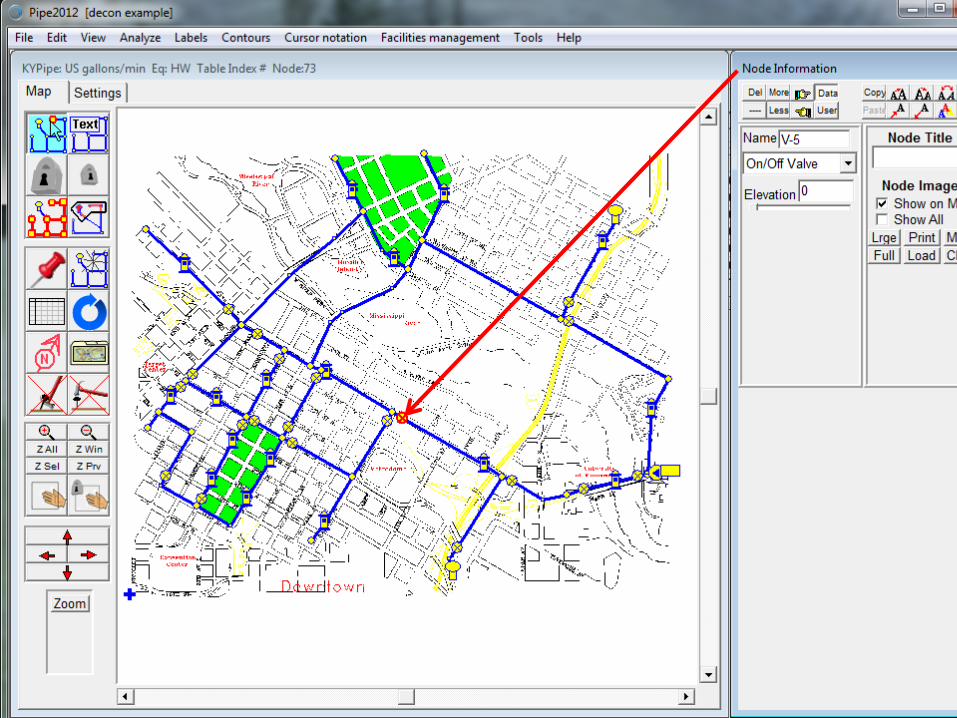
Network Data Management
29

30
31
32
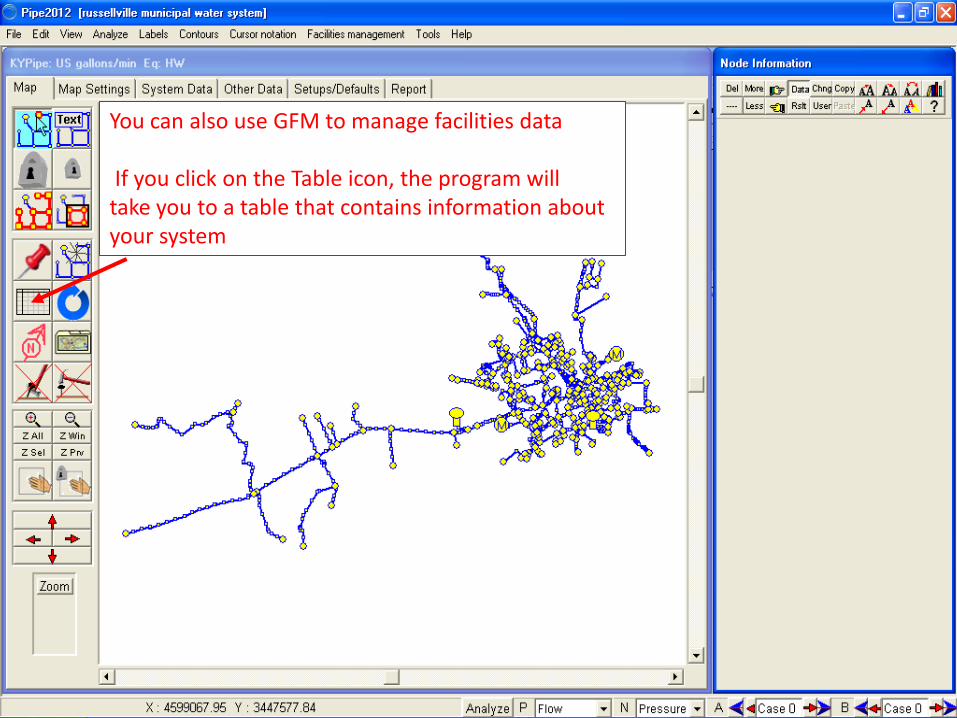
You can also use GFM to manage facilities data If you click on the Table icon, the program will take you to a table that contains information about your system

33
These are the parameter values that have been read in From the KIA database. However, you can change them if you want.
34
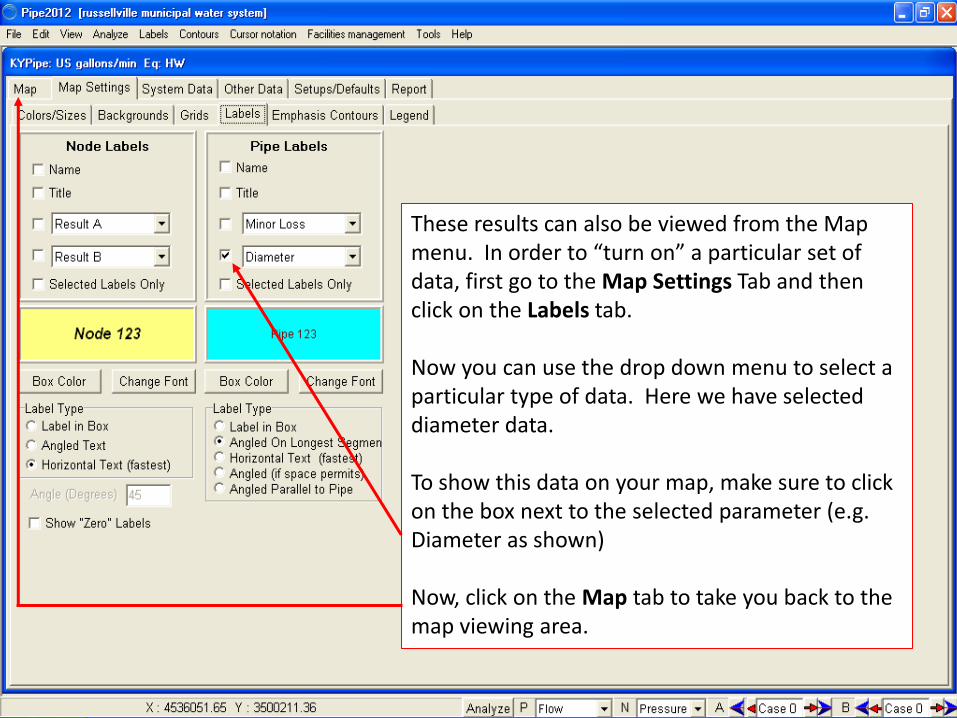
These results can also be viewed from the Map menu. In order to “turn on” a particular set of data, first go to the Map Settings Tab and then click on the Labels tab. Now you can use the drop down menu to select a particular type of data. Here we have selected diameter data. To show this data on your map, make sure to click on the box next to the selected parameter (e.g. Diameter as shown) Now, click on the Map tab to take you back to the map viewing area.

35
Here is the map view with all the pipe diameters (in inches) shown.

Hydraulic Model
36

37
Model Results
Display Flowrates
Display Pressures
Display Pressures Contours
Print Out Report
1
2
4
3

Generating a Flow Analysis
39

40
Analyze Error Check Analysis Inventory/Costs Quick Results

41
Flow analysis options are provided in a menu after the run completes
42
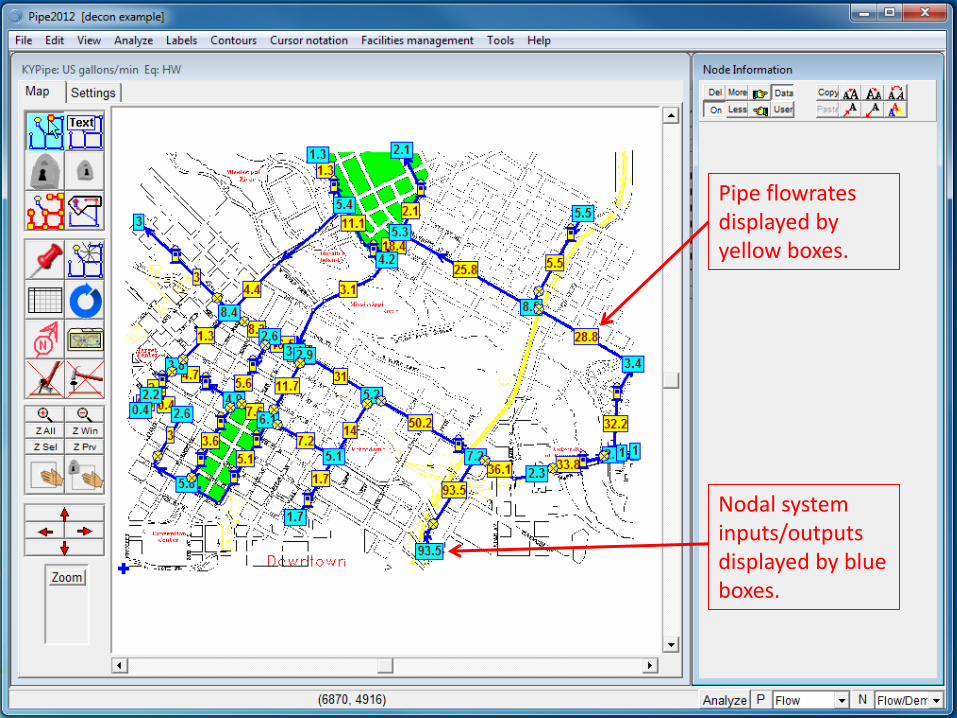
Pipe flowrates displayed by yellow boxes.
Nodal system inputs/outputs displayed by blue boxes.
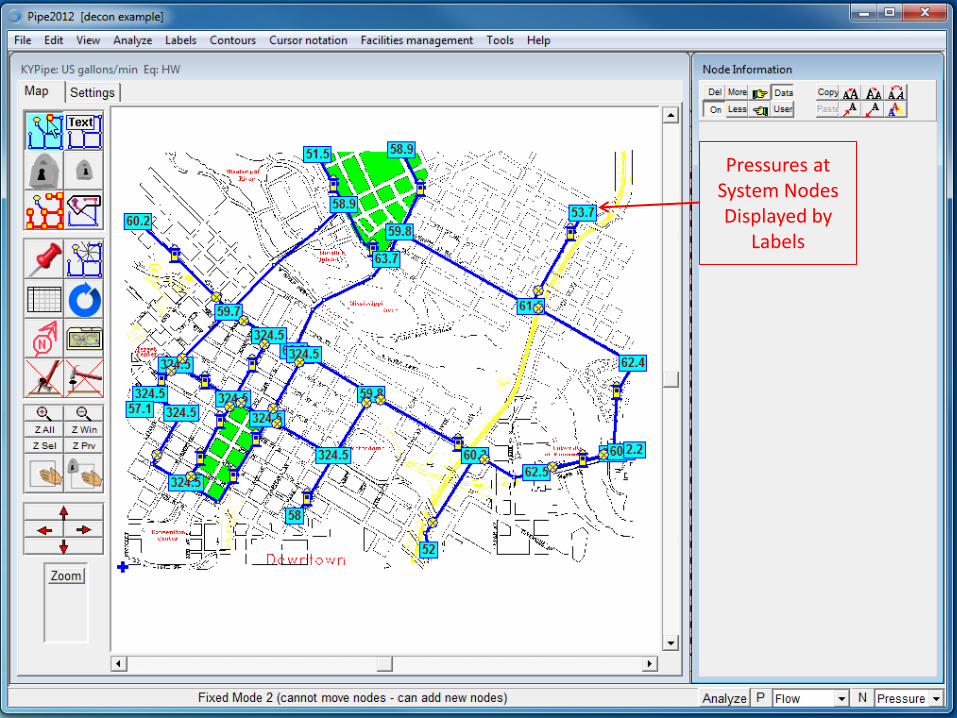
Pressures at System Nodes Displayed by
Labels

Pressure Contours (Hatch)
44
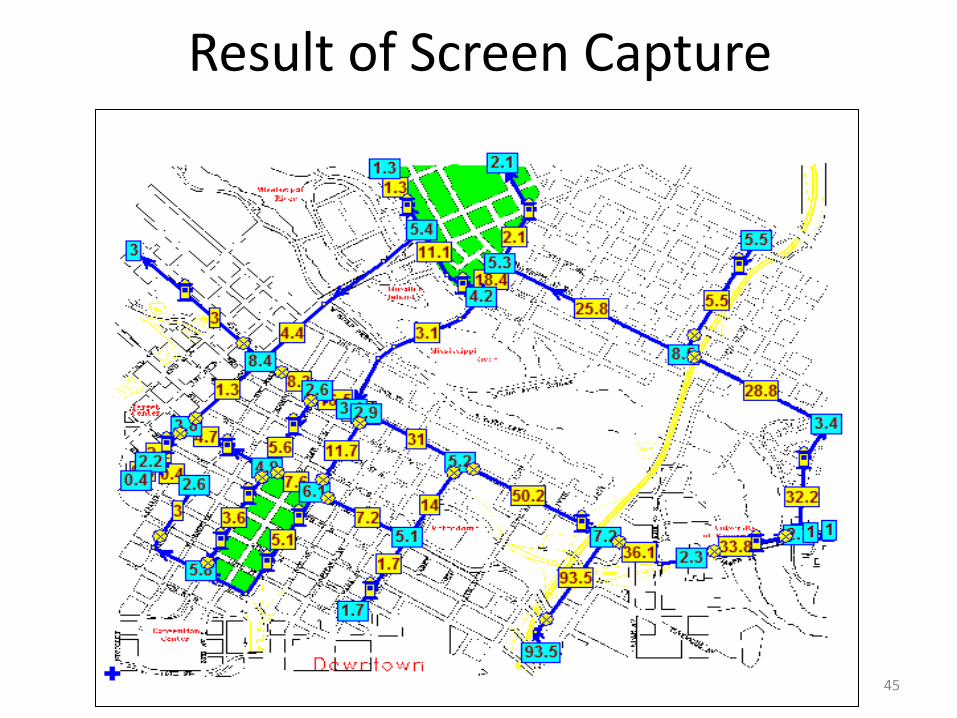
Result of Screen Capture
45

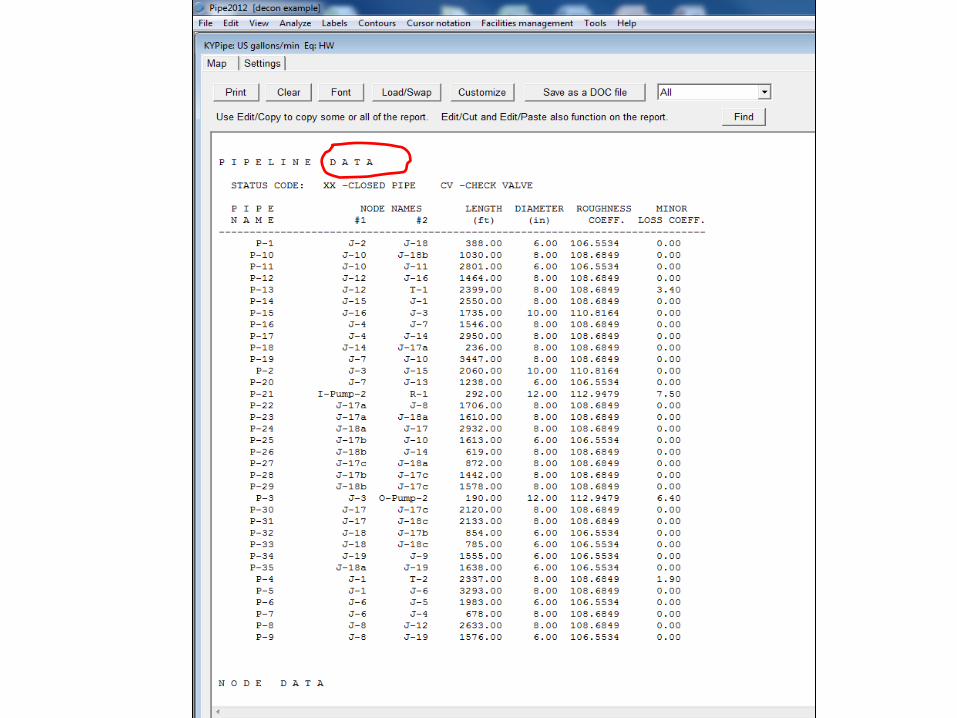
Elements of a Flow Analysis Report
1. File name of the network
2. Regulatory valve data and properties
3. Pipeline data and properties
4. Node data and properties
5. Regulatory valve flow analysis results (upstream and downstream pressure and through flowrate)
6. Pipeline Flow analysis (flowrates)
7. Node flow analysis results (external demand, hydraulic grade, pressure head and node pressure in psi)
8. Summary of system inflows and outflows
46


Pipe Break/Contamination Extent Visualization
49
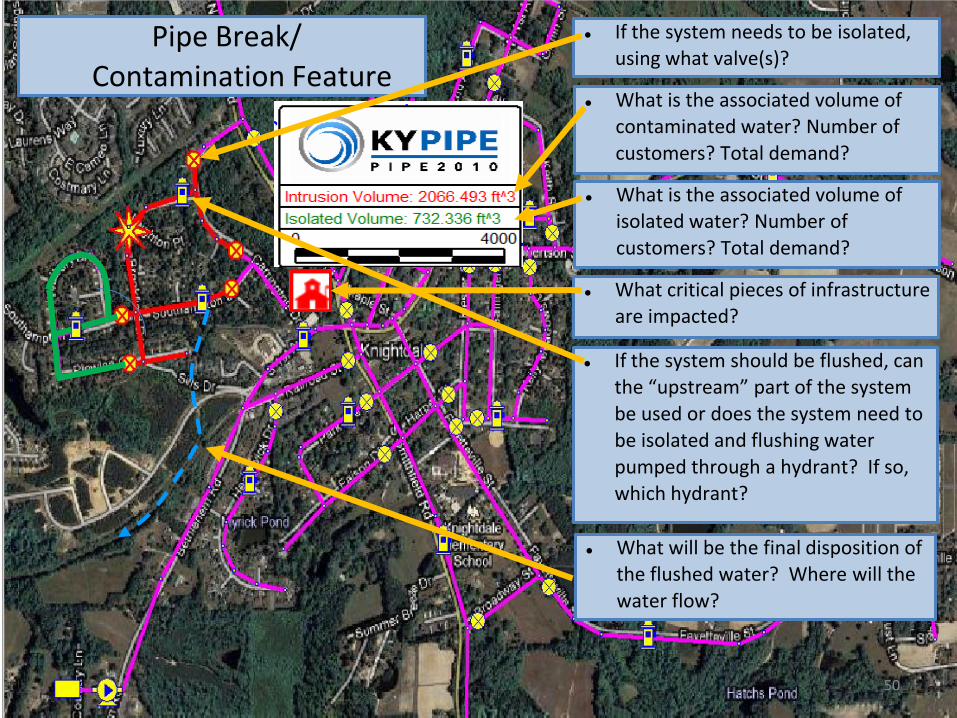
What will be the final disposition of the flushed water? Where will the
water flow?
What is the associated volume of contaminated water? Number of
customers? Total demand?
If the system should be flushed, can the “upstream” part of the system
be used or does the system need to
be isolated and flushing water
pumped through a hydrant? If so, which hydrant?
If the system needs to be isolated, using what valve(s)?
What critical pieces of infrastructure are impacted?
What is the associated volume of isolated water? Number of
customers? Total demand?
Pipe Break/ Contamination Feature
50

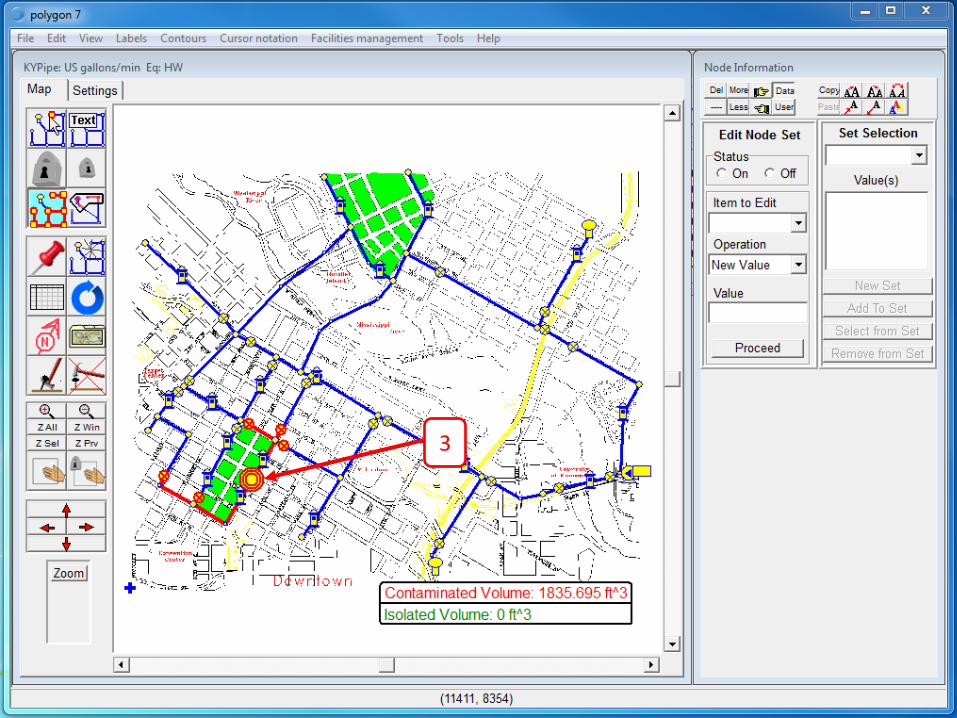
Generate a contamination report by a point
1. Click on “Facilities Management” on the top menu bar
2. Select “Contamination (point)” from the menu
3. Click on a pipe in the network map in the location of the contamination
4. Click on a valve to expand the contamination beyond the valve
5. Go back to the Facilities Management menu and select “Contamination Report”
51

1 2
53
3

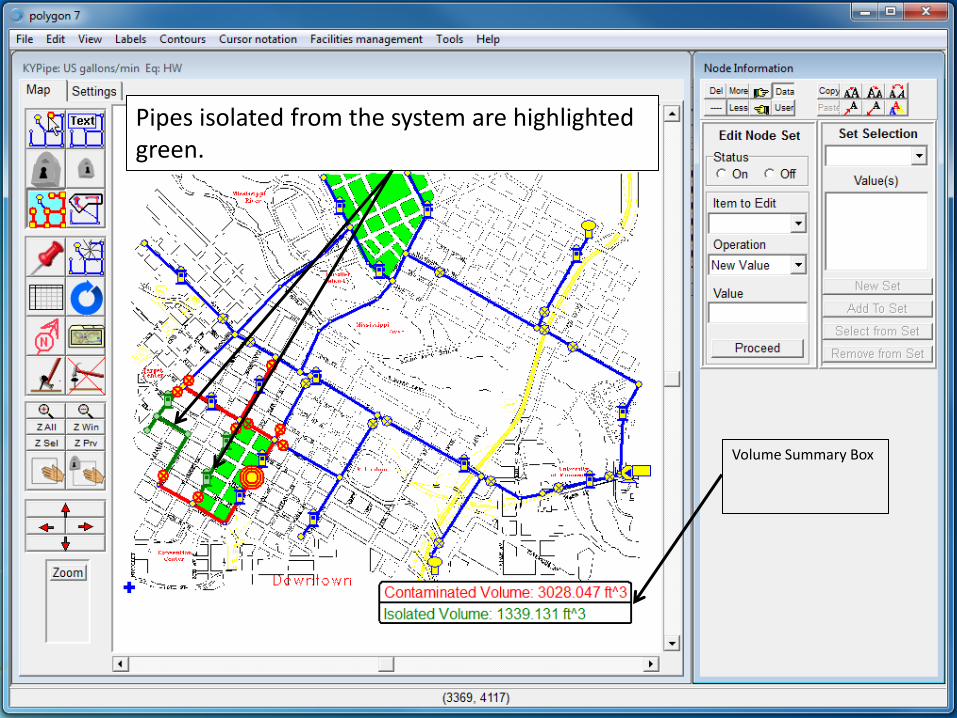
4. Single-click this valve to see the contamination move north and west in the system. (Note: clicking again on this valve will close it and the contamination will update to the new boundary condition.)
55
Pipes isolated from the system are highlighted green.
Volume Summary Box
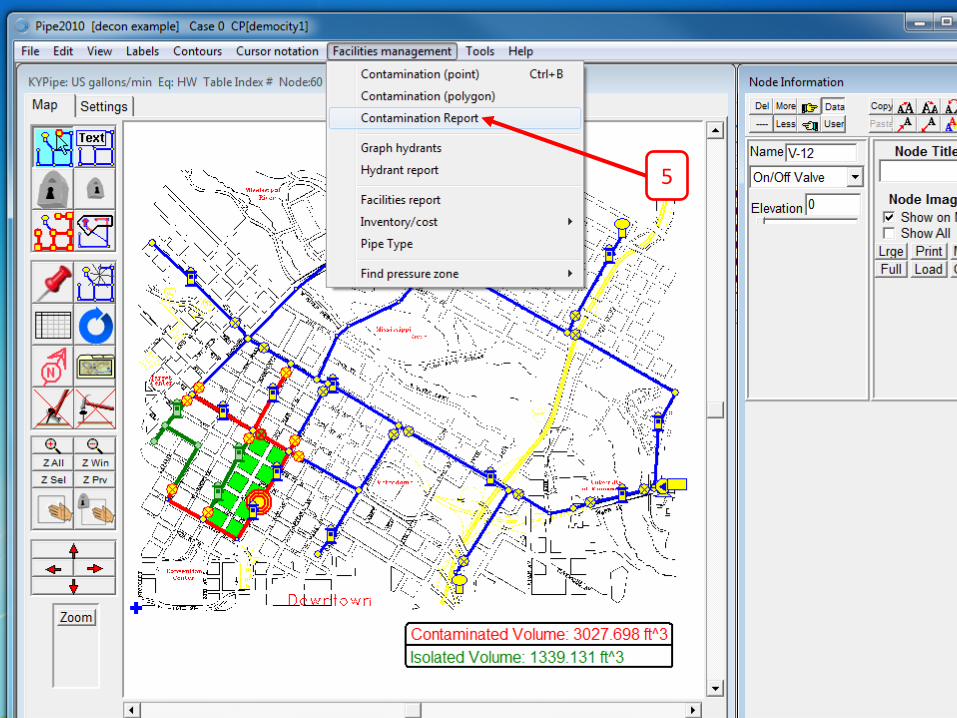
56
5
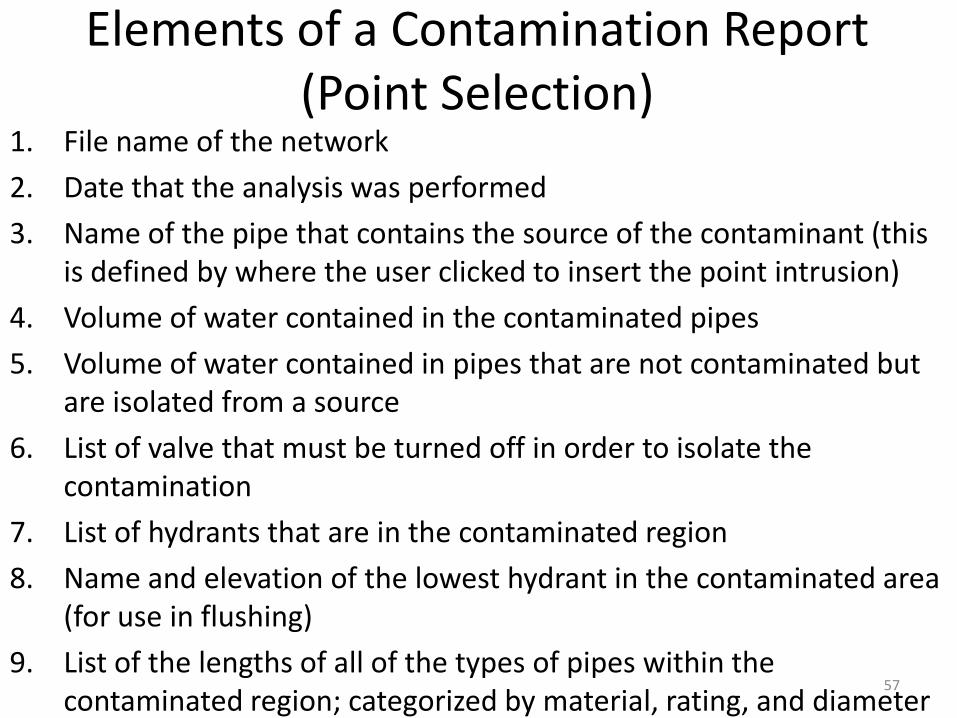
Elements of a Contamination Report (Point Selection)
1. File name of the network
2. Date that the analysis was performed
3. Name of the pipe that contains the source of the contaminant (this is defined by where the user clicked to insert the point intrusion)
4. Volume of water contained in the contaminated pipes
5. Volume of water contained in pipes that are not contaminated but are isolated from a source
6. List of valve that must be turned off in order to isolate the contamination
7. List of hydrants that are in the contaminated region
8. Name and elevation of the lowest hydrant in the contaminated area (for use in flushing)
9. List of the lengths of all of the types of pipes within the contaminated region; categorized by material, rating, and diameter
57
Workshop Agenda • 1. Project Overview
• 2. Overview of Project Website
• 3. Overview of Visualization Models
– Graphical Flow Model
– Pipe Break Model
• 4. Off line network modeling • 5. Overview of SCADA
• 6. Overview of Sensor Placement – Sensor Placement Model
• 7. On-line network modeling
– Real-time predictive analytics: process and benefits – Real-time network modeling: NKWD field study
• 8. Overview of Toolkit
• 9. Wrap up discussion 58

OFF-LINE COMPUTER MODELS
59
SPATIAL VISUALIZATION
OF NETWORK
COMPONENTS
OFF-LINE COMPUTER
MODELS
ON-LINE COMPUTER
MODELS
SUPERVISORY
CONTROL AND DATA
ACQUISITION (SCADA)

Computer Models • Computer models for network modeling have
been around since the late 1950s.
60
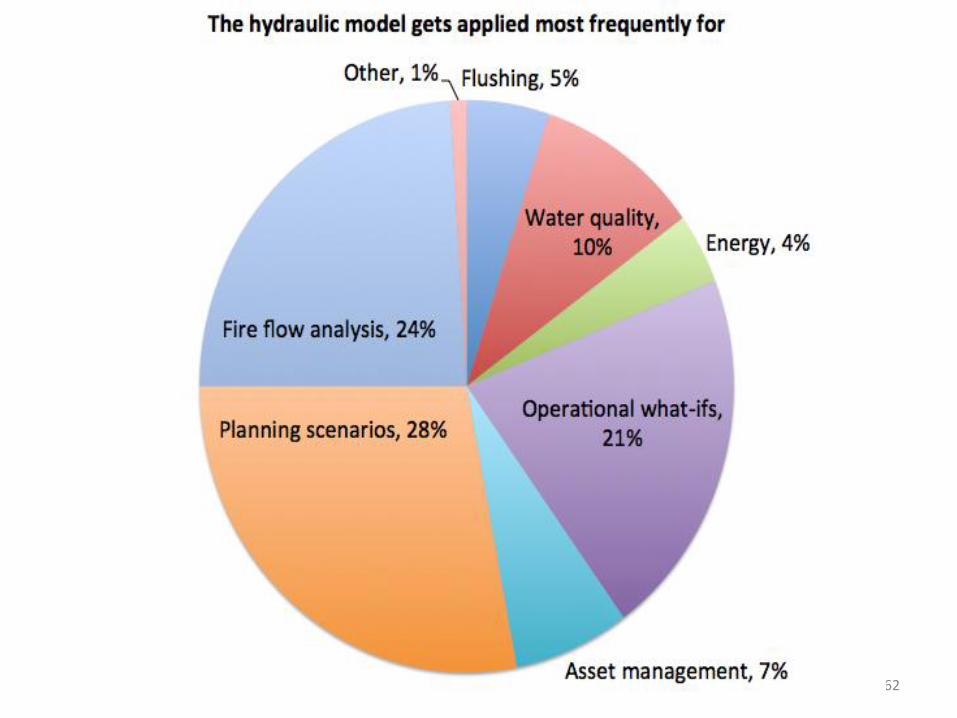
Potential Model Uses • Static hydraulic analyses
– Flows and pressures in the system – Fire flow tests – Valve closure
• Dynamic hydraulic analyses – Tank turnover – Pump operations – Emergency response
• Water Quality analyses – Age analysis – Chlorine residual analysis – Tracer analysis
• Real Time Analysis – Real Time Operations – Emergency Response
61
62

OFF-LINE COMPUTER MODELS
63
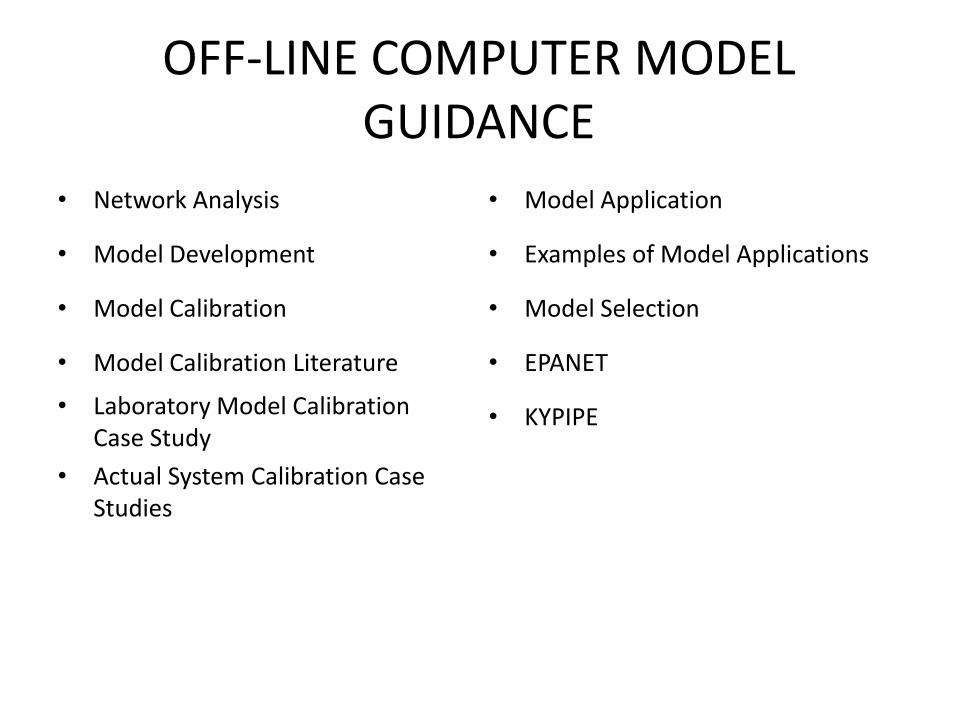
OFF-LINE COMPUTER MODEL GUIDANCE
• Network Analysis
• Model Development
• Model Calibration
• Model Calibration Literature
• Laboratory Model Calibration Case Study
• Actual System Calibration Case Studies
• Model Application
• Examples of Model Applications
• Model Selection
• EPANET
• KYPIPE
65
66
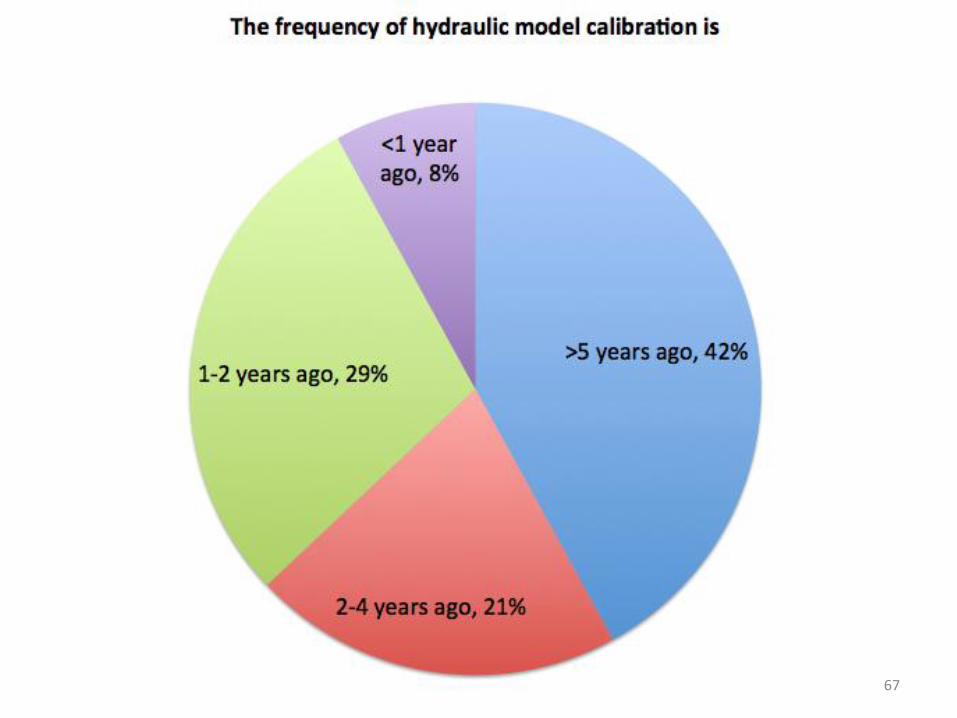
67
OFF-LINE COMPUTER MODEL GUIDANCE
• Network Analysis
• Model Development
• Model Calibration
• Model Calibration Literature
• Laboratory Model Calibration Case Study
• Actual System Calibration Case Studies
• Model Application
• Examples of Model Applications
• Model Selection
• EPANET
• KYPIPE
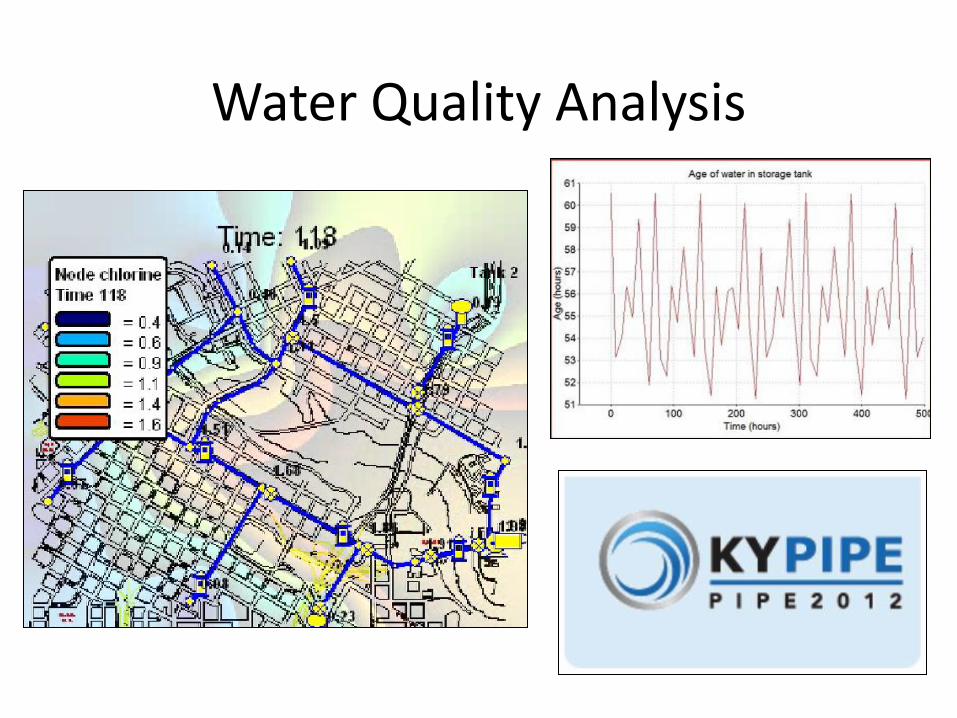
Water Quality Analysis
Water Quality Analysis
• KYPIPE provides a powerful interface to the EPANET program to perform water quality simulations on an existing hydraulic model.
• Through this EPANET interface it is possible to:
– Calculate chemical concentrations (e.g. chlorine)
– Calculate water age (residence time)
– Trace a chemical from a source

Calculating Chemical Concentrations *WQ Simulations are performed over an extended period of time, therefore ensure your system is set up for an EPS prior to the WQ analysis
1) Click the tab “Other Data” 2) Click the tab “Quality” 3) Select which quality parameter you would like to calculate 4) Fill in the required parameter tables
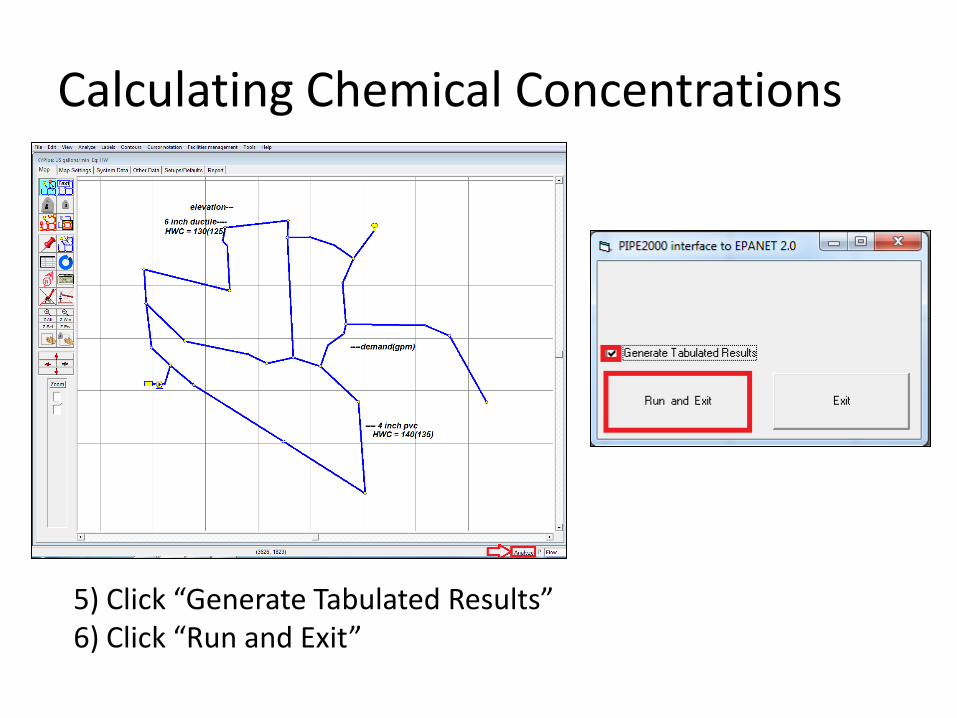
Calculating Chemical Concentrations
5) Click “Generate Tabulated Results” 6) Click “Run and Exit”

Calculating Chemical Concentrations
View the maximum chemical concentrations at each node.
Click on any node to view the concentration time series data.
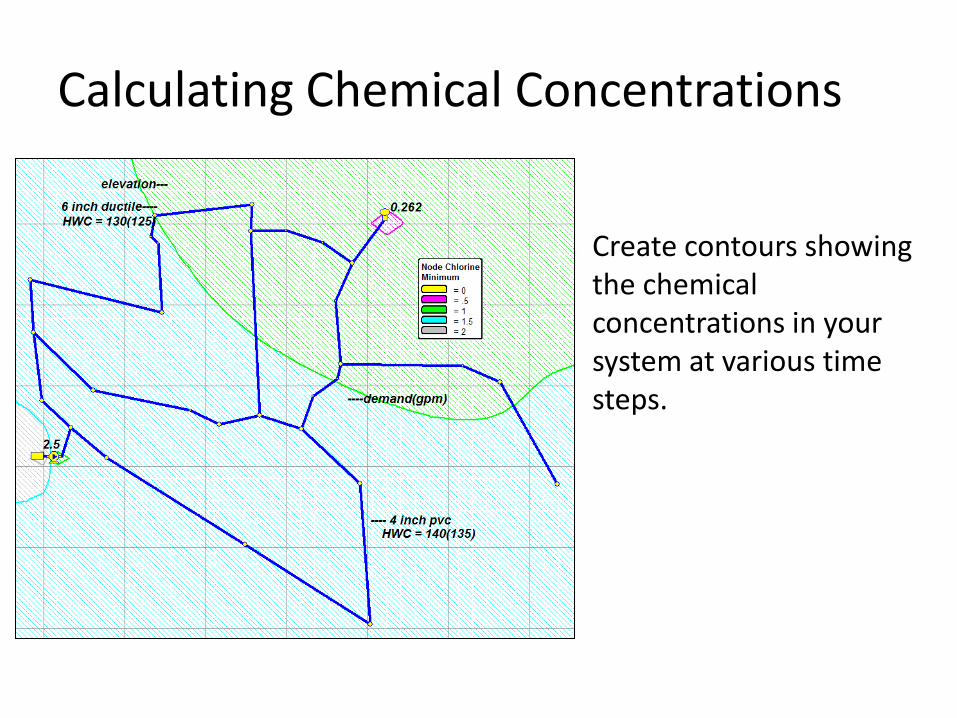
Calculating Chemical Concentrations
Create contours showing the chemical concentrations in your system at various time steps.
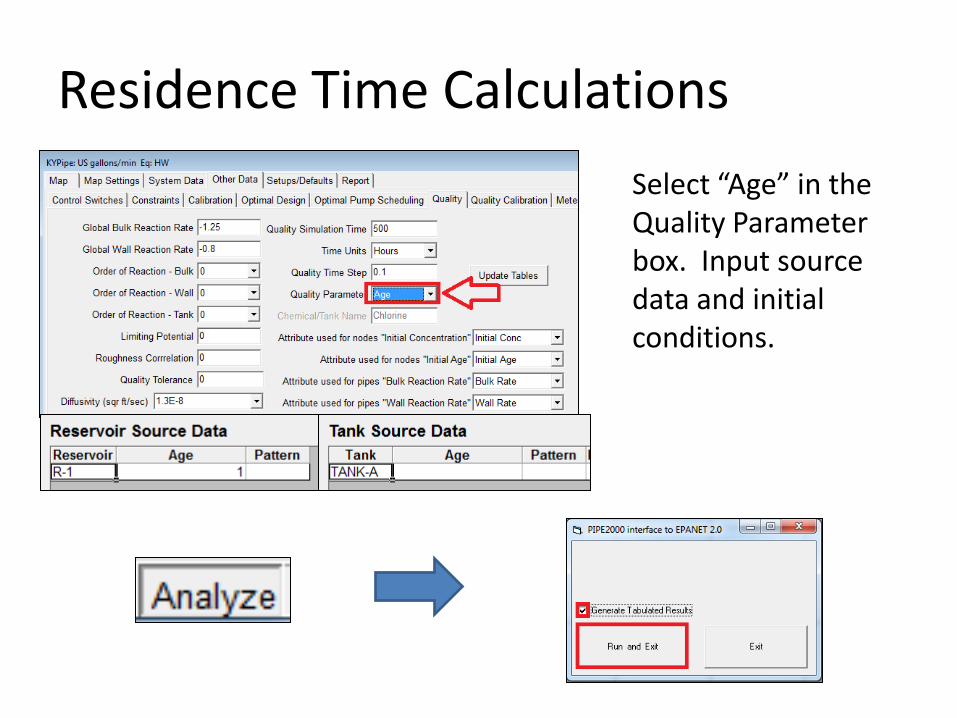
Residence Time Calculations
Select “Age” in the Quality Parameter box. Input source data and initial conditions.

Residence Time Calculations
Click on storage tank and view time series plot to show the age of water in the tank at a given time.
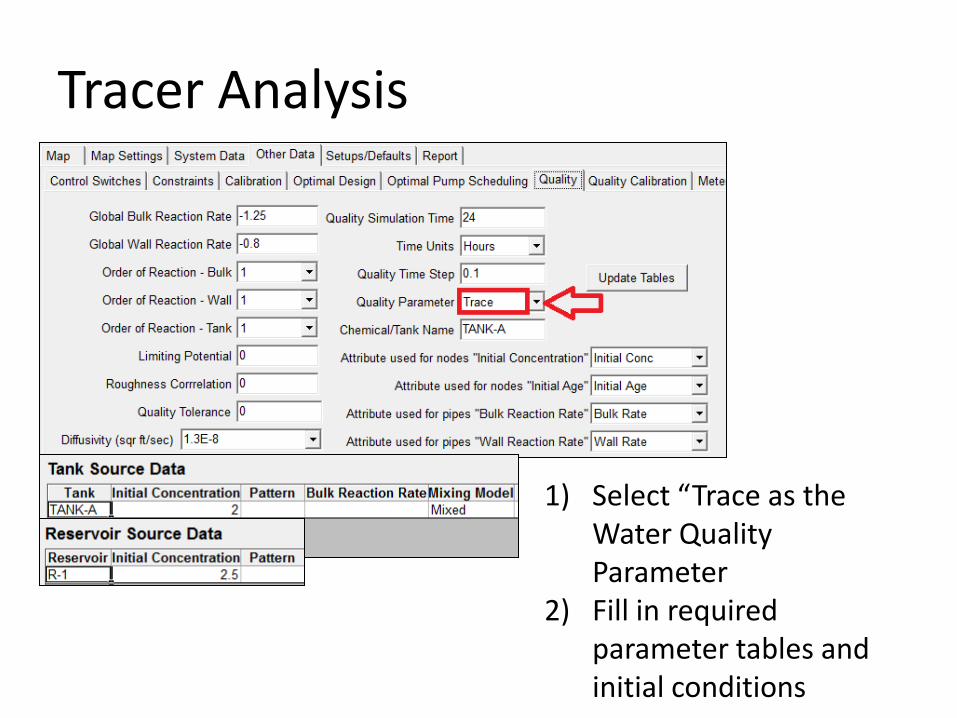
Tracer Analysis
1) Select “Trace as the Water Quality Parameter
2) Fill in required parameter tables and initial conditions

Tracer Analysis
Click on any node in the system
View the percent contribution at that node at a given time
Workshop Agenda • 1. Project Overview
• 2. Overview of Project Website
• 3. Overview of Visualization Models – Graphical Flow Model
– Pipe Break Model
• 4. Off-line network modeling
• 5. Overview of SCADA • 6. Overview of Sensor Placement
– Sensor Placement Model
• 7. On-line network modeling – Real-time predictive analytics: process and benefits
– Real-time network modeling: NKWD field study
• 8. Overview of Toolkit
• 9. Wrap up discussion 79
SCADA
80
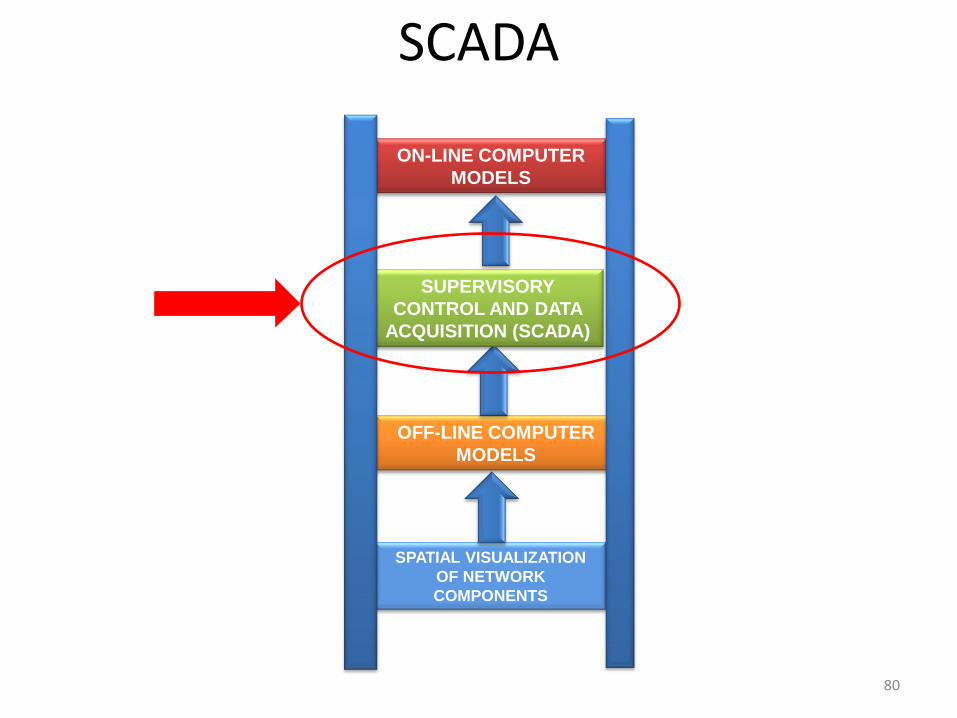
SPATIAL VISUALIZATION
OF NETWORK
COMPONENTS
OFF-LINE COMPUTER
MODELS
ON-LINE COMPUTER
MODELS
SUPERVISORY
CONTROL AND DATA
ACQUISITION (SCADA)
SCADA
81
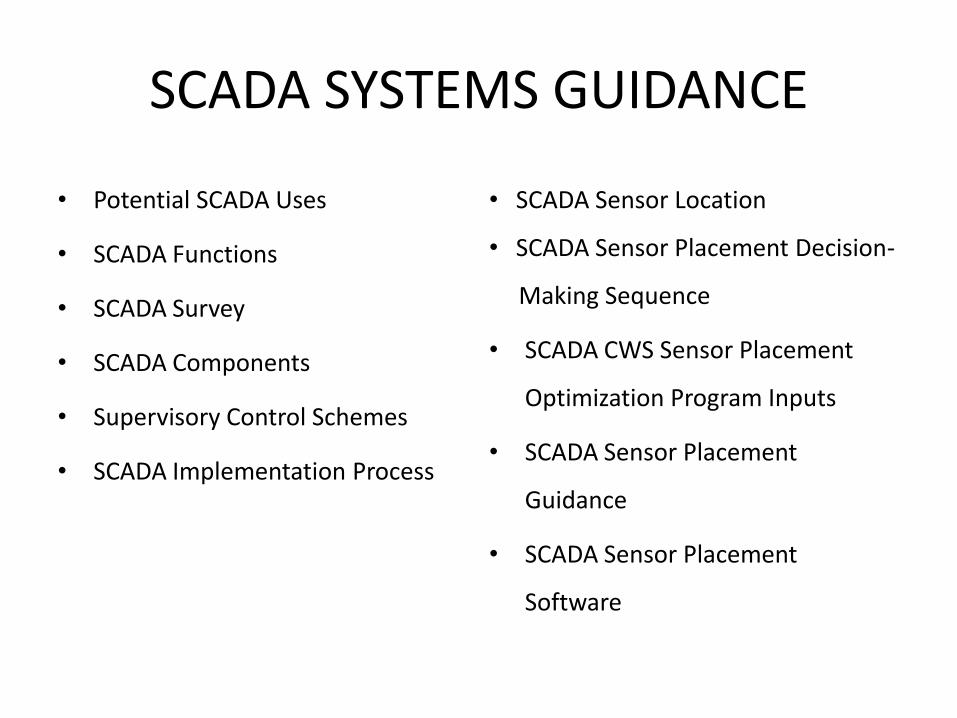
SCADA SYSTEMS GUIDANCE
• Potential SCADA Uses
• SCADA Functions
• SCADA Survey
• SCADA Components
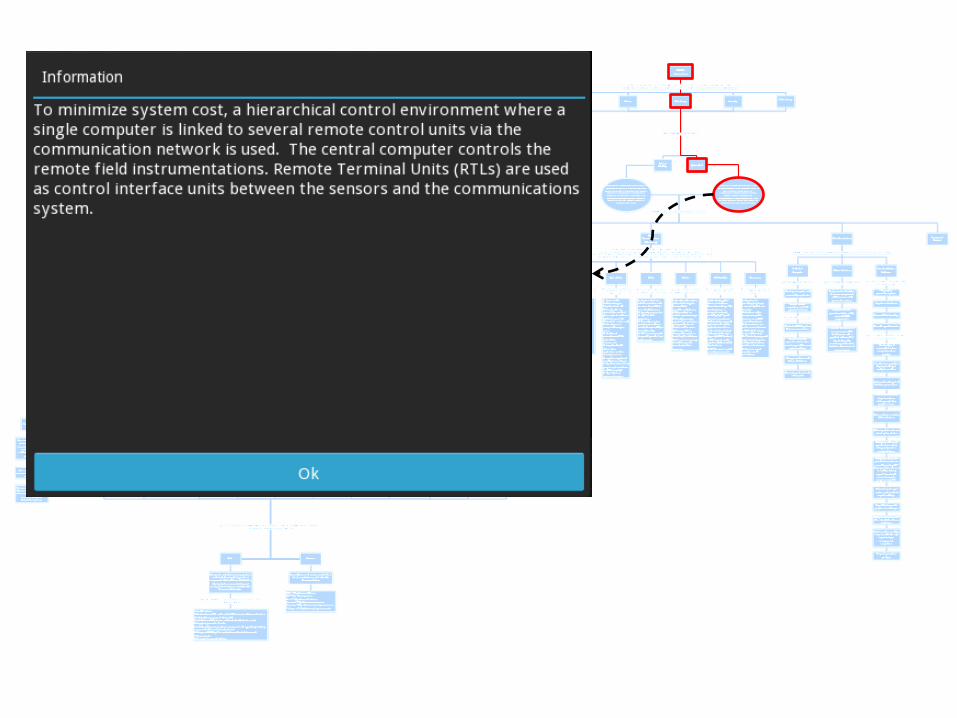
• Supervisory Control Schemes
• SCADA Implementation Process
• SCADA Sensor Location
• SCADA Sensor Placement Decision-
Making Sequence
• SCADA CWS Sensor Placement
Optimization Program Inputs
• SCADA Sensor Placement
Guidance
• SCADA Sensor Placement
Software

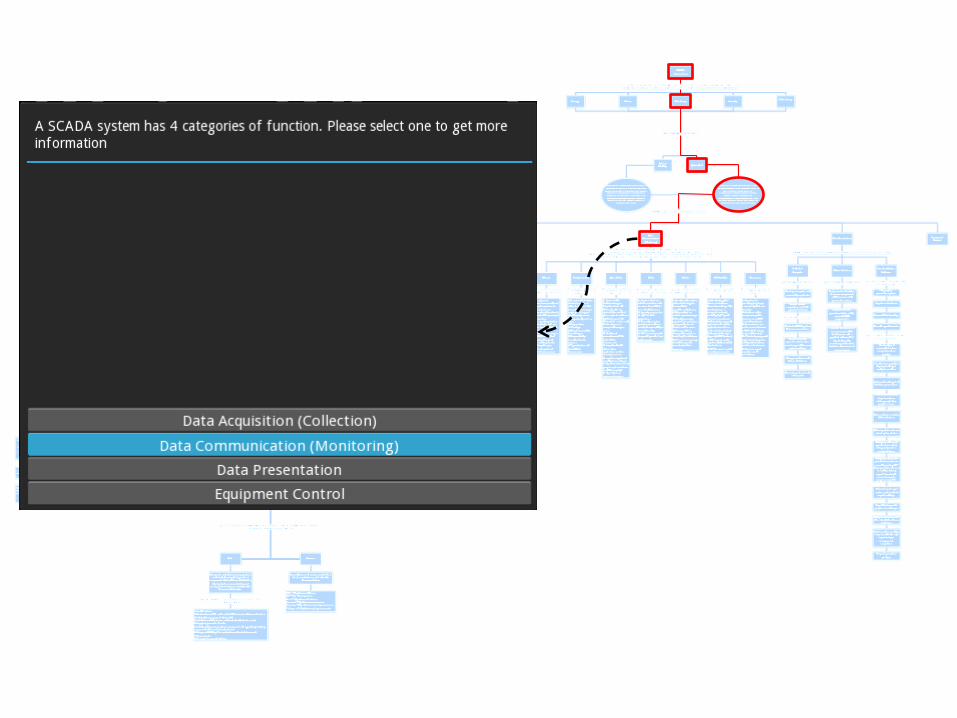
SCADA Functions
• Data Acquisition (Collection)
• Data Communication (Monitoring)
• Data Presentation
• Equipment Control
83
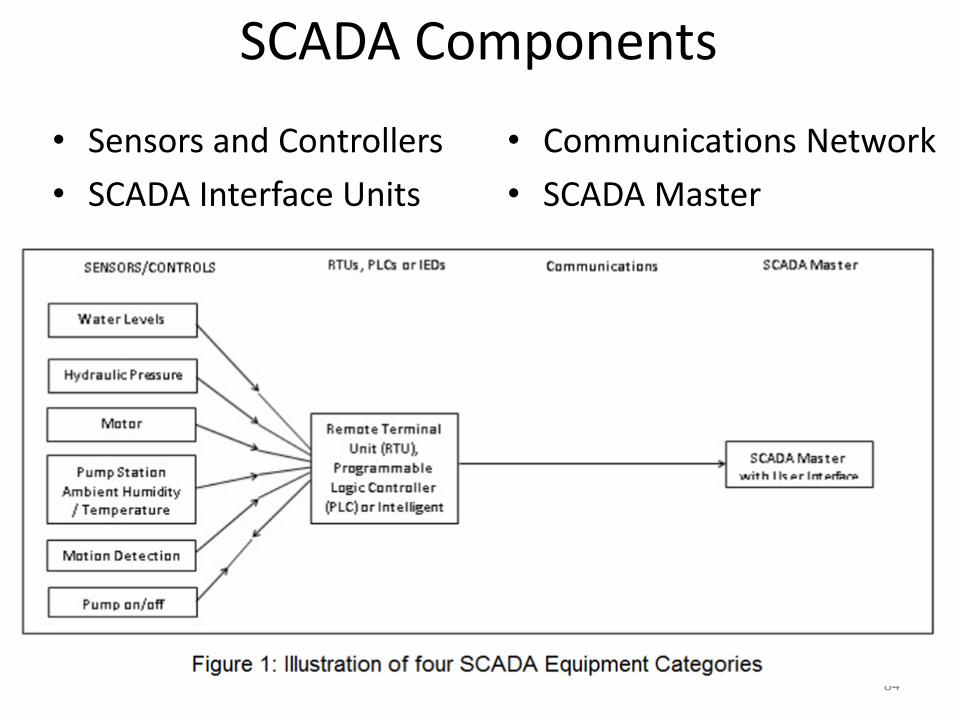
SCADA Components
84
• Sensors and Controllers
• SCADA Interface Units
• Communications Network
• SCADA Master
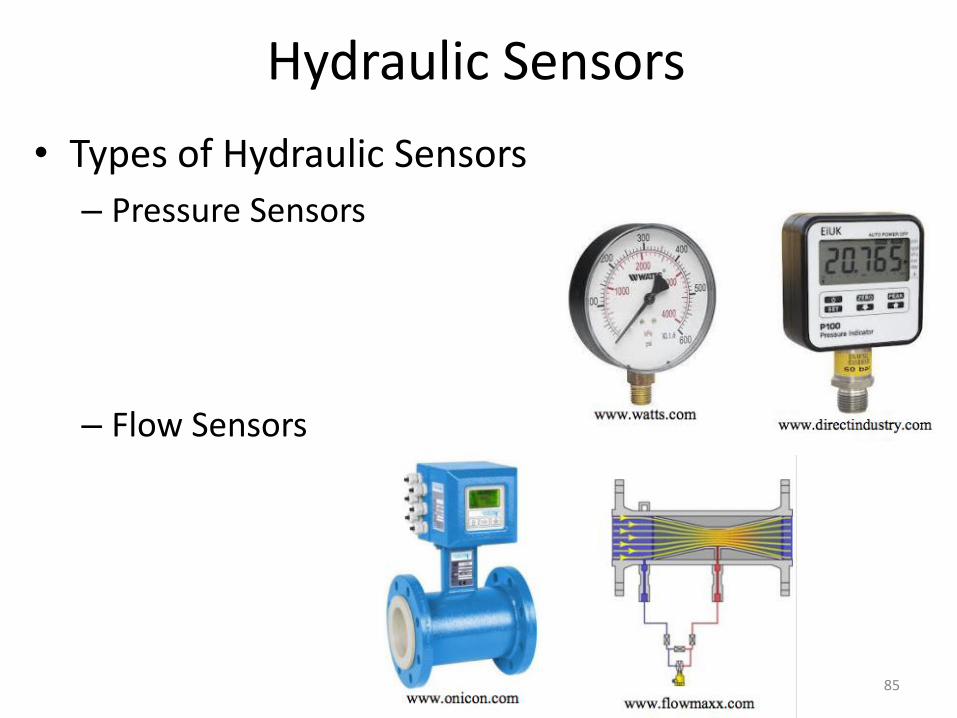
Hydraulic Sensors
• Types of Hydraulic Sensors
– Pressure Sensors
– Flow Sensors
85
Hydraulic Sensors
• Sources of Hydraulic Sensors:
– ABB, abb.com
– Ashcroft, ashcroft.com
– Holykell, holykell.com
– Honeywell, honeywell.com
– Keyence, keyence.com
– Truck, truck-usa.com
86

Water Quality Sensors
• Types of Water Quality Sensors
– Chlorine Residual Sensor
– TOC Sensor
– Turbidity Sensor
– Conductivity Sensor
– pH Sensor
– ORP Sensor -
87
Water Quality Sensors
• Sources of Water Quality Sensors
– ABB, abb.com
– GE, ge.com
– Hach, hach.com
– Siemens, siemens.com
– Emerson, emersonprocess.com
– Yokogawa, yokogawa.com/us
88
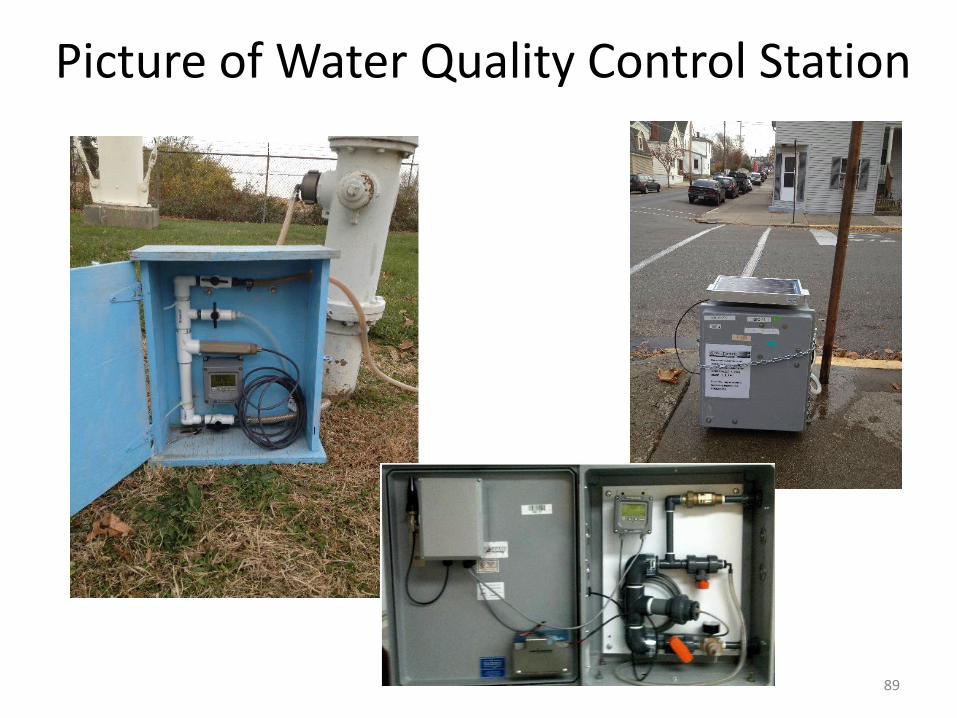
Picture of Water Quality Control Station
89

Control Equipment (Pumps)
90
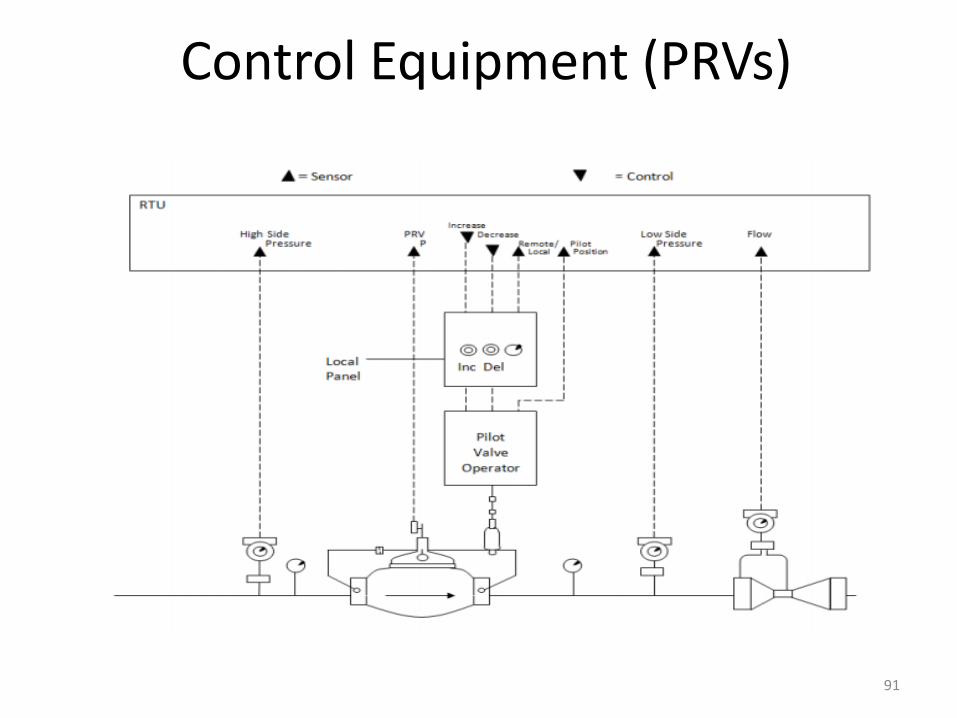
Control Equipment (PRVs)
91
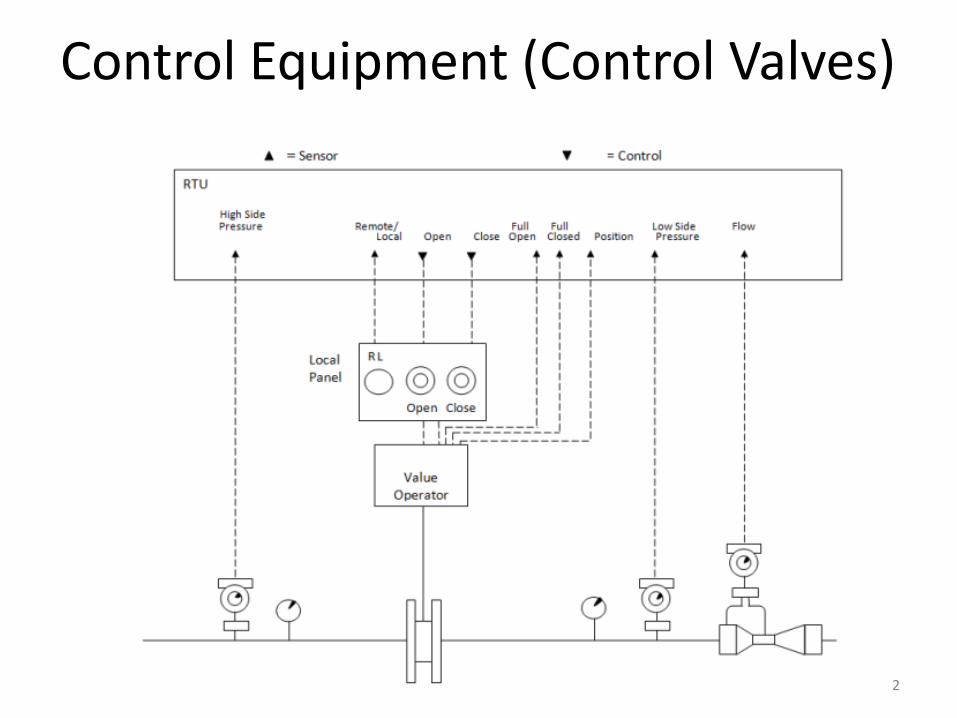
Control Equipment (Control Valves)
92
SCADA Interface Units
• Remote Telemetry Units (RTU1s)
• Remote Terminal Units (RTU2s)
• Programmable Logic Controllers (PLCs)
93
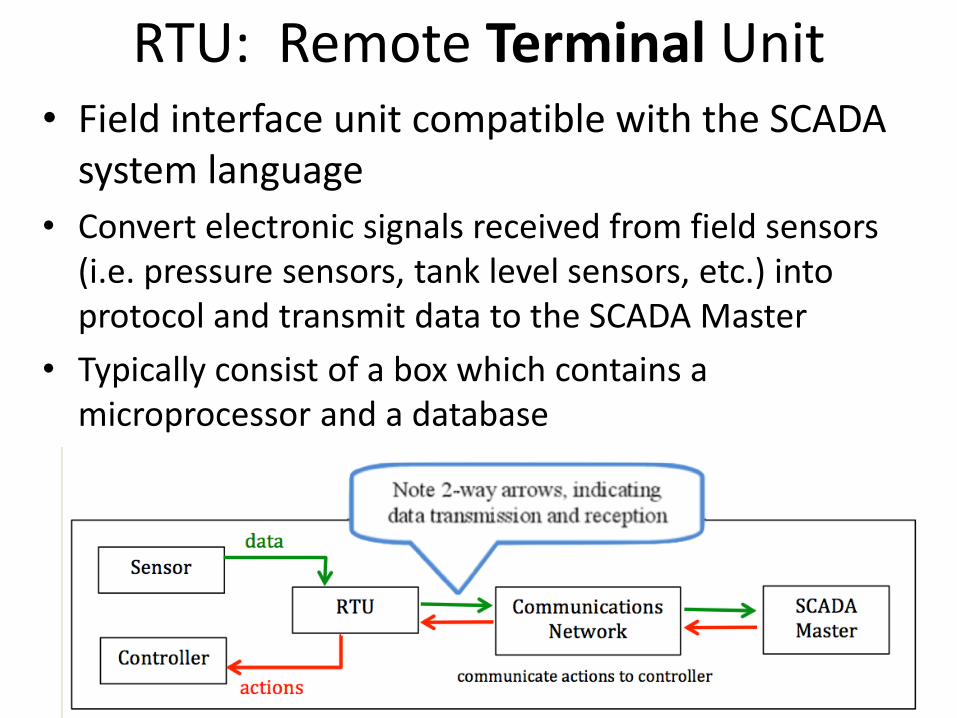
• Field interface unit compatible with the SCADA system language
• Convert electronic signals received from field sensors (i.e. pressure sensors, tank level sensors, etc.) into protocol and transmit data to the SCADA Master
• Typically consist of a box which contains a microprocessor and a database
94
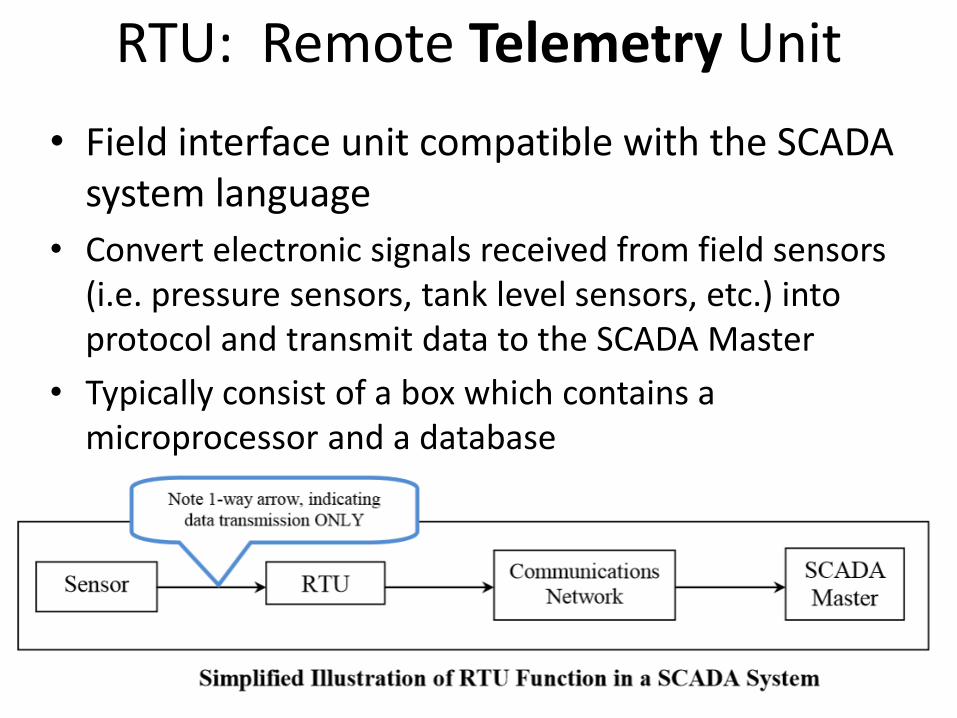
RTU: Remote Telemetry Unit
• Field interface unit compatible with the SCADA system language
• Convert electronic signals received from field sensors (i.e. pressure sensors, tank level sensors, etc.) into protocol and transmit data to the SCADA Master
• Typically consist of a box which contains a microprocessor and a database
95
RTU: Remote Terminal Unit
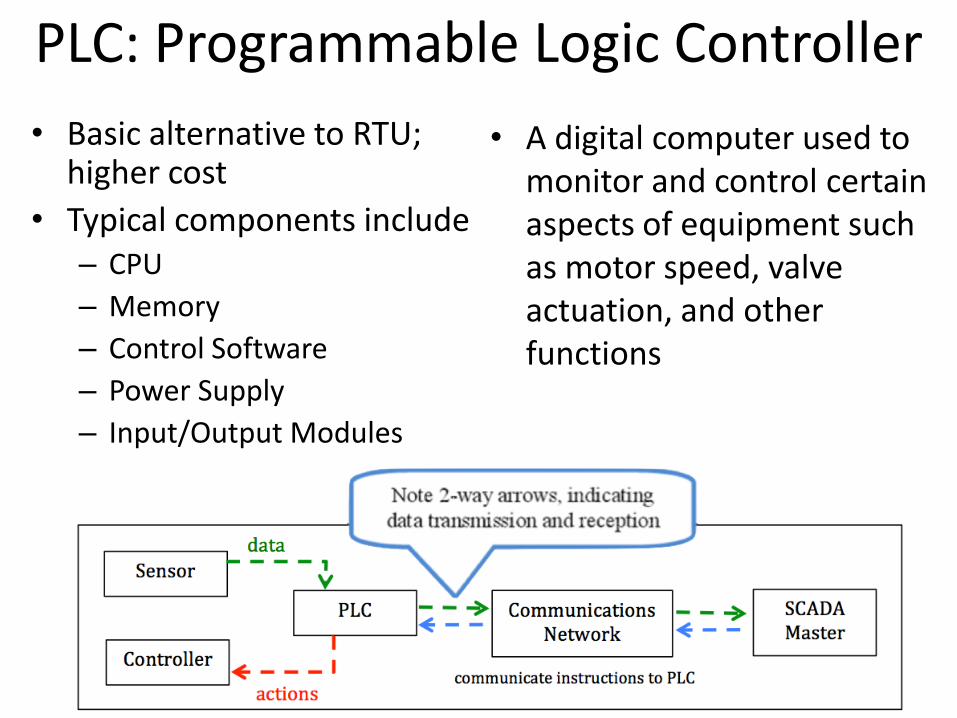
• Basic alternative to RTU; higher cost
• Typical components include – CPU
– Memory
– Control Software
– Power Supply
– Input/Output Modules
96
PLC: Programmable Logic Controller
• A digital computer used to monitor and control certain aspects of equipment such as motor speed, valve actuation, and other functions

SCADA
97
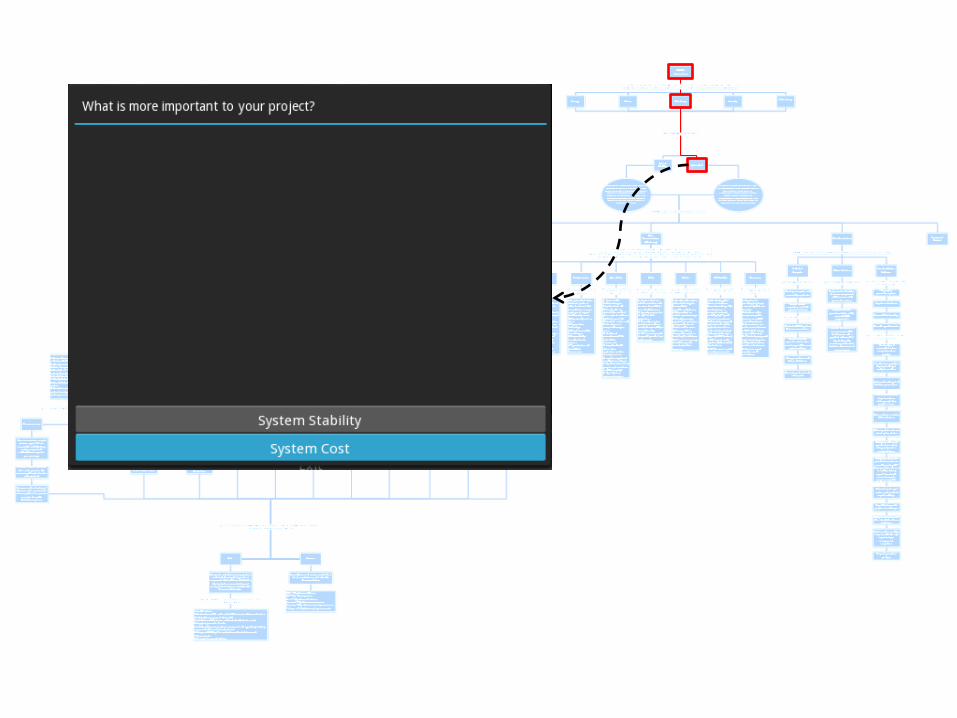
2 Supervisory Control Schemes
Hierarchical Control Distributed Control
Control
Control
Control
RTU
RTU
RTU
Monitor Instruct
Monitor Instruct
Monitor Instruct
PLC
PLC
PLC
“Supervisory Control and Data Acquisition”
Control
Control
Control
Control
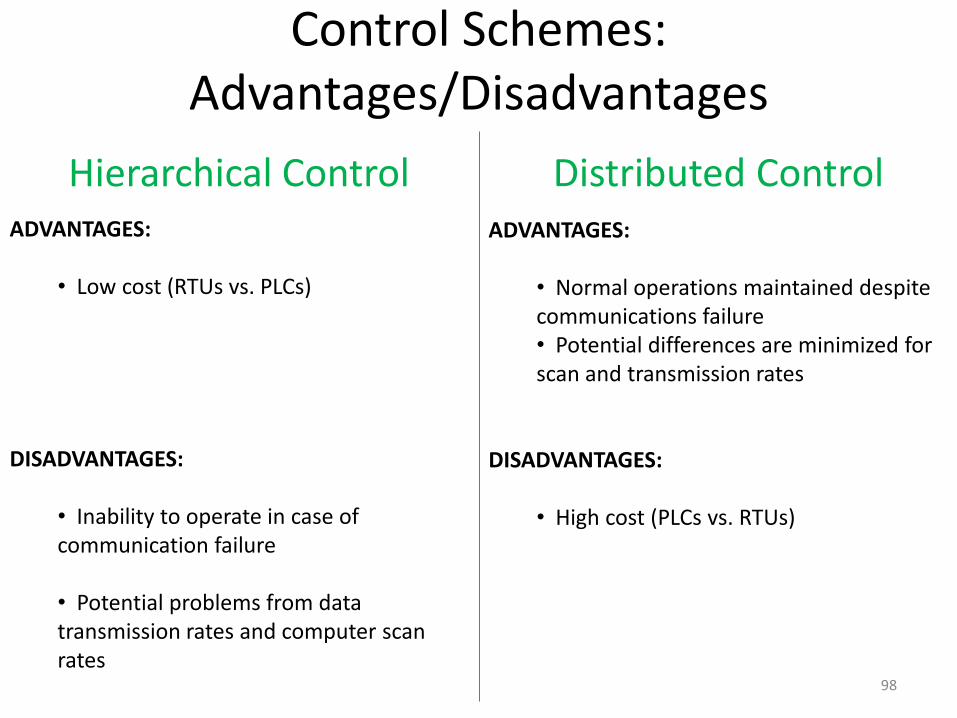
Control Schemes: Advantages/Disadvantages
98
Hierarchical Control Distributed Control ADVANTAGES:
• Low cost (RTUs vs. PLCs)
DISADVANTAGES:
• Inability to operate in case of communication failure • Potential problems from data transmission rates and computer scan rates
ADVANTAGES:
• Normal operations maintained despite communications failure • Potential differences are minimized for scan and transmission rates
DISADVANTAGES:
• High cost (PLCs vs. RTUs)
• Why do we need a monitoring/ control system?
– Normal Operations
– Pipe Breaks/Leaks
– Pump/Tank Failures
–Contamination Events – Maintain Energy Efficiency
– Minimize Operational Costs
99
Need for SCADA
EPA Water Security Initiative
• The Water Security (WS) initiative is a U.S. Environmental Protection Agency (EPA) program that addresses the risk of contamination of drinking water systems.
• EPA established this initiative in response to Homeland Security Presidential Directive 9, under which the Agency must “develop robust, comprehensive, and fully coordinated surveillance and monitoring systems, including international information, for…water quality that provides early detection and awareness of disease, pest or poisonous agents.”
100


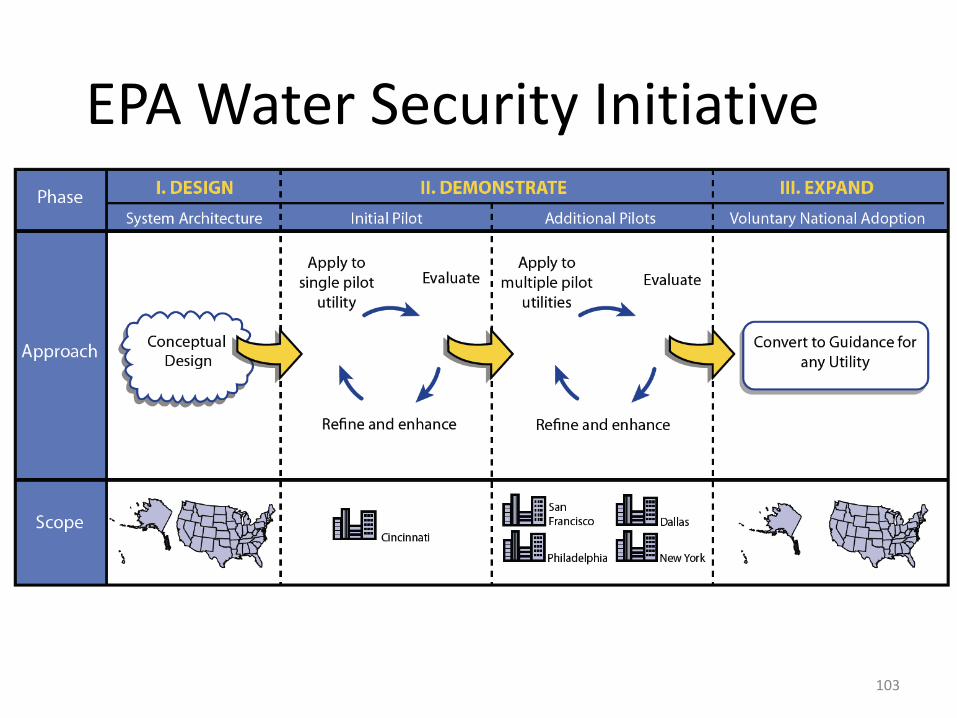
EPA Water Security Operational Phases
103
EPA Water Security Initiative

Notes
104
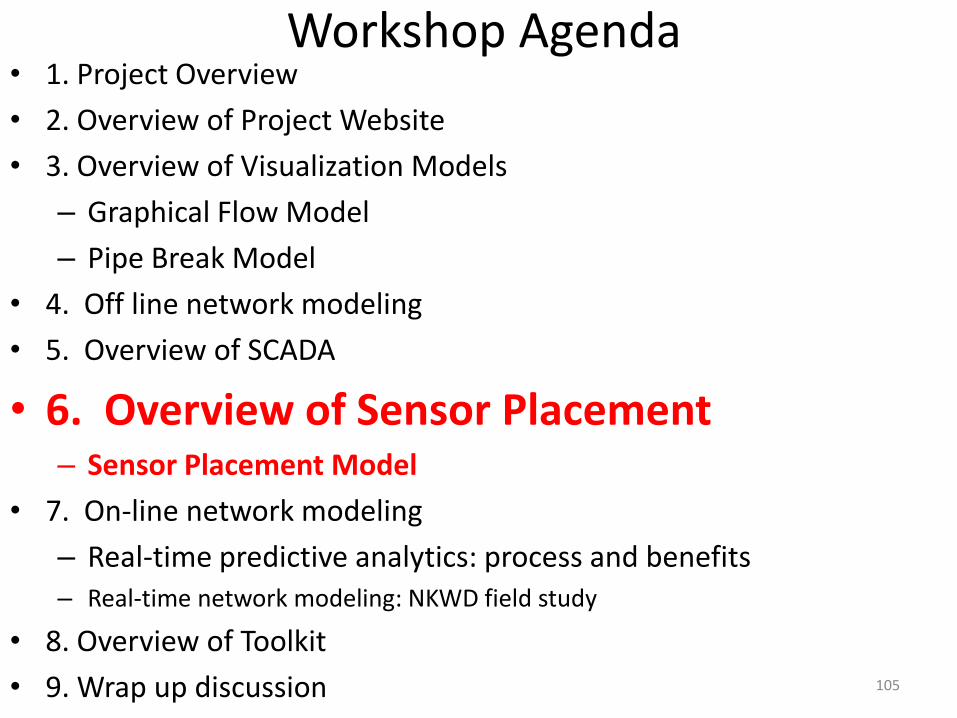
Workshop Agenda • 1. Project Overview
• 2. Overview of Project Website
• 3. Overview of Visualization Models
– Graphical Flow Model
– Pipe Break Model
• 4. Off line network modeling
• 5. Overview of SCADA
• 6. Overview of Sensor Placement – Sensor Placement Model
• 7. On-line network modeling
– Real-time predictive analytics: process and benefits – Real-time network modeling: NKWD field study
• 8. Overview of Toolkit
• 9. Wrap up discussion 105
Water Quality Sensor Placement
• General guidelines
– Single sensor placement
• Graphical method
• Simplified graphical method
• Placement Software
– TEVA SPOT
– KYPIPE
106
107
108

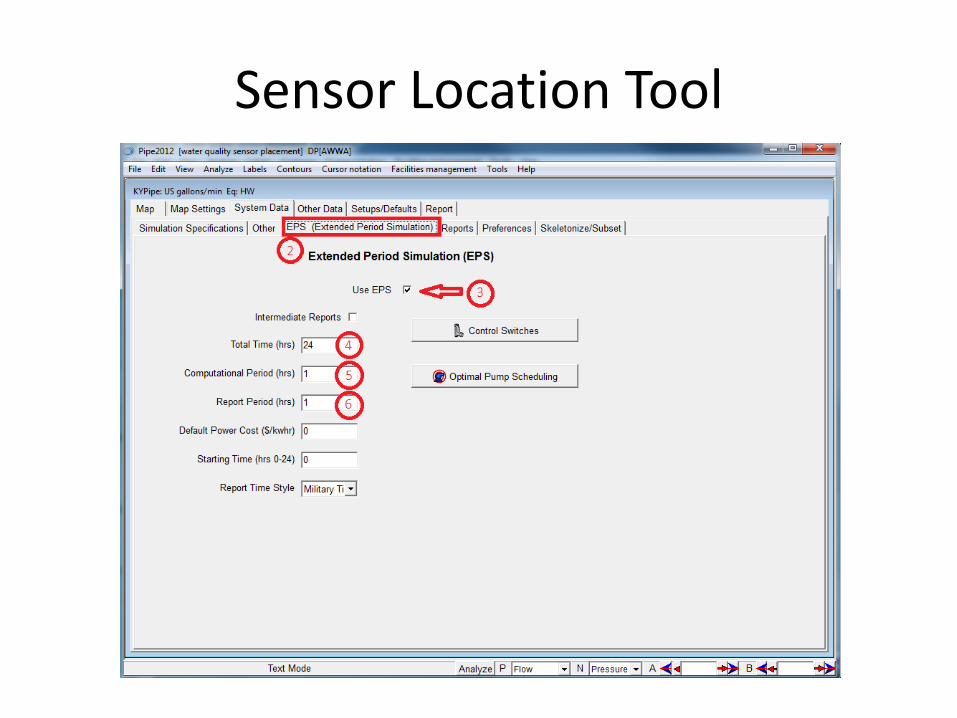
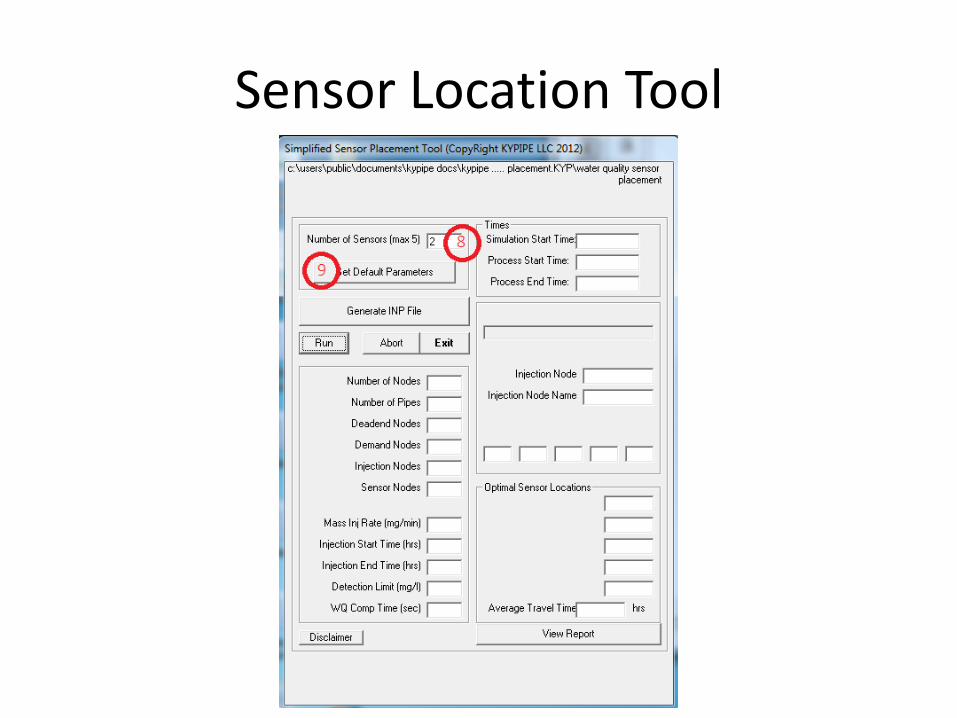
Sensor Location Tool
INPUT
• Number of sensors to be placed in system
• Mass injection rate of contaminant (1000 mg/min)
• Duration of injection (1 hr)
* Be sure you are using an Extended Period Simulation (EPS)
OUTPUT
• Optimal sensor placement locations within system
• Contamination Report

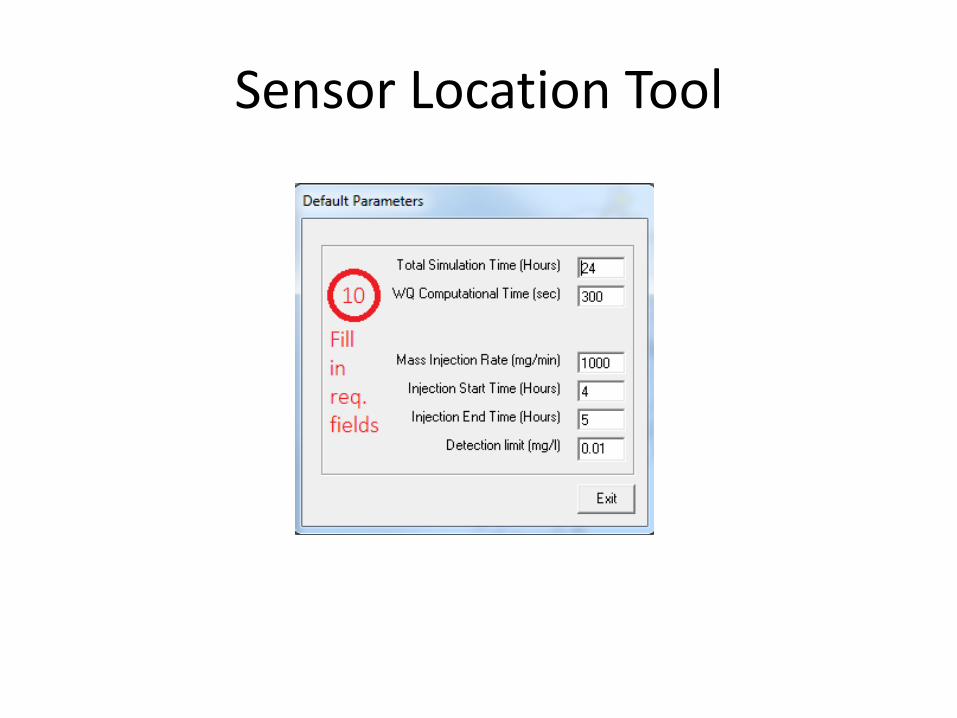
Sensor Location Tool
Sensor Location Tool

Sensor Location Tool
Press “SHIFT + F7”
Press “Shift + F7”
Sensor Location Tool
Sensor Location Tool

Sensor Location Tool
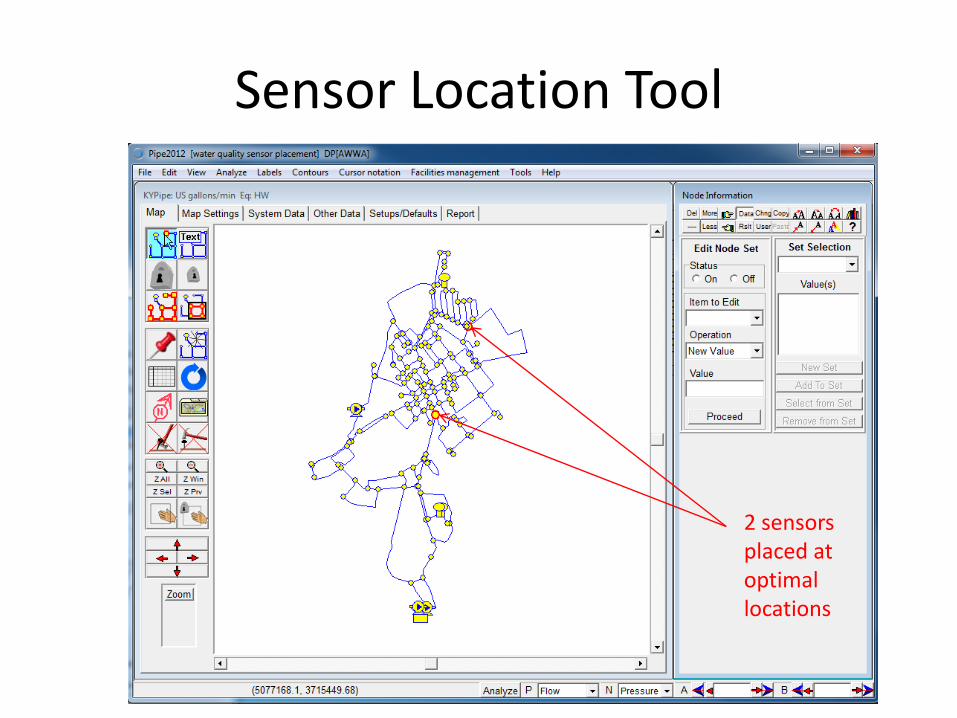
Sensor Location Tool
2 sensors placed at optimal locations

Sensor Location Tool

Notes:
118

Workshop Agenda • 1. Project Overview
• 2. Overview of Project Website
• 3. Overview of Visualization Models – Graphical Flow Model
– Pipe Break Model
• 4. Off line network modeling
• 5. Overview of SCADA
• 6. Overview of Sensor Placement – Sensor Placement Model
• 7. On-line network modeling – Real-time predictive analytics: process and benefits
– Real-time network modeling: NKWD field study
• 8. Overview of Toolkit
• 9. Wrap up discussion 119
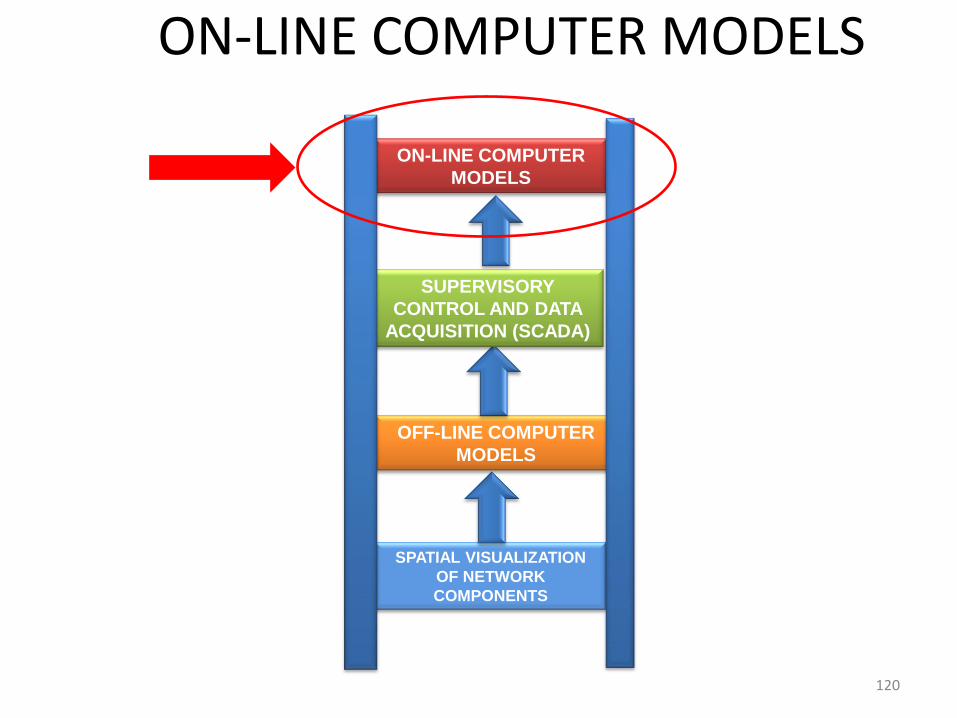
ON-LINE COMPUTER MODELS
120
SPATIAL VISUALIZATION
OF NETWORK
COMPONENTS
OFF-LINE COMPUTER
MODELS
ON-LINE COMPUTER
MODELS
SUPERVISORY
CONTROL AND DATA
ACQUISITION (SCADA)
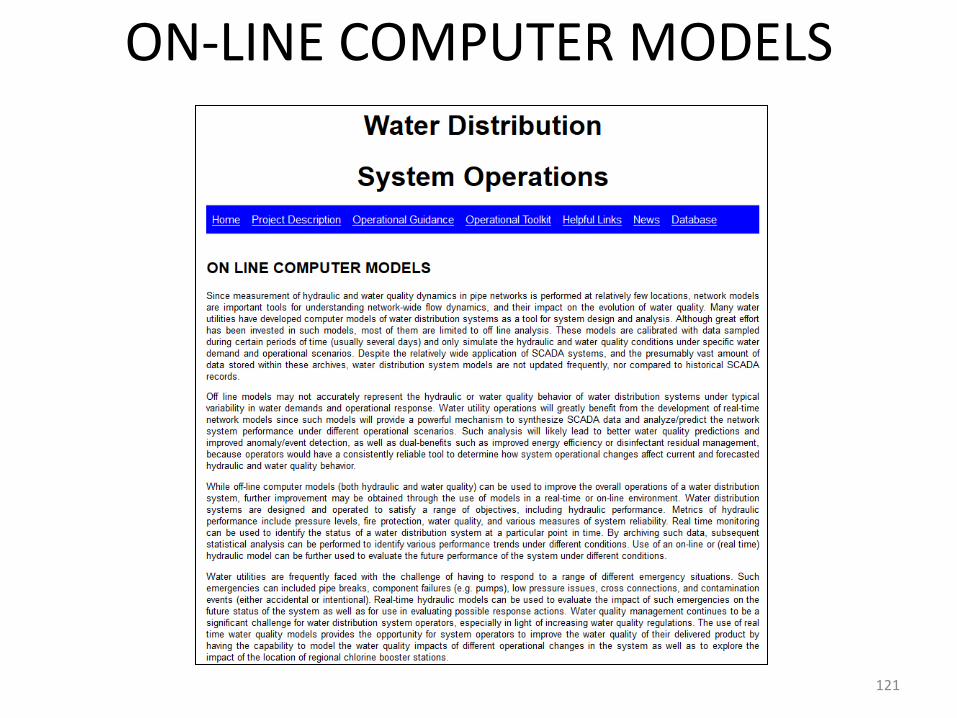
ON-LINE COMPUTER MODELS
121

ON-LINE COMPUTER MODEL GUIDANCE
• Model / SCADA Integration / Calibration
• Implementation Strategies and Barriers for Real-Time Modeling
• Potential Applications of Real-Time Simulation
• Actual Applications of Real-Time Simulation
123
124
125
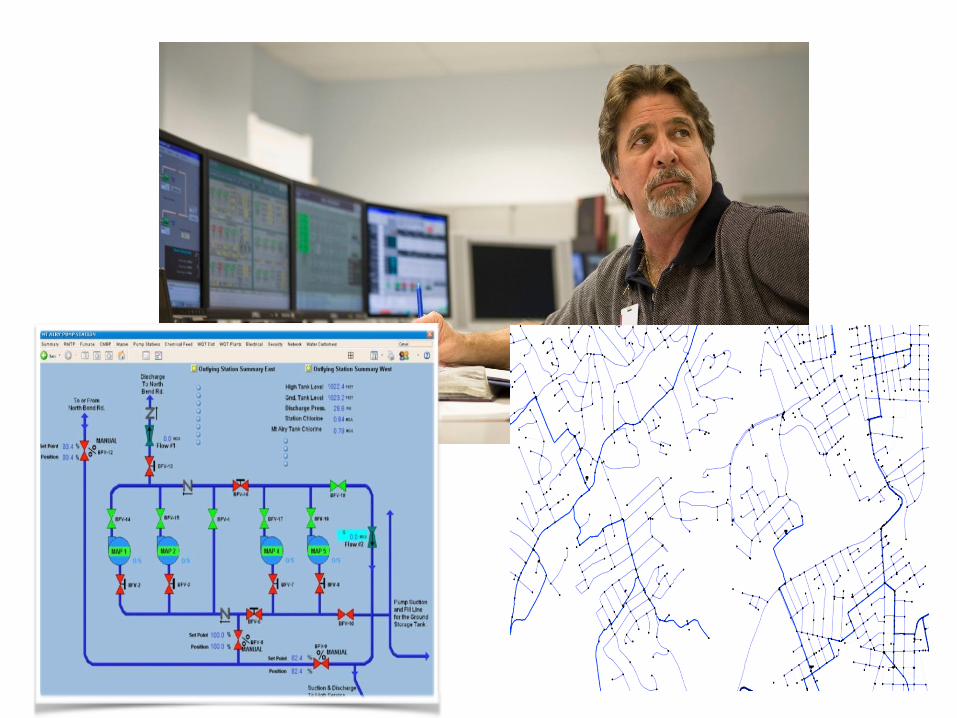
The current situation:
Lots of models...
and lots of data...
Isolated from each other
What will real-time analytics look like
when I see it?

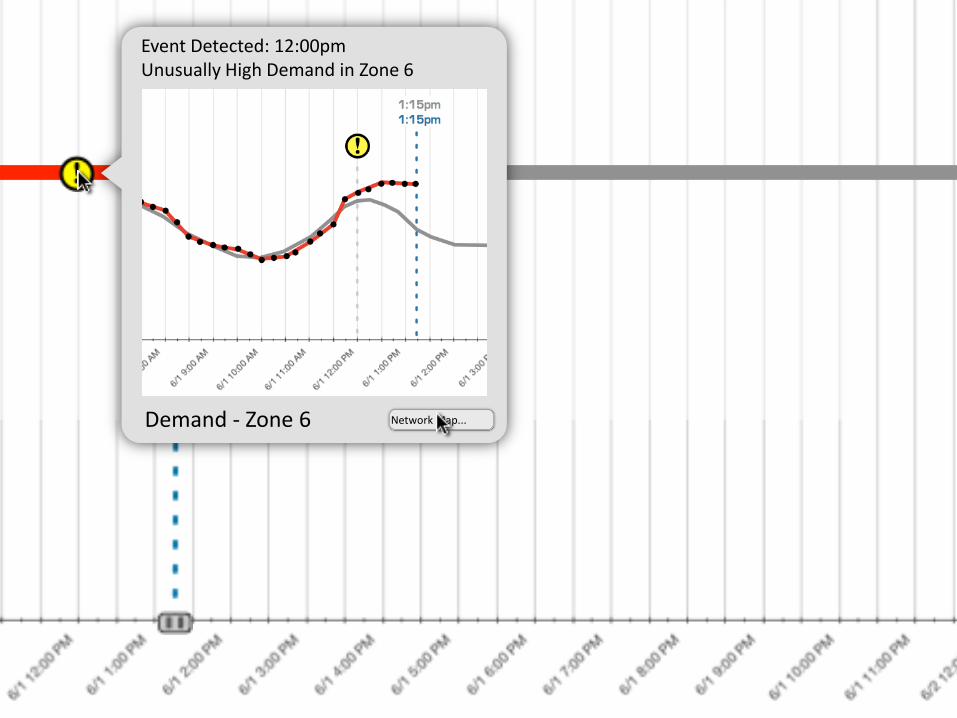
1:15pm 1:15pm Event Detected: 12:00pm
Unusually High Demand in Zone 6
Demand - Zone 6 Network Map...
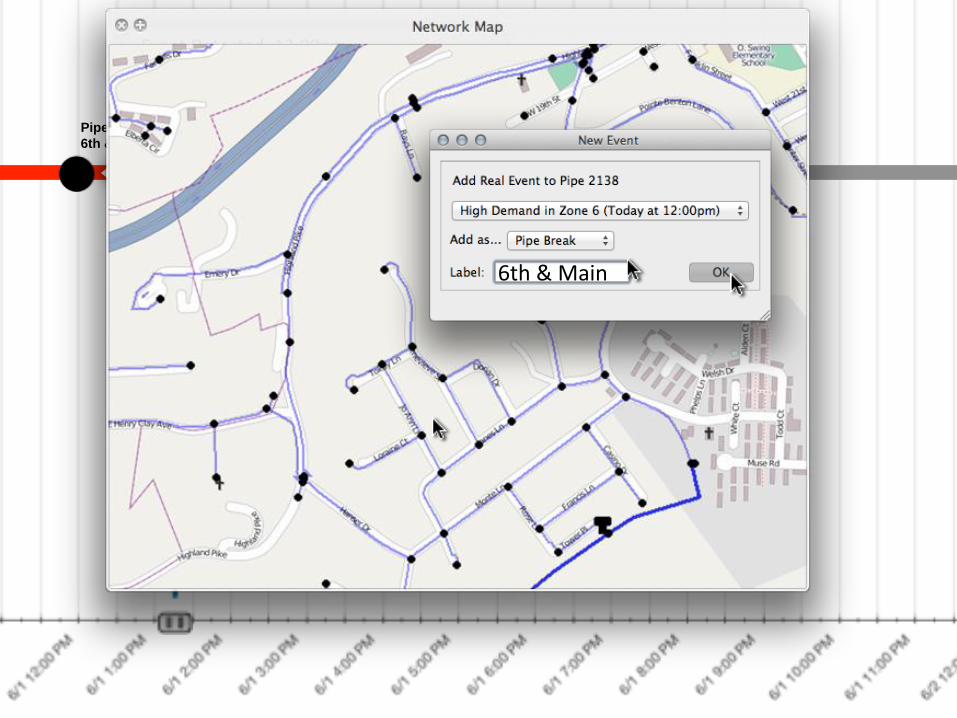
Pipe Break
6th & Main
1:15pm 1:15pm Event Detected: 12:00pm
Unusually High Demand in Zone 6
Demand - Zone 6 Network Map...
6th & Main
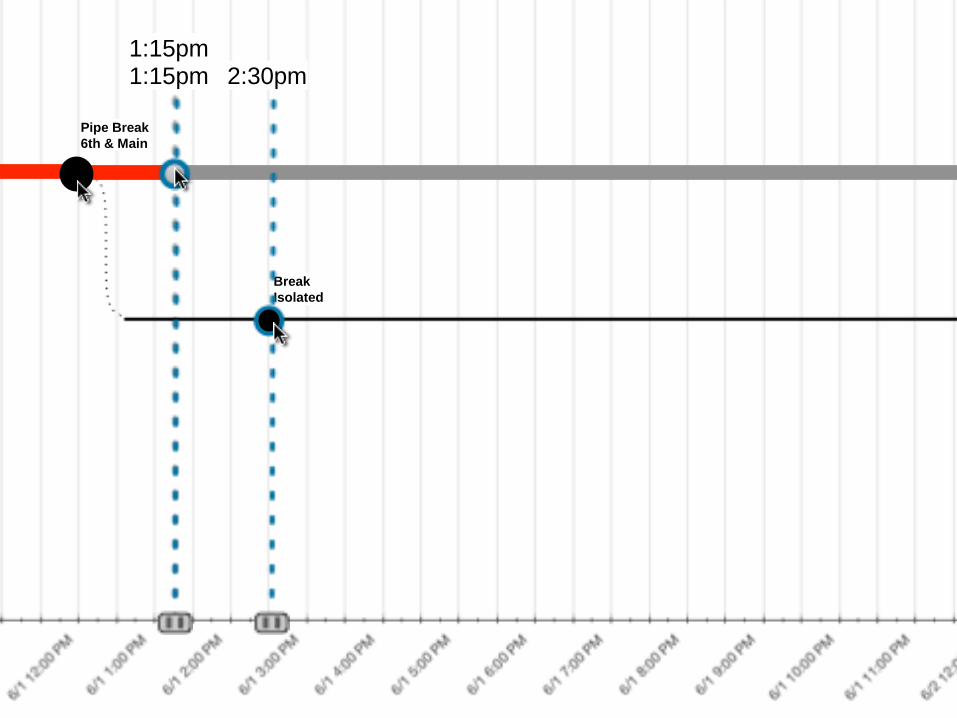
Break
Isolated
Pipe Break
6th & Main
1:15pm 1:15pm
2:30pm
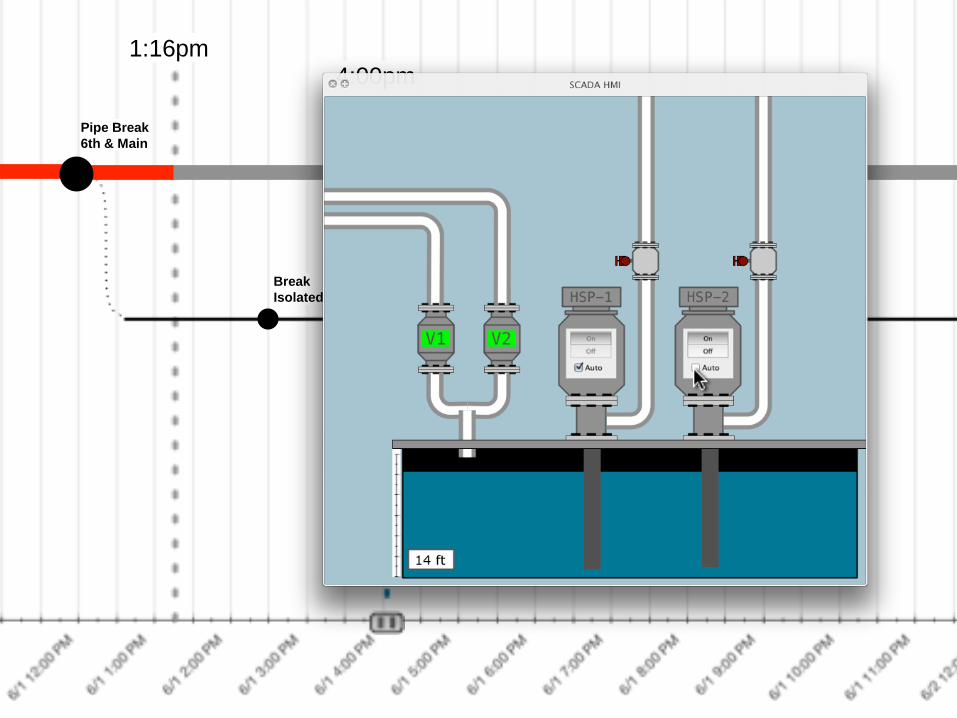
HSP-2
Manual (on)
Break
Isolated
Pipe Break
6th & Main
1:16pm 4:00pm
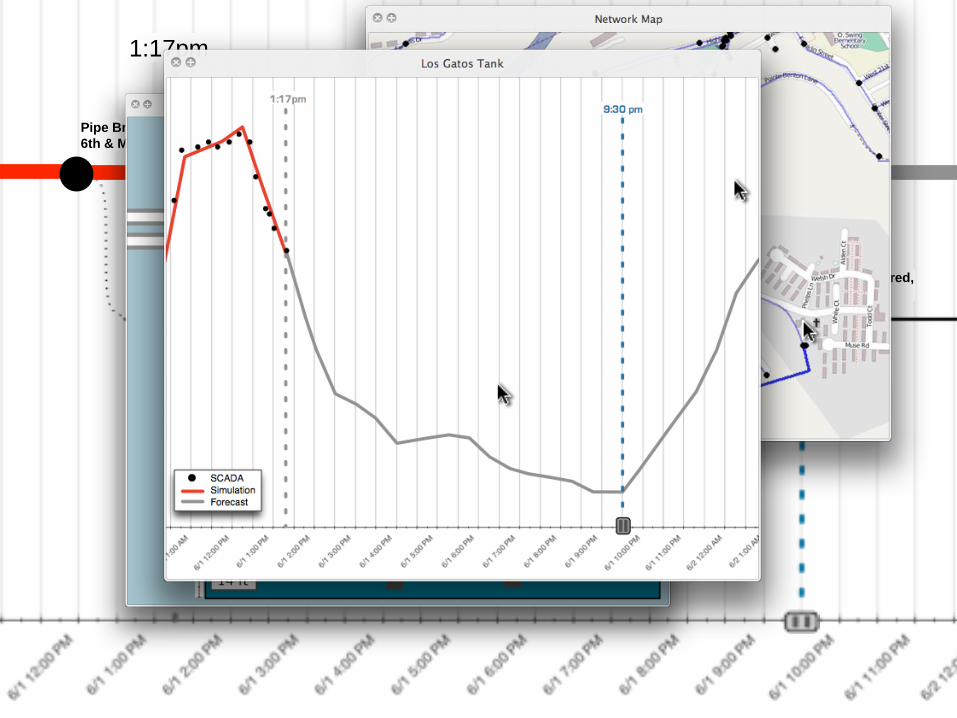
Service Restored,
HSP-2 Auto HSP-2
Manual (on)
Break
Isolated
Pipe Break
6th & Main
1:17pm 9:30pm

Is this practical?

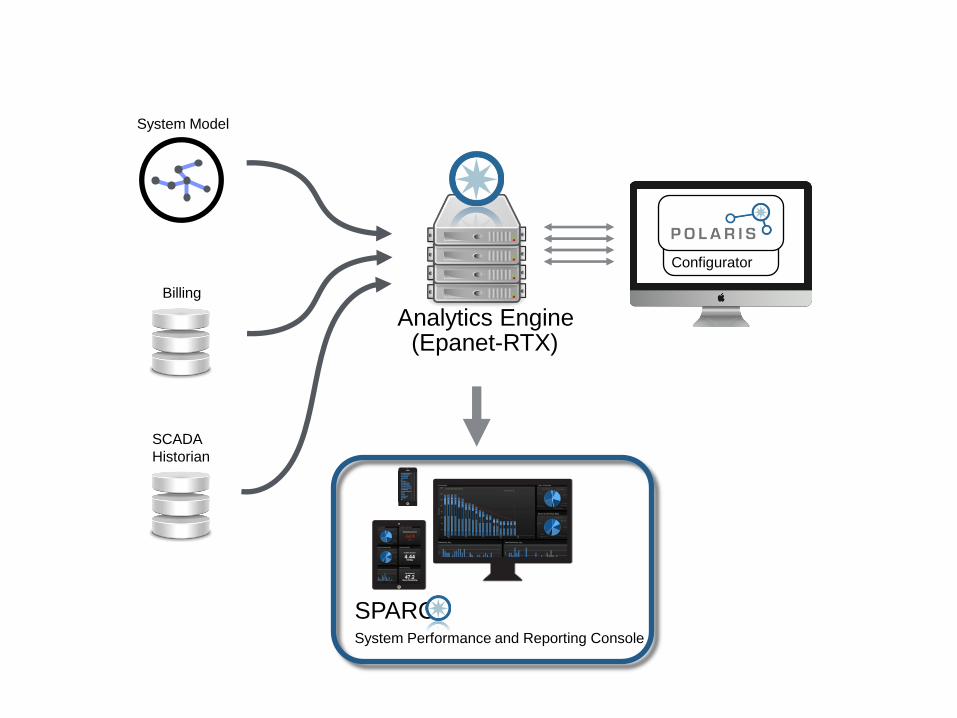
SCADA
Historian
Configurator
Billing
Analytics Engine
SPARC
System Performance and Reporting Console
System Model
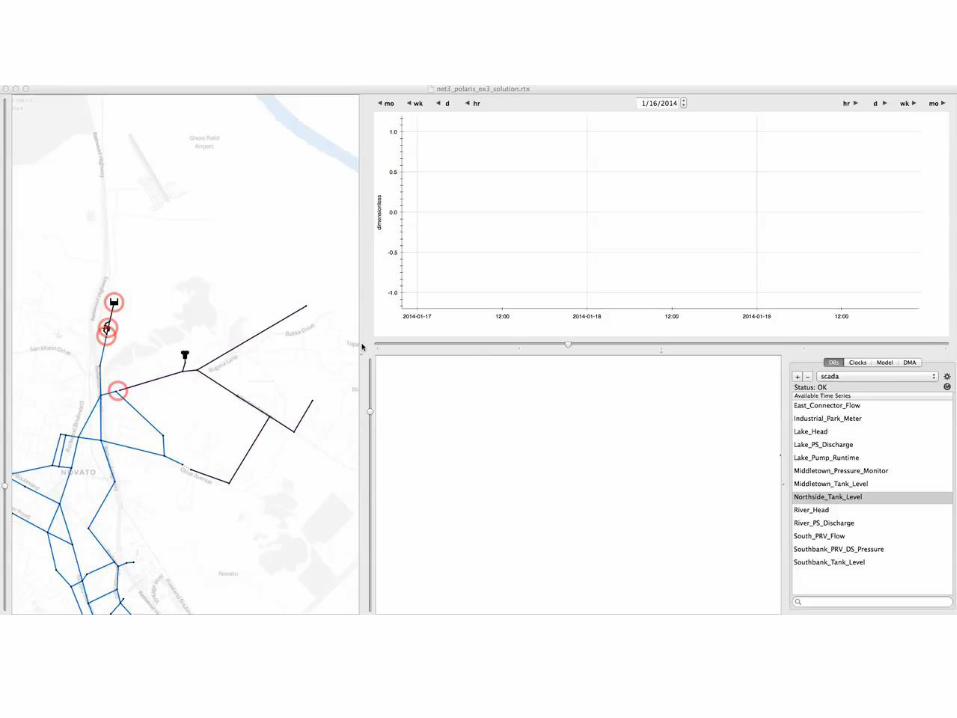
(Epanet-RTX)

SCADA historian infrastructure model
SCADA tags Model IDs
Smooth Time Series Noisy Time Series Transformations
SCADA
Historian
Configurator
Billing
Analytics Engine
SPARC
System Performance and Reporting Console
System Model
(Epanet-RTX)
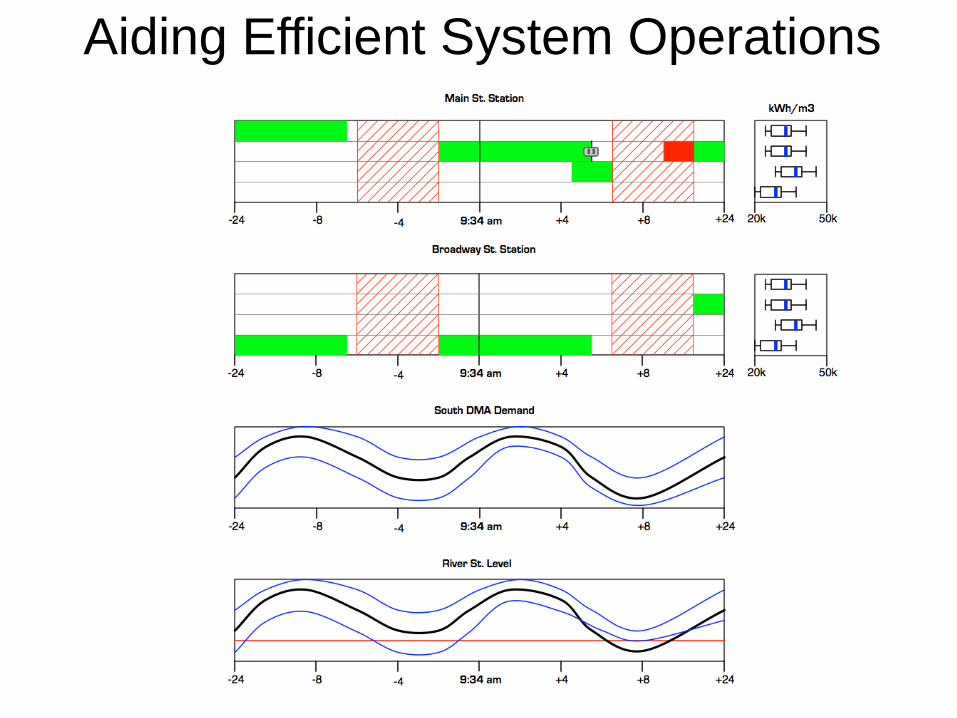
Aiding Efficient System Operations

EPANET
RTX


Summary:
Real-time modeling tools are
available.
Analytics that derive value from
existing data sources should be
anticipated and expected.

Notes:
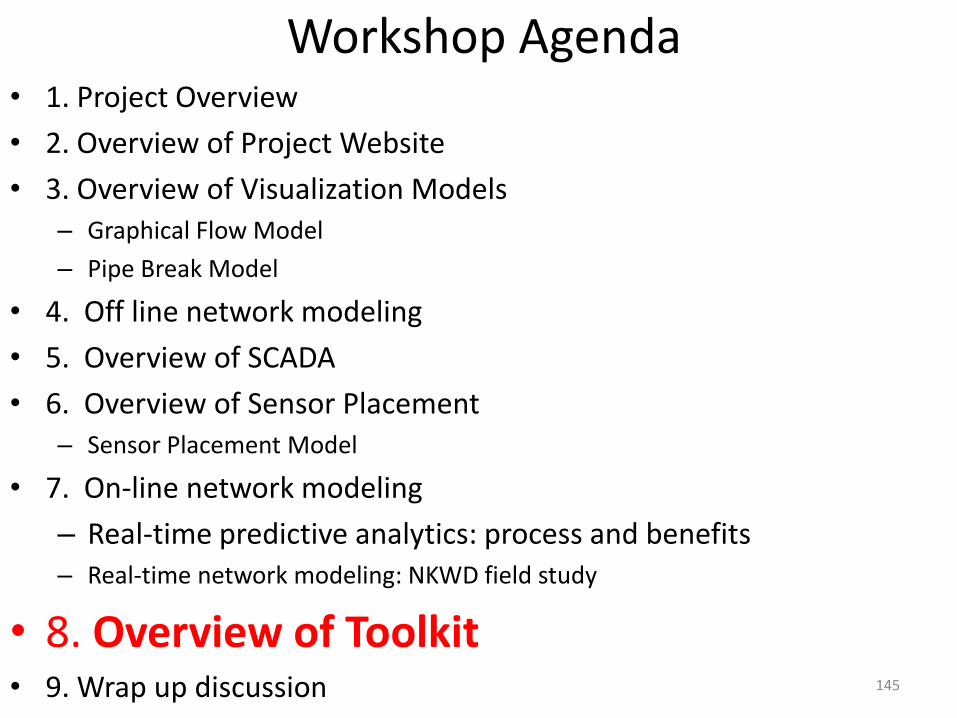
Workshop Agenda • 1. Project Overview
• 2. Overview of Project Website
• 3. Overview of Visualization Models – Graphical Flow Model
– Pipe Break Model
• 4. Off line network modeling
• 5. Overview of SCADA
• 6. Overview of Sensor Placement – Sensor Placement Model
• 7. On-line network modeling
– Real-time predictive analytics: process and benefits – Real-time network modeling: NKWD field study
• 8. Overview of Toolkit • 9. Wrap up discussion 145
146
User Defined
Decisional Process
User Assisted
Decisional Process
User Assisted Decisional Process (toolkit)
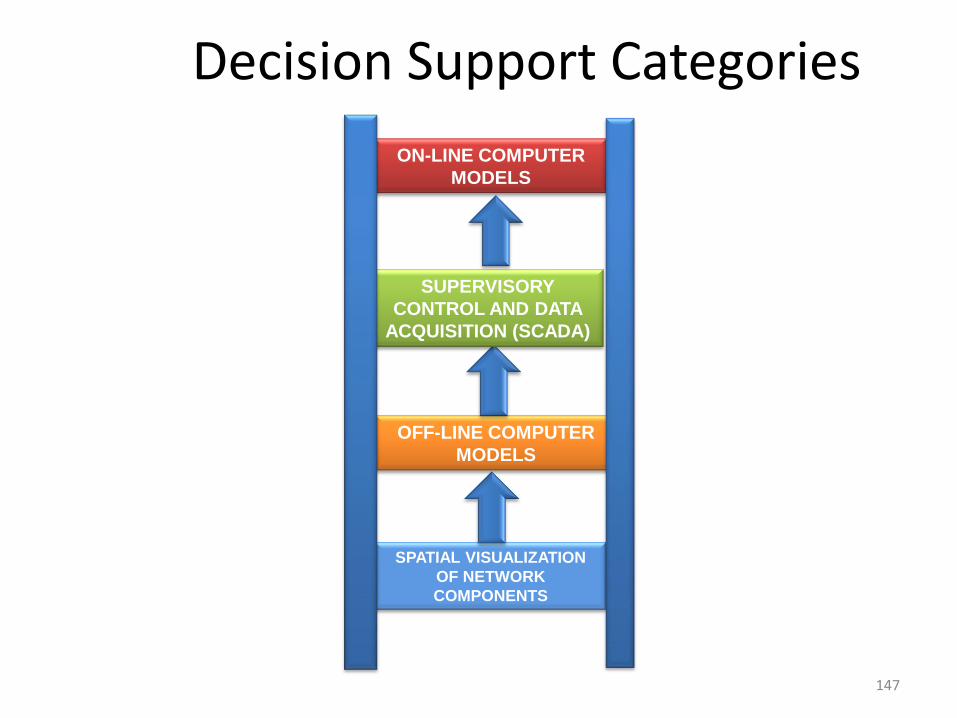
Decision Support Categories
147
SPATIAL VISUALIZATION
OF NETWORK
COMPONENTS
OFF-LINE COMPUTER
MODELS
ON-LINE COMPUTER
MODELS
SUPERVISORY
CONTROL AND DATA
ACQUISITION (SCADA)
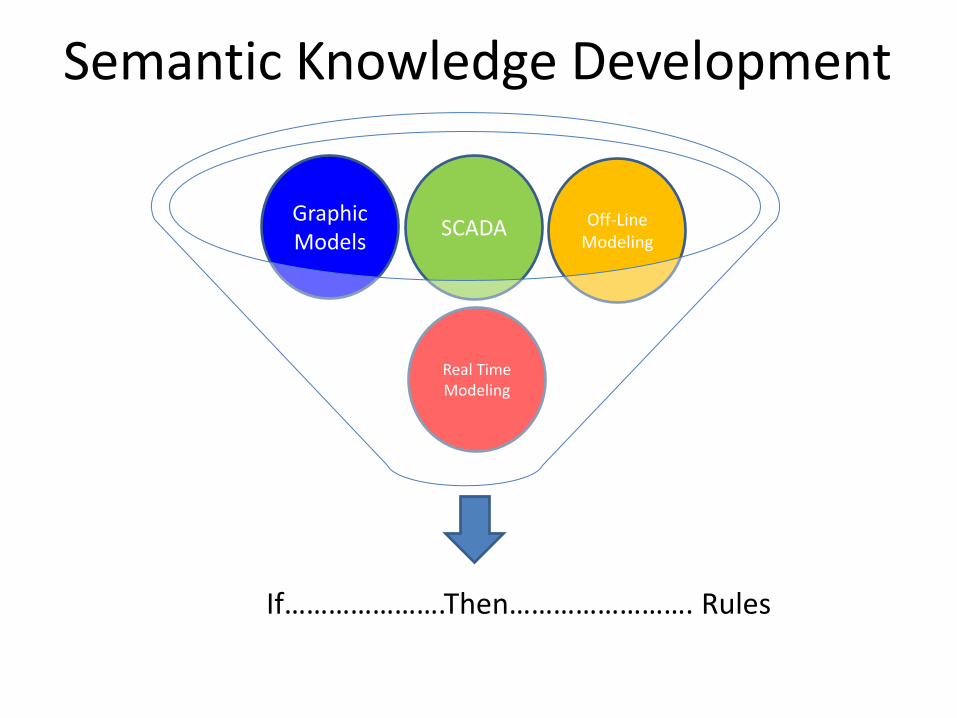
Semantic Knowledge Development
Graphic Models
SCADA
SCADA
S
Real Time Modeling
Off-Line Modeling
If………………….Then……………………. Rules


Workshop Agenda • 1. Project Overview
• 2. Overview of Project Website
• 3. Overview of Visualization Models – Graphical Flow Model
– Pipe Break Model
• 4. Off line network modeling
• 5. Overview of SCADA
• 6. Overview of Sensor Placement – Sensor Placement Model
• 7. On-line network modeling
– Real-time predictive analytics: process and benefits – Real-time network modeling: NKWD field study
• 8. Overview of Toolkit
• 9. Wrap up discussion 157

Questions?
158
Survey • On a scale of 1-9, how important are the following
knowledge databases to your operations? • Information on sensors and telemetry. [ ] • Information on SCADA. [ ] • Information on network visualization. [ ] • Information on sensor placement. [ ] • Information on off-line modeling. [ ] • Information on model calibration. [ ] • Information on water quality modeling. [ ] • Information on real-time modeling. [ ] • What additional content would you like to see added?
159

Survey
• On a scale of 1-9, how likely would you be to use the following models?
– Graphical flow model [ ]
– Decon/pipe break model [ ]
– Sensor placement tool [ ]
– Water quality model [ ]
– Real-time operations [ ]
160
Survey
• How useful was the project presentation?
• What additional information would you like to see?
• What information, if any, do you feel was not necessary?
• What changes could be made to make the presentation more informative or useful to your operations?
161