Embed Size (px)
Citation preview
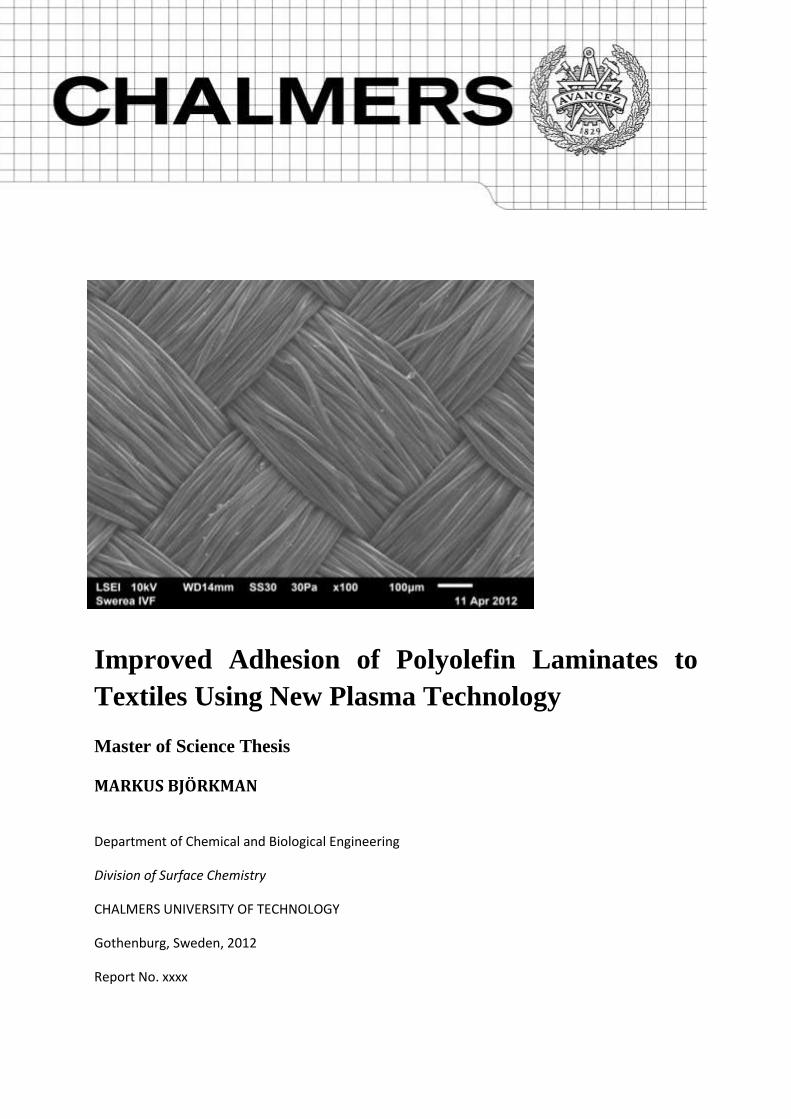
Improved Adhesion of Polyolefin Laminates to
Textiles Using New Plasma Technology
Master of Science Thesis
MARKUS BJÖRKMAN
Department of Chemical and Biological Engineering
Division of Surface Chemistry
CHALMERS UNIVERSITY OF TECHNOLOGY
Gothenburg, Sweden, 2012
Report No. xxxx
2
Master of Science Thesis
Improved Adhesion of Polyolefin Laminates to
Textiles Using New Plasma Technology
Markus Björkman
Examiner: Prof. Krister Holmberg
Supervisor: Dr Philip Karlsson
This work was performed at Swerea IVF AB, Mölndal, Sweden
Department of Chemical and Biological Engineering
Division of Applied Surface Chemistry
Chalmers University of Technology
Göteborg, Sweden 2012

3
Abstract
Coatings and laminates introduce new properties to fabrics, such as improved durability and barrier
properties to gasses and liquids. For the coatings and laminates to work properly the adhesion to the
fabric needs to be good. Today adhesion is obtained by treating the surfaces with different
chemicals, which may be harmful to the environment. In this project it is investigated if plasma
treatment of the surfaces can be employed to increase the adhesion instead.
Atmospheric pressure plasma treatment was used to treat both the textiles and the polymer films
that were used for the lamination. The adhesion was evaluated by peel testing and it was seen that
the plasma treatment enhanced the adhesion several times the original value. However, both the
textile fabric and the polymer film used as laminate need to be plasma-treated to achieve high
adhesion.
Also XPS and SEM have been employed for characterization. From the XPS measurement it was seen
that there was a significant increase in the amount of oxygen groups on the surface after plasma
treatment. This supports the assumption that such functional groups are responsible for the
enhanced adhesion between the fabric and the polymer film. Plasma treatment of a material brings a
lot of energy to the surface. From the SEM pictures taken in this project however, it is concluded that
the plasma treatment can be made without damaging the textile fibers.
The number of functional groups that are introduced on the surface by the plasma treatment will
decrease with time and the surface will eventually go back to its initial state. To investigate how long
this will take, fabrics were plasma-treated and then stored in a room of constant climate for a certain
time, before laminated to the polymer film. From this experiment it was seen that the fabric surfaces
will lose some of their reactivity, needed to obtain high adhesion, but not at a high rate and the
material will still obtain high adhesion if laminated one week after the plasma treatment.
4
Table of contents Abstract ................................................................................................................................................... 2
1 Introduction .......................................................................................................................................... 6
1.2 Aim................................................................................................................................................. 7
2 Theory ................................................................................................................................................... 8
2.1 Fabrics............................................................................................................................................ 8
2.1.1Polyester fabrics ...................................................................................................................... 8
2.1.2 Nylon fabrics ........................................................................................................................... 9
2.1.3 Acrylic fabrics .......................................................................................................................... 9
2.3.4 Cotton ..................................................................................................................................... 9
2.2 Coated and laminated textiles .................................................................................................... 10
2.2.1 Coating and laminating methods ......................................................................................... 10
2.3 Polymer coatings ......................................................................................................................... 11
2.3.1 Polyvinyl chloride ................................................................................................................. 11
2.3.2 Polyurethanes ....................................................................................................................... 11
2.3.3 Acrylics .................................................................................................................................. 12
2.3.4 Elastomers ............................................................................................................................ 12
2.3.5 Polyethylene ......................................................................................................................... 13
2.4 Adhesion ...................................................................................................................................... 14
2.5 Surface tension and surface energy ............................................................................................ 15
2.6 Plasma ......................................................................................................................................... 16
2.6.1 Ageing after plasma treatment ............................................................................................ 17
2.6.2 Plasma treatments ............................................................................................................... 17
2.7 Characterization methods ........................................................................................................... 18
2.7.1 Measurement of adhesion ................................................................................................... 18
2.7.3 Scanning electron microscopy .............................................................................................. 19
2.7.4 X-ray photoelectron spectroscopy ....................................................................................... 19
3 Materials and Method ........................................................................................................................ 21
3.1 Materials used ............................................................................................................................. 21
3.1.1 Fabrics ................................................................................................................................... 21
3.1.2 Polymers ............................................................................................................................... 21
3.2 Methods ...................................................................................................................................... 22
3.2.1 Pressing of the polymer films ............................................................................................... 22
3.2.2 Plasma treatment ................................................................................................................. 22
5
3.2.3 Lamination ............................................................................................................................ 24
3.2.4 The adhesion measurements ............................................................................................... 24
3.2.5 Ageing test ............................................................................................................................ 25
3.2.6 Treatment of plastic powder and fabric at the same time .................................................. 26
3.2.7 SEM analysis ......................................................................................................................... 26
3.2.8 X-ray photoelectron spectroscopy ....................................................................................... 26
4 Results/discussion .............................................................................................................................. 27
4.1 Results of the peel test for plasma treated fabrics ..................................................................... 27
4.1.1 Colored fabric ....................................................................................................................... 27
4.1.2 Uncolored fabric ................................................................................................................... 28
4.2 Result of the peel test for the plasma treated polymer films laminated to untreated fabric .... 29
4.3 Result of the peel test when both films and fabric have been treated ...................................... 30
4.4 Result from the peel test when other gases than He has been used ......................................... 31
4.5 Result of the peel test when treating fabric together with a polymeric powder ....................... 33
4.6 Ageing results .............................................................................................................................. 34
4.7 SEM pictures ................................................................................................................................ 35
4.8 XPS results ................................................................................................................................... 36
5 Conclusion .......................................................................................................................................... 40
6 Future work ........................................................................................................................................ 41
7 Acknowledgements ............................................................................................................................ 42
8 References .......................................................................................................................................... 43
9 Appendix ............................................................................................................................................. 45
6
1 Introduction
The Swedish textile industry face some big challenges, companies in Asia and other parts of the world
can often produce the same products but at a lower cost. In order for the Swedish textile industry to
compete they need to focus on advanced materials of high quality. It is then important to find
improved ways of production. Plasma treatment is one such technique that has the potential of
improving textile materials without a big increase in production cost.
Plasma technology has been used for about 60 years but then as a vacuum technique where the first
area of application was surface treatment within the microelectronics industry. The reasons for this is
that only batch-wise production is possible and because the energy and equipment needed to reach
and maintain the low pressure, makes this technique complicated to use in a continuous process.
However, in recent years atmospheric pressure plasma has been developed into a new and
promising technique for surface treatment. In atmospheric pressure plasma there is no need for
vacuum making it possible to use in a continuous process for surface treatment of materials such as
textiles and paper. The technique is also possible to directly introduce into today’s production.
However, more research is needed to investigate how the technique best is utilized to improve the
performance of the textile. One promising field of application is adhesion enhancement of coating
and laminates.
For many textiles a coating or laminate is applied in order to improve the material properties,
chemical resistance, appearance and waterproofing. A good coating or laminate needs to have good
adhesion to the textile, or the coating will fall off. To achieve a good adhesion between the applied
coating or laminate and the fabric the fabric surface is generally treated by chemicals, which are
applied as a solution, making it necessary to dry the fabric after the chemical treatment. This process
is expensive, since a lot of chemicals and energy are used. If instead a plasma technique could be
used the need for chemicals would be reduced, and since plasma is a dry technique there would be
no need for drying.
Another problem with the coatings and laminates used today is that a lot of chemicals need to be
added to the polymer to make a useful coating. One such example is poly vinyl chloride (PVC) which
is a common polymer in coatings. The PVC used for coatings and laminates contains a lot of
plasticizers which are harmful to the environment. Therefore, it would be a significant advantage if
plasma could make it possible to use plastics which are less harmful to the environment but still
cheap and easy to use.
There are however some challenges related to plasma treatment, one is the ageing of the surface
after the treatment. After surface activation by plasma the material will relax and go back to its
normal, low-energy state. How long this relaxation takes is affected by the plasma parameters and
the material treated, and must be investigated in each case. Other challenges are about optimization
of the plasma parameters, such as gas type, power and exposure time etc. Another concern is that
plasma treatments have the potential of harming the surface of the fabric if too much energy is
added to the surface. Hence, the plasma parameters need to be optimized in order to achieve the
desired effect of the treatment without harming the fabric surface.

7
1.2 Aim This project aims to use atmospheric plasma treatment to improve the adhesion between a synthetic
textile fabric and a polymer film based on ethylene. A first step of the project will be to investigate if
the plasma treatment can improve the adhesion. The treatment will then be optimized to improve
the adhesion without harming the surfaces of the materials. Finally, the aging of the plasma-treated
surfaces will be investigated.
8
2 Theory
2.1 Fabrics Different materials can be used for the production of fabrics. The first fiber used for textile
production and the most important even today is cotton.
Nowadays there exist not only natural fibers such as cotton but also synthetic fibers. Examples of
synthetic fibers are nylon, polyester and acrylic fibers. All of these synthetic fibers are polymers
produced from petroleum products. Depending on the desired properties of the final product
different fibers should be used. Synthetic fibers of infinitive length are called filament fibers. The
fabric used in this project was produced from polyester fibers of filament yarn. [1]
2.1.1Polyester fabrics
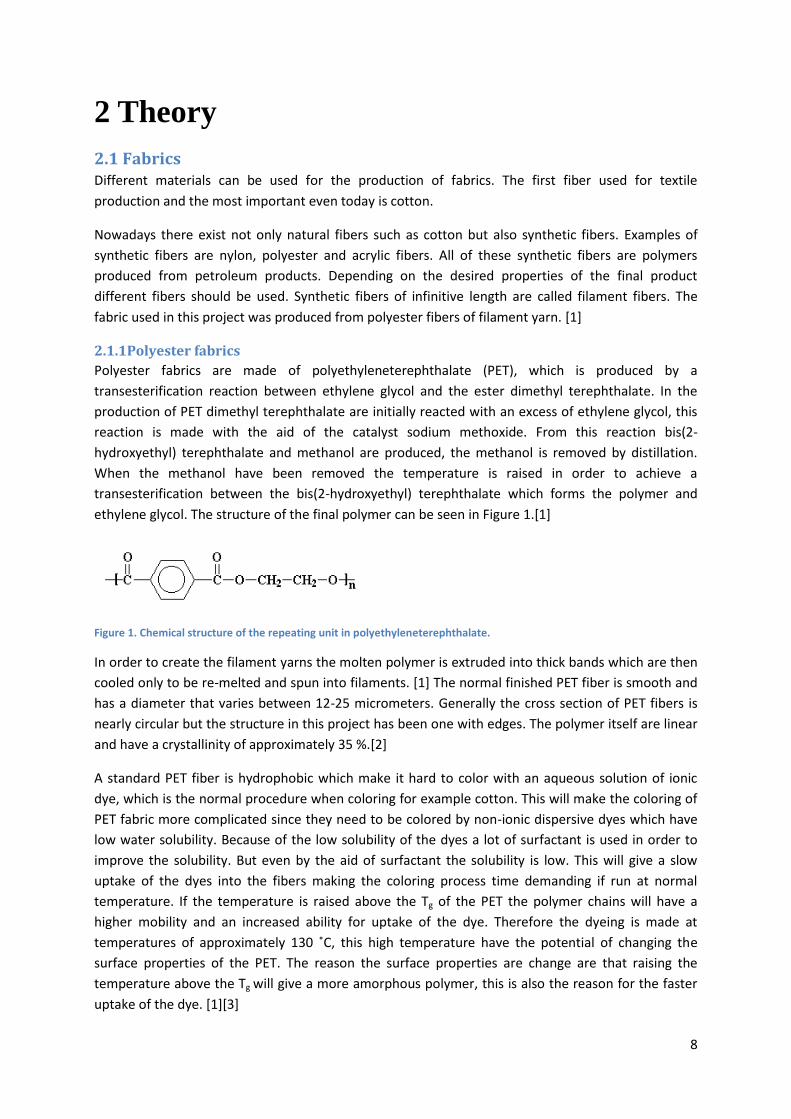
Polyester fabrics are made of polyethyleneterephthalate (PET), which is produced by a
transesterification reaction between ethylene glycol and the ester dimethyl terephthalate. In the
production of PET dimethyl terephthalate are initially reacted with an excess of ethylene glycol, this
reaction is made with the aid of the catalyst sodium methoxide. From this reaction bis(2-
hydroxyethyl) terephthalate and methanol are produced, the methanol is removed by distillation.
When the methanol have been removed the temperature is raised in order to achieve a
transesterification between the bis(2-hydroxyethyl) terephthalate which forms the polymer and
ethylene glycol. The structure of the final polymer can be seen in Figure 1.[1]
Figure 1. Chemical structure of the repeating unit in polyethyleneterephthalate.
In order to create the filament yarns the molten polymer is extruded into thick bands which are then
cooled only to be re-melted and spun into filaments. [1] The normal finished PET fiber is smooth and
has a diameter that varies between 12-25 micrometers. Generally the cross section of PET fibers is
nearly circular but the structure in this project has been one with edges. The polymer itself are linear
and have a crystallinity of approximately 35 %.[2]
A standard PET fiber is hydrophobic which make it hard to color with an aqueous solution of ionic
dye, which is the normal procedure when coloring for example cotton. This will make the coloring of
PET fabric more complicated since they need to be colored by non-ionic dispersive dyes which have
low water solubility. Because of the low solubility of the dyes a lot of surfactant is used in order to
improve the solubility. But even by the aid of surfactant the solubility is low. This will give a slow
uptake of the dyes into the fibers making the coloring process time demanding if run at normal
temperature. If the temperature is raised above the Tg of the PET the polymer chains will have a
higher mobility and an increased ability for uptake of the dye. Therefore the dyeing is made at
temperatures of approximately 130 ˚C, this high temperature have the potential of changing the
surface properties of the PET. The reason the surface properties are change are that raising the
temperature above the Tg will give a more amorphous polymer, this is also the reason for the faster
uptake of the dye. [1][3]

9
2.1.2 Nylon fabrics
Nylon was the first synthetic fiber to be produced and it exists in several forms, where nylon 6.6 and
nylon 6 are the most abundant. The name nylon is a trade name, the chemical name is polyamide.
Nylon 6 and nylon 6.6 are both polyamides but produced in slightly different ways giving different
structure of the polymer chains and therefore also different properties of the finished polymer. [1][2]
Nylon 6.6 is produced by heating a mixture between the salt of adipic acid and hexamethylene
diamine in a concentrated aqueous solution in the presence of a some acetic acid. When most of the
hexamethylene diamine has reacted most of the water is removed by distillation. The mixture is then
heated in a nitrogen atmosphere to about 280 ˚C, the reason a nitrogen atmosphere is used is to
prevent oxidation. The obtained polymer is finally extruded and cut into chips from which the
filaments can be created.
Nylon 6 is produced in a similar way to nylon 6.6 but from caprolactam instead of hexamethylene
diamine and adipic acid. For the rest of the polymerization the process is basically the same. There is
however a differens when it comes to the production of the filament from the polymer. Since nylon 6
has a lower melting point than nylon 6.6 the filament can be created directly from the polymerization
reactor.
For a comparison, the repeating units of nylon 6.6 and nylon 6 are shown I Figure 2.
Figure 2. Chemical structure of the repeating units of nylon 6 and nylon 6,6.
2.1.3 Acrylic fabrics
Acrylic fabrics are made from the polymer polyacrylonitrile (PAN), which is also a common polymer in
coatings. PAN is described further in section 2.3.3.
2.3.4 Cotton
Also cotton can be considered to be a polymer, the difference is that cotton comes from cellulose
which is the basic building stone for all vegetation. Therefore the cellulose used for cotton fabric
production is not produce by man but is a naturally occurring material that is harvested and spun
into fibers.
Cotton comes from the seed pod of the plant family Gossypium, where the cotton fibers grows out
from the seeds in the closed pod. When the pod burst and the seeds are released the fibers will stay
and after a while dry out where-after they can be harvested and used for the production of cotton
fabrics. [1]

10
2.2 Coated and laminated textiles For as long as man have been wearing clothes made from fabrics there has always been the need for
improving properties such as water and wind proofing. For examples the Maya Indians began to
improve their fabrics by applying the sap from the rubber tree onto the fabric and then dry it.
However, to find the beginning of the modern form of coating and laminating industry one has to go
all the way up to 1823 when Charles Macintosh patented the first raincoat. This first raincoat was
made by applying rubber dissolved in naphtha between two pieces of cloth which was then dried for
evaporation of the naphtha creating a rubber film in between the two cloth pieces. [4][5]
The fabrics created this way had several disadvantages. One was the smell of the fabric, but the
fabrics were also uncomfortable to wear and the rubber film had a tendency to soften and melt in
hot weather. New ways of production and the use of new materials soon made the fabrics better and
today the techniques and materials used are quite different from the one used by Macintosh in
1823.[4][5]
2.2.1 Coating and laminating methods
Textile materials can be coated or laminated with a polymer for a number of reasons such as increased resistance to soling and penetration of liquids and gases, improvement of abrasion resistance, but it can also be made for esthetic reasons. Hence, a coating is made in order to introduce new properties to the fabric. [4][5] The coating can be made by several different methods and the method used depends on several factors such as the polymer used, what kind of fabric the coating is applied on, how the end product are to be used and for economic reasons. The methods used to coat a textile fabric can be divided into two main groups which are fluid coating and dry coating. [4]
Fluid coating
In fluid coating the polymer is applied as a solution to the textile where-after the solvent are
evaporated and the polymer is solidified into a film. There are several different techniques to apply
the polymer solution and also many different machines can be used. A general structure for a fluid
operation involves four steps. The first is the fabric let-of arrangement where the fabric is drawn
under uniform tension. The second step is application and spreading of the polymer solution on the
fabric surface from the coating head, to achieve an even polymer film with the desired thickness.
There exist many different methods to achieve the correct thickness of the coating they are however
outside of the scope of this report and are therefore not explained here but the interested reader
can find them in [4][5] and [6]
The third step is the drying oven where the coating is solidified and all the solvent are evaporated in
order achieve a polymer film. The fourth and final step is the winding section where the fabric is
cooled and winded up on rolls. [4]
Dry coating
In the dry coating process, no solvents are used in the application of the polymer. One simple
application method is melt coating where the polymer is melted and applied onto the fabric where-
after it is cooled to solidify. Another method for dry coating of plastic films is lamination where the
plastics are first made into a film with a certain thickness which is then laminated onto the fabric by
means of heat or certain chemicals, called adhesives. [4]
11
Lamination can be seen as a special case since an already prepared film is applied to the substrate.
Therefore a distinction is sometimes made between coating and laminating. The final product is
however often called a coated product.
2.3 Polymer coatings The main polymers used for polymer coatings and laminations of textiles today are polyvinyl chloride
(PVC), polyurethanes, acrylics and rubbers [5]. These polymers will here be briefly explained and also
polyethylene (PE), which is the polymer of choice in this project. PE however, is not frequently used
in coating and laminations.
2.3.1 Polyvinyl chloride
Polyvinyl chloride (PVC) is polymerized from the monomer vinyl chloride CH2=CH-Cl by a free radical
polymerization mechanism. The monomer vinyl chloride has been found to be toxic in large dosages
and standards have been set for the exposure levels of the monomer. These exposure levels include
exposure during the polymerization but also on the amount of monomer residue left in the final
product. Thanks to these standards the amount of monomer residue in PVC is today close to zero.
[4][7]
PVC is usually produced by suspension polymerization but solution, emulsion and bulk
polymerization techniques can also be used. The product is normally atactic, independent of the
polymerization technique, but also isotactic and syndiotactic PVC can be made. The combination of
an atactic polymer chain with the relative bulkiness of the chlorine atom will give a highly amorphous
polymer with about 10% crystallinity. The bulkiness of the chlorine atom also makes the polymer
more sensitive to solvents compared to similar polymers such as polyethylene. This sensitivity is used
in the production of PVC products since the addition of certain solvents, called plasticizers, will
significantly change the properties of PVC. The most common plasticizers used for PVC are
phthalates. Phthalates is toxic and can cause some serious health problems such as cancers and
damages to kidneys or the reproductive system of mammals. Addition of plasticizers will give a softer
and more flexible polymer, this form of PCV is normally called soft PVC. Without the addition of the
plasticizers the polymer will be harder and more rigid and is therefore called rigid PVC. For coating
and lamination of textiles the soft PVC is used. [4][7][8]
A general property of PVC is that it is sensitive to degradation by both heat and light. If degraded,
the polymer will release hydrochloric gas, which is corrosive and toxic. Stabilizers must therefore be
added to PVC in order to increase the lifespan of the polymer. The release of HCL gas when degraded
also makes PVC self extinguishing when exposed to a fire, a property that makes PVC suitable for
many applications where there is a risk of fire. [4][7]
2.3.2 Polyurethanes
Polyurethanes are a family of polymers that is formed by the interaction between diisocyanates and
diols. The general reaction for forming polyurethane is: [9]
OCN-R-NCO + HO-R1 –OH (-O-R1-O-CO-NH-R-NH-CO-)n
The reaction mechanism can be seen as a step growth reaction since two monomers react in a head
to tail manner except that no condensate is formed, differentiating it from a normal step growth
polymerization. The reaction is often made in two steps where the first are the production of a

12
prepolymer by a reaction between diisocyanate and dihydroxy-terminated short-chain polyether or
polyester. In this first step the diisocyanate is used in excess to ensure isocyanates end–capped
blocks. These prepolymers are then chain extended by reaction with a diol. [9]
Since the groups R and R1 as seen in the above reaction can be varied, the properties of the polymer
changes accordingly . This gives a polymer that can be designed for many different applications and
the use of polyurethanes is therefore wide. [7]
Advantages of using polyurethanes as material for coatings and laminates compared to other
polymers include: high toughness, abrasion resistance, flexibility, fast curing and good chemical
resistance. Many polyurethanes is however sensitive to UV, humidity and certain temperatures and
are therefore unsuitable for some coating and lamination applications. [7]
2.3.3 Acrylics
The monomers used in creating the acrylic polymers are esters of acrylic and methacrylic acid. The
chemical structure of an acrylic ester can be seen in Figure 3.[4]
Figure 3. structure of an acrylic ester.(figure redrawn from [4])
Acrylic polymers are created in a free radical polymerization mechanism. For the acrylic group two
main polymers are created, namely Polymethyl methacrylate (PMMA) and polyacrylonitrile (PAN).
The properties of these polymers differ significantly, PMMA is a hard and rigid polymer with excellent
optical clarity and PAN is mainly used as a fiber or for creating copolymers with other polymers.
Mixing of those two monomers creates copolymers that obtain flexibility and softness according to
the ratio between the monomers. [4][7]
Acrylic polymers can be produced by bulk, suspension, solution and emulsion polymerization
techniques. When the polymer is to be used as a coating or laminate the normal production
techniques are emulsion and solution polymerization. Acrylic coatings have excellent resistance to
UV, heat, ozone and chemicals. [4]
2.3.4 Elastomers
Rubbers or elastomers, which is a more suitable name of this material group, are materials that are
highly elastic. Elastomers can be elongated several times their original length and directly retracted
when the tensile stress is released. [9] The property of elastomers to be stretched and their direct
retraction is mainly due to entropic effects. In their outstretched state the polymer chains will be
highly ordered which is unfavorable in terms of entropy and the material will therefore retract, giving
a less ordered state with higher entropy. [9]
The first elastomers discovered and used was natural rubber which have the chemical name cis-poly
isoprene. The first use of natural rubber was by the Maya Indians who used it as a coating to
13
waterproof clothing and footwear. The Maya Indians obtained this rubber by drying the sap from the
rubber tree (Hevea braziliensis). The poly isoprene obtained by this method only contains the cis-
form while the synthetically produced poly isoprene will also contain some amount of trans poly
isoprene making the synthetically produced poly isoprene somewhat harder to process. [7]
Today there are many different elastomers used for coating and laminations. Apart from poly
isoprene, a few of those are styrene–butadiene rubber (SBR), poly chloroprene rubber (CR), nitrile–
butadiene rubber (NBR) and silicone rubber. Those elastomers have different properties and hence,
are useful in different applications [4]
All elastomers are used above their Tg and are amorphous. If the temperature is lowered below the
Tg of the polymer it will become more rigid and will no longer function as an elastomer. Many
elastomers are also slightly cross-linked something that may seem counterintuitive since crosslink’s
normally provides a higher stiffness and strength in a polymer, making it more rigid. This is to some
extent also true for elastomers, but if the crosslink’s are few enough they may give the elastomers a
higher strength without affecting the materials ability to elongate. This since there will be many
atoms in-between every crosslink and therefore the material will still be able to elongate, making it
suitable for a wider range of applications. Elastomers are crosslinked in a process called
vulcanization. . [7][9]
2.3.5 Polyethylene
Polyethylene (PE) is produced from the monomer ethylene CH2=CH2 and is the simplest polymer
available, consisting only of only carbon and hydrogen. Polyethylene is also the most common
polymer used and can be found in applications such as plastic bags, packaging film, children’s toy and
many other. The main reasons for the widespread use of polyethylene are that it is cheap to produce
and easy to process. Another advantage of polyethylene is that the temperature needed to process
polyethylene into its final shapes is low, keeping the energy consumption at a low level. [7] [10]
Polyethylene can be found in many different forms and the three main types are high density
polyethylene (HDPE), low density polyethylene (LDPE) and linear low density polyethylene (LLDPE).
All of these various forms of polyethylene will differ in their general properties and it is important to
use the right type of polyethylene for the right application. The main difference between these
various forms of polyethylene is the amount of side chains present in the molecule. [7] [10]
In HDPE the amount of side chains is low making it possible for the polymer chains to pack close
together which gives a material with a high density. HDPE is therefore more rigid and harder
compared to LDPE and LLDPE. To produce HDPE a catalyst is required since the temperature and
pressure must be kept low to avoid chain branching during the polymerization process. [7] [10]
LDPE contains a lot of side chains giving a material with a lower density compared to HDPE, this since
the side chains will prevent close packing of the polymer chains. LDPE is the easiest type of PE to
produce and was also the first type of PE discovered. For the production of LDPE the temperature
and pressure can be higher compared to the production of HDPE reducing the need for a catalyst.
Properties of LDPE include good flexibility, low water absorption and good resistance to chemicals
and weather. [7] [10]
14
LLDPE is similar to LDPE in that it contains a lot of side chains, these side chains is however shorter in
LLDPE compared to the side chains found in LDPE. The side chains in LLDPE will prevent close packing
of the polymer chains giving a lower density compared to HDPE, however since the side chains are
short the polymer will have a linear structure similar to HDPE. LLDPE can be seen as a mixture
between HDPE and LDPE and its properties are also somewhere in between those of HDPE and LDPE.
To make the short side chains of LLDPE a co-monomer is added during the polymerization. These co-
monomers consist of a short carbon chain (normally 2-6 carbons) with a double bound between the
first and second carbon. The co-monomers will bind to the polymer chain, creating the short side
chains necessary to produce LLDEP. For production of LLDPE a catalyst is used, as in the case of HDPE.
[7] [10]
2.4 Adhesion Adhesion is the ability of two different materials to stick together, by mutual interactions and
formation of chemical bonds. Adhesion is important for most applications where two surfaces are
joined together. For applications such as painting and coating it is important to have as high adhesion
as possible but for some applications such as lubrication it is instead important to have as low
adhesion as possible. [4][11]
There are four main mechanisms that contribute to the total adhesion between two polymer
materials and those are mechanical interlocking, interdiffusion of chains, electrical interactions and
chemical interactions. [4][11]
Mechanical interlocking states that an adhesive will adhere more strongly to a rough surface than
one that is completely smooth. This is because if a surface is rough the adhesive can penetrate into
the pores and then lock mechanically to the surface. Mechanical interlocking are however a bit
controversial and some mean that it is not a valid theory since there are experiments showing that
an increased roughness of a surface in some cases can decrease the adhesion. This is however
dependent on the materials used and for some materials the mechanical interlocking can be
important for achieving a good adhesion. [4][11][12]
Interdiffusion of chains are the interaction between different polymer chains. If the polymers are
above their Tg, segments of long polymer chains can diffuse into the other polymer moiety. This
theory however only applies to the case when both moieties are polymers and their compatibility is
high enough. [4][11]
Electrostatic attraction is the effect that similar charges will repel each other while charges with
different signs will attract each other. This is a well known fact and if dealing with surfaces of
different charges the electrostatic interaction will contribute to the adhesion. But also the opposite
effect can be found if two surfaces with the same charge are put together, in this case the
electrostatic effect will lower the adhesion. [4][11]
The fourth and final form of adhesion is the chemical interactions. In the case of chemical
interactions there are many different forces that contribute to the adhesion such as London
interactions, dipole-dipole interactions, dipole induced dipole interactions, hydrogen bonding and
chemical bonding (covalent bonds). [4][11][12] Another chemical interaction that affects the
adhesion is the acid/base character of the surfaces which is a polar interaction. [13]

15
All of these interactions have to be considered to achieve good adhesion but generally it is the
chemical interactions that play the biggest roll in how strong an adhesive will adhere to a substrate.
It is also only the chemical interactions that are applicable to all surfaces, the other mechanisms are
more or less special cases that can have some effect for some materials but not for all. The chemical
interactions are also the strongest and in order to create a coating or laminate with strong adhesion
to the substrate chemical interactions are preferable.
2.5 Surface tension and surface energy Achieving a strong interlaying bonding between two materials is central to achieve a good adhesion
as was explained in the previous section. Achieving this strong interlaying bonding between two
surfaces is strongly dependent on the interlaying strength of the two surfaces. The interlaying
strength is called surface tension for a liquid and surface energy for a solid and is here shortly
explained. To achieve high adhesion, the joined materials need to have high surface energies. [6]
The surface tension is what gives liquids the ability to form drops, and is central when it comes to the
wetting of a surface. The surface tension occurs because the attractive forces between the molecules
of the liquids is stronger compared to the forces between the liquid molecules and the surrounding
medium. Depending on the strength of these forces, different surface tensions will occur. A good
example where strong forces are present is in water, since water has the capability of forming
hydrogen bonds. The great number of hydrogen bonds and the high polarity of a water molecule will
give a liquid with a high surface tension. If this is compared to ordinary oil where no hydrogen bonds
can be formed and the molecular structure is non-polar the difference in surface tension is
significant. [14]
The explanation above has focused on the surface tension of liquid, for a solid the case is somewhat
different. A solid surface is defined as portions of matter able to withstand stress without
deformation. Therefore the methods used to measure the surface tensions of liquids cannot be used
for solids. The surface energy of a solid not only depends on the interaction between the molecules
at the surface and the bulk of the material, but also on functional groups present on the surface. The
easiest way to measure the surface energy of a solid is by measuring the contact angle between
liquids with known surface tensions and the solid surface. [11][14]
Measuring surface energy of a solid surface is, easiest done by contact angle measurement and the
procedure used is explained below.
Figure 4. Contact angle between a liquid and a solid surface.
The contact angle θ between a liquid and a solid surface is illustrated in Figure 4. The surface energy
of the solid can be calculated by the use of Youngs equation:
16
γSG-γSL=γLG*cosθ
In Youngs equation γSG is the interfacial tension between the solid and the gas, γSL is the interfacial
tension between the solid and the liquid and γLG is the interfacial tension between the liquid and the
gas (surface tension). By plotting cos θ against the surface tension (Zisman plot) one will get a
straight line and the point where the line cuts the cos θ=1 is the critical surface energy of the
solid.[11] [14]
The spreading of a liquid on a surface requires that the surface energy of the solid is higher than the
surface tension of the liquid. It is thus important to achieve as high surface energy as possible to
ensure a good spreading of a coating on a substrate. [14]
2.6 Plasma Plasma was explained by Faraday as the fourth state for matter even though Faraday called this state
radiant matter instead of plasma. [15] Plasma is simply ionized gas existing of electrons, ions and
neutrals in excited states. Plasmas are electrically conductive and free charges exist but seen from a
macroscopic view all plasmas are electrically neutral and is therefore said to be quasineutral. Plasma
is the most common state in the universe and approximately 99% of the matter is in the plasma
state. [16] For technical applications the plasma is created by an electrical discharge where a gas is
led in between two electrodes. A high voltage over the electrodes generates a gas discharge and
thereby a plasma is created.
Plasmas can be divided into two different forms, one is the local thermodynamic equilibrium plasma
denoted LTE. The LTE plasma is in thermal equilibrium and both the electrons and the more heavy
particles have the same temperature, this will give a high overall temperature of the plasma.
Because of the high temperatures of the LTE plasma it is often called hot or high temperature
plasma. For surface treatment of textiles LTE plasma is useless since the plasma would burn the
fabric as soon as they come into contact. But for applications such as welding or plasma cutting the
LTE plasma is excellent. The form of plasma used in this project is the non-local thermodynamic
equilibrium plasmas, denoted non-LTE plasma. In non-LTE plasmas the electrons and the heavier
particles are not in thermal equilibrium giving the electrons one temperature and the heavier
particles another where Te>>Th. This gives the effect that even though the electrons have a high
temperature the total temperature of the plasma can be kept low since the heavy particles have a
much lower temperature and due to their heavier weight gives the main contribution to the overall
temperature. [16]
In order to produce non-LTE plasmas the feeding power supply must have a low density or be pulsed.
The plasma will then be prevented from reaching equilibrium. [16]
A plasma treatment can essentially change a material surface in two different ways. The first is
removal of particles from the surface. This will lead to cleaning, sterilization and etching of the
surface. [17]
Plasma treatments can also introduce particles on surfaces. One typically speaks of three different
effects: activation, functionalization, and finishing/coating. [17]

17
Activation of a surface is made by temporarily increasing its surface energy. This is made by the
incorporation of oxygen-containing groups such as –OH, =O and –COOH onto the surface. This is the
desired effect of the plasma treatment in this project. The oxygen bound to the surface in this way is
however un-stable and will orient into the bulk of the material with time. This process is called
ageing and is explained in section 2.6.1 [17]
In functionalization specific chemical groups is permanently grafted to the surface of the material.
One example of functionalization of a surface is the introduction of nitrogen-based groups onto the
surface creating a permanent primer layer. This is essentially done by the use of nitrogen as process
gas in the plasma treatment. [17]
Plasma finishing/coating is the deposition of a thin layer or coating of a specific material onto the
surface. This is done by using a plasma device in combination with a liquid evaporator, to vaporize a
liquid precursor directly into the plasma field; the precursor is applied to the surface in situ.
Depending on the precursor chosen several different surfaces can be created. [17]
2.6.1 Ageing after plasma treatment
The improved adhesion achieved by plasma treatment comes from the creation of new functional
groups on the material surface. These functional groups will increase the surface energy of the
material and interact with other surfaces creating an enhanced adhesion. However since everything
in nature wants to have as low energy as possible these new functional groups bounded to the
surface will eventually reorient into the bulk of the material and the effect of the plasma treatment
will therefore decrease with time. Depending on which functional groups that are present on the
surface the aging time will vary and in order to use plasma for the activation of a surface it is
essential to know how long after the treatment the surface can be coated or laminated. [17]
2.6.2 Plasma treatments
Two different forms of non-LTE plasma treatments exists, vacuum plasma and atmospheric pressure
plasma treatment. The plasmas created by these techniques are basically the same, the difference
lies in how the plasma is created.
Vacuum or low pressure plasmas have been used in the microelectronics industry since the 1960s. In
the 1980s their usages started to broaden and more areas where plasmas could be used were
investigated. Soon research within plasma for textile applications started and this is an ongoing field
ever since. [18]
In vacuum plasma the gas pressure needs to be low in order to produce the plasma. Hence, a vacuum
chamber and pump is needed. This will make the technique energy-demanding since the pump needs
to be powerful in order to be able to reach the low pressures needed for the plasma to be generated
and maintained. This also makes it demanding to use a vacuum plasma treatment as part of a
continuous process and only batch-wise processes are realistic.
Atmospheric pressure plasma is a technique in which there is no need for low pressures hence, the
treatment can be made at a normal pressure. This makes it possible to use atmospheric plasma
treatments in a continuous production line. The energy use for an atmospheric plasma treatment will
also be significantly lower compared to vacuum plasma since no pump is needed.
18
Some different forms of cold atmospheric plasmas exist examples of this are corona discharge,
dielectric barrier discharge and glow discharge.
The corona discharge is the oldest and most widely used of the atmospheric pressure plasma
techniques. It is however a weak form of plasma and cannot penetrate deep into textiles. [18] The
corona treatment is also inhomogeneous making it unsuitable for use when treating textiles since
homogeneity is an important factor in textile applications. [15]
The dielectric barrier discharge uses an insulating (dielectric) layer made of for example quarts or a
ceramic material, covering at least one of the electrodes. The technique is often used in the
packaging industry in order to increase the wettability of polymer films. The homogeneity of the
plasma is however not that good and can cause an uneven treatment of the textile [15][18][19].
Glow discharge is a homogenous, uniform and stable technique for producing plasma. The plasma is
created by applying radio frequency voltages across two parallel plate electrodes, the gas used for
glow discharge is often helium or argon [18].
In this project the atmospheric plasma equipment used has been based on dielectric barrier
discharge plasma.
2.7 Characterization methods Different characterization methods were employed, to evaluate the effect the plasma treatment had
on the material surfaces and to increase the understanding of the chemical and physical mechanisms
that are taking place.
2.7.1 Measurement of adhesion
Depending on the nature of the polymer and the substrate some different methods can be used to
measure the adhesive force between two materials. If the coating is flexible the preferred method
used is the peel test, in a peel test the coating is simply peeled of the substrate at a specific angle. If
both the coating and the substrate are flexible normally a T-peel test is used, see Figure 5A. This is
the method used in this project, since both the textile and the polymer films are flexible. If a flexible
coating is applied on a more rigid surface the peel tests used is normally the 90⁰ and the 180⁰ peel-
test, see Figure 5B-C. [20]
If both the coating and the substrate is rigid the butt joint test or the lap shear test can be used
instead, see Figure 5D-E.

19
Figure 5. A=T-peel test, B=90⁰ peel test, C=180⁰ peel test, D=lap shear test, E=but joint test
The techniques seen in Figure 5 all have one big disadvantage in that the sample is destroyed during
the measurement. There exist also nondestructive tests for adhesion measurements. Those methods
however, are generally more complicated and therefore also more expensive to run. In this project
no such technique was used and for most purposes the techniques seen in figure 4 are sufficiently
reliable.
2.7.3 Scanning electron microscopy
In scanning electron microscopy (SEM) a surface is bombarded by an electron beam, this will result in
emission of electrons from the surface. These emissions can be categorized into groups, depending
on how they have interacted with the surface these groups are:
Primary backscattered electrons without energy loss
Primary backscattered electrons with energy loss
Secondary and Auger electrons
Electrons of the continuum
In SEM the image is created by the backscattered and secondary electrons. To achieve the primary
electrons necessary for a SEM experiment, a tungsten filament with a low beam current is normally
used. Other sources can be used to produce primary electrons as well, but the most common is the
tungsten filament. Different detectors are used for detection of different kinds of electrons. For
secondary electrons a Thornley-Everhart scintillator/photomultiplicator can be used, while
backscattered electrons normally are detected by silicon diodes. [17]
2.7.4 X-ray photoelectron spectroscopy
X-ray photoelectron spectroscopy (XPS) is used for elemental surface characterization of materials.
The theory behind the technique comes from Einstein’s explanation of the photoelectric effect for
which he received the Nobel prize in 1905. [21] However, the technique was developed in Uppsala in
the 1950s, by Siegbahn et al. They first called the technique electron spectroscopy for chemical
analysis (ESCA) and later it has also been known as XPS. [22]
20
In an XPS experiment the sample is irradiated with soft X-rays photons with a specific energy hυ. The
X-ray photons will eject photoelectrons from the sample and the energy of those photoelectrons can
be calculated according to;
EK= hυ-EB
Where EK is the kinetic energy of the emitted photoelectrons, hυ is the incident photon energy and EB
is the binding energy of the photoelectrons. From the kinetic energy of the photoelectrons EB can be
calculated. EB is elemental-specific and hence, allow for the elemental composition of the surface to
be determined. [17][22]
One advantage of using XPS for surface characterization of plasma-treated samples is that it is a
surface sensitive technique with a sampling depth of approximately 10 nm. Another advantage is
that the irradiation damage is low, since soft X-rays are used and XPS can therefore be regarded as a
nondestructive technique. [17]
21
3 Materials and Method
3.1 Materials used
3.1.1 Fabrics
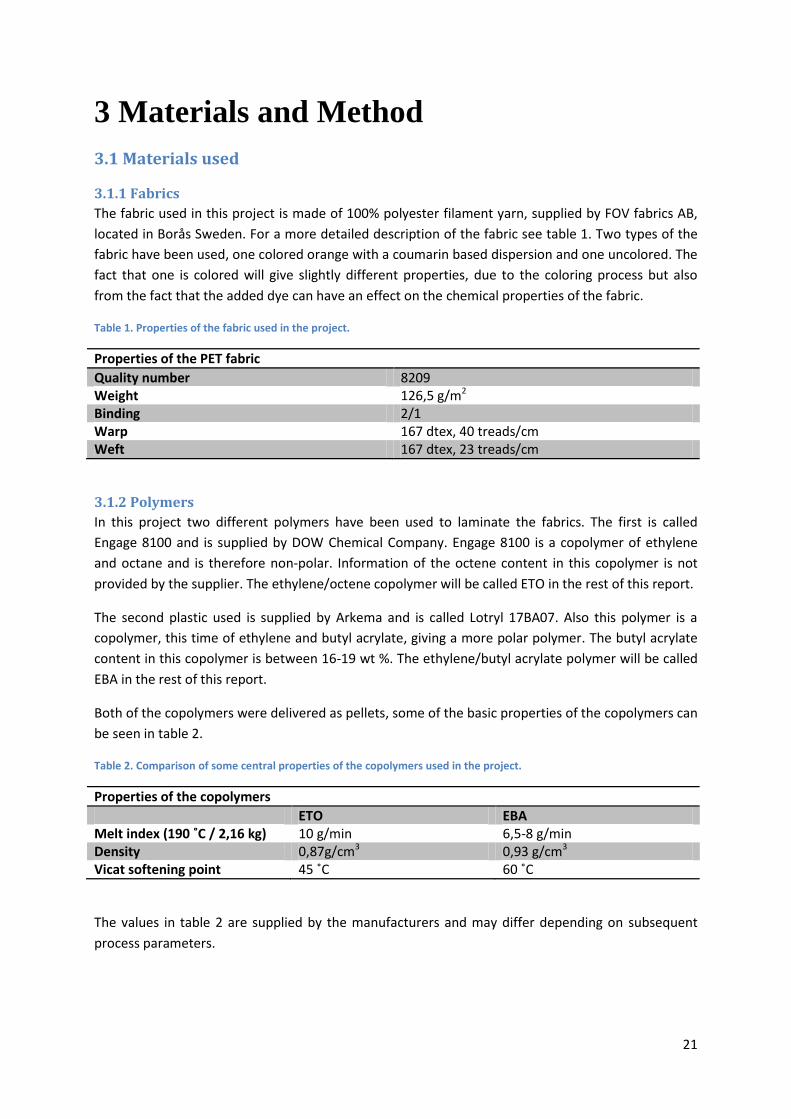
The fabric used in this project is made of 100% polyester filament yarn, supplied by FOV fabrics AB,
located in Borås Sweden. For a more detailed description of the fabric see table 1. Two types of the
fabric have been used, one colored orange with a coumarin based dispersion and one uncolored. The
fact that one is colored will give slightly different properties, due to the coloring process but also
from the fact that the added dye can have an effect on the chemical properties of the fabric.
Table 1. Properties of the fabric used in the project.
Properties of the PET fabric
Quality number 8209 Weight 126,5 g/m2 Binding 2/1 Warp 167 dtex, 40 treads/cm Weft 167 dtex, 23 treads/cm
3.1.2 Polymers
In this project two different polymers have been used to laminate the fabrics. The first is called
Engage 8100 and is supplied by DOW Chemical Company. Engage 8100 is a copolymer of ethylene
and octane and is therefore non-polar. Information of the octene content in this copolymer is not
provided by the supplier. The ethylene/octene copolymer will be called ETO in the rest of this report.
The second plastic used is supplied by Arkema and is called Lotryl 17BA07. Also this polymer is a
copolymer, this time of ethylene and butyl acrylate, giving a more polar polymer. The butyl acrylate
content in this copolymer is between 16-19 wt %. The ethylene/butyl acrylate polymer will be called
EBA in the rest of this report.
Both of the copolymers were delivered as pellets, some of the basic properties of the copolymers can
be seen in table 2.
Table 2. Comparison of some central properties of the copolymers used in the project.
Properties of the copolymers
ETO EBA Melt index (190 ˚C / 2,16 kg) 10 g/min 6,5-8 g/min Density 0,87g/cm3 0,93 g/cm3 Vicat softening point 45 ˚C 60 ˚C
The values in table 2 are supplied by the manufacturers and may differ depending on subsequent
process parameters.
22
3.2 Methods All lab work was conducted at Swerea IVF in Mölndal, Sweden, unless otherwise stated.
3.2.1 Pressing of the polymer films
For the lamination of the polymer films (explained in section 3.2.3) the copolymer first needed to be
pressed into polymer films. To make the polymer films, a compression mold from J. Wickert & Söhne
Maschinenbau, Germany, was used. An appropriate amount of pellets where placed between two
sheets of Teflon film and metal pieces with a thickness of 1 mm. The metal pieces were placed so
that the melted copolymer only came in contact with the Teflon sheets the reason for using the
metal pieces was to ensure that the films always gained the same thickness.
The films were pressed at 95 ˚C for the ETO copolymer, and 110 ˚C for the EBA copolymer. The
pressure was slowly raised from 0 to 50 kg/cm2, where it was kept for about 15 s where-after the
pressure was released and the film collected. The pressure applied were the same for both
copolymers.
3.2.2 Plasma treatment
Atmospheric plasma treatment
The atmospheric plasma treatment was performed on a Platex 600 lab plasma from Grinp S.r.l, Italy.
The plasma is based on the DBD technique and have two parallel electrodes placed horizontally. One
electrode is placed upwards and the other downwards. The plasma zone is generated in the gap
between the two electrodes. Following parameters of the plasma was varied:
The process gas used
The gas flow
Time in the plasma zone
The power
The distance between the electrodes
Temperature of the electrodes
Pure He was used as process gas, if not otherwise noted, but also N2 and O2 have been used, either
pure or mixed with He. The total gas flow was kept constant at 7,5 l/min for all samples, independent
of the gas used. The time in the plasma zone was controlled by regulating the speed of a tender
frame on which the fabric was mounted. The treatment was generally repeated three to six times
and the total time in the plasma zone calculated.
The power of the plasma can be set to values in between 500 and 8000 W, depending on the
electrode distance. The electrode distance can be varied between 1-500 mm and in this project
distances between 1-60 mm has been used. The temperatures of the electrodes can also be varied
and was set to 50 ˚C when treating the fabric and 30 ˚C when treating the polymer films.
The polymer films was too small to be mounted on the tender frame normally used for the fabrics
and was therefore placed on top of a large piece of fabric, which was then mounted on the tender
frame.
23
The different parameters were used to calculate the total plasma energy per square meter of treated
surface (treatment energy). The calculations are described by equations 1-6 seen below.
In equation 1 the total time the material has spent in the plasma zone was calculated. The total
energy is given by equation 2, where ttot and the power of the plasma is multiplied. The power of the
plasma is set by the operator, which means that it is known.
Equation 3 and 4 are combined into equation 5, which expresses the area of the treated material.
Combination of equation 3 and 4 removes the Fabric speed.
Combining equation 2 and 5 will give equation 6 which is the plasma energy applied per square
meter of material. This is called the Treatment Energy (TE).
The calculations don’t account for all of the parameters that can be varied during the plasma
treatment. The type of gas used, the gas flow, the distance between the electrodes and the
temperature of the electrodes are not accounted for in the calculations. Furthermore, the calculation
of the Treatment power is only valid for atmospheric pressure plasma and not for vacuum plasma.
Vacuum plasma treatment
The vacuum plasma treatment has been performed with 440 Plasma-System from Technics Plasma
GmbH, Germany. The vacuum plasma equipment has been used for treatment of the polymer films.
Following parameters were varied to obtain the optimal conditions:
24
The gas used
The power
Time in the plasma
The pressure in the vacuum chamber
The process gasses used for vacuum treatment were O2 and N2. Those gasses were also used to clean
the plasma chamber from other gasses prior to any treatment. This is done by first lowering the
pressure in the chamber to about 0,22 mbar. The pressure in the chamber is then raised to about 1,4
mbar by the connected process gas. This procedure was repeated 3 times. When the chamber had
been cleaned from other gases the pressure was adjusted to the desired value by controlling the flow
of the process gas. The gas pressure was 0.7 mbar in all treatments.
The plasma parameters were kept constant once optimized. The power of the plasma can be varied
between 0 and 600 W and was set to 500 W. The total exposure time to the plasma was 60 s, divided
into two periods of 30 s each, with 10 s delay time between them.
3.2.3 Lamination
Lamination of the plastic films to the fabric has been achieved by using a laboratory hydraulic press
from Graseby Specac. The following parameters can be varied:
Lamination temperature
Lamination time
Lamination pressure
All the samples have been laminated the same way independent of the copolymer used. The
temperature used was 180 ˚C, and the lamination time 1 min. The lamination pressure is applied
manually
The fabrics and the polymer films were placed between two Teflon sheets during the lamination. The
fabrics were also laminated on the backside with a supportive polymer film of the same type.
3.2.4 The adhesion measurements
20 mm wide stripes of the laminate were punched pressed out to be tested for adhesion. The
adhesion testing is performed by an Instron 1122, connected to a computer with the program Test
Works 4. The samples are pulled by the Instron at a constant rate of 100 mm/min, while the applied
force is measured. The measurement has been performed as a T-peel test se figure 5A. The
measurement is stopped when all the plastic has been peeled off the fabric. The program plots a
graph, with the extension in mm on the x-axis and the force in N on the y-axis, see figure 6. The
average force is calculated by choosing a representative interval of the graph.

25
Figure6. A typical load-extension graph, the way is it generated by Test Works 4.
From each sample laminated, three stripes were measured for adhesion. The average forces from
these three measurements are then combined to give an average. Those averages are the values
presented in this report.
3.2.5 Ageing test
The ageing test has been made by first treating the uncolored and the colored fabric in the
atmospheric plasma device. For different samples with different plasma treatments were made for
both of the fabrics, the treated fabrics were large enough to ensure that at least 8 different pieces
could be used for lamination.
The fabric was laminated with ETO copolymer films treated in the vacuum plasma. The parameters
used for the vacuum treatment of the film can be seen in table 3.
Table 3. Parameters used for the vacuum plasma treatment of the polymer films used for the ageing test
Parameters for the vacuum plasma treatment
Process gas O2
Pressure in the vacuum chamber 0.7 mbar Time in the plasma 30+30 s Power 500 W
All the films used in the aging test have been treated this way and the plasma treatment has been
made no longer than 2 h before the lamination of the film.
When the fabrics had been plasma-treated they were place in a room with a controlled atmosphere
(65 % rh and 20 ˚C). The plasma-treated fabrics were kept up to 50 days before laminated and tested
for adhesion.
0
10
20
30
40
50
60
0 17 33 50 67 83 100 117 133 150 167 183 200
Load
(N
/2 c
m)
Extension (mm)
Specimen Number
26
3.2.6 Treatment of plastic powder and fabric at the same time
Fabrics have been treated by the atmospheric plasma after a powder of the ETO copolymer pellets
had been spread on the fabric. The powder was obtained by grinding the polymer pellets in a
variable speed rotor from Fritsch, called Pulverisette 14. The pellets were cooled by liquid nitrogen
before fed into the Pulverisette.
The powder was spread on the fabric with an ordinary kitchen strainer. After the powder had been
applied to the fabric it was treated in the atmospheric plasma device. After the fabric and the
polymer powder had been plasma treated it was laminated with the same polymer used to produce
the powder.
3.2.7 SEM analysis
The SEM analysis where performed on the fiber structure of the untreated fabric and on fabric
treated with a relatively low treatment power, and one that has been treated with a high treatment
power. The SEM analysis was performed with a 6610 LV from JEOL, Japan, employing a secondary
electron detector.
Pictures have also been taken on the fabric after plasma treatment. For this, two different plasma
treatment have been performed, one with a treatment power of 150 kJ/m2 and one with a treatment
power of 1060 kJ/m2. For both of these plasma treatments helium has been used at an electrode
distance of 1 mm. The plasma treatments was made one day before the pictures was taken and the
fabric was place in aluminum foil during that time.
3.2.8 X-ray photoelectron spectroscopy
XPS was performed on a Quantum 2000 scanning ESCA microprobe from Physical Electronics located
at Chalmers University of Technology in Gothenburg, Sweden. The setup used during the XPS
measurement can be found in Table 4.
Table 4. The setup used for the XPS measurements
X-ray source Al Kα (1486.6 eV)
Beam size 100 µm Analyzed area Approx 500 x 500 µm Take off angle (with respect to sample surface) 45 ˚ Information depth Approx 4-5 nm
The XPS was made for both plasma-treated and untreated samples of EBA films and the colored
fabric. The plasma-treated samples were treated one day before the experiment and kept in
aluminum foil during that time.

27
4 Results/discussion
4.1 Results of the peel test for plasma treated fabrics The primary method used to evaluate the adhesion and the improvement achieved by the plasma
treatment has been the peel tests. Since the focus mainly has been on plasma treatment of the fabric
this is presented first. The first results presented here are the colored fabric (orange), laminated with
either the ETO or the EBA copolymer. All of the points in the graphs below are average values,
derived from three measurements. Turn to the appendix for a complete list of all measured adhesion
values and their standard deviations, last in the appendix the atmospheric plasma parameters used
for the different treatments can also be found.
4.1.1 Colored fabric
The result from the atmospheric plasma treatment of the colored fabrics can be seen in figure 7. The
electrode distance was 1 mm and the process gas helium, for all the samples in figure 7. All samples
were laminated within an hour after the plasma treatment.
Figure 7. This graph show how the treatment effect of the orange fabric affects the adhesion when laminated with either the EBA or the ETO copolymer film.
Something that is interesting in figure 7 is that the EBA copolymer clearly has a lower adhesion than
the ETO film to the PET fabric. This is the opposite effect from what was expected since the EBA has a
more polar structure and therefore should interact strongly with the polar structure of the PET
fabric. What instead is seen is that the completely non-polar copolymer ETO has higher adhesion
than the EBA copolymer to the PET fabric. The reasons for this could be that the EBA copolymer has
stronger intermolecular bonds between the polymer chains, which could lead to a higher crystallinity
and hence, a weaker polymer-fabric interaction. A higher crystallinity will also give less penetration
of the polymer chains of the film into the polymer chains of the fabric, giving an overall lower
adhesion. Other factors that could contribute to the lower adhesion of the EBA film could be the
molecular weight of the polymers and the amount of crosslink’s on the surface of the plastic film. The
0
2
4
6
8
10
12
14
16
18
0 200 400 600 800 1000 1200
Ad
he
sio
n s
tre
ngt
h (
N/2
cm
)
Treatment energy (kJ/m2)
Plasma treatment of colored fabric Plasma treated fabric laminated with EBA polymer
plasma treated fabric laminated with ETO polymer
untreated fabric laminated with ethylene/octene plastic
untreated fabric laminated with EBA plastic
28
amount of crosslink’s would in this case be higher for the EBA than for the ETO copolymer, giving a
less reactive surface for the EBA copolymer.
Interesting however, is the fact that the plasma treatment of the fabric increases the adhesion for
both EBA and ETO. Even though the adhesion is slightly higher for the samples where the fabric has
been treated with a high treatment energy the differences between high and low plasma treatment
energies are small. This indicates that the need to treat the fabric with a high treatment power is
small, at least for fabrics that are laminated directly after the plasma treatment.
The adhesion improvement is approximately the same independent of if the fabrics are laminated
with the ETO or the EBA copolymer. At least as long as only the fabric and not the polymer film has
been plasma-treated.
As mentioned above, all of the plasma treatments presented in figure 7 have been made at an
electrode distance of 1 mm. A higher electrode distance gave a more uneven plasma zone, which
lead to damaging of the fabric since there were a high number of discharges which burnt small holes
in the fabric.
4.1.2 Uncolored fabric
Most of the fabric used in the project has been the colored but also an uncolored variant of the same
fabric has been used in order to see if the coloring of the fabric has an effect on the adhesion
properties.
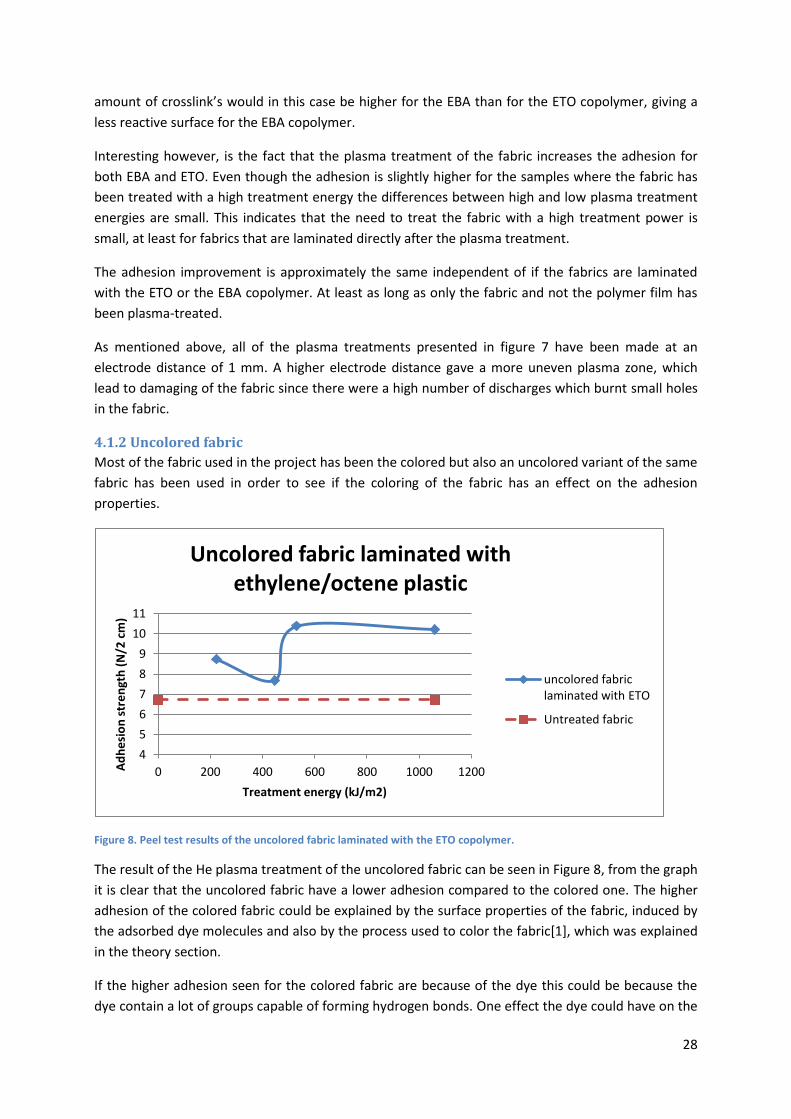
Figure 8. Peel test results of the uncolored fabric laminated with the ETO copolymer.
The result of the He plasma treatment of the uncolored fabric can be seen in Figure 8, from the graph
it is clear that the uncolored fabric have a lower adhesion compared to the colored one. The higher
adhesion of the colored fabric could be explained by the surface properties of the fabric, induced by
the adsorbed dye molecules and also by the process used to color the fabric[1], which was explained
in the theory section.
If the higher adhesion seen for the colored fabric are because of the dye this could be because the
dye contain a lot of groups capable of forming hydrogen bonds. One effect the dye could have on the
4
5
6
7
8
9
10
11
0 200 400 600 800 1000 1200 Ad
he
sio
n s
tre
ngt
h (
N/2
cm
)
Treatment energy (kJ/m2)
Uncolored fabric laminated with ethylene/octene plastic
uncolored fabric laminated with ETO
Untreated fabric

29
surface is that more groups capable of forming hydrogen bond are bond to the surface, making it
more reactive. Another reason for the higher adhesion could be that the dye dispersion probably
contains a lot of surfactants, these could be left on the surface giving a better wetting and therefore
improving the adhesion.
The higher adhesion for a colored fabric could also be because of the treatment used to color the
fabric. As mentioned in section 2.1.1 the coloring process involve water at temperatures up to 130 ˚C
and treating a PET fabric at this temperature can significantly change the surface properties of the
fabric, since the Tg of PET is around 70 °C. [9] The changes may involve chemical crosslinking and
increase of the total surface area of the fabric, which both will have an effect on the adhesion
properties of the fabric.
The increased adhesion for the colored fabric can be because of either one of the factors mentioned
above or it can be a combination of all of them. But clear is that there is some difference in the
surface properties of the fabric before and after the coloring of the fabric.
Another interesting aspect of the results in Figure 7 and 8 are that even though the adhesion is lower
from the start for the uncolored fabric the adhesion enhancement seems to be approximately the
same after plasma treatment. This indicates that the properties of the surface before plasma
treatment are of less importance to reach high adhesion and that the plasma treatment induces the
same kind of surface functionality, irrespective of the surface properties of the untreated materials.
4.2 Result of the peel test for the plasma treated polymer films laminated to
untreated fabric Not only the fabrics have been treated in the atmospheric plasma, also the polymeric films have
been treated in a few cases, see Table 5. The reason for the low number of plasma-treated polymer
films, is that the atmospheric plasma treatment performed in the beginning of the project was made
with an electrode temperature of 50˚C. That temperature had a tendency to soften the polymer films
making them curl up and a high electrode distance had to be used in order to prevent the films from
getting stuck inside the plasma zone. The solution to this problem was to lower the electrode
temperature to 30 °C. This was however not made until late in the project and the main focus was
then to plasma-treat both the fabric and the polymer film, see section 4.3.
For the values presented in table 5 the electrode temperature has been 30 °C, the electrode distance
2,5 mm and helium was used as process gas.
Table 5. Peel test results for when only the polymer films has been plasma treated, prior to lamination.
ETO
Treatment power kJ/m2 Adhesion strength N/2 cm
1060 19,1
1471 19,8
EBA
1471 18,0
30
From the values found in Table 5 it is clear that treating only the polymeric films will give a higher
adhesion compared to when only the fabric is treated. The reasons for this could be that more
oxygen-containing functional groups will be incorporated on the surface of the polymer film during
the plasma treatment, as compared to when the fabric is plasma-treated. Several different
explanations exist however, such as changed amount of crosslink's or making the surfaces more
rough, but the most probable cause of the adhesion enhancement is the incorporation of new
functional groups onto the surface.[23]
4.3 Result of the peel test when both films and fabric have been treated The results presented in section 4.1 and 4.2 are for treatment of either the fabric or the polymer film.
The results presented in Figure 9 are instead when both of the material surfaces have been plasma
treated by the atmospheric plasma, prior to lamination.
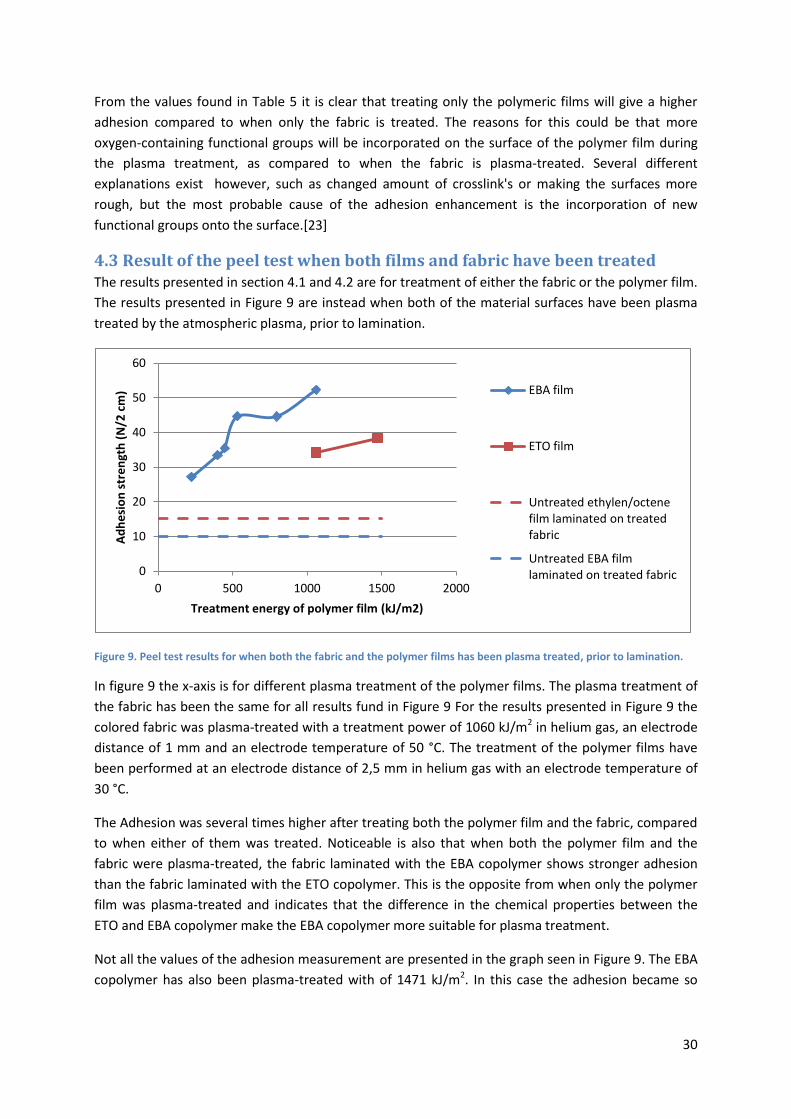
Figure 9. Peel test results for when both the fabric and the polymer films has been plasma treated, prior to lamination.
In figure 9 the x-axis is for different plasma treatment of the polymer films. The plasma treatment of
the fabric has been the same for all results fund in Figure 9 For the results presented in Figure 9 the
colored fabric was plasma-treated with a treatment power of 1060 kJ/m2 in helium gas, an electrode
distance of 1 mm and an electrode temperature of 50 °C. The treatment of the polymer films have
been performed at an electrode distance of 2,5 mm in helium gas with an electrode temperature of
30 °C.
The Adhesion was several times higher after treating both the polymer film and the fabric, compared
to when either of them was treated. Noticeable is also that when both the polymer film and the
fabric were plasma-treated, the fabric laminated with the EBA copolymer shows stronger adhesion
than the fabric laminated with the ETO copolymer. This is the opposite from when only the polymer
film was plasma-treated and indicates that the difference in the chemical properties between the
ETO and EBA copolymer make the EBA copolymer more suitable for plasma treatment.
Not all the values of the adhesion measurement are presented in the graph seen in Figure 9. The EBA
copolymer has also been plasma-treated with of 1471 kJ/m2. In this case the adhesion became so
0
10
20
30
40
50
60
0 500 1000 1500 2000
Ad
he
sio
n s
tre
ngt
h (
N/2
cm
)
Treatment energy of polymer film (kJ/m2)
EBA film
ETO film
Untreated ethylen/octene film laminated on treated fabric
Untreated EBA film laminated on treated fabric

31
high that the polymer film broke in the tensile testing machine, before it was peeled off the fabric.
Hence, no adhesion values could be obtained, but the film broke at a load of 70 N/2 cm.
There can be several different reasons for the high adhesion when both the polymer and the fabric
have been plasma-treated. One explanation could be that the introduced functional groups are
reactive and create covalent bonds, resulting in strong adhesion.[23] The reason could also be
because a formation of hydrogen bonds between the two materials surfaces. This is a possible
explanation since the plasma treatment will incorporate many oxygen-containing groups on the
surface, capable of forming hydrogen bonds. These examples would all be regarded as chemical
interactions, further explained in section 2.4. After all, it is unlikely to reach the high adhesion here
reported, without the involvement of chemical interactions.
Also other factors may contribute to the adhesion enhancement; one such factor is that the plasma
treatment will break the molecular structures of some of the polymer chains. This would affect the
interlocking of chains since the plasma then would give a more amorphous structure at the surfaces,
enhancing the interlocking of the chains. The same goes for the mechanical interlocking. Since
plasma energy has the potential of harming surfaces by etching, those surfaces will become less
smooth and this should contribute to the enhanced adhesion.
For the present case it is clear that the plasma treatment has changed the surfaces of both the fabric
and the polymer, giving two more reactive surfaces, capable of forming strong interactions between
them. From the result seen in Figure 9 it is also clear that plasma treatment is a good method for
enhancing the adhesion between a PET fabric and an ethylene-based polymer.
4.4 Result from the peel test when other gases than He has been used Not only helium has been used for the atmospheric plasma treatment, also nitrogen and oxygen have
been evaluated. These gases has been used both pure and in mixtures with Helium. In the case of gas
mixtures the ratio between helium and the other gas has been 4/1. The peel test results for the
colored fabric, plasma-treated in pure nitrogen and laminated with untreated ETO film, can be found
in Figure 10.
Figure 10. Peel test results of the treatment of the fabric in nitrogen gas
10,0
10,5
11,0
11,5
12,0
12,5
13,0
13,5
14,0
14,5
0 100 200 300 400 500 600 700
Ad
he
sio
n s
tre
ngt
h (
N/2
cm
)
Treatment energy (kJ/m2
Samples treated in N2

32
From the results found in Figure 10 it can be seen that the adhesion is approximately the same as
when helium was used. What is not seen in Figure 10 is that the treatment made with nitrogen
damaged the fabric to a higher degree, compared to the fabric treated with helium. Still, the
treatment energy was kept at a low level when using nitrogen, in order not to damage the fibers too
much. For the oxygen-treated samples the damage to the fabric was so extensive that there was no
point in performing the lamination.
The fabrics treated with a mixture of gases have been laminated with a film treated by vacuum
plasma. The process gases used for the vacuum plasma treatment were O2 and N2. The reason for
evaluating both O2 and N2 were to investigate if different functional groups can be incorporated on
the plasma-treated surface, by using different gases. And if this is the case, to see if surfaces plasma-
treated a certain gas will interact more strongly with a another surface treated with the same gas.
The vacuum plasma parameters used in the treatment of these films have been the same as those
used in the ageing tests, described in section 3.2.5. The results can be found in Table 6, where the
electrode distance has been 1 mm.
Table 6. Results of the peel test when a gas mixture has been used, the gas used beside helium can be seen in brackets for the values given in the table. The polymer was treated by vacuum plasma and the fabric by atmospheric pressure plasma. For a comparison where only He has been used se Figure 7 and 8.
Laminate with polymer film treated in N2
Treatment power of the fabric (kJ/m2)
Adhesion strength (N/2 cm)
176 (He:N2 , 4:1) 29,34 1060 (He:N2 , 4:1) 29,14 176 (He:O2 , 4:1) 29,09 587 ((He:O2 , 4:1) 28,30 Laminate with polymer film treated in O2 Treatment power of the fabric (kJ/m2)
Adhesion strength (N/2 cm)
176 (He:N2 , 4:1) 28,27 1060 (He:N2 , 4:1) 31,88 176 (He:O2 , 4:1) 26,43 587 (He:O2 , 4:1) 33,18
From the values in Table 6 it is seen that O2 and N2 are equally good to use for the vacuum plasma
treatment of the polymer film, when the gas mixture of helium and nitrogen has been used for the
atmospheric plasma treatment of the fabric.
When a gas mixture of helium and oxygen has been used for the atmospheric plasma treatment the
best results seems to be achieved when laminating with a film where oxygen was used in vacuum
plasma treatment. The variations are small however and more measurements need to be made in
order to make a correct assumption of the influence of the process gases.
From Table 6 the assumption can be made that the effect of the gas composition is small to the
adhesion results. Worth mentioning here is also that the damaging of the fabric when it was treated
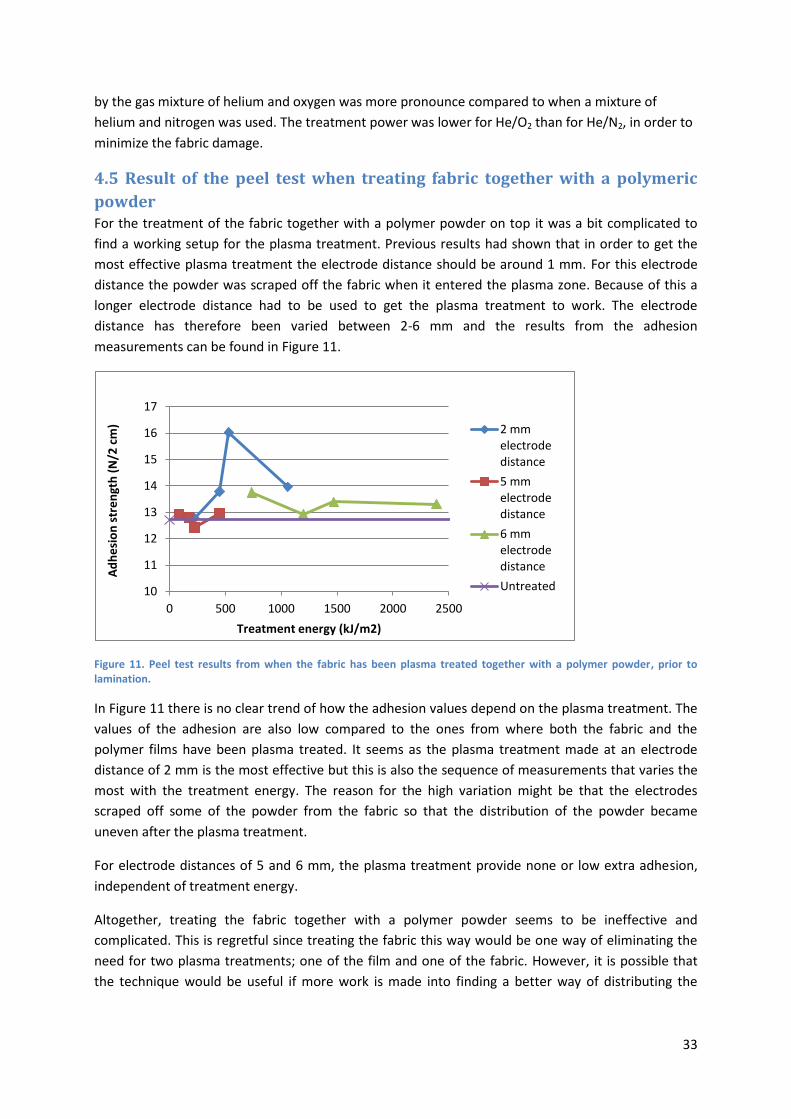
33
by the gas mixture of helium and oxygen was more pronounce compared to when a mixture of
helium and nitrogen was used. The treatment power was lower for He/O2 than for He/N2, in order to
minimize the fabric damage.
4.5 Result of the peel test when treating fabric together with a polymeric
powder For the treatment of the fabric together with a polymer powder on top it was a bit complicated to
find a working setup for the plasma treatment. Previous results had shown that in order to get the
most effective plasma treatment the electrode distance should be around 1 mm. For this electrode
distance the powder was scraped off the fabric when it entered the plasma zone. Because of this a
longer electrode distance had to be used to get the plasma treatment to work. The electrode
distance has therefore been varied between 2-6 mm and the results from the adhesion
measurements can be found in Figure 11.
Figure 11. Peel test results from when the fabric has been plasma treated together with a polymer powder, prior to lamination.
In Figure 11 there is no clear trend of how the adhesion values depend on the plasma treatment. The
values of the adhesion are also low compared to the ones from where both the fabric and the
polymer films have been plasma treated. It seems as the plasma treatment made at an electrode
distance of 2 mm is the most effective but this is also the sequence of measurements that varies the
most with the treatment energy. The reason for the high variation might be that the electrodes
scraped off some of the powder from the fabric so that the distribution of the powder became
uneven after the plasma treatment.
For electrode distances of 5 and 6 mm, the plasma treatment provide none or low extra adhesion,
independent of treatment energy.
Altogether, treating the fabric together with a polymer powder seems to be ineffective and
complicated. This is regretful since treating the fabric this way would be one way of eliminating the
need for two plasma treatments; one of the film and one of the fabric. However, it is possible that
the technique would be useful if more work is made into finding a better way of distributing the
10
11
12
13
14
15
16
17
0 500 1000 1500 2000 2500
Ad
he
sio
n s
tre
ngt
h (
N/2
cm
)
Treatment energy (kJ/m2)
2 mm electrode distance
5 mm electrode distance
6 mm electrode distance
Untreated

34
powder on top of the fabric and to make sure that the powder stays on the surface also for shorter
electrode distances.
4.6 Ageing results Aging tests have been made for both the uncolored and the colored fabric. The plasma parameters
were the same for the colored and the uncolored fabrics, and the results of these experiments can be
found in Figure 12 and Figure 13.
Figure 12. Ageing results for the uncolored fabric
Figure 13. Ageing results for the colored fabric
The colored and the uncolored fabric show the same trend: the adhesion is highest for the samples
laminated soon after the plasma treatment and decreases with time. This was expected and the
results confirm that the aging after plasma treatment is worth taking into account when working
with plasma treatment for adhesion enhancement.
Interesting from the results of the ageing is that the effect of the plasma treatment can last 50 days
after the fabrics has been treated. It is also interesting to see that even though a decrease can be
0
10
20
30
40
50
0 10 20 30 40 50 60 Ad
he
sio
n s
tre
ngt
h (
N/2
cm
)
Days after plasma treatment
Uncolored fabric
88 kJ/m2
176 kJ/m2
530 kJ/m2
1060 kJ/m2
Untreated fabric
0
10
20
30
40
50
0 10 20 30 40 50 60
Ad
he
sio
n s
tre
ngt
h (
N/2
cm
)
Days after plasma treatment
Colored fabric
88 kJ/m2
176 kJ/m2
530 kJ/m2
1060 kJ/m2
untreated fabric

35
seen already after a week the adhesion-decrease is not so significant and a good adhesion can still be
achieved if the lamination is made within one week after the plasma treatment.
From the graphs in Figure 12 and 13 it is also seen that higher plasma treatment power generally
gives higher adhesion, even a long time after plasma treatment of the fabric. This is not true for all of
the values in Figure 12 and 13 but a general trend.
4.7 SEM pictures SEM pictures were captured in order to investigate if the plasma treatment damaged the surface of
the fabrics. Pictures were captured on both the uncolored and the colored fabric, to investigate if any
differences could be seen, since the adhesion values have been different depending on whether the
fabric had been colored or not. SEM micrographs of the colored and the uncolored fabrics, without
plasma treatment, are presented in Figure 14.
From the SEM pictures seen in Figure 14 it seems as the coloring process has left the fibers unharmed.
Slightly more contaminants can be seen on the surface of the colored fabric, but the fibers seem to be
smooth and unharmed in both cases.
Figure 14. SEM pictures taken at a magnification of 1 500. The left picture is the uncolored fabric and the right picture is of the colored fabric

36
SEM pictures were also captured on plasma-treated colored fabrics, shown in Figure 15. Two
different plasma treatment were performed, both was made in He and with an electrode distance of
1 mm. The first fabric was treated with a treatment energy of 150 kJ/m2 and the second with a
treatment energy of 1060 kJ/m2.
In figure 15 a small damage can be seen for the fabric treated by a plasma energy of 150 kJ/m2 this
kind of damages could however also be seen for the untreated fabrics and is therefore not
considered to be because of the plasma treatment. For a plasma energy of 1060 kJ/m2 no signs of
damages can be seen on the fabric fibers with SEM. This indicates that the plasma treatment of the
fabrics has been performed without harming the fiber surface.
4.8 XPS results The elemental surface compositions of some selected materials were determined by XPS and the
results are shown in Table 7.
Table 7. Result of the XPS measurements
C1s N1s O1s F1s Si2p S2p Na1s Ca2p
Un treated fabric 72.8 - 27.2 - - - - -
Fabric treated by 150 kJ/m2
65.9 0.8
32.0 - 0.8 0.2 - 0.3
Fabric treated by 1060 kJ/m2
64.3 2.1 32.8 - - - 0.3 0.4
Untreated EBA 89.7 0.4 8.0 1.8 - 0.2 - -
EBA treated by 1471 kJ/m2
71.0 2.8 24.8 0.7 0.7 - - -
From the result of the XPS measurement it is clear that the oxygen content on the surface of the
fabric has increased for the plasma treated samples. To be able to decide which functional groups of
oxygen that has been bound to the surface of the fabric the carbon peaks has been studied more
closely. The different carbon bands of the untreated fabric is presented in Table 8.
Figure 1. SEM pictures taken at a magnification of 1 500. The left picture is the colored fabric treated with a treatment energy of 150 kJ/m
2 and the right picture is of the colored fabric treated with a treatment energy of 1060 kJ/m
2

37
Table 8.The carbon bands found for the untreated colored fabric
Band Pos (EV) %Area
1 284.2 67.0
2 285.8 21.6
3 288.2 11.5
As can be seen in Table 8, there are three different carbon peaks present for the untreated fabric.
From these values and the repeating unit of PET the different carbons to which the bands belong can
be decided. This is illustrated in Figure 16.
Figure 16 The functional groups connected to the bands seen in table 8
Looking at the carbon bands of the plasma-treated fabrics, it is possible to make an estimation of
which type of oxygen groups has been bond to the fabric surface.[22] For the two plasma-treated
fabrics, those bands can be found in Table 9.
Table 9 The carbon bands found for the plasma-treated colored fabric
Fabric treated by 150 kJ/m2 Fabric treated by 1060 kJ/m2
Band Pos (EV) %Area Band Pos (EV) %Area
1 284.2 56.3 1 284.2 52.6
2 285.8 25.4 2 285.7 26.5
3 288.1 18.4 3 288.1 21.0
Comparing table 8 and table 9 one can see that the bands present are approximately the same for all
the fabrics. The main difference is the area of the bands. For the plasma-treated samples the area of
band 2 and 3 are larger than the corresponding bands of the untreated fabric. This indicates that
after the plasma treatment oxygen has been bound to the surface in the form seen as group 2 and 3
in Figure 16. Band 3 has increased the most, meaning that the carboxyl is the type of functional
group that has increased the most on the surface.
From Table 9 it is also interesting to see that the area differences between the bands of the plasma-
treated samples are small, for the two treatment powers evaluated. This is supported by the peel
tests of the plasma-treated fabrics, in which approximately the same adhesion was reached,
independent of plasma power.
From the values found in Table 7 it can be seen that not only oxygen have been bound to the fabric
surface, some amount of nitrogen has also been introduced. The amount of nitrogen seems to be
higher for the fabric treated with a high treatment power indicating that a lot of energy is needed in
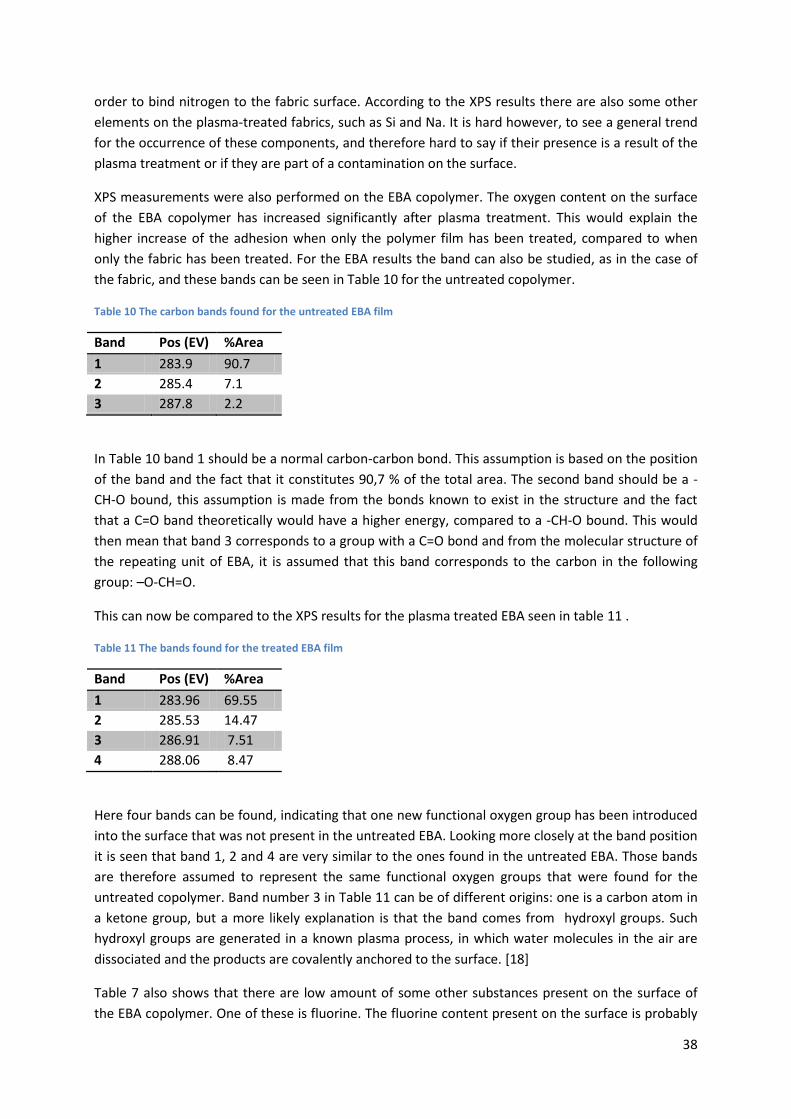
38
order to bind nitrogen to the fabric surface. According to the XPS results there are also some other
elements on the plasma-treated fabrics, such as Si and Na. It is hard however, to see a general trend
for the occurrence of these components, and therefore hard to say if their presence is a result of the
plasma treatment or if they are part of a contamination on the surface.
XPS measurements were also performed on the EBA copolymer. The oxygen content on the surface
of the EBA copolymer has increased significantly after plasma treatment. This would explain the
higher increase of the adhesion when only the polymer film has been treated, compared to when
only the fabric has been treated. For the EBA results the band can also be studied, as in the case of
the fabric, and these bands can be seen in Table 10 for the untreated copolymer.
Table 10 The carbon bands found for the untreated EBA film
Band Pos (EV) %Area
1 283.9 90.7
2 285.4 7.1
3 287.8 2.2
In Table 10 band 1 should be a normal carbon-carbon bond. This assumption is based on the position
of the band and the fact that it constitutes 90,7 % of the total area. The second band should be a -
CH-O bound, this assumption is made from the bonds known to exist in the structure and the fact
that a C=O band theoretically would have a higher energy, compared to a -CH-O bound. This would
then mean that band 3 corresponds to a group with a C=O bond and from the molecular structure of
the repeating unit of EBA, it is assumed that this band corresponds to the carbon in the following
group: –O-CH=O.
This can now be compared to the XPS results for the plasma treated EBA seen in table 11 .
Table 11 The bands found for the treated EBA film
Band Pos (EV) %Area
1 283.96 69.55
2 285.53 14.47
3 286.91 7.51
4 288.06 8.47
Here four bands can be found, indicating that one new functional oxygen group has been introduced
into the surface that was not present in the untreated EBA. Looking more closely at the band position
it is seen that band 1, 2 and 4 are very similar to the ones found in the untreated EBA. Those bands
are therefore assumed to represent the same functional oxygen groups that were found for the
untreated copolymer. Band number 3 in Table 11 can be of different origins: one is a carbon atom in
a ketone group, but a more likely explanation is that the band comes from hydroxyl groups. Such
hydroxyl groups are generated in a known plasma process, in which water molecules in the air are
dissociated and the products are covalently anchored to the surface. [18]
Table 7 also shows that there are low amount of some other substances present on the surface of
the EBA copolymer. One of these is fluorine. The fluorine content present on the surface is probably

39
due to the teflon films used in the pressing of the polymer films, possibly the plasma has etched
away some of the fluorine present on the surface, explaining the lower fluorine content for the
plasma treated EBA than for the untreated EBA. The silicon and sulfur are probably contaminant on
the surface and not a result of the plasma treatment.

40
5 Conclusion
In this project it has been shown that an atmospheric plasma treatment can significantly enhance the
adhesion between a PET textile and a copolymer of ethylene. The results indicate that in order to
achieve the best adhesion both the polymer film and the textile need to be plasma-treated.
Treatment of only one of them will enhance the adhesion, but the effect will be significantly lower
compared to when both of the surfaces have been plasma-treated, if however only one surface is to
be plasma treated it is most effective to treat the polymer film.
From the experiments made in the project it is clearly seen that higher adhesion can be achieved
when a slightly polar polymer is used for the coating of the fabric, compared to when a completely
nonpolar polymer is used.
The aging of the plasma-treated PET fabric has been investigated and it has been shown that the
effect of the plasma treatment can be seen as long as 50 days after the treatment. However, even
though the effect could be seen 50 days after the treatment it had decreased during this time.
The best adhesion has been achieved when using helium as a process gas for the plasma treatment.
The use of nitrogen and oxygen seem to damage the fabric surface too much to make them useful for
the present application. From the SEM pictures taken in this project it is also found that the helium
plasma treatment has no damaging effect on the surface of the fabric.
From performed XPS measurements, it is clear that the plasma treatment will bind functional groups
to the surface of the treated materials. It is also clear that these functional groups are mainly oxygen-
based, giving a surface with a higher surface energy after the plasma treatment. Also nitrogen has
been found to be bound to the surface by the plasma treatment.

41
6 Future work
In this project only ethylene based copolymers have been used for the lamination and plasma
treatment, in future studies it would be interesting to investigate how other polymers could be
plasma-treated in order to improve the adhesion. Only PET fabric has been used in this project,
natural and other synthetic fibers would be very interesting in order to see if how they will respond
to the plasma treatment.
Only fabrics were age-tested in this project and another thing that would be interesting to
investigate is the ageing of the polymer films. Also a combined investigation, where both the
polymer and the fabric are age-tested at the same time would be interesting to perform.
Since only lamination has been used as the coating method in this project it would be interesting to
see if another way of applying the polymer to the fabric surface could be used and still achieve high
adhesion. Here it would also be interesting to see if different application methods would give
different results, depending on the polymer and fabric used.

42
7 Acknowledgements
I would like to thanks my supervisors at Swerea IVF Dr Philip Karlsson and Mr Kay Grinneback for all
the help and guidance during this project.
I would also like to thank all other employees at Swerea IVF for help with showing me equipment and
making it possible to carry out this project. A special thanks goes out to Mr Jan Johansson for the
help with taking the SEM pictures.
I would also like to thank Ms Anne Wendel at Chalmers University of Technology for the help with
making the XPS measurements and for the support of how to interpret them afterwards.
Finally I would like to then my examiner Professor Krister Holmberg at Chalmers University of
Technology.

43
8 References
[1] Broadbent, 2001, Basic Principles of Textile Coloration, West Yorkshire; Dyers Company
Publications Trust
[2] Hatch K.L, 1993, Textile Science, Minneapolis: West Publ
[3] Shim J.J, Choi J, Ju J, Son B, Ahn J, Kim B, Kim K, 2003, Dyeing of Polyester, Aramid and
Polypropylene Fibers in Supercritical CO2,
http://www.isasf.net/fileadmin/files/Docs/Versailles/Papers/Mt2.pdf (2012-05-23)
[4] Sen A.K, 2008, Coated Textiles; Principles and Applications [electronic], 2nd ed, Boca Raton: Taylor
& Francis
[5] Fung W, 2002, Coated and Laminated Textile, Cambridge: Woodhead Publ
[6] Smith W, 2010, Smart Textile Coatings and Laminates, Cambridge: Woodhead Publ
[7] Strong B, 2000, Plastics Materials and Processing [electronic] 2nd ed, New Jersey: R.R Donnelly &
Sons
[8] Sjöblom J, 2001, Kemikaliespridning från produkter: kemikalier i skor. En förstudie, Solna:
Kemikalieinspektionen.
[9] Cowie J.M.G, 2008, Polymers: Chemistry and Physics of Modern Materials, 3rd ed, Boca Raton:
Taylor & Francis
[10] Pascu M, Vasile C, 2005, Practical Guide to Polyethylene, Shawbury: Rapra Technology
[11] Garbassi F, Morra M, Occhiellol E, 1998, Polymer Surfaces, Chichester: Wiley
[12] Special chem, Mechanical Interlocking,
http://www.specialchem4adhesives.com/resources/adhesionguide/index.aspx?id=theory4 (2012-02-
02)
[13] Roberts A D, 1992, Acid base interactions in the adhesion of rubber surfaces, Langmuir, Vol 8,
1479-1486
[14] Holmberg K, Jönsson B, Kronberg B, Lindman B, 2003, Surfactants and Polymers in Aqueous
Solution, 2nd ed, Chichester; Wiley
[15] Sparavigna, 2008, Plasma treatment advantages for textiles
http://arxiv.org/ftp/arxiv/papers/0801/0801.3727.pdf (2012-02-02)
[16] Tendero C, Tixier C, Tristant P, Desmaison J, Leprince P, 2005, Atmospheric plasmas: a review,
Spectrochimica Acta B, Vol 61, 2-30
[17] Rauscher H, Perucca M, Buyle C, 2010, Plasma Technology for Hyperfunctional Surfaces,
Weinheim: Wiley-VCH
44
[18] Shishoo R, 2007, Plasma technologies for textiles, Cambridge: Woodhead publishing
[19] Bogaers A, Neyts E, Gijbels R, Mullen J, 2001, Gas discharge plasmas and their applications,
Spectrochimica Acta Part B, Vol 57, No 4, pp 609-658
[20] Mital K.L, 2001, Adhesion Measurement of Films and Coatings, Volume 2, Netherlands: VSP
[21] Fadley C.S, 2010, X-ray photoelectron spectroscopy: Progress and perspectives, Journal of
Electron Spectroscopy and Related Phenomena, Vol 178–179, pp 2–32
[22] Nascente P.A.P, 2005, Materials characterization by X-ray photoelectron spectroscopy, Journal
of Molecular Catalysis, Vol 228, No 1-2, pp 145-150
[23] Morent R, De Geyter N, Leys C, Gengembre L, Payen E 2007, Surface modification of non-woven
textiles using a dielectric barrier discharge operating in air helium and argon at medium pressure,
Textile Research Journal, Vol 77, No7, pp 471-488

45
9 Appendix
In this appendix the adhesion values used to create the figures seen in the report are presented
together with the standard deviation. The average values found in these tables are the values that
are presented in the figures found in the chapter Results/Discussion. The two last tables in this
appendix presents all the parameters used for the atmospheric plasma treatment used in the
project.
Table 12 The values used to create figure 7.
Table 13 The values used to create figure 8
Atm plasma treated colored fabric lam with untreated ETO
Energy (kJ/m2) Point 1 Point 2 Point 3 Standard deviation Average
223 8,93 8,291 9,011 0,394 8,744
447 7,867 7,487 7,702 0,191 7,685
530 11,78 9,97 9,41 1,239 10,387
1060 10,86 10,291 9,501 0,682 10,217
Atm plasma treated colored fabric lam with untreated EBA
Energy (kJ/m2) Point 1 Point 2 Point 3 Standard deviation Average
0 (untreated) 8,598 8,475 8,283 0,159 8,452
88 9,084 8,9 8,571 0,260 8,852
176 9,46 9,487 9,494 0,018 9,480
530 9,226 9,248 8,999 0,138 9,158
1060 9,83 10,334 10,099 0,252 10,088
Atm plasma treated colored fabric lam with untreated ETO
Energy (kJ/m2) Point 1 Point 2 Point 3 Standard deviation Average
0 (untreated) 12,685 12,466 12,998 0,267 12,716
122 15,735 13,844 13,97 1,057 14,516
223 16,14 15,394 15,073 0,547 15,536
245 14,813 14,35 13,548 0,640 14,237
447 15,834 14,03 14,458 0,943 14,774
530 14,678 13,345 14,656 0,763 14,226
1060 15,257 14,478 15,488 0,529 15,074
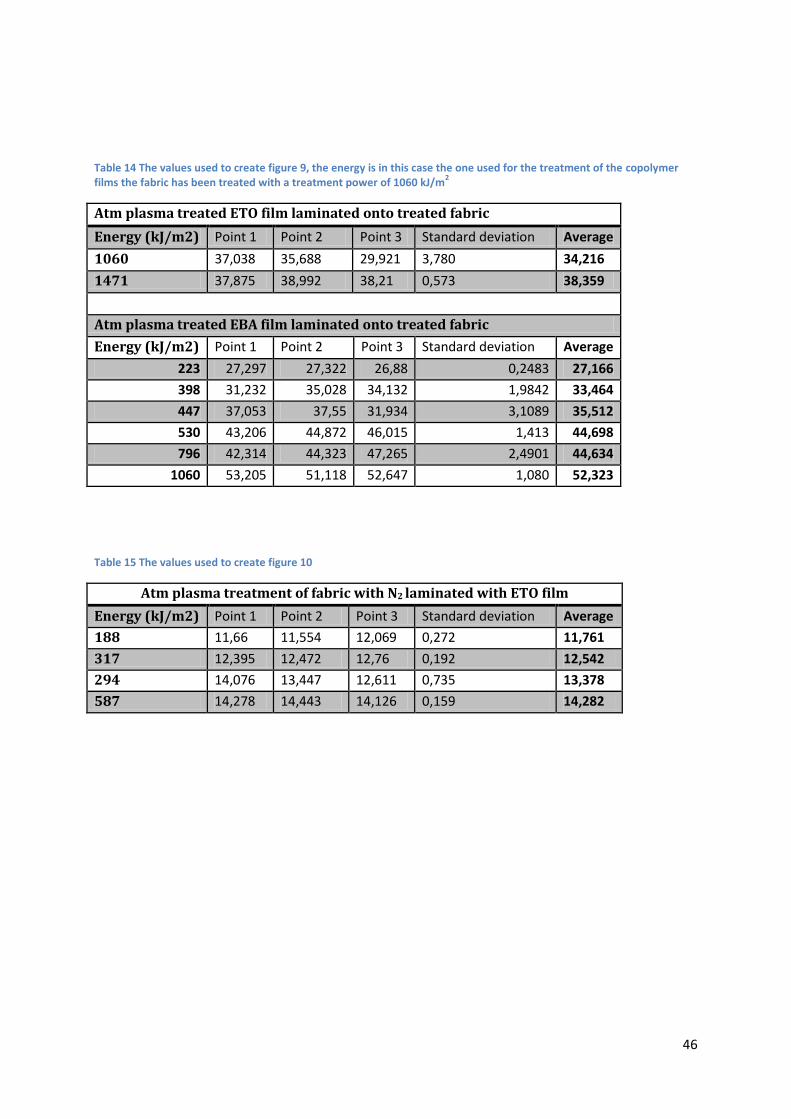
46
Table 14 The values used to create figure 9, the energy is in this case the one used for the treatment of the copolymer films the fabric has been treated with a treatment power of 1060 kJ/m
2
Atm plasma treated ETO film laminated onto treated fabric
Energy (kJ/m2) Point 1 Point 2 Point 3 Standard deviation Average
1060 37,038 35,688 29,921 3,780 34,216
1471 37,875 38,992 38,21 0,573 38,359
Atm plasma treated EBA film laminated onto treated fabric
Energy (kJ/m2) Point 1 Point 2 Point 3 Standard deviation Average
223 27,297 27,322 26,88 0,2483 27,166
398 31,232 35,028 34,132 1,9842 33,464
447 37,053 37,55 31,934 3,1089 35,512
530 43,206 44,872 46,015 1,413 44,698
796 42,314 44,323 47,265 2,4901 44,634
1060 53,205 51,118 52,647 1,080 52,323
Table 15 The values used to create figure 10
Atm plasma treatment of fabric with N2 laminated with ETO film
Energy (kJ/m2) Point 1 Point 2 Point 3 Standard deviation Average
188 11,66 11,554 12,069 0,272 11,761
317 12,395 12,472 12,76 0,192 12,542
294 14,076 13,447 12,611 0,735 13,378
587 14,278 14,443 14,126 0,159 14,282
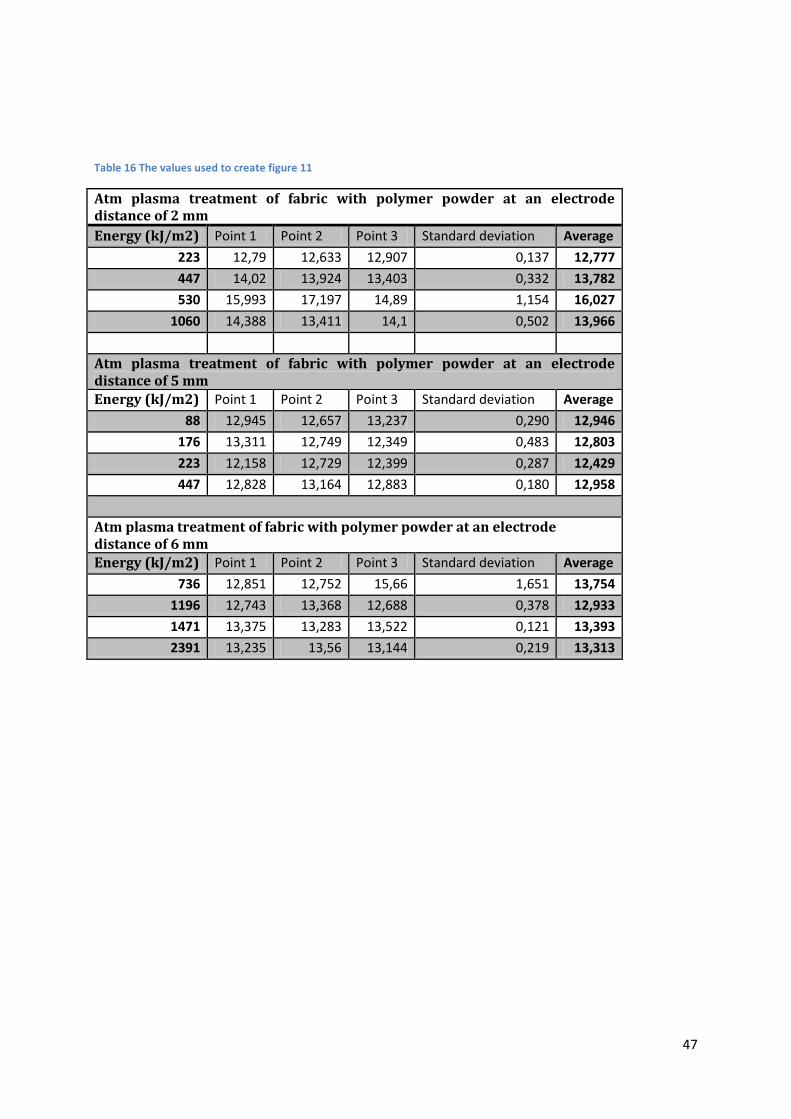
47
Table 16 The values used to create figure 11
Atm plasma treatment of fabric with polymer powder at an electrode distance of 2 mm
Energy (kJ/m2) Point 1 Point 2 Point 3 Standard deviation Average
223 12,79 12,633 12,907 0,137 12,777
447 14,02 13,924 13,403 0,332 13,782
530 15,993 17,197 14,89 1,154 16,027
1060 14,388 13,411 14,1 0,502 13,966
Atm plasma treatment of fabric with polymer powder at an electrode distance of 5 mm
Energy (kJ/m2) Point 1 Point 2 Point 3 Standard deviation Average
88 12,945 12,657 13,237 0,290 12,946
176 13,311 12,749 12,349 0,483 12,803
223 12,158 12,729 12,399 0,287 12,429
447 12,828 13,164 12,883 0,180 12,958
Atm plasma treatment of fabric with polymer powder at an electrode distance of 6 mm
Energy (kJ/m2) Point 1 Point 2 Point 3 Standard deviation Average
736 12,851 12,752 15,66 1,651 13,754
1196 12,743 13,368 12,688 0,378 12,933
1471 13,375 13,283 13,522 0,121 13,393
2391 13,235 13,56 13,144 0,219 13,313
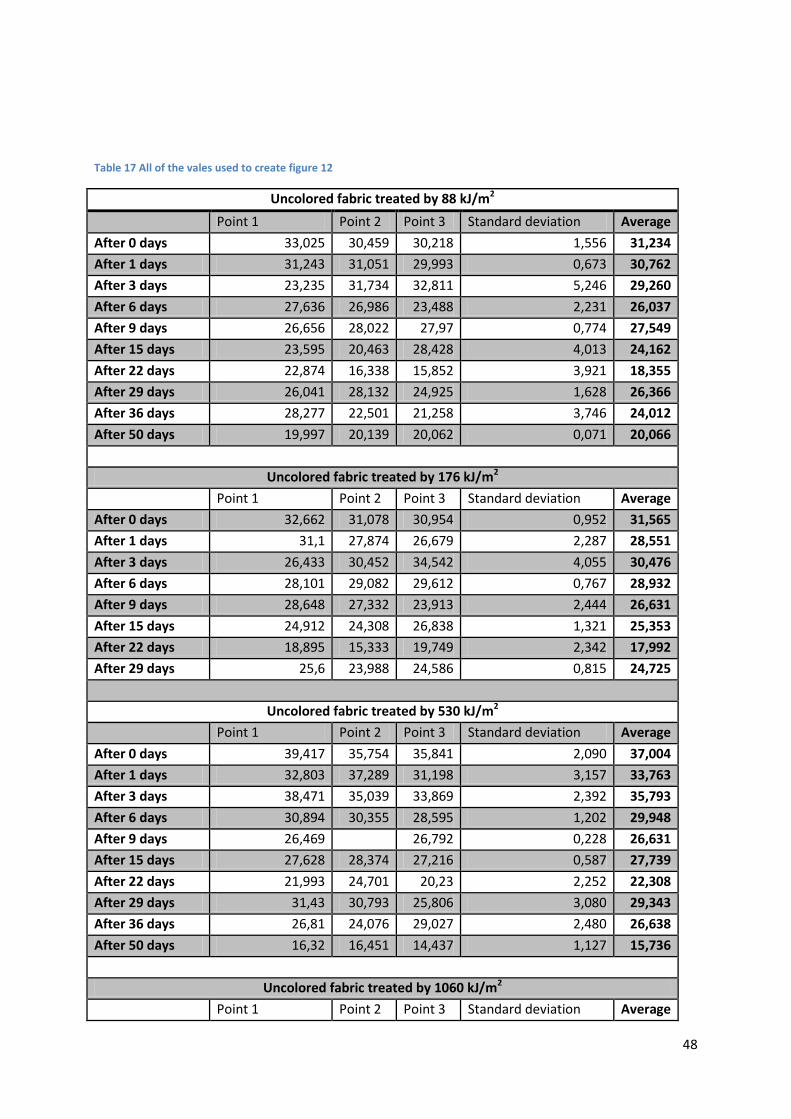
48
Table 17 All of the vales used to create figure 12
Uncolored fabric treated by 88 kJ/m2
Point 1 Point 2 Point 3 Standard deviation Average
After 0 days 33,025 30,459 30,218 1,556 31,234
After 1 days 31,243 31,051 29,993 0,673 30,762
After 3 days 23,235 31,734 32,811 5,246 29,260
After 6 days 27,636 26,986 23,488 2,231 26,037
After 9 days 26,656 28,022 27,97 0,774 27,549
After 15 days 23,595 20,463 28,428 4,013 24,162
After 22 days 22,874 16,338 15,852 3,921 18,355
After 29 days 26,041 28,132 24,925 1,628 26,366
After 36 days 28,277 22,501 21,258 3,746 24,012
After 50 days 19,997 20,139 20,062 0,071 20,066
Uncolored fabric treated by 176 kJ/m2
Point 1 Point 2 Point 3 Standard deviation Average
After 0 days 32,662 31,078 30,954 0,952 31,565
After 1 days 31,1 27,874 26,679 2,287 28,551
After 3 days 26,433 30,452 34,542 4,055 30,476
After 6 days 28,101 29,082 29,612 0,767 28,932
After 9 days 28,648 27,332 23,913 2,444 26,631
After 15 days 24,912 24,308 26,838 1,321 25,353
After 22 days 18,895 15,333 19,749 2,342 17,992
After 29 days 25,6 23,988 24,586 0,815 24,725
Uncolored fabric treated by 530 kJ/m2
Point 1 Point 2 Point 3 Standard deviation Average
After 0 days 39,417 35,754 35,841 2,090 37,004
After 1 days 32,803 37,289 31,198 3,157 33,763
After 3 days 38,471 35,039 33,869 2,392 35,793
After 6 days 30,894 30,355 28,595 1,202 29,948
After 9 days 26,469 26,792 0,228 26,631
After 15 days 27,628 28,374 27,216 0,587 27,739
After 22 days 21,993 24,701 20,23 2,252 22,308
After 29 days 31,43 30,793 25,806 3,080 29,343
After 36 days 26,81 24,076 29,027 2,480 26,638
After 50 days 16,32 16,451 14,437 1,127 15,736
Uncolored fabric treated by 1060 kJ/m2
Point 1 Point 2 Point 3 Standard deviation Average

49
After 0 days 32,107 30,768 35,079 2,206 32,651
After 1 days 36,173 31,344 35,535 2,623 34,351
After 3 days 34,186 40,722 44,893 5,397 39,934
After 6 days 32,348 25,394 27,248 3,601 28,330
After 9 days 29,207 30,294 33,858 2,433 31,120
After 15 days 27,393 23,026 22,422 2,713 24,280
After 22 days 13,866 13,194 15,227 1,036 14,096
After 29 days 28,878 32,974 31,365 2,064 31,072
After 36 days 18,37 23,651 22,698 2,815 21,573
After 50 days 24,457 22,073 22,796 1,222 23,109
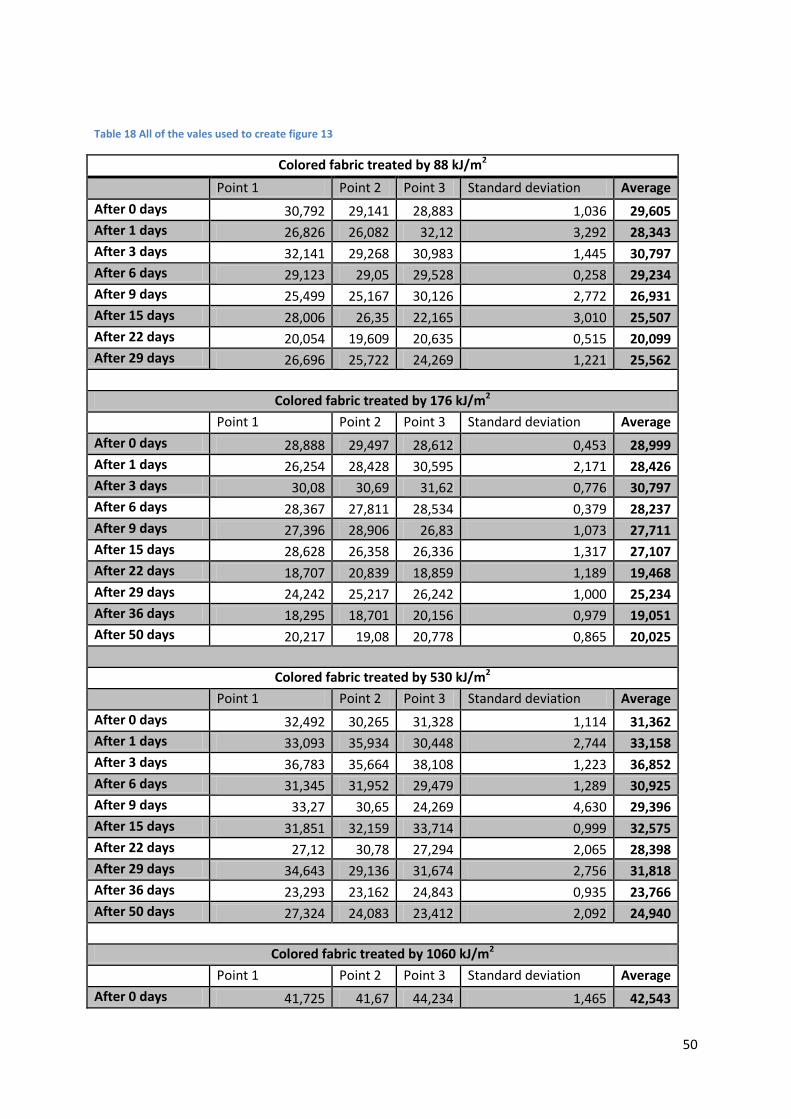
50
Table 18 All of the vales used to create figure 13
Colored fabric treated by 88 kJ/m2
Point 1 Point 2 Point 3 Standard deviation Average
After 0 days 30,792 29,141 28,883 1,036 29,605
After 1 days 26,826 26,082 32,12 3,292 28,343
After 3 days 32,141 29,268 30,983 1,445 30,797
After 6 days 29,123 29,05 29,528 0,258 29,234
After 9 days 25,499 25,167 30,126 2,772 26,931
After 15 days 28,006 26,35 22,165 3,010 25,507
After 22 days 20,054 19,609 20,635 0,515 20,099
After 29 days 26,696 25,722 24,269 1,221 25,562
Colored fabric treated by 176 kJ/m2
Point 1 Point 2 Point 3 Standard deviation Average
After 0 days 28,888 29,497 28,612 0,453 28,999
After 1 days 26,254 28,428 30,595 2,171 28,426
After 3 days 30,08 30,69 31,62 0,776 30,797
After 6 days 28,367 27,811 28,534 0,379 28,237
After 9 days 27,396 28,906 26,83 1,073 27,711
After 15 days 28,628 26,358 26,336 1,317 27,107
After 22 days 18,707 20,839 18,859 1,189 19,468
After 29 days 24,242 25,217 26,242 1,000 25,234
After 36 days 18,295 18,701 20,156 0,979 19,051
After 50 days 20,217 19,08 20,778 0,865 20,025
Colored fabric treated by 530 kJ/m2
Point 1 Point 2 Point 3 Standard deviation Average
After 0 days 32,492 30,265 31,328 1,114 31,362
After 1 days 33,093 35,934 30,448 2,744 33,158
After 3 days 36,783 35,664 38,108 1,223 36,852
After 6 days 31,345 31,952 29,479 1,289 30,925
After 9 days 33,27 30,65 24,269 4,630 29,396
After 15 days 31,851 32,159 33,714 0,999 32,575
After 22 days 27,12 30,78 27,294 2,065 28,398
After 29 days 34,643 29,136 31,674 2,756 31,818
After 36 days 23,293 23,162 24,843 0,935 23,766
After 50 days 27,324 24,083 23,412 2,092 24,940
Colored fabric treated by 1060 kJ/m2
Point 1 Point 2 Point 3 Standard deviation Average
After 0 days 41,725 41,67 44,234 1,465 42,543

51
After 1 days 41,154 45,174 46,7 2,865 44,343
After 3 days 44,369 43,656 41,11 1,713 43,045
After 6 days 39,157 28,17 33,66 5,494 33,662
After 9 days 33,518 26,084 32,712 4,079 30,771
After 15 days 35,808 34,968 33,565 1,133 34,780
After 22 days 27,825 23,785 30,91 3,573 27,507
After 29 days 31,091 29,085 30,328 1,013 30,168
After 36 days 18,32 17,805 20,561 1,465 18,895

52
Table 19 The parameters used for the different atmospheric plasma treatment of the fabrics used in the project.
Treatment energy kJ/m2
Process gas
Electrode distance
Electrode temp
Number of cycles
Treatment power
Value of tender frame speed control
88 He 1 50 3 1000 2,5
88 He 2 50 3 1000 2,5
88 He 5 50 3 1000 2,5
122 He 1 50 3 1000 2
176 He 1 50 6 1000 2,5
176 He 5 50 6 1000 2,5
176 He/N2 1 50 6 1000 2,5
176 He/O2 1 50 6 1000 2,5
188 N2 1 50 3 1500 2,5
223 He 1 50 3 2000 2,5
223 He 2 50 3 2000 2,5
223 He 5 50 3 2000 2,5
245 He 1 50 6 1000 2
294 N2 1 50 3 2500 2,5
317 N2 1 50 6 1500 2,5
447 He 1 50 6 2000 2,5
447 He 2 50 6 2000 2,5
447 He 5 50 6 2000 2,5
530 He 1 50 3 4000 2,5
530 He 2 50 3 4000 2,5
587 N2 1 50 6 2500 2,5
587 He/O2 1 50 6 2500 2,5
736 He 6 50 3 5000 2,5
1060 He 1 50 6 4000 2,5
1060 He 2 50 6 4000 2,5
1060 He/N2 2 50 6 4000 2,5
1196 He 6 50 3 7000 2,5
1471 He 6 50 6 5000 2,5
2391 He 6 50 6 7000 2,5
Table 20 The parameters used for the different atmospheric plasma treatment of the polymer films used in the project.
Treatment energy kJ/m2
Process gas
Electrode distance
Electrode temp
Number of cycles
Treatment power
Value of tender frame speed control
223 He 2,5 30 3 2000 2,5
398 He 2,5 30 3 3000 2,5
447 He 2,5 30 6 2000 2,5
530 He 2,5 30 3 4000 2,5
796 He 2,5 30 6 3000 2,5
1060 He 2,5 30 6 4000 2,5
1471 He 2,5 30 6 5000 2,5

53