Embed Size (px)
Citation preview

IMPROVE Corrects OC and EC for a Positive Artifact
The positive artifact correction causes the organic and elemental carbon to approach zero as fine mass goes to zero
Shenandoah, VA 1999, IMPROVE
0
0.5
1
1.5
2
2.5
3
3.5
4
4.5
5
0 5 10 15 20 25 30
Fine Particle Mass (g/m3)
Car
bo
n M
ass
(
g/m
3)
Light Abs. CarbonOrganic Carbon
Burlington, VT 2001, EPA STN
0
1
2
3
4
5
6
7
8
0 10 20 30 40
Fine Particle Mass (g/m3)
Ca
rbo
n M
as
s (
g/m
3 )
SASS_ECSASS_OC
IMPROVE: Artifact CorrectedOC ~ 0.3, EC ~0.02 g/m3
EPA STN monitoring site: No carbon artifact correction


IMPROVE and STN Fine Mass Budgets
• OC is scaled by 1.4 to account for oxygen and hydrogen mass• OC accounts for ~20% of fine mass at Washington, ~43% at Baltimore• EC accounts for ~6% of fine mass at Washington, ~4.4% at Baltimore
Reconstructed fine mass:
Washington, DC 2001 - IMPROVE
0%
20%
40%
60%
80%
100%
Jan Mar May Jul Sep Nov
Per
cen
t F
ine
mas
s
Organic EC Amm. SulfateAmm. Nitrate Soil Other
Baltimore, MD 2001 - STN
0%
20%
40%
60%
80%
100%
120%
Jan Mar May Jul Sep Nov
Per
cen
t F
ine
mas
s
Organic EC Amm. SulfateAmm. Nitrate Soil Other


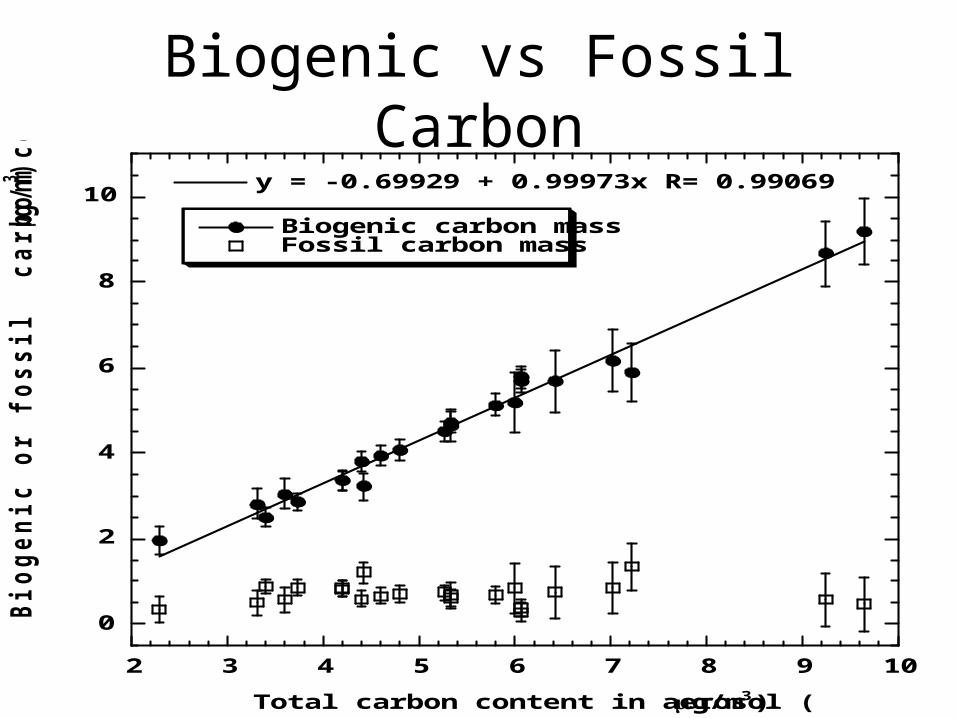
Biogenic vs Fossil Carbon
0
2
4
6
8
10
2 3 4 5 6 7 8 9 10
Biogenic carbon massFossil carbon mass
y = -0.69929 + 0.99973x R= 0.99069
Bio
gen
ic o
r f
oss
il
carb
on
con
ten
t in
aeroso
l (
g/m
3)
Total carbon content in aerosol (g/m3 )

Washington

Great Smoky

Jarbidge

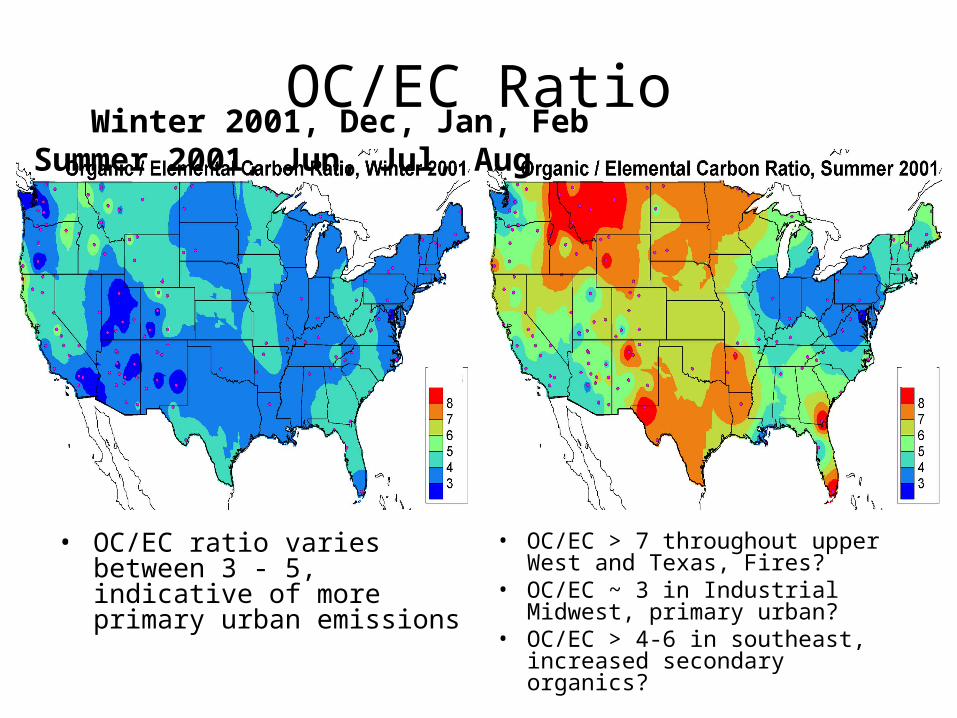
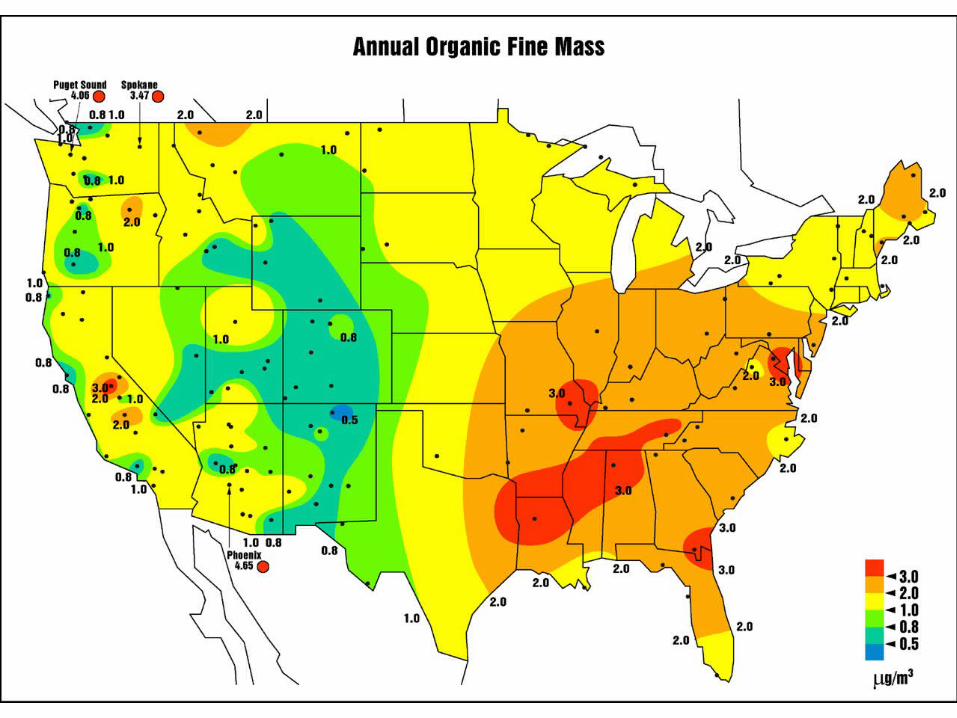
OC/EC Ratio Winter 2001, Dec, Jan, Feb Summer 2001, Jun, Jul, Aug
• OC/EC ratio varies between 3 - 5, indicative of more primary urban emissions
• OC/EC > 7 throughout upper West and Texas, Fires?
• OC/EC ~ 3 in Industrial Midwest, primary urban?
• OC/EC > 4-6 in southeast, increased secondary organics?
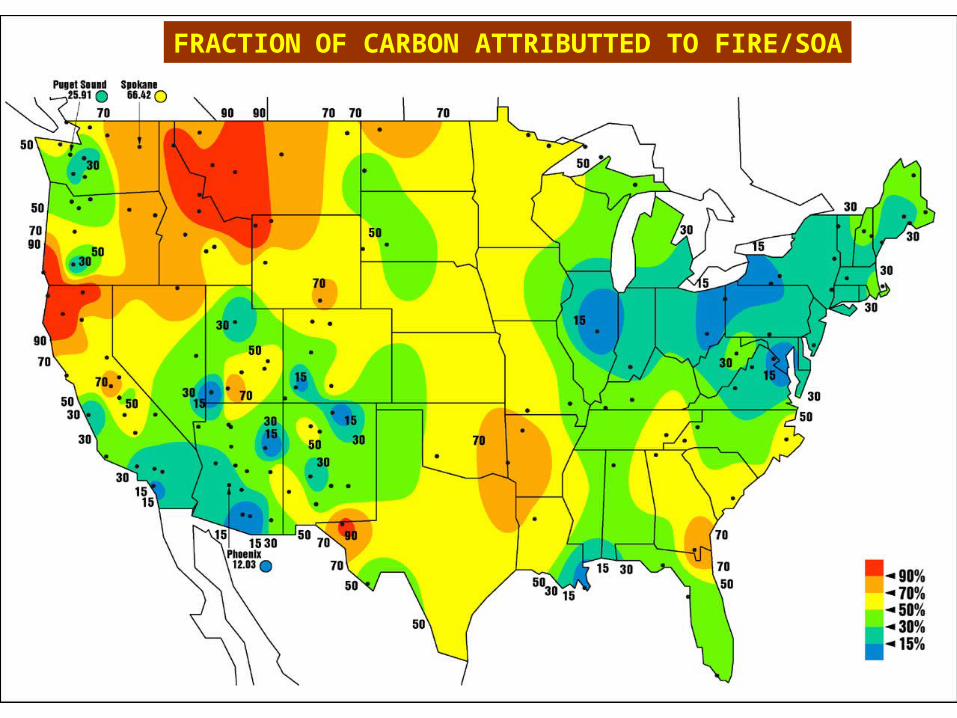
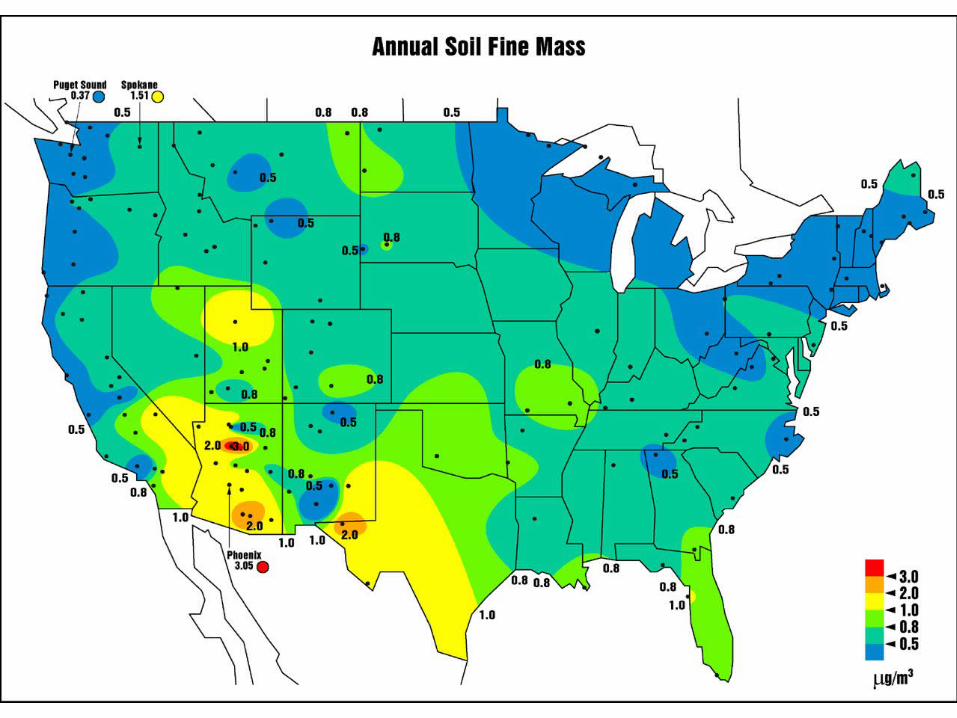
FRACTION OF CARBON ATTRIBUTTED TO FIRE/SOA


END