Embed Size (px)
Citation preview

8/3/2019 Important Natural Experiments Rdd
http://slidepdf.com/reader/full/important-natural-experiments-rdd 1/40
Difference in differences Regression Discontinuity Design Correction of the Stata exercise Conclusion
Difference in differences and RegressionDiscontinuity Design
Clément de Chaisemartin
Majeure Economie
November 2010
Clément de Chaisemartin DID and RDD

8/3/2019 Important Natural Experiments Rdd
http://slidepdf.com/reader/full/important-natural-experiments-rdd 2/40
Difference in differences Regression Discontinuity Design Correction of the Stata exercise Conclusion
1 Difference in differences
IntuitionIdentification of a causal effectDiscussion of the assumptionExamples
2 Regression Discontinuity DesignTwo policy questionsIntuitionFormal AnalysisDiscussion of the assumptionsApplications
3 Correction of the Stata exercise
4 Conclusion
Clément de Chaisemartin DID and RDD

8/3/2019 Important Natural Experiments Rdd
http://slidepdf.com/reader/full/important-natural-experiments-rdd 3/40
Difference in differences Regression Discontinuity Design Correction of the Stata exercise Conclusion
Two new impact evaluation techniques
Gold standard in impact evaluation = randomized experiments(session 6).
When it is not possible to run a randomized experiment, three
alternative possibilities:instrumental variable (session 7)Difference in differences (today)Regression discontinuity (today)
Contrary to randomized experiments, these methods are not
assumption free. Rely on assumptions which cannot be tested =>should be carefully discussed.
Clément de Chaisemartin DID and RDD

8/3/2019 Important Natural Experiments Rdd
http://slidepdf.com/reader/full/important-natural-experiments-rdd 4/40
Difference in differences Regression Discontinuity Design Correction of the Stata exercise Conclusion
Intuition
Before-After analysis
Assume you want to measure the impact of the minimum wage onemployment. Not possible to run a randomized experiment. Toughto find out an instrumental variable.
You have a data set of 200 american fast-food (FF) located in NewJersey (NJ), with the number of people employed during year N and
year N+1.FF highly relevant for this type analysis: they indeed pay theminimum wage to their employees.
We assume that the minimum wage in NJ changed between N andN+1.
You could say that impact of the change of the minimum wage =average number of employees in N+1 - average number of employees in N.
Issue = not only the minimum wage changed from the before to theafter period (business cycle...)
Clément de Chaisemartin DID and RDD
Diff i diff R i Di i i D i C i f h S i C l i

8/3/2019 Important Natural Experiments Rdd
http://slidepdf.com/reader/full/important-natural-experiments-rdd 5/40
Difference in differences Regression Discontinuity Design Correction of the Stata exercise Conclusion
Intuition
Cross-sectional analysis
Assume that on top of this data set, you have another with thesame data but for FF located in Pennsylvania (Penn) where therewas no change in the minimum wage from N to N+1 and where theminimum wage in N and N+1 was similar to that of NJ in N.
=> you could say that impact of the change of the minimum wage= average number of employees in NJ firms in N+1 - averagenumber of employees in Penn firms in N+1.
Issue = NJ and Penn differ on more aspects than just minimumwage. => your estimate might capture more than just the minimum
wage effect (maybe fast-food are just bigger in one state than in theother : larger population, larger cities...)
=> any idea to circumvent these two issues ?
Clément de Chaisemartin DID and RDD
Difference in differences Regression Discontin ity Design Correction of the Stata e ercise Concl sion

8/3/2019 Important Natural Experiments Rdd
http://slidepdf.com/reader/full/important-natural-experiments-rdd 6/40
Difference in differences Regression Discontinuity Design Correction of the Stata exercise Conclusion
Intuition
Difference in differences
impact of the change of the minimum wage = average number of employees in NJ FF in N+1 - average number of employees in NJFF in N-(average number of employees in Penn FF in N+1 - averagenumber of employees in Penn FF in N).
Difference in differences or double differences.Intuition: you observe a change in FF size from N to N+1 in NJ.
Some of it is due to the change in the minimum wage, some of itwould have happened anyway.To measure the change that would have happened anyway, you do
the same computation but in a State where there has been nochange in the minimum wage.=> effect of the minimum wage = total change - change that wouldhave happened anyway.
Clément de Chaisemartin DID and RDD
Difference in differences Regression Discontinuity Design Correction of the Stata exercise Conclusion

8/3/2019 Important Natural Experiments Rdd
http://slidepdf.com/reader/full/important-natural-experiments-rdd 7/40
Difference in differences Regression Discontinuity Design Correction of the Stata exercise Conclusion
Identification of a causal effect
Framework and notations (1/2)
Two groups (NJ and Penn, Test and Control group) represented by a dummy G .
Two periods of time (before and after) represented by a dummy T .
One treatment, represented by a dummyD
.D
=T ×G
. Only observationsfrom the treatment group in period 1 are treated.
Potential outcomes:
Y (1): what happens to someone if he receives the treatment.Y (0): what happens to someone if he does not receive receives thetreatment.Y
= observed outcome
Clément de Chaisemartin DID and RDD
Difference in differences Regression Discontinuity Design Correction of the Stata exercise Conclusion

8/3/2019 Important Natural Experiments Rdd
http://slidepdf.com/reader/full/important-natural-experiments-rdd 8/40
Difference in differences Regression Discontinuity Design Correction of the Stata exercise Conclusion
Identification of a causal effect
Framework and notations (2/2)
For the test group in period 1, is Y equal to Y (1) or to Y (0) ? For the controlgroup in period 0 ?
What we want to identify is E (Y (1) − Y (0)|T = 1,
G = 1) = E (Y (1)|T =1,G = 1) − E (Y (0)|T = 1,G = 1). Which of these two expectations can weeasily estimate from the sample ? Which one is missing ?
FF example: average number of employees in NJ FF after the minimum wageincrease minus the the average number of employees in NJ FF after theminimum wage increase if actually the minimum wage had not increased.
Clément de Chaisemartin DID and RDD
Difference in differences Regression Discontinuity Design Correction of the Stata exercise Conclusion

8/3/2019 Important Natural Experiments Rdd
http://slidepdf.com/reader/full/important-natural-experiments-rdd 9/40
Difference in differences Regression Discontinuity Design Correction of the Stata exercise Conclusion
Identification of a causal effect
Summary
100% treated
T = 0 T = 1
G = 0
G = 1
0% treated 0% treated
0% treated
In the minimum wage example, are we indeed facing this situation ?
Clément de Chaisemartin DID and RDD
Difference in differences Regression Discontinuity Design Correction of the Stata exercise Conclusion

8/3/2019 Important Natural Experiments Rdd
http://slidepdf.com/reader/full/important-natural-experiments-rdd 10/40
g y g
Identification of a causal effect
Common trend assumption
Assumption: E (Y (0)|T = 1,G = 1) − E (Y (0)|T = 0,G = 1) = E (Y (0)|T =1,G = 0) − E (Y (0)|T = 0,G = 0).
Interpretation of the assumption in the minimum wage example: without the riseof the minimum wage, average number of employees in NJ FF would have
followed the same evolution from period 0 to 1 than the evolution observed inPennsylvania.
Under this assumption:
E (Y (0)|T = 1,G = 1) = E (Y (0)|T = 0,G = 1) + E (Y (0)|T = 1,G = 0) − E (Y (0)|T = 0,G = 0)
and therefore E (Y (1) − Y (0)|T = 1,G = 1)
= E (Y (1)|T = 1,
G = 1) − E (Y (0)|T = 0,
G = 1) − [E (Y (0)|T = 1,
G = 0) − E (Y (0)|T = 0,
G = 0)]
Double difference or difference in differences (DID).
Clément de Chaisemartin DID and RDD
Difference in differences Regression Discontinuity Design Correction of the Stata exercise Conclusion

8/3/2019 Important Natural Experiments Rdd
http://slidepdf.com/reader/full/important-natural-experiments-rdd 11/40
y
Identification of a causal effect
Regression analysis
If you run the following regression:Y = α + β × 1{G =1} + γ × 1{T =1} + δ × 1{G =1} × 1{T =1} + ε,
δ = DID .Indeed, E (Y |T = 0,G = 0) = α, E (Y |T = 1,G = 0) = α + γ ,E (Y |T = 0,G = 1) = α + β , E (Y |T = 1,G = 1) = α + β + γ + δ.
=> you can easily get the difference in differences estimator and itst-statistic from this regression.
Clément de Chaisemartin DID and RDD
Difference in differences Regression Discontinuity Design Correction of the Stata exercise Conclusion

8/3/2019 Important Natural Experiments Rdd
http://slidepdf.com/reader/full/important-natural-experiments-rdd 12/40
Discussion of the assumption
Interpretation of the common trend assumption
Diff in diff is clearly not assumption free: the very strong assumptionis the common trend assumption.
What it means = without the reform, the trend in fast foodemployment would have been the same in NJ and Penn.
Might not be true: assume for instance that business cycles are notat all the same in NJ and Penn. Maybe the differential trend in FFemployment is not due to the reform but just to the fact that theeconomic conjecture in NJ and Penn did not follow the same trendat all from year N to N+1.
The smaller the time periods you look at, the more likely it is thatthe assumption is verified. If instead of years your units of time aremonths.
Any idea on how one could test the common trend assumption ?
Clément de Chaisemartin DID and RDD
Difference in differences Regression Discontinuity Design Correction of the Stata exercise Conclusion

8/3/2019 Important Natural Experiments Rdd
http://slidepdf.com/reader/full/important-natural-experiments-rdd 13/40
Discussion of the assumption
Test of the assumption
Not testable by a formal test.
Graphical test: if you have several years of data, you can testwhether the outcome variable followed parallel trends over theperiod except in the year of the reform.
Assume that the minimum wage reform was implemented on01/01/1993. If you also have data on the same FF in 1991 and1992, you can compute the same DID but from 1991 to 1992, thatis to say over two years when there was no change in the minimumwage. This is what we call a “placebo difference in difference”.
If your common trend assumption is true, do you expect to find thatthis placebo difference is large or small ?
Clément de Chaisemartin DID and RDD
Difference in differences Regression Discontinuity Design Correction of the Stata exercise Conclusion

8/3/2019 Important Natural Experiments Rdd
http://slidepdf.com/reader/full/important-natural-experiments-rdd 14/40
Examples
Impact of the minimum wage on employment (1/3)
Paper by Krueger and Card, 1994.Increase of the minimum wage in April 1992 in New Jersey, from4.25$ to 5.05$ per hour. 19% increase. In the meanwhile, minimumwage in the neighboring state of Pennsylvania remained unchanged.
Totally changes the wage distribution in restaurants:
Clément de Chaisemartin DID and RDD
Difference in differences Regression Discontinuity Design Correction of the Stata exercise Conclusion

8/3/2019 Important Natural Experiments Rdd
http://slidepdf.com/reader/full/important-natural-experiments-rdd 15/40
Examples
Impact of the minimum wage on employment (2/3)
Conduct two waves of surveys: one before and one after theincrease, and ask to the managers of 200 FF in each state how manyemployees they have.
Increase in minimum wage => increase in employment (+2.76employees).
Clément de Chaisemartin DID and RDD
Difference in differences Regression Discontinuity Design Correction of the Stata exercise Conclusion

8/3/2019 Important Natural Experiments Rdd
http://slidepdf.com/reader/full/important-natural-experiments-rdd 16/40
Examples
Impact of the minimum wage on employment (3/3)
Issues with the paper: they do not have several years of data =>can not run the “placebo” tests described above.
However, they have employment data on high standards restaurants=> compute the diff in diff estimator on them and this is 0 asexpected (a rise in the minimum wage should not have any impacton them).
Clément de Chaisemartin DID and RDD
Difference in differences Regression Discontinuity Design Correction of the Stata exercise Conclusion

8/3/2019 Important Natural Experiments Rdd
http://slidepdf.com/reader/full/important-natural-experiments-rdd 17/40
Examples
Impact of the 2007 smoking ban in workplaces in France
In February 2007, smoking was banned from workplaces in France.
Did it give more motivation to working smokers to quit ?Data: network of tobacco cessation centers.Comparison of the quitting rate among employed and not employedpatients.
Clément de Chaisemartin DID and RDD
Difference in differences Regression Discontinuity Design Correction of the Stata exercise Conclusion

8/3/2019 Important Natural Experiments Rdd
http://slidepdf.com/reader/full/important-natural-experiments-rdd 18/40
Two policy questions
Do unemployment benefits increase unemployment duration?
Unemployment benefits:
Pros:
safety net for those who loose their jobs. Insurance system.no benefits might be counter-productive: forces unemployed toaccept whatever type of jobs, even if do not correspond to theirqualifications.
Cons:
unemployment benefits = an incentive for unemployed not to lookfor a job.
Clément de Chaisemartin DID and RDD
Difference in differences Regression Discontinuity Design Correction of the Stata exercise Conclusion

8/3/2019 Important Natural Experiments Rdd
http://slidepdf.com/reader/full/important-natural-experiments-rdd 19/40
Two policy questions
Do students learn better in small classrooms ?
Important question: if the answer = class size has no impact on students’performance, you can save a lot of public money setting up classrooms of 50students => less teachers.
Much debated, but in the public debate, analysts tend to compare apples andoranges:
first type of analysis = international comparisons. Korean students dobetter than German ones whereas classroom size is much larger in Koreaand in Germany. Makes sense ?second type of analysis: univariate regressions in a given country. AmongFrench students, regress their score in a national exam on the number of students in their class. Makes sense ?third type of analysis: multivariate regressions. Among French students,regress their score in a national exam on the number of students in theirclass + control variables (income of their parents...). Makes sense ?
=> need to find an empirical strategy which allows comparing apples and apples.
Clément de Chaisemartin DID and RDD
Difference in differences Regression Discontinuity Design Correction of the Stata exercise Conclusion

8/3/2019 Important Natural Experiments Rdd
http://slidepdf.com/reader/full/important-natural-experiments-rdd 20/40
Intuition
Using thresholds to identify the effect of a policy
In Israël schools, there cannot be a class with more than 40students. => if you have a school with 40 children enrolled in grade1: only one grade 1 class. If 41 students => 2 grade 1 classes (onehas 21 students, the other one has 20 students).
=> to measure the impact of class size on students achievement,maybe you can compare schools with 40 grade 1 students to schoolswith 41 grade 1 students.
Intuition: for sure, big schools and small schools are not similar(urban / rural etc...) => school size is not independant fromstudent’s performance.
However, passing from 40 to 41 students is something which can beregarded as random: schools with 40 grade 1 students should besimilar to those with 41, but very strong difference in class size.
=> to identify the effect of class size on students’ performance,compare achievement of students in schools with 40 students toachievement of students in schools with 41 students.
Clément de Chaisemartin DID and RDD
Difference in differences Regression Discontinuity Design Correction of the Stata exercise Conclusion

8/3/2019 Important Natural Experiments Rdd
http://slidepdf.com/reader/full/important-natural-experiments-rdd 21/40
Intuition
Sharp or fuzzy design ?
Sharp design: the rule is deterministic. If you are more than 50 yearsold then you get larger unemployment benefits.
Fuzzy design: the rule is not deterministic. some headmasters willdecide to open a new class from 35 students onwards (parent’spressure, size of the classroom). However, the rule has some impacton the actual class size.
Clément de Chaisemartin DID and RDD
Difference in differences Regression Discontinuity Design Correction of the Stata exercise Conclusion

8/3/2019 Important Natural Experiments Rdd
http://slidepdf.com/reader/full/important-natural-experiments-rdd 22/40
Formal Analysis
Identification of the treatment effect (1/2)
To simplify, we assume that the treatment is binary (receive unemploymentbenefits over a long period or over a short period according to your age.
In Austria, in some areas, if you are unemployed and more than 50, you getunemployment benefits for a long time (2 years) whereas you get them for only 6months if you are below 50: T = 1 iif A ≥ 50.
We are in the sharp design situation.Outcome of interest: whether those unemployed find a job in less than months.
Each individual has once more two binary outcomes: Y 1 and Y 0. For individualsstrictly below 50 which outcome do we observe ? For individuals above 50 whichoutcome do we observe ? We observe Y = Y 0 + 1{A≥50}(Y 1 − Y 0)
What we assume is that E (Y 1|A) and E (Y 0|A) are continuous functions of A.
We acknowledge the fact that the probability to find a job is a function of age(not the same for old than young unemployed). But we are just assuming that itchanges continuously with age.
=> how to estimate a causal impact of the treatment with these assumptions ?
Clément de Chaisemartin DID and RDD
Difference in differences Regression Discontinuity Design Correction of the Stata exercise Conclusion

8/3/2019 Important Natural Experiments Rdd
http://slidepdf.com/reader/full/important-natural-experiments-rdd 23/40
Formal Analysis
Identification of the treatment effect (sharp design) (2/2)
By comparing the probability of finding a job of individuals “slightly”below 50 to the same probability but for individuals “slightly” above
50.limA→50,A≥50E (Y |A) − limA→50,A<50E (Y |A) =limA→50,A≥50E (Y 1|A) − limA→50,A<50E (Y 0|A)= E (Y 1|A = 50) − E (Y 0|A = 50) = E (Y 1 − Y 0|A = 50), thanks tothe continuity assumption.
Clément de Chaisemartin DID and RDD
Difference in differences Regression Discontinuity Design Correction of the Stata exercise Conclusion
F l A l i

8/3/2019 Important Natural Experiments Rdd
http://slidepdf.com/reader/full/important-natural-experiments-rdd 24/40
Formal Analysis
Estimation of the treatment effect in the sharp design case
An interesting quantity (E (Y 1 − Y 0|A = 50)) is equal to somethingwe can estimate from the sample:limA→50,A≥50E (Y |A) − limA→50,A<50E (Y |A).
to estimate limA→50,A≥50E (Y |A) − limA→50,A<50E (Y |A), run thefollowing regression:
Y = α + β 1(A− 50) + β 2(A− 50)2 + ... + β k (A− 50)k
+β
1(A− 50)1{A≥50} + β
2(A− 50)21{A≥50} + ... + β
k (A− 50)k 1{A≥50} +
γ 1{A≥50} + ε
You can check that under this model,γ = limA→50,A≥50E (Y |A) − limA→50,A<50E (Y |A).
Clément de Chaisemartin DID and RDD
Difference in differences Regression Discontinuity Design Correction of the Stata exercise Conclusion
F l A l i

8/3/2019 Important Natural Experiments Rdd
http://slidepdf.com/reader/full/important-natural-experiments-rdd 25/40
Formal Analysis
Intuition
Estimate Y as a continuous (polynomial) function in the left handside of the threshold, and in the right hand side, and see whetherthese two functions connect at the threshold.
Clément de Chaisemartin DID and RDD
Difference in differences Regression Discontinuity Design Correction of the Stata exercise Conclusion
Formal Analysis

8/3/2019 Important Natural Experiments Rdd
http://slidepdf.com/reader/full/important-natural-experiments-rdd 26/40
Formal Analysis
Estimation of the treatment effect in the fuzzy design case(1/2)
Back to the class size example
If you run the regression:Y = α + β 1(SS − 40) + β 2(SS − 40)2 + ... + β k (SS − 40)k
β
1(SS − 40)1{SS ≥40} + β
2(SS − 40)21{SS ≥40} + ... + β
k (SS −
40)k 1{SS ≥40} + γ CS + εwhere SS denotes the size of the school, CS is the size of the classand Y is for instance the results of students in a nation-wideexamination, you will not get a good estimate of the impact of classsize on achievement at school.
CS is indeed likely to be correlated with ε. We are in the fuzzydesign case => there are some variations that we observe in CS
which are not caused by S (classes that open before the 40th
student due to parents pressure etc...). Which schools will choose toopen a new classroom even if they have less than 40 students ?
Clément de Chaisemartin DID and RDD
Difference in differences Regression Discontinuity Design Correction of the Stata exercise Conclusion
Formal Analysis

8/3/2019 Important Natural Experiments Rdd
http://slidepdf.com/reader/full/important-natural-experiments-rdd 27/40
Formal Analysis
Estimation of the treatment effect in the fuzzy design case(2/2)
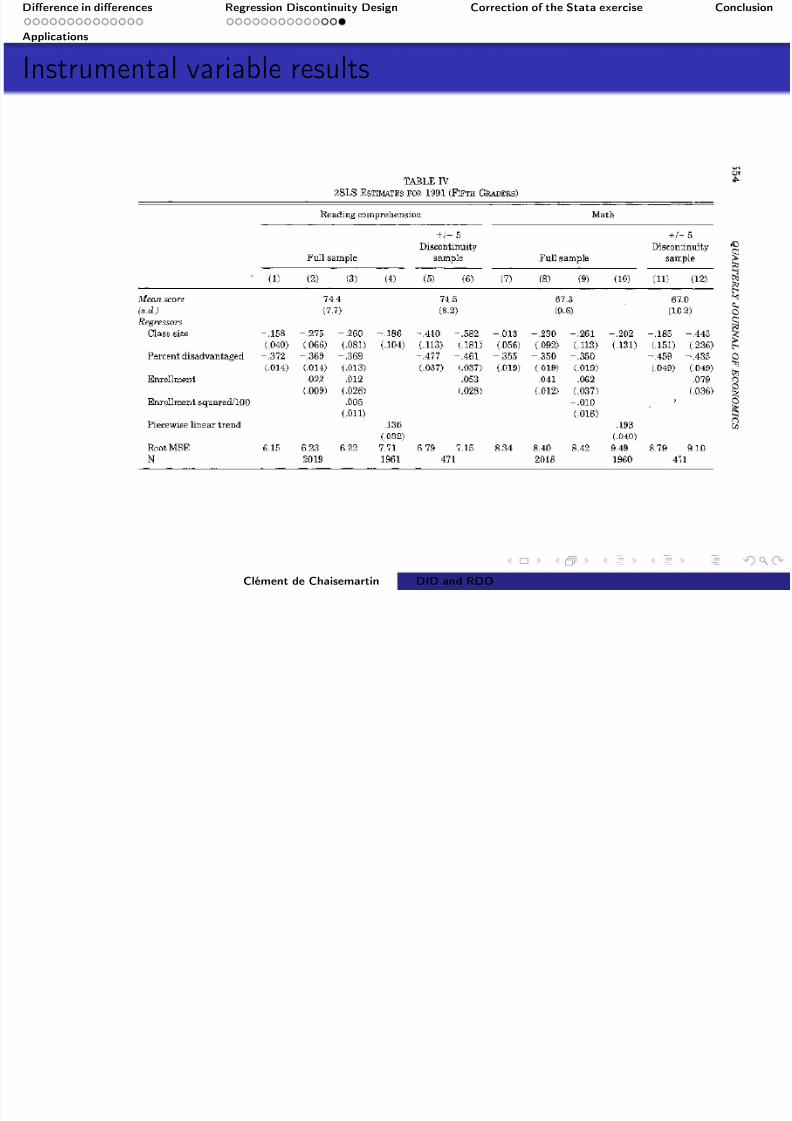
=> you instrument CS by the threshold variable.
Then you run the regression:
Y = α + β 1(SS − 40) + β 2(SS − 40)2 + ... + β k (SS − 40)k
+β
1(SS − 40)1{SS ≥40} + β
2(SS − 40)21{SS ≥40} + ... + β
k (SS −
40)k 1{SS ≥40} + γ CS + ε
2SLS procedure.
CS = variation in class size only due to the size of the school.What will be the value of γ ?
Clément de Chaisemartin DID and RDD
Difference in differences Regression Discontinuity Design Correction of the Stata exercise Conclusion
Discussion of the assumptions

8/3/2019 Important Natural Experiments Rdd
http://slidepdf.com/reader/full/important-natural-experiments-rdd 28/40
Discussion of the assumptions
Informal tests
No formal test of the continuity assumption.
In the class size example, you can plot for instance some studentscharacteristics (X =parents income...) as a function of the size of theschool. What you expect = no big jump at the 40 students threshold.
Intuition: Y jumps at the threshold, and so does CS . If those things =the two only things which jump, then we can attribute the jump in Y to
the jump inCS
(people comparable with every respect in the left and inthe right of the threshold except with respect to CS ).
But if other things jump at the threshold, such as parents income, thenwe do not know whether jump in Y due to jump in CS or to jump inparents income.
Example of micro-credit program in Mexico: eligibility rule = having a
land smaller than 1 ha (10 000 m2). => some people temporarily soldpart of their land to benefit from the program. => now, people in the leftand in the right of the threshold no longer comparable. In the left: peoplewhose land = really below 1 ha + dishonest people with land above 1ha.In the right, only honest people whose land is above 1ha. => you arecomparing apples and bananas again !
Clément de Chaisemartin DID and RDD
Difference in differences Regression Discontinuity Design Correction of the Stata exercise Conclusion
Applications

8/3/2019 Important Natural Experiments Rdd
http://slidepdf.com/reader/full/important-natural-experiments-rdd 29/40
ppl cat ons
Graphical analysis in the class size example
Clément de Chaisemartin DID and RDD
Difference in differences Regression Discontinuity Design Correction of the Stata exercise Conclusion
Applications

8/3/2019 Important Natural Experiments Rdd
http://slidepdf.com/reader/full/important-natural-experiments-rdd 30/40
pp
OLS results
Clément de Chaisemartin DID and RDD
Difference in differences Regression Discontinuity Design Correction of the Stata exercise Conclusion
Applications
8/3/2019 Important Natural Experiments Rdd
http://slidepdf.com/reader/full/important-natural-experiments-rdd 31/40
Instrumental variable results
Clément de Chaisemartin DID and RDD
Difference in differences Regression Discontinuity Design Correction of the Stata exercise Conclusion

8/3/2019 Important Natural Experiments Rdd
http://slidepdf.com/reader/full/important-natural-experiments-rdd 32/40
Stata exercise
Clément de Chaisemartin DID and RDD
Difference in differences Regression Discontinuity Design Correction of the Stata exercise Conclusion

8/3/2019 Important Natural Experiments Rdd
http://slidepdf.com/reader/full/important-natural-experiments-rdd 33/40
Exam (1/2)
List of the proofs exigible for the exam (5% of final grade):
Session 2:
deriving α and β from the OLS minimization modelproof of the fact that under the univariate linear model assumptionsβ = cov (X ,Y )
V (X )
consistency of β
Session 3:
proof of the fact that in the multivariate regression model, β 1 = cov e ( r 1,Y )
V e ( r 1)where r 1 is the estimated residual in the regression of
X 1 on all the other explanatory variables.
proof that if cov e (X 1,X 2) = 0, then β 11
, the coefficient of X 1 when
Y is regressed on X 1only is the same than β 21
, the coefficient of X 1when Y is regressed on X 1and X 2.
Clément de Chaisemartin DID and RDD
Difference in differences Regression Discontinuity Design Correction of the Stata exercise Conclusion

8/3/2019 Important Natural Experiments Rdd
http://slidepdf.com/reader/full/important-natural-experiments-rdd 34/40
Exam (2/2)
Session 6:
proof of the fact that when you run a randomized experiment,E (Y 1) − E (Y 0) = E (Y 1|T = 1) − E (Y 0|T = 0) (assuming Y 1 andY 0 are discrete)
Session 7:
proof of the fact that under the 2 IV assumption, β = cov (y ,z )cov (x ,z )
.
value of β 1 when there is an omitted variable bias. Interpretation inthe change in regression coefficients induced by this result.
10% of final grade: questions related to the course.35% of final grade: questions on a paper.
Clément de Chaisemartin DID and RDD
Difference in differences Regression Discontinuity Design Correction of the Stata exercise Conclusion

8/3/2019 Important Natural Experiments Rdd
http://slidepdf.com/reader/full/important-natural-experiments-rdd 35/40
Your evaluation (1/3)
Start indicating:
How many sessions of the course you attended.
Whether your initial background in maths was strong or weak.
This will help me interpreting your comments.
Please indicate whether you think the following objectives of the coursewere reached:
Give you some basic knowledge about econometric theory (OLS)
Show you how these tools can be used by learning how to use an
econometric software and practicing on real dataMake you realize that measuring causality is both important anddifficult through the reading of empirical research articles
Clément de Chaisemartin DID and RDD
Difference in differences Regression Discontinuity Design Correction of the Stata exercise Conclusion

8/3/2019 Important Natural Experiments Rdd
http://slidepdf.com/reader/full/important-natural-experiments-rdd 36/40
Your evaluation (2/3)
Issue of highly heterogenous initial background of students. Do you thinkthat:
The course should be kept as it is
The course should be kept as it is but should become an elective so
that only students who think their initial background is sufficient willchoose to follow it
The course should remain a compulsory course, but to allow studentswith little initial background in maths to follow it, it should becomea fully applied econometrics course, that is to say a course in which
all sessions take place in the PC lab and consist of Stata exercises.There should not be an econometrics course in the program
Clément de Chaisemartin DID and RDD
Difference in differences Regression Discontinuity Design Correction of the Stata exercise Conclusion

8/3/2019 Important Natural Experiments Rdd
http://slidepdf.com/reader/full/important-natural-experiments-rdd 37/40
Your evaluation (3/3)
Stata projects were (to some extent) business oriented. But empiricalarticles we discussed in class were mostly policy oriented. You arebusiness school students => those papers might be of little interest toyou. => last question = do you think that the empirical papers westudied in class were interesting ?
Very interesting
Somewhat interesting
Not very interesting
Not interesting at all
Clément de Chaisemartin DID and RDD
Difference in differences Regression Discontinuity Design Correction of the Stata exercise Conclusion

8/3/2019 Important Natural Experiments Rdd
http://slidepdf.com/reader/full/important-natural-experiments-rdd 38/40
Useful quantitative methods for your professional life
Methods to help you to forecast future outcomes based oninformation available today: regressions.
time series model to predict future sales...logistic regression to predict whether a customer will default or not...
Method to assess the efficacy of a marketing, sales policy:
randomized experiment.
You learnt how to use a new useful software.
Clément de Chaisemartin DID and RDD
Difference in differences Regression Discontinuity Design Correction of the Stata exercise Conclusion
U f l l l i i li i

8/3/2019 Important Natural Experiments Rdd
http://slidepdf.com/reader/full/important-natural-experiments-rdd 39/40
Useful tools to get a clearer vision on some policy issues(1/2)
Impact evaluation = very important question, very difficult toanswer: what would have happened if people had not benefited fromthe program ?
Hundreds of studies try to answer this question on all kinds of policies. Results often contradictory.
Quality of the results = very unequal according to the methodologyof the study => all of them should not deserve the same degree of attention. Important to draw a hierarchy.
One key principle to assess the value of the study in assessing theimpact of a policy: in trying to reconstruct the hypothetical scenarioof what would have happened to people if they had not received theprogram, do they compare apples to apples or apples to bananas ?
Clément de Chaisemartin DID and RDD
Difference in differences Regression Discontinuity Design Correction of the Stata exercise Conclusion
U f l t l t t l i i li i

8/3/2019 Important Natural Experiments Rdd
http://slidepdf.com/reader/full/important-natural-experiments-rdd 40/40
Useful tools to get a clearer vision on some policy issues(2/2)
International comparisons: average class size is lower in the US or inFrance than in Eastern Europe, however results of students instandardized scores lower => small class size = detrimental. Butthis kind of study compare things that can not be compared. Franceand Eastern Europe educational system differ in much more aspects
than class size (% of a cohort enrolled, role of education in societyetc...).
Intra-country comparisons with OLS regression. Can be misleading if you forget the right controls: you are not yet comparing comparablethings. Can yield better results when many controls added (the
things you are comparing are now comparable with respect to somedimensions).
Quasi-experimental (IV, RDD, diff-in-diff) methods are alreadybetter.
Gold standard = randomized experiments.
Clément de Chaisemartin DID and RDD


![Natural experiments: the basics - chato.cl · Natural experiments Thad Dunning: Natural Experiments in the Social Sciences. Cambridge University Press, 2012 [link]](https://img.pdfslide.us/doc/110x75/5ed39dc91b06b3118744c11f/natural-experiments-the-basics-chatocl-natural-experiments-thad-dunning-natural.jpg)