Embed Size (px)
Citation preview

` Importance of River Flow to the Apalachicola River-Bay System
Robert J. Livingston Department of Biological Science,
Florida State University, Tallahassee, Florida 32306 USA
September 2008
Report to the Florida Department of Environmental Protection

Abstract
The Apalachicola River is one of the last major free flowing, unpolluted alluvial systems in the conterminous United States, and is a major center for endemic and endangered species. Seasonal river flooding provides the engine for mobilization and transfer of nutrients and detritus between the Apalachicola wetlands and associated river and bay areas. Food webs leading to high production of oysters, shrimp, blue crabs and fin fishes in Apalachicola Bay are linked to river flows that control salinity regimes and nutrient dynamics of the estuary. Since the mid-1970’s, the State of Florida has spent over $239 million through land acquisition to protect the Apalachicola River and Bay system. A major planning effort has been in progress for decades. Scientific reviews indicate that there has been a serious change in recent Apalachicola flow rates with an increase of the frequency and severity of low flow periods during droughts. These changes are due, in part, to water use in the upper parts of the Tri-river system. There will be increased municipal and agricultural development in the Tri-River Basin in future years that will put more pressure on river flows during drought periods. Increased frequency and duration of recent droughts have been associated with losses of about 3 million canopy trees in the non-tidal Apalachicola River wetlands. Recent droughts have caused kills of federally “protected” mussels. Minimum flows of 8000 cfs are likely to be required for maintenance of existing unionid populations, and are essential for recovery of federally listed species. Flow management for riverine and wetland productivity, biodiversity and endangered species should be based on historical seasonal and interannual river flow rates. Nutrient-induced phytoplankton productivity is an important component of estuarine food webs in the Apalachicola Estuary. The alluvial river also provides organic matter that fuels detrital food webs in the bay. Autochthonous and allochthonous organic carbon creates the resources for consumers in the Apalachicola Estuary. Recent bay sediment analyses suggest a decrease in riverine organic matter supply and a change in sediment clay content supply and/or distribution for the bay that are related, in part, to anthropogenic river alterations. This loss of detrital matter could adversely affect key food webs in the bay. Recent salinity increases due to droughts have adversely affected the highly productive upper bay grass beds. The dominant, commercially important populations of the Apalachicola estuary (oysters, blue crabs, penaeid shrimp, sciaenid fishes) are adapted to varying salinities. High salinities and reduced nutrient loading adversely affect such species. Commercial fishing landings during the 2007 drought suffered decreases of white shrimp (down 90%), brown shrimp (down 55%), blue crabs (down 55%) and flounder (down 40%). The most productive oyster bars in the bay were destroyed by predation during this drought. With reduced flows, as salinity goes up, population productivity is reduced due to altered habitat conditions and enhanced predation, competition and disease. With a more permanent reduction of freshwater flows below a level specific for the receiving system, the physically controlled, highly productive river-estuarine system will eventually become a high diversity, biologically controlled bay of substantially reduced fishery potential. It is likely that increased frequency and duration of river flow reductions in the future due to water removal by upstream human activities will eventually result in the loss of the Apalachicola resource. This process has already started in the Apalachicola system. Future, long-term changes in atmospheric conditions could lead to exacerbation of current reductions of river flows. There is a real need to organize a comprehensive scientific research program to evaluate the impacts of reduced river flow rates, and to use the objective findings to develop a water conservation plan for the ACF basin. The extrinsic and intrinsic value of the Apalachicola River and Bay system demands nothing less.
2

Table of Contents
Page I. Rationale and Conclusions 4 II. Documentation for Rationale and Conclusions 14
A. Apalachicola River Basin 14 B. Apalachicola Bay System 18 C. General Ecology 19
1. River Flows, the Apalachicola Floodplain and the Bay 21
2. Estuarine Productivity 22
3. Biological Response to Apalachicola River Flows 26
4. Habitat Type and Population Distribution 28
5. Trophic Organization of the Bay 45
6. Long-term Changes of Trophic Organization 48
7. The Apalachicola Oyster Industry 56
8. Recent Droughts and River Flow Changes 62
III. Management of the Apalachicola River-Bay System 66
IV. Current Threats to the Apalachicola River-Bay System 69
1. Cumulative Reductions of Apalachicola River Flow Rates 69 2. Recent Actions by the Federal Government 70
V. Conclusions 72 VI. Literature Cited and Bibliography 76 List of Tables 91 List of Figures 92
3

I. Rationale and Conclusions
Temperate alluvial rivers and their associated estuaries are among the most productive
and economically valuable aquatic resources in the world. Freshwater/saline wetlands and
associated coastal areas account for high quality habitats that nurture numerous, important aquatic
species. Transfers of nutrients and organic compounds from alluvial rivers to wetlands and
receiving bay areas represent an important process in river-dominated systems (Howarth 1988,
Baird and Ulanowicz, 1989; Livingston, 1984; Livingston et al., 2000). Nutrient input from river
sources has been closely associated with autochthonous phytoplankton production in receiving
coastal areas. River-driven particulate organic matter maintains detritivorous food webs in
estuaries (Livingston, 1983, 1984). However, the relative importance of different sources of both
inorganic nutrients and organic carbon (dissolved and particulate) can vary from system to system
(Peterson and Howarth, 1987). These differences can be related to the specific tidal and
hydrological attributes of a given coastal area (Odum et al., 1979). Loading of nutrients due to
urban runoff, agricultural wastes and industrial discharges often have an opposite effect on
riverine-estuarine productivity (Livingston, 2007). Anthropogenic nutrients can cause damaging
plankton blooms, associated deterioration of the estuarine food webs, and loss of major seafood
resources (Livingston, 2000, 2002, 2005).
High natural productivity of alluvial rivers is closely related to continuous water input
within the bounds of natural climatological cycles. The Apalachicola River remains in a
relatively natural state with low human populations and low levels of industrialization and
farming. Aquatic habitats of the Apalachicola River floodplain depend on river flows in terms of
frequency and duration of inundation and saturation. Floodplain vegetation is closely associated
with the extent and timing of river flows and flooding. Seasonal flow changes are important to
the life cycles of many terrestrial and aquatic species along the river. Since 80-85% of the fishes
use the floodplain as a food source, wetlands inundation is a critical part of the life history of
these species. There have been recent increases of the frequency and duration of low flows
during drought periods (Light et al., 1998). This has led to the loss of 3 million canopy trees in
the non-tidal flood plain of the river. Reduced river flows could also affect state-listed wetlands
plant species such as Sideroxlyon lycioides (Apalachicola buckthorn), S. thornei (Thorne’s
buckhorn), and Leitneria floridana (corkwood). Federally protected species such as Gulf sturgeon
4

(Acipenser oxyrinchus desotoi- threatened. 56 FR 49653) are also dependent on natural river
flows.
The Apalachicola River contains a number of freshwater bivalve and gastropod mollusks,
with high endemism and threatened/endangered mussels. Recent surveys of the Apalachicola and
Chipola Rivers indicated the presence of five federally protected mussel species: Amblema
neislerii (Fat threeridge), Elliptoideus sloatianus (Purple bankclimber), Elliptio chipolaensis
(Chipola slabshell), Lampsilis [= Hamiota] subangulata (shineyrayed pocketbook) and
Pleurobema pyriforme (oval pigtoe) (EnviroScience, Inc., 2005). Field surveys indicated that
unionids in the Apalachicola River occur in shallow channel margins, sloughs and tributaries that
undergo rapid depth fluctuations (EnviroScience, Inc., 2005). These areas are “critically
important to the survival of threatened and endangered mussels in the Apalachicola and lower
Chipola Rivers.” Purple bankclimbers were eliminated by recent (2000, 2002) low flows, and did
not re-colonize affected areas (EnviroScience, Inc., 2005). Flow reductions below 8000 cubic
feet second-1 (cfs) have been associated with mussel kills. Purple bankclimbers were eliminated
by recent (2000, 2002) low flows, and did not re-colonize affected areas (EnviroScienc, Inc.,
2005). Zimmerman (2006) noted “numerous dead and dying mussels including fat threeridge” at
discharges of 5400 cfs. Minimum flows of 8000 cfs are required for maintenance of existing
slough and channel margin unionid populations, and are considered essential for recovery of
federally listed species (EnviroScience, 2005; Zimmerman, 2006). Apalachicola River flow rates
should follow functionally-equivalent historical patterns to maintain the highly diverse and
productive species that are adapted to the natural periodicity of this system.
The river dominates the Apalachicola Bay system as a source of freshwater, nutrients, and
organic matter. Together with local rainfall and wind events, the river is closely associated with
the estuarine salinity regime and coastal productivity (Livingston, 1983, 1984, 2000, 2005;
Livingston et al., 1997, 1999, 2000). Fresh water discharges from the Apalachicola River,
together with regional rainfall, create a salinity gradient in the estuary (Figure 1). Reduced and
highly variable salinity in the bay prevents access of open Gulf predators (stenohaline; adapted to
high salinity) to the oyster resources (Crassostrea virginica) of the bay. Important commercial
populations such as penaeid shrimp, blue crabs (Callinectes sapidus) and sciaenid fishes move
into the bay from offshore spawning grounds to nursery in the highly productive estuarine waters.
5

These species also benefit from reduced/variable salinities that limit predation. Without adequate
river water input, the Apalachicola estuary, one of the most prolific in North America, would be
transformed into a much less productive system.
Figure 1: Model of the Apalachicola Bay system showing key features that result in extremely high primary and secondary productivity.
Nutrient loading from the river, in the form of inorganic nitrogen and phosphorus
compounds, is distributed in form of particulate matter, colloidal conglomerates, and dissolved
compounds (Figure 1). Inorganic nutrients (NH3, NO2, NO3, PO4) are taken up rapidly by
phytoplankton (microscopic floating plants), thus leading to relatively low concentrations of such
nutrients in the bay. The high level of dissolved inorganic nutrients that are loaded into the
estuary from the river creates conditions for very high phytoplankton productivity that forms the
basis for key food webs in the bay. This includes food for oysters and clams. Zooplankton that
feed on the phytoplankton support high numbers of anchovies (Anchoa mitchilli) and gulf
menhaden (Brevoortia patronus). These species, in turn, represent a primary food source for
various fishes and invertebrates in the estuary. Particulate organic matter from the bodies of
6

plants and animals, together with particulate and dissolved organic carbon loaded from the river,
accumulate in the sediments where infaunal microfauna, microflora and macrofauna form
important elements of detrital food webs for the bay. Depositional (sedimentary) areas that
receive fresh water input are particularly important as nursery areas for the young of fishes and
invertebrates that spawn offshore (Figure 1).
Nutrients adhere to the particulate organic matter (detritus) that eventually falls into the
sediments of the shallow Apalachicola system (Figure 1). This nutrient-rich organic matter is
colonized by microbial components to form the basis of important detrital food webs. Infaunal,
detritus-feeding macroinvertebrate assemblages that live in the sediments of the bay are
dominated by various species of worms and crustaceans that include Mediomastus ambiseta,
Hobsonia florida, Grandidierella bonnieroides and Streblospio benedicti. The infauna form the
food base for sciaenid fishes (Atlantic croaker [Micropogonias undulatus], spot [Leiostomus
xanthurus], and sea trout (Cynoscion spp.) that dominate the estuarine fish populations. Shallow
depths and extremely high bottom productivity explain why the Apalachicola estuary is a primary
nursery along the Gulf coast for blue crabs (Callinectes sapidus) and white shrimp (Litopenaeus
setiferus). These species form the basis of highly lucrative fisheries in the region. The outer bay,
having higher salinities than the upper parts of the Apalachicola estuary, is dominated by species
such as silver perch (Bairdiella chrysoura), pigfish (Orthopristis chrysoptera), least squid
(Lolliguncula brevis), pink shrimp (Farfantepenaeus duorarum), brown shrimp (Farfantepenaeus
aztecus), and various important game fishes (Figure 1).
Submerged aquatic vegetation (SAV) contributes to the high level of estuarine
production. These plants provide habitat and organic matter that form the basis for important
estuarine food webs. In the upper bay, there have been dense growths of submerged aquatic
vegetation (SAV) dominated by Vallisneria americana, Ruppia maritima, and Potamogeton sp.
These SAV species are adapted to low light penetration and low, varying salinities. Recent
salinity increases due to a prolonged drought have adversely affected the East Bay grass beds that
represent an important habitat and source of productivity for the upper bay. Shoal grass
(Halodule wrightii) is dominant in the highly productive seagrass areas off St. George Island.
Enhanced watercolor and turbidity due to river input restricts development of dominant sea grass
species such as Thalassia testudinum (turtle grass) and Syringodium filiforme (manatee grass).
7

These species are adapted to clear water and high salinities, and are thus restricted to shallower
areas in the outer regions of the Apalachicola system such as along the St. James Island area from
the City of Carrabelle to Alligator Harbor. Submerged aquatic vegetation thus complements the
high phytoplankton productivity of river-dominated parts of the estuary, giving rise to an
important sports fishing industry in the region. The intricate combination of fresh water input,
nutrient loading, water quality factors, high biological productivity, salinity distributions and the
diversity of natural habitats have contributed to the relatively high commercial and sports fishery
values of the Apalachicola River-Bay system (Figure 1).
Due to decades of planning and management initiatives, the Apalachicola River and Bay
system remains one of the most protected aquatic areas in the world. A coalition of local, state
and federal personnel instituted advanced land planning in Franklin County in the 1970's and
early 1980’s. This effort was based on an extensive scientific database that was used as the
anchor for management initiatives. This included the establishment of the Apalachicola River
and Bay Estuarine Sanctuary in 1979. This sanctuary, now called a National Estuarine Research
Reserve, included purchases of about 78,000 ha (hectares) of wetlands, and remains one of the
largest such Reserves in the country. State officials along the river and the bay carried out a
series of major purchases of wetlands. These purchases have been extended to the present day.
Public land holdings accompanied regional and local planning efforts designed to mitigate the
effects of human activities. Purchases of the barrier islands were added to acquisitions of the East
Bay and Apalachicola River wetlands to complete a ring of publicly owned lands around the most
environmentally sensitive areas of the system. The State of Florida has spent over $239 million
for these land acquisitions, based almost entirely on scientific reports that prioritized the order of
ecological value of the various river and bay resources. The major management effort for the
Apalachicola system would be undone by increased drought frequency and enhanced low-flow
conditions due to upriver water removal by human activities.
Nutrient loading is defined as the product of nutrient concentration times water flow
rates. This differs from the actual concentration of nutrients in the water, as loading is a dynamic
process rather than a simple concentration variable. Naturally high nutrient loading from the river
should thus not be confused with the high concentrations of nutrients that flood into the river and
bay from urbanized areas during rain events. Urban storm water runoff occurs due to replacement
8

of natural systems with impervious surfaces that exacerbate the extent of the flow in space and
time during storms. The high concentrations of nutrients in the water entering the bay cause
blooms of destructive microalgae and plankton that are associated with reduced oxygen and toxic
impacts on estuarine biota. Reduced river flow can accentuate the bloom impacts by reducing
turnover rates of the water and eliminating the flushing of the planktonic bloom species.
Livingston (2007) outlined the adverse impacts of nutrient loading from industrial,
agricultural and urban sources on a similar estuary (the Perdido Bay system) along the west
Florida Gulf coast. These impacts indicate how the natural attributes of temperate river-bay
systems are destroyed by anthropogenic loading of nutrients from various sources. In the Perdido
system, initial diatom blooms were replaced by raphidophytes and dinoflagellates in time. Bloom
effects on phytoplankton assemblages included initial reductions of species richness/diversity and
direct/indirect replacement processes. Long-term occurrences of plankton blooms and related
changes in phytoplankton composition were accompanied by altered food web processes and
losses of key fish and invertebrate populations. Raphidophyte (Heterosigma akashiwo) and
dinoflagellate (Prorocentrum cordatum) blooms were statistically associated with reduced
invertebrate and fish community variables, and creating serious disruptions of bay food webs.
Natural seasonal and interannual trends of river flows represent an important factor in the
timing and extent of the plankton blooms due to urban development in coastal areas (Figure 2).
The relatively high natural nutrient loading of the Apalachicola River is an important component
of the influence of nutrients on high bay productivity. Without the naturally high river flow rates,
anthropogenic nutrient inputs could have an enhanced adverse effect on bay water quality and
populations by stimulating toxic blooms that would reduce bay productivity. Thus, natural river
flows are a major component in the maintenance of phytoplankton associations that form the basis
of the bay productivity. There is evidence that urban development and storm water runoff are
already having an adverse effect on the productivity of the Apalachicola system (Livingston,
2008). The complex interrelationships of river flow and cultural eutrophication have been
outlined in various studies (Livingston, 2002, 2007). There is ample evidence that low river flow
conditions that are enhanced by anthropogenic activities would exacerbate the impact of urban
runoff and treated sewage on bay productivity during extended drought periods.
9

Figure 2: Model of the Apalachicola Bay system showing potential impacts of reduced river flow leading to plankton blooms and reduced secondary productivity.
The seasonal and interannual drought/flood periodicity of river flows is an important
factor in the maintenance of riverine and estuarine productivity (Livingston, 2000, 2002, 2005).
Freshwater and estuarine species in the Apalachicola system are adapted to natural drought/flood
flow cycles. This has led to temporal successions of species that contribute to the high biological
productivity of the system. Bay productivity is high due to loading of nutrients and organic
matter from the river and autochthonous production by benthic plants. Lowered Apalachicola
River flow would reduce detritus loading from wetlands areas. Associated reductions of
nutrients, along with changes of water quality associated with reduced river flow during droughts,
would lead to altered phytoplankton productivity (Figure 3). These alterations would disrupt river
and bay food webs and reduce overall secondary production. The impacts of natural drought-
related reductions of river flows would be exacerbated by up-river human activities in the form of
urban and agricultural use of river water. Human-related reductions of river flow would expand
the scope and duration of the associated reduction of river and bay productivity (Figure 3).
10

Figure 3: Model of the Apalachicola Bay system showing potential impacts of reduced river flow to the bay leading to seriously reduced secondary productivity.
There is evidence that droughts in recent years have become longer and more extreme
leading to related reductions of Apalachicola River flows. Continuation of these trends will result
in a decided adverse impact on river and bay productivity. The enhancement of the impacts of
natural drought conditions due to removal of river water use by human activities is likely to
exceed the resilience of the river and bay, thus altering the natural processes that are responsible
for the high productivity of the system.
11

The salinity of the Apalachicola Bay system is controlled to a considerable degree by the
Apalachicola River (Livingston 1984). The Apalachicola Bay system has historically provided
90% of Florida’s oysters (10% nationally). The very high oyster production in the Apalachicola
system depends on a combination of variables that are directly and indirectly associated with
fresh water input. Increased salinity would allow increased oyster mortality due to predation and
disease. This same process would also adversely affect other commercially important fishes and
invertebrates due to increased predation on the nurserying organisms. The Apalachicola estuary
is a major nursery for white shrimp and blue crabs. Both species utilize the bay as a highly
productive nursery, and, along with oysters, form the basis for important commercial fisheries.
Increased salinity due to reduced river flows lowers the nursery function of the bay for such
species due, in part, to increased predation from stenohaline offshore species. Recent prolonged
low-flow events during droughts have adversely affected bay and Gulf fisheries for white shrimp,
blue crab and sciaenid fish populations. In addition, reduced nutrient loading due to lower river
flows would lead to altered phytoplankton that, in turn, would alter food webs that support the
highly valued commercial and sports fisheries. In this way, reduced river flows due to
anthropogenic activities, would lead to direct and indirect adverse impacts on the commercial
fisheries along the Apalachicola River-Bay system.
Information from various sources indicates that there has been a serious change in the
Apalachicola flow rates with an increase of the frequency and severity of low flow periods during
droughts. There is also evidence that these changes are due, in part, to water use in the upper
parts of the Tri-river system. Flood plain areas of the river and commercial fisheries in the
Apalachicola estuary have already been seriously damaged in the most recent droughts. These
impacts have been enhanced recently by the increased frequency and virulence of low river flows.
It is likely that increased frequency and duration of river flow reductions in the future due to
water removal by upstream human activities will eventually lead to the loss of the Apalachicola
resource though serial reductions of bay resilience. There would be habitat and productivity
changes that would be accompanied by the elimination of the riverine wetlands, loss of the
nursery function of the bay and destruction of the naturally high productivity associated with key
aquatic species.
12

A noted above, there has been a considerable investment by local, state and federal
associations and agencies in terms of time and money to manage the Apalachicola drainage
system. After a series of legal disputes among the states of Florida, Georgia and Alabama for
water rights in the ACF system for almost 2 decades, negotiations among the governors of these
states broke down in February 2008. In April 2008, the U. S. Army Corps of Engineers (U. S. A.
C. E., 2008) released a modified Interim Operation Plan (IOP) that would allow Georgia to keep
more water in reservoirs such as Lake Lanier during droughts. This would essentially result in
even lower river flows than those associated with the original IOP during droughts with the onus
of lower flows placed on the natural resources of the Apalachicola River and Bay system. Flows
would thus fluctuate below 5000 cfs during droughts. The modified IOP was approved by the U.
S. Fish and Wildlife Service. The Corps’ modified Interim Operation Plan does not include any
requirement that Georgia implement effective conservation efforts designed to limit the impact of
enhanced drought effects on Florida resources. These actions indicate that the application of
minimum flow requirements has been progressively minimized by federal environmental
agencies.
According to the Carnegie Institution for Science (2008), there is evidence that the jet
streams in the northern hemisphere have weakened with an increased northward movement in
recent years. These changes fit the predictions of global warming models and have implications
for the frequency and intensity of future storms, including hurricanes. Storm paths in North
America are likely to shift northward as a result of the jet stream changes. This change could
lead to less rain in the already drought-stricken SE United States. There is no way to confirm the
long-term effects of these changes that are likely due to global climate trends. If the projections
of reduced rainfall in the ACF region are true, however, it would place even more emphasis on
the need for an advanced water conservation effort in the Tri-River area. The increase of the
frequency and intensity of droughts in the Apalachicola system is a fact, and the potential for
further reductions of rainfall and natural river flow should be included in calculations for water
conservation efforts. It is possible that future, long-term changes in atmospheric conditions
could lead to further reductions of river flows.
13

II. Documentation for Rationale and Conclusions
A. Apalachicola River Basin The Apalachicola River-Bay system is part of a major drainage area (the Chattahoochee-
Flint-Apalachicola [ACF] basin) of about 48,500 km2(square kilometers). This system is located
in western Georgia, southeastern Alabama, and northern Florida (Figure 4). There are 13 dams
on the Chattahoochee River and 3 dams on the Flint River. The Apalachicola River, 21st in flow
magnitude in the conterminous United States, is one of the few alluvial systems that remains free
flowing in the country. The river flows 171 km from the confluence of the Chattahoochee and
Flint Rivers (the Jim Woodruff Dam) to its terminus in the Apalachicola estuary (Figure 1).
Average flow rates have historically approximated 690 m3s-1 (1958-1980) with annual high flows
averaging 3,000 m3s-1 (Leitman et al., 1982; Leitman et al., 1991). The forested floodplain, about
450 km2, is the largest in Florida (Leitman et al., 1982). Forestry is the primary land use in the
floodplain (Clewell, 1977). Other activities include minor agricultural and residential use, bee
keeping, tupelo honey production, and sports/commercial fishing (Livingston, 1983, 1984).
Figure 4: The Apalachicola-Chattahoochee-Flint (ACF or Tri-River) drainage basin.
Tn. N.C.
S.C.
Al. Ga.
Fl.
Al.Fl.
Ga.Fl.
Al.
Ga.
Apalachicola River
Apalachicola Bay
0
km
40 80
BASIN
LIMITS
BASI
NLI
MIT
S
Atlanta, Georgia
Columbus, Georgia
Apalachicola,Florida
Gulf of Mexico
N
Chattahoochee River
Flint River
Chipola River
Jim Woodruff Dam
Lake Seminole
Lake Lanier
14
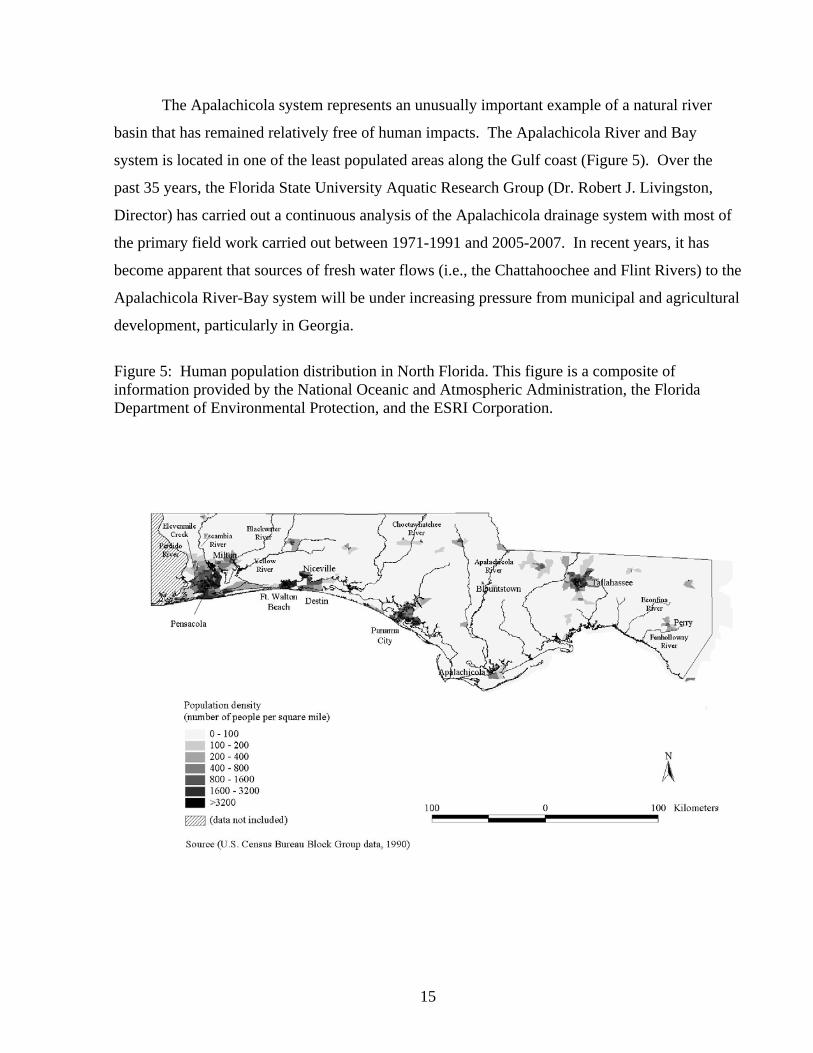
The Apalachicola system represents an unusually important example of a natural river
basin that has remained relatively free of human impacts. The Apalachicola River and Bay
system is located in one of the least populated areas along the Gulf coast (Figure 5). Over the
past 35 years, the Florida State University Aquatic Research Group (Dr. Robert J. Livingston,
Director) has carried out a continuous analysis of the Apalachicola drainage system with most of
the primary field work carried out between 1971-1991 and 2005-2007. In recent years, it has
become apparent that sources of fresh water flows (i.e., the Chattahoochee and Flint Rivers) to the
Apalachicola River-Bay system will be under increasing pressure from municipal and agricultural
development, particularly in Georgia.
Figure 5: Human population distribution in North Florida. This figure is a composite of information provided by the National Oceanic and Atmospheric Administration, the Florida Department of Environmental Protection, and the ESRI Corporation.
15

The Apalachicola River is one of the last major free flowing, unpolluted alluvial systems
in the conterminous United States. The importance of freshwater flows to the Apalachicola
floodplain has been extensively studied (Cairns, 1981; Elder and Cairns, 1982; Mattraw and
Elder, 1982; Light et al., 1998, 2006). Based on a long history of management efforts
(Livingston, 2002), the unique characteristics of the river-flood plain have been the subject of
various studies. The importance of freshwater flows to the Apalachicola floodplain has been
extensively documented (Light et al., 1998, 2006). As a consequence of this effort, various
aspects of the Apalachicola upland drainage system have been found to be critical to the overall
resource management approach for the basin (Livingston and Joyce, 1977):
1) The Tri-River system extends from the Piedmont to the Gulf of Mexico. The Apalachicola drainage basin receives biotic exchanges from the Piedmont, the Atlantic Coastal Plain, the Gulf Coastal Plain, and peninsular Florida. This accounts for the high quality of the terrestrial animal biota of the river floodplain (Means, 1977). 2) Floodplain forests include many terrestrial plant species of which 9 are narrowly endemic, 28 endangered, 17 threatened, and 30 rare (Clewell, 1977). 3) Of the north Florida drainages, the Apalachicola River contains the largest number of freshwater bivalve and gastropod mollusks, with high endemism and a number of rare and endangered species (Heard, 1977). 4) Eighty six fish species have been noted in the Apalachicola River system, including 3 endemics, important anadromous species, and an important sports and commercial fishery (Yerger, 1977). 5) Apalachicola River wetlands represent a center of endemism for terrestrial species, which includes federally protected species of amphibians, reptiles, and birds (Means, 1977). Due to the high diversity of wetland and upland habitats, the highest species density of amphibians and reptiles in North America (north of Mexico) occurs in the upper Apalachicola basin.
Hoehn (2002) noted that aquatic habitats of the Apalachicola River and floodplain depend
on river flows in terms of frequency and duration of inundation and saturation. Regular seasonal
changes of flow rates are important to the life cycles of various invertebrate and fish species along
the river system. Since 80-85% of the Apalachicola River fish species use the floodplain as a food
source (Light et al., 1998), wetlands inundation is a critical part of the life history of these species.
Crayfish, an important species in terms of biomass, are directly controlled by annual river
fluctuations (Bass, 2002). Spawning of various species is also dependent on river levels with
16

rapid flow reductions usually having a negative effect on this process (Hoehn, 2002). Critical
habitats for anadromous species such as striped bass are dependant on flow rates.
The Apalachicola floodplain is important to various freshwater fisheries, although most of
the more important fisheries (e.g., striped bass, Morone saxatilis; sturgeon, Acipenser
oxyrhynchus) have been destroyed or seriously impaired due to habitat destruction by
channelization and damming in the Chattahoochee and Flint Rivers (Livingston and Joyce, 1977;
Livingston, 1984). Dredging activities, mandated by the U. S. Congress have led to serious
habitat damage along the Apalachicola River with a minimum of economic justification for such
channelization (Leitman et al., 1991). The Apalachicola River-wetlands system has been the
subject of land purchase efforts by Florida state officials, and is one of the few such systems that
is largely in public hands.
Associations of floodplain habitat and river flows explain how such effects result in lost
habitat and aquatic populations (Light et al, 1998; Hoehn, 2002). Declining water levels caused
by reduced spring-summer flows and erosion of the river channel have adversely affected many
plant and animal species dependent on the historical seasonal pattern of river fluctuations (Light
et al., 2006). Although large floods exceeding 100,000 cfs are still occurring as frequently as in
the past (about 3 times per decade), there has been an increase in the frequency and duration of
low flows (Helen Light, Pers. Comm., 2008). Recent surveys of the non-tidal floodplain forest
indicate that drying of floodplain tree composition has occurred in response water-level declines
in the river, and that swamp forests, which grow in the lowest and wettest parts of the floodplain,
have been affected the most (Darst and Light, 2007). An estimated loss of nearly 3 million
canopy trees in swamp forests of the floodplain has occurred as a result of declining water levels
in the Apalachicola River (Helen Light, Pers. Comm., 2008).
Flow reductions could have an impact on state-listed wetlands plant species such as
Sideroxlyon lyciodes, S. thornei, S. lyciodes and Leitneria floridana. According to Ziewitz
(2003), federally protected species include the Gulf sturgeon (Acipenser oxyrinchus desotoi).
Recent surveys of the Apalachicola and Chipola Rivers indicate the presence of five federally
protected mussel species: Amblema neislerii (Fat threeridge), Elliptoideus sloatianus (Purple
bankclimber), Elliptio chipolaensis (Chipola slabshell), Lampsilis [= Hamiota] subangulata
17

(shineyrayed pocketbook) and Pleurobema pyriforme (oval pigtoe). Recent surveys
(EnviroScience, Inc., 2005) have shown that unionids in the Apalachicola River occur in shallow
channel margins, sloughs and tributaries that undergo rapid depth fluctuations. These areas are
“critically important to the survival of threatened and endangered mussels in the Apalachicola and
lower Chipola Rivers” (EnviroScience, Inc., 2005). Purple bankclimbers were eliminated by
recent (2000, 2002) low flows, and did not re-colonize affected areas (EnviroScience, Inc., 2005).
Zimmerman (2006) noted “numerous dead and dying mussels at various locations including fat
threeridge” at discharges of 5400 cfs. Minimum flows of 8000 cfs are likely to be required for
maintenance of existing slough and channel margin unionid populations, and are likely essential
for recovery of federally listed species (EnviroScience, 2005; Zimmerman, 2006). Reduced river
flows and physical alterations to the river are considered threats to these species.
Various sources of information regarding the Apalachicola River system indicate that flow
management for riverine and wetland productivity, biodiversity and endangered species should be
based on historical intra- and interannual flow rates of the Apalachicola River. Projected flow
rates of the Apalachicola River should follow historical patterns to maintain the highly diverse
and productive species that are currently adapted to the natural periodicity of this system.
B. Apalachicola Bay System Results of previous studies indicated that the Apalachicola estuary has been historically in
a relatively natural state (Livingston, 1984; Livingston et al., 1997, 2000, 2003). A sparse human
population, together with a low level of industrial and municipal development, has been
associated with historically high water and sediment quality (Livingston, 1984, 2000, 2002,
2005). Published results included various subjects: hydrology (Meeter et al. 1979), the effects of
anthropogenic activities such as agriculture (Livingston et al., 1978) and forestry (Duncan, 1979,
Livingston and Duncan, 1979, Livingston et al., 1976), and the importance of salinity levels to the
community structure of estuarine organisms (Livingston, 1979; Livingston et al., 2000, 2003).
The basic distribution of the estuarine populations was analyzed (Edmiston, 1979; Estabrook,
1972; Laughlin, 1979; Laughlin and Livingston, 1982; Livingston, 1976b, 1977, 1981b, 1983;
Livingston et al., 1974; 1976, 1977, Mahoney, 1982, Mahoney and Livingston, 1982, McLane,
1980, Purcell, 1977, Sheridan, 1979; Sheridan and Livingston, 1979, 1983). Various studies were
18

also carried out concerning the trophic organization of the estuary (Laughlin, 1979; Livingston et
al., 1997; Sheridan, 1978) that includes microbial ecology (Federle et al., 1983; White, 1983;
White et al., 1977, 1979a, 1979b).
Overall, the extensive studies of the Apalachicola system indicated that the relatively
natural interaction of relatively undisturbed river-bay interactions, along with little human
development in the vicinity of the estuary, resulted in an extremely productive bay system with
high levels of secondary productivity relative to other river-dominated estuaries such as the
Choctawhatchee and Escambia systems to the west.
C. General Ecology
There is considerable natural variability of freshwater fluxes in the various sub-basins of
the north Florida Gulf region (Livingston, 1984a, 1989, 2000). Most of the river systems are
composed of a series of tributaries that drain sub-basins into the main stem. The sub-basins
often follow different hydrological cycles (Livingston et al., 1989, 1990) than the main stem,
depending on regional rainfall patterns and the highly variable physiographic conditions in the
different regions. Some drainage basins extend into Alabama and Georgia. Temporal patterns
and volumes of river discharge to associated estuaries depend on the cumulative climatological
conditions and seasonally varying evapo-transpiration rates in associated watersheds.
Flooding plays a role during winter and early spring months in the north Florida
drainages. Winter-spring flooding in the alluvial streams is a product of reduced evapo-
transpiration rates during winter rainfall peaks along the heavily vegetated drainage basins
(Livingston, 1984). Reduced summer surface flows are due to increased evapo-transpiration in
vegetated flood plains. Evapo-transpiration in existing reservoirs is also a major component of
the water balance in the Tri-river system (Leitman, 2003a). Up-river withdrawals of river water
by municipal and agricultural activities represent another cause of reduced flows. Surface-flows
are minimal during the fall low-flow period. Alluvial systems such as the Apalachicola have
flow patterns that are thus more correlated with seasonal rainfall patterns in Georgia and
Alabama (where high percentages of the respective drainage basins are located) than in Florida
(Meeter et al., 1979). The smaller streams along Apalachee Bay are associated with relatively
19

limited estuarine areas, whereas the alluvial, river-dominated estuaries (Apalachicola,
Choctawhatchee, Escambia) to the west are proportionately larger due to the higher river flows.
The Apalachicola estuary (Figure 6) is about 62,879 ha in area, and is a shallow lagoon-
and-barrier-island complex oriented along an east-west axis. Water movement is controlled by
wind currents and tides as a function of the generally shallow depths (Livingston 1984,
Livingston et al., 1999, 2000) that constitute a major feature of the system. Upland marshes grade
into fringing grass beds, soft-sediment areas, and oyster reefs. A series of passes control
interactions of the bay with the Gulf of Mexico; these passes, together with river flows and bay
configuration, have major effects on the salinity structure of system (Livingston, 1983, 1984).
The Apalachicola River dominates water quality in the bay system, and represents the chief
source of freshwater input. As such, the river represents a major source of coastal productivity in
the region (Livingston, 1983, 1984; Livingston et al., 1997, 1999, 2000, 2002, 2005).
Figure 6: The Apalachicola Bay system showing location of long-term sampling stations (1972-1984).
20
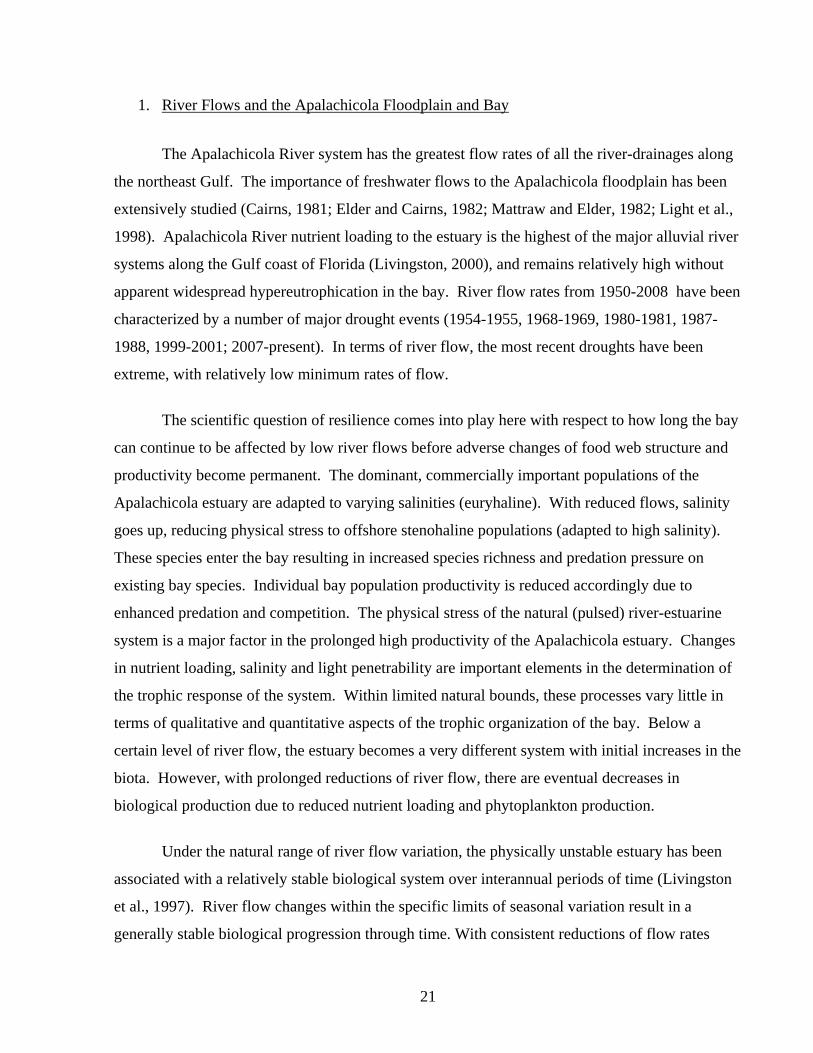
1. River Flows and the Apalachicola Floodplain and Bay
The Apalachicola River system has the greatest flow rates of all the river-drainages along
the northeast Gulf. The importance of freshwater flows to the Apalachicola floodplain has been
extensively studied (Cairns, 1981; Elder and Cairns, 1982; Mattraw and Elder, 1982; Light et al.,
1998). Apalachicola River nutrient loading to the estuary is the highest of the major alluvial river
systems along the Gulf coast of Florida (Livingston, 2000), and remains relatively high without
apparent widespread hypereutrophication in the bay. River flow rates from 1950-2008 have been
characterized by a number of major drought events (1954-1955, 1968-1969, 1980-1981, 1987-
1988, 1999-2001; 2007-present). In terms of river flow, the most recent droughts have been
extreme, with relatively low minimum rates of flow.
The scientific question of resilience comes into play here with respect to how long the bay
can continue to be affected by low river flows before adverse changes of food web structure and
productivity become permanent. The dominant, commercially important populations of the
Apalachicola estuary are adapted to varying salinities (euryhaline). With reduced flows, salinity
goes up, reducing physical stress to offshore stenohaline populations (adapted to high salinity).
These species enter the bay resulting in increased species richness and predation pressure on
existing bay species. Individual bay population productivity is reduced accordingly due to
enhanced predation and competition. The physical stress of the natural (pulsed) river-estuarine
system is a major factor in the prolonged high productivity of the Apalachicola estuary. Changes
in nutrient loading, salinity and light penetrability are important elements in the determination of
the trophic response of the system. Within limited natural bounds, these processes vary little in
terms of qualitative and quantitative aspects of the trophic organization of the bay. Below a
certain level of river flow, the estuary becomes a very different system with initial increases in the
biota. However, with prolonged reductions of river flow, there are eventual decreases in
biological production due to reduced nutrient loading and phytoplankton production.
Under the natural range of river flow variation, the physically unstable estuary has been
associated with a relatively stable biological system over interannual periods of time (Livingston
et al., 1997). River flow changes within the specific limits of seasonal variation result in a
generally stable biological progression through time. With consistent reductions of flow rates
21

during a prolonged drought, the clarification of a turbid system leads to rapid changes in the
pattern of primary production, which, in turn, becomes associated with major changes in the
trophic organization of the system. With the prolongation of the restricted river flows, the
formerly physically controlled biological system gradually changes to a more biologically
controlled system. Trophic response time would be measured in years from the point of the
initiation of low flow conditions. Eventually, permanent reductions of freshwater flows would
then lead to major reductions of biological productivity. With the more or less permanent
reduction of freshwater flow below a level specific for the receiving system, the physically
controlled, highly productive river-estuarine system would eventually become a high diversity,
biologically controlled bay of substantially reduced fishery potential. Although the exact pattern
of the loss of bay resilience to these controlling factors cannot be predicted, the overall process of
fisheries losses has been confirmed by the considerable scientific database concerning the
Apalachicola Bay system.
2. Estuarine productivity
A generalized review of the factors that add to the productivity of a river-dominated
estuary is shown in Figure 7. Fresh water flows from the upland river-wetlands system carry
nutrients and particulate organic matter into the estuary. The nutrients cause increased production
of natural phytoplankton populations. Detrital food webs are fed by loading of organic matter
(dissolved and particulate) that is primarily associated with bottom (benthic) trophic interactions.
The planktonic trophic organization and the detrital food webs account for the high levels of
estuarine secondary productivity. Reduced salinity in the estuary due to freshwater inputs from
the river favors reduced predation by offshore (Gulf) populations that are not adapted to the low
and highly variable salinities of the estuary. Relatively few fish and invertebrate populations
outside of the infaunal invertebrates actually breed in the estuary. Most bay populations migrate
into the bay as juveniles that use the high naturally high productivity of the bay to grow to sizes
that are commercially valuable. This includes the penaeid shrimp, blue crabs and sciaenid fishes
that form the backbone of the commercial value of the Apalachicola Bay system. Some species
such as clams and oysters that are indigenous to the estuary add to the value of the estuary. In
areas distant from the immediate effects of the river, sea grass beds become abundant, and,
22

together with associated upland wetlands, form the basis of complex and highly productive parts
of the overall bay productivity (Livingston, 2008).
Figure 7: Model of the interaction between the Apalachicola River and Bay with respect to the riverine contributions to bay primary and secondary productivity.
The combination of low levels of pollution, the lack of hypereutrophication due to
nutrient pollution, and undisturbed estuarine habitats has made the Apalachicola system a highly
productive body of water that is relatively rare in the United States today. The association
between alluvial freshwater input and estuarine productivity has been indirectly established in a
number of estuaries (Cross and Williams, 1981). In a study of 64 estuaries in the Gulf of Mexico,
Deegan et al. (1986) found that freshwater input was highly correlated (R = 0.98) with fishery
harvest. Funicelli (1984) found that upland carbon input was in some way associated with
estuarine productivity. Armstrong (1982) noted that nutrient budgets in Texas Gulf estuaries
were dominated by freshwater inflows, and that shellfish and finfish production was a function of
nutrient loading rates and average salinity. However, few studies have evaluated more detailed
facets of the linkage of the freshwater river-wetlands with estuarine productivity (Livingston
1981a). The sources of high productivity are subject to complex seasonal and interannual
fluctuations that are closely associated with climatological conditions.
23

In response to projections of anthropogenic freshwater use by Georgia over the next 30-50
years (Livingston, 1988), a long-term program was initiated to analyze data generated during the
1970’s and 1980’s, and to determine how projected reduced flows of the Tri-river system would
affect the Apalachicola River-bay system (Livingston et al., 1997, 2003).
The linkage between upland freshwater wetlands and the rich estuarine biota of associated
estuaries underscores the importance of ecosystem-level research in management processes
(Livingston and Loucks, 1978). Studies concerning the distribution of wetland vegetation in the
Apalachicola floodplain indicated that vegetation type was associated with water-level depth and
fluctuation and duration of inundation (Leitman et al., 1982). Litter fall in the Apalachicola
floodplain (800 gm-2) is higher than that noted in many tropical systems and almost all warm
temperate systems (Elder and Cairns, 1982). The authors found that annual deposition of litter
fall in the bottomland hardwood forests of the Apalachicola River floodplain approximates
360,000 metric tons (mt). Seasonal river flooding provides for the transfer of detritus from the
wetlands to associated aquatic areas (Cairns, 1981; Elder and Cairns, 1982).
Livingston et al. (1974) indicated that, in addition to providing particulate organics that
fueled the bay system, river input determined nutrient loading to the estuary. Of the 214,000
metric tons (mt) of carbon, 21,400 mt of nitrogen, and 1,650 metric tons (mt) of phosphorous that
is delivered to the estuary over a given year, over half is transferred during the winter-spring flood
peaks (Mattraw and Elder, 1982). Bay studies (Livingston, 1976, 1981a, 1983, 1984, 2000, 2002)
corroborated the timing of these flow events with the delivery of nutrients and dissolved and
particulate organic matter as an important factor in the maintenance of the estuarine primary
production (autochthonous and allochthonous). There were direct links between the estuarine
food webs and freshwater discharges (Livingston, 1981a, 1983, 1984). Particulate organic carbon
delivered to the estuary followed seasonal and interannual fluctuations that were closely
associated with river flow (Livingston, 1991a; R2 = 0.738). During summer and fall months, there
was no direct correlation of river flow and detritus movement into the bay. By winter, there was a
significant relationship between micro-detrital loading and river flow peaks.
It has been recognized that phytoplankton productivity is a major determinant of
secondary production in many coastal systems. Boynton et al. (1982) reported that the
24

Apalachicola system has high phytoplankton productivity relative to other river-dominated
estuaries, embayments, lagoons, and fjords around the world. Nixon (1988) showed that the
Apalachicola Bay system ranks high in overall primary production compared to other such
systems. Up to 50% of the phytoplankton productivity of the Apalachicola estuary is explained
by Apalachicola River flow (Myers 1977, Myers and Iverson 1977, 1981). In the Apalachicola
system, orthophosphate availability limited phytoplankton during both low and high salinity
winter periods and during the summer at stations with low salinity (Iverson et al., 1997).
Nitrogen was limiting during summer periods of moderate to high salinity in the Apalachicola
estuary. Flow rates affected the development of nutrient limitation in the Apalachicola estuary.
Nutrient limitation was highest during low-flow summer periods. The physiography of the
Apalachicola estuary is an important factor in the high primary productivity of the system. The
bay is relatively shallow, and wind action is associated with periodic peaks of phytoplankton
production as inorganic nutrients, regenerated in the sediments, are mixed through turbulence into
the euphotic zone (Livingston et al., 1974; Iverson et al., 1997). In deeper estuaries, nutrients can
be sequestered in the sediments and thus can be lost in terms of phytoplankton production. Water
depth is thus an important factor in the natural productivity of the Apalachicola estuary.
Recent studies have further documented the influence of the Apalachicola River on
nutrient and organic carbon loading to the bay. Chanton and Lewis (1999) found that, although
there were inputs of large quantities of terrestrial organic matter, net heterotrophy in the
Apalachicola Bay system was not dominant relative to net autotrophy during a 3-year period.
Chanton and Lewis (2002), using δ13C and δ34S isotope data, noted clear distinctions between
benthic and water column feeding types. They found that the estuary depended on river flows to
provide flood-plain detritus during high-flow periods, and dissolved nutrients for estuarine
primary productivity (plants) during low flows. Floodplain detritus was significant in the
important East Bay nursery area, thus showing that peak flows were important in washing such
detritus into the estuary. Winter/spring periods of high river flow and macrodetritus delivery to
the bay (Livingston, 1981a) were coincident with increased infaunal abundance (McLane, 1980).
Four out of the 5 dominant infaunal species at river-dominated stations were detritus feeders. The
transformation of nutrient-rich particulate organic matter from periodic river-based influxes of
dissolved and particulate organic matter coincided with abundance peaks of the detritus-based
25

(infaunal) food webs of the Apalachicola system (Livingston and Loucks, 1979; White et al.,
1979a, 1979b; Livingston, 1984)). A mechanism for the direct connection of increased infaunal
abundance was described by Livingston (1983, 1984) whereby microbial activity at the surface of
the detritus (Federle et al., 1983a) led to microbial successions (Morrison et al., 1977) that then
provided food for a variety of detritivorous organisms (White et al., 1979a, 1979b; Livingston,
1984).
Mortazavi et al. (2000a) found that phytoplankton productivity in river-dominated parts of
the Apalachicola estuary was limited by phosphorus in the winter (during periods of low salinity)
and nitrogen during summer periods of high salinity. The Dissolved Organic Nitrogen (DON)
input was balanced by export from the estuary. Mortazavi et al. (2000b) determined temporal
couplings of nutrient loading with primary production in the estuary. Around 75% of such
productivity occurs from May through November, with primary control due to grazing. Mortazavi
et al. (2000c) gave detailed accounts of the nitrogen budgets of the bay. These studies indicated
that phytoplankton productivity was an important component of estuarine food webs along the
Gulf coast, and that a combination of river-derived organic matter and autochthonous organic
carbon provided the resources for consumers in river-dominated estuaries of the Gulf coast.
3. Biological Response to Apalachicola River Flows
An intensive field study was carried out during the period from March 1972 through July
1984. This included monthly collections of water quality and biological data concerning infaunal
macroinvertebrates, epibenthic macroinvertebrates and fishes (Livingston et al., 1997). The data
were summed across all taxonomic lines and translated into the various trophic levels that
included herbivores (feeding on phytoplankton, benthic algae), detritivores (feeding primarily on
particulate organic matter), omnivores (feeding on plants and animals), primary carnivores
(feeding on herbivores), secondary carnivores (feeding on primary carnivores) and tertiary
carnivores (feeding on secondary carnivores). All data were expressed as ash-free dry weight m-1
month-1 or as percent ash-free dry weight m-2 month-1. The data were presented as monthly means
of a series of stations (3, 4, 5, 6, 4a, 5a, 5b) in East Bay.
26

River flows during the last half of the 20th century and early parts of the 21st century are
shown in Figure 8. There was a major drought during the mid-1950’s. During the intensive study
period (1975-1984), interannual river flows followed model predictions (Meeter et al., 1979) with
peak flows in 1975 and 1979, and a drought from 1980-1981 (Figure 8). The model noted by
Meeter et al. (1979) indicated low fall flows, peak flows during winter-early spring periods,
spring and fall low flow periods and low summer flows (relative to winter-spring flows) due to
high evapotranspiration rates during warm months. This drought, characterized by the lowest
winter-spring river flow levels during the 9.5-year study period, was a defining feature of the
long-term habitat data with sustained high salinities during the 2-yr drought (1980-1981)
(Livingston et al., 1997).
Figure 8: Three-month moving averages of monthly Apalachicola River flows from October 1950 through May 2008. Data were provided by the U. S. Geological Survey (Sumatra, Florida gage). Blue lines designate drought conditions.
Apalachicola River Flow (Sumatra)
0
500
1000
1500
2000
2500
3000
1950
/10
1951
/10
1952
/10
1953
/10
1954
/10
1955
/10
1956
/10
1957
/10
1958
/10
1959
/10
1960
/10
1961
/10
1962
/10
1963
/10
1964
/10
1965
/10
1966
/10
1967
/10
1968
/10
1969
/10
1970
/10
1971
/10
1972
/10
1973
/10
1974
/10
1975
/10
1976
/10
1977
/10
1978
/10
1979
/10
1980
/10
1981
/10
1982
/10
1983
/10
1984
/10
1985
/10
1986
/10
1987
/10
1988
/10
1989
/10
1990
/10
1991
/10
1992
/10
1993
/10
1994
/10
1995
/10
1996
/10
1997
/10
1998
/10
1999
/10
2000
/10
2001
/10
2002
/10
2003
/10
2004
/10
2005
/10
2006
/10
2007
/10
date
There was an extreme drought from 1999-2001 (Figure 8) that was followed by the most
recent drought period (2007-present). It is during these droughts that bay conditions are most
susceptible to anthropogenic reductions of river flow when the combined natural and
anthropogenic flow rate decreases have documented adverse effects on the receiving bay.
27

4. Habitat Type and Population Distribution
The bay is characterized by a series of dominant species that are euryhaline (adapted to
varying salinities), and able to nursery in the extreme salinity variations of the bay. An extensive
stomach content analysis was carried out with the dominant fish and invertebrate species. The
long-term database was re-organized according to the ontogenetic feeding stages of the
numerically dominant species. Trophic units were averaged by month over the 14-year study.
The actual distribution of the key estuarine species is based on microhabitat organization that, in
turn, is based on various conditions related to river flow processes. By transforming the data
according to ontogenetic (developmental) feeding stages, we were able to evaluate population
distribution according to a basic, functional process (feeding) that defined the nurserying
organism.
Infaunal macroinvertebrates
In terms of frequency of occurrence during the sampling effort, the infaunal
macroinvertebrate assemblages in East Bay are dominated by species such as Mediomastus
ambiseta (below surface deposit feeder and detritivorous omnivore), Hobsonia florida (above-
surface deposit feeder and detritivorous omnivore), Grandidierella bonnieroides
(grazer/scavenger and general omnivore), Streblospio benedicti (above-surface deposit feeder
and detritivorous omnivore), and Parandalia americana (primary carnivore). Larger types of
infaunal macroinvertebrates include the plankton-feeding herbivores Mactra fragilis and Rangia
cuneata. Dominant epibenthic macroinvertebrates in East Bay over the period of study include
the palaemonetid shrimp (Palaemonetes spp.: detritivorous omnivores), xanthid crabs
(Rhithropanopeus harrisi: primary carnivores), blue crabs (Callinectes sapidus: primary
carnivores at < 30 mm; secondary carnivores at > 30 mm), and penaeid shrimp (L. setiferus, F.
duorarum and F. aztecus: primary carnivores at <25 mm; secondary carnivores at > 25 mm).
Most of these invertebrate species are browsers, grazers, or seize-and-bite predators.
Penaeid shrimp
The numerically dominant invertebrates included white shrimp and blue crabs that,
together, represent about 70% of the total numbers taken over the14-year study period. The white
28
shrimp, Litopenaeus setiferus, is the numerically dominant penaeid species in the Apalachicola
system. White shrimp enter the bay during spring months, and are caught in otter trawls during
summer-fall months. Young-of-the-year white shrimp (< 25mm) are first noted in East Bay
during early summer months. They remain in the East Bay area throughout the summer. The
second trophic unit of this species is concentrated in East Bay during summer and fall months.
The largest white shrimp trophic unit is located mainly just west of the river mouth and in parts of
East Bay. White shrimp are largely absent in the bay by mid-to late November through
December. White shrimp represent the most commercially valuable population in the
Apalachicola estuary, and are distributed in areas most affected by river flows. This distribution
is compatible with the importance of freshwater inflows and the resulting productivity that
accompanies such flows. The low numbers associated with drought conditions is compatible with
known aspects of white shrimp life history patterns.
Pink shrimp (Farfantepenaeus duorarum) and brown shrimp (Farfantepenaeus aztecus)
occur in lower numbers than the white shrimp. Pink shrimp are usually associated with higher
salinities than white shrimp, and young-of-the-year also are most abundant during early fall in
East Bay. This appears to be related to food availability in areas receiving freshwater flow.
Young brown shrimp are most abundant during late spring, with the primary pattern of
distribution just west of the river mouth and in East Bay areas. Once again, areas receiving direct
freshwater runoff from the river are favored by both species.
Callinectes sapidus The blue crab (Callinectes sapidus) is another commercially important species in the
Apalachicola system. Young-of-the-year blue crabs appear in the bay during winter months and
are largely concentrated in East Bay and along the main river channel of the bay. Secondary
increases of this trophic unit occur during late summer to fall months in the upper bay. The next
trophic stage appears in the bay during February with secondary peaks during summer months.
This trophic stage is centered in East Bay. The largest blue crab trophic unit is found in highest
numbers during summer months in East Bay. In all 3 blue crab trophic stages, the East Bay
nursery area appears to be the favorite habitat. Spatial-temporal blue crab distribution appears to
29

be associated with the relationship of the individual trophic units to freshwater inputs from the
river.
The long-term trends of invertebrate distribution indicate that invertebrate numbers are
associated with river flow even though such manifestations of habitat preference vary by species
and by trophic unit within each species. High invertebrate numbers during the drought of 1980-
1981 were due in large part to blue crab predominance. Each species has a very different set of
habitat needs through its ontological development, with major differences in the spatial/temporal
patterns of habitat use. The one unifying feature that affects such distributions appears to be
increased concentrations of invertebrate populations in areas associated with the entry of
freshwater into the upper bay. These areas are notable for relatively high organic carbon and
nutrient loading and associated productivity. Trophic unit distribution displays a broad spectrum
of diverse phase interactions with river input to the bay over seasonal and interannual periods.
Feeding habit changes are related to habitat-oriented differences in available food.
Fishes
Dominant fishes in East Bay include the plankton-feeding primary carnivore Anchoa
mitchilli (bay anchovy) and benthic feeding primary carnivores such as spot (Leiostomus
xanthurus), hogchokers (Trinectes maculatus), young Atlantic croakers (Micropogonias
undulatus: < 70 mm) and silver perch (Bairdiella chrysoura: 21-60 mm). Secondary carnivores
among the dominant fishes include larger croakers (> 70 mm), Gulf flounder (Paralichthys
albigutta), and sand seatrout (Cynoscion arenarius). Tertiary carnivores in East Bay include the
larger spotted seatrout (C. nebulosus), southern flounder (P. lethostigma), largemouth bass
(Micropterus salmoides) and gars (Lepisosteus spp). With the exception of the bay anchovies, all
of the above species live near the sediment-water interface with most of the trophic organization
of the bay dependent on interactions among bottom living infaunal (living in or on sediments) and
epibenthic (living above sediments) macroinvertebrates and fishes. The primary fish dominants,
representing about 80% of total fish numbers taken over the sampling period, include bay
anchovies, seatrout, spot, and Atlantic croaker.
30
Anchoa mitchilli The youngest bay anchovies enter the bay during early summer, and are located mainly in
East Bay. They eventually move to the river in the late fall. The second anchovy trophic unit
moves to the river area during fall months. Overall, this species is closely tied to freshwater flows
from the Apalachicola River, and populations move from summer distributions in East Bay to fall
distributions in the Apalachicola River channel. Long-term changes of the anchovy trophic units
indicated peak numbers of the first trophic unit between peak river flows (1973-75) and drought
conditions (1980-81). Peak numbers were noted during the first year of the drought, with major
decreases during succeeding years. This distribution was consistent with the postulated increases
of plankton during the first year of the drought. The second trophic unit showed relatively low
numbers during and after the 1980-81 drought.
Cynoscion arenarius The sand seatrout, a piscivorous fish that feeds primarily on anchovies (Sheridan and
Livingston 1979), reaches peak numbers during late spring and early summer. The distribution of
the first 2 trophic units is located largely in East Bay and around the Apalachicola River mouth
from late spring to early fall. The larger sand seatrout are located mainly near the river channel of
the bay. This distribution generally follows that of the bay anchovies. The long-term trends of
this species indicate relatively low numbers during the second year of the drought followed by
subsequent increases during succeeding years. The patterns of anchovy distribution in time could
reflect predation pressure by the sand seatrout.
Leiostomus xanthurus
Young-of-the-year spot enter the bay during winter-early spring periods, and are
concentrated in East Bay and areas near the river mouth. Older spot move to the lower parts of
Apalachicola Bay. This distribution in consistent with known distributions of infaunal
macroinvertebrate distribution in space and time, and is a trophic response to herbivorous and
omnivorous species that respond directly to river inflows to the bay. Temporal changes of spot
indicated a major increase of young spot during the second year of the drought followed.
31

Micropogonias undulatus
Young-of-the-year Atlantic croaker enter the bay during winter-spring months and are
located mainly in East Bay and west of the river mouth. The larger forms move throughout the
bay during summer months. There were no overt temporal trends of this species.
Apalachicola Bay ecology is closely associated with freshwater input from the
Apalachicola River (Livingston, 1984a). The distribution of epibenthic organisms in the
Apalachicola Estuary follow a specific spatial relationship to river flows. Stations most affected
by the river are inhabited by anchovies (Anchoa mitchilli), spot (Leiostomus xanthurus), Atlantic
croaker (Micropogonias undulatus), gulf menhaden (Brevoortia patronus), white shrimp
(Litopenaeus setiferus), and blue crabs (Callinectes sapidus). The outer bay stations are often
dominated by species such as silver perch (Bairdiella chrysoura), pigfish (Orthopristis
chrysoptera), least squid (Lolliguncula brevis), pink shrimp (Farfantepenaeus duorarum), brown
shrimp (Farfantepenaeus aztecus), and other shrimp species (Trachypenaeus constrictus). Sikes
Cut, an artificial opening to the Gulf that is maintained by the U. S. Army Corps of Engineers, is
characterized by salinities that resemble the open gulf. This area is dominated by species such as
least squid, anchovies, Cynoscion arenarius, Etropus crossotus, Portunus gibbesi, and Acetes
americanus.
Field analyses of long-term change of infaunal and epibenthic invertebrates and fishes are
based on a series of studies executed continuously from 1972-1984 (Livingston, 1984). Cross-
correlation analyses of long-term changes of infaunal and epibenthic invertebrates and fishes over
the intensive study period indicated that dominant bay populations followed a broad spectrum of
diverse phase interactions with river flow and associated changes in salinity over interannual
periods of drought and flood conditions. Long-term (14-year) trends of penaeid shrimp indicated
direct associations with river flow (Livingston, 1991b). Fish populations also followed diverse,
species-specific phase angles with river flows. Fish numbers usually peaked one month after
river flow peaks (winter periods) whereas invertebrate numbers were inversely related to peak
river conditions with increases during summer months (Livingston, 1991b). Top fish dominants
such as spot were prevalent in winter-spring months of river flooding whereas peak numbers of
32

penaeid shrimp usually occurred in summer and fall months. River flow was thus a controlling
factor for biological organization of the Apalachicola estuary (Livingston, 1991b).
The response of the bay to river flows is complex due to species-specific responses to the
river-directed habitat changes and responses of the food web to nutrient loading and
phytoplankton production.
Marshes and Submerged Aquatic Vegetation
The primary non-forested coastal fringe is dominated by freshwater and brackish marshes
in the Apalachicola delta above East Bay (Figure 9a; Livingston, 1984). The fresh water
dominants include bulrushes (Scirpus spp.), cattails (Typha domingensis), and other species such
as saw grass (Cladium jamaicense). Brackish species include Juncus roemerianus and Spartina
alterniflora. These marshes are highly productive and, together with the loading of river nutrients
and organic matter, contribute to the enhanced nursery function of East Bay.
Figure 9a: Seagrass and wetland habitats of the Apalachicola Drainage System.
33

The primary distribution of the submerged aquatic vegetation (SAV) in the Apalachicola
estuary is shown in Figure 9a. The color and turbidity of river input tends to limit the distribution
of the benthic macroflora to the shallow fringes of the estuary. Upper East Bay has historically
been inhabited by dense beds dominated by tapeweed (Vallisneria americana), widgeon grass
(Ruppia maritina), and pondweed (Potamogeton pusillus). These beds have been well studied
(Livingston and Duncan, 1979; Purcell, 1977), and are dominated by the snail Neritina reclivata
and various crustaceans and polychaete worms. Dominant fishes include killifish (Lucania
parva), silversides (Menidia beryllina) and centrarchids such as largemouth bass (Micropterus
salmoides). These areas serve as nursery grounds for penaeid shrimp and other crustaceans and
fishes at early stages of their ontogenetic progressions in the bay.
The predominant macrophyte species in the mesohaline and higher salinity areas off St.
George Island (Figure 9a) is shoalgrass (Halodule wrightii) with other species such as Gracilaria
spp. and manatee grass (Syringodium filiforme) also represented. Sheridan and Livingston
(1983) noted that the infaunal macroinvertebrates in this part of the bay were among the most
speciose in the northern hemisphere. This infauna included various species used as food for the
abundant blue crabs (Callinectes sapidus), pink shrimp (Farfantepenaeus duorarum), pinfish
(Lagodon rhomboides) and spotted seatrout (Cynoscion nebulosus) in this part of the bay.
The seagrass beds off St. James Island (Figures 9a, 9b) are dominated by turtle grass
(Thalassia testudinum) and manatee grass (Syringodium filiforme) (Livingston, 2008). Water
quality data and depth distributions indicated that between depths of 1 to 2 m, depth-related light
penetration becomes limiting to the grass beds. Light limitation is an important factor in the
development of seagrass beds in the area. Light penetration is limited by color and turbidity.
Based on the distribution of these factors, the data indicate that the combination of runoff from
the Carrabelle River and the depth of the water in areas east of the river are important
determinants of SAV distribution. Sea grasses and macroalgae provide habitat and productivity
that supports a diverse and productive trophic organization. Dominant fishes in these beds
included high numbers of pigfish (Orthopristis chrysoptera), pinfish (Lagodon rhomboides), and
silver perch (Bairdiella chrysoura) (Livingston, 1984). Dominant species taken with the
trammel nets in the seagrass beds included southern flounder (Paralichthys albigutta), spotted
34

seatrout (Cynoscion nebulosus), and sharks of various types (Livingston, 1984). Storm water
runoff from urban development has recently caused high loading of nitrogen and phosphorus into
the St. George Sound at concentrations that have stimulated plankton blooms. These blooms are
characterized by increased turbidity, alterations of the dissolved oxygen regime and reduced light
penetration.
Figure 9b: Distribution of submerged aquatic vegetation (density) in near-shore areas of St. George Sound during 2006-2007. Water quality stations (Livingston, 2006a) are shown along with upland wetlands systems.
East Bay East Bay (Figure 9c) is a major nursery ground for various populations. Dominant fishes
in East Bay include the plankton-feeding primary carnivore Anchoa mitchilli (bay anchovy) and
benthic feeding primary carnivores such as spot (Leiostomus xanthurus), hogchokers (Trinectes
maculatus), Atlantic croakers (Micropogonias undulates < 70 mm) and silver perch (Bairdiella
chrysoura: 21-60 mm). Secondary carnivores among the dominant fishes include larger croakers
35

(> 70 mm), Gulf flounder (Paralichthys albigutta), and sand seatrout (Cynoscion arenarius).
Tertiary carnivores in East Bay include the larger spotted seatrout (C. nebulosus), southern
flounder (P. lethostigma), largemouth bass (Micropterus salmoides) and gars (Lepisosteus spp).
With the exception of the bay anchovies, all of the above species live near the sediment-water
interface with most of the trophic organization of the bay dependent on interactions among
bottom living infaunal and epibenthic macroinvertebrates and fishes. Plankton-feeding bay
anchovies (Anchoa mitchilli) are also dominant in East Bay. Invertebrates in East Bay are
dominated by penaeid shrimp and blue crabs.
Figure 9c: Station distribution in East Bay for the long term trophic analyses involving infaunal and epifaunal macroinvertebrates and fish.
A listing of the 9.5 year averages of the monthly data for East Bay are given in Table 1.
Sediments in western parts of East Bay (station 4) were relatively silty. The same is true of the
small embayment in eastern parts of the system (station 4a) and a tidal creek affected by runoff
36

from upland forestry operations in Tate’s Hell Swamp (station 5b). The area in the upper bay
(station 5a) was mainly sandy. Western parts of East Bay were denoted by considerable amounts
of leaf matter during periods of high winter-spring river flows relative to eastern sections (Figure
9a). Watercolor increased in eastern parts of the bay due to runoff from clear-cut areas in Tate’s
Hell Swamp. Turbidity was highest in areas adjacent to input from the Apalachicola River
(station 4a). Dissolved oxygen and pH were lowest in the area receiving runoff from the cleared
areas in the contributing drainage area (5b). Total weights of fishes and invertebrates were
highest in areas adjacent to the river where the detrital food webs were particularly strong. The
Atlantic Croaker (Micropogonias undulatus) and blue crabs (Callinectes sapidus) were also more
abundant in western sections of the bay whereas white shrimp (P. setiferus) were most numerous
at stations 4a and 5a. Overall, areas affected by runoff from the clear-cut areas were denoted by
the lowest overall secondary production. These data indicate the importance of the river as a
source of organic matter for the detrital food webs of the bay and the impact of clear-cutting on
eastern sections of East Bay.
Table 1. Averages of physico-chemical and biological variables sampled during the 9.5–year survey of East Bay taken monthly from 2/1997-7/1984. Stations are noted in Figure 9. b=bottom, s=surface. n/smp=numbers per sample. FII (fish, invertebrates, infauna). C1 (primary carnivores), C2 (secondary carnivores), MICU (Micropogonias undulates), CALSAP (Callinectes sapidus), PENSET (Litopenaeus setiferus).
Factor S-4 S-4A S-5A S-5B %silt 32.500 41.300 2.500 49.900bsalinity (ppt) 10.014 3.244 5.054 4.257scolor (Pt-Co Units) 53.640 60.447 73.803 115.548bTurbidity (NTU) 23.171 20.311 22.781 17.535sD.O.(mgL-1) 8.285 8.956 8.675 7.900nOxygen Anom (mgL-1) -0.593 0.167 -0.182 -0.868bpH (pH Units) 7.264 7.401 7.363 6.982fish totwt(gm2) 0.099 0.057 0.047 0.036inv totwt (gm2) 0.026 0.022 0.012 0.014FIIC1 (gm2) 0.575 0.050 0.474 0.035FIIC2 (gm2) 0.088 0.045 0.025 0.022MICUn/smp 26.759 17.623 21.421 13.743CALSAPn/smp 3.741 3.392 2.868 2.993PENSETn/smp 4.157 9.189 7.205 2.683
37

Detritus-based Food Webs
Leaf matter, as a form of macrodetritus, enters the bay in areas dominated by river flow
(Livingston, 1984). These inputs occur during winter-early spring periods (Figure 9d), and are
influenced by peak river flow flooding in river wetlands areas. Microdetritus (small particulates)
fluxes into the bay from the river also peak during winter-spring periods (Figure 9e). Livingston
(1984) outlined the detrital food webs with respect to influxes of particulate organic matter that
amounts to about 214,000 mt (metric tons) annually (Mattraw and Elder, 1982). Livingston
(1984) noted that micro- and macroparticulate matter had a direct relationship with river flooding
with the exact timing of peak river flows and productivity of river wetlands as key determinants
of the short-term fluctuations and long-term trends of the input of allochthonous (derived from
outside the system) organic matter into the bay (Livingston, 1981a, b). Detrital inputs were
significantly associated with seasonal trends of river flows during winter-spring periods. Local
marshes also contribute to the export of detrital aggregates to the bay (Ribelin and Collier, 1979).
Figure 9d: Leaf matter taken in otter trawls in East Bay taken monthly from January 1975-February 1981.
East Bay leaf matter (dry weight)
0
50
100
150
200
250
300
350
400
450
Jan-
75
Apr
-75
Jul-7
5
Oct
-75
Jan-
76
Apr
-76
Jul-7
6
Oct
-76
Jan-
77
Apr
-77
Jul-7
7
Oct
-77
Jan-
78
Apr
-78
Jul-7
8
Oct
-78
Jan-
79
Apr
-79
Jul-7
9
Oct
-79
Jan-
80
Apr
-80
Jul-8
0
Oct
-80
Jan-
81
date
DryWt-A04-g/trwl DryWt-A5a-g/trwl
38

Figure 9e: Microdetritus taken in water samples in the lower Apalachicola River monthly from August 1975-March 1982.
Apalachicola River Microdetrit
0
10000
20000
30000
40000
50000
60000
75/0
875
/12
76/0
476
/08
76/1
277
/04
77/0
877
/09
77/1
077
/12
78/0
278
/03
78/0
478
/06
78/0
778
/08
78/1
078
/11
78/1
279
/02
79/0
379
/04
79/0
679
/07
79/0
879
/10
79/1
179
/12
80/0
280
/03
80/0
480
/06
80/0
780
/08
80/1
080
/11
80/1
281
/02
81/0
381
/04
81/0
681
/07
81/0
881
/10
81/1
282
/01
82/0
2
date
DryWt(mg/1000L)-A08 3 per. Mov. Avg. (DryWt(mg/1000L)-A
Particulate organic matter is colonized by morphologically diverse prokaryotic and
microeukaryotic assemblages (White, 1983) that can be defined by complex chemical signatures
such as phospholipid alkyl fatty acids (prokaryotes, microeukaryotes) and fatty lipids (anaerobic-
aerobic bacteria) (White, 1983; Federle et al., 1983; Livingston, 1984). There is a succession of
microbiota that colonize the particulate matter deposited into the bay with initial bacteria
succeeded by diatoms and fungal mycelia (Bobbie et al., 1978). Grazing amphipods feed on the
microbiota that live on leaf matter (Morrison and White, 1980). Amphipod distribution is
significantly associated with bacterial fatty acids (White et al, 1979a, b). This base of the detrital
food webs is controlled by epibenthic predators (Federle et al., 1983). Various forms of nutrients
and dissolved organic nitrogen and phosphorus compounds contributed by the river are thus
transformed into a nutritious mixture of particulate matter through microbial activity that forms
the basis of the detrital food webs dominated by amphipods, gastropod mollusks, isopods and
commercially valuable decapods (white shrimp, blue crabs). The numerical abundance of the
litter-associated populations is strongly aligned with the availability of detritus (Livingston,
39

1984). The distribution of these detrital associations is determined by temperature, salinity, and
the biochemical features of the microbial communities with detritivorous macroinvertebrates as
the link between the microbial producers and numerically important populations of fishes and
invertebrates.
Oyster Bars Oyster bars represent an important habitat in the Apalachicola estuary, providing cover
and food for diverse assemblages (Livingston, 1984). This includes bryozoans, flatworms,
annelids, gastropod and pelecypod mollusks, arthropod crustaceans and fishes. Oyster ecology
will be treated below.
Sub-tidal (soft sediment) Areas Around 70% of the Apalachicola Bay system is composed of sub-tidal, unvegetated, soft
sediment areas. This habitat is dominated by polychaete worms (deposit and suspension feeders)
and amphipods. Studies documented by Livingston (2002) were carried out at stations in East
Bay and St. George Sound (Figure 9f). Water quality and biological samples were taken
monthly at stations 3 and 5a (July 1978-June 1984) and station ML (November 1981-August
1986). The biological organization reflected the differences between the highly productive mud
flats in East Bay and the productive seagrass beds of St. George Sound. Fresh water quality and
quantity in the loadings to the respective areas are quite different in terms of nutrients. These
differences also extend to the most important food web components in these areas that are
represented by infaunal macroinvertebrates that live in and on the sediments in the respective
study areas. The most obvious difference between the aquatic habitats of East Bay (stations 3
and 5a) and St. George Sound (station ML) is the lack of direct (station 3) or indirect (station 5a)
Apalachicola River flow at station ML. East Bay station 3, which receives direct river flow, had
lower salinity, temperature, and dissolved oxygen anomaly than the other sites. Bottom salinity
in East Bay ranged from essentially freshwater conditions during winter-spring floods to
salinities between 10 and 20 ppt (parts per thousand) during the fall low water periods. There
were rapid changes in salinity at station 3. Station ML was characterized by high salinity and
less salinity variability. During periods of high Apalachicola River flow, salinity was not
markedly reduced in St. George Sound and there was evidence (low salinities during summer
40

months) that local runoff was responsible for the relatively small seasonal differences in salinity
in this area of the bay. Station 5a was outside of the direct effects of the river; however, this
station received periodic highly colored fresh water input from adjacent upland swamps.
Figure 9f: Chart showing stations used in East Bay and St. George Sound for the
comparative analysis of the river-dominated upper bay (stations 3 and 5a) and the high salinity sound area (station ML).
One hundred and sixty-six taxa were collected at station ML compared with 47 and 40 at
stations 3 and 5a, respectively, over the long-term sampling program. The dominant organisms
(i.e., those species comprising the top 90% of density) at each site were comprised of 9 (station
41

3), 10 (station 5a) and 28 taxa (station ML) (Livingston, 2002). The polychaete Mediomastus
ambiseta was the numerical dominant at all stations. The three most abundant taxa comprised
over 50% of the total infaunal density at all three sites. Long-term means of community indices
differed among stations over the period of record with the highest density at station 3, the
greatest number of taxa at station ML, and the greatest biomass at station 5a. Analysis of the
long-term field data indicated that species richness reached maximal levels in all three sampling
areas during fall, a period of relatively low numerical abundance.
Fine-scale community variation was examined with the replicated sets of 100 core
samples taken at each of the three study sites in October 1981. Data from the replicate sets are
presented graphically in Figure 9g. Infaunal abundance per core was highest at station 3 and
lowest at station ML. Species richness per core was highest at station ML and lowest at station
5a. Relative dominance per core was highest at station 3 and lowest at station ML. Station 3 had
high numbers m-2 with a relatively low cumulative species richness (21 species). Numerical
dominants were the polychaetes Mediomastus ambiseta and Streblospio benedicti. Station 5a
was moderately productive in terms of numerical abundance with low cumulative species
richness (10 species) and high dominance of the same species noted at Station 3. A total of 72
species was found at station ML with low dominance of the most numerically abundant species.
Dominants included Apoprionospio pygmaea, Paraprionospio pinnata and Mediomastus
ambiseta.
These data indicate that areas affected by river flow are highly productive in terms of
secondary productivity but are low in species richness due to the highly variable environment in
such areas. Parts of the bay distant from river input are higher in species richness but lower in
secondary productivity. These data indicate what would happen to the bay if river flows are
reduced due to increased incidence and intensity of low flows during droughts. The bay would
be inhabited by more species, but the overall productivity would be reduced as euryhaline
populations were reduced due to increased salinity and reduced primary productivity. The
physically controlled, highly productive system would be replaced by a biologically controlled,
speciose system with lower secondary production.
42

Figure 9g: Three-dimensional view of numbers of individuals, species richness, and top dominant numbers of infaunal macroinvertebrates taken from 100 core samples at stations 3, 5a and ML.
43

The influence of river flow on receiving areas was observed as a gradient of increasing
temporal habitat stability with distance from the river. Salinity variation as well as ambient
salinity at any given time appeared to be primary factors that defined the East Bay habitat. Areas
directly (station 3) and indirectly (station 5a) affected by Apalachicola River flow had high
salinity variation relative to areas distant from such flow (station ML). Although important
habitat variables had high levels of variation within short-term periods at river-dominated sites,
such variation was relatively consistent from year to year. Other variables such as watercolor
and oxygen anomaly had significant annual differences at river-dominated stations relative to
areas not directly affected by river flow. There were thus fundamental differences of habitat
stability between a system that was physically dominated by freshwater runoff (East Bay) and an
area that was little influenced by changes in river flow (St. George Sound). The Sound is mainly
influenced by rainfall and storm water runoff from adjacent land areas. These differences of
runoff result in distinctive forms of species composition and trophic organization.
The Apalachicola River thus serves as the dominant habitat feature of the receiving
estuary. River flow elements contribute both directly and indirectly to a series of habitats that
maintain the overall high secondary production of the estuary. Surrratt et al. collected sediment
cores from three sites in Apalachicola Bay and analyzed for organic carbon (C), total nitrogen
(N), and total phosphorus (P) concentrations and delta13C and delta15N stable isotopic
abundances. According to this recent research,
“Carbon and nitrogen concentrations, ratios, and stable isotopes coupled with grain-size shifts for the bay suggest a decrease in river organic matter supply and a change in sediment clay content supply and/or distribution for the bay. Overall, the applied indicators suggest an increase in marine influence on the organic matter in the estuary. These shifts appear to be associated with Apalachicola River management practices coupled with sea-level rise in the Gulf of Mexico. “
Samples taken near the river mouth indicated that organic matter deposition was driven by both
natural (i.e., hurricanes and droughts) and anthropogenic (i.e., hydrologic river alteration and
dredging) activities. After the drought of 1981, Woodruff Dam operation procedures and the
resultant river discharge patterns could have affected mass sedimentation rates and organic
loading within the estuary. Coupling ACF River discharge alterations with sea-level rise appears
to account for the modification of organic matter loading to the bay.
44

5. Trophic Organization of the Bay
Physical, chemical and biological (infauna, epibenthic macroinvertebrates, fishes) samples
were taken at fixed stations in East Bay (Figure 9) monthly from 1975-1984 (9.5 years;
Livingston et al., 1997). East Bay is the primary nursery area for the Apalachicola Bay system.
These data were used to transform the descriptive field information into a trophic organization for
the estuary. Detailed descriptions of methods for the field collection of physical and chemical
data have been provided by Livingston (1979, 1981a, 1982, 1984a, b, 2000, 2002) and Livingston
et al. (1974, 1976).
All of the biological data (as biomass.m-2.mo-1 of the infauna, epibenthic
macroinvertebrates and fishes) were transformed from species-specific data into a new data
matrix based on trophic organization as a function of ontogenetic (developmental) feeding stages
of the species found in the estuary over the multi-year sampling program. Ontogenetic feeding
units were determined from a series of detailed stomach content analyses carried out with the
various epibenthic invertebrates and fishes in the region (Sheridan 1978, 1979, Laughlin 1979,
Sheridan and Livingston 1979, 1983, Livingston 1980, 1982, 1984b, unpublished data, Stoner and
Livingston 1980, 1984, Laughlin and Livingston 1982, Stoner 1982, Clements and Livingston
1983, 1984, Leber 1983, 1985). Based on the long-term stomach content data for each size class,
the fishes and invertebrates were re-organized into their trophic ontogenetic units using cluster
analyses. An example of such an analysis is given for the blue crab, Callinectes sapidus (Figure
10). Generic codes are given in Table 2.
45

Table 2: Generic Codes for the Trophic Ontogenetic Units.
AMPHIP AM Amphipods OPHIUR OP Ophiuroids ANNELI AN Annelids ORGCON OR Organic remains APPENA AP Appendicularians OSTRAC OS Ostracods ANIMRM AR Animal remains POLYLA PL Polychaetes (larvae) BARNAC BA Barnacles (ad,juv) POLYCH PO Polychaetes (ad,juv) BIVALV BI Bivalves (ad,juv) PLNTRM PR Plant remains BARLAR BN Barnacles (larvae) PYNCNO PY Pycnogonida BRASPE BR Branchiopods RADIOL RA Radiolarians BRYOZO BZ Bryozoans REPTIL RP Reptilia CAMBAR CA Cambaridae SANDGR SA Sand grains CEPHCO CD Cephalochordates SHRIMP SH Shrimp (ad,juv) CEPHAL CE Cephalopoda SIPUNC SI Sipunculids CHAETO CH Chaetognaths SPONGE SP Sponge matter CILLIO CI Ciliophora STOMAT ST Stomatopods CLADOC CL Cladocerans TANAID TA Tanaids CNIDAR CN Cnidaria TREMAT TM Trematodes COPEPO CO Copepods (calanoid,cyclopoid) TUNSPE TN Tunicates CRABBS CR Crabs (ad,juv) TURBEL TR Turbellarians CRUSRM CS Crustacean remains UNIDEN UN Unidentified/unknown CHITON CT Chitons HOLOTH HO Holothuroidia CUMACE CU Cumaceans HYDRAC HY Hydracarina DETRIT DE Detritus INVEGG IE Invertebrate eggs DIATOM DI Diatoms INSLAR IL Insect larvae DECALA DL Decapod larvae INSECT IN Insects ECHINO EC Echinoderms INSPUP IP Insect pupae EGGCAS EG Egg cases ISOPOD IS Isopods FISHEG FE Fish eggs MICALG MA Microalgae FISHLA FL Fish larvae MOLLAR ML Molluscan larvae FORAMS FO Foraminiferans MYSIDS MY Mysids FECALP FP Fecal pellets NEMATD NE Nematodes FISHRM FR Fish remains (ad,juv) NEMERT NM Nemerteans GASTRO GA Gastropods OLIGOC OL Oligochaeta GENSPE GS Genus/species dummy HARPAC HC Copepods (harpacticoid) HEMICH HE Hemichordates HIRSPE HI Hirudinia
46

Figure 10: Ontogenetic feeding units of blue crabs (day vs. night collections).
47

The data show how the diet of the blue crabs taken in the Apalachicola estuary changes as
the organisms grow. This analysis was carried out for the all the major invertebrate and fish
species in the Apalachicola system. These data express the lifetime feeding habits in a far more
detailed and significant way than just looking at the adult feeding behavior. This is important in
what is essentially a nursery system where by fishes and invertebrates use the highly productive
estuary as a nursery for the growth and maintenance of juveniles.
Infaunal macroinvertebrates were also organized by feeding preference based on a review
of the scientific literature (Livingston 2000, 2002). The field data for the infauna, fishes and
invertebrates were re-ordered into trophic levels (i.e., herbivores, omnivores, three levels of
carnivores [C1, C2, C3]) so that monthly changes in the overall trophic organization of the system
could be determined over the study period. The data were summed across all taxonomic lines and
translated into the various trophic levels that included herbivores (feeding on phytoplankton and
benthic algae), omnivores (feeding on detritus and various combinations of plant and animal
matter), primary carnivores (feeding on herbivores and detritivorous animals), secondary
carnivores (feeding on primary carnivores and omnivores) and tertiary carnivores (feeding on
primary and secondary carnivores and omnivores). Data were given as ash-free dry mass.m-2.mo-1
or as percent ash-free dry mass.m-2.mo-1.
We assumed that feeding habits (at this level of detail) did not change over the period of
observation, based on previous analyses of species-specific fish feeding habits that remained
stable in Apalachee Bay over a 6-7-yr period (Livingston 1980). In this way, the long-term
database of the collections of infauna, epibenthic macroinvertebrates and fishes was re-organized
into a quantitative and detailed trophic matrix based not solely on species (Livingston 1988) but
on the complex ontogenetic feeding stages of the various organisms in East Bay.
6. Long-term Changes of Trophic Organization
Livingston et al. (1997) provided important evidence of how droughts affect the key
trophic components of the Apalachicola Bay system through time. Physical/chemical and
biological samples (infauna, epibenthic macroinvertebrates, fishes) were taken monthly at fixed
stations in East Bay from February 1975-August 1984. The field data were then re-ordered into
trophic levels so that monthly changes in the overall trophic organization of East Bay could be
48

determined over the study period. . High flows occurred during the winter-spring months of most
years and low flows occurred during summer-fall months (Figure 11). From May 1980 through
the end of 1981, there was a major drought with substantially lower river flows during the winter-
spring of 1981. Flow rates during the 20-mo period prior to the winter of 1982 were consistently
below the long-term (40-yr) monthly means and were often less than 50% of what East Bay
usually receives in the way of freshwater runoff from the river. The following 2.5 yr were
characterized by a general return to the prevailing patterns of Apalachicola River flow as noted
during the period from 1978 through the winter of 1980.
Figure 11: Apalachicola River flows, monthly, from February 1975 through June 1984. Data were provided by the U. S. Geological Survey (Sumatra, Florida gage).
Apalachicola RIver Flow
0
500
1000
1500
2000
2500
75/0
275
/04
75/0
675
/08
75/1
075
/12
76/0
276
/04
76/0
676
/08
76/1
076
/12
77/0
277
/04
77/0
677
/08
77/1
077
/12
78/0
278
/04
78/0
678
/08
78/1
078
/12
79/0
279
/04
79/0
679
/08
79/1
079
/12
80/0
280
/04
80/0
680
/08
80/1
080
/12
81/0
281
/04
81/0
681
/08
81/1
081
/12
82/0
282
/04
82/0
682
/08
82/1
082
/12
83/0
283
/04
83/0
683
/08
83/1
083
/12
84/0
284
/04
84/0
6date
APRIV 3 per. Mov. Avg. (APRIV)
The most outstanding aspect of the bay salinity over the period of study was the sustained
high salinities during the 2-yr period of drought (1980-1981) (Figure 12). Watercolor was lowest
and Secchi disk readings (light penetration) were highest during the drought period of 1980-1981
with Secchi readings in 1980 being significantly different (p < 0.05) from preceding years. Color
levels during the drought years were significantly (p < 0.05) different from those taken during
49

preceding and succeeding years. The period during the 1980-1981 drought was also characterized
by periodically high positive values of dissolved oxygen anomalies. All physical-chemical
indices returned to previous levels during the period following this drought.
Figure 12: Water quality indices (Secchi depths, watercolor, salinity) taken monthly from February through June 1984. Also shown are the 3-month moving averages of the data.
EAST BAY
0.1
1
10
100
1000
75/0
275
/06
75/1
076
/02
76/0
676
/10
77/0
277
/06
77/1
078
/02
78/0
678
/10
79/0
279
/06
79/1
080
/02
80/0
680
/10
81/0
281
/06
81/1
082
/02
82/0
682
/10
83/0
283
/06
83/1
084
/02
84/0
6
date
SECCHI COLORSALINITY 3 per. Mov. Avg. (SECCHI)3 per. Mov. Avg. (COLOR) 3 per. Mov. Avg. (SALINITY)
DROUGHT
50

Infaunal abundance was highest during the early part of the drought period. However,
there was a sharp reduction of infaunal numbers by spring 1982 at which time the lowest numbers
of the data series were found. Infaunal numbers taken during the peak drought years (1980 and
1981) were significantly lower than those of all other collection years. During summer 1981 (the
latter part of the drought period), infaunal trophic diversity dropped significantly (p < 0.05) to the
lowest level of the survey period. Invertebrate trophic diversity followed the trends of infaunal
trophic diversity with sustained low levels during the spring and summer of 1981. Fish numbers
and fish trophic diversity were lowest during the majority of the drought. The drought conditions
of 1980-1981 were thus associated with initial increases of numbers of organisms of various types
that was followed by a general decrease of numbers and trophic diversity.
The long-term trends of the trophic groupings in East Bay are shown in Figure 13. The
mean monthly biomass of herbivores over the study period was 2.39 g/m2 with averages of 0.21
g/m2 for omnivores, 0.53 g/m2 for primary carnivores, 0.04 g/m2 for secondary carnivores and
0.004 g/m2 for tertiary carnivores. There was a marked increase in the herbivore biomass during
the beginning of the drought. Herbivore biomass peaks coincided with low winter river flows,
peak turbidity, low water color and increased Secchi depths. The more frequent periods of
positive oxygen anomaly during the drought also coincided with the high levels of herbivore
biomass. There was a marked decrease of herbivore biomass that started during the second half
of the drought. Herbivore biomass virtually collapsed during the following year with the lowest
levels occurring during spring-summer 2003. There was not a complete recovery of herbivores
through the end of the sampling period.
Omnivore biomass peaked during the period of increasing herbivore biomass in the 1980-
1981 drought. There was a general decrease of omnivore biomass during the succeeding 2 yr.
Once again, there was not a complete recovery of the omnivores during the study period. Primary
carnivore biomass increased during fall 1980 and continued at high levels through spring 1981.
After the drought, primary carnivore biomass declined to levels way below the pre-drought
conditions. There was no recovery of the C1 carnivores during the post-drought months of the
study. The biomass of secondary carnivores increased incrementally from the onset of the
drought with peaks that generally coincided with those of the primary carnivores. There was no
overt recovery of this group during the months following the drought. The tertiary predators were
51

virtually absent during the 1980-1981 drought period. Overall, the drought of 1980-1981 had a
profound effect on the trophic organization of East Bay. This impact remained at various trophic
levels during the 2.5-year period of river flow recovery.
Figure 13: Fish, infaunal and invertebrate (FII) trophic levels (herbivores, omnivores, C1 carnivores, C2 carnivores) taken monthly from February through June 1984. Also shown are the 12-month moving averages of the data.
East Bay
0.001
0.01
0.1
1
10
100
75/0
275
/06
75/1
076
/02
76/0
676
/10
77/0
277
/06
77/1
078
/02
78/0
678
/10
79/0
279
/06
79/1
080
/02
80/0
680
/10
81/0
281
/06
81/1
082
/02
82/0
682
/10
83/0
283
/06
83/1
084
/02
84/0
6
date
FIIHER FIIOMNFIIC1 FIIC212 per. Mov. Avg. (FIIHER) 12 per. Mov. Avg. (FIIOMN)12 per. Mov. Avg. (FIIC1) 12 per. Mov. Avg. (FIIC2)
DROUGHT
52

The trophic data were examined on a relative basis by expressing the mass of each trophic
level as a percent of each monthly total (Figure 14). This enabled a view of an aspect of trophic
structure different from absolute mass. The herbivores showed the most pronounced dominance
during the first 17 mo of the 1980-1981 drought. After this period, there was a distinct decrease
of the herbivores as a percentage of the monthly totals. The omnivores showed an almost
diametrically opposite reaction with relative decreases during the drought and increases during
the 2-yr period following the drought. The primary carnivores had the highest percentages during
the year after the drought while the secondary and tertiary carnivores had the highest such
percentages during the first and second years following the drought. This pattern of prolonged
delays of the primary, secondary and tertiary carnivores was evident only as percentages of the
monthly biomass totals during the latter stages and following the end of the drought at which
times overall biomass was low.
Figure 14: Fish, infauna, invertebrate (FII) trophic data taken monthly from 2/75-8/84 in East Bay. Data represent % of total biomass for each category (herbivores, omnivores, C1, C2, C3 carnivores).
53

Livingston et al. (1997) found that, within limited natural bounds of freshwater flow from
the Apalachicola River, there was little change in the trophic organization of the Apalachicola
estuary over prolonged periods. The physical instability of the estuary was contrasted with the
biologically stable estuarine system. However, when a specific threshold of freshwater reduction
was reached during the drought (1980-1981), clarification of the normally turbid and highly
colored river-estuarine system led to rapid changes in the pattern of primary production, which, in
turn, were associated with major changes of the trophic structure of the system. Increased light
penetration due to the cessation of river flow was postulated as an important factor in the
temporal response of bay productivity and herbivore/omnivore abundance. There was a marked
increase in the herbivore biomass during the beginning of the drought of 1980-1981. Herbivore
biomass peaks coincided with low winter river flows, peak turbidity, low water color and
increased Secchi depths. More frequent periods of positive oxygen anomaly (high dissolved
oxygen) during the drought also coincided with the high levels of herbivore biomass indicating
increased phytoplankton activity. However, reduced river flows were likely associated with
reduced nutrient loading that then led to the reduction of plankton and the eventual collapse of the
various trophic groups in East Bay.
There are problems with relating bay productivity to specific reductions or threshold
levels of freshwater as referenced above. This threshold must be discussed with caution, for there
is likely no particular flow below which the river falls that will always cause the type of effects
observed in this study. The level of flow reduction and its subsequent effects are no doubt
influenced as much by the timing and duration of the event as by the absolute magnitude. The
1980-1981 drought did not encompass the lowest flows seen on the river; however, the
combination of two lower than average dry season flows with an unusually low wet season flow
resulted in the dramatic trophic effects observed. Thus, permanent base flow reductions of even a
relatively small magnitude could cause the system to be more vulnerable to droughts of less
magnitude than examined here. The response of the river and the bay to serial increases in
duration and intensity of low flow patterns during drought occurrences would likely be non-
linear, thus leading to exacerbation of productivity losses of with time. This leads to the question
of at what point would the Apalachicola system be altered to a point of no return to its former
high level of biological productivity.
54
The concepts of biological stability and resilience have been defined in various ways (see
Harrison [1979], and Santos and Bloom [1980], for a brief review of the semantic problems
encountered). Stability is generally defined as the ability of a given system, once perturbed, to
return to its previous state. Resilience refers to the degree, manner, and pace of restoration of the
initial system function and structure following a disturbance (Westman, 1978). Cairns and
Dickson (1977) referred to various parameters of a recovery index: proximity of re-colonization
sources, mobility of propagules, physical and chemical suitability of habitat for re-colonization,
toxicity of the disturbed habitat, and effectiveness of human management initiatives to facilitate
rehabilitation. There are, however, differences in the resilience of species to natural disturbances
relative to disruptions caused by humans. Anthropogenic disturbances that occur outside of the
evolutionary experience of a given species may have a more adverse impact on the ability of that
population to recover relative to natural changes that occur through time.
Based on the observed trends in the Apalachicola estuary, postulated permanent
reductions of freshwater flows due to anthropogenic activities could lead to major reductions of
biological productivity (i.e. invertebrate and fish populations) in the Apalachicola Bay system
(Livingston et al., 1997). There was no real recovery of the trophic order during the 2.5-year
period of returned river flows following the 1980-81 drought. This indicated that recovery of the
bay following a drought could not be predicted from these data. The response of the bay to a
series of droughts could be dependent on serial loss of resilience. It is not possible to predict
when the rubber band would no longer snap back. However, the long-term data indicated that,
with increased reductions of freshwater flow due to anthropogenic use of water, a point would
come where flow rates would fall below levels that would sustain high productivity. In this event,
the physically controlled, highly productive river-estuarine system would become a species-rich,
biologically controlled bay with an altered food web and substantially reduced productivity of its
commercial and sports fisheries.
The severe losses of the oyster, shrimp and blue crab production during the most recent
and ongoing drought would lend credence to the hypothesis of non-linear response in the form of
accelerated loss relative to drought frequency and intensity.
55

7. The Apalachicola Oyster Industry
Research on the extensive Apalachicola oyster (Crassostrea virginica) reefs goes back to
the work of Swift (1896) and Danglade (1917). The Apalachicola estuary has accounted for
about 90% of Florida's commercial fishery (Whitfield and Beaumariage, 1977), and about 10% of
the oyster production in the U. S. Conditions in the Apalachicola Bay system are highly
advantageous for oyster propagation and growth (Menzel, 1981, Menzel and Nichy, 1958; Menzel
et al., 1966; Livingston, 1984) with reefs covering about 7% (4,350 hectares) of bay bottom
(Livingston, 1984). Growth rates of oysters in this region are among the most rapid of those
recorded (Ingle and Dawson, 1952, 1953) with harvestable oysters taken in 18 months. The
distribution of oyster bars in the estuary (Figure 15) does not differ substantially from that
described over 100 years ago.
Figure 15: Location of oyster bars in the Apalachicola Bay system oyster study.
56

Livingston et al. (1999, 2000) outlined life history descriptions of the Apalachicola oyster
population. Hurricane Elena struck the Apalachicola estuary in fall 1985, and destroyed major
portions of the most productive oyster reefs in the bay. Storms, including hurricanes, occur
frequently along the northern gulf coast. Hurricanes occur with the highest frequency during
summer-fall months, overlapping the usual spawning season for oysters. After Elena, there was
an adaptive response to the storm in the form of an unprecedented increase of spawning and spat
fall success. Oysters are relatively well adapted to disturbances such as storms, even when the
immediate effects include substantial damage to the existing population. Under such
circumstances, the resilience of the oysters was enhanced by specific aspects of its life history
that include rapid and massive spawning capabilities, a relatively high rate of growth due to the
usually optimal habitat conditions in the Apalachicola estuary, and the return of habitat
availability and natural productivity of this system within days to weeks of the disturbance. The
return of the Apalachicola oyster population was aided by other by-products of the storm that
included the absence of natural predators (including human beings). The overall outcome of
oyster population changes thus indicated an adaptive response and high resilience to storm
effects of this species that allowed survival under even extreme conditions of natural storm-
induced stress.
Long-term changes of the Apalachicola oyster population should be placed within the
context of major habitat-controlling features such as Apalachicola River flow. Meeter et al.
(1979) found that oyster landings from 1959 to 1977 were correlated negatively with river flow.
The highest oyster landings coincided with drought conditions. Wilber (1992), using oyster data
from 1960 to 1984, found that river flows were correlated negatively with oyster catch per unit
effort within the same year and positively with catches 2 and 3 yr later. Highest oyster harvests
occurred in 1980-1981, coinciding with a major drought. Predation on newly settled spat during
periods of high salinity was given as a possible explanation of the 2-yr time lags between low
flow events and subsequent poor production. Livingston et al. (1997) found that increases of the
Apalachicola Bay non-oyster bivalve mollusk populations during droughts was based on changes
in the trophic organization of the estuary. The relatively high oyster production during low flow
years was probably due to increased primary productivity as a function of altered physical
conditions (i. e., increased light penetration) in the receiving estuary. Increased productivity
57

contributed to increased growth rates and ultimately increased oyster production. Such changes
in river flow and oyster productivity were regular and occurred within prescribed progressions of
river flow fluctuations. However, prolonged droughts eventually induced serious reductions of
oysters due to the effects of increased predation and disease as noted below.
Overall oyster production is concentrated on three eastern bars (Cat Point [CP], East Hole
[EH], Platform [PL]) that are located just off East Point (Figures 15,16). These areas are
subjected to a convergence of highly colored surface water from East Bay (i.e., influenced by the
Apalachicola River/Tate’s Hell Swamp drainage) and high velocity bottom water currents moving
westward from St. George Sound. Maximum growth occurs during periods of low water
temperature and high salinity variation. Oyster mortality is highest at St. Vincent’s Bar (SV) and
areas associated with Sike’s Cut (SK) (Figure 16). These are the parts of the bay distant to river
influence (with high salinity) but also in close proximity to the entry of oyster predators from the
Gulf through the respective passes. The most important oyster predator is the gastropod mollusk,
Thais haemastoma. Oyster mortality is low at the highly productive reefs in the eastern part of
the bay (Cat Point, East Hole). Statistical analyses indicated that oyster mortality was positively
associated with maximum bottom salinity and surface residual current velocity (Livingston et al.,
2000). Mortality was inversely related to oyster density, bottom residual velocity, and bottom
salinity.
Oyster bar growth (actual number of oysters in a given bar) and density (numbers of
oysters per unit area) were highest at the East Hole, Cat Point, and Platform reefs (i.e., the eastern
reefs) (Figure 16). Oyster density was lowest in oyster reefs located in St. Vincent Sound. High
oyster bar growth (Figure 16) was concentrated mainly in eastern oyster growing areas (Cat Point,
East Hole, Platform). Bar growth, defined as oyster density times bar area, was directly
associated with high surface watercolor and Secchi readings and average bottom current
velocities. These results are consistent with the findings that most of the oyster production in the
bay occurs in areas subjected to a convergence of highly colored surface water from East Bay
(i.e., influenced by the Apalachicola River/Tate’s Hell Swamp drainage) and high velocity bottom
water currents moving westward from St. George Sound. Based on the distribution of oyster
density, the primary oyster growing areas were in eastern sections of the bay with maximum
growth during periods of low water temperature and high salinity variation.
58

Figure 16: Distribution of oyster larvae, spat fall, density, new growth, and % mortality in the Apalachicola Bay system.
Stations
0
1000
2000
3000
SC PK SL BB PA CT DB KL SV PC SK NH HO GB SG CP EH PL PB SP
19851986
4240 4590 3505
Oys
ter l
arva
e(n
m-3
)
0
1000
2000
3000
SC PK SL BB PA CT DB KL SV PC SK NH HO GB SG CP EH PL PB SP
Oys
ter l
arva
e(n
m-3
)
19851986
4240 4590 3505
05
101520
Spat
fall
rate
(nsh
ell-
1 wk-
1 ) 19851986
28 21
0
500
1000
Oys
ter
dens
ity(n
m-2
) 1510
0.0
5.0
10.0
New
oys
ter
grow
th ra
te
Individual (mgAFDWd-1)
Whole bar (kgAFDWd-1, in 500s)
0
20
40
60
80
SC PK SL BB PA CT DB KL SV PC SK NH HO GB SG CP EH PL PB SP
Per
cen
tm
orta
lity
Western Bay Central Bay Eastern …
Open side
Closed side
05
101520
Spat
fall
rate
(nsh
ell-
1 wk-
1 ) 19851986
28 21
0
20
40
60
80
SC PK SL BB PA CT DB KL SV PC SK NH HO GB SG CP EH PL PB SP
0
500
1000
Oys
ter
dens
ity(n
m-2
) 1510
0.0
5.0
10.0
New
oys
ter
grow
th ra
te
Individual (mgAFDWd-1)
Per
cen
tm
orta
lity
Western Bay Central Bay Eastern
Open side
…
Closed side
0
500
1000
Oys
ter
dens
ity(n
m-2
) 1510
59
We calculated a time-averaged model for summer oyster mortality by running a
regression analysis with averaged predictors derived from a hydrodynamic model and observed
(experimental) mortality rates throughout the estuary. Based on the model, we determined that
high salinity, relatively low-velocity current patterns, and the proximity of a given oyster bar to
entry points of saline Gulf water into the bay were important factors that contributed to
increased oyster mortality (disease and predation) (Livingston et al., 2000). Mortality was a
major determinant of oyster production in the Apalachicola estuary with predation as a
significant aspect of such mortality. By influencing salinity levels and current patterns
throughout the bay, the Apalachicola River was important in controlling such mortality.
Actual mortality data were plotted in Figure 17 so that the behavior of the model relative
to real data could be observed. The distribution of mortality during 1985 (moderately low river
flow year) was highest in areas directly affected by high salinity; such mortality was also near the
entry points of oyster predators (St. Vincent Bar, Scorpion, Pickalene, Porter’s Bar). Predation on
the primary eastern oyster bars was usually relatively low. The projections of oyster mortality for
1986 (a drought year characterized by much lower river flow than 1985) were considerably
higher, especially on the highly productive bars in eastern sections of the bay. Experimental
oyster mortality data taken during May 1986 (Figure 17) tended to confirm the model projections.
During 1986 the projected predation on high producing bars such as Cat Point, East Hole,
Platform and Sweet Goodson would have been extensive. These model projections were verified
by losses of oysters on the eastern bars during the most recent drought periods.
The effect of river flow, as an indirect determinant of oyster mortality due to predation
through primary control of salinity regimes, was a major factor in the development of oysters in
Apalachicola Bay. Model results indicated that reductions of river flow would be accompanied
by substantial reductions in oyster stocks. Predation is an active factor in the determination of
oyster production in the Apalachicola system. An example of its importance is the near total
demise of the St. Vincent oyster bar following the opening of Sike’s Cut in the mid-1950’s.
Oyster bar associations include various organisms that prey on oysters (Menzel et al., 1958,
1966). Our experiments indicated that oyster mortality in the Apalachicola system was related to
salinity as a determinant of oyster predation and the geographic position of the reef relative to the
60

natural (East Pass, West Pass, Indian Pass) and man-made (Sike’s Cut) entry points of predators
from the Gulf.
Figure 17: Map of projected oyster mortality in the Apalachicola Bay system based on the statistical model for mortality in 1985 and the hydrodynamic model results for (A) 1985. (B) 1986. (C) 1991. Circles indicate observed mortality values from oyster predation experiments (1985, May-August average).
The association of increased oyster mortality with extent and duration of reduced river
flow is consistent with the initial increase of oyster production at the initiation of the drought that
is followed by oyster losses during an extended period of low river flows. Increased mortality
with prolonged drought is verified by oyster losses during recent droughts.
61

By coupling hydrodynamic modeling with descriptive and experimental biological data,
Livingston et al. (2000) were able to determine the effects of potential freshwater diversions on
oyster production in Apalachicola Bay. The very high oyster production rates in the
Apalachicola system depend on a combination of variables that are directly and indirectly
associated with freshwater input as modified by wind, tidal factors, and the physiography of the
bay. River flow reduction, whether through naturally occurring droughts, through increased
upstream anthropogenic (consumptive) water use, or a combination of the two, could have
serious long-term, adverse consequences for oyster populations. Based on the findings of
Livingston et al. (1997, 2000), the authors concluded that an anthropogenic reduction of
freshwater flow during relatively low-flow periods could extend and exacerbate the effects of
natural drought periods on the bay through enhanced oyster mortality by predation and disease.
Reductions of oyster production that are part of the natural cycle of river flow could thus be
extended or, under extreme conditions, made permanent, thereby eliminating the naturally high
oyster production of the Apalachicola system.
8. Recent Droughts and River Flow Changes
A comparison of the bottom salinities at Cat Point Bar (CP) and the Dry Bay (DB)
indicated relatively high salinities at Cat Point during various time periods (1996, 1995, 1999-
2001). During a recent drought (1999-2002), there was a series of extremely low-flow periods.
Data, provided by the Apalachicola National Estuarine Reserve (Lee Edmiston, Pers. Comm.),
indicated that the Cat Point area had systematically higher bottom salinities than Dry Bar. The
prolonged drought of 1999-2002 was associated with the most consistently high salinities since
the initial study period by the Livingston research group (1972-1990). These salinities peaked
during 2001. The salinity maxima were consistently high from 1991-2001 whereas salinity
minima showed pronounced increases during 2001. This trend was consistent with the relatively
low standard deviations during 2001, an observation that has significance when oyster trends
during this period are taken into account.
It should be recognized that various species take advantage of natural drought-flood
conditions on an interannual basis. This results in a temporal succession of dominant species
based on long-term adaptive responses to a natural range of river flows.
62

A review of river flow rates below 10000 cfs from 1950-2008 is given in Table 3.
Based on a comparison of the low flows during the study period, the lowest flows from 1954-
1990 were generally less frequent than those from 1999-present. In general, the averages of
the low flows for periods from 1999-2007 were lower than those from 1954-1990. These data
indicate that in the most recent decade, low-flow periods associated with reservoir and other
water management practices during droughts have been more severe in terms of both duration
and extent.
Table 3: Apalachicola River flow rates (Sumatra) below 10000 cfs over the period from 10/1950-5/2008.
year/mnth Average of flow(cfs)
Average of flow(m3/sec) year/mnth
Average of flow(cfs)
Average of flow(m3/sec)
1954/09 9380 266 1999/09 8612 2441954/10 8575 243 1999/10 8051 2281954/11 9064 257 1999/11 7996 2261955/10 8834 250 1999/12 9300 2631955/11 8231 233 2000/06 6085 1721955/12 9622 272 2000/07 5631 1591956/01 9209 261 2000/08 5878 1661956/06 9902 280 2000/09 7302 2071956/11 9894 280 2000/10 6515 185
average 9190 260 2000/11 7368 2091981/09 9963 282 2001/09 8665 2451981/10 7598 215 2001/10 6790 1921981/11 6574 186 2001/11 6479 183
average 8045 228 2001/12 7947 2251986/06 9981 283 2002/05 9902 2801986/07 8355 237 2002/06 8397 2381986/08 7382 209 2002/07 7591 2151986/09 8437 239 2002/08 7939 2251986/10 7323 207 2002/09 9509 2691987/10 9565 271 average 7630 2161987/11 8968 254 2006/06 8214 2331987/12 9806 278 2006/07 6930 1961988/06 9989 283 2006/08 7072 2001988/07 8038 228 2006/09 8899 2521988/08 7460 211 2006/10 7854 222
average 8664 245 2007/05 8565 2431990/09 9083 257 2007/06 6175 1751990/10 9157 259 2007/07 6194 1751990/11 9884 280 2007/08 6207 176
average 9375 265 2007/09 6412 182 2007/10 7727 219 2007/11 6762 191 2007/12 7282 206 average 7253 205
63

During the 1999-2002 drought, there was a collapse of oystering in the Eastern reefs from
Cat Point to East Hole. In a 2002 field assessment by the Florida Department of Environmental
Protection (G. S. Gunter, Pers. Comm.), lowered oyster productivity in eastern bay reefs was
accompanied by large numbers of predators that included oyster drills, crown conchs, scallops
and sea urchins. Hard and soft corals were noted on Porter’s Bar during these field surveys (G.
S. Gunter, Pers. Comm.). With a return of higher river flows during 2003, there was an increase
of observed oysters on the Cat Point and East Hole with an accompanied reduction of oyster
predators (G. S. Gunter, Pers. Comm.), During the 2002 collapse of the eastern oyster reefs,
commercial oystering continued in northern sections of western bars such as Dry Bar and upper
St. Vincent Bar (G. S. Gunter, Pers. Comm.). The above observations during the 1999-2002
drought represent field verification of model predictions made by Livingston et al. (2000). With
permanent reductions of Apalachicola River flow in the region related, in part, to reservoir and
other recent water management practices, the adverse effects of natural droughts would be
accentuated. Over prolonged periods, the resilience of the bay to such events would be
systematically reduced which could then lead to more permanent reductions of those forms of
secondary production (such as oysters, shrimp, blue crabs and sciaenid fishes) that depend on the
interannual cycling of natural river flows into the bay.
The most recent drought (2007-present) followed a similar pattern to that described for
the 1999-2002 drought. During this drought, salinities in East Bay have reached unprecedented
high levels (>30 ppt) (L. Edmiston, J. Wanat, Pers. Comm.). The highly productive eastern bars
have been adversely affected by predators and disease (the exact proportions could not be
determined; G. Lewis, Pers. Comm.). Cat Point, the leading oyster producing reef in the bay, was
hit hard by predators during the recent drought. Oyster catches have been largely restricted to
lower producing bars in the western parts of the bay during the period of increased salinity.
These observations represent field verifications of the oyster model results described above
(Livingston et al., 2000).
Grass beds in the upper bay, dominated by Vallisneria americana, have been adversely
affected by recent droughts (L. Edmiston, Pers. Comm.). This submerged aquatic vegetation
(SAV) supports a productive food web in East Bay (Purcell, 1977). Based on a survey of the
SAV in East Bay in June 2005, Hurricane Dennis took out all the SAV in both the lower river and
64

East Bay. The grass beds started to return the following year. However, the grass beds have all
but disappeared again since the most recent drought. The high salinities associated with the
drought are thought to be responsible for the loss of the East Bay SAV due to the fact that such
vegetation is adapted to low and varying salinity (L. Edmiston, J., Pers. Comm.).
Trawl data (L. Edmiston, J. Wanat, Pers. Comm.) indicate that, after initial increases of
population density during the beginning of the 1999-2002 drought, there were subsequent
reductions that followed the model noted by Livingston et al.(1997) (see above). The trawl data
taken by Edmiston and Wanat indicate severe reductions of white shrimp in East Bay and the
Apalachicola estuary as a whole over the past 2 years. Pink shrimp increased modestly during
2007, but the numbers of this species did not compensate for the loss of the white shrimp in the
bay. Relatively few blue crabs were taken in East Bay during 2007. Commercial fishing landings
data taken during 2007 reflected decreases of white shrimp (down 90%), brown shrimp (down
55%), blue crabs (down 55%) and flounder (down 40%) relative to 2004-2006 and 2006 periods.
The severely reduced landings of key commercial species represents a practical example of how
low river flows, exacerbated by upstream human activities, have adverse effects on the
Apalachicola estuary.
Although it is too early to assess the final outcome of this latest drought, it is clear that
the commercial resources of the bay are currently in danger of being lost for an as yet
undetermined period. If the increased incidents of low river flow regimes during severe drought
periods in recent decades continues as a trend into the future, the bay productivity in terms of the
key commercial species will inevitably give way to replacement by less important species in
terms of their fisheries value. The resilience of the bay is being serially reduced by the increased
severity and length of the reduced river flows during droughts. There is evidence that non-linear
responses by key bay populations to reductions of river flows have already occurred. The almost
total lack of effective water conservation efforts in the Tri-river system has undoubtedly
exacerbated an already serious loss of Apalachicola River and Bay productivity.
65

III. Management of the Apalachicola River-bay System
Because of the generally pristine state of the Apalachicola drainage system, planning and
management was carried out as preemptive activity rather than a restoration effort (Figure 18).
Figure 18: Map showing major elements of the Apalachicola Management Plan.
66
The extensive studies of the Apalachicola system that have been carried out since 1972
were used to develop an ecosystem-based management program that included the purchase of
wetlands associated with both the river and the bay (Figure 18). The scientific data provided the
objective basis for the development of the Apalachicola management program that has been
documented by Livingston (1976b, 1977, 1980, 1982b, 1983, 2000, 2002).
The primary objectives of much of the early planning were related to maintaining natural
flows to receiving areas and they included the following:
1) Purchases of environmentally critical lands in the Apalachicola drainage system that
now include most of the river-bay wetlands systems (Figure 18). 2) Designation of the Apalachicola system as an Area of Critical State Concern, (Florida
Environmental Land and Water Act of 1972; Chapter 380, Florida statutes). 3) Creation of cooperative research efforts to determine the potential impact of activities
such as ongoing forestry management programs, urban development, and pesticide treatment programs.
4) Making provisions for aid to local governments in the development of comprehensive
land use plans, a function that is vested primarily at the county commission level in Florida.
Documentation of facts concerning the Apalachicola Basin (Livingston and Joyce, 1977)
provided the initial details of the unique ecological status of the Apalachicola system. The
linkage between the upland freshwater wetlands and the Apalachicola estuary via nutrient loading
analyses together with related bay studies led to purchases of river-wetlands by the Florida
Department of Natural Resources as part of the Environmentally Endangered Land program
(Chapter 259, Florida statutes). The initial purchase was thirty thousand acres of hardwood
wetlands in the lower Apalachicola in December 1976 (Pearce, 1977; Figure 18). This was to be
the first of many wetland purchases in the Apalachicola region that have continued up to the
present time. Upland and coastal wetlands along the Apalachicola River and the East Bay area
(Tate’s Hell Swamp; Figure 18) have been recently purchased by state agencies.
Since the mid-1970’s, the State of Florida has spent over $239 million through land
acquisition to protect the wetlands system of the Apalachicola River and Bay system. Currently,
major parts of the Apalachicola River river-wetland system is held by public agencies for
67

preservation and management (Figure 18). This is a unique situation in terms of protective
measures of large river-estuarine systems in the United States. The state of Florida has devoted
considerable time and expense to assure that the wetlands along the Apalachicola River-Bay
system remain viable relative to the importance of such wetlands to the productivity of this
drainage basin.
Thanks to the efforts of the same coalition of local and state personnel that instituted land
planning in Franklin County in the early 1970's, the Apalachicola scientific database was used to
establish the Apalachicola River and Bay Estuarine Sanctuary in 1979. This sanctuary, now
designated a National Estuarine Research Reserve, included the purchase of about 78,000 ha in
the bay system (Figure 18). The original designation included $3.8 million for land purchases in
the East Bay wetlands. The reserve remains one of the largest such systems in the country. The
Florida government purchased Little St. George Island in 1977 (Figure 18). Somewhat later, an
area above the East Hole oyster beds (Unit 4 EEL; Figure 18) was purchased through the efforts
of the Trust for Public Lands (Caroline Reusch, Pers. Comm.). St. Vincent Island was already a
federal preserve administered by the U. S. Department of the Interior (Figure 18). The east end of
St. George Island is a state park. After considerable legal proceedings, most of the western
section of St. George Island (the Plantation, Figure 18) was planned for maximum protection of
island freshwater drainages, associated wetlands, and upland vegetation.
In a relatively short period, land purchases on the barrier islands were added to the
purchases of the East Bay and Apalachicola River wetlands to complete a ring of publicly owned
lands around the most environmentally sensitive areas of the Apalachicola River-Bay system
(Figure 18). When combined with state regulations (Aquatic Preserve, Area of Critical State
Concern) and a Franklin County management program designed to protect the bay from urban
runoff, most of the land-water interfaces were thus protected from the effects of human activities.
The management of a river-dominated estuary should be based on protection and control
of fresh water sources, nutrients, and organic matter with a minimization of physical alterations
that often lead to increased salinity stratification and the associated loss of the nursery function
of the estuary. These processes underlie the very basis of riverine and estuarine productivity. It
is clear that fisheries production, the nursery function, and the productivity of individual
68

populations depend on species-specific responses to combinations of freshwater input, salinity
changes, food web processes, and interspecific predation and competition. Due to the lack of
science-based management of river-estuarine systems throughout the United States, these areas
are quietly succumbing to the detrimental effects of a range of human activities (Livingston,
2000, 2007). These effects can be avoided, but only if adequate research is directed to a
scientific determination of the fresh water needs and nutrient-loading tolerances of coastal
systems.
Based on established relationships in a series of river-estuarine systems along the NE
Gulf of Mexico, management of these resources should be based on the following:
1) protection of freshwater and coastal wetlands 2) maintenance of adequate freshwater input to sustain natural productivity and the
important nursery function of the river-bay system 3) minimization of physical alterations of the river-estuary that could lead to adverse
changes involving nutrient transfer and salinity distribution, and 4) management of local municipal development and agricultural runoff to minimize input
of toxic agents, nutrients, and disease vectors to receiving river-estuarine systems. IV. Current Threats to the Apalachicola River-bay System
1. Cumulative Reductions of Apalachicola River Flow Rates
Agricultural and municipal interests along the Apalachicola-Chattahoochee-Flint system
continue to increase pressure on the freshwater resources of the Tri-river basin. There are
proposals to re-allocate water in the Lake Lanier storage from hydropower to water supply for
rapidly growing Atlanta, Georgia metropolitan area. Models (Livingston, 1988) indicated that
agricultural use of water in the Tri-river system would eventually lead to serious depletion of
freshwater input to the Apalachicola from the Georgia area. Recent analyses (Livingston et al.,
2003) found that depletions of freshwater in the basin already represented a significant portion of
low flow during summer months, and forecasted demands for the ACF basin suggested that such
losses would become even greater with time especially in low-flow summer months.
69

Leitman (2003a) and Leitman et al. (2003) reviewed cumulative monthly freshwater
deficits during three major drought events in the Apalachicola systems (mid-1950’s, mid-1980’s,
1999-2002). In developing the comparisons, the authors expected that the unimpaired flow
results would correspond to fluctuations in the rainfall data over the entire period of record. A
cumulative deficit evaluation of the drought events showed that the greatest cumulative rainfall
deficit occurred during the mid 1950’s drought event, but the greatest flow deficit occurred during
the 1999–2002 drought event. Leitman (2003a, b) found that during average years, the net evapo-
precipitation losses from impoundments in the ACF basin were considerable; these losses in the
Flint and Chattahoochee areas far exceeded consumptive losses in the year 2000 for municipal
and industrial uses for the entire Chattahoochee system (including metro Atlanta and Columbus,
Georgia) for all months between May and October except August. If the net evapo-precipitation
losses for 1986 were considered, such losses exceeded the consumptive losses for municipal and
industrial demands for all months between May and September.
The net evapo-precipitation losses for 1999 exceeded the consumptive losses for
municipal and industrial demands for April, May, August and September. The drought of 1999-
2002 had lower river flows but higher precipitation levels than those observed during the drought
of the 1950’s. The differences were related to higher consumptive uses (via the evaporation
losses from the impoundments and reservoir management practices) during the 1999-2002
drought. The low oyster production during the drought was thus directly related to low river
flows and high salinities due, in part, to anthropogenic changes in the Flint and Chattahoochee
Rivers including (among other anthropogenic factors) the building and management of dams and
their resulting reservoirs.
Leitman et al. (2003) concluded that flows of the Apalachicola River at the
Chattahoochee gage during drought events have been affected by consumptive demands, and that
the Corps of Engineers daily unimpaired flow data at the Columbus gage for the years 1999-2001
do not totally reflect these impacts.
2. Recent Actions by the Federal Government After a series of legal proceedings over the past 2 decades among the states of Florida,
Georgia and Alabama for water rights in the ACF system, negotiations among the governors of
70

these states broke down in February 2008. In April 2008, the U. S. Army Corps of Engineers (U.
S. A. C. E., 2008) released a federal proposal that would allow Georgia to keep more water in
reservoirs during droughts. This would essentially result in lower river flows during droughts into
the Apalachicola River with the onus of lower flows placed on the natural resources of the
Apalachicola River and Bay system. There is no mention of any form of conservation effort that
would be designed to limit the impact of such droughts on the Florida resources.
According to a report by the Carnegie Institution for Science (2008), the following
evidence of long-term changes in the atmosphere was published:
“The Earth’s jet streams, the high-altitude bands of fast winds that strongly influence the paths of storms and other weather systems, are shifting—possibly in response to global warming. Scientists at the Carnegie Institution determined that over a 23-year span from 1979 to 2001 the jet streams in both hemispheres have risen in altitude and shifted toward the poles. The jet stream in the northern hemisphere has also weakened. These changes fit the predictions of global warming models and have implications for the frequency and intensity of future storms, including hurricanes.... Storm paths in North America are likely to shift northward as a result of the jet stream changes. Hurricanes, whose development tends to be inhibited by jet streams, may become more powerful and more frequent as the jet streams move away from the sub-tropical zones where hurricanes are born.” This change could mean less rain in the already drought-stricken SE United States. There
is no way of confirming the long-term effects of climate changes due to Global Warming. There
is ample scientific information that there are major changes taking place in recent decades. If the
projections of reduced rainfall in the ACF region are true, it would place even more emphasis on
the need for an advanced water conservation effort in this area. The increase of the frequency
and intensity of droughts in the Apalachicola system is a fact, however, and the potential for
further reductions of rainfall and river flow should be included in an calculations for water
conservation efforts. It is possible that future, long-term changes in atmospheric conditions
could lead to further reductions of river flows. There is a real need to organize a comprehensive
scientific study program to evaluate the impacts of reduced river flow rates, and to use the
objective findings to develop a water conservation plan for the ACF basin.
71

V. Conclusions
1. The Apalachicola River is one of the last major free flowing, unpolluted alluvial systems in the conterminous United States. The Apalachicola River has historically been among the most productive systems in the northern hemisphere, and is a major center for endemic and endangered species. Seasonal flooding provides the engine for mobilization and transfer of the nutrients and detritus between the Apalachicola wetlands and associated river and bay areas. Food webs leading to high production of oysters, shrimp, blue crabs and fin fishes in Apalachicola Bay are linked to river flows that control salinity regimes and nutrient dynamics of the bay. 2. Apalachicola River wetlands represent a center of endemism for terrestrial species that includes amphibians, reptiles, and birds. Due to the high diversity of wetland and upland habitats, the highest species density of amphibians and reptiles in North America (north of Mexico) occurs in the upper Apalachicola basin. The Apalachicola River and floodplain depend on natural river flows in terms of frequency and duration of inundation and saturation. 3. The Apalachicola River has the greatest flow rates of all the river-drainages along the northeast Gulf of Mexico. River input dominates salinity and water quality in the bay system. The river represents a major source of productivity in the adjoining coastal region. 4. There has been a considerable investment by local, state and federal associations and agencies in terms of time and money to manage the Apalachicola drainage system. Since the mid-1970’s, the State of Florida has spent over $239 million through land acquisition to protect the Apalachicola River and Bay system. Currently, major parts of this system are held by public agencies for preservation and management. This is a unique situation in terms of protective measures of large river-estuarine systems in the United States. 5. Scientific reviews indicate that there has been a serious change in the Apalachicola flow rates with an increase of the frequency and severity of low flow periods due to droughts. There is also evidence that these changes are due, in part, to water use in the upper parts of the Tri-river system. The drought of 1999-2002 had lower river flows but higher precipitation levels than those observed during the drought of the 1950’s. The differences could be related to higher consumptive uses during the 1999-2002 drought. There will be increased municipal and agricultural development in the Tri-River Basin in future years that will put more pressure on river flows during drought periods. 6. Increased frequency and duration of recent droughts have been associated with losses of about 3 million canopy trees in the non-tidal Apalachicola River wetlands. Low-flow regimes of river flows during recent droughts have caused kills of federally “protected” mussels. Numerous dead and dying mussels at various locations have been noted during a recent drought. Minimum flows of 8000 cfs are likely to be required for maintenance of existing slough and channel margin unionid populations, and are essential for recovery of federally listed species. 7. Different sources of information regarding the Apalachicola River system indicate that flow management for riverine and wetland productivity, biodiversity and endangered species
72

should be based on historical seasonal and interannual flow rates of the Apalachicola River. Projected flow rates of the Apalachicola River should follow these patterns to maintain the highly diverse and productive species that are currently adapted to the natural periodicity of this system. 8. Results of previous studies indicate that the Apalachicola estuary has been in a relatively natural state historically. The undisturbed progression of river-bay interactions, along with little human development in the Apalachicola basin, resulted in a productive bay system with high levels of secondary productivity relative to other river-dominated estuaries. 9. The response of the bay to river flows is complex due to species-specific responses to the river-directed habitat changes and responses of the food web to nutrient loading and phytoplankton production. The river contributes to a broad spectrum of habitats that accommodate commercially important species. The distribution of oysters and epibenthic fishes and invertebrates in the Apalachicola Estuary follows a specific spatial relationship to river flows. Dominant bay populations follow a broad spectrum of diverse phase interactions with river flow and associated changes in salinity over interannual periods of drought and flood conditions 10. Nutrient-induced phytoplankton productivity is an important component of estuarine food webs along the Gulf coast. The alluvial river also provides river-derived nutrients and organic matter that fuel the planktonic and detrital food webs. The combination of these sources of autochthonous and allochthonous organic carbon provides the resources for consumers in the Apalachicola Estuary. Reduced river flows and flooding will diminish this loading leading to a collapse of useful productivity in receiving coastal areas. There is evidence that recent extended periods of low river flow have already adversely affected organic carbon loading to the bay. 11. Recent research was conducted on the nutrient history in Apalachicola Bay sediments. Samples taken near the river mouth indicated that organic matter deposition was driven by both natural (i.e., hurricanes and droughts) and anthropogenic (i.e., hydrologic river alteration and dredging) activity. After the drought of 1981, Woodruff Dam operation procedures and the resultant river discharge patterns could have affected mass sedimentation rates and organic loading within the estuary. “Carbon and nitrogen concentrations, ratios, and stable isotopes coupled with grain-size shifts for the bay suggest a decrease in river organic matter supply and a change in sediment clay content supply and/or distribution for the bay.” Coupling ACF River discharge alterations with sea-level rise appears to clearly account for the modification to organic matter sources for the entire bay. 12. The dominant, commercially important populations of the Apalachicola estuary (oysters [Crassostrea virginica], blue crabs [Callinectes sapidus], penaeid shrimp [Litopenaeus setiferus, Farfantepenaeus spp.], and sciaenid fishes [Cynoscion spp.]) are adapted to varying salinities. With reduced flows, salinity goes up, reducing physical stress that results in increased species richness as stenohaline populations (adapted to high salinity in offshore Gulf areas) enter the bay. Individual population productivity is reduced accordingly due to altered habitat conditions and enhanced predation, competition and disease.
73

13. Within natural boundaries of river flows, food web processes in the bay vary little in terms of qualitative and quantitative interactions. Below a certain level of river flow, however, the estuary becomes a very different system. With prolonged reductions of river flow, there are eventual decreases in biological production due to reduced nutrient loading and altered phytoplankton assemblages. Together with associated habitat changes, the commercially important populations are replaced by less productive species as the value of the bay is substantially reduced. With the more or less permanent reduction of freshwater flows below a level specific for the receiving system, the physically controlled, highly productive river-estuarine system will eventually become a high diversity, biologically controlled bay of substantially reduced fishery potential. 14. Brackish water submerged aquatic vegetation (SAV) dominated by Vallisneria americana in East Bay has served as nursery grounds for penaeid shrimp and other crustaceans and fishes at early stages of their ontogenetic (developmental) progressions in the bay. Shoalgrass (Halodule wrightii) with other species such as Gracilaria spp. and manatee grass (Syringodium filiforme) represent highly productive habitats along St. George Island with the infaunal macroinvertebrates in this part of the bay among the most speciose in the northern hemisphere. The grass bed fauna includes species used as food for the abundant blue crabs (Callinectes sapidus), pink shrimp (Farfantepenaeus duorarum), pinfish (Lagodon rhomboides) and spotted seatrout (Cynoscion nebulosus). The seagrass beds off St. James Island are dominated by turtle grass (Thalassia testudinum) and manatee grass (Syringodium filiforme). These grass beds provide habitat for southern flounder (Paralichthys albigutta), spotted seatrout (Cynoscion nebulosus), and various species of sharks. 15. The drought of 1980-1981 had a profound effect on the trophic organization of East Bay. This impact remained at various trophic levels during the 2.5-year period of river flow recovery. Similar changes during more recent droughts indicate a relatively similar response of dominant estuarine species to prolonged droughts. There is evidence that anthropogenic reductions of river flow that occur outside of the evolutionary experience of a given species may have an enhanced adverse impact on the ability of that population to recover relative to natural changes to which the species has adapted through time. 16. During the most recent decade, low flows experienced during droughts have been more severe in terms of both duration and extent. Recent salinity increases due to low flows during droughts have adversely affected oyster beds and the East Bay grass beds that represent important habitats and sources of productivity for the upper bay. Commercial fishing landings during the 2007 drought were associated with decreases of white shrimp (down 90%), brown shrimp (down 55%), blue crabs (down 55%) and flounder (down 40%). Major losses in key oyster producing areas were noted due to high salinities and associated mortality due to predation and/or disease. It is not clear how these changes will affect long-term production of these species. The severe losses of the oyster, shrimp and blue crab production during the most recent and ongoing low flow events during droughts lends credence to the hypothesis of a non-linear response in the form of accelerated loss relative to low flow frequency and intensity during droughts.
74

17. Losses of commercial fisheries, together with impacts on river wetlands, represent a threat to unique cultural and economic resources of the Apalachicola system. It is likely that the current losses could be expanded indefinitely as resilience of the system is serially reduced by the increased frequency and duration of droughts. This condition is exacerbated by anthropogenic reductions of fresh water flows due to urbanization and agriculture in upstream areas. 18. Scientists at the Carnegie Institution determined that over a 23-year span from 1979 to 2001, the jet streams in both hemispheres have risen in altitude and shifted toward the poles. This change could mean less rain in the already drought-stricken SE United States. There is no way of confirming the long-term effects of climate changes due to Global Warming. There is ample scientific information that there are major changes taking place in recent decades. If the projections of reduced rainfall in the ACF region are true, it would place even more emphasis on the need for an advanced water conservation effort in this area. 19. After a series of legal proceedings for almost 2 decades among the states of Florida, Georgia and Alabama for water rights in the ACF system, negotiations among the governors of these states broke down in February 2008. In April 2008, the U. S. Army Corps of Engineers (U. S. A. C. E., 2008) released a federal proposal that would allow Georgia to keep more water in reservoirs during droughts. This would essentially result in lower river flows during droughts into the Apalachicola River with the onus of lower flows placed on the natural resources of the Apalachicola River and Bay system. 20. It is not clear if the long-term resilience of the river and bay has been lessened by recent drought events, but it is likely that increased frequency and duration of river flow reductions in the future due to water removal by upstream human activities will eventually result in the loss of the Apalachicola resource. There have already been habitat and productivity changes that have led to elimination of the riverine wetlands as noted by substantial reductions of native trees in the flood plain, loss of the nursery function of the bay and destruction of the naturally high productivity associated with key aquatic species in the river and bay. 21. The increase of the frequency and intensity of low flows during droughts in the Apalachicola system is a fact, and the potential for further reductions of rainfall and river flow due to anthropogenic activities and climate changes should be included in calculations for water conservation efforts. Despite scientific evidence for a growing crisis in the Apalachicola system, there has been little effort in upstream areas for effective implementation of water conservation efforts. There is a real need to organize a comprehensive scientific study program to evaluate the impacts of reduced river flow rates, and to use the objective findings to develop and implement an appropriate water conservation plan for the ACF basin.
75

VI. Literature Cited and Bibliography
Armstrong, N. E. 1982. Responses of Texas estuaries to freshwater inflows. Pages 103-120 in V. S. Kennedy, editor. Estuarine Comparisons. Academic Press, New York, New York, U. S. A.
Baird, D. and R. E. Ulanowicz. 1989. The seasonal dynamics of the Chesapeake Bay ecosystem.
Ecological Monographs 59: 329-364. Blanchet, R. H. 1979. The distribution and abundance of ichthyoplankton in the Apalachicola
Bay, Florida area. M. S, Thesis. Florida State University, Tallahassee, Florida. U. S. A. Blumberg, A. F. and Mellor, G. L. 1980 A coastal ocean numerical model. In Mathematical
modeling of Estuarine Physics, Proceedings of the International Symposium, Hamburg, 24-26 August 1978 (Sundermann, J. and Holz, K. P., eds). Springer-Verlag, Berlin, pp. 203-214.
Blumberg, A. F. and Mellor, G. L. 1987 A description of a three-dimensional coastal ocean
circulation model. In Three-dimensional Coastal Ocean Models (Heaps, N.S., ed). American Geophysical Union, Washington, D.C., pp. 1-16.
Bobbie, R. J., S. J. Morrison, and D. C. White. 1978. Effects of substrate biodegradability on the
mass and activity of the associated estuarine microbiota. Applied Environmental Microbiology 35: 179-184.
Boynton, W. R., W. M. Kemp, and C. W. Keefe. 1982. Comparative analysis of nutrients and
other factors influencing estuarine phytoplankton production. Pages 69-90 in V. S. Kennedy, editor. Estuarine Comparisons. Academic Press, New York, New York, U. S. A.
Cairns, D. J. 1981. Detrital production and nutrient release in a southeastern flood-plain forest. M.
S. Thesis. Florida State University. Tallahassee, Florida, U. S. A. Cairns, J. Jr., and K. L. Dickson. 1977. Recovery of streams and spills of hazardous materials. In,
pp. 24-42, J. Cairns, Jr., K. L. Dickson, and E. E. Herricks, Editors, Recovery and Restoration of Damaged Ecosystems, University of Virginia Press, Charlottesville, Virginia, USA.
Carnegie Institution for Science, Department of Global Ecology, Geophysical Research Letters,
2008. Changing Jet Streams May Alter Paths of Storms and Hurricanes. Chanton, J. and F. G. Lewis. 1999. Plankton and dissolved inorganic carbon isotopic composition
in a river-dominated estuary: Apalachicola Bay, Florida. Estuaries 22: 575-583. Chanton, J. and F. G. Lewis. 2002. Examination of coupling between primary and secondary
production in a river-dominated estuary: Apalachicola Bay, Florida, U. S. A. Limnol. Oceanogr. 47: 683-697.
76

Christensen, J. D., Monaco, M. E., Livingston, R. J., Woodsum, G., Battista, T. A., Klein, C. J., Galperin, B. and Huang, W. 1998 Potential impacts of freshwater inflow on Apalachicola Bay, Florida oyster (Crassostrea virginica) populations: coupling hydrologic and biological models. NOAA/NOS Strategic Environmental Assessments Division Report, Silver Spring, Maryland. 58 pp.
Clements, W. H. and R. J. Livingston. 1983. Overlap and pollution-induced variability in the
feeding habits of filefish (Pisces: Monacanthidae) from Apalachee Bay, Florida. Copeia (1983): 331-338.
Clements, W. H. and R. J. Livingston. 1984. Prey selectivity of the fringed filefish Monacanthus
ciliatus (Pisces: Monacanthidae): role of prey accessibility. Mar. Ecol. Prog. Ser 16: 291-295.
Clewell, A. F. 1977. Geobotany of the Apalachicola River region. Pages 6-15 in R. J. Livingston,
editor. Proceedings of the conference on the Apalachicola drainage system. Florida Department of Natural Resources, Marine Resources Publication 26. St. Petersburg, Florida, U. S. A.
Cloern, J. E., A. E. Alpine, B. E. Cole, R. L. J. Wong, J. F. Arthur and M. D. Ball. 1983. River
discharge controls phytoplankton dynamics in the northern San Francisco Bay estuary. Estuarine, Coastal and Shelf Science 16: 415-429.
Cross, R. D. and D. L. Williams. 1981. Proceedings of the national symposium on freshwater
flow to estuaries. Fish and Wildlife Service, Washington, D. C., U. S. A. Danglade, E. 1917. Conditions and extent of the water level oyster beds and barren bottoms in the
vicinity of Apalachicola, Florida. Appendix V, Reports of the U.S. Commissioner of Fishes for 1916, Bureau of fishes Document No. 841. 75 pp.
Darst, M.R., and Light, H.M., 2007 Drying of Floodplain Forests Associated with Water-Level
Decline in the Apalachicola River, Florida—Interim Results, 2006: U.S. Geological Survey Open-File Report 2007-1019, 32 p.
Dayton, P. K., M. J. Tegner, P. E. Parnell, and P. B. Edwards. 1992. Temporal and spatial patterns
of disturbance and recovery in a kelp forest community. Ecological Monographs 62: 421-445.
Deegan, L. A., J. W. Day, Jr., J. G. Gosselink, A. Yanez-Arancibia, G. Soberon Chavez, and P.
Sanchez-Gil. 1986. Relationships among physical characteristics, vegetation distribution, and fisheries yield in Gulf of Mexico estuaries. Pages 83-100 in D. A. Wolfe, editor. Estuarine Variability. Academic Press, Inc., New York, New York, U. S. A.
Denman, K. and T. Platt. 1977. Time series analysis in marine ecosystems. Pages 227-242 in H.
H. Shugart, Jr. editor. Time Series and Ecological Processes. Siam Institute for Mathematics and Society, Philadelphia, Pennsylvania, U. S. A.
77

Duncan, J. L. 1977. Short-term effects of storm water runoff on the epibenthic community of a north Florida estuary (Apalachicola, Florida). M. S. Thesis. Florida State University, Tallahassee, Florida, U. S. A.
Edmiston, H. L. 1979. The zooplankton of the Apalachicola Bay system. M. S. Thesis. Florida
State University, Tallahassee, Florida, U. S. A Elder, J. F. and D. J. Cairns. 1982. Production and decomposition of forest litter fall on the
Apalachicola River floodplain, Florida. U. S. Geological Survey Water-Supply Paper 2196.
EnviroScience, Inc. 2005. Freshwater mussel and habitat surveys of the Apalachicola River,
Chipola River, and selected sloughs/tributaries. Final Report. Estabrook, R. H. 1973. Phytoplankton ecology and hydrology of Apalachicola Bay. M. S. Thesis.
Florida State University. Tallahassee, Florida, U. S. A. Ezer, T. and Mellor, G. L. 1997 Simulations of the Atlantic Ocean with a free surface sigma
coordinate ocean model. Journal of Geophysical Research 102 647-657. Federle, T. W. , R. J. Livingston, D. A. Meeter, and D. C. White. 1983. Modification of estuarine
sedimentary microbiota by exclusion of epibenthic predators. Journal of Experimental Marine Biological Ecology 73: 81-94.
Funicelli, N. A. 1984. Assessing and managing effects of reduced freshwater inflow to two Texas
estuaries. Pages 435-446 in V. S. Kennedy, Editor. The Estuary as a Filter. Academic Press. New York, New York, U. S. A.
Gorsline, D. S. 1963. Oceanography of Apalachicola Bay. Pages 145-176 in Essays in marine
geology in honor of K. O. Emery. University of Southern California Press, Los Angeles, California, USA.
Harrison, G. W. 1979. Stability under environmental stress: resistance, resilience, persistence,
and variability. Am. Nat. 113:659-669. Hayes, P. F., and R. W. Menzel. 1981. The reproductive cycle of early setting Crassostrea
virginica (Gmelin) in the northern Gulf of Mexico, and its implications for population recruitment. Biol. Bull. 160:80-88.
Heard, W. H. 1977. Freshwater mollusca of the Apalachicola drainage. Pages 20-21 in R. J.
Livingston, editor. Proceedings of the conference on the Apalachicola drainage system. Florida Department of Natural Resources, Marine Resources Publication 26. St. Petersburg, Florida, U. S. A.
Hoehn. T. 2002. Apalachicola-Chattahoochee-Flint River water control plan technical assistance
document. Florida Department of Environmental Protection, Tallahassee, Florida.
78

Howarth, R. W. 1988. Nutrient limitation of net primary production in marine ecosystems. Annual Reviews of Ecology and Systematics 19: 89-110.
Ingle, R. M., and C. E. Dawson. 1952. Growth of the American Oyster Crassostrea virginica
(Gmelin) in Florida Waters. Bull. Mar. Sci. Gulf and Caribbean 2:393-404. Ingle, R. M., and C. E. Dawson. 1953. A survey of Apalachicola Bay, Technical Series No. 10.
State of Florida Board of Conservation 38 pp. Iverson, R. L., W. Landing, B. Mortazawi, and J. Fulmer. 1997. Nutrient transport and primary
productivity in the Apalachicola River and Bay. F. G. Lewis, Ed. Apalachicola River and Bay Freshwater Needs Assessment. Report to the ACF/ACT Comprehensive Study. Northwest Florida Water Management District, Havana, Florida. Unpublished Report.
Kemp, W. M. and W. R. Boynton. 1984. Spatial and temporal coupling of nutrient inputs to
estuarine primary production: the role of particulate transport and decomposition. Bulletin of Marine Science 35: 522-535.
Laughlin, R. A. 1979. Trophic ecology and population distribution of the blue crab, Callinectes
sapidus, Rathbun, in the Apalachicola estuary (North Florida, U.S.A.) Ph. D. Dissertation. Florida State University. Tallahassee, Florida, U. S. A.
Laughlin, R. A. and R. J. Livingston. 1982. Environmental and trophic determinants of the
spatial/temporal distribution of the brief squid (Lolliguncula brevis) in the Apalachicola Estuary (North Florida, USA). Bulletin of Marine Science 32: 489-497.
Leber, K. M. 1983. Feeding ecology of decapod crustaceans and the influence of vegetation on
foraging success in a subtropical seagrass meadow. Ph. D. Dissertation, Florida State University, Tallahassee, Florida.
Leber, K.M. 1985. The influence of predatory decapods, refuge, and microhabitat selection on
seagrass communities. Ecology 66: 1951-1964. Lehman, P. W. 1992. Environmental factors associated with long-term changes in chlorophyll
concentration in the Sacramento-San Joaquin delta and Suisun Bay, California. Estuaries 15: 335-348.
Leitman, S.F. 2003a. An evaluation of evapo-precipitation loses from impoundments in the ACF
basin. Unpublished report. Leitman, S.F. 2003b. Review of cumulative monthly deficits during three major drought events.
Unpublished report. Leitman, H. M., J. E. Sohm, and M. A. Franklin. 1982. Wetland hydrology and tree distribution of
the Apalachicola River floodplain, Florida. U. S. Geological Survey Report 82. U. S. Government Printing Office, Washington, D. C. U. S. A. 92 pp.
79

Leitman, S., L. Ager, and C. Mesing. 1991. The Apalachicola experience: Environmental effects of physical modifications to a river. In R. J. Livingston, Editor. The Rivers of Florida. Springer-Verlag, New York, New York, U. S. A.
Leitman, S., J. Dowd, and Skelly Hombeck-Pelham. 2003. An evaluation of observed and
unimpaired flow and precipitation during drought events in the ACF basin. Proceedings of the 2003 Georgia Water Resources Conference, held April 23-24, 2003, at the University of Georgia, Kathryn J. Hatcher, editor, Institute of Ecology, The University of Georgia, Athens, Georgia.
Light, H.M., Darst, M.R., and Grubbs, J.W., 1998, Aquatic habitats in relation to river flow in the
Apalachicola River floodplain, Florida: U.S. Geological Survey Professional Paper 1594, 77 p.
Light, H.M., Vincent, K.R., Darst, M.R., and Price, F.D., 2006, Water-Level Decline in the
Apalachicola River, Florida, from 1954 to 2004, and Effects on Floodplain Habitats: U.S. Geological Survey Scientific Investigations Report 2006-5173, 83 p., plus CD.
Livingston, R. J. 1975. Resource management and estuarine function with application to the
Apalachicola drainage system. Estuarine Pollution Control and Assessment 1: 3-17. Livingston, R.J. 1975. Resource management and estuarine function with application to the
Apalachicola drainage system (North Florida, U.S.A.).Office of Water and Hazardous Materials, U.S. Environmental Protection Agency: included in final collection of papers (reviewed and published for submission to the Congress of the United States), Estuarine Pollution Control and Assessment, Vol. 1, 3-17.
Livingston, R. J. 1976. Dynamics of organochlorine pesticides in estuarine systems and their
effects on estuarine biota. Invited paper, Proceedings of the Third International Estuarine Research Federation Conference, Galveston Texas. October, 1975. Estuarine Processes I., 507- 522.
Livingston, R. J. 1976a. Diurnal and seasonal fluctuations of organisms in a north Florida estuary.
Estuarine and Coastal Marine Science 4: 373-400. Livingston, R. J. 1976b. Environmental considerations and the management of barrier islands: St.
George Island and the Apalachicola Bay system. Pages 86-102 in Barrier Islands and Beaches. Technical Proceedings of the 1976 Barrier Islands Workshop. Annapolis, Maryland, U. S. A.
Livingston, R. J. 1977. The Apalachicola dilemma: Wetlands development and management
initiatives. Pages 163-177 in National Wetlands Protection Symposium; Environmental Law Institute and the Fish and Wildlife Service. Washington, D. C. U. S. A.
Livingston, R. J., 1978. Short- and Long-term Effects of Forestry Operations on Water Quality
and the Biota of the Apalachicola Estuary (North Florida, U. S. A.). Technical Paper No.
80
5, Florida Sea Grant, National Oceanic and Atmospheric Administration, Gainesville, Florida.
Livingston, R. J. 1979. Multiple factor interactions and stress in coastal systems: A review of
experimental approaches and field implications. Pages in F. J. Vernberg, Editor. Marine Pollution: Functional Responses. Academic Press, Inc. New York, U. S. A.
Livingston, R.J. 1980. Ontogenetic trophic relationships and stress in a coastal seagrass system in
Florida. Pages 423-435 in V.S. Peterson, editor. Estuarine perspectives. Academic Press, New York, New York, USA.
Livingston, R. J., 1980. Critical Habitat Assessment of the Apalachicola Estuary and Associated
Coastal Areas. Final Report, Coastal Plains Regional Commission, Tallahassee, Florida. Livingston, R. J. 1980. The Apalachicola experiment: research and management. Oceanus 23: 14-
21. Livingston, R.J. 1981. Between the Idea and Reality. V.P.I. Publ. Prog. Ser. (Invited paper), 31-
59. Livingston, R. J. 1981a. River-derived input of detritus into the Apalachicola estuary. Pages 320-
332 in R. D. Cross and D. L Williams editors. Proceedings of the national symposium on freshwater inflow to estuaries. Fish and Wildlife Service, Washington, D. C., U. S. A.
Livingston, R. J. 1981b. Man's impact on the distribution and abundance of Sciaenid fishes. Pages
189-196 in Sixth Annual Marine Recreational Fisheries Symposium; Sciaenids: Territorial Demersal Resources. National Marine Fisheries Service. Houston, Texas, U. S. A.
Livingston, R. J. 1982a. Trophic organization in a coastal sea grass system. Marine Ecology
Progress Series 7: 1-12. Livingston, R. J. 1982b. Between the idea and the reality: An essay on the problems involved in
applying scientific data to research management problems. Pages 31-59 in A. Donovan and A. L. Berge, Editors. Working papers in science and technology studies. Virginia Polytechnic Institution, Blacksburg, Virginia, U. S. A.
Livingston, R.J. 1982. Review of the Distribution of Trace Metals in the Apalachicola/Chipola
Drainage System. Final Report. Apalachee Regional Planning Council, Blountstown, Florida.
Livingston, R. J. 1983. Resource atlas of the Apalachicola estuary. Florida Sea Grant College
Publication. Gainesville, Florida, U. S. A. Livingston, R. J. 1983. Compendium of Knowledge Concerning the Flint River System (Georgia).
Final Report, Science Advisory Committee for the Flint River Ecosystem Study, Montezeuma, Georgia.
81

Livingston, R. J. 1983. The Biota of St. George Island. Final Report. Franklin County Board of
County Commissioners, Apalachicola, Florida. Livingston, R. J. 1983. Field and Semi-Field Validation of Laboratory-derived Aquatic Test
Systems. U. S. Environmental Protection Agency, Gulf Breeze, Florida. Livingston, R. J. 1983. Identification and Analysis of Sources of Pollution in the Apalachicola
River and Bay System. Final Report, Florida Department of Natural Resources, Tallahassee, Florida.
Livingston, R. J. 1983. Review and Analysis of the Environmental Implications of the Proposed
Development of the East Point Breakwater and Associated Dredging Operations Within the East Point Channel (Apalachicola Bay System). Final Report. Franklin County Board of County Commissioners, Apalachicola, Florida.
Livingston, R. J. 1984. Long-term Effects of Dredging and Open-water Disposal on the
Apalachicola Bay System. Final Report, National Oceanic and Atmospheric Administration, Washington, D. C.
Livingston, R.J. 1984. The ecology of the Apalachicola Bay system: an estuarine profile. US Fish
and Wildlife Service FWS/PBS 82/05. 148 pp. Livingston, R. J. 1984. Field characterization study of a Gulf coastal seagrass system.
Unpublished report for the U. S Environmental Protection Agency. Livingston, R. J. 1985. Application of scientific research to resource management: case history,
the Apalachicola Bay system. Pages 103-125 in N. L. Chao and W. Kirby-Smith, editors. Proceedings of the International Symposium on Utilization of Coastal Ecosystems: Planning, Pollution, and Productivity. Fundacao Universidad do Rio Grande. Rio Grande, Brazil.
Livingston, R. J. 1986. Ecological processes of recruitment in coastal epibenthic macrobiota.
Proc., IOC/FAO Workshop on recruitment in tropical coastal demersal communities. Report # 44, 151-166.
Livingston, R. J. 1987. Field sampling in estuaries: the relationship of scale to variability.
Estuaries 10: 194-207. Livingston, R. J. 1988. Inadequacy of species-level designations for ecological studies of coastal
migratory fishes. Environmental Biology of Fishes 22: 225-234. Livingston, R. J. 1988. Projected changes in estuarine conditions based on models of long-term
atmospheric alteration. Report CR-814608-01-0, U. S. Environmental Protection Agency, Washington, D. C.
82

Livingston, R. J. 1990. Application of Scientific Data to the Management of the Apalachicola Oyster Resource. Final Report, National Oceanic and Atmospheric Administration through the Florida Department of Environmental Regulation, Washington, D. C. and Tallahassee, Florida.
Livingston, R. J. 1990. Inshore marine habitats. Pages 549-573 in R. L Myers and J. J. Ewel,
editors. Ecosystems of Florida. University of Central Florida Press, Orlando, Florida, USA.
Livingston, R.J. 1991. Medium sized rivers: gulf coastal plain. In: Biodiversity of the
Southeastern U. S. eds: C. T. Hackney et al., 434 pp., Ecological Society of America. Livingston, R. J. 1991. Historical relationships between research and resource management in the
Apalachicola River-estuary. Ecological Applications 1: 361-382. Livingston, R. J. 1991a. The Rivers of Florida. Springer-Verlag, New York, New York, U. S. A. Livingston, R.J. 1991b. Historical Relationships Between Research and Resource Management in
the Apalachicola River-estuary. Ecological Applications 4: 361-382. Livingston, R. J. 1997. Eutrophication in estuaries and coastal systems: relationships of physical
alterations, salinity stratification, and hypoxia. Pages 285-318 in F. J. Vernberg, W. B. Vernberg and T. Siewicki, eds. Sustainable Development in the Southeastern Coastal Zone. University of South Carolina Press, Columbus, South Carolina, U. S. A.
Livingston, R. J. 2000. Eutrophication Processes in Coastal Systems: Origin and Succession of
Plankton Blooms and Effects on Secondary Production. CRC Press, Inc. Boca Raton, Florida. 327 pp.
Livingston, R. J. 2002. Trophic Organization in Coastal Systems. CRC Press, Inc. Boca Raton,
Florida. 388 pp. Livingston, R. J. 2005. Restoration of Aquatic Systems. CRC Press, Inc. Boca Raton, Florida, 424
pp. Livingston, R. J. 2007. Phytoplankton Bloom Effects on a Gulf Estuary: Water Quality Changes
and Biological Response. Ecological Applications 17: 110-128. Livingston, R. J. 2008. Water quality and seagrass survey in the Carrabelle River and St. George
Sound. Unpublished report for the Apalachicola Riverkeepers and City of Carrabelle. Livingston, R. J., G. Kobylinski, F. G. Lewis, and P. Sheridan. 1976. Analysis of long-term
fluctuations of estuarine fish and invertebrate populations in Apalachicola Bay. Fish. Bull. 74(2): 311-321.
83

Livingston, R. J., R. S. Lloyd, and M. S. Zimmerman. 1976. Determination of adequate sample size for collections of benthic macrophytes in polluted and unpolluted coastal areas. Bulletin of Marine Science 26: 569-575.
Livingston, R. J. and E. A. Joyce, Jr. 1977. Proceedings of the conference on the Apalachicola
drainage system, 23-24 April , 1976, Gainesville, Florida. Florida Department of Natural Resources. Florida Marine Research Publications 26. St. Petersburg, Florida, U. S. A.
Livingston, R. J. and O. L Loucks. 1978. Productivity, trophic interactions, and food-web
relationships in wetlands and associated systems. Pages 101-119 in P. E. Greeson, J. R. Clark, and J. E. Clark, editors. Wetland functions and values: the state of our understanding. American Water Resources Association. Lake Buena Vista, Florida, U. S. A.
Livingston, R. J., and J. Duncan. 1979. Short- and long-term effects of forestry operations on
water quality and epibenthic assemblages of a north Florida estuary. Ecological Processes in Coastal and Marine Systems, Ed. R. J. Livingston.
Livingston, R. J. and J. L. Duncan. 1979. Climatological control of a north Florida coastal system
and impact due to upland forestry management. Pages 339-382 in R. J. Livingston editor. Ecological Processes in Coastal and Marine Systems. Plenum Press, New York, New York, U. S. A.
Livingston, R. J., R. L. Iverson, R. H. Estabrook, V. E. Keys, and J. Taylor, Jr. 1974. Major
features of the Apalachicola Bay system: Physiography, biota, and resource management. Florida Scientist 4: 245-271.
Livingston, R. J., G. J. Kobylinski, F. G. Lewis, III, and P. F. Sheridan. 1976. Long-term
fluctuations of epibenthic fish and invertebrate populations in Apalachicola Bay, Florida. Fishery Bulletin 74: 311-321.
Livingston, R. J., P. S. Sheridan, B. G. McLane, F. G. Lewis, III, and G. G. Kobylinski. 1977.
The biota of the Apalachicola bay system: functional relationships. Pages 75-100 in R. J. Livingston, editor. Proceedings of the conference on the Apalachicola drainage system. Florida Department of Natural Resources, Marine Resources Publication 26. St. Petersburg, Florida, U. S. A.
Livingston, R. J., N. P. Thompson, and D. A. Meeter. 1978. Long-term variation of
organochlorine residues and assemblages of epibenthic organisms in a shallow north Florida (USA) estuary. Marine Biology 46: 355-372.
Livingston, R.J., John Cairns, Jr., and K. Dickson, 1978. Eds. Biological Data in Water Pollution
Assessment: Quantitative and Statistical Analyses: American Society for Testing and Materials.
84

Livingston, R. J., K. R. Smith, and W. H. Clements. 1984. Distribution of Macroinvertebrates in the Flint River-Lake Blackshear System. Final Report, Science Advisory Committee for the Flint River Ecosystem Study, Montezeuma, Georgia.
Livingston, R. J., and S. H. Wolfe (1988). Restoration and preservation ranks of water bodies
within the Northwest Florida Water Management District. Report for the Northwest Florida Water Management District.
Livingston, R. J., X. Niu, F. G. Lewis, and G. C. Woodsum. 1997. Freshwater input to a Gulf estuary: Long-term control of trophic organization. Ecol. Appl. 7: 277-299.
Livingston, R. J., Howell, R. L., Niu, X., Lewis, F. G. and Woodsum, G. C. 1999. Recovery of oyster reefs (Crassostrea virginica) in a gulf estuary following disturbance by two hurricanes. Bulletin of Marine Science, Gulf and Caribbean 64, 75-94.
Livingston, R. J., F. Graham Lewis, III, Glenn C. Woodsum, Xufeng Niu, R. L. Howell, IV, G. L. Ray, J. D. Christensen, M. E. Monaco, T. A. Battista, C. J Klein, B. Galperin, and W. Huang. 2000. Coupling of physical and biological models: response of oyster population dynamics to freshwater input in a shallow Gulf estuary. Est. Coast. Shelf Sci.50: 655-672.
Livingston, R. J., S. Leitman, Glenn C. Woodsum, B. Galperin, P Homann, J. D. Christensen, and M. E. Monaco. 2003. Relationships of river flow and productivity of the Apalachicola River-bay system. Final Report, NOS/CCMA Biogeography Program, National Oceanic and Atmospheric Administration.
Mahoney, B. M. S. 1982. Seasonal fluctuations of benthic macrofauna in the Apalachicola
estuary, Florida. The role of predation and larval availability. Ph. D. Dissertation. Florida State University. Tallahassee, Florida, U. S. A.
Mahoney, B. M. S. and R. J. Livingston. 1982. Seasonal fluctuations of benthic macrofauna in the
Apalachicola estuary, Florida, USA. Marine Biology 69: 207-213. McLane, B. G. 1980. An investigation of the infauna of East Bay-Apalachicola Bay. M. S. Thesis.
Florida State University, Tallahassee, Florida, U. S. A. Mattraw, H. C. and J. F. Elder. 1982. Nutrient and detritus transport in the Apalachicola River,
Florida. 1984. U. S. Geological Survey Water-Supply Paper 2196-C. Means, D. B. 1977. Aspects of the significance to terrestrial vertebrates of the Apalachicola River
drainage basin, Florida. Pages 37-67 in R. J. Livingston, editor. Proceedings of the conference on the Apalachicola drainage system. Florida Department of Natural Resources, Marine Resources Publication 26. St. Petersburg, Florida, U. S. A.
Meeter, D. A., and R. J. Livingston. 1978. Statistical methods applied to a four-year multivariate
study of a Florida estuarine system. Invited paper, Biological Data in Water Pollution Assessment: Quantitative and Statistical Analyses. American Society for Testing and
85

Materials. Special technical publication 652. Eds., John Cairns, Jr., K. Dickson, and R. J. Livingston.
Meeter, D.A., R.J. Livingston, and G. Woodsum. 1979. Short and long-term hydrologic cycles of
the Apalachicola drainage system with application to Gulf coastal populations. Pages 315-338 in R. J. Livingston, Editor. Ecological Processes in Coastal and Marine Systems. Plenum Press, New York, New York, U. S. A.
Menge, B. A. 1992. Community regulation: under what conditions are bottom-up factors
important on rocky shores. Ecology 73: 755-765. Menzel, R. W., N. C. Hulings, and R. R. Hathaway. 1966. Oyster abundance in Apalachicola Bay,
Florida in relation to biotic associations influenced by salinity and other factors. Gulf Research Reports 2: 73-96.
Menzel, R. W. and F. E. Nichy. 1958. Studies of the distribution and feeding habits of some
oyster predators in Alligator Harbor, Florida. Bulletin of Marine Science Gulf and Caribbean 8: 125-145.
Mittlebach, G. G. 1988. Competition among refuging surf-fishes and effects of fish density on
littoral zone invertebrates. Ecology 69: 614-623. Mittlebach, G. G., C. W. Osenberg, and M. A. Leibold. 1988. Trophic relations and ontogenetic
niche shifts in aquatic ecosystems. Pages 219-235 in B. Ebenman and L. Persson, editors. Size-structured populations. Springer-Verlag, Berlin, Germany.
Morrison, S. J., J. D. King, R. J. Bobbie, R. E. Bechtold, and D. C. White. 1977. Evidence of
microfloral succession of allochthonous plant litter in Apalachicola Bay, Florida, U. S. A. Marine Biology 41:229-240.
Mortazavi, B., R. L. Iverson, W. M. Landing, and W. Huang, 2000a. Phosphorus budget of
Apalachicola Bay: a river-dominated estuary in the northeastern Gulf of Mexico. Mar. Ecol. Prog. Ser. 198: 33-42.
Mortazavi, B., R. L. Iverson, W. M. Landing, F. G. Lewis, and W. Huang, 2000b. Control of
phytoplankton production and biomass in a river-dominated estuary: Apalachicola Bay, Florida USA. Mar. Ecol. Prog. Ser. 198: 19-31.
Mortazavi, B., R. L. Iverson, and W. Huang, 2000c..Dissolved organic nitrogen and nitrate in
Apalachicola Bay, Florida: spatial distributions and monthly budgets. Mar. Ecol. Prog. Ser. 214: 79-91.
Myers, V. B. 1977. Nutrient limitation of phytoplankton productivity in north Florida coastal
systems: technical considerations; spatial patterns; and wind mixing effects. Ph. D. Dissertation. Florida State University. Tallahassee, Florida, U. S. A.
86
Myers, V. B. and R. J. Iverson. 1977. Aspects of nutrient limitation of phytoplankton productivity in the Apalachicola Bay system. Pages 68-74 in R. J. Livingston, editor. Proceedings of the conference on the Apalachicola drainage system. Florida Department of Natural Resources, Marine Resources Publication 26. St. Petersburg, Florida, U. S. A.
Myers, V. B., and R. J. Iverson. 1981. Phosphorus and nitrogen limited phytoplankton
productivity in Northeastern Gulf of Mexico coastal estuaries. Pages 569-582 in B J. Nielson and L. E. Cronin, editors. Estuaries and Nutrients. Humana Press, Clifton, New Jersey, U.S.A.
Nichols, F. H. 1985. Increased benthic grazing: an alternative explanation for low phytoplankton
biomass in northern San Francisco Bay during the 1976-1977 drought. Estuarine, Coastal and Shelf Science 21: 379-388.
Nixon, S. W. 1980. Between coastal marshes and coastal waters-a review of twenty years of
speculation and research on the role of salt marshes in estuarine productivity and water chemistry. Pages 438-525 in P. Hamilton and K. B. MacDonald, editors. Estuarine and wetland processes, Plenum Press, New York, USA.
Nixon, S. W. 1981. Freshwater inputs and estuarine productivity. Pages 31-57 in Cross, R. D. and
D. L. Williams, editors. Proceedings of the National Symposium on Freshwater Inflow to Estuaries. U. S. Fish and Wildlife Service, Office of Biological Services. FWS/OBS-81/04.
Nixon, S. W. 1988. Physical energy inputs and the comparative ecology of lake and marine
ecosystems. Limnology and Oceanography 33: 1005-1025. Odum, W. E., J. S. White, and J. C. Pickral. 1979. Factors controlling the flux of particulate
organic carbon from estuarine wetlands. Pages 69-82 in R. J. Livingston editor. Ecological Processes in Coastal and Marine Systems. Plenum Press, New York, New York, U. S. A.
Pearce, J. W. 1977. Florida's environmentally endangered land acquisition program and the
Apalachicola River system. Pages 141-145 in R. J. Livingston, editor. Proceedings of the conference on the Apalachicola drainage system. Florida Department of Natural Resources, Marine Resources Publication 26. St. Petersburg, Florida, U. S. A.
Peterson, Bruce J. and Robert W. Howarth. 1987. Sulfur, carbon, and nitrogen isotopes used to
trace organic matter flow in the salt-marsh estuaries of Sapelo Island, Georgia. Limnology and Oceanography 32: 1195-1213.
Peterson, C. H. 1982. The importance of predation and intra- and interspecific competition in the
population biology of two infaunal suspension feeding bivalves, Protothaca staminea and Chione undatella. Ecological Monographs 52: 437-475.
Peterson, C. H. 1992. Competition for food and its community-level implications. Benthos
Research 42: 1-11.
87

Peterson, B. J. and R. W. Howarth. 1987. Sulfur, carbon, and nitrogen isotopes used to trace
organic matter flow in the salt-marsh estuaries of Sapelo Island, Georgia. Limnology and Oceanography 32: 1195-1213.
Power, M. P. 1992. Top-down and bottom-up forces in food webs: do plants have primacy?
Ecology 73: 733-746. Purcell, B. H. 1977. The ecology of the epibenthic fauna associated with Vallisneria americana
beds in a north Florida estuary. M. S. Thesis. Florida State University. Tallahassee, Florida, U. S. A.
Reise, K. 1978. Experiments on epibenthic predation in the Wadden Sea. Helgolander wiss.
Meeresunters 31: 51-101. Santos, S. H., and S. A. Bloom. 1980. Stability in an annually defaunated estuarine soft-bottom
community. Oecologia 46:290-294. Sheridan, P F. 1978. Trophic relationships of dominant fishes in the Apalachicola Bay system
(Florida). Ph. D. Dissertation. Florida State University. Tallahassee, Florida, U. S. A. Sheridan, P. F. 1979. Trophic resource utilization by three species of sciaenid fishes in a
northwest Florida estuary. Northeast Gulf Science 3: 1-15. Sheridan, P. F. and R. J. Livingston. 1979. Cyclic trophic relationships of fishes in an unpolluted,
river-dominated estuary in North Florida. Pages 143-161 in R. J. Livingston editor. Ecological Processes in Coastal and Marine Systems. Plenum Press, New York, New York, U. S. A.
Schroeder, W. W. 1978. Riverine influence on estuaries: a case study. Pages 347-364 in V. S.
Kennedy, editor. Estuarine interactions. Academic Press, New York, New York, USA. Sheridan, P. F. 1978. Trophic relationships of dominant fishes in the Apalachicola Bay system
(Florida). Dissertation. Florida State University. Tallahassee, Florida, USA. Sheridan, P. F. 1979. Trophic resource utilization by three species of sciaenid fishes in a
northwest Florida estuary. Northeast Gulf Science 3: 1-15. Sheridan, P. F. and R. J. Livingston. 1983. Abundance and seasonality of infauna and epifauna
inhabiting a Halodule wrightii meadow in Apalachicola Bay, Florida. Estuaries 6: 407-419.
Smith D. E., M. Laffler, and G. Mackiernan. 1992. Oxygen dynamics in the Chesapeake Bay.
Maryland Sea Grant College, College Park, Maryland, USA.
88
Snedaker, S., D. de Sylva, and D. Cottrell. 1977. A review of the role of freshwater in estuarine ecosystems. Final Report, Southwest Florida Water Management District, Brooksville, Florida, USA.
Stoner, A. W. 1976. Growth and food conversion efficiency of pin-fish (Lagodon rhomboides)
exposed to sublethal concentrations of bleached kraft mill effluents). M.S. Thesis, Florida State University. Tallahassee, Florida.
Stoner, A. W. 1982. The influence of benthic macrophytes on the foraging behavior of pinfish
Lagodon rhomboides (Linnaeus). J. Exper. Mar. Biol. Ecol. 58: 271-284. Stoner, A. W. and R. J. Livingston. 1980. Distributional ecology and food habits of the banded
blenny Paraclinus fasciatus (Clinidae): a resident in a mobile habitat. Mar. Biol. 56: 239-246.
Stoner, A. W. and R. J. Livingston. 1984. Ontogenetic patterns in diet and feeding morphology in
sympatric sparid fishes from seagrass meadows. Copeia (1984): 174-187. Surratt, D., J. Cherrier, L. Robinson and J. Cable. 2008. Chronology of sediment nutrient
geochemistry in Apalachicola Bay, Florida (U. S. A). J. Coastal Res. 24 (3): 660-671. Swift, F. 1896. Report of a survey of the oyster region of St. Vincent Sound, Apalachicola Bay,
and St. George Sound, Florida. U.S. Commission of Fish and Fisheries. Report of the U.S. Commission for 1896. Appendix 4, pp. 187-221.
Toner, William. 1975. Oysters and the good 'ol boys. Planning 41: 10-15. Trush, W. J., S. M. McBain, and L. B. Leopol d. 2000. Attributes of an alluvial river and their
relation to water policy and management. PNAS 97: 11858-11863. Westman, W. E. 1978. Measuring the inertia and resilience of ecosystems. Bioscience 28:705-710. U. S. Army Corps of Engineers, 2008. Modification the current Interim Operations Plan (IOP) at
Jim Woodruff Dam. Welch, B. L., R. B. Whitlatch, and W. F. Bohlen. 1982. Relationship between physical
characteristics and organic carbon sources as a basis for comparing estuaries in southern New England. Pages 53-67 in V. S. Kennedy, editor. Estuarine comparisons. Academic Press, New York, New York, USA.
White, D. C. 1983. Analysis of microorganisms in terms of quantity and activity in natural
environments. Microbes in their natural environments. Society for General Microbiology Symposium 34: 37-66.
89

White, D. C., R. J. Bobbie, S. J. Morrison, D.K. Oesterhof, C. W. Taylor, and D. A. Meeter. 1977. Determination of microbial activity of lipid biosynthesis. Limnology and Oceanography 22: 1089-1099.
White, D. C., R. J. Livingston, R. J. Bobbie, and J. S. Nickels. 1979a. Effects of surface
composition, water column chemistry, and time of exposure on the composition of the detrital microflora and associated macrofauna in Apalachicola Bay, Florida. Pages 83-116 in R. J. Livingston, Editor. Ecological Processes in Coastal and Marine Systems. Plenum Press, New York, New York, U. S. A.
White, D. C., W. M. Davis, J. S. Nickels, J. D. King, and R. J. Bobbie. 1979b. Determination of
the sedimentary microbial biomass by extractable lipid phosphate. Oecologia 40: 51-62. Whitfield, W. K., Jr., and D. S. Beaumariage. 1977. Shellfish management in Apalachicola Bay:
Past, present, and future. Proceedings of the Conference on the Apalachicola Drainage System. Eds. R. J. Livingston and E. A. Joyce, Jr. Florida Department of Natural Resources Mar. Res. Publ. 26: 130-140.
Wilber, D. H. 1992. Associations between freshwater inflows and oyster productivity in
Apalachicola Bay, Florida. Est. Coastal Shelf Sci. 35: 179-190. Yerger, R. W. 1977. Fishes of the Apalachicola River. Pages 22-33 in R. J. Livingston, editor.
Proceedings of the conference on the Apalachicola drainage system. Florida Department of Natural Resources, Marine Resources Publication 26. St. Petersburg, Florida, U. S. A.
Ziewitz, J. 2003. Summary of relationships between flow regime and species protected under the
Endangered Species Act on the Apalachicola River. U. S Fish and Wildlife Service, unpublished report.
Zimmerman, G. F. 2006. Declaration, U. S. District Court, Northern District of Alabama.
90

List of Tables Table 1: Averages of physico-chemical and biological variables sampled during the 9.5–year
survey of East Bay taken monthly from 2/1997-7/1984.
Table 2: Generic codes for the trophic ontogenetic units.
Table 3: Apalachicola River flow rates below 5000 cfs over the period from 1995-2003.
91

List of Figures Figure 1: Model of the Apalachicola Bay system showing key features that result in extremely
high primary and secondary productivity. Figure 2: Model of the Apalachicola Bay system showing potential impacts of reduced river flow
leading to plankton blooms and reduced secondary productivity. Figure 3: Model of the Apalachicola Bay system showing potential impacts of reduced river
flow to the bay leading to seriously reduced secondary productivity. Figure 4: The Apalachicola-Chattahoochee-Flint (ACF or Tri-River) drainage basin. Figure 5: Human population distribution in North Florida. This figure is a composite of
information provided by the National Oceanic and Atmospheric Administration, the Florida Department of Environmental Protection, and the ESRI Corporation.
Figure 6: The Apalachicola Bay system showing location of long-term sampling stations.
Figure 7: Model of the interaction between the Apalachicola River and Bay with respect to the
riverine contributions to bay primary and secondary productivity. Figure 8: Monthly averages of Apalachicola River flow from October 1951 through September
2003. Data were provided by the U. S. Geological Survey (Sumatra, Florida gage). Figure 9a: Seagrass and wetland habitats of the Apalachicola Drainage System.
Figure 9b: Distribution of submerged aquatic vegetation (density) in near-shore areas of St.
George Sound during 2006-2007. Water quality stations (Livingston, 2006a) are shown along with upland wetlands systems.
Figure 9c: Station distribution in East Bay for the long term trophic analyses involving infaunal
and epifaunal macroinvertebrates and fish. Figure 9d: Leaf matter taken in otter trawls in East Bay taken monthly from January 1975-
February 1981. Figure 9e: Microdetritus taken in water samples in the lower Apalachicola River monthly from
August 1975-March 1982.
Figure 9f: Chart showing stations used in East Bay and St. George Sound for the comparative analysis of the river-dominated upper bay (stations 3 and 5a) and the high salinity sound area (station ML).
92
93
Figure 9g: Three-dimensional view of numbers of individuals, species richness, and top dominant numbers of infaunal macroinvertebrates taken from 100 core samples at stations 3, 5a and ML.
Figure 10: Ontogenetic feeding units of blue crabs (day vs. night collections).
Figure 11: Apalachicola River flows, monthly, from February 1975 through June 1984. Data were
provided by the U. S. Geological Survey (Sumatra, Florida gage). Figure 12: Water quality indices (Secchi depths, watercolor, salinity) taken monthly from
February through June 1984. Also shown are the 3-month moving averages of the data. Figure 13: Fish, infaunal and invertebrate (FII) trophic levels (herbivores, omnivores, C1
carnivores, C2 carnivores) taken monthly from February through June 1984. Also shown are the 12-month moving averages of the data.
Figure 14: Fish, infauna, invertebrate (FII) trophic data taken monthly from 2/75-8/84 in East
Bay. Data represent % of total biomass for each category (herbivores, omnivores, C1, C2, C3 carnivores).
Figure 15: Location of oyster bars in the Apalachicola Bay system oyster study.
Figure 16: Distribution of oyster larvae, spatfall, density, new growth, and % mortality in the
Apalachicola Bay system. Figure 17: Map of projected oyster mortality in the Apalachicola Bay system based on the
statistical model for mortality in 1985 and the hydrodynamic model results for (A) 1985. (B) 1986. (C) 1991. Circles indicate observed mortality values from oyster predation experiments (1985, May-August average).
Figure 18: Map showing major elements of the Apalachicola Management Plan.