Embed Size (px)
Citation preview

U.S. Department of the InteriorU.S. Geological Survey
Nitrogen Loads and Ground-Water Residence Times in an Agricultural Basin in North-Central Connecticut
Nitrogen Loads and GroundNitrogen Loads and Ground--Water Water Residence Times in an Agricultural Basin Residence Times in an Agricultural Basin in Northin North--Central ConnecticutCentral ConnecticutJohn R. MullaneyU.S. Geological Survey, Connecticut Water Science Center, East Hartford, Connecticut [email protected]
In Cooperation with the Connecticut Department of Environmental Protection
John R. MullaneyU.S. Geological Survey, Connecticut Water Science Center, East Hartford, Connecticut [email protected]
In Cooperation with the Connecticut Department of Environmental Protection

The Base Flow Component of Streamflow
Basins (red) with base flow index of 50% or greater
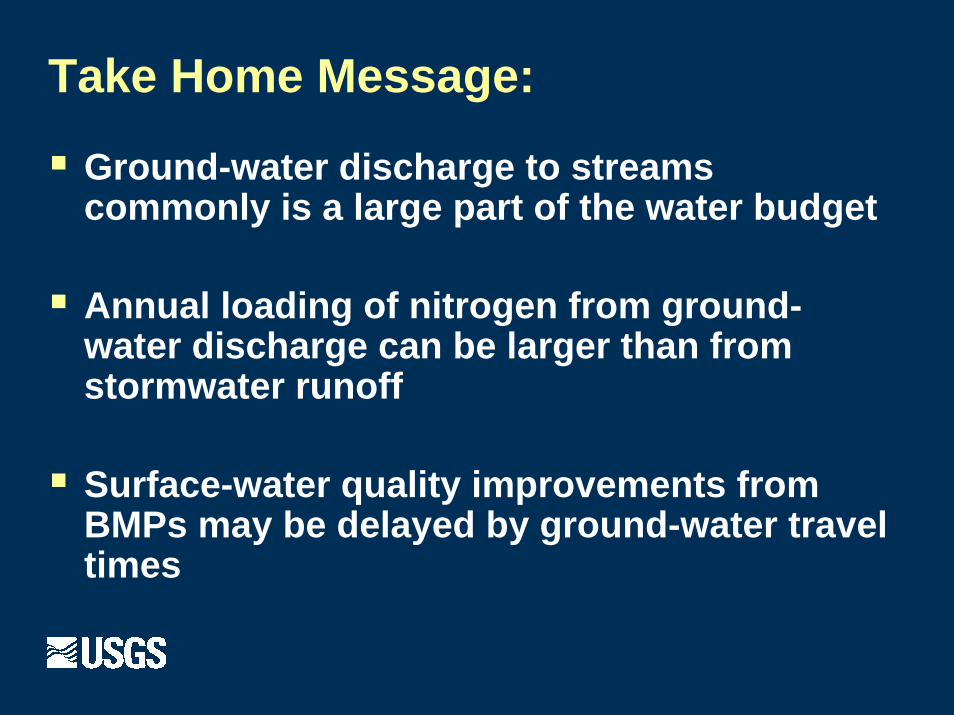
Take Home Message:
Ground-water discharge to streams commonly is a large part of the water budget
Annual loading of nitrogen from ground-water discharge can be larger than from stormwater runoff
Surface-water quality improvements from BMPs may be delayed by ground-water travel times

Framework and Purpose
Long Island Sound Watershed in Connecticut
TMDL for nitrogen 58.5% reduction by 2014
10 percent reduction in nonpoint source required

Framework and Purpose (Cont.)
To gain understanding of the contribution of nitrogen from ground-water discharge
Provide information on the effect of ground-water travel time on surface-water quality
Explore scenarios to determine the most effective way to implement BMPs
Largest load and shortest ground-water travel time

Broad Brook Basin on the Connecticut List of Impaired Waters
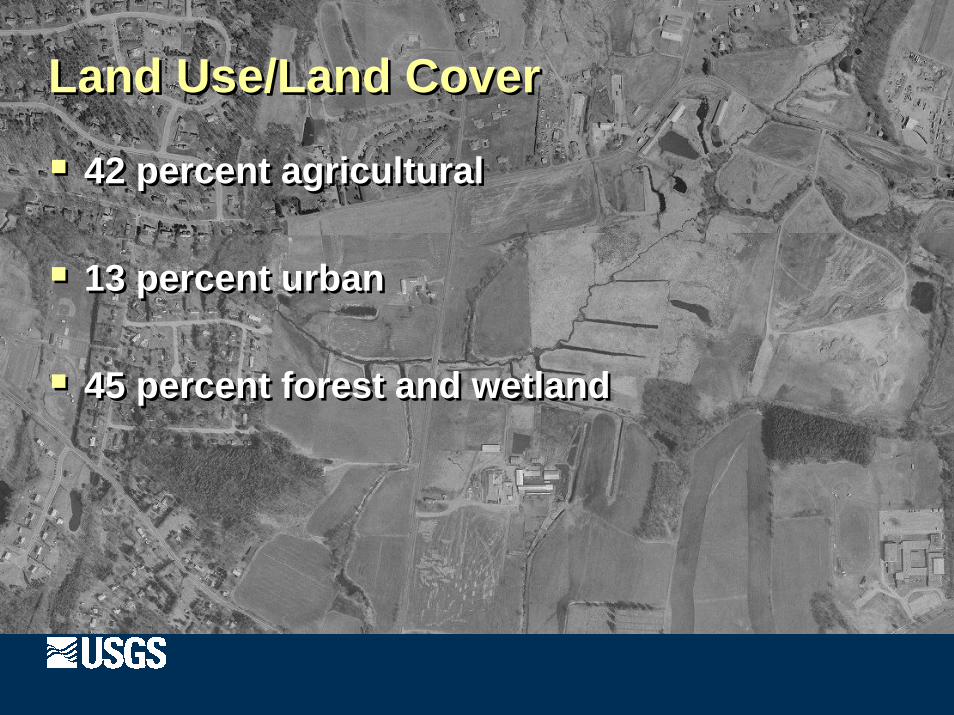
Land Use/Land CoverLand Use/Land Cover
42 percent agricultural
13 percent urban
45 percent forest and wetland
42 percent agricultural
13 percent urban
45 percent forest and wetland

DevelopedTurf & GrassOther Grasses & AgricultureDeciduous ForestConiferous ForestWaterNon-forested WetlandForested WetlandBarren LandUtility ROW
Land Use/Land CoverLand Use/Land Cover
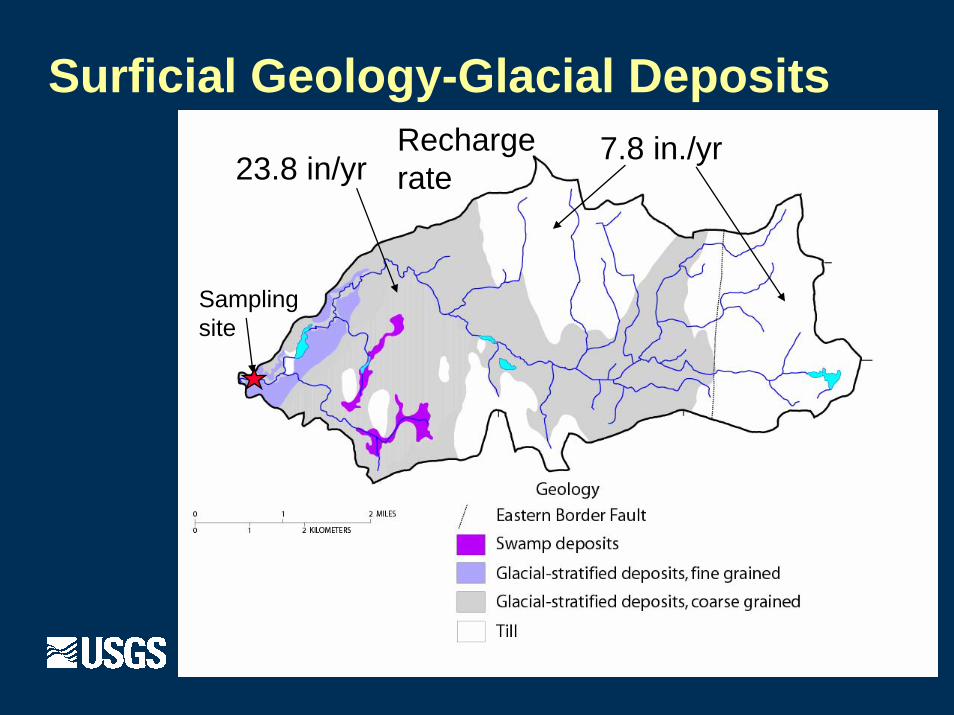
Surficial Geology-Glacial Deposits7.8 in./yr23.8 in/yr
Recharge rate
Sampling site

Data Collection
Samples collected from 1993-1995, 1996-present
Frequency has varied from 8 to >12 samples per year
Samples currently analyzed for nutrients, major ions, trace elements, bacteria

Sampling on Flow-Duration Curve

Nutrient Data in Surface Waterin mg/LConstituent Min. Median Max Rec.
NutrientCriteria
Total N 2.8 4.2 6.3 0.7
NO3-N 1.3 3.7 5.8
TK-N 0.14 0.43 4.2
Total P 0.02 0.08 0.63 0.031
Dissolved P 0.019 0.05 0.49

Load Estimation
“ESTIMATOR” Developed by Cohn and others for USGS
Log-linear regression equation for load estimationRelates load to flow, trends with time, and seasonal fluctuations
εβββββββ
+++++++=
ΠΠ )2cos()2sin()()()()()(
652
43
2210
TTTTQlnQlnCXQln
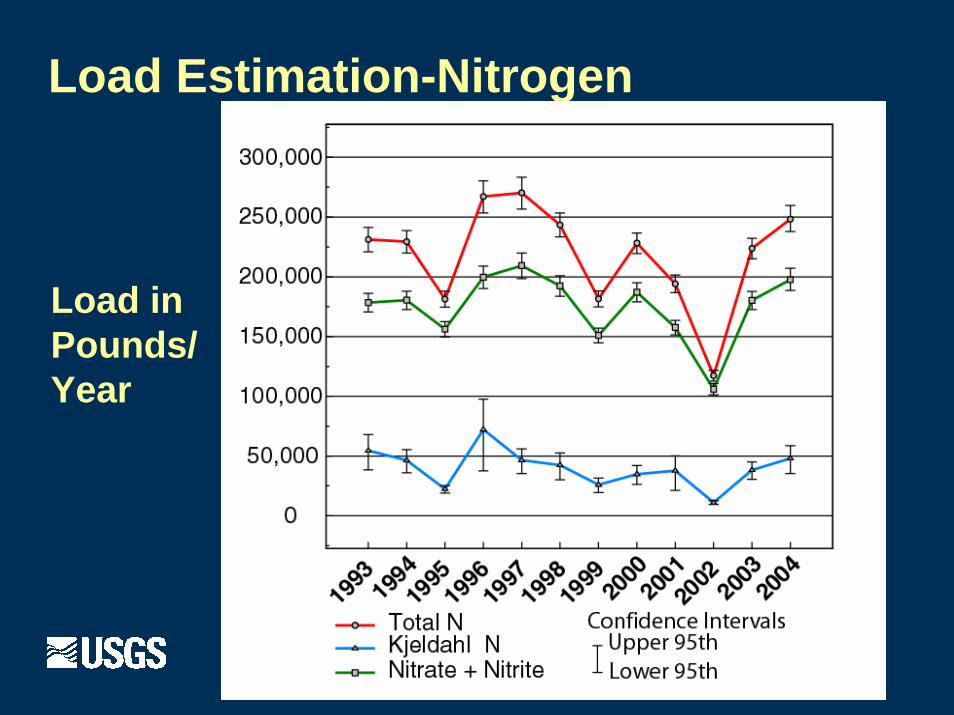
Load Estimation-Nitrogen
Load in Pounds/Year

Load Estimation-Phosphorus
Load in Pounds/Year

Base-flow Separation- GW Discharge

Base-Flow Separation (GW Discharge Averaged 80% of Flow 1993-2004)
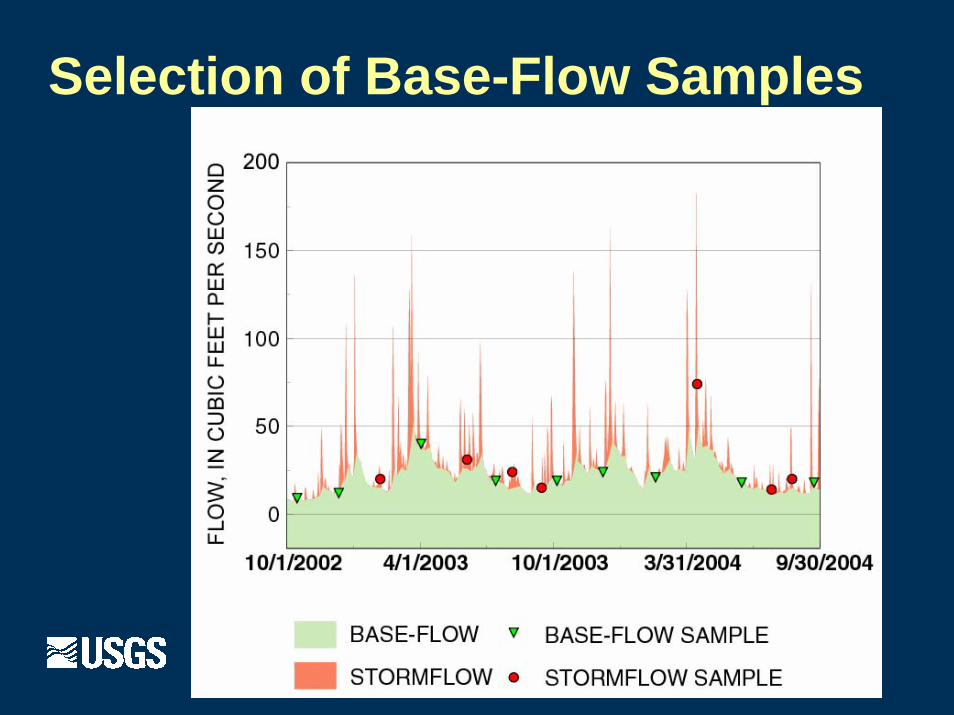
Selection of Base-Flow Samples

Load Estimation- Nitrate in Base Flow

Nitrate Load in Base Flow (Averaged 71 % of N Load 1993-2004)

Load Estimation- Dissolved P in Base Flow
Load in Pounds/Year

Wells/Well ClustersNutrients, Age Dating, Dissolved Gases
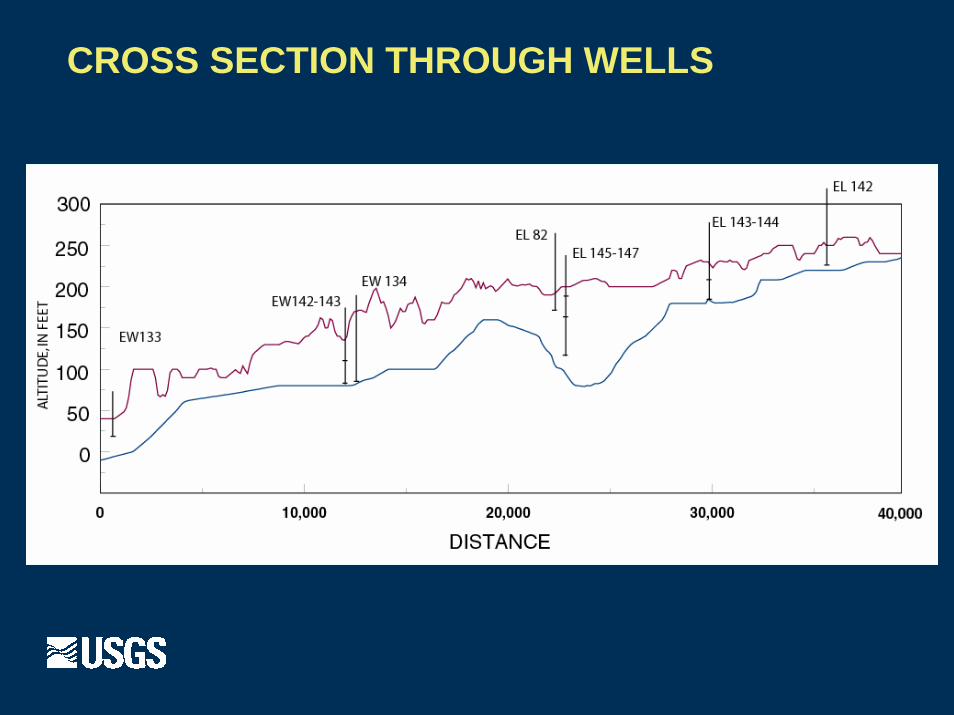
CROSS SECTION THROUGH WELLS

Nutrients in Ground-Water Samples
Constituent RangeMg/L
NO2-NO3 N <0.06 – 9.7
DK-N <0.10
Dissolved P <0.004 – 0.1

Ground-Water Age Dating, Dissolved Gases
Done using 3H, 3H-3He, SF6
Apparent ages ranged from 2.4 to >50 years
Dissolved gas analysis indicated denitrification generally not occurring

MODFLOW Ground-Water ModelingMODPATH Particle Tracking

Simulated Particle Tracks

Simulated Ground-Water Travel Time
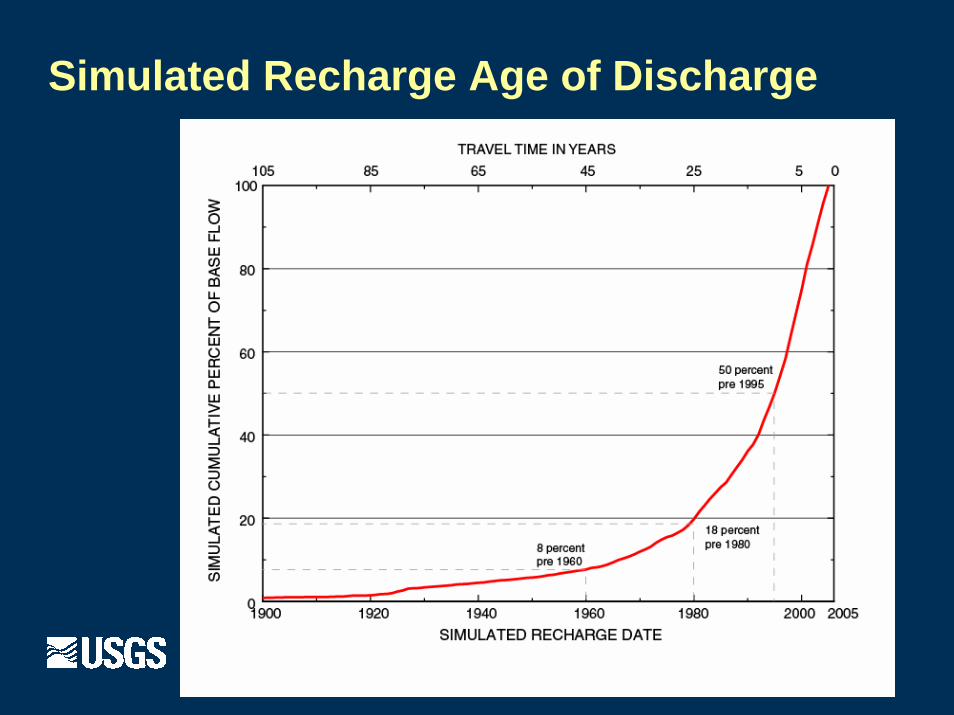
Simulated Recharge Age of Discharge
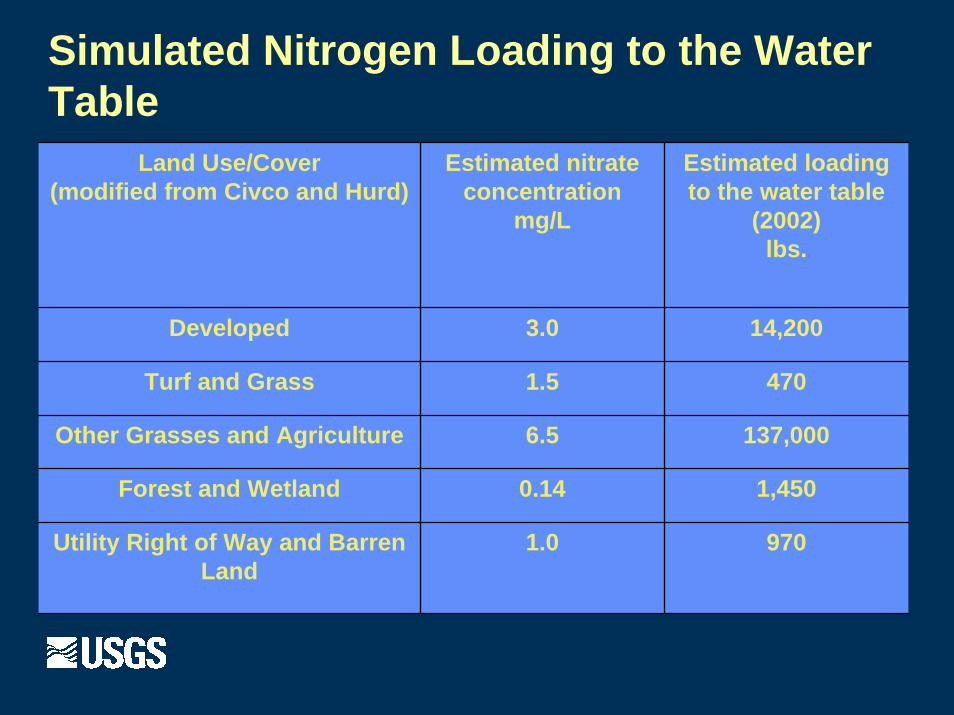
Simulated Nitrogen Loading to the Water Table
Land Use/Cover(modified from Civco and Hurd)
Estimated nitrate concentration
mg/L
Estimated loading to the water table
(2002)lbs.
Developed 3.0 14,200
Turf and Grass 1.5 470
Other Grasses and Agriculture 6.5 137,000
Forest and Wetland 0.14 1,450
Utility Right of Way and Barren Land
1.0 970

Future Scenarios AnalysisNitrateinBase Flow
Conclusions
Nitrogen load is dominated by ground-water discharge during base flow
Base-flow load of nitrogen is dominated by agricultural land use on glacial stratified deposits
It is important to differentiate the recharge rates to different aquifers in the basin

Conclusions (Cont.)Ground-water travel times can be greater than 50 years
Under realistic scenarios for reduction– for a 50-percent reduction in nitrate load to the water table from agricultural and urban land:
A 25% reduction in base-flow nitrogen load will occur in 10 yearsA 45% reduction will occur in 40 years
BMPs can be targeted to land uses with shortest travel time and largest nitrate loads
For more info contact: [email protected]