Embed Size (px)
Citation preview
Atmos Chem Phys 19 14365ndash14385 2019httpsdoiorg105194acp-19-14365-2019copy Author(s) 2019 This work is distributed underthe Creative Commons Attribution 40 License
Importance of dry deposition parameterization choice in globalsimulations of surface ozoneAnthony Y H Wong1 Jeffrey A Geddes1 Amos P K Tai23 and Sam J Silva4
1Department of Earth and Environment Boston University Boston MA USA2Earth System Science Programme Faculty of Science The Chinese University of Hong Kong Hong Kong China3Institute of Energy Environment and Sustainability and State Key Laboratory of Agrobiotechnology The ChineseUniversity of Hong Kong Hong Kong China4Department of Civil and Environmental Engineering Massachusetts Institute of Technology Cambridge MA USA
Correspondence Jeffrey A Geddes (jgeddesbuedu)
Received 5 May 2019 ndash Discussion started 11 June 2019Revised 15 October 2019 ndash Accepted 16 October 2019 ndash Published 28 November 2019
Abstract Dry deposition is a major sink of troposphericozone Increasing evidence has shown that ozone dry depo-sition actively links meteorology and hydrology with ozoneair quality However there is little systematic investigation onthe performance of different ozone dry deposition parameter-izations at the global scale and how parameterization choicecan impact surface ozone simulations Here we present theresults of the first global multidecadal modelling and eval-uation of ozone dry deposition velocity (vd) using multipleozone dry deposition parameterizations We model ozone drydeposition velocities over 1982ndash2011 using four ozone drydeposition parameterizations that are representative of cur-rent approaches in global ozone dry deposition modellingWe use consistent assimilated meteorology land cover andsatellite-derived leaf area index (LAI) across all four suchthat the differences in simulated vd are entirely due to differ-ences in deposition model structures or assumptions abouthow land types are treated in each In addition we use thesurface ozone sensitivity to vd predicted by a chemical trans-port model to estimate the impact of mean and variabilityof ozone dry deposition velocity on surface ozone Our es-timated vd values from four different parameterizations areevaluated against field observations and while performancevaries considerably by land cover types our results suggestthat none of the parameterizations are universally better thanthe others Discrepancy in simulated mean vd among the pa-rameterizations is estimated to cause 2 to 5 ppbv of discrep-ancy in surface ozone in the Northern Hemisphere (NH) andup to 8 ppbv in tropical rainforests in July and up to 8 ppbv in
tropical rainforests and seasonally dry tropical forests in In-dochina in December Parameterization-specific biases basedon individual land cover type and hydroclimate are found tobe the two main drivers of such discrepancies We find sta-tistically significant trends in the multiannual time series ofsimulated July daytime vd in all parameterizations driven bywarming and drying (southern Amazonia southern Africansavannah and Mongolia) or greening (high latitudes) Thetrend in July daytime vd is estimated to be 1 yrminus1 and leadsto up to 3 ppbv of surface ozone changes over 1982ndash2011The interannual coefficient of variation (CV) of July daytimemean vd in NH is found to be 5 ndash15 with spatial distri-bution that varies with the dry deposition parameterizationOur sensitivity simulations suggest this can contribute be-tween 05 to 2 ppbv to interannual variability (IAV) in surfaceozone but all models tend to underestimate interannual CVwhen compared to long-term ozone flux observations Wealso find that IAV in some dry deposition parameterizationsis more sensitive to LAI while in others it is more sensitive toclimate Comparisons with other published estimates of theIAV of background ozone confirm that ozone dry depositioncan be an important part of natural surface ozone variabilityOur results demonstrate the importance of ozone dry depo-sition parameterization choice on surface ozone modellingand the impact of IAV of vd on surface ozone thus mak-ing a strong case for further measurement evaluation andmodelndashdata integration of ozone dry deposition on differentspatiotemporal scales
Published by Copernicus Publications on behalf of the European Geosciences Union
14366 A Y H Wong et al Ozone dry deposition parameterization choice
1 Introduction
Surface ozone (O3) is one of the major air pollutants thatposes serious threats to human health (Jerrett et al 2009) andplant productivity (Ainsworth et al 2012 Reich 1987 Wit-tig et al 2007) Ozone exerts additional pressure on globalfood security and public health by damaging agriculturalecosystems and reducing crop yields (Avnery et al 2011McGrath et al 2015 Tai et al 2014) Dry deposition bywhich atmospheric constituents are removed from the atmo-sphere and transferred to the Earthrsquos surface through turbu-lent transport or gravitational settling is the second-largestand terminal sink of tropospheric O3 (Wild 2007) Terrestrialecosystems are particularly efficient at removing O3 via drydeposition through stomatal uptake and other non-stomatalpathways (Wesely and Hicks 2000) (eg cuticle soil re-action with biogenic volatile organic compounds (BVOCs)Fares et al 2010 Wolfe et al 2011) Meanwhile stomataluptake of O3 inflicts damage on plants by initiating reactionsthat impair their photosynthetic and stomatal regulatory ca-pacity (Hoshika et al 2014 Lombardozzi et al 2012 Reich1987) Widespread plant damage has the potential to alter theglobal water cycle (Lombardozzi et al 2015) and suppressthe land carbon sink (Sitch et al 2007) as well as generatea cascade of feedbacks that affect atmospheric compositionincluding ozone itself (Sadiq et al 2017 Zhou et al 2018)Ozone dry deposition is therefore key in understanding howmeteorology (Kavassalis and Murphy 2017) climate andland cover change (Fu and Tai 2015 Ganzeveld et al 2010Geddes et al 2016 Heald and Geddes 2016 Sadiq et al2017 Sanderson et al 2007 Young et al 2013) can affectair quality and atmospheric chemistry at large
Analogous to other surfacendashatmosphere exchange pro-cesses (eg sensible and latent heat flux) O3 dry depositionflux (FO3 ) is often expressed as the product of ambient O3concentrations at the surface ([O3]) and a transfer coefficient(dry deposition velocity vd) that describes the efficiency oftransport (and removal) to the surface from the measurementheight
FO3 =minus [O3]vd (1)
Also analogous to other surface fluxes FO3 [O3] and hencevd can be directly measured by the eddy covariance (EC)method (eg Fares et al 2014 Gerosa et al 2005 Lamaudet al 2002 Munger et al 1996 Rannik et al 2012) withrandom uncertainty of about 20 (Keronen et al 2003Muller et al 2010) Apart from EC FO3 and vd can alsobe estimated from the vertical profile of O3 by exploitingfluxndashgradient relationship (Foken 2006) (termed the gradi-ent method GM) (eg Gerosa et al 2017 Wu et al 20152016) A recent study (Silva and Heald 2018) complied 75sets of ozone deposition measurement from the EC and GMacross different seasons and land cover types over the past30 years
At the site level ozone dry deposition over various ter-restrial ecosystems can be simulated comprehensively by 1-D chemical transport models (Ashworth et al 2015 Wolfeet al 2011 Zhou et al 2017) which are able to simulatethe effects of vertical gradients inside the canopy environ-ment and gas-phase reaction with BVOCs in addition tosurface sinks Regional and global models which lack thefine-scale information (eg vertical structure of canopy in-canopy BVOC emissions) and horizontal resolution for re-solving the plant canopy in such detail instead representplant canopy foliage as one to two big leaves and vd is pa-rameterized as a network of resistance which accounts forthe effects of turbulent mixing via aerodynamic (Ra) molec-ular diffusion via quasi-laminar sublayer resistance (Rb) andsurface sinks via surface resistance (Rc)
vd =1
Ra +Rb+Rc (2)
A diverse set of parameterizations of ozone dry deposi-tion is available and used in different models and monitor-ing networks Examples include the Wesely parameterization(1989) and modified versions of it (eg Wang et al 1998)the Zhang et al (2003) parameterization (Zhang et al 2003)the Deposition of O3 for Stomatal Exchange model (Ember-son et al 2000 Simpson et al 2012) and the Clean Air Sta-tus and Trends Network (CASTNET) deposition estimates(Meyers et al 1998) The calculation of Ra (mostly basedon MoninndashObukhov similarity theory) and Rb across theseparameterizations often follow a standard formulation frommicrometeorology (Foken 2006 Wesely and Hicks 19772000 Wu et al 2011) and thus does not vary significantlyThe main difference between the ozone dry deposition pa-rameterizations lies on the surface resistance Rc This resis-tance includes stomatal resistance (Rs) which can be com-puted by a Jarvis-type multiplicative algorithm (Jarvis 1976)where Rs is the product of its minimum value and a seriesof response functions to individual environmental conditionsSuch conditions typically include air temperature (T ) pho-tosynthetically available radiation (PAR) vapour pressuredeficit (VPD) and soil moisture (θ ) with varying complexityand functional forms
Such formalism is empirical in nature and does not ade-quately represent the underlying ecophysiological processesaffecting Rs (eg temperature acclimation) An advancementof these efforts includes harmonizing Rs with that computedby land surface models (Ran et al 2017a Val Martin etal 2014) which calculate Rs by coupled photosynthesisndashstomatal conductance (Anndashgs) models (Ball et al 1987 Col-latz et al 1991 1992) Such coupling should theoreticallygive a more realistic account of ecophysiological controls onRs Indeed it has been shown that the above approach maybetter simulate vd than the multiplicative algorithms that onlyconsider the effects of T and PAR (Val Martin et al 2014Wu et al 2011)
Atmos Chem Phys 19 14365ndash14385 2019 wwwatmos-chem-physnet19143652019
A Y H Wong et al Ozone dry deposition parameterization choice 14367
The non-stomatal part of Rc often consists of cuticular(Rcut) ground (Rg) and other miscellaneous types of resis-tance (eg lower canopy resistance (Rlc) in Wesely 1989)Due to very limited measurements and mechanistic under-standing towards non-stomatal deposition non-stomatal re-sistance is often constant (eg Rg) or simply scaled with leafarea index (LAI) (eg Rcut) (Simpson et al 2012 Wang etal 1998 Wesely 1989) while some of the parameteriza-tions (Zhang et al 2003 Zhou et al 2017) incorporate theobservation of enhanced cuticular O3 uptake under leaf sur-face wetness (Altimir et al 2006 Potier et al 2015 2017Sun et al 2016)
Furthermore terrestrial atmospherendashbiosphere exchangeis also directly affected by CO2 as CO2 can drive increasesin LAI (Zhu et al 2016) while inhibiting gs (Ainsworth andRogers 2007) These can have important implications on vdas shown by Sanderson et al (2007) where doubling cur-rent CO2 level reduces gs by 05ndash20 mm sminus1 and by Wuet al (2012) where vd increases substantially due to CO2fertilization at 2100 Observations from the Free Air CO2Enrichment (FACE) experiments also confirm CO2 fertiliza-tion and inhibition of gs effects but the impacts are variableand species specific such that extrapolation of these effectsto global forest cover is cautioned (Norby and Zak 2011)
Various efforts have been made to evaluate and assess theuncertainty in modelling ozone dry deposition using fieldmeasurements Hardacre et al (2015) evaluate the perfor-mance of simulated monthly mean vd and FO3 by 15 chemi-cal transport models (CTMs) from the Task Force on Hemi-spheric Transport of Air Pollutant (TF HTAP) against sevenlong-term site measurements 15 short-term site measure-ments and modelled vd from 96 CASTNET sites This worksuggests that the difference in land cover classification is themain source of discrepancy between models In this casemost of the models in TF HTAP use the same class of dry de-position parameterization (Wang et al 1998 Wesely 1989)so a global evaluation of different deposition parameteriza-tions was not possible Also the focus in this intercompari-son study was on seasonal but not other (eg diurnal dailyinterannual) timescales Using an extended set of measure-ments Silva and Heald (2018) evaluate the vd output fromthe Wang et al (1998) parameterization used by the GEOS-Chem chemical transport model They show that diurnal andseasonal cycles are generally well captured while the dailyvariability is not well simulated They find that differences inland type and LAI rather than meteorology are the main rea-son behind modelndashobservation discrepancy at the seasonalscale and eliminating this model bias results in up to 15 change in surface O3 This study is also limited to a singleparameterization Using parameterizations that are explicitlysensitive to other environmental variables (eg Simpson etal 2012 Zhang et al 2003) could conceivably lead to dif-ferent conclusions
Other efforts have been made to compare the perfor-mance of different parameterizations Centoni (2017) find
that two different dry deposition parameterizations We-sely (1989) versus Zhang et al (2003) implemented in thesame chemistryndashaerosol model (United Kingdom ChemistryAerosol UKCA model) result in up to a 20 differencein simulated surface O3 concentration This study demon-strates that uncertainty in vd can have a large potential ef-fect on surface O3 simulation Wu et al (2018) compare vdsimulated by five North American dry deposition parame-terizations to a long-term observational record at a singlemixed forest in southern Canada and find a large spread be-tween the simulated vd with no single parameterization uni-formly outperforming others They further acknowledge thatas each parameterization is developed with its own set of lim-ited observations it is natural that their performance can varyconsiderably under different environments and advocate foran ldquoensemblerdquo approach to dry deposition modelling Thishighlights the importance of parameterization choice as akey source of uncertainty in modelling ozone dry depositionMeanwhile in another evaluation at a single site Cliftonet al (2017) show that the GEOS-Chem parameterizationlargely underestimates the interannual variability (IAV) ofvd in Harvard Forest based on the measurement from 1990to 2000 although they do not show how the IAV of vd maycontribute to the IAV of O3
These developments have made a substantial contributionto our understanding of the importance of O3 dry depositionin atmospheric chemistry models Still pertinent questionsremain about the impact of a dry deposition model on simu-lations of the global distribution of ozone and its long-termvariability Here we build on previous works by posing andanswering the following questions
1 How does the global distribution of mean vd vary withdifferent dry deposition parameterizations and whatdrives the discrepancies among them How much mightthe choice of deposition parameterization affect spatialdistribution of surface ozone concentration simulated bya chemical transport model
2 How are the IAV and long-term trends of vd differentacross deposition parameterizations and what drives thediscrepancies among them Do they potentially con-tribute different predictions of the long-term temporalvariability in surface ozone
The answers to such question could have important conse-quences on our ability to predict long-term changes in at-mospheric O3 concentrations as a function of changing cli-mate and land cover characteristics In general there is ahigh computational cost to thorough and large-scale evalu-ations of different dry deposition parameterizations embed-ded in CTMs In this study we explore these questions usinga strategy that combines an offline dry deposition modellingframework incorporating long-term assimilated meteorologi-cal and land surface remote sensing data in combination witha set of CTM sensitivity simulations
wwwatmos-chem-physnet19143652019 Atmos Chem Phys 19 14365ndash14385 2019
14368 A Y H Wong et al Ozone dry deposition parameterization choice
2 Method
21 Dry deposition parameterization
Here we consider several ldquobig-leafrdquo models commonly usedby global chemical transport models More complex multi-layer models require the vertical profiles of leaf area densityfor different biomes which are generally not available for re-gional and global models From the wide range of literatureon dry deposition studies we observe that Rs is commonlymodelled through one of the following approaches
1 a multiplicative algorithm that considers the effects ofLAI temperature and radiation (Wang et al 1998)
2 a multiplicative algorithm that considers the effects ofLAI temperature radiation and water stress (eg Mey-ers et al 1998 Pleim and Ran 2011 Simpson et al2012 Zhang et al 2003) or
3 a coupled Anndashgs model which exploits the strong em-pirical relationship between photosynthesis (An) andstomatal conductance (gs) (eg Ball et al 1987 Lin etal 2015) and simulates An and gs = 1Rs simultane-ously (eg Ran et al 2017b Val Martin et al 2014)
Similarly their functional dependence of non-stomatal sur-face resistance can be classified into two classes
1 mainly scaling with LAI with in-canopy aerodynamicsparameterized as function of friction velocity (ulowast) or ra-diation (Meyers et al 1998 Simpson et al 2012 Wanget al 1998) and
2 additional dependence of cuticular resistance on relativehumidity (Pleim and Ran 2011 Zhang et al 2003)
With these considerations we identify four common param-eterizations that are representative of the types of approachesdescribed above
1 the version of Wesely (1989) with the modificationfrom Wang et al (1998) (hereafter referred to as W98)which is used extensively in global CTMs (Hardacre etal 2015) and comprehensively discussed by Silva andHeald (2018) ndash this represents Type 1 in both stomataland non-stomatal parameterizations
2 the Zhang et al (2003) parameterization (hereafter re-ferred to as Z03) which is used in many North Amer-ican air quality modelling studies (eg Huang et al2016 Kharol et al 2018) and Canadian Air and Pre-cipitation Monitoring Network (CAPMoN) (eg Zhanget al 2009) ndash this represents Type 2 in both stomataland non-stomatal parameterizations
3 W98 with Rs calculated from a widely used coupledAnndashgs model the BallndashBerry model (hereafter referredto as W98_BB) (Ball et al 1987 Collatz et al 1991
1992) which is similar to that proposed by Val Martinet al (2014) and therefore the current parameterizationin Community Earth System Model (CESM) ndash this rep-resents Type 3 in stomatal and Type 1 in non-stomatalparameterizations and
4 Z03 with the BallndashBerry model (Z03_BB) which iscomparable to the configuration in Centoni (2017) im-plemented in the UKCA model ndash this represents Type3 in stomatal and Type 2 in non-stomatal parameteriza-tions
Another important consideration in choosing Z03 and W98is that they both have parameters for all major land types overthe globe making them widely applicable in global mod-elling We extract the source code (Wang et al 1998) andparameters (Baldocchi et al 1987 Jacob et al 1992 Ja-cob and Wofsy 1990 Wesely 1989) of W98 from GEOS-Chem CTM (httpwikiseasharvardedugeos-chemindexphpDry_deposition last access 24 January 2019) Thesource code of Z03 was obtained through personal communi-cation with Zhiyong Wu and Leiming Zhang which followsthe series of papers that described the development and for-malism of the parameterization (Brook et al 1999 Zhang etal 2001 2002 2003) The BallndashBerry Anndashgs model (Ball etal 1987 Collatz et al 1991 1992 Farquhar et al 1980)and its solver are largely based on the algorithm of CLM(Community Land Model) version 45 (Oleson et al 2013)which is numerically stable (Sun et al 2012) We use iden-tical formulae of Ra and Rb (Paulson 1970 Wesely andHicks 1977) for each individual parameterization allowingus to focus our analysis on differences in parameterizationsof Rc alone Table S1 in the Supplement gives a brief de-scription on the formalism of each of the dry deposition pa-rameterizations
22 Dry deposition model configuration inputs andsimulation
The above parameterizations are re-implemented in R lan-guage (R core team 2017) in the modelling framework ofthe Terrestrial Ecosystem Model in R (httpsgithubcomamospktaiTEMIR last access 15 November 2019) anddriven by gridded surface meteorology and land surfacedatasets The meteorological forcing chosen for this studyis the Modern-Era Retrospective analysis for Research andApplications version 2 (MERRA-2) (Gelaro et al 2017) anassimilated meteorological product at hourly time resolutionspanning from 1980 to the present day MERRA-2 containsall the required surface meteorological fields except VPD andRH which can be readily computed from T specific humid-ity (q) and surface air pressure (P ) We use the CLM landsurface dataset (Lawrence and Chase 2007) which containsinformation for land cover per-grid cell coverage of eachplant functional type (PFT) and PFT-specific LAI whichare required to drive the dry deposition parameterizations
Atmos Chem Phys 19 14365ndash14385 2019 wwwatmos-chem-physnet19143652019
A Y H Wong et al Ozone dry deposition parameterization choice 14369
and soil property which is required to drive the Anndashgs modelin addition to PFT and PFT-specific LAI CLM land typesare mapped to the land type of W98 following Geddes etal (2016) The mapping between CLM and Z03 land types isgiven in Table S2 Other relevant vegetation and soil param-eters are also imported from CLM 45 (Oleson et al 2013)while land-cover-specific roughness length (z0) values fol-low Geddes et al (2016) Leaf is set to be wet when either la-tent heat flux lt 0 W mminus2 or precipitation gt 02 mm hminus1 Frac-tional coverage of snow for Z03 is parameterized as a land-type-specific function of snow depth following the originalpaper of Z03 while W98 flags grid cells with albedo gt 04 orpermanently glaciated as snow covered
As the IAV of LAI could be an important factor in sim-ulating vd the widely used third-generation Global Inven-tory Modelling and Mapping Studies leaf area index product(GIMMS LAI3g abbreviated as LAI3g in this paper) (Zhu etal 2013) which is a global time series of LAI with 15 d tem-poral frequency and 112 spatial resolution spanning fromlate 1981 to 2011 is incorporated in this study We derive theinterannual scaling factors that can be applied to scale thebaseline CLM-derived LAI (Lawrence and Chase 2007) foreach month over 1982 to 2011 All the input data are aggre-gated into horizontal resolution of 2times 25 to align with theCTM sensitivity simulation described in the next subsectionTo represent subgrid land cover heterogeneity grid-cell-levelvd is calculated as the sum of vd over all subgrid land typesweighted by their percentage coverage in the grid cell (akatiling or mosaic approach eg Li et al 2013) This reducesthe information loss when land surface data are aggregated tocoarser spatial resolution and allows us to retain PFT-specificresults for each grid box in the offline dry deposition simula-tions
We run three sets of 30-year (1982ndash2011) simulations withthe deposition parameterizations to investigate how vd simu-lated by different parameterizations responds to different en-vironmental factors over multiple decades The settings ofthe simulations are summarized in Table 1 The first set[Clim] focuses on meteorological variability alone drivenby MERRA-2 meteorology and a multiyear (constant) meanannual cycle of LAI derived from LAI3g The second set[Clim+LAI] combines the effects of meteorology and IAVin LAI driven by the same MERRA-2 meteorology plusthe LAI time series from LAI3g As the increase in atmo-spheric CO2 level over multidecadal timescales may lead tosignificant reduction in gs as plants tend to conserve water(eg Franks et al 2013 Rigden and Salvucci 2017) weintroduce the third set of simulations [Clim+LAI+CO2]which is driven by varying meteorology and LAI plus theannual mean atmospheric CO2 level measured in MaunaLoa (Keeling et al 2001) (for the first two sets of sim-ulations atmospheric CO2 concentration held constant at390 ppm) Since W98 and Z03 do not respond to changesin CO2 level only W98_BB and Z03_BB are run with[Clim+LAI+CO2] to evaluate this impact We focus on
the daytime (solar elevation angle gt 20) vd as both vd andsurface O3 concentration typically peak around this timeWe calculate monthly means filtering out the grid cells withmonthly total daytime lt 100 h
In summary we present for the first time a unique setof global dry deposition velocity predictions over the last30 years driven by identical meteorology and land cover sothat discrepancies (in space and time) among the predictedvd are a result specifically of dry deposition parameteriza-tion choice or assumptions about how land cover is treated ineach
23 Chemical transport model sensitivity experiments
We quantify the sensitivity of surface O3 to variations in vdusing a global 3-D CTM GEOS-Chem version 1101 (httpacmgseasharvardedugeos last access 20 June 2019)which includes comprehensive HOxndashNOxndashVOCndashO3ndashBrOxchemical mechanisms (Mao et al 2013) and is widely usedto study tropospheric ozone (eg Hu et al 2017 Travis etal 2016 Zhang et al 2010) The model is driven by the as-similated meteorological data from the GEOS-FP (forwardprocessing) Atmospheric Data Assimilation System (GEOS-5 ADAS) (Rienecker et al 2008) which is jointly developedby National Centers for Environmental Prediction (NCEP) ofNational Oceanic and Atmospheric Administration (NOAA)and the Global Modelling and Assimilation Office (GMAO)The model is run with a horizontal resolution of 2times25
and 47 vertical layers The dry deposition module which hasbeen discussed above (W98) is driven by the monthly meanLAI retrieved from Moderate Resolution Imaging Spectro-radiometer (MODIS) (Myneni et al 2002) and the 2001version of Olson land cover map (Olson et al 2001) Bothof the maps are remapped from their native resolutions to025times 025
We propose to estimate the sensitivity of surface O3 con-centrations to uncertaintychanges in vd by the followingequation
1O3 = β1vd
vd
where 1O3 is the response of monthly mean daytime sur-face O3 to fractional change in vd (1vdvd) and β accountsfor the sensitivity of surface O3 concentration in a grid boxto the perturbation in vd within that grid box To estimateβ we run two simulations for the year 2013 one with thedefault setting and another where we perturb vd by +30 Thus this approach could represent a conservative estimateof O3 sensitivity to vd if the impacts on other species resultin additional effects on O3 We use this sensitivity to iden-tify areas where local uncertainty and variability in vd is ex-pected to affect local surface O3 concentration and we usethe assumption of linearity to estimate those impacts to a firstorder (eg Wong et al 2018) In the Supplement we justifythis first-order assumption mathematically as well as demon-
wwwatmos-chem-physnet19143652019 Atmos Chem Phys 19 14365ndash14385 2019
14370 A Y H Wong et al Ozone dry deposition parameterization choice
Table 1 List of vd simulations with input data
vd simulation Meteorology LAI Atmospheric CO2 concentration
[Clim]MERRA-2 meteorology
LAI3g monthly climatology 390 ppm[Clim+LAI] LAI3g monthly time series 390 ppm[Clim+LAI+CO2] LAI3g monthly time series Mauna Loa time series
strate the impact of using a second-order approximation andestimate the uncertainty using an assumption of linearity tobe within 30 However we note this first-order assumptionmay not be able to capture the effects of chemical transportchanges in background ozone and non-linearity in chem-istry which can contribute to response of O3 concentration tovd Our experiment could help identify regions where morerigorous modelling efforts could be targeted in future workWe limit our analysis to grid cells where the monthly aver-age vd is greater than 025 cm sminus1 in the unperturbed GEOS-Chem simulation since changes in surface O3 elsewhere areexpected to be attributed more to change in background O3rather than the local perturbation of vd (Wong et al 2018)
3 Evaluation of dry deposition parameterizations
We first compare our offline simulations of seasonal meandaytime average vd that result from the four parameteriza-tions in the [Clim] and [Clim+LAI] scenarios with an obser-vational database largely based on the evaluation presentedin Silva and Heald (2018) We do not include the evaluationof vd from the [Clim+LAI+CO2] scenario as we find thatthe impact of CO2 concentration on vd is negligible over theperiod of concern as we will show in subsequent sectionsWe use two unbiased and symmetrical statistical metricsnormalized mean bias factor (NMBF) and normalized meanabsolute error factor (NMAEF) to evaluate our parameteri-zations Positive NMBF indicates that the parameterizationoverestimates the observations by a factor of 1+NMBF andthe absolute gross error is NMAEF times the mean observa-tion while negative NMBF implies that the parameterizationunderestimates the observations by a factor of 1minusNMBF andthe absolute gross error is NMAEF times the mean modelprediction (Yu et al 2006) We use the simulated subgridland-type-specific predictions of vd that correctly match theland type and the averaging window indicated by the obser-vations We exclude instances where the observed land typedoes not have a match within the model grid box While thisremoves one-third of the original datasets used in Silva andHeald (2018) this means that mismatched land cover typescan be ignored as a factor in model bias
Figure 1 shows the fractional coverage within each gridcell and the geographic locations of O3 flux observation sitesfor each major land type Nearly all the observations areclustered in Europe and North America except three sitesin the tropical rainforest and one site in a tropical decidu-
ous forest in Thailand For most major land types there aresignificant mismatches between the locations of flux mea-surements and the dominant land cover fraction which mayhinder the spatial representativeness of our evaluation Theresulting NMBF and NMAEF for five major land-type cat-egories are shown in Table 2 and the list of sites and theirdescriptions are given in Table S3 In general the numeri-cal ranges of both NMBF and NMAEF are similar to thatof Silva and Heald (2018) and no single parameterization ofthe four parameterizations outperforms the others across allfive major land types
The performance metrics of each parameterization at eachland type are summarized in Table 2 Comparing the twomultiplicative parameterizations (W98 and Z03) we find thatW98 performs satisfactorily over deciduous forests and trop-ical rainforests while strongly underestimating daytime vdover coniferous forests In contrast Z03 performs better inconiferous forests but worse in tropical rainforests and de-ciduous forests The severe underestimation of daytime vd byZ03 over tropical rainforests has previously been attributed topersistent canopy wetness and hence stomatal blocking im-posed by the parameterization (Centoni 2017) We also notethat even for the same location vd can vary significantly be-tween seasons (Rummel et al 2007) and management prac-tices (Fowler et al 2011) which models may fail to capturedue to limited representations of land cover Given the smallsample size (N = 5) diverse environments and large anthro-pogenic intervention in the tropics the disparity in perfor-mance metrics may not fully reflect the relative model per-formance Baseline cuticular resistance in Z03 under dry andwet canopy is 15 and 2 times that of coniferous forests re-spectively (Zhang et al 2003) such that the enhancement ofcuticular uptake by wetness may not compensate the reducedgs over tropical rainforests and to a lesser extent deciduousforests
Over grasslands W98 has higher positive biases whileZ03 has higher absolute errors This is because for datasets athigh latitudes the dominant grass PFT is arctic grass whichis mapped to ldquotundrardquo land type (Geddes et al 2016) Whiletundra is parameterized similarly to grasslands in W98 thisis not the case in Z03 Combined with the general high bi-ases at other sites for these parameterizations the large lowbiases for ldquotundrardquo sites in Z03 lower the overall high biasesbut lead to higher absolute errors
Over croplands the positive biases and absolute errors arerelatively large for both W98 and Z03 (with Z03 performing
Atmos Chem Phys 19 14365ndash14385 2019 wwwatmos-chem-physnet19143652019
A Y H Wong et al Ozone dry deposition parameterization choice 14371
Figure 1 Fractional coverage of each major land type at each grid cell Blue dots indicate the locations of the observational sites
Table 2 Performance metrics (NMBF and NMAEF) for daytime average vd simulated by the four dry deposition parameterizations withN referring to number of data points (one data point indicates one seasonal mean) ldquoStatic LAIrdquo is the result from the [Clim] run whichuses 1982ndash2011 Advanced Very High Resolution Radiometer (AVHRR) monthly climatological LAI while ldquodynamic LAIrdquo is the result of[Clim+LAI] which uses 1982ndash2011 AVHRR LAI time series Dec indicates deciduous forest Con indicates coniferous forest Tro indicatestropical rainforest Gra indicates grassland and Cro indicates cropland N indicates the number of observational datasets involved in thatparticular land type The best performing parameterization for each land type has its performance metrics in bold text
Land types Metrics Static LAI Dynamic LAI
W98 Z03 W98_BB Z03_BB W98 Z03 W98_BB Z03_BB
Dec (N = 8)NMBF 0134 minus0367 minus0287 minus0142 0119 minus0376 minus0299 minus0153NMAEF 0322 0369 0305 0215 0319 0376 0321 0226
Con (N = 16)NMBF minus0362 minus0217 minus0252 minus0025 minus0355 minus0209 minus0248 minus0023NMAEF 0448 0455 0483 0399 0427 0458 0470 0394
Tro (N = 5)NMBF 0080 minus0808 minus0086 minus0438 0075 minus0813 minus0090 minus0441NMAEF 0423 0831 0404 0569 0422 0832 0399 0567
Gra (N = 10)NMBF 0276 0015 0175 0097 0294 0011 0186 0110NMAEF 0392 0479 0307 0318 0396 0467 0302 0311
Cro (N = 11)NMBF 0297 0360 0241 0282 0318 0371 0255 0292NMAEF 0473 0541 0474 0570 0485 0550 0480 0576
worse in general than W98) The functional and physiolog-ical diversity with the ldquocroprdquo land type also contributes tothe general difficulty in simulating vd over cropland Eventhough Z03 has individual parameterizations for four spe-cific crop types (rice sugar maize and cotton) this advan-tage is difficult to fully leverage as most global land coverdatasets do not resolve croplands in such detail Having landcover maps that distinguish between more crop types couldpotentially improve the performance of Z03 The evaluationfor herbaceous land types also suggests that as CLM PFTsdo not have exact correspondence with W98 and Z03 landtypes our results over herbaceous land types are subject tothe uncertainty in land-type mapping (eg tundra vs grass-land specific vs generic crops C3 vs C4 grass)
Substituting the native gs in W98 and Z03 by that sim-ulated by the BallndashBerry model (the W98_BB and Z03_BBruns) generally though not universally leads to improvementin model performance against the observations W98_BB hasconsiderably smaller biases and absolute errors than W98over grassland While having little effect on the absolute er-ror W98_BB improves the biases over coniferous forest andcropland compared to W98 but worsens the biases over rain-forests and deciduous forests In contrast Z03_BB is able toimprove the modelndashobservation agreement over all five landtypes when compared to Z03 This finding echoes that fromWu et al (2011) who explicitly show the advantage of re-placing the gs of Wesely (1989) with the BallndashBerry model insimulating vd over a forest site and in addition show the po-
wwwatmos-chem-physnet19143652019 Atmos Chem Phys 19 14365ndash14385 2019
14372 A Y H Wong et al Ozone dry deposition parameterization choice
Figure 2 The 1982ndash2011 July mean daytime vd (solar elevationangle gt 20) over vegetated land surface simulated by W98
tential of the BallndashBerry model in improving the spatial dis-tribution of mean vd The different responses to substitutingnative gs with that from the BallndashBerry model highlight thesignificant differences in parameterizing non-stomatal up-take between W98 and Z03 which further suggests that theuncertainty in non-stomatal deposition should not be over-looked
The minimal impact that results from using LAI thatmatches the time of observation is not unexpected since themeteorological and land cover information from a 2times 25
grid cell may not be representative of the typical footprintof a site measurement (on the order of 10minus3 to 101 km2eg Chen et al 2009 2012) The mismatch between modelresolution and the footprint of site-level measurements hasalso been highlighted in previous evaluation efforts in global-scale CTMs (Hardacre et al 2015 Silva and Heald 2018)Furthermore the sample sizes for all land types are small(N le 16) and the evaluation may be further compromised byinherent sampling biases
In addition to the evaluation against field observation wefind good correlation (R2
= 094) between the annual meanvd from GEOS-Chem at 2013 and the 30-year mean vd ofW98 run with static LAI providing further evidence that ourimplementation of W98 is reliable Overall our evaluationshows that the quality of our offline simulation of dry depo-sition across the four parameterizations in this work is largelyconsistent with previous global modelling evaluation efforts
4 Impact of dry deposition parameterization choice onlong-term averages
Here we summarize the impact that the different dry deposi-tion parameterizations may have on simulations of the spatialdistribution of vd and on the inferred surface O3 concentra-tions We begin by comparing the simulated long-term meanvd across parameterizations then use a chemical transportmodel sensitivity experiment to estimate the O3 impacts
Figure 2 shows the 30-year July daytime average vd sim-ulated by W98 over vegetated surfaces (defined as the gridcells with gt 50 plant cover) and Fig 3 shows the differ-ence between the W98 and the W98_BB Z03 and Z03_BBpredictions respectively We first focus on results from Julybecause of the coincidence of high surface O3 level bio-spheric activity and vd in the Northern Hemisphere (NH)and will subsequently discuss the result for December whensuch a condition holds for the Southern Hemisphere (SH)W98 simulates the highest July mean daytime vd in Ama-zonia (12 to 14 cm sminus1) followed by other major tropicalrainforests and temperate forests in the northeastern US Julymean daytime vd in other temperate regions in North Amer-ica and Eurasia typically ranges from 05 to 08 cm sminus1 whilein South American and the African savannah and most partsof China daytime vd is around 04 to 06 cm sminus1 In IndiaAustralia the western US polar tundra and Mediterraneanregion July mean daytime vd is low (02ndash05 cm sminus1)
The other three parameterizations (W98_BB Z03Z03_BB) simulate substantially different spatial distributionsof daytime vd In North America we find W98_BB Z03and Z03_BB produce lower vd (by minus01 to minus04 cm sminus1)compared to W98 in the deciduous-forest-dominated north-eastern US and slightly higher vd in boreal-forest-dominatedregions of Canada Z03 and Z03_BB produce noticeablylower vd (by up to minus02 cm sminus1) in arctic tundra andgrasslands in the western US In the southeastern USW98_BB and Z03_BB simulate a slightly higher vd (by upto +01 cm sminus1) while Z03 suggests a slightly lower vd (byup to minus01 cm sminus1) W98_BB simulates a lower (minus01 tominus04 cm sminus1) vd in tropical rainforests with larger reductionsconcentrated in southern Amazonia where July is within thedry season while the northern Amazonia is not (Malhi etal 2008) Z03 and Z03_BB simulate much smaller (minus04to minus06 cm sminus1) vd in all tropical rainforests
Over the midlatitudes in Eurasia Australia and SouthAmerica except Amazonia W98_BB Z03 and Z03_BBgenerally simulate a lower daytime vd by up to 025 cm sminus1possibly due to the dominance of grasslands and deciduousforests where W98 tends to be more high biased than otherparameterizations when compared to the observations of vdIn the southern African savannah W98_BB and Z03_BBsuggest a much lower daytime vd (by minus01 to minus04 cm sminus1)
because of explicit consideration of soil moisture limitationto An and gs (demonstrated by the spatial overlap with soilmoisture stress factors shown in Fig S2) Z03_BB simulatesa particularly high daytime vd over the high-latitude conifer-ous forests (+01 to +03 cm sminus1) W98_BB and Z03_BBproduce higher daytime vd (up to +015 cm sminus1) in Indiaand south China due to temperature acclimation (Kattge andKnorr 2007) which allows more stomatal opening under thehigh temperature that would largely shut down the stomataldeposition in W98 and Z03 as long as the soil does not be-come too dry to support stomatal opening This is guaranteedby the rainfall from summer monsoon in both regions Low
Atmos Chem Phys 19 14365ndash14385 2019 wwwatmos-chem-physnet19143652019
A Y H Wong et al Ozone dry deposition parameterization choice 14373
Figure 3 Differences of 1982ndash2011 July mean daytime vd (1vd) between three other parameterizations (Z03 W98_BB and Z03_BB) andW98 over vegetated land surface
vd is simulated by Z03 and Z03_BB in the grasslands near theTibetan Plateau because the grasslands are mainly mapped tothe tundra land type which typically has low vd as discussedin Sect 3
Our results suggest that the global distribution of simu-lated mean vd depends substantially on the choice of dry de-position parameterization driven primarily by the responseto hydroclimate-related parameters such as soil moistureVPD and leaf wetness in addition to land-type-specific pa-rameters which could impact the spatial distribution of sur-face ozone predicted by chemical transport models To esti-mate the impact on surface ozone of an individual parameter-ization ldquoirdquo compared to the W98 predictions (which we useas a baseline) we apply the following equation
1O3i asymp β1vdi
vdW98
(3)
where 1O3i is the estimated impact on simulated O3 con-centrations in a grid box1vdi is the difference between pa-rameterization i and W98 simulated mean daytime vd in thatgrid box vdW98 is W98 output mean daytime vd for that gridbox and β is the sensitivity of surface ozone to vd calculatedby the method outlined in Sect 23
Figure 4 shows the resulting estimates of 1O3 globallyWe find 1O3 is the largest in tropical rainforests for all theparameterizations (up to 5 to 8 ppbv) Other hotspots of sub-stantial differences are boreal coniferous forests the easternUS continental Europe Eurasian steppe and the grasslandin southwestern China where 1O3 is either relatively largeor the signs disagree among parameterizations In India In-dochina and south China 1O3 is relatively small but stillreaches up to up to minus2 ppbv We find that 1O3 is not negli-gible (1ndash4 ppbv) in many regions with relatively high popu-lation density which suggests that the choice of dry deposi-tion parameterization can be relevant to the uncertainty in thestudy of air quality and its implication on public health Wenote that we have not estimated 1O3 for some regions withlow GEOS-Chem-predicted vd (lt 025 cm sminus1 as describedin Sect 23) but where the disagreement in vd between pa-rameterizations can be large (eg the southern African sa-
vannah see Fig 3) Given this limitation the impacts on O3we have summarized may therefore be spatially conservative
To explore the impact of different prediction of vd on sur-face O3 in different seasons we repeat the above analyses forDecember Figure 5 shows the 1982ndash2011 mean Decemberdaytime vd predicted by W98 while Fig 6 shows the dif-ference between W98 and the Z03 W98_BB and Z03_BBrespectively High latitudes in the NH are excluded due tothe small number of daytime hours Z03 and Z03_BB sim-ulate substantially lower in daytime vd at NH midlatitudesbecause Z03 and Z03_BB allow partial snow cover but W98and W98_BB only allow total or no snow cover At mid-latitudes the snow cover is not high enough to trigger thethreshold of converting vegetated to snow-covered ground inW98 and W98_BB resulting in lower surface resistance andhence higher daytime vd compared to Z03 and Z03_BB inAmazonia the hotspot of difference in daytime vd shifts fromthe south to the north relative to July which is in the dry sea-son (Malhi et al 2008) These results for December togetherwith our findings from July suggest that the discrepancy insimulated daytime vd between W98 and other parameteriza-tions is due to the explicit response to hydroclimate in theformer compared to the latter Given that field observationsindicate a large reduction of vd in dry season in Amazonia(Rummel et al 2007) the lack of dependence of hydrocli-mate can be a drawback of W98 in simulating vd in Amazo-nia
Figure 7 shows the resulting estimates of 1O3 globallyfor December using Eq (3) In all major rainforests 1O3 issmaller in December due to generally lower sensitivity com-pared to July A surprising hotspot of both daytime 1vd and1O3 is the rainforesttropical deciduous forest in Myanmarand its eastern bordering region which also has distinct wetand dry seasons The proximity of December to the dry sea-son which starts in January (eg Matsuda et al 2005) in-dicates that the consistent 1vd between W98 and other pa-rameterizations is driven by hydroclimate as in AmazoniaComparison with field measurements (Matsuda et al 2005)suggests that the W98_BB and Z03_BB capture daytime vdbetter than W98 while Z03 may overemphasize the effectof such dryness The above reasoning also explains some of
wwwatmos-chem-physnet19143652019 Atmos Chem Phys 19 14365ndash14385 2019
14374 A Y H Wong et al Ozone dry deposition parameterization choice
Figure 4 Estimated difference in July mean surface ozone (1O3) due to the discrepancy of simulated July mean daytime vd among theparameterizations
Figure 5 The 1982ndash2011 December mean daytime vd (solar ele-vation angle gt 20) over vegetated land surface simulated by W98The data over high latitudes over Northern Hemisphere are invaliddue to insufficient daytime hours over the month (lt 100 h monthminus1)
the 1vd in India and south China across the three param-eterizations These findings identify hydroclimate as a keydriver of process uncertainty of vd over tropics and subtrop-ics and therefore its impact on the spatial distribution of sur-face ozone concentrations independent of land-type-basedbiases in these regions
Overall these results demonstrate that the discrepancy inthe spatial distribution of simulated mean daytime vd result-ing from choice of dry deposition parameterization can havean important impact on the global distribution of surface O3predicted by chemical transport models We find that the re-sponse to hydroclimate by individual parameterization notonly affects the mean of predicted surface ozone but also hasdifferent impacts in different seasons which is complemen-tary to the findings of Kavassalis and Murphy (2017) thatmainly focus on how shorter-term hydrometeorological vari-ability may modulate surface O3 through dry deposition
5 Impact of dry deposition parameterization choice ontrends and interannual variability
Here we explore the impact that different dry deposition pa-rameterizations may have on predictions of IAV and trendsin vd and on the inferred surface O3 concentrations We usethe TheilndashSen method (Sen 1968) which is less suscepti-ble to outliers than least-square methods to estimate trendsin July daytime vd (and any underlying meteorological vari-ables) and use p value lt 005 to estimate significance
Figure 8 shows the trend in July mean daytime vd from1982 to 2011 predicted by each of the parameterizations andscenarios ([Clim] [Clim+LAI] and [Clim+LAI+CO2])Figure 9 shows the potential impact of these trends in vd onJuly daytime surface ozone which we estimate to a first orderusing the following equation
1O330yi asymp β timesmvdi times 30 (4)
where 1O330yi and mvdi are the absolute change in ozoneinferred to a first order as a result of the trend of vd and thenormalized TheilndashSen slope ( yrminus1) of vd for parameteriza-tion i over the 30 years (1982ndash2011)
In [Clim] simulations (where LAI is held constant) signif-icant decreasing trends in July daytime vd are simulated bythe Z03 W98_BB and Z03_BB in Mongolia where signif-icant increasing trend in T (warming) and decreasing trendin RH (drying) detected in the MERRA-2 surface meteoro-logical field in July daytime This trend is not present in theW98 parameterization as this formulation does not respondto the long-term drying We find some decreasing trends invd across parts of central Europe and the Mediterranean tovarying degrees across the parameterizations In the SH wefind consistent decreasing trends across all four parameteri-zations in southern Amazonia and southern African savannahdue to warming and drying which we estimate could pro-duce a concomitant increase in July mean surface ozone ofbetween 1 to 3 ppbv (Fig 9)
In [Clim+LAI] scenario all four parameterizations sim-ulate a significant increasing trend of vd over high latitudeswhich is consistent with the observed greening trend overthe region (Zhu et al 2016) We estimate this could pro-
Atmos Chem Phys 19 14365ndash14385 2019 wwwatmos-chem-physnet19143652019
A Y H Wong et al Ozone dry deposition parameterization choice 14375
Figure 6 Differences of 1982ndash2011 December mean daytime vd (1vd) between three other parameterizations (Z03 W98_BB and Z03_BB)and W98 over vegetated land surface
Figure 7 Estimated difference in December mean surface ozone (1O3) due to the discrepancy of simulated December mean daytime vdamong the parameterizations
duce a concomitant decrease in July mean surface ozoneof between 1 and 3 ppbv The parameterizations generallyagree in terms of the spatial distribution of these trends inO3 Exceptions include a steeper decreasing trend in most ofSiberia predicted by W98 while the trend is more confined ineastern and western Siberia in the other three parameteriza-tions Including the effect of CO2-induced stomatal closure([Clim+LAI+CO2] runs) partially offsets the increase ofvd in high latitudes but does not lead to large changes in boththe magnitudes and spatial patterns of vd trend We find neg-ligible trends in daytime vd for December in all cases Theseresults show that across all dry deposition model parameteri-zations LAI and climate more than increasing CO2 can po-tentially drive significant long-term changes in vd and shouldnot be neglected when analysing the long-term change in airquality over 1982ndash2011 We note that the importance of theCO2 effect could grow as the period of study extends to allowa larger range of atmospheric CO2 concentrations (Hollawayet al 2017 Sanderson et al 2007)
We go on to explore the impact of parameterization choicein calculations of IAV in vd Figure 10 shows the coefficientof variation of linearly detrended July daytime vd (CVvd )Figure 11 shows the potential impact this has on IAV in sur-face ozone which we estimate to a first order by the follow-ing equation
σO3i asymp β timesCVvdi (5)
where σO3i is the estimated interannual standard deviationin surface ozone resulting from IAV in vd given predictedby dry deposition parameterization i In both cases we showonly the [Clim] and [Clim+LAI] runs since IAV in CO2 hasnegligible impact on interannual variability in vd
Using the W98 parameterization IAV in predicted vd andO3 is considerably smaller in the [Clim] run than that for the[Clim+LAI] run since both the stomatal and non-stomatalconductance in W98 are assumed to be strong functions ofLAI rather than meteorological conditions This implies thatlong-term simulations with W98 and constant LAI can po-tentially underestimate the IAV of vd and surface ozone Incontrast IAV in vd calculated by the Z03 parameterizationis nearly the same for the [Clim] and [Clim+LAI] runs InZ03 gs is also directly influenced by VPD in addition to tem-perature and radiation and non-stomatal conductance in Z03is much more dependent on meteorology than W98 leadingto high sensitivity to climate Though the BallndashBerry modelalso responds to meteorological conditions it considers rel-atively complex Anndashgs regulation and includes temperatureacclimation which could dampen its sensitivity to meteoro-logical variability compared to the direct functional depen-dence on meteorology in the Z03 multiplicative algorithmThus the climate sensitivity of W98_BB and Z03_BB is inbetween Z03 and W98 as is indicated by a more moderatedifference between σO3i from [Clim] and [Clim+LAI] runsin Fig 11
wwwatmos-chem-physnet19143652019 Atmos Chem Phys 19 14365ndash14385 2019
14376 A Y H Wong et al Ozone dry deposition parameterization choice
Figure 8 Trends of July mean daytime vd during 1982ndash2011 over vegetated land surface Black dots indicate statistically significant trends(p lt 005)
Figure 9 Estimated impact of trends of July mean daytime vd on July mean surface ozone (1O330y ) during 1982ndash2011 over vegetated landsurface Only grid points with statistically significant trends (p lt 005) in July mean daytime vd are considered
For regional patterns of CVvd and σO3 we focus on the[Clim+LAI] runs (Figs 10e to h and 11e to h) as they allowfor a comparison of all four parameterizations and containall the important factors of controlling vd In North Americawe estimate modest IAV in vd across all four parameteriza-tions (CVvd lt 15 ) in most places We find this results inrelatively low σO3 in the northeastern US and larger σO3 inthe central and southeast US (in the range of 03 to 2 ppbv)These results are of a similar magnitude to the standard devi-ation of summer mean background ozone suggested by Fioreet al (2014) over similar time period suggesting that IAV ofdry deposition can be a potentially important component ofthe IAV of surface ozone in summer over North America
All parameterizations produce larger CVvd (and there-fore larger σO3) in southern Amazonia compared to northern
and central Amazonia but we find substantial discrepanciesacross parameterizations The estimated impact on IAV inO3 in southern Amazonia ranges from less than 1 ppbv pre-dicted by the W98 and W98_BB parameterizations to ex-ceeding 15ndash25 ppbv predicted by the Z03 parameterizationIAV is also relatively large in central Africa We find thatthe parameterizations which include a BallndashBerry formula-tion (W98_BB and Z03_BB) estimate higher IAV in this re-gion (with σO3 varying between 1 and 4 ppbv) compared tothe W98 and Z03 parameterizations (σO3 up to 2 ppbv) Wealso note that the BallndashBerry formulations show more spa-tial heterogeneity compared to W98 and Z03 In our imple-mentation of the BallndashBerry model impact of soil moistureon gs is parameterized as a function of root-zone soil matricpotential which makes gs very sensitive to variation in soil
Atmos Chem Phys 19 14365ndash14385 2019 wwwatmos-chem-physnet19143652019
A Y H Wong et al Ozone dry deposition parameterization choice 14377
Figure 10 Interannual coefficient of variation of linearly detrended July mean daytime vd (CVvd ) during 1982ndash2011 over vegetated landsurface
Figure 11 Estimated contribution of IAV in July mean daytime vd to IAV of July mean surface ozone (σO3 ) during 1982ndash2011 over vegetatedland surface
wetness when its climatology is near the point that triggerslimitation onAn and gs Given the large uncertainty in globalsoil property map (Dai et al 2019) such sensitivity couldbe potentially artificial which should be taken into consid-eration when implementing BallndashBerry parameterizations inlarge-scale models despite their relatively good performancein site-level evaluation (Wu et al 2011)
Across Europe the magnitudes of IAV predicted by allfour parameterizations show relatively good spatial consis-tency Simulated CVvd is relatively low in western and north-ern Europe (lt 10 ) which we estimate translates to lessthan 1 ppbv of σO3 We find larger CVvd (and therefore largeσO3) over parts of southern Russia and Siberia (σO3 up to25 ppbv) from all parameterizations except W98 The localgeographic distribution of CVvd and σO3 also significantlydiffers among the parameterizations there Z03 and Z03_BBsimulate larger CVvd in eastern Siberia than W98_BB whileW98 BB and Z03_BB predict larger CVvd over the southernRussian steppe then Z03 Finally all four parameterizationsestimate relatively low CVvd and σO3 in India China andsoutheast Asia
We compare the simulated IAV July CVvd from all fourdeposition parameterizations with those recorded by publiclyavailable long-term observations Hourly vd is calculated us-ing Eq (1) from raw data We filter out the data points withextreme (gt 2 cm sminus1) or negative vd and without enough tur-bulence (ulowast lt 025 m sminus1) As vd values in each daytime hourare not uniformly sampled in the observational datasets wecalculate the mean diurnal cycle and then calculate the day-time average July vd for each year from the mean diurnalcycle from which CVvd can be calculated
The IAV predicted by all four parameterizations at Har-vard Forest is between 3 and 79 which is 2 to 6 timeslower than that presented in the observations (18 ) We findsimilar underestimations by all four parameterizations com-pared to the long-term observation from Hyytiaumllauml (Junninenet al 2009 Keronen et al 2003 httpsavaatdatafiwebsmartsmeardownload last access 25 July 2019) where ob-served CVvd (16 ) is significantly higher than that predictedby the deposition parameterizations (35 ndash71 ) In Blod-gett Forest we find that the models underestimate the ob-served annual CVvd more seriously (sim 1 ndash3 compared to
wwwatmos-chem-physnet19143652019 Atmos Chem Phys 19 14365ndash14385 2019
14378 A Y H Wong et al Ozone dry deposition parameterization choice
18 in the observations) This suggests that the IAV of vdmay be underestimated across all deposition parameteriza-tions we investigated (and routinely used in simulations ofchemical transport) Clifton et al (2019) attribute this to theIAV in deposition to wet soil and dew-wet leaves and in-canopy chemistry under stressed conditions for forests overthe northeastern US Some of these processes (eg in-canopychemistry wetness slowing soil ozone uptake) are not rep-resented by existing parameterizations contributing to theirdifficulty in reproducing the observed IAV The scarcity oflong-term ozone flux measurements (Fares et al 2010 2017Munger et al 1996 Rannik et al 2012) limits our ability tobenchmark the IAV in our model simulations with observa-tional datasets
In summary when both the variability in LAI and climateare considered the IAV in simulated vd translates to IAV insurface O3 of 05ndash2 ppbv in July for most regions Such vari-ability is predicted to be particularly strong in southern Ama-zonian and central African rainforest where the predictedIAV in July surface O3 due to dry deposition can be as highas 4 ppbv This suggests that IAV of vd can be an importantpart of the natural variability of surface O3 The estimatedmagnitude of IAV is also dependent of the choice of vd pa-rameterization which highlights the importance of vd param-eterization choice on modelling IAV of surface O3
6 Discussion and conclusion
We present the results of multidecadal global modelling ofozone dry deposition using four different ozone depositionparameterizations that are representative of the major typesof approaches of gaseous dry deposition modelling used inglobal chemical transport models The parameterizations aredriven by the same assimilated meteorology and satellite-derived LAI which minimizes the uncertainty of model inputacross parameterization and simplifies interpretation of inter-model differences The output is evaluated against field ob-servations and shows satisfactory performance One of ourmain goals was to investigate the impact of dry depositionparameterization choice on long-term averages trends andIAV in vd over a multidecadal timescale and estimate the po-tential concomitant impact on surface ozone concentrationsto a first order using a sensitivity simulation approach drivenby the GEOS-Chem chemical transport model
We find that the performance of the four dry depositionparameterizations against field observations varies consider-ably over land types and these results are consistent withother evaluations reflecting the potential issue that dry de-position parameterizations can often be overfit to a partic-ular set of available observations requiring caution in theirapplication at global scales We also find that using moreecophysiologically realistic output gs predicted by the BallndashBerry model can generally improve model performance butat the cost of high sensitivity to relatively unreliable soil data
However the number of available datasets of ozone dry de-position observation is still small and concentrated in NorthAmerica and Europe We know of only one multi-season di-rect observational record in Asia (Matsuda et al 2005) andnone in Africa where air quality can be an important issueTo better constrain regional O3 dry deposition effort must bemade in making new observations of gaseous dry deposition(Fares et al 2017) especially in the undersampled regionsEvaluation and development of ozone dry deposition param-eterizations will continue to benefit from publicly availableozone flux measurements and related micrometeorologicalvariables that allow for partitioning measured flux into in-dividual deposition pathways (eg Clifton et al 2017 2019Fares et al 2010 Wu et al 2011 2018)
We find substantial disagreement in the spatial distributionbetween the mean daytime vd predicted by the different pa-rameterizations we tested We find that these discrepanciesare in general a function of both location and season In NHsummer vd values simulated by the four parameterizationsare considerably different in many regions over the worldWe estimate that this could lead to around 2 to 5 ppbv in un-certainty of surface ozone concentration simulations over avast majority of land in the NH In tropical rainforests whereleaf wetness is prevalent and the dryndashwet season dynamicscan have a large impact on vd (Rummel et al 2007) we es-timate the uncertainty due to dry deposition model choicecould even lead to an uncertainty in surface ozone of up to8 ppbv We also find noticeable impacts in parameterizationchoice during SH summer but we note that due to the unre-liability of β at low vd we have not assessed its impact onsurface ozone in many high-latitude regions of the NH Ingeneral we find hydroclimate to be an important driver ofthe uncertainty This demonstrates that the potential impactof parameterization choice (or process uncertainty) of vd isneither spatiotemporally uniform nor negligible in many re-gions over the world More multi-seasonal observations areespecially needed over seasonally dry ecosystems where therole of hydroclimate in deposition parameterizations needs tobe evaluated Recently standard micrometeorological mea-surements have been used to derive gs and stomatal deposi-tion of O3 over North America and Europe (Ducker et al2018) highlighting the potential of using global networks ofmicrometeorological observation (eg FLUXNET Baldoc-chi et al 2001) to benchmark and calibrate gs of dry deposi-tion parameterizations which could at least increase the spa-tiotemporal representativeness if not the absolute accuracyof dry deposition parameterizations since it would be diffi-cult to constrain non-stomatal sinks with this method Furtherresearch is required to more directly verify whether better-constrained gs leads to improved vd simulation
Over the majority of vegetated regions in the NH we esti-mate the IAV of mean daytime vd is generally on the order of5 to 15 and may contribute between 05 and 2 ppbv ofIAV in July surface O3 over the 30-year period consideredhere with each parameterization simulating different geo-
Atmos Chem Phys 19 14365ndash14385 2019 wwwatmos-chem-physnet19143652019
A Y H Wong et al Ozone dry deposition parameterization choice 14379
graphic distribution of where IAV is highest The predictedIAV from all four models is smaller than what long-term ob-servations suggest but its potential contribution to IAV in O3is still comparable to the long-term variability of backgroundozone over similar timescales in US summer (Brown-Steineret al 2018 Fiore et al 2014) This would seem to confirmthat vd may be a substantial contributor to natural IAV of O3in summer at least in the US In the Southern Hemispherethe IAV mainly concentrates in the drier part of tropical rain-forests The BallndashBerry parameterizations simulate large andspatially discontinuous CVvd and σO3 due to their sensitivityto soil wetness Globally we find that IAV of vd in W98 ismostly driven by LAI while in other parameterizations cli-mate generally plays a more important role We therefore em-phasize that temporal matching of LAI is important for con-sistency when W98 is used in long-term simulations Whileour results show notable impacts across the globe in manyregions there are no available long-term observations to eval-uate the model predictions over interannual timescales Thisinformation is helpful in designing and identifying sourcesof error in model experiments that involve variability of vd
We are also able to detect statistically significant trendsin July daytime vd over several regions The magnitudes oftrends are up to 1 per year and both climate and LAI con-tribute to the trend All four deposition parameterizationsidentify three main hotspots of decreasing July daytime vd(southern Amazonia southern African savannah Mongolia)which we link mainly to increasing surface air temperatureand decreasing relative humidity Meanwhile extensive ar-eas at high latitudes experience LAI-driven increasing Julydaytime vd consistent with the greening trend in the region(Zhu et al 2016) We do not find a strong influence of CO2-induced stomatal closure in the trend over this time periodOver the 30 years we estimate the trend in July daytimevd could translate approximately to 1 to 3 ppbv of ozonechanges in the areas of impact indicating the potential effectof long-term changes in vd on surface ozone This estimateshould be considered conservative since we are unable to re-liably test the sensitivity of ozone to regions with low vd withour approach
While the approach we have presented here allows us toexplore the role of dry deposition parameterization choice onsimulations of long-term means trends and IAV in ozonedry deposition velocity there remain some limitations andopportunities for development First we only used one LAIand assimilated meteorological product The geographic dis-tribution of trend and IAV of vd may vary considerably asthe LAI and meteorological products used due to their in-herent uncertainty (eg Jiang et al 2017) While we expectthe qualitative conclusions about how LAI and climate con-trols the modelled trend and IAV of vd to be robust to thechoice of dataset the magnitude and spatial variability couldbe affected Second the estimated effects on surface O3 area first-order inference based on a linear approximation of theimpact that vd has directly on O3 We have not applied our
analysis to regions with low GEOS-Chem vd where othercomponents of parameterization (eg definition and treat-ment of snow cover difference in ground resistance) mayhave major impact on vd prediction (Silva and Heald 2018)nor accounted for the role that vd variability can have onother chemical species which would have feedbacks on O3Moreover the sensitivity of surface ozone to vd may be de-pendent on the choice of chemical transport model (here theGEOS-Chem model has been used) and possibly the choiceof simulation year for the sensitivity simulation Finally wehave neglected the effect of land use and land cover changeon global PFT composition at this stage which can be an-other source of variability for vd and even long-term LAI re-trieval (Fang et al 2013) Nevertheless the relatively highNMAEF of simulated vd and the inherent uncertainty in in-put data (land cover soil property assimilated meteorologyand LAI) are considered as the major sources of uncertaintyin our predictions of vd
The impact of dry deposition parameterization choice mayalso have impacts which we have not explored in this studyon other trace gases with deposition velocity controlled bysurface resistance and for which stomatal resistance is animportant control of surface resistance (eg NO2) As vd hasalready been recognized as a major source of uncertainty inderiving global dry deposition flux of NO2 and SO2 (Nowlanet al 2014) systematic investigation on the variability anduncertainty of vd for other relevant chemical species does notonly contribute to understanding the role of gaseous dry de-position on air quality but also to biogeochemical cyclingParticularly gaseous dry deposition has been shown to be amajor component in nitrogen deposition (Geddes and Mar-tin 2017 Zhang et al 2012) highlighting the potential im-portance of understanding the role of vd parameterization inmodelling regional and global nitrogen cycles
Here we have built on the recent investigations of mod-elled global mean (Hardacre et al 2015 Silva and Heald2018) and observed long-term variability (Clifton et al2017) of O3vd We are able to demonstrate the substantialimpact of vd parameterization on modelling the global meanand IAV of vd and their non-trivial potential impact on sim-ulated seasonal mean and IAV of surface ozone We demon-strate that the parameterizations with explicit dependenceon hydroclimatic variables have higher sensitivity to climatevariability than those without Lin et al (2019) likewise re-cently demonstrated the importance of accounting for wateravailability in O3 dry deposition modelling Difficulties inevaluating predictions of vd for many regions of the world(eg most of Asia and Africa) persist due to the scarcity ofmeasurements This makes a strong case for additional mea-surement and model studies of ozone dry deposition acrossdifferent timescales which would be greatly facilitated by anopen data-sharing infrastructure (eg Baldocchi et al 2001Junninen et al 2009)
wwwatmos-chem-physnet19143652019 Atmos Chem Phys 19 14365ndash14385 2019
14380 A Y H Wong et al Ozone dry deposition parameterization choice
Code availability The source code and output of the dry depositionparameterizations can be obtained by contacting the correspondingauthor (jgeddesbuedu)
Supplement The supplement related to this article is available on-line at httpsdoiorg105194acp-19-14365-2019-supplement
Author contributions AYHW and JAG developed the ideas be-hind this study formulated the methods and designed the modelexperiments AYHW wrote the dry deposition code and ran thechemical transport model simulations Data analysis was performedby AYHW with input and feedback from JAG APKT providedthe photosynthesis model code and co-supervised the dry deposi-tion code development SJS compiled the dry deposition observa-tions used for evaluation Manuscript preparation was performed byAYHW reviewed by JAG and commented edited and approved byall authors
Competing interests The authors declare that they have no conflictof interest
Acknowledgements We thank the Global Modelling and Assimila-tion Office (GMAO) at NASA Goddard Flight Center for provid-ing the MERRA-2 data Ranga Myneni for providing the GIMMSLAI3g product Petri Keronen and Ivan Mammarella for the fluxmeasurements in Hyytiaumllauml Silvano Fares and Allen Goldstein forthe flux measurements in Blodgett Forest and Leiming Zhangand Zhiyong Wu for the source code of Z03 Amos P K Tai ac-knowledges support from the Vice-Chancellor Discretionary Fund(project ID 4930744) from the Chinese University of Hong Kong(CUHK) given to the Institute of Environment Energy and Sustain-ability Sam J Silva acknowledges support provided by a NationalScience Foundation grant to C L Heald (ATM-1564495)
Financial support This work was funded by a National ScienceFoundation CAREER grant to project PI Jeffrey A Geddes (AGS-1750328)
Review statement This paper was edited by Tim Butler and re-viewed by two anonymous referees
References
Ainsworth E A and Rogers A The response of photosynthe-sis and stomatal conductance to rising [CO2] Mechanisms andenvironmental interactions Plant Cell Environ 30 258ndash270httpsdoiorg101111j1365-3040200701641x 2007
Ainsworth E A Yendrek C R Sitch S Collins W J and Em-berson L D The Effects of Tropospheric Ozone on Net Pri-mary Productivity and Implications for Climate Change Annu
Rev Plant Biol 63 637ndash661 httpsdoiorg101146annurev-arplant-042110-103829 2012
Altimir N Kolari P Tuovinen J-P Vesala T Baumlck J SuniT Kulmala M and Hari P Foliage surface ozone deposi-tion a role for surface moisture Biogeosciences 3 209ndash228httpsdoiorg105194bg-3-209-2006 2006
Ashworth K Chung S H Griffin R J Chen J ForkelR Bryan A M and Steiner A L FORest Canopy Atmo-sphere Transfer (FORCAsT) 10 a 1-D model of biospherendashatmosphere chemical exchange Geosci Model Dev 8 3765ndash3784 httpsdoiorg105194gmd-8-3765-2015 2015
Avnery S Mauzerall D L Liu J and Horowitz LW Global crop yield reductions due to surface ozoneexposure 1 Year 2000 crop production losses andeconomic damage Atmos Environ 45 2284ndash2296httpsdoiorg101016jatmosenv201011045 2011
Baldocchi D Falge E Gu L Olson R Hollinger D RunningS Anthoni P Bernhofer C Davis K Evans R FuentesJ Goldstein A Katul G Law B Lee X Malhi Y Mey-ers T Munger W Oechel W Paw U K T PilegaardK Schmid H P Valentini R Verma S Vesala T Wil-son K and Wofsy S FLUXNET A New Tool to Studythe Temporal and Spatial Variability of Ecosystem-Scale Car-bon Dioxide Water Vapor and Energy Flux Densities B AmMeteorol Soc 82 2415ndash2434 httpsdoiorg1011751520-0477(2001)082lt2415FANTTSgt23CO2 2001
Baldocchi D D Hicks B B and Camara P A canopy stomatalresistance model for gaseous deposition to vegetated surfacesAtmos Environ 21 91ndash101 httpsdoiorg1010160004-6981(87)90274-5 1987
Ball J T Woodrow I E and Berry J A A Model Predict-ing Stomatal Conductance and its Contribution to the Controlof Photosynthesis under Different Environmental Conditions inProgress in Photosynthesis Research Springer Dordrecht pp221ndash224 1987
Brook J R Zhang L Di-Giovanni F and Padro J Descrip-tion and evaluation of a model of deposition velocities for rou-tine estimates of air pollutant dry deposition over North Amer-ica Part I Model development Atmos Environ 33 5037ndash5051httpsdoiorg101016S1352-2310(99)00250-2 1999
Brown-Steiner B Selin N E Prinn R G Monier ETilmes S Emmons L and Garcia-Menendez F Maximiz-ing ozone signals among chemical meteorological and cli-matological variability Atmos Chem Phys 18 8373ndash8388httpsdoiorg105194acp-18-8373-2018 2018
Chen B Black T A Coops N C Hilker T Trofymow JA and Morgenstern K Assessing tower flux footprint cli-matology and scaling between remotely sensed and eddy co-variance measurements Bound-Lay Meteorol 130 137ndash167httpsdoiorg101007s10546-008-9339-1 2009
Chen B Coops N C Fu D Margolis H A AmiroB D Black T A Arain M A Barr A G BourqueC P A Flanagan L B Lafleur P M McCaughey JH and Wofsy S C Characterizing spatial representative-ness of flux tower eddy-covariance measurements across theCanadian Carbon Program Network using remote sensingand footprint analysis Remote Sens Environ 142 742ndash755httpsdoiorg101016jrse201206007 2012
Atmos Chem Phys 19 14365ndash14385 2019 wwwatmos-chem-physnet19143652019
A Y H Wong et al Ozone dry deposition parameterization choice 14381
Centoni F Global scale modelling of ozone deposition processesand interaction between surface ozone and climate change A the-sis presented for the degree The University of Edinburgh Univer-sity of Edinburgh 2017
Clifton O E Fiore A M Munger J W Malyshev S HorowitzL W Shevliakova E Paulot F Murray L T and Grif-fin K L Interannual variability in ozone removal by a tem-perate deciduous forest Geophys Res Lett 44 542ndash552httpsdoiorg1010022016GL070923 2017
Clifton O E Fiore A M Munger J W and WehrR Spatiotemporal Controls on Observed Daytime OzoneDeposition Velocity Over Northeastern US Forests Dur-ing Summer J Geophys Res Atmos 124 5612ndash5628doi1010292018JD029073 2019
Collatz G Ribas-Carbo M and Berry J Cou-pled Photosynthesis-Stomatal Conductance Model forLeaves of C4 Plants Aust J Plant Physiol 19 519httpsdoiorg101071PP9920519 1992
Collatz G J Ball J T Grivet C and Berry J A Phys-iological and environmental regulation of stomatal conduc-tance photosynthesis and transpiration a model that includesa laminar boundary layer Agric For Meteorol 54 107ndash136httpsdoiorg1010160168-1923(91)90002-8 1991
Dai Y Shangguan W Wei N Xin Q Yuan H Zhang S andLiu S SOIL A review of the global soil property maps for Earthsystem models Soil 5 137ndash158 httpsdoiorg105194soil-5-137-2019 2019
Ducker J A Holmes C D Keenan T F Fares S GoldsteinA H Mammarella I Munger J W and Schnell J Syn-thetic ozone deposition and stomatal uptake at flux tower sitesBiogeosciences 15 5395ndash5413 httpsdoiorg105194bg-15-5395-2018 2018
Emberson L D Wieser G and Ashmore M R Modelling ofstomatal conductance and ozone flux of Norway spruce Com-parison with field data Environ Pollut 109 393ndash402 2000
Fang H Li W and Myneni R B The impact of potentialland cover misclassification on modis leaf area index (LAI) es-timation A statistical perspective Remote Sens 5 830ndash844httpsdoiorg103390rs5020830 2013
Fares S McKay M Holzinger R and Goldstein A HOzone fluxes in a Pinus ponderosa ecosystem are dominatedby non-stomatal processes Evidence from long-term con-tinuous measurements Agric For Meteorol 150 420ndash431httpsdoiorg101016jagrformet201001007 2010
Fares S Savi F Muller J Matteucci G and Paoletti E Simul-taneous measurements of above and below canopy ozone fluxeshelp partitioning ozone deposition between its various sinks in aMediterranean Oak Forest Agric For Meteorol 198 181ndash191httpsdoiorg101016jagrformet201408014 2014
Fares S Conte A and Chabbi A Ozone flux in plant ecosys-tems new opportunities for long-term monitoring networks todeliver ozone-risk assessments Environ Sci Pollut Res 258240ndash8248 httpsdoiorg101007s11356-017-0352-0 2017
Farquhar G D Von Caemmerer S and Berry J AA Biochemical Model of Photosynthetic CO2 Assim-ilation in Leaves of C3 Species Planta 149 78ndash90httpsdoiorg101007BF00386231 1980
Fiore A M Oberman J T Lin M Y Zhang L Clifton O EJacob D J Naik V Horowitz L W Pinto J P and Milly
G P Estimating North American background ozone in US sur-face air with two independent global models Variability uncer-tainties and recommendations Atmos Environ 96 284ndash300httpsdoiorg101016jatmosenv201407045 2014
Foken T 50 years of the Monin-Obukhov similar-ity theory Bound-Lay Meteorol 119 431ndash447httpsdoiorg101007s10546-006-9048-6 2006
Fowler D Nemitz E Misztal P di Marco C Skiba U RyderJ Helfter C Neil Cape J Owen S Dorsey J Gallagher MW Coyle M Phillips G Davison B Langford B MacKen-zie R Muller J Siong J Dari-Salisburgo C di Carlo PAruffo E Giammaria F Pyle J A and Nicholas Hewitt CEffects of land use on surface-atmosphere exchanges of tracegases and energy in Borneo Comparing fluxes over oil palmplantations and a rainforest Philos Trans R Soc B Biol Sci366 3196ndash3209 httpsdoiorg101098rstb20110055 2011
Franks P J Adams M A Amthor J S Barbour M M Berry JA Ellsworth D S Farquhar G D Ghannoum O Lloyd JMcDowell N Norby R J Tissue D T and von CaemmererS Sensitivity of plants to changing atmospheric CO2 concentra-tion From the geological past to the next century New Phytol197 1077ndash1094 httpsdoiorg101111nph12104 2013
Fu Y and Tai A P K Impact of climate and land cover changeson tropospheric ozone air quality and public health in East Asiabetween 1980 and 2010 Atmos Chem Phys 15 10093ndash10106httpsdoiorg105194acp-15-10093-2015 2015
Ganzeveld L Bouwman L Stehfest E van Vuuren DP Eickhout B and Lelieveld J Impact of future landuse and land cover changes on atmospheric chemistry-climate interactions J Geophys Res 115 D23301httpsdoiorg1010292010JD014041 2010
Geddes J A and Martin R V Global deposition of total reac-tive nitrogen oxides from 1996 to 2014 constrained with satelliteobservations of NO2 columns Atmos Chem Phys 17 10071ndash10091 httpsdoiorg105194acp-17-10071-2017 2017
Geddes J A Heald C L Silva S J and Martin R V Landcover change impacts on atmospheric chemistry simulating pro-jected large-scale tree mortality in the United States AtmosChem Phys 16 2323ndash2340 httpsdoiorg105194acp-16-2323-2016 2016
Gelaro R McCarty W Suaacuterez M J Todling R Molod ATakacs L Randles C A Darmenov A Bosilovich M G Re-ichle R Wargan K Coy L Cullather R Draper C AkellaS Buchard V Conaty A da Silva A M Gu W Kim GK Koster R Lucchesi R Merkova D Nielsen J E Par-tyka G Pawson S Putman W Rienecker M Schubert SD Sienkiewicz M and Zhao B The modern-era retrospectiveanalysis for research and applications version 2 (MERRA-2)J Climate 30 5419ndash5454 httpsdoiorg101175JCLI-D-16-07581 2017
Gerosa G Vitale M Finco A Manes F Denti A B andCieslik S Ozone uptake by an evergreen Mediterranean Forest(Quercus ilex) in Italy Part I Micrometeorological flux measure-ments and flux partitioning Atmos Environ 39 3255ndash3266httpsdoiorg101016jatmosenv200501056 2005
Gerosa G Marzuoli R Monteleone B Chiesa M and FincoA Vertical ozone gradients above forests Comparison of differ-ent calculation options with direct ozone measurements above
wwwatmos-chem-physnet19143652019 Atmos Chem Phys 19 14365ndash14385 2019
14382 A Y H Wong et al Ozone dry deposition parameterization choice
a mature forest and consequences for ozone risk assessmentForests 8 httpsdoiorg103390f8090337 2017
Hardacre C Wild O and Emberson L An evaluation of ozonedry deposition in global scale chemistry climate models At-mos Chem Phys 15 6419ndash6436 httpsdoiorg105194acp-15-6419-2015 2015
Heald C L and Geddes J A The impact of historicalland use change from 1850 to 2000 on secondary particu-late matter and ozone Atmos Chem Phys 16 14997ndash15010httpsdoiorg105194acp-16-14997-2016 2016
Hollaway M J Arnold S R Collins W J Folberth Gand Rap A Sensitivity of midnineteenth century tro-pospheric ozone to atmospheric chemistry-vegetationinteractions J Geophys Res-Atmos 122 2452ndash2473httpsdoiorg1010022016JD025462 2017
Hoshika Y Carriero G Feng Z Zhang Y and PaolettiE Determinants of stomatal sluggishness in ozone-exposeddeciduous tree species Sci Total Environ 481 453ndash458httpsdoiorg101016jscitotenv201402080 2014
Hu L Jacob D J Liu X Zhang Y Zhang L KimP S Sulprizio M P and Yantosca R M Globalbudget of tropospheric ozone Evaluating recent modeladvances with satellite (OMI) aircraft (IAGOS) andozonesonde observations Atmos Environ 167 323ndash334httpsdoiorg101016jatmosenv201708036 2017
Huang L McDonald-Buller E C McGaughey G Kimura Yand Allen D T The impact of drought on ozone dry de-position over eastern Texas Atmos Environ 127 176ndash186httpsdoiorg101016jatmosenv201512022 2016
Jacob D J and Wofsy S C Budgets of Reactive Nitro-gen Hydrocarbons and Ozone Over the Amazon Forest dur-ing the Wet Season J Geophys Res 95 16737ndash16754httpsdoiorg101029JD095iD10p16737 1990
Jacob D J Fan S-M Wofsy S C Spiro P A Bakwin P SRitter J A Browell E V Gregory G L Fitzjarrald D R andMoore K E Deposition of ozone to tundra J Geophys Res97 httpsdoiorg10102991JD02696 1992
Jarvis P G The Interpretation of the Variations in Leaf Wa-ter Potential and Stomatal Conductance Found in Canopies inthe Field Philos Trans R Soc B Biol Sci 273 593ndash610httpsdoiorg101098rstb19760035 1976
Jerrett M Burnett R T Pope C A Ito K Thurston GKrewski D Shi Y Calle E and Thun M Long-Term OzoneExposure and Mortality N Engl J Med 360 1085ndash1095httpsdoiorg101056NEJMoa0803894 2009
Jiang C Ryu Y Fang H Myneni R Claverie M and Zhu ZInconsistencies of interannual variability and trends in long-termsatellite leaf area index products Glob Chang Biol 23 4133ndash4146 httpsdoiorg101111gcb13787 2017
Junninen H Lauri A Keronen P Aalto P Hiltunen V Hari Pand Kulmala M Smart-SMEAR On-line data exploration andvisualization tool for SMEAR stations Boreal Environ Res 14447ndash457 2009
Kattge J and Knorr W Temperature acclimation in a bio-chemical model of photosynthesis A reanalysis of datafrom 36 species Plant Cell Environ 30 1176ndash1190httpsdoiorg101111j1365-3040200701690x 2007
Kavassalis S C and Murphy J G Understand-ing ozone-meteorology correlations A role for dry
deposition Geophys Res Lett 44 2922ndash2931httpsdoiorg1010022016GL071791 2017
Keeling C D Stephen C Piper S C Bacastow R B WahlenM Whorf T P Heimann M and Meijer H A Exchanges ofatmospheric CO2 and 13CO2 with the terrestrial biosphere andoceans from 1978 to 2000 Glob Asp SIO Ref Ser Scripps InstOcean San Diego httpsdoiorg101007b138533 2001
Keronen P Reissell a Rannik Uuml Pohja T Siivola E HiltunenV Hari P Kulmala M and Vesala T Ozone flux mea-surements over a Scots pine forest using eddy covariancemethod Performance evaluation and comparison with flux-profile method Boreal Environ Res 8 425ndash443 2003
Kharol S K Shephard M W Mclinden C A Zhang L SiorisC E OrsquoBrien J M Vet R Cady-Pereira K E Hare ESiemons J and Krotkov N A Dry Deposition of Reactive Ni-trogen From Satellite Observations of Ammonia and NitrogenDioxide Over North America Geophys Res Lett 45 1157ndash1166 httpsdoiorg1010022017GL075832 2018
Lamaud E Carrara A Brunet Y Lopez A and Druil-het A Ozone fluxes above and within a pine forest canopyin dry and wet conditions Atmos Environ 36 77ndash88httpsdoiorg101016S1352-2310(01)00468-X 2002
Lawrence P J and Chase T N Representing a newMODIS consistent land surface in the Community LandModel (CLM 30) J Geophys Res-Biogeo 112 G01023httpsdoiorg1010292006JG000168 2007
Li D Bou-Zeid E Barlage M Chen F and Smith J A De-velopment and evaluation of a mosaic approach in the WRF-Noah framework J Geophys Res-Atmos 118 11918ndash11935httpsdoiorg1010022013JD020657 2013
Lin Y Medlyn B and Duursma R Optimal stomatalbehaviour around the world Nat Clim 5 459ndash464httpsdoiorg101038NCLIMATE2550 2015
Lin M Malyshev S Shevliakova E Paulot F Horowitz L WFares S Mikkelsen T N and Zhang L Sensitivity of ozonedry deposition to ecosystem-atmosphere interactions A criticalappraisal of observations and simulations Global BiogeochemCy 3 httpsdoiorg1010292018GB006157 2019
Lombardozzi D Sparks J P Bonan G and Levis S Ozoneexposure causes a decoupling of conductance and photosynthe-sis Implications for the Ball-Berry stomatal conductance modelOecologia 169 651ndash659 httpsdoiorg101007s00442-011-2242-3 2012
Lombardozzi D Levis S Bonan G Hess P G andSparks J P The influence of chronic ozone exposure onglobal carbon and water cycles J Climate 28 292ndash305httpsdoiorg101175JCLI-D-14-002231 2015
Malhi Y Roberts J T Betts R A Killeen T JLi W and Nobre C A Climate change deforesta-tion and the fate of the Amazon Science 319 169ndash172httpsdoiorg101126science1146961 2008
Mao J Paulot F Jacob D J Cohen R C CrounseJ D Wennberg P O Keller C A Hudman R CBarkley M P and Horowitz L W Ozone and organicnitrates over the eastern United States Sensitivity to iso-prene chemistry J Geophys Res-Atmos 118 11256ndash11268httpsdoiorg101002jgrd50817 2013
Matsuda K Watanabe I Wingpud V Theramongkol PKhummongkol P Wangwongwatana S and Totsuka T
Atmos Chem Phys 19 14365ndash14385 2019 wwwatmos-chem-physnet19143652019
A Y H Wong et al Ozone dry deposition parameterization choice 14383
Ozone dry deposition above a tropical forest in the dry sea-son in northern Thailand Atmos Environ 39 2571ndash2577httpsdoiorg101016jatmosenv200501011 2005
McGrath J M Betzelberger A M Wang S Shook E ZhuX-G Long S P and Ainsworth E A An analysis ofozone damage to historical maize and soybean yields in theUnited States P Natl Acad Sci USA 112 14390ndash14395httpsdoiorg101073pnas1509777112 2015
Meyers T P Finkelstein P Clarke J Ellestad T G and SimsP F A multilayer model for inferring dry deposition usingstandard meteorological measurements J Geophys Res 10322645 httpsdoiorg10102998JD01564 1998
Muller J B A Percival C J Gallagher M W Fowler DCoyle M and Nemitz E Sources of uncertainty in eddy co-variance ozone flux measurements made by dry chemilumines-cence fast response analysers Atmos Meas Tech 3 163ndash176httpsdoiorg105194amt-3-163-2010 2010
Munger J W Wofsy S C Bakwin P S Fan S-M GouldenM L Daube B C Goldstein A H Moore K E and Fitz-jarrald D R Atmospheric deposition of reactive nitrogen ox-ides and ozone in a temperate deciduous forest and a subarcticwoodland 1 Measurements and mechanisms J Geophys Res101657 639ndash712 httpsdoiorg10102996JD00230 1996
Myneni R B Hoffman S Knyazikhin Y Privette J L GlassyJ Tian Y Wang Y Song X Zhang Y Smith G R LotschA Friedl M Morisette J T Votava P Nemani R R andRunning S W Global products of vegetation leaf area andfraction absorbed PAR from year one of MODIS data RemoteSens Environ 83 214ndash231 httpsdoiorg101016S0034-4257(02)00074-3 2002
Norby R J and Zak D R Ecological Lessons from Free-Air CO2Enrichment (FACE) Experiments Annu Rev Ecol Evol Syst42 181ndash203 httpsdoiorg101146annurev-ecolsys-102209-144647 2011
Nowlan C R Martin R V Philip S Lamsal L N Krotkov NA Marais E A Wang S and Zhang Q Global dry deposi-tion of nitrogen dioxide and sulfur dioxide inferred from space-based measurements Global Biogeochem Cy 28 1025ndash1043httpsdoiorg1010022014GB004805 2014
Oleson K W Lawrence D M Bonan G B Drewniak BHuang M Koven C D Levis S Li F Riley W J SubinZ M Swenson S C Thornton P E Bozbiyik A FisherR Heald C L Kluzek E Lamarque J-F Lawrence PJ Leung L R Lipscomb W Muszala S Ricciuto D MSacks W Sun Y Tang J and Yang Z-L Technical De-scription of version 45 of the Community Land Model (CLM)NCARTN-478+STR NCAR Tech Note (April) NCARTN-503+STR httpsdoiorg105065D6RR1W7M 2013
Olson D M Dinerstein E Wikramanayake E D BurgessN D Powell G V N Underwood E C Drsquoamico JA Itoua I Strand H E Morrison J C Loucks CJ Allnutt T F Ricketts T H Kura Y Lamoreux JF Wettengel W W Hedao P and Kassem K R Ter-restrial Ecoregions of the World A New Map of Life onEarth Bioscience 51 933ndash938 httpsdoiorg1016410006-3568(2001)051[0933TEOTWA]20CO2 2001
Paulson C A The Mathematical Representation ofWind Speed and Temperature Profiles in the Un-stable Atmospheric Surface Layer J Appl Me-
teorol 9 857ndash861 httpsdoiorg1011751520-0450(1970)009lt0857tmrowsgt20co2 1970
Pleim J and Ran L Surface flux modeling for airquality applications Atmosphere (Basel) 2 271ndash302httpsdoiorg103390atmos2030271 2011
Potier E Ogeacutee J Jouanguy J Lamaud E Stella P PersonneE Durand B Mascher N and Loubet B Multilayer mod-elling of ozone fluxes on winter wheat reveals large depositionon wet senescing leaves Agric For Meteorol 211ndash212 58ndash71httpsdoiorg101016jagrformet201505006 2015
Potier E Loubet B Durand B Flura D Bourdat-DeschampsM Ciuraru R and Ogeacutee J Chemical reaction rates ofozone in water infusions of wheat beech oak and pineleaves of different ages Atmos Environ 151 176ndash187httpsdoiorg101016jatmosenv201611069 2017
R core team R A language and environment for statistical com-puting R Found Stat Comput Vienna Austria available athttpwwwR-projectorg (last access 25 July 2019) 2017
Ran L Pleim J Song C Band L Walker J T and BinkowskiF S A photosynthesis-based two-leaf canopy stomatal con-ductance model for meteorology and air quality modeling withWRFCMAQ PX LSM J Geophys Res 122 1930ndash1952httpsdoiorg1010022016JD025583 2017a
Ran L Pleim J Song C Band L Walker J T and BinkowskiF S A photosynthesis-based two-leaf canopy stomatal con-ductance model for meteorology and air quality modeling withWRFCMAQ PX LSM J Geophys Res 122 1930ndash1952httpsdoiorg1010022016JD025583 2017b
Rannik Uuml Altimir N Mammarella I Baumlck J Rinne J Ru-uskanen T M Hari P Vesala T and Kulmala M Ozonedeposition into a boreal forest over a decade of observationsevaluating deposition partitioning and driving variables AtmosChem Phys 12 12165ndash12182 httpsdoiorg105194acp-12-12165-2012 2012
Reich P B Quantifying plant response to ozone a unifying theoryTree Physiol 3 63ndash91 httpsdoiorg101093treephys31631987
Rienecker M M Suarez M J Todling R Bacmeister J TakacsL Liu H-C Gu W Sienkiewicz M Koster R D GelaroR Stajner I and Nielsen E The GEOS-5 Data AssimilationSystem ndash Documentation of versions 501 and 510 and 520NASA Tech Rep Ser Glob Model Data Assim NASATM-2008-104606 httpsdoiorg10275932049 2008
Rigden A J and Salvucci G D Stomatal response to humidityand CO2 implicated in recent decline in US evaporation GlobChang Biol 23 1140ndash1151 httpsdoiorg101111gcb134392017
Rummel U Ammann C Kirkman G A Moura M A L Fo-ken T Andreae M O and Meixner F X Seasonal variation ofozone deposition to a tropical rain forest in southwest AmazoniaAtmos Chem Phys 7 5415ndash5435 httpsdoiorg105194acp-7-5415-2007 2007
Sadiq M Tai A P K Lombardozzi D and Val Martin M Ef-fects of ozonendashvegetation coupling on surface ozone air qual-ity via biogeochemical and meteorological feedbacks AtmosChem Phys 17 3055ndash3066 httpsdoiorg105194acp-17-3055-2017 2017
Sanderson M G Collins W J Hemming D L and Betts R AStomatal conductance changes due to increasing carbon diox-
wwwatmos-chem-physnet19143652019 Atmos Chem Phys 19 14365ndash14385 2019
14384 A Y H Wong et al Ozone dry deposition parameterization choice
ide levels Projected impact on surface ozone levels Tellus B59 404ndash411 httpsdoiorg101111j1600-0889200700277x2007
Sen P K Estimates of the Regression Coefficient Basedon Kendallrsquos Tau J Am Stat Assoc 63 1379ndash1389httpsdoiorg10108001621459196810480934 1968
Silva S J and Heald C L Investigating Dry Deposition ofOzone to Vegetation J Geophys Res-Atmos 123 559ndash573httpsdoiorg1010022017JD027278 2018
Simpson D Benedictow A Berge H Bergstroumlm R Em-berson L D Fagerli H Flechard C R Hayman G DGauss M Jonson J E Jenkin M E Nyiacuteri A RichterC Semeena V S Tsyro S Tuovinen J-P Valdebenito Aacuteand Wind P The EMEP MSC-W chemical transport modelndash technical description Atmos Chem Phys 12 7825ndash7865httpsdoiorg105194acp-12-7825-2012 2012
Sitch S Cox P M Collins W J and Huntingford CIndirect radiative forcing of climate change through ozoneeffects on the land-carbon sink Nature 448 791ndash794httpsdoiorg101038nature06059 2007
Sun S Moravek A Trebs I Kesselmeier J and SoumlrgelM Investigation of the influence of liquid surface filmson O3 and PAN deposition to plant leaves coated with or-ganicinorganic solution J Geophys Res-Atmos 121 14239ndash14256 httpsdoiorg1010022016JD025519 2016
Sun Y Gu L and Dickinson R E A numerical is-sue in calculating the coupled carbon and water fluxesin a climate model J Geophys Res-Atmos 117httpsdoiorg1010292012JD018059 2012
Tai A P K Martin M V and Heald C L Threat tofuture global food security from climate change andozone air pollution Nat Clim Change 4 817ndash821httpsdoiorg101038nclimate2317 2014
Travis K R Jacob D J Fisher J A Kim P S Marais E AZhu L Yu K Miller C C Yantosca R M Sulprizio MP Thompson A M Wennberg P O Crounse J D St ClairJ M Cohen R C Laughner J L Dibb J E Hall S RUllmann K Wolfe G M Pollack I B Peischl J Neuman JA and Zhou X Why do models overestimate surface ozone inthe Southeast United States Atmos Chem Phys 16 13561ndash13577 httpsdoiorg105194acp-16-13561-2016 2016
Val Martin M Heald C L and Arnold S R Cou-pling dry deposition to vegetation phenology in the Com-munity Earth System Model Implications for the simula-tion of surface O3 Geophys Res Lett 41 2988ndash2996httpsdoiorg1010022014GL059651 2014
Wang Y Jacob D J and Logan J A Global simulationof tropospheric O3-NOx -hydrocarbon chemistry 1 Modelformulation J Geophys Res-Atmos 103 10713ndash10725httpsdoiorg10102998JD00158 1998
Wesely M L Parameterization of surface resistances to gaseousdry deposition in regional-scale numerical models Atmos Envi-ron 41 52ndash63 httpsdoiorg101016jatmosenv2007100581989
Wesely M L and Hicks B B Some Factors that Affectthe Deposition Rates of Sulfur Dioxide and Similar Gaseson Vegetation J Air Pollut Control Assoc 27 1110ndash1116httpsdoiorg10108000022470197710470534 1977
Wesely M L and Hicks B B A review of the current status ofknowledge on dry deposition Atmos Environ 34 2261ndash2282httpsdoiorg101016S1352-2310(99)00467-7 2000
Wild O Modelling the global tropospheric ozone budget explor-ing the variability in current models Atmos Chem Phys 72643ndash2660 httpsdoiorg105194acp-7-2643-2007 2007
Wittig V E Ainsworth E A and Long S P To what ex-tent do current and projected increases in surface ozone af-fect photosynthesis and stomatal conductance of trees A meta-analytic review of the last 3 decades of experiments PlantCell Environ 30 1150ndash1162 httpsdoiorg101111j1365-3040200701717x 2007
Wolfe G M Thornton J A McKay M and Goldstein AH Forest-atmosphere exchange of ozone sensitivity to veryreactive biogenic VOC emissions and implications for in-canopy photochemistry Atmos Chem Phys 11 7875ndash7891httpsdoiorg105194acp-11-7875-2011 2011
Wong A Y H Tai A P K and Ip Y-Y Attributionand Statistical Parameterization of the Sensitivity of SurfaceOzone to Changes in Leaf Area Index Based On a ChemicalTransport Model J Geophys Res-Atmos 123 1883ndash1898httpsdoiorg1010022017JD027311 2018
Wu S Mickley L J Kaplan J O and Jacob D J Impacts ofchanges in land use and land cover on atmospheric chemistry andair quality over the 21st century Atmos Chem Phys 12 1597ndash1609 httpsdoiorg105194acp-12-1597-2012 2012
Wu Z Wang X Chen F Turnipseed A A Guenther A BNiyogi D Charusombat U Xia B William Munger J andAlapaty K Evaluating the calculated dry deposition veloci-ties of reactive nitrogen oxides and ozone from two commu-nity models over a temperate deciduous forest Atmos Environ45 2663ndash2674 httpsdoiorg101016jatmosenv2011020632011
Wu Z Staebler R Vet R and Zhang L Dry depositionof O3 and SO2 estimated from gradient measurements abovea temperate mixed forest Environ Pollut 210 202ndash210httpsdoiorg101016jenvpol201511052 2016
Wu Z Schwede D B Vet R Walker J T Shaw MStaebler R and Zhang L Evaluation and intercompari-son of five North American dry deposition algorithms at amixed forest site J Adv Model Earth Syst 10 1571ndash1586httpsdoiorg1010292017MS001231 2018
Wu Z Y Zhang L Wang X M and Munger J W A modi-fied micrometeorological gradient method for estimating O3 drydepositions over a forest canopy Atmos Chem Phys 15 7487ndash7496 httpsdoiorg105194acp-15-7487-2015 2015
Young P J Archibald A T Bowman K W Lamarque J-FNaik V Stevenson D S Tilmes S Voulgarakis A Wild OBergmann D Cameron-Smith P Cionni I Collins W J Dal-soslashren S B Doherty R M Eyring V Faluvegi G HorowitzL W Josse B Lee Y H MacKenzie I A Nagashima TPlummer D A Righi M Rumbold S T Skeie R B Shin-dell D T Strode S A Sudo K Szopa S and Zeng G Pre-industrial to end 21st century projections of tropospheric ozonefrom the Atmospheric Chemistry and Climate Model Intercom-parison Project (ACCMIP) Atmos Chem Phys 13 2063ndash2090 httpsdoiorg105194acp-13-2063-2013 2013
Yu S Eder B Dennis R Chu S-H and Schwartz S E Newunbiased symmetric metrics for evaluation of air quality mod-
Atmos Chem Phys 19 14365ndash14385 2019 wwwatmos-chem-physnet19143652019
A Y H Wong et al Ozone dry deposition parameterization choice 14385
els Atmos Sci Lett 7 26ndash34 httpsdoiorg101002asl1252006
Zhang L Moran M D and Brook J R A comparison of mod-els to estimate in-canopy photosynthetically active radiation andtheir influence on canopy stomatal resistance Atmos Environ35 4463ndash4470 httpsdoiorg101016S1352-2310(01)00225-4 2001
Zhang L Brook J R and Vet R On ozone dry deposition -With emphasis on non-stomatal uptake and wet canopies At-mos Environ 36 4787ndash4799 httpsdoiorg101016S1352-2310(02)00567-8 2002
Zhang L Brook J R and Vet R A revised parameterizationfor gaseous dry deposition in air-quality models Atmos ChemPhys 3 2067ndash2082 httpsdoiorg105194acp-3-2067-20032003
Zhang L Vet R OrsquoBrien J M Mihele C Liang Z andWiebe A Dry deposition of individual nitrogen species ateight Canadian rural sites J Geophys Res-Atmos 114httpsdoiorg1010292008JD010640 2009
Zhang L Jacob D J Liu X Logan J A Chance K Elder-ing A and Bojkov B R Intercomparison methods for satellitemeasurements of atmospheric composition application to tro-pospheric ozone from TES and OMI Atmos Chem Phys 104725ndash4739 httpsdoiorg105194acp-10-4725-2010 2010
Zhang L Jacob D J Knipping E M Kumar N MungerJ W Carouge C C van Donkelaar A Wang Y X andChen D Nitrogen deposition to the United States distributionsources and processes Atmos Chem Phys 12 4539ndash4554httpsdoiorg105194acp-12-4539-2012 2012
Zhou P Ganzeveld L Rannik Uuml Zhou L Gierens RTaipale D Mammarella I and Boy M Simulating ozonedry deposition at a boreal forest with a multi-layer canopydeposition model Atmos Chem Phys 17 1361ndash1379httpsdoiorg105194acp-17-1361-2017 2017
Zhou S S Tai A P K Sun S Sadiq M Heald C L and Ged-des J A Coupling between surface ozone and leaf area indexin a chemical transport model strength of feedback and implica-tions for ozone air quality and vegetation health Atmos ChemPhys 18 14133ndash14148 httpsdoiorg105194acp-18-14133-2018 2018
Zhu Z Bi J Pan Y Ganguly S Anav A Xu L Samanta APiao S Nemani R R and Myneni R B Global data sets ofvegetation leaf area index (LAI)3g and fraction of photosynthet-ically active radiation (FPAR)3g derived from global inventorymodeling and mapping studies (GIMMS) normalized differencevegetation index (NDVI3G) for the period 1981 to 2 RemoteSens 5 927ndash948 httpsdoiorg103390rs5020927 2013
Zhu Z Piao S Myneni R B Huang M Zeng Z CanadellJ G Ciais P Sitch S Friedlingstein P Arneth A CaoC Cheng L Kato E Koven C Li Y Lian X Liu YLiu R Mao J Pan Y Peng S Pentildeuelas J Poulter BPugh T A M Stocker B D Viovy N Wang X WangY Xiao Z Yang H Zaehle S and Zeng N Greeningof the Earth and its drivers Nat Clim Change 6 791ndash795httpsdoiorg101038nclimate3004 2016
wwwatmos-chem-physnet19143652019 Atmos Chem Phys 19 14365ndash14385 2019
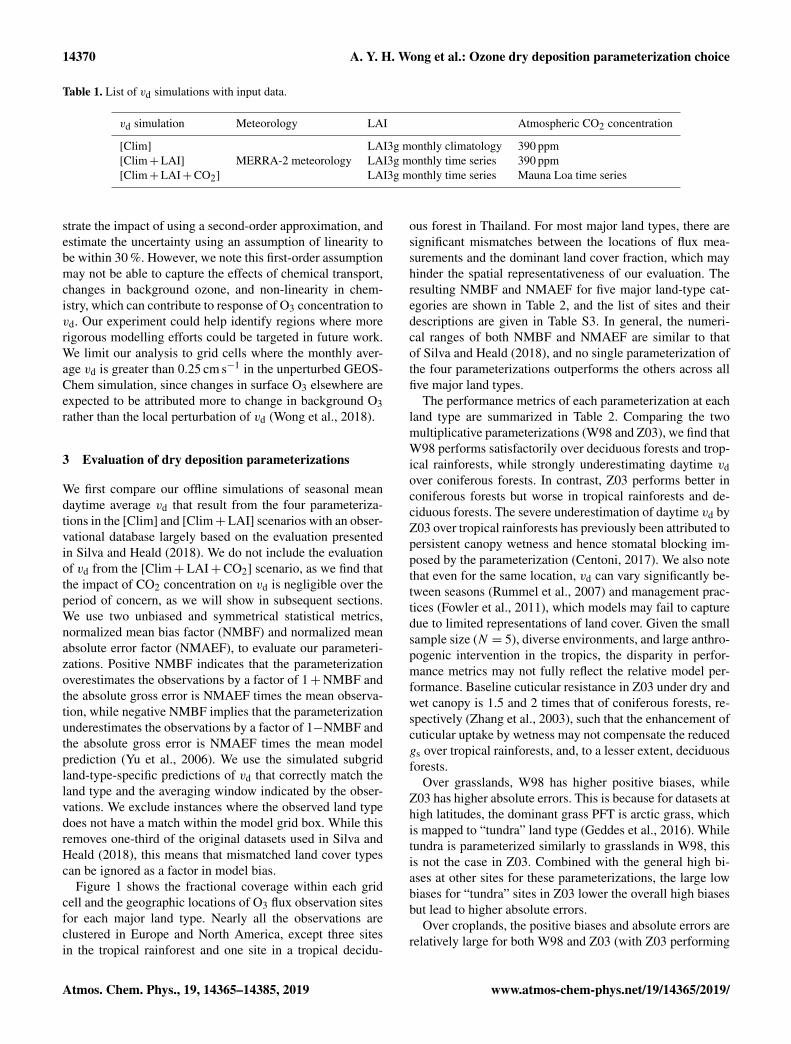
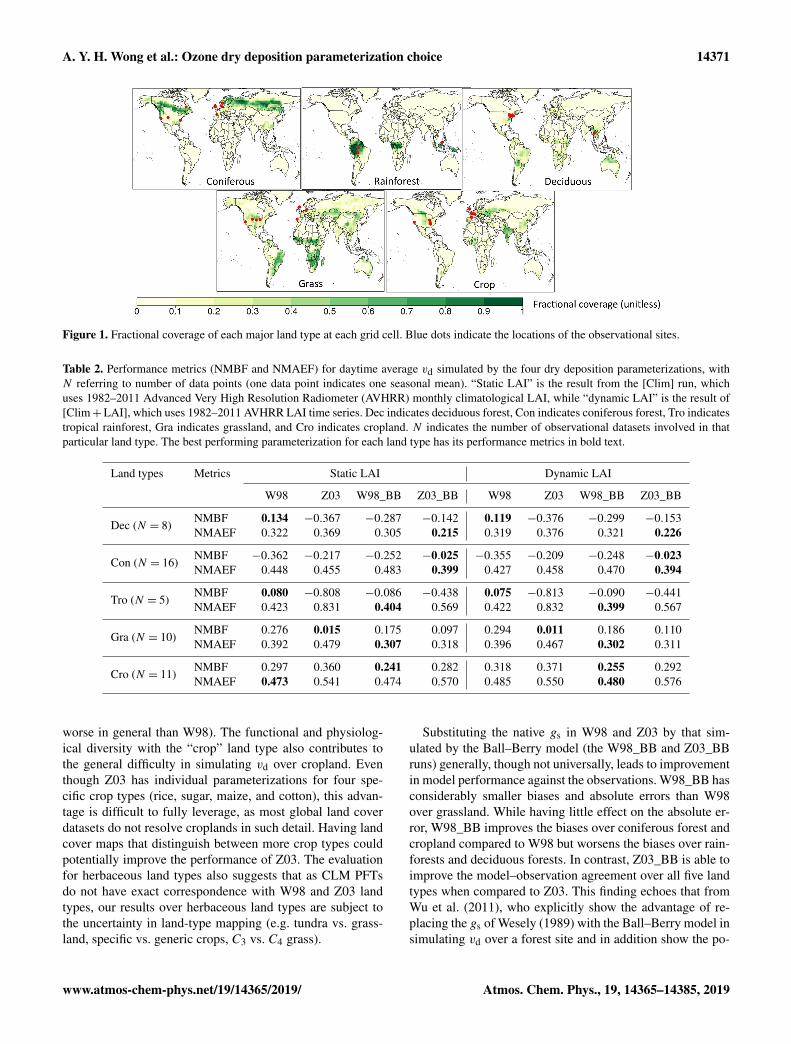
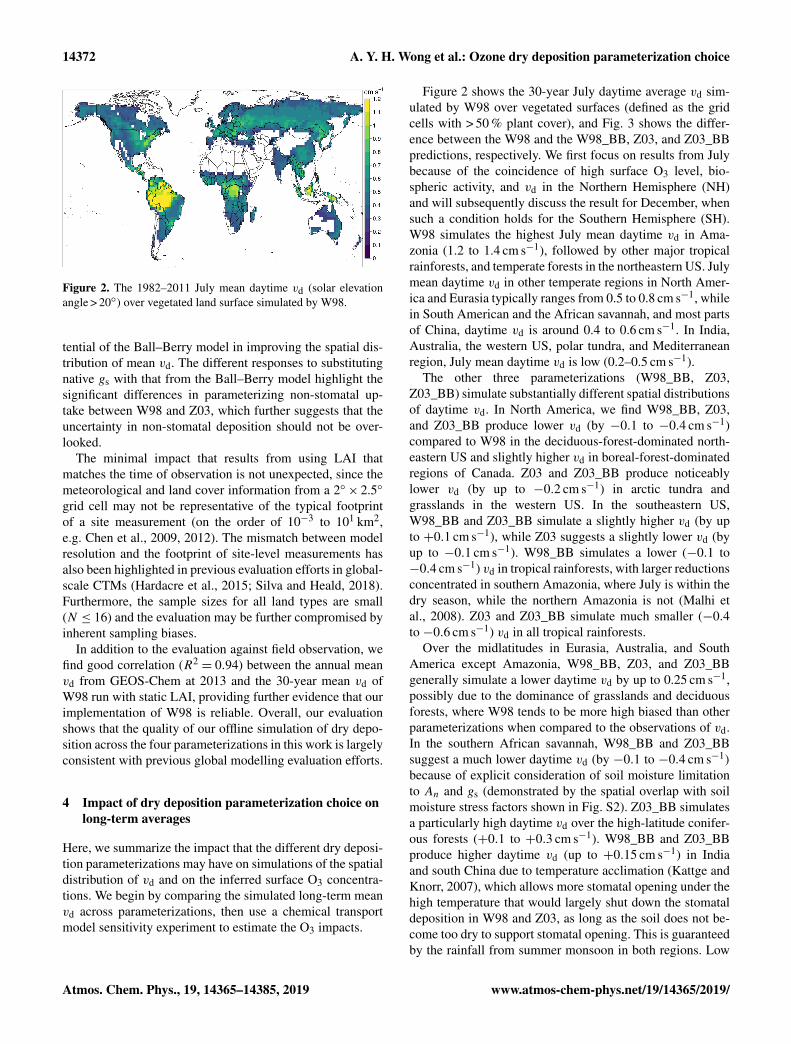
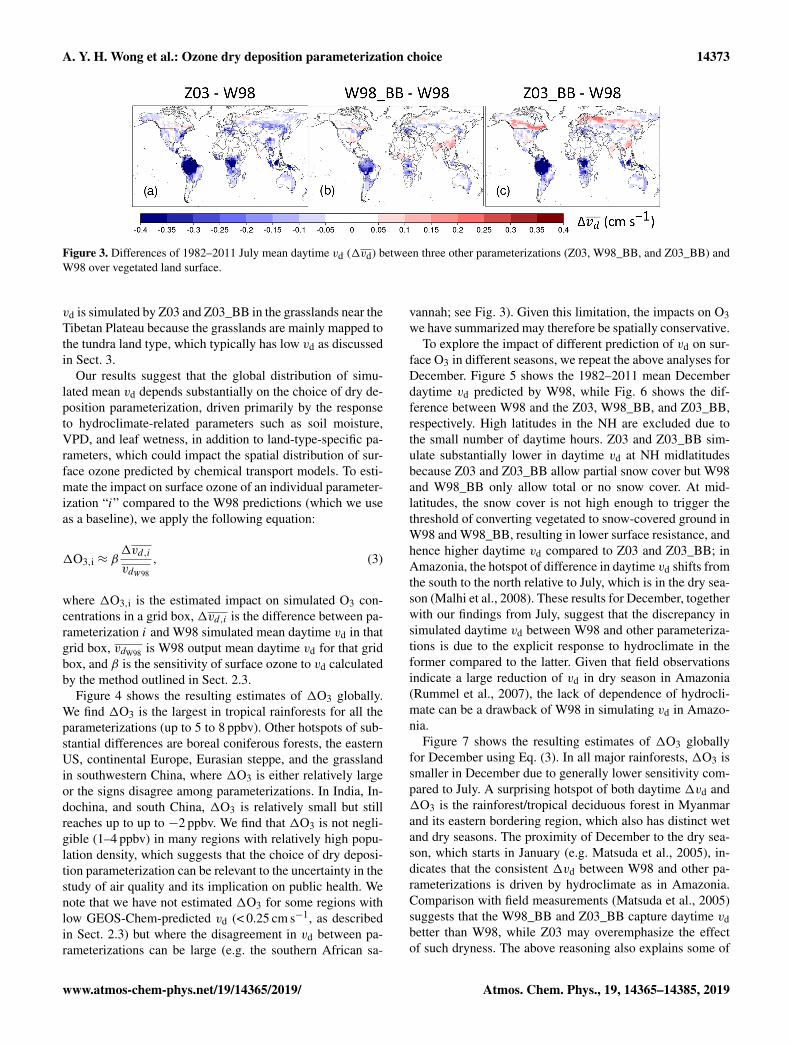
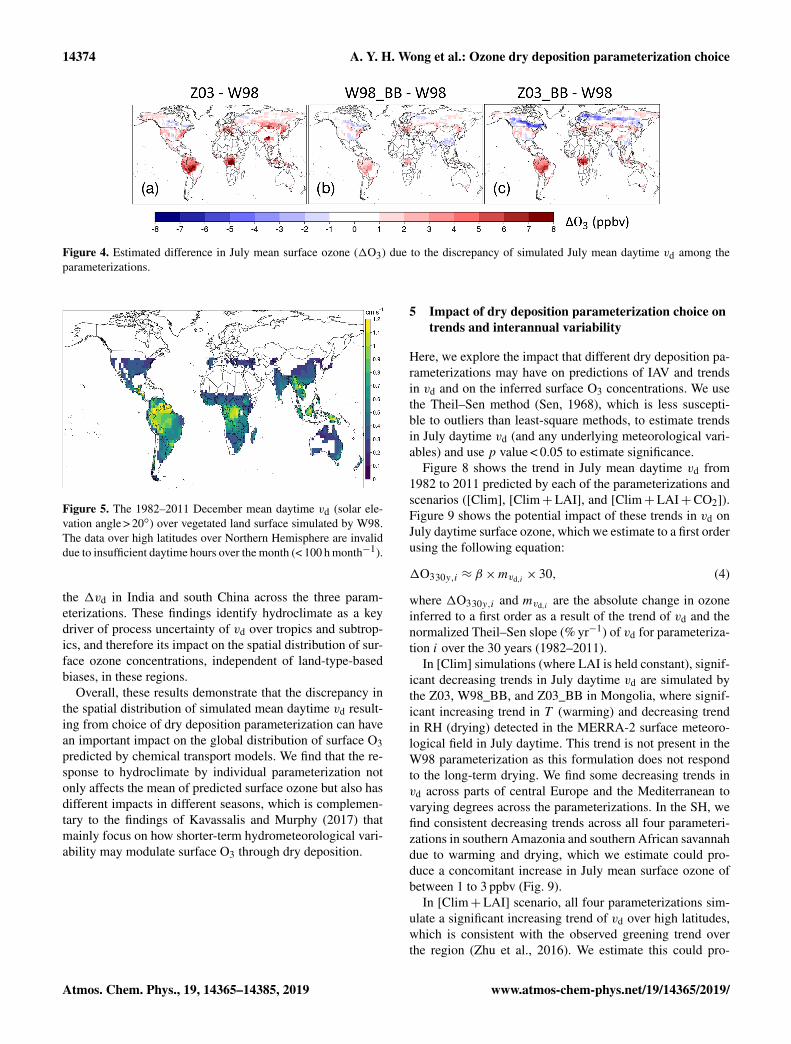
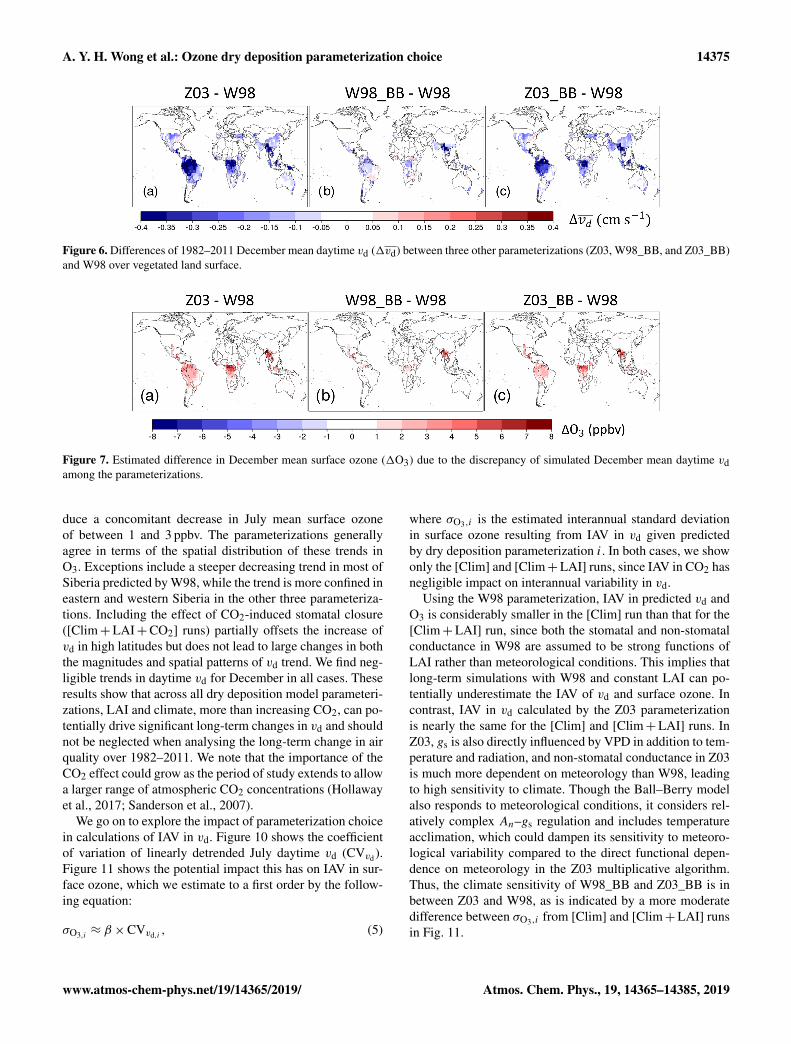
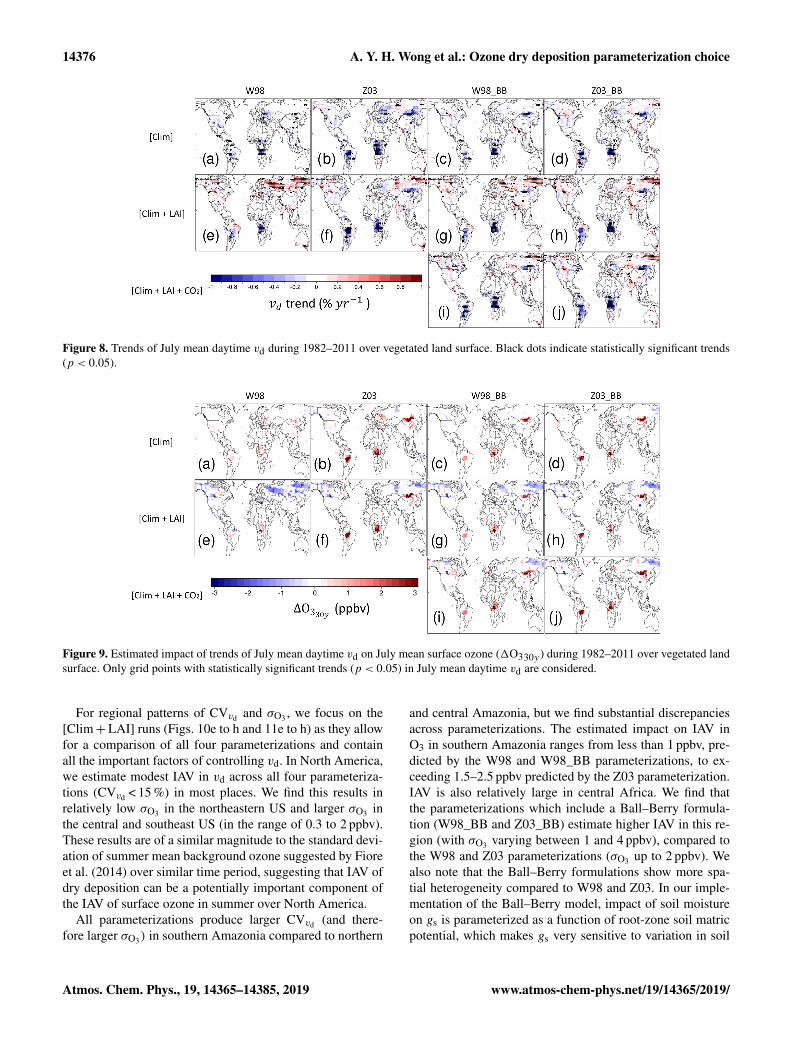
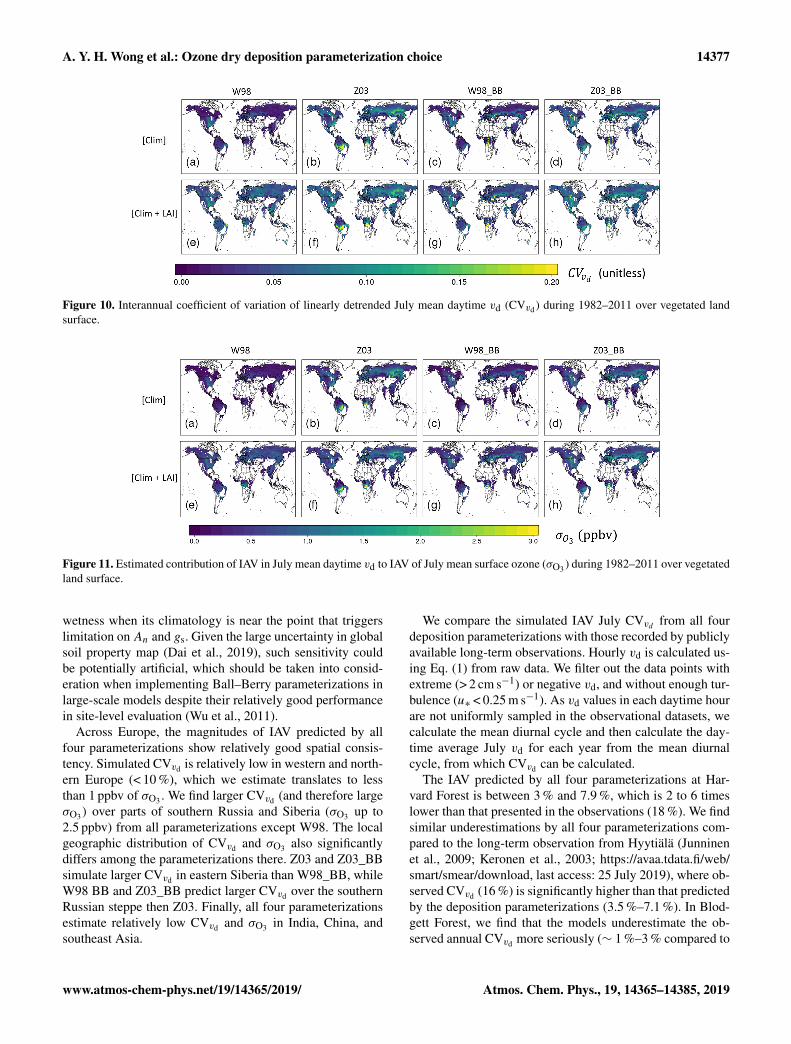
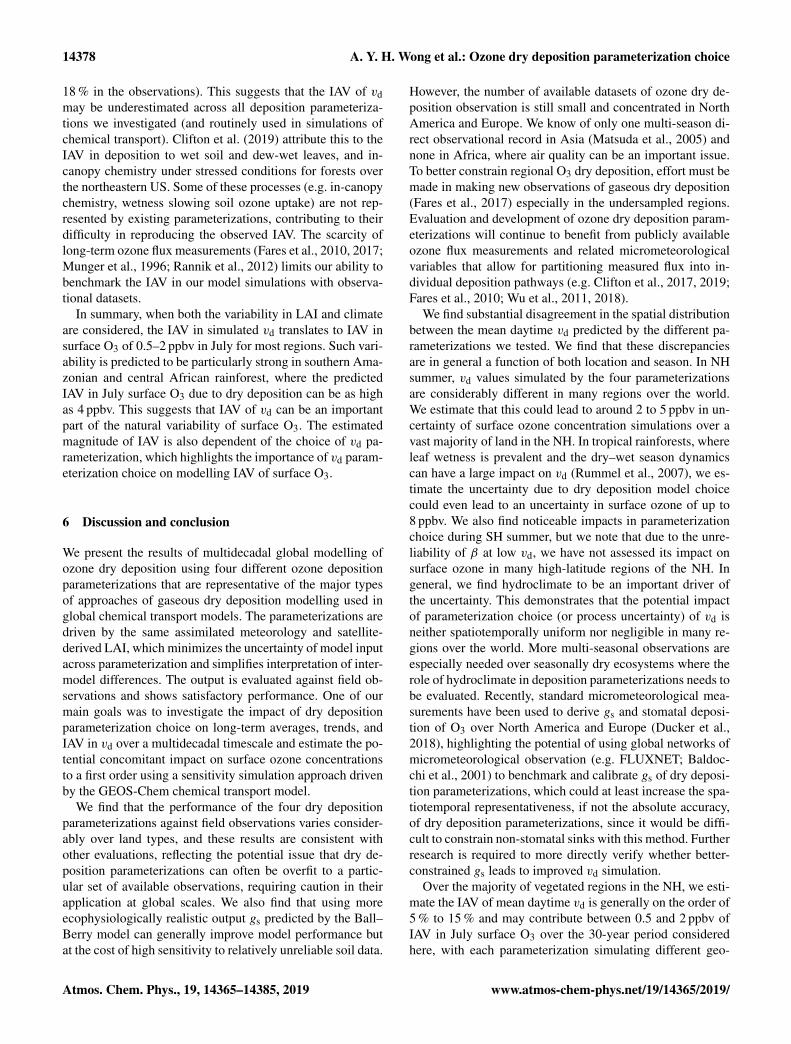
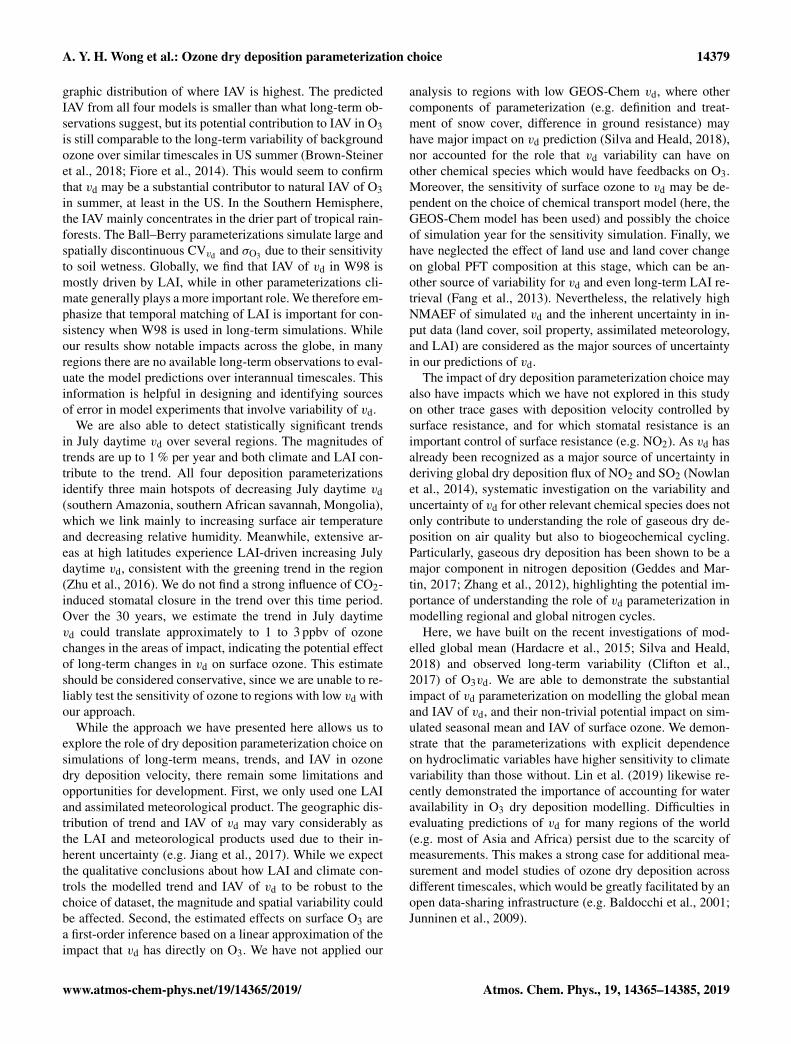
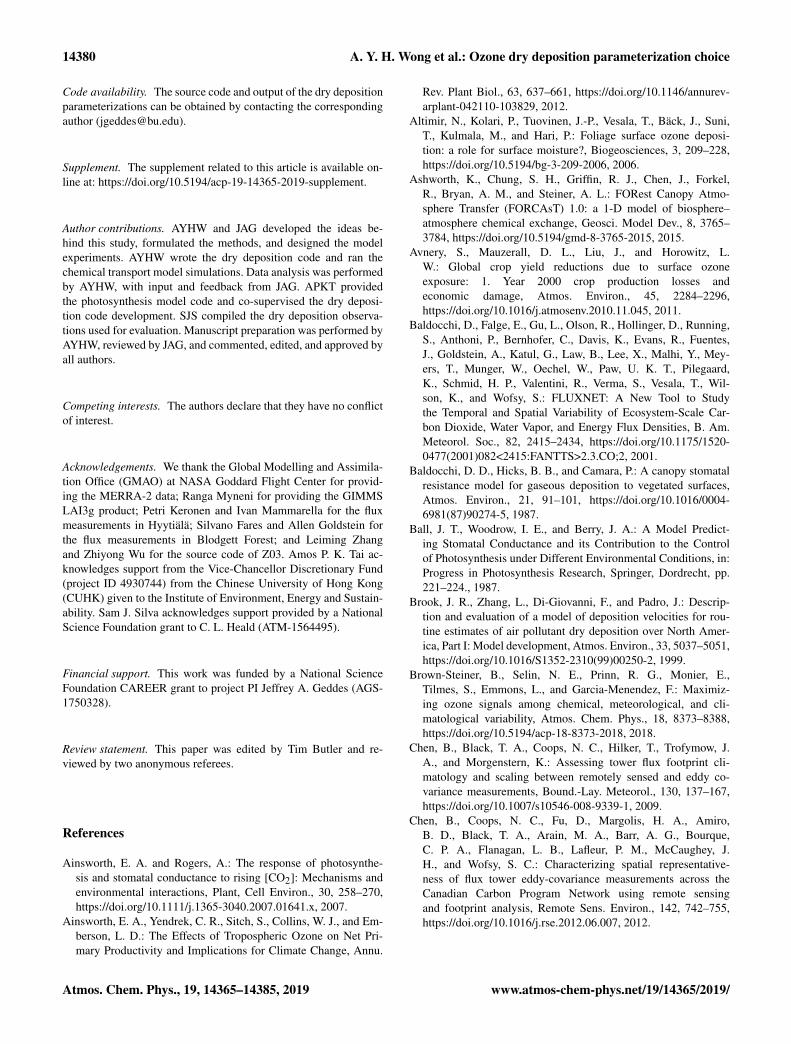
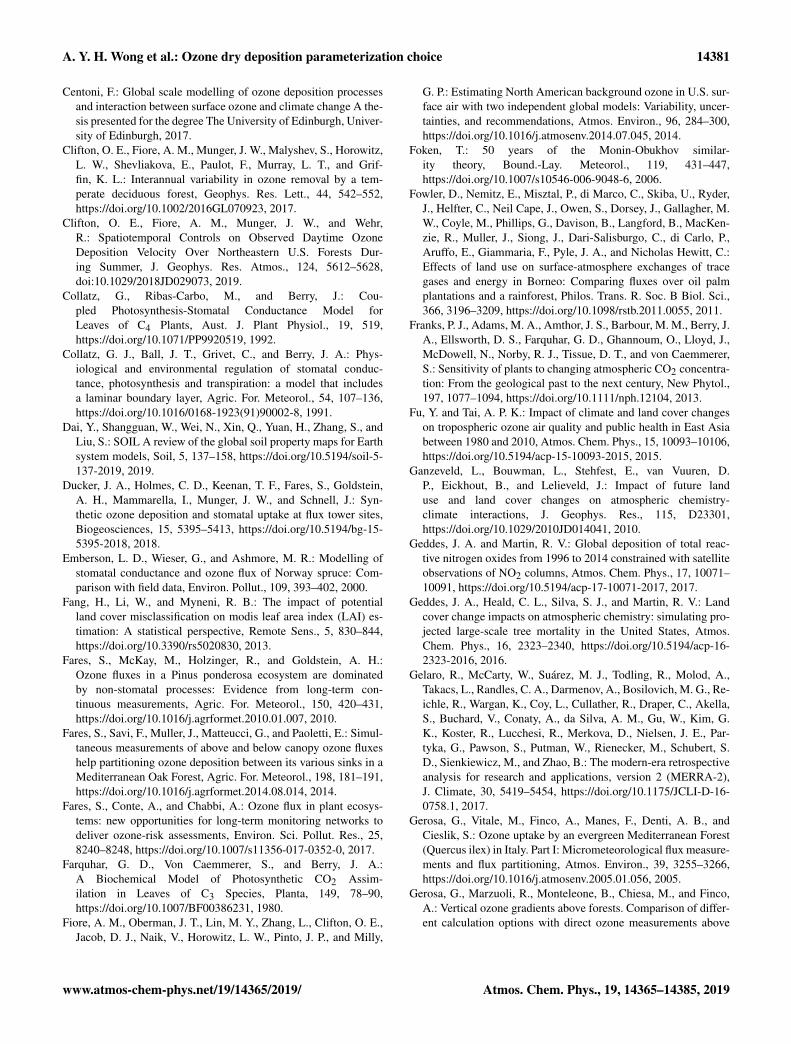
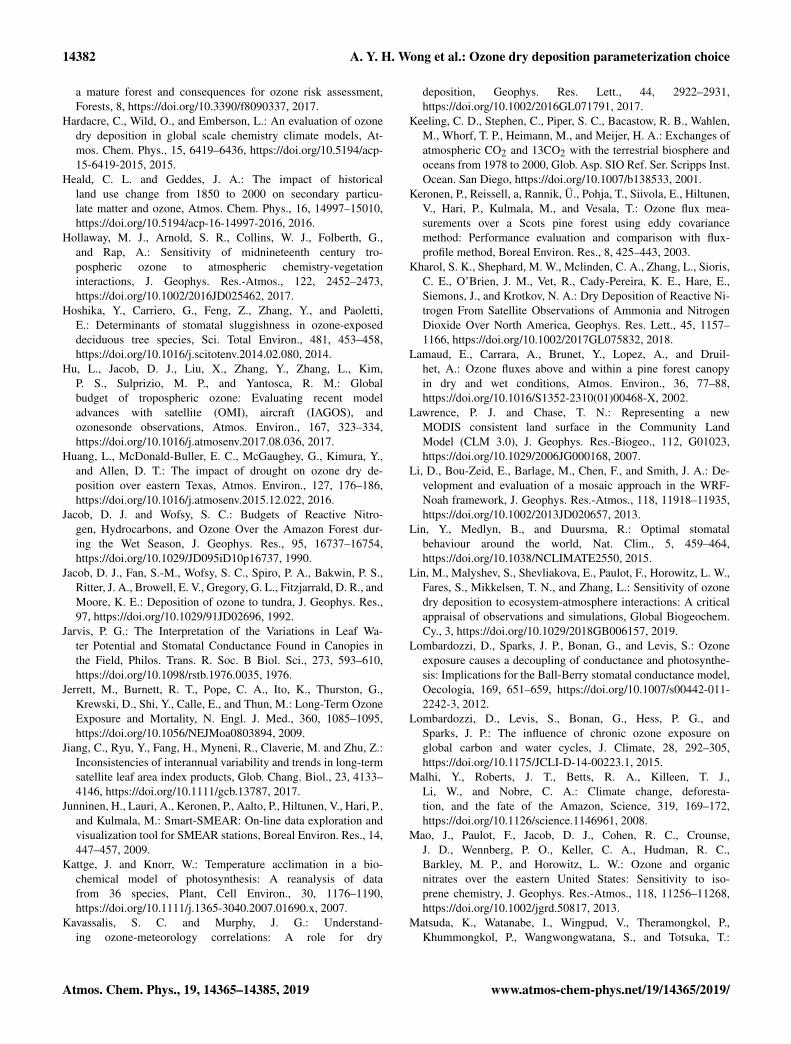
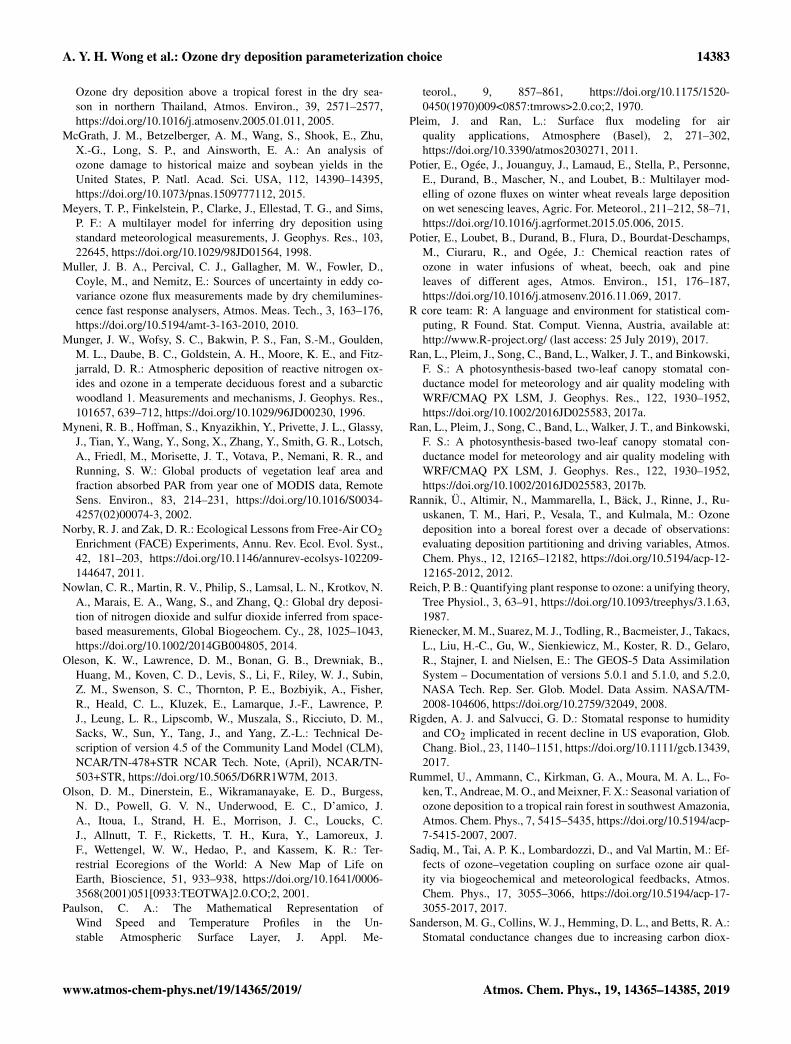
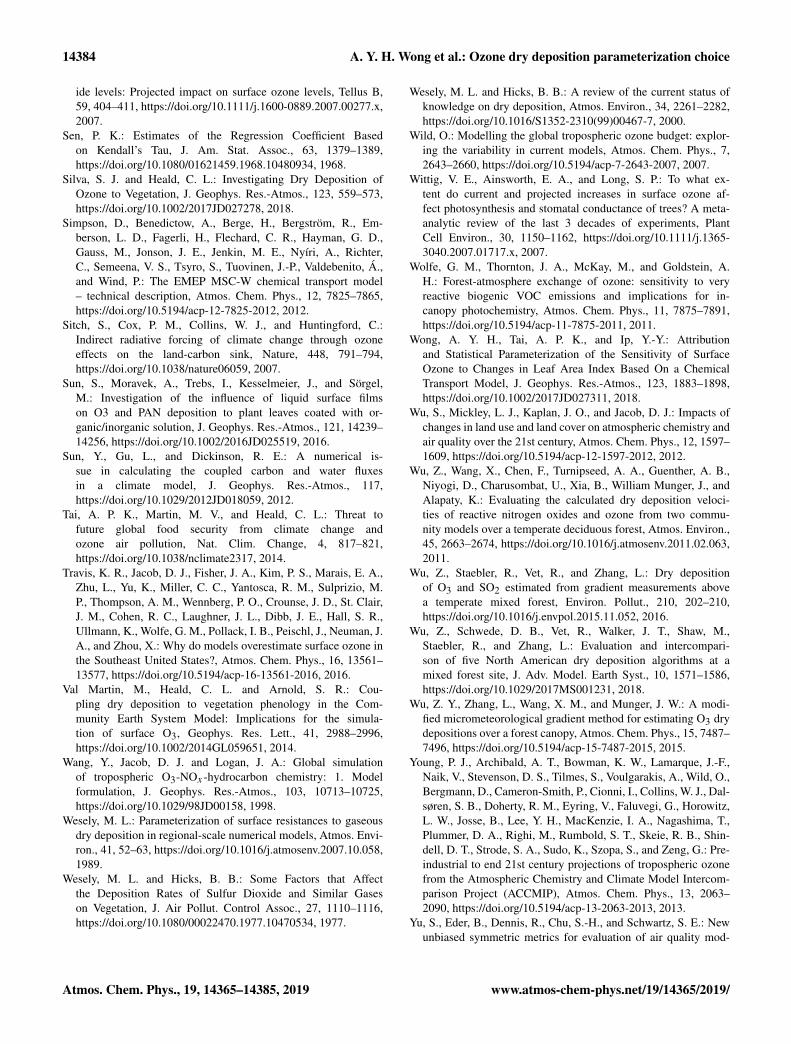
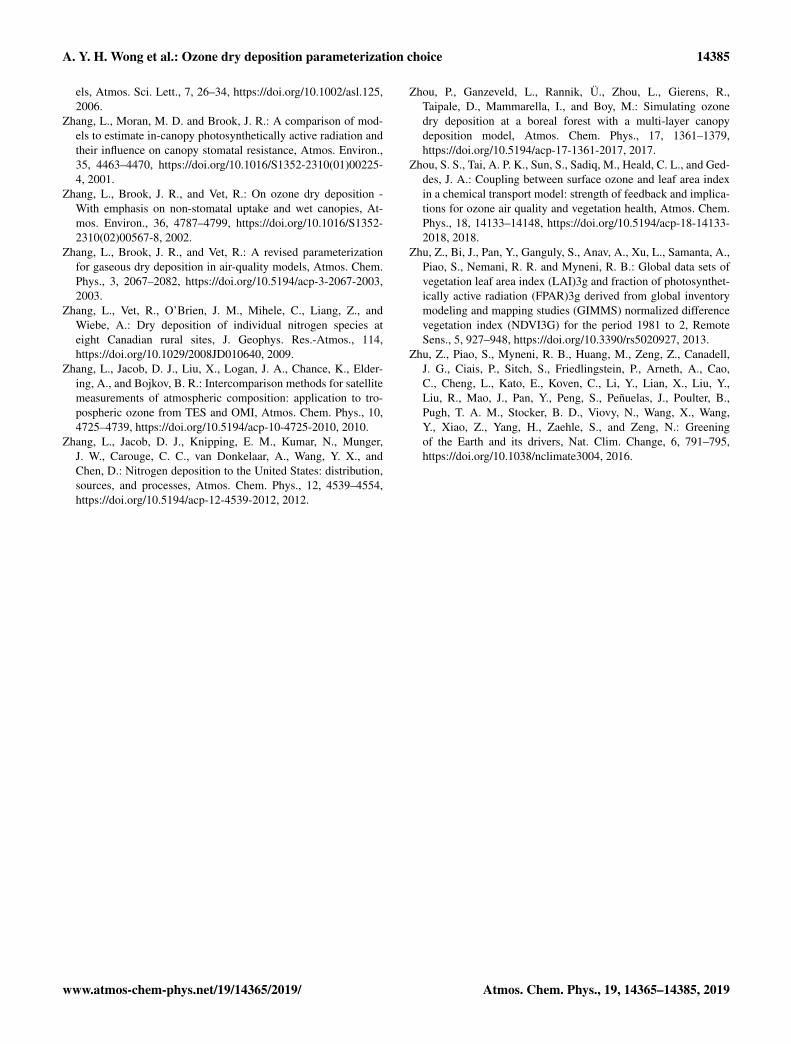